
Submitted:
04 July 2025
Posted:
07 July 2025
You are already at the latest version
Abstract
Organic farming represents a shift in the paradigm that emphasises a balance between production and environmental sustainability. In European Union (EU), organic farming dates to the early 20th century and has now evolved into a global production system with harmonized standards and increasing market demand. Compared with intensive agriculture, it brings greater environmental benefits. The European Green Deal and the Farm to Fork (F2F) strategy highlight the role of organic farming in achieving the EU’s climate and environmental goals, with an aim to achieve at least 25% of the total agricultural area under organic farming by 2030. The present research aims to assess the overall situation in the EU and the Member States' contributions to achieving the European Green Deal’s and F2F strategy's objective of increasing organic farming areas in the future. The research assessed the performance of EU Member States in the period 2018-2022 and in the projected period up to 2030 by employing indicators prescribed by the Common Agricultural Policy (CAP) Strategic Plan. The EU Member States were classified by historical growth of organic farming area and required future performance. The research found that an increase in organic areas in the whole EU was a sign of a shift towards more sustainable farming, with performance varying between the Member States. For example, in 2018-2022, Austria achieved the target, Estonia approached its target; overall, the performance tended to improve in 17 Member States, was stable in 9 and only one Member State performed poorly.
Keywords:
organic farming
; area
; EU Member States
; contribution
; target
1. Introduction
Organic farming represents a paradigm shift in agriculture, prioritising a balance between the environment and production, the preservation of biodiversity and the health of consumers and the environment [1]. It differs from conventional farming by strict limitation of the use of chemical fertilisers, pesticides, growth hormones and genetically modified organisms [2]. Organic farming represents a comprehensive system for soil management, water conservation and biodiversity [3]. It is essential to recognise that the principles of organic farming have been developed and enhanced over many decades, with their origins in Europe dating back to the early 20th century [4]. In the 21st century, organic farming has evolved from a small-scale localised system into a highly organised and global production and marketing system, which has led to setting standards for organic production and marketing [5] based on an increase in demand for healthy food [6]. Organic farming practices are known to bring larger environmental benefits than intensive farming, thereby providing a more sustainable alternative [7,8]. The benefits include higher soil fertility, water conservation and more biodiversity [9]. One of the main benefits of organic farming for the environment is its positive impact on soil health. Organic farming practices, e.g., crop rotation and cover crops, increase soil organic matter, which improves soil structure, water infiltration and nutrient retention [10]. Organic farming often has a larger diversity of plants, insects and birds than conventional farming [11], which is due to the absence of synthetic pesticides and the presence of different habitats, e.g., hedges, wildflower strips and buffer zones. The agri-food sector plays a significant economic role in the EU; however, conventional farming practices have depleted land resources, contributed to greenhouse gas emissions, and led to soil fertility and biodiversity loss, as well as water scarcity and pollution [12,13]. A shift towards more sustainable farming practices is therefore needed, and organic farming is a potential solution to mitigating the adverse environmental impacts [14,15].
The EU has positioned itself as a global leader in fostering sustainability through innovative policy initiatives, particularly the European Green Deal [16]. This ambitious plan outlines a strategy to reduce the negative impacts of climate change and environmental degradation [17,18]. The Green Deal aims to develop the European economy to achieve a sustainable production pattern that is resource-efficient and climate-neutral by 2050 [19,20]. An important element of it is sustainable farming, and organic farming practices play a key role in achieving EU environmental targets [10,21] because organic farming is increasingly recognised as a viable and essential approach in modern agriculture [2,22]. The growth of organic farming is perfectly aligned with the objectives of the European Green Deal, thereby providing a long-term, environmentally friendly alternative to conventional agriculture to strengthen its resilience. However, the efficiency and scalability of organic farming in the EU context requires a thorough analysis considering regional differences in agricultural practices, historical economic evolution, agricultural and farm structure and environmental conditions [15,23].
The F2F strategy, an essential component of the European Green Deal, envisages a transition to sustainable food systems that are healthy, fair and environmentally friendly. This strategy encompasses a diverse range of initiatives, from reducing pesticide use to promoting organic farming and animal welfare, all with the primary aim of establishing a sustainable food supply chain [24]. Organic farming, which respects ecological balance, biodiversity and the management of natural resources, is a cornerstone of achieving the ambitious objectives of the F2F strategy [25]. This approach aims to minimise environmental impacts and promote soil health and ecosystem resilience in the long term. Organic farming is considered a key component in achieving the objectives of the F2F strategy, namely the establishment of sustainable food systems [2]. The strategy recognises the positive environmental and health impacts of organic farming practices, highlighting their potential to reduce pollution, protect biodiversity and improve soil fertility. The F2F strategy therefore prescribes and aims “to reach the target of at least 25% of the EU’s agricultural land under organic farming by 2030” [26]. This target shows that the European Commission considers organic farming to be an essential tool for sustainability transition in agriculture, as this would reduce the use of fertilisers, pesticides and antibiotics, which would have a positive impact on the environment, climate, soil, water, air, biodiversity, animal welfare etc. [27]. Therefore, the present research aims to assess the overall situation in the EU and the contributions of Member States to achieving the European Green Deal F2F strategy’s objective of increasing organic farming areas in the future. An assessment of management practices in organic farming in EU Member States is not the focus of the present research.
The following. Section 2 Materials and Methods, presents the methodology employed in the present research, while Section 3 Results reports the findings of the assessment of the actual situation and the potential contribution of EU Member States to achieving the European Green Deal F2F strategy’s objective of increasing organic farming areas in the future. Section 4 Discussions presents the main findings of the present research in comparison with other research studies and findings, and suggests the main priorities for future research. The paper ends with the main conclusions.
2. Materials and Methods
To achieve the research aim, a methodological framework was designed (Figure 1) and the following specific research tasks were set: 1) to examine the overall situation in organic farming areas in the EU; 2) to assess the contributions of EU Member States to achieving the EU Green Deal target regarding organic farming areas defined by the F2F strategy, both during the progress period and for the forecast and target period.
In the first step, the research identified indicators and their availability, which correspond to the target set by the F2F strategy and were selected for the study. The research used the indicator “Share of utilised agricultural area (UAA) under organic farming (%)”. To achieve the F2F aims, it is necessary to have 25% of total farmland under organic farming by 2030 [26]. The selected statistical indicator was complemented by a result indicator from the CAP National Strategic Plans (SP) for 2023-2027.
On 6 December 2021, the European Parliament and the Council of the European Union adopted Regulation (EU) 2021/2115, establishing the contribution monitoring and evaluation framework that applies to the CAP from 2023 until 2027 [28,29]. This new contribution-oriented implementation framework prescribes several common contribution indicators for EU Member States, including result indicators, which will be used to monitor the Member States’ progress towards pre-set targets. The CAP legislation includes 44 result indicators related to specific objectives. Not all 44 targets are included in each Member State’s CAP SP. The objectives consider needs and planned measures adopted at the national level [28]. The objective set by the F2F strategy to increase the area under organic farming is R.29 “Development of organic agriculture”, which means the share of UAA supported by the CAP for organic farming, with a split between maintenance and conversion. The EU-27 average target value for the R.29 result indicator in 2027 is 10%, supported by CAP funding [30] and is significantly higher than the 5.6% in 2020 [27].
The region examined by the research covers 27 EU Member States: Austria (AT), Belgium (BE), Bulgaria (BG), Croatia (HR), Czech Republic (CZ), Cyprus (CY), Denmark (DK), Estonia (EE), Finland (FI), France (FR), Germany (DE), Greece (EL), Hungary (HU), Ireland (IE), Italy (IT), Latvia (LV), Lithuania (LT), Luxembourg (LU), Malta (MT), the Netherlands (NL), Poland (PL), Portugal (PT), Romania (RO), Slovakia (SK), Slovenia (SI), Spain (ES) and Sweden (SE). In the case of Belgium, there are two CAP SPs for the regions of Wallonia and Flanders; therefore, the forecast indicators were analysed for each region.
The contributions of EU Member States were assessed for two periods: 1) the progress period (2018-2022); 2) the forecast and target period (2023-2030).
In the second step, EU Member States were classified into groups based on selected indicators. During the progress period, Member States were classified based on two differentiation indicators: (1) the share of organic farming area in 2022 (%) and (2) the rate of change of the share of organic farming area from the base year (2018) during the progress period (%). The rate of change from the base year (increase/decrease) (%) over the progress period was calculated by Equation 1:
In Equation 1, tm(b) is the rate of change from the base year (%), ym is the value at the end of the progress period, y1 is the value at the beginning of the progress period.
For the forecast and target period, EU Member States were grouped using two differentiation indicators: 1) the average annual rate of change over the forecast and target period; 2) result indicator R.29 set by the CAP SP of the respective EU Member State for 2023-2027, which represents current policies, future lines of action and political ambitions of national governments in achieving the goal. Although the programming period ends in 2027, the impacts of the implemented measures will be visible until 2030.
Since indicator-based trends observed in previous years do not indicate the current and future context, but only the past context [31], the average annual rate of change was calculated for the statistical indicator for both the progress period (2018-2022) and for the forecast and target period (2023-2030). The average rate of change (%) shows the average development intensity of the phenomenon examined, indicating the number of times the average levels of the time series have changed per unit of time. It was calculated using Equation 2:
In Equation 2, is the average annual rate of change (increase/decrease), yn is the time series indicator value at the end of the period, y1 is the time series indicator value at the beginning of the period, and n is the number of time series levels.
The average annual rate of change over the forecast and target period (B) was compared with the average annual rate of change over the progress period (A) to determine whether the pace of change should be increased, decreased, or maintained in the future. A potential increase in the pace in the future would mean the need for changes in the current policies and actions to be taken by the respective Member State.
The following estimate was made to interpret the required rate of change: for (B − A) < −4% the achievement is considered probable; for −4% ≤ (B − A) < −2% feasible; for −2% ≤ (B − A) < 0% uncertain; for 0% ≤ (B − A) < 2% difficult; for 2% ≤ (B − A) <4% very difficult; for (B − A) ≥ 4% improbable [32].
The indicator values achieved by EU Member States were compared with the EU-27 average, which allowed the Member States to be classified into four groups based on each differentiation indicator: (1) above the EU average and (2) below the EU average. Assigning group ranks was based on the aggregated indicator [33]. To compare different data and have a uniform scale for analysis, the indicators were standardised by the zero unitarization method [34]. Given that the parameters selected for the research were both stimulants or indicators that had a positive impact on the phenomenon examined and a de-stimulant or indicator that negatively impacted the phenomenon [34], Equations 3 and 4 were applied for the standardisation:
In Equations 3 and 4, zij was the normalised value of the j-th variable in the i-th Member State, xij was the initial value of the j-th variable in the i-th Member State, min(xij)i was the minimum value of xij, max(xij)i was the maximum value of xij.
Since the normalised values were in the range of 0-1, the average normalised value was calculated for each Member State both for the progress period and for the forecast and target period. Using the average normalised value found for each Member State, the average aggregated indicator value for each group was calculated, based on which a group rank was assigned. The closer the aggregated indicator value to 1, the higher the group rank was assigned.
A colour-coded visualisation allows Member States’ achievements to be compared with the EU-27 average. It shows whether a given Member State’s indicator value is higher, equal (± 15%), or lower than the EU average.
The authors of the present research interpreted a national performance as follows:
- Strong contribution—the contributions of Member States were high compared with the EU average, i.e., the national contribution was superior;
- Contribution parity—the contributions of Member States were average;
- Limited contribution—the contributions of Member States were below average;
- Insufficient contribution—the contributions of Member States were low.
In the third step, the contributions of Member States during the progress period as well as the forecast and target period were compared to identify changes in national contributions: 1) whether the Member State’s contribution improves; 2) whether the Member State’s contribution deteriorates; 3) whether the Member State’s contribution is stable.
In each step, the research analysed the indicator values calculated and described the results. Ultimately, the main conclusions and proposals were formulated.
3. Results
This chapter analyses the situation in and the areas under organic farming in the EU, as well as performs a comprehensive and detailed assessment of the contributions of EU Member States to achieving the EU Green Deal target in organic farming defined by the F2F strategy, both in the progress period and in the forecast and target period.
3.1. Situation in Organic Farming in the EU
The area under organic farming in the EU has been steadily increasing since 2012 owing to a high demand for organic products and policy support. In 2022, 16.8 million ha or 10.5 % of the total UAA (160 million ha) were organically managed in the EU, which was 3.9 million ha more than in 2018 (Table 1). The largest absolute increase in the organic area in 2022 was reported in France (+787 thousand ha), Portugal (547 thousand ha), Greece (+432 thousand ha), Spain (+429 thousand ha), Germany (+410 thousand ha), Italy (+392 thousand ha) and Romania (318 thousand ha) compared with 2018. In total, four EU Member States—France, Germany, Italy and Spain—had the most significant organic areas at 9.5 million ha or 56% of the total EU. The smallest organic areas have been reported in Malta, Cyprus and Luxembourg, which had a small but stable or slightly growing organic area, yet their impact on the EU total was negligible. Less than 1% of the total organically managed land in 2022 was reported in nine EU Member States (BE, BG, HR, CY, IE, LU, MT, NL, SI).
In Portugal, Greece and Romania, organically managed areas showed significant increases with +2.9%, +1.7% and +1.3% share growth of EU total, respectively. In contrast, the largest decrease in the share of the EU total in 2022 compared with 2018 was found in Spain (-1.5%), Italy (-1.2%) and Sweden (-1.2%). However, despite a decline in the share of the EU-27 total, in Italy and Spain the total organic area increased. The only EU Member States where the area of organic agricultural land decreased were Bulgaria and Sweden.
Overall, there was a steady increase in the area under organic farming in the EU-27; however, in several Member States the share of organic area in the total agricultural area was negligible or even tended to decrease.
3.2. Assessment of the Contributions of EU Member States to Achieving the EU Green Deal Target in Organic Farming Defined by the F2F Strategy
Although the share of organic area in the EU has steadily increased by an average of 7 % per year (EU-27) between 2018 and 2022, the share of organic area varied significantly at Member State level, ranging from 0.62 % in Malta (2022) to 27.5 % in Austria (2022) (Figure 2).
To assess the performance of Member States during the progress period regarding the target of 25% of the total EU agricultural area under organic farming by 2030, Member States were classified into four groups based on the two differentiation indicators described in the research methodology (Figure 2).
Group 1 included three Member States: Portugal, Greece and Slovakia, with the share of organic farming area in 2022 being higher than the EU-27 average (> 10.5%) and the rate of change in the share of organic farming area during the progress period being higher than the EU-27 average (> 31.3%). Among the Member States from Group 1, Portugal should be highlighted, as its share of organic farming area increased by 227%, or from 5.9% in 2018 to 19.3% in 2022. The colour-coded visualisation also demonstrated that in 2018, the share of organically managed areas in Portugal was lower than the EU-27 average, while in 2022 it was above the EU-27 average. This can be attributed to the support measures implemented in Portugal, which resulted in a nearly tenfold increase in the area under organic farming during the “conversion process” between 2020 and 2022 [38].
Group 2 included ten EU Member States, with the share of organic farming area being above the EU-27 average in 2022 (> 10.5%) and the rate of change in the share of organic farming area during the progress period being lower than the EU-27 average (< 31.3%). In Group 2, the share of organic farming area in 2022 ranged from 10.83% in Spain to 27.5% in Austria, which was above the EU target for 2027. Estonia also had a high share of organic farming area (23.42 % in 2022). An analysis of the rate of change in the share of organic farming area in Group 2 over the progress period revealed that the rate of change ranged from a decrease of 1.8 % in Sweden to an increase of 19.3 % in Italy.
Group 3 includes 7 Member States, with the rate of change in the share of organic farming during the progress period being higher than the EU-27 average (> 31.3%). It ranged from 34.7% in Germany to 111.7% in Romania. Despite the high rates of change, the share of organic UAA was lower than the EU-27 average. This ranged from 0.62% in Malta to almost 10% in France and Germany. The colour-coded visualisation demonstrated that the share of organic area in France and Germany was close to the EU average (EU average ± 15%).
Group 4 included 7 Member States where the share of organic UAA area in 2022 was lower than the EU-27 average, ranging from 2.2% in Bulgaria and Ireland to 9.32% in Lithuania, and the rate of change in the share of organic area was lower than the EU-27 average over the progress period (< 31.3%). In two Member States, Bulgaria and Ireland, the rate of change in the share of organic farming area was negative during the progress period, meaning that the share in both Member States decreased from 2.6% to 2.2%. Among the Member States from Group 4, Croatia and the Netherlands should be highlighted, as their rates of change could be compared to the EU average (EU average ± 15%), as well as Lithuania and Croatia, as their shares of organic farming can be compared to the EU average (EU average ± 15%).
The research results revealed that during the progress period, the performance of Group 1 regarding the target was the highest among the EU Member States, yet the average value of the aggregated indicator (0.572) for this group could interpreted by the authors not as high, but as above average. Therefore, the authors rate the performance of Group 1 as performance parity, not performance opportunity. The value of the average aggregated indicator (0.359) for Group 2 could be interpreted as below the average level; therefore, the performance of Group 2 could be rated as limited. The authors interpret the performance of Groups 3 and 4 (average aggregated indicator values of 0.250 and 0.145, respectively) as low, so that the performance of the EU Member States in both groups was insufficient during the progress period.
To assess the performance of Member States over the forecast and target period regarding the target of 25% of the total EU agricultural area under organic farming by 2030, the Member States were grouped based on two differentiation indicators: (1) the average annual growth rate needed to reach the target by 2030 and (2) national CAP SP performance indicator R.29 (Development of organic agriculture).
Based on the above indicators, the Member States were classified into three groups (1, 2 and 4), as Group 3 was not singled out because no EU Member State was classified in it.

Table 2.
Group 1 Member States classified according to the required average annual growth rate and result indicator R.29 set by the Member States’ CAP SPs for the forecast and target period [30,35,37].
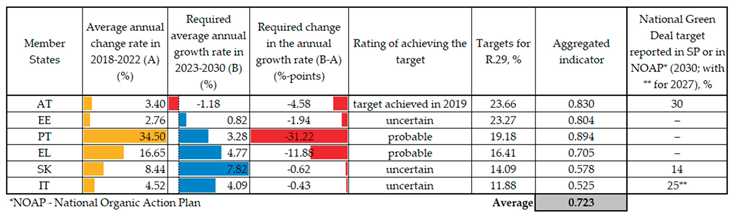
Group 1 includes Member States whose average annual growth rate towards the target in 2023-2030 can be reduced compared with the average annual growth rate achieved over the progress period, which means that if the policies and activities implemented so far are continued, there is a high probability that Portugal and Greece will reach the 25% target. Both EU Member States can significantly reduce their average annual growth rate in 2023-2030 by 31.22 percentage points and 11.88 percentage points, respectively. Austria should also be highlighted, as it has already achieved the target set by the EU during the progress period (2019) and has set a national target of 30% of organic UAA for 2030. Italy, however, has set a target of 25% of the total agricultural area under organic farming by 2027. Slovakia has set a national Green Deal target of 14 % reported in its SP, which is significantly behind the EU target, and, according to Eurostat data [35], the share of organic farming in Slovakia in 2022 was 13.69 %, meaning that the target set was close to the level of 2022. The other Member States from Group 1 have not set a national Green Deal target in their CAP Strategic Plans. This shows that the Member States lack ambition in this target, despite the good results achieved during the progress period. The ability of Estonia, Slovakia and Italy to achieve the target was rated by the authors as “uncertain”.
Actions taken by the Member States were essential to achieve the 25% organic farming target defined by the European Green Deal F2F strategy, which required the Member States to set a CAP SP target for organic farming for the period 2023-2027. At the EU level, approximately 10% of the total utilised agricultural area is expected to receive CAP support for organic farming in 2027, i.e., the area will double compared with 2020 [27], yet there are differences between the Member States. Among those from Group 1, Austria and Estonia should be highlighted, as their CAP SPs envisage support for organic farming for more than 20 % of the total UAA, while for the other ones, this figure is below 20 %.
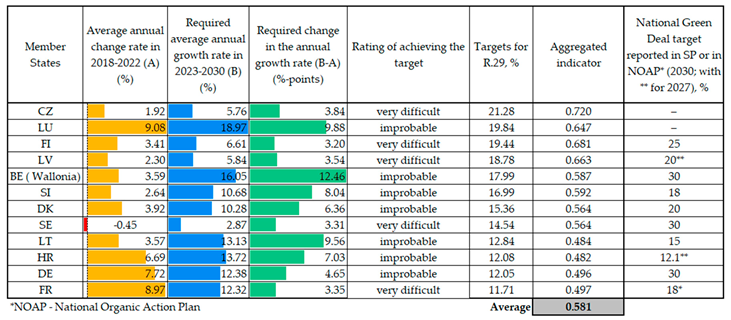
Group 2 (Table 3) included Member States where the average annual growth rate for achieving the target in 2023-2030 needs to be increased compared with the average annual growth rate achieved during the progress period. The increase in the average annual growth rate to be achieved in 2023-2030 ranged from 3.20 %-points for Finland to 12.46 %-points for Belgium in the Wallonia region. Based on the data, it could be concluded that if the policies and activities implemented so far continue, the Member States will not approach the 25% target defined by the F2F strategy. Therefore, the possibilities of achieving the target are rated by the authors as “very difficult” (CZ, FI, LV, SE, FR) and “improbable” (LU, BE (Wallonia), SI, DK, LT, HR, DE). The result indicator R.29 for Group 2 was above the EU-27 average, ranging from 21.28 % in Czechia to 11.71 % in France, which was positive.
Group 3 can reduce the average annual growth rate towards the target over the forecast and target period compared with that over the progress period. Their result indicator R.29 values were below the EU-27 average, and this group was not singled out because no Member State qualified for both indicators.
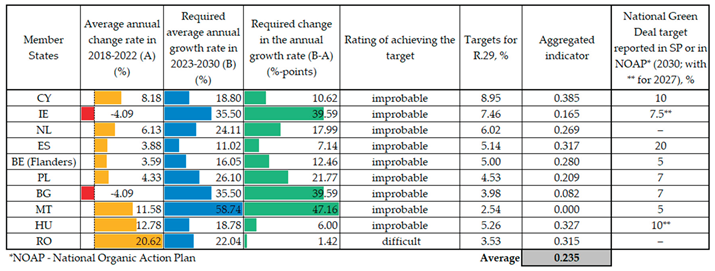
Group 4 (Table 4) included Member States where the average annual growth rate towards the target in 2023-2030 needs to be increased compared with that in the progress period. The annual growth rate to be achieved ranged from 1.4 %-points for Romania to 47.2 %-points for Malta. Based on the data, it could be concluded that by continuing the policies and activities implemented so far, Group 4 will not reach the 25% target defined by the F2F strategy, except Romania, whose future position in achieving the target is positive. For Group 4, the result indicator R.29 was below the EU-27 average, ranging from 2.54% for Malta to 8.95% for Cyprus. It is positive that most of the Member States from Group 4 had national European Green Deal targets for organic farming, yet at the same time their ambitions were low, ranging from 5% for the region of Flanders and Malta to 20% for Spain, which was a significantly lower target compared with that set by the F2F strategy. Only the Netherlands and Romania had not set national targets.
The calculated average indicator values revealed that in the forecast and target period, the performance of Group 1 regarding the target was high, as the average aggregated indicator value for the group was 0.723 (strong performance). The performance of Group 2 was above average (performance parity) (average aggregated indicator value for the group was 0.581). The performance of Group 4 was low (insufficient performance), and this was indicated by the value of the average aggregated indicator at 0.235.
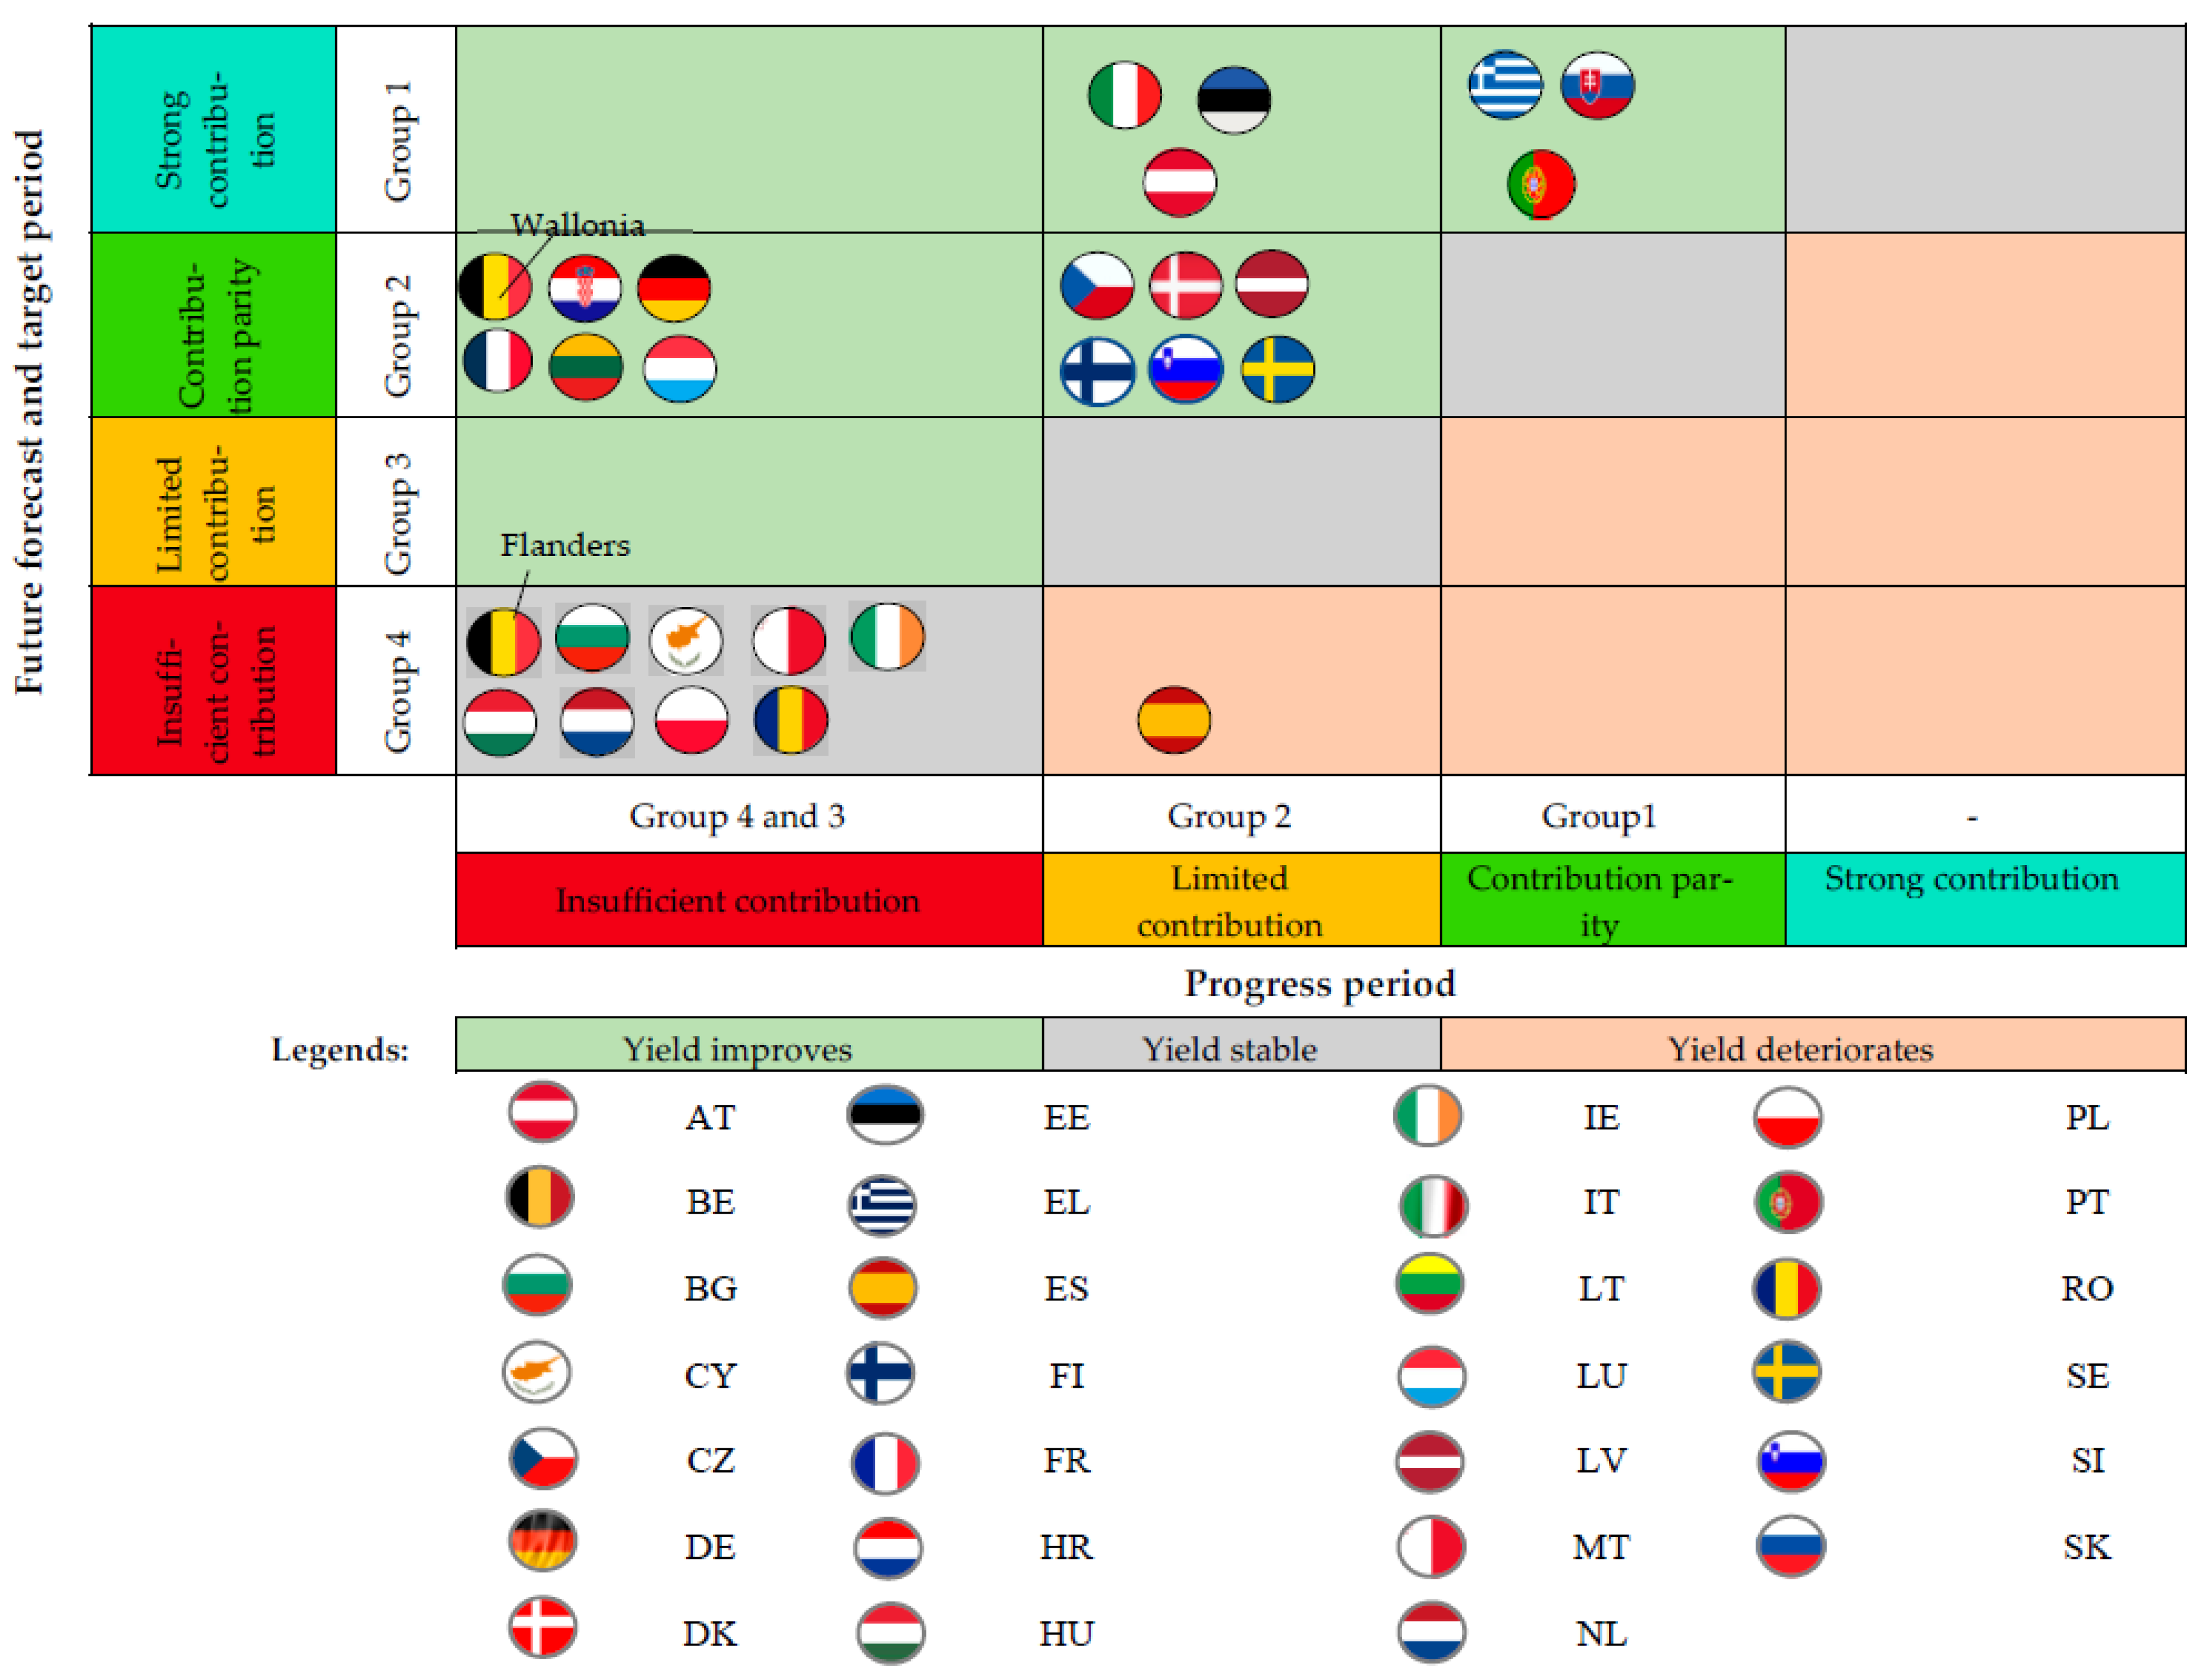
A spatial summary of the performance of EU Member States and their changes to achieve the target defined by the F2F strategy—at least 25% of the EU’s agricultural land under organic farming by 2030—is presented in Figure 3.
Figure 4 presents a summary of the changes in the performance of EU Member States to achieve the target of at least 25% of the EU’s agricultural land under organic farming by 2030, as outlined in the F2F strategy. The summary indicates that performance improved in 17 Member States and the Wallonia region of Belgium, remained stable in 8 Member States and the Flanders region, and deteriorated in only one Member State (Spain).
4. Discussion
The research has found that in the EU in 2018-2022, organically managed areas increased by 30% or 3.9 million ha, which was also in line with the findings made by other scientists. For example, Doorn & Verhoef (2011) have emphasised that the growing consumer demand for sustainably produced food, combined with an understanding of the environmental and health impacts of conventional farming, has led to a significant increase in the uptake of organic farming techniques in all EU Member States [39]. Mughal et al. (2021) have concluded that this transition to organic farming is driven by a combination of factors, including a growing consumer awareness of environmental and animal welfare issues, widespread media coverage, and a growing awareness among the public of the consequences of environmental pollution, global warming and depletion of natural resources [40]. It should be noted that the expansion of organic farming is further facilitated by the introduction of support policies and financial incentives at both the national and European levels [16] that encourage farmers to switch from conventional to organic farming systems. National support for organic farming is particularly emphasised in Portugal [38], which, combined with different agro-ecological conditions and historical dependence on agriculture, is conducive to the rapid growth of organic farming [41]. Peng (2019) has pointed out that an increase in the popularity of organic farming and products is driven by both market demand and subsidies, which are economically beneficial both locally and globally, owing to the associated trade and employment opportunities [42]. Rocchi et al. (2021) have acknowledged that the expansion of organic farming in the EU can be characterised by a significant increase in the total area under organic farming [43]. This growth is not just a compilation of statistical data, but represents a fundamental change in agricultural practices, reflecting the farmers’ growing commitment to the environment and sustainable resource management [44]. The holistic approach to agriculture not only reduces the environmental impact of farming but also contributes to biodiversity and strengthens the resilience of agro-ecosystems [45].
The expansion of organic farming in the EU is a multifaceted process, covering environmental, economic and social considerations that have been researched by a number of scientists. From an environmental perspective, organic farming practices reduce the negative impact of conventional farming on soil health, water quality and biodiversity [46]. Organic farming facilitates the sequestration of carbon in the soil, thereby contributing to climate change mitigation. The non-use of synthetic raw materials also reduces the risk of water and soil pollution and protects non-target organisms from exposure to pesticides [21]. In addition, organic farming systems tend to be more resilient to the impacts of climate change, e.g., droughts and floods, owing to their improved soil structure and water retention capacity [3]. Economically, organic farming can give farmers opportunities to diversify sources of income, as well as access to an expanding market for higher-quality organic products. This could be achieved through direct sales on farms and local markets [47]. The prices of organic products are often higher than those produced conventionally, thereby indicating their value in terms of quality, safety and environmental properties [1]. Socially, the expansion of organic farming is aligned with the wider societal objectives of promoting sustainable development, food security and rural revitalisation [48]. Organic farming practices often prioritise fair labour standards and public engagement, thus contributing to fairer and more sustainable food systems [2]. An increase in the organic area is a sign of a shift towards sustainable practices where environmental protection and human health are priorities. The principles of sustainable agriculture involve maximising the use of natural resources while preserving them for future generations. Nowak & Kasztelan (2022) have acknowledged that organic farming is integrated into the concept of sustainable agriculture [34].
However, some scientists have recognised that there are many challenges in the transition to organic farming. Although some research studies show comparable costs between the two agricultural practices (conventional and organic), labour costs in organic farming can be significantly higher [7]. One of the main obstacles is lower yields in organic farming than in conventional farming, especially during the first years of transition. However, many organic farmers also use modern equipment, better crop varieties and practices of preserving soil and water. Overcoming the challenges requires a concerted effort by farmers, researchers, policymakers and consumers to support the development and uptake of innovative organic farming technologies and practices [8].
A number of problems and obstacles hinder the uniform implementation of organic farming practices across all EU Member States. The current situation in organic farming varies considerably across the EU, as evidenced by the authors’ research, which classified the Member States by area under organic farming in the historical development period (2018-2022) and future ambitions (2030) into groups. This revealed that, on average, a significant part of agricultural land (10.5% of the total in 2022) was managed organically in the EU. However, there are significant disparities among EU Member States. The lowest share of organic farming was found in Malta at only 0.6% of UAA, whereas the highest share was found in Austria at 27.5%, which showed different practices implemented so far to achieve the F2F strategy target set by the European Green Deal, i.e., at least 25% of UAA under organic farming by 2030. Crowder & Reganold (2015) have emphasised that economic factors are crucial, as the transition to organic farming could be costly for farmers, including investments in new equipment, training and certification [7]. In addition, consumer demand for organic products, although growing, was not the same across the EU, which could have a significant impact on the economic viability of organic farming in some EU regions. Shortcomings in policy implementation, as well as inconsistencies in the application of EU legislation, further complicate the situation, as do differences in eligibility criteria for national support for organic farming [21]. Managing agricultural sustainability is a complex problem with emerging challenges, fundamental institutional modernisation and a lack of long-term data [15]. Furthermore, problems such as imperfect legal frameworks and insufficient support measures for organic producers can hinder an increase in organic areas [49], as organic farming is a voluntary production system and it is therefore important to understand the obstacles and drivers to the implementation, with scientific evidence playing an important role [50].
The feasibility of individual EU Member States to achieve the target of 25% of the total UAA under organic farming by 2030 set by the F2F strategy is affected by complex interactions of factors, including the current state of organic farming in the Member State, the level of support provided to farmers for the transition to organic farming, consumer demand for organic products, as well as the general policy and the regulatory framework. The Member States with a strong organic farming industry, supportive policies and high consumer demand are more likely to achieve the target, while those facing economic constraints, policy gaps and limited access to the organic market might struggle to achieve the target. For example, those with established organic certification institutions and well-developed organic farming legislation are in a better position to support the expansion of organic farming [51]. In addition, the Member States need to consider the availability of technical assistance and training programmes for farmers to facilitate the transition to organic farming. Policy measures are needed to improve production technologies, management procedures and the viability of rural communities, while increasing the resilience of farms [52].
Fostering organic farming effectively in the EU requires a multifaceted scientific approach encompassing advances in soil health management, pest and disease control and optimised crop and livestock production techniques [45]. Innovative techniques, e.g., biological preparations that contribute to the degradation of crop residues, have become a key area of focus and are in line with the objectives of the European Green Deal, thereby encouraging sustainable agricultural practices and reducing the use of pesticides [53]. Therefore, joint efforts between sectoral politicians, farmers, scientists and other stakeholders are needed to implement the latest scientific findings on the prerequisites for environmentally friendly farming practices, as well as on how to deal with economic, social and environmental problems related to organic farming to achieve the targets set by the European Green Deal by 2030 not only in the Member States that already have established good traditions for organic farming and classified by the present research into Groups 1 or 2 but also in the others. It is therefore necessary to continue assessing how and whether EU Member States are achieving the target set by the F2F strategy for increasing the area of organic farming.
5. Conclusions
The increase in organic farming areas in the EU over the last decade marks a systemic transition towards more sustainable farming practices. In 2022, the organic area in the EU reached 16.8 million ha or 10.5 % of the total UAA. The increase was driven by both demand for organic products and targeted policy support.
At the national level, the shares of organic farming and growth rates varied significantly. France, Portugal, Greece, Spain, Germany, Italy and Romania have been the main drivers of the expansion of organic areas, with significant increases between 2018 and 2022. However, only a few Member States, e.g., Austria (27.5%) and Estonia (23.4%), have already reached or come close to the target of 25% of the EU’s agricultural land under organic farming set by the European Green Deal F2F strategy.
The performance of Member States was analytically assessed applying two different classification approaches: based on historical growth and the need for future growth to achieve the target. The indicators allowed Member States to be classified into several groups.
By historical performance (2018-2022): (a) Group 1: a high share of organic area in the total UAA and a rapid increase in the organic area was found in Portugal, Greece and Slovakia; (b) Group 2 with a high share, but a lower increase over the analysis period included Austria, Estonia, Spain and Italy, which were close to the target set by the F2F strategy but the growth rate tended to decrease; (c) Group 3 with a share of organic area below the EU average, but with a fast increase in it included Germany, France, Romania and others, which are those with great potential but need to continue to grow; (d) Group 4 with a share of organic area below the EU average and low growth rates included Bulgaria, Ireland, Lithuania and others, where achieving the target set by the F2F strategy was at risk. The calculated aggregated indicator values showed that Group 1 had better performance than other EU Member States, was rated as “above average” rather than “high” and as performance parity. Group 2 had below-average performance that was considered limited. However, Group 3 and Group 4 had low and insufficient performance to achieve the F2F target.
By prospects (2023-2030): (a) Group 1: growth rates could be reduced in Portugal, Greece and Austria. The current government policies could be viewed as sufficiently effective; (b) Group 2: it is necessary to increase the growth rate in Finland, Belgium, the Czech Republic and France where, without additional measures, the target of 25% of the total UAA under organic farming will not be achieved; (c) Group 4 with a significant increase in the organic area but low national targets included Malta, Cyprus, the Belgian region of Flanders and others, which were characterised by low results and low levels of political ambition until 2030. The research results revealed that the performance of Group 1 was high for the forecast and target period (strong performance). Group 2 had above-average performance (performance parity), while Group 4 had low performance (insufficient performance).
Overall, although the EU Member States moved towards the target set by the F2F strategy, there were significant differences between them in terms of growth, political commitment and targets set. It is the quality of the national CAP SP and the ambition that is key to achieving the strategic targets of the European Green Deal by 2030. It is therefore necessary to continue examining what Member State practices and political commitments could accelerate the achievement of the target in the Member States where it is at risk, in particular building on and assessing the achievements of Austria and Portugal.
Author Contributions
Conceptualization, A.M. and I.P.; methodology, A.M.; software, A.M. and K.M.; validation, I.P., A.H.V. and A.N.; formal analysis, A.M.; investigation, A.M. and I.P.; resources, A.N.; data curation, A.M. and I.P.; writing—original draft preparation, A.M. and I.P.; writing—review and editing, A.H.V. and A.N.; visualization, A.M. and K.M.; supervision, A.N.; project administration, A.N.; funding acquisition, A.N. All authors have read and agreed to the published version of the manuscript.”.
Funding
The research was supported by the Ministry of Agriculture of the Republic of Latvia and the Latvian Science Council’s national research programme “Research and Sustainable Use of Local Resources for the Development of Latvia” for 2023-2025, scientific project No. VPP-ZM-VRIIILA-2024/1-0002 Science-based Solutions for a Sustainable Food System to Achieve the Goals of the European Green Deal (GreenAgroRes).
Institutional Review Board Statement
Not applicable.
Data Availability Statement
The data presented in this study are available: Muska, A.; Pilvere, I.; Viira, A.-H.; Muska, K.; Nipers, A. Datasets for European Green Deal Objective: Potential Expansion of Organic Farming Areas. DataverseLV, 2025. ttps://doi.org/10.71782/DATA/XDLJDQ.
Acknowledgments
Not applicable.
Conflicts of Interest
The authors declare no conflicts of interest.
Abbreviations
The following abbreviations are used in this manuscript:
| AT | Austria |
| BE | Belgium |
| BG | Bulgaria |
| CAP | European Union Common Agricultural Policy |
| CY | Cyprus |
| CZ | Czech Republic |
| DE | Germany |
| DK | Denmark |
| EE | Estonia |
| EL | Greece |
| ES | Spain |
| EU | European Union |
| EU-27 | EU 27 Member States |
| F2F | A Farm to Fork Strategy |
| FI | Finland |
| FR | France |
| HR | Croatia |
| HU | Hungary |
| IE | Ireland |
| IT | Italy |
| LT | Lithuania |
| LU | Luxembourg |
| LV | Latvia |
| MT | Malta |
| NL | The Netherlands |
| NOAP | National Organic Action Plan |
| PL | Poland |
| PT | Portugal |
| RO | Romania |
| SE | Sweden |
| SK | Slovakia |
| SI | Slovenia |
| SP | CAP National Strategic Plan for 2023-2027 |
| UAA | Utilised Agricultural Area |
References
- Mandal, D.N. Organic farming: an ecofriendly way to sustainable agriculture. Journal of Agriculture and Environment 2007, 8, 115–118. [Google Scholar] [CrossRef]
- Gamage, A.; Gangahagedara, R.; Gamage, J.; Jayasinghe, N.; Kodikara, N.; Suraweera, P.; Merah, O. Role of organic farming for achieving sustainability in agriculture. Farming System 2023, 1(1), 100005. [CrossRef]
- Prousalidis, K.; Bourou, S.; Velivassaki, T.H.; Voulkidis, A.; Zachariadi, A.; Zachariadis, V. Olive Tree Segmentation from UAV Imagery. Drones 2024, 8(8), 408. [CrossRef]
- Jackson-Smith, D. B. Toward sustainable agricultural systems in the 21st century. Choice Reviews Online 2011, 48(6), 48. [CrossRef]
- Mulvaney, D.; Robbins, P. (Eds.) National Organic Program. In Green Food: An A-to-Z Guide. SAGE Publications, Inc., 2011. [CrossRef]
- Aslam, W. Factors affecting organic productions and its consumption approaches towards consumers: A case study of Punjab province. Asian Journal of Agriculture and Biology 2020, 8(3), 274. [CrossRef]
- Crowder, D. W.; Reganold, J. P. Financial competitiveness of organic agriculture on a global scale. Proceedings of the National Academy of Sciences 2015, 112(24), 7611. [CrossRef]
- Uddin, Md.N.; Bari, Md.L. Governmental policies and regulations including FSMA on organic farming in the United States and around the globe. In Elsevier eBooks, Elsevier BV., 2019, p. 33. [CrossRef]
- Lacour, C.; Seconda, L.; Allès, B.; Herzberg, S.; Langevin, B.; Pointereau, P.; Lairon, D.; Baudry, J.; Kesse-Guyot, E. Environmental impacts of plant-based diets: How does organic food consumption contribute to environmental sustainability? Frontiers in Nutrition 2018. [CrossRef]
- Lemke, S.; Smith, N.; Thiim, C.; Stump, K. Drivers and barriers to adoption of regenerative agriculture: case studies on lessons learned from organic. International Journal of Agricultural Sustainability 2024, 22(1). [CrossRef]
- Stein-Bachinger, K.; Gottwald, F.; Haub, A.; Schmidt, E. To what extent does organic farming promote species richness and abundance in temperate climates? A review. Org. Agr. 2021, 11, 1–12. [Google Scholar] [CrossRef]
- Choirun, A.; Santoso, I.; Astuti, R. Sustainability risk management in the agri-food supply chain: literature review. IOP Conference Series Earth and Environmental Science 2020, 475(1), 12050. [CrossRef]
- Fess, T.L.; Benedito, V.A. Organic versus Conventional Cropping Sustainability: A Comparative System Analysis. Sustainability 2018, 10, 272. [Google Scholar] [CrossRef]
- Duquennoi, C.; Martínéz, J. A. European Union’s policymaking on sustainable waste management and circularity in agroecosystems: The potential for innovative interactions between science and decision-making. Frontiers in Sustainable Food Systems 2022. [CrossRef]
- Bachev, H. Governance of agrarian sustainability-forms, efficiency and improvement. Adv Plants Agric Res. 2018, 8(1), 56\u201269. [CrossRef]
- Pilvere, I.; Nipers, A.; Pilvere, A. Evaluation of the European Green Deal Policy in the Context of Agricultural Support Payments in Latvia. Agriculture 2022, 12, 2028. [Google Scholar] [CrossRef]
- Papallou, E.; Katafygiotou, M.; Dimopoulos, T. Emerging Sustainability Trends in Tourist Facilities: A Comparative Assessment of Multiple Hotels and Resorts. Sustainability 2024, 16(9), 3536. [CrossRef]
- Rowan, N.J.; Casey, O. Empower Eco multiactor HUB: A triple helix ‘academia-industry-authority’ approach to creating and sharing potentially disruptive tools for addressing novel and emerging new Green Deal opportunities under a United Nations Sustainable Development Goals framework. Current Opinion in Environmental Science & Health 2021, 21, 100254. [Google Scholar] [CrossRef]
- Doran, N. M.; Bădîrcea, R. M.; Jianu, E.; Antoniu, M.; Ciobanu, R. M. G.; Ciobanu, Ș.C. F. Unveiling CO2 Emission Dynamics Under Innovation Drivers in the European Union. Sustainability 2025, 17(8), 3463. [CrossRef]
- Kowalska, A.; Bieniek, M. Meeting the European green deal objective of expanding organic farming. Balance. Quarterly Journal of Economics and Economic Policy 2022, 17(3), 607-633. [CrossRef]
- Migliorini, P.; Wezel, A. Converging and diverging principles and practices of organic agriculture regulations and agroecology. A review. Agron. Sustain. Dev. 2017, 37, 63. [Google Scholar] [CrossRef]
- Magaudda, S.; D’Ascanio, R.; Muccitelli, S.; Palazzo, A. L. ‘Greening’ Green Infrastructure. Good Italian Practices for Enhancing Green Infrastructure through the Common Agricultural Policy. Sustainability 2020, 12(6), 2301. [CrossRef]
- Brodny, J.; Tutak, M. Analyzing Similarities between the European Union Countries in Terms of the Structure and Volume of Energy Production from Renewable Energy Sources. Energies 2020, 13(4), 913. [CrossRef]
- Turetta, A. P. D.; Bonatti, M.; Sieber, S. Resilience of Community Food Systems (CFS): Co-Design as a Long-Term Viable Pathway to Face Crises in Neglected Territories? Foods 2021, 10(3), 521. [CrossRef]
- Wang, G.; Wang, Y.; Li, S.; Yang, Y.; Li, C.; Shin, C.H. Sustainability in Global Agri-Food Supply Chains: Insights from a Comprehensive Literature Review and the ABCDE Framework. Foods 2024, 13(18), 2914. [CrossRef]
- European Commission. A Farm to Fork Strategy for a fair, healthy and environmentally-friendly food system. COM(2020)381 final. Brussels, 2020. Available online: https://eur-lex.europa.eu/legal-content/EN/TXT/?uri=celex:52020DC0381.URL (accessed on 01 March 2025).
- European Commission. Replies of the European Commission to the European Court of Auditors’ Special Report ‘Organic farming in the EU: Gaps and inconsistencies hamper the success of the policy’. 2024. Available online: https://www.eca.europa.eu/Lists/ECAReplies/COM-Replies-SR-2024-19/COM-Replies-SR-2024-19_EN.pdf (accessed on 01 March 2025).
- EUR-Lex. Regulation (EU) 2021/2115 of the European Parliament and of the Council of 2 December 2021 establishing rules on support for strategic plans to be drawn up by Member States under the common agricultural policy (CAP Strategic Plans) and financed by the European Agricultural Guarantee Fund (EAGF) and by the European Agricultural Fund for Rural Development (EAFRD) and repealing Regulations (EU) No 1305/2013 and (EU) No 1307/2013. Available online: https://eur-lex.europa.eu/legal-content/EN/TXT/PDF/?uri=CELEX:32021R2115 (accessed on 03 March 2025).
- European Commission. Recommendations to the Member States as regards their strategic plan for the Common Agricultural Policy. COM(2020) 846 final. Brussels, 2020. Available online: https://eur-lex.europa.eu/legal-content/EN/TXT/?uri=celex:52020DC0846 (accessed on 06 March 2025).
- European Commission. Result Indicators dashboard. Available online: https://agridata.ec.europa.eu/extensions/DashboardCapPlan/result_indicators.html (accessed on 15 March 2025).
- European Environment Agency. European Union 8th Environment Action Programme: Monitoring report on progress towards the 8th EAP objectives 2023 edition. EEA Report 11/2023. Available online: https://www.eea.europa.eu/en/analysis/publications/european-union-8th-environment-action-programme (accessed on 11 March 2025).
- Canali, M.; Aragrande, M.; Beber, C. L. The 2030 Veterinary Antimicrobial Sales Reduction Target in Europe: Where Are We? EuroChoices 2024, 23(2), 52–53. [CrossRef]
- Kasztelan, A. How Circular Are the European Economies? A Taxonomic Analysis Based on the INEC (Index of National Economies’ Circularity). Sustainability 2020, 12(18), 7613. [CrossRef]
- Nowak, A.; Kasztelan, A. Economic competitiveness vs. green competitiveness of agriculture in the European Union countries. Copernican Economics 2022, 13(2), 379–405. [CrossRef]
- Eurostat. Organic crop area by agricultural production methods and crops [org_cropar]. Available online: https://doi.org/https://doi.org/10.2908/ORG_CROPAR (accessed on 14 March 2025).
- European Commission Directorate-General for Agriculture and Rural Development. Mapping and analysis of CAP strategic plans—Assessment of joint efforts for 2023-2027. Chartie, O. (Editor), Folkeson Lillo, C. (Editor), Publications Office of the European Union, 2023. [CrossRef]
- OrganicTargets4EU. Austria Organic Sector Factsheet Production/Market Trends & Policies. Available online: https://organictargets.eu/wp-content/uploads/2025/03/Austria-Digital-country-Factsheet.pdf (accessed on 11 March 2025).
- Eurostat (2025). Developments in organic farming. Data from June 2024. Available online: https://ec.europa.eu/eurostat/statistics-explained/index.php?title=Developments_in_organic_farming (accessed on 11 March 2025).
- Doorn, J. van; Verhoef, P. C. Willingness to pay for organic products: Differences between virtue and vice foods. International Journal of Research in Marketing 2011, 28(3), 167. [CrossRef]
- Mughal, H. A.; Faisal, F.; Khokhar, M. N. Exploring consumer’s perception and preferences towards purchase of non-certified organic food: A qualitative perspective. Cogent Business & Management 2021, 8(1). [CrossRef]
- Viana, C. M.; Freire, D.; Abrantes, P.; Rocha, J. Evolution of Agricultural Production in Portugal during 1850–2018: A Geographical and Historical Perspective. Land 2021, 10(8), 776. [CrossRef]
- Peng, M. The Growing Market of Organic Foods: Impact on the U.S. and Global Economy. In Elsevier eBooks, Chapter 1—The Growing Market of Organic Foods: Impact on the US and Global Economy. Editor(s): Biswas, D., Micallef, Sh.A. Safety and Practice for Organic Food, Academic Press, 2019, pp. Available online: https://doi.org/10.1016/b978-0-12-812060-6.00001-5 3-22 (accessed on 12 March 2025).
- Isman, M. B. Challenges of Pest Management in the Twenty First Century: New Tools and Strategies to Combat Old and New Foes Alike. Frontiers in Agronomy 2019, 1. [CrossRef]
- Rocchi, L.; Mancinelli, A. C.; Paolotti, L.; Mattioli, S; Boggia, A.; Papi, F.; Castellini, C. Sustainability of Rearing System Using Multicriteria Analysis: Application in Commercial Poultry Production. Animals 2021, 11(12), 3483. [CrossRef]
- Lechenet, M.; Bretagnolle, V.; Bockstaller, C.; Boissinot, F.; Petit, M.S.; Petit, S.; Munier-Jolain, N. Reconciling Pesticide Reduction with Economic and Environmental Sustainability in Arable Farming. PLoS ONE 2014, 9(6). [CrossRef]
- Malkanthi, S. H. P.; Rathnachandra, S. D. D.; Weerasinghe, W. A. R. N. Consumers’ Awareness on Organic Food: Case of Urban Sri Lanka. Zeszyty Naukowe SGGW w Warszawie—Problemy Rolnictwa Światowego 2021, 21(4), 25. [CrossRef]
- Perpar, A.; Udovč, A. Organic Farming: A Good Production Decision for Slovenian Small Size Farms and Farms in the Areas with Restrictions/Limitations or Natural Obstacles for Agriculture? IntechOpen 2019. [CrossRef]
- Rahmaniah, H. M.; Darma, R.; Asrul, L.; Taufik, D. The potential of organic agriculture, soil structure and farmers income for inclusive agriculture sustainability: a review. IOP Conference Series Earth and Environmental Science 2020, 575(1), 12099. [CrossRef]
- Çakmakçı, R.; Salık, M.A.; Çakmakçı, S. Assessment and Principles of Environmentally Sustainable Food and Agriculture Systems. Agriculture 2023, 13, 1073. [Google Scholar] [CrossRef]
- Ewert, F.; Baatz, R.; Finger, R. Agroecology for a Sustainable Agriculture and Food System: From Local Solutions to Large-Scale Adoption. Annual Review of Resource Economics 2023, 15(1), 351. [CrossRef]
- Adebiyi, J. A.; Olabisi, L. S.; Richardson, R. B.; Liverpool-Tasie, L. S. O.; Delate, K. Drivers and Constraints to the Adoption of Organic Leafy Vegetable Production in Nigeria: A Livelihood Approach. Sustainability 2019, 12(1), 96. [CrossRef]
- Peng, B.; Melnikienė, R.; Baležentis, T.; Agnusdei, G. P. Structural dynamics and sustainability in the agricultural sector: the case of the European Union. Agricultural and Food Economics 2024, 12(1). [CrossRef]
- Rowińska, P.; Gutarowska, B.; Janas, R.; Szulc, J. Biopreparations for the decomposition of crop residues. Microbial Biotechnology 2024, 17, e14534. [Google Scholar] [CrossRef] [PubMed]
Figure 1.
Main steps of the research methodology.
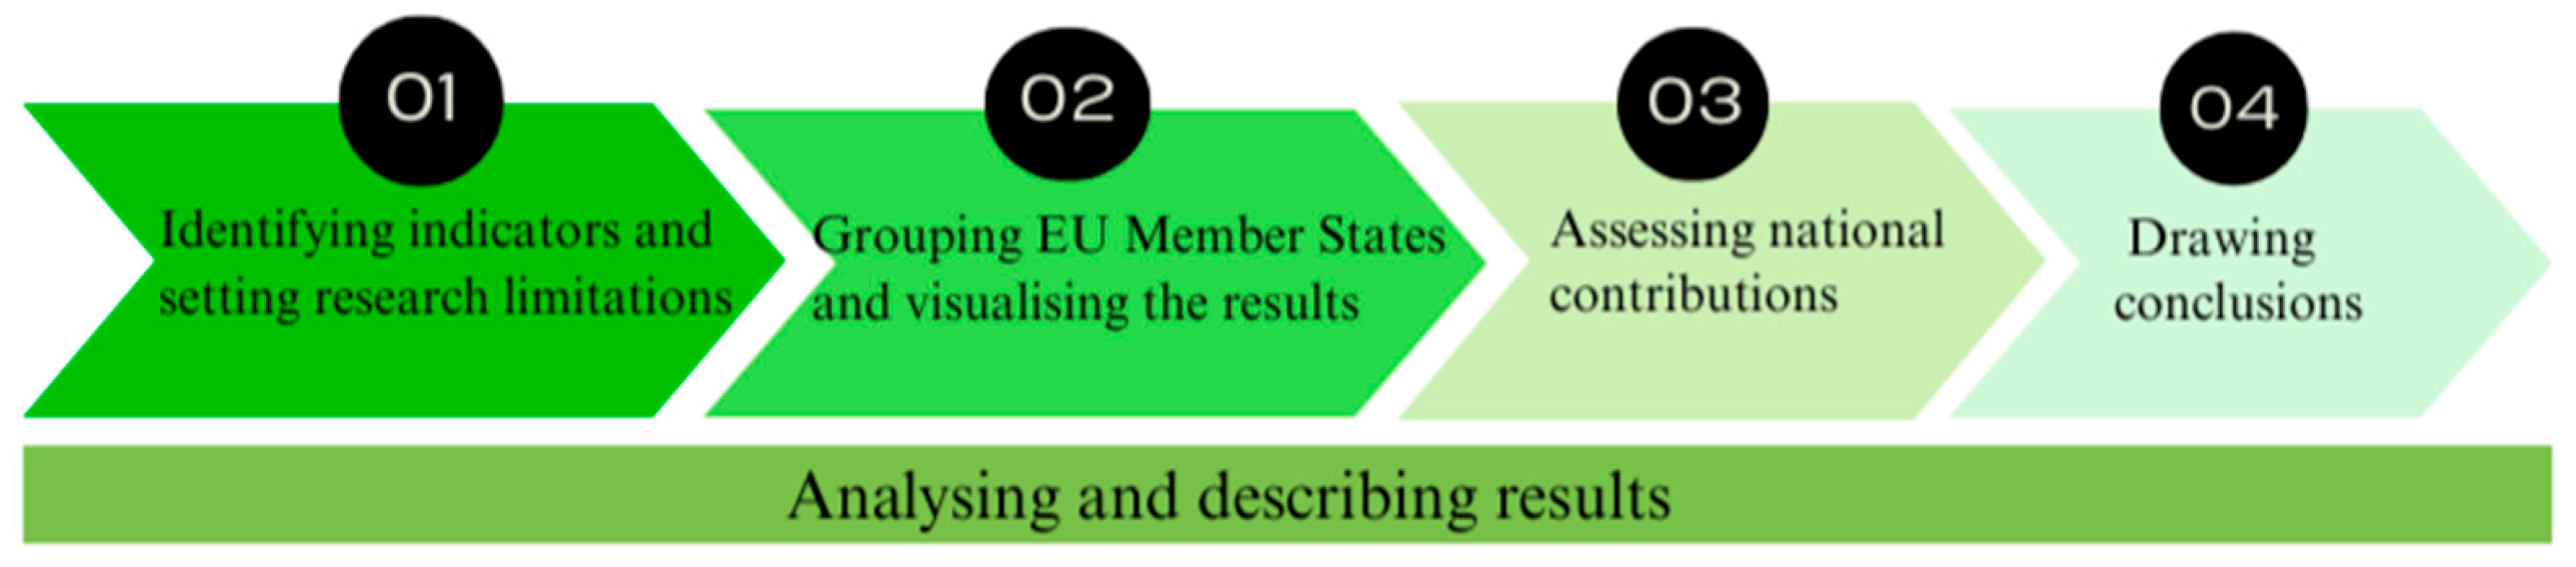
Figure 2.
Classification of EU Member States by organic UAA, %, and by rate of change in the share of organic UAA in 2018-2022 [35,37].
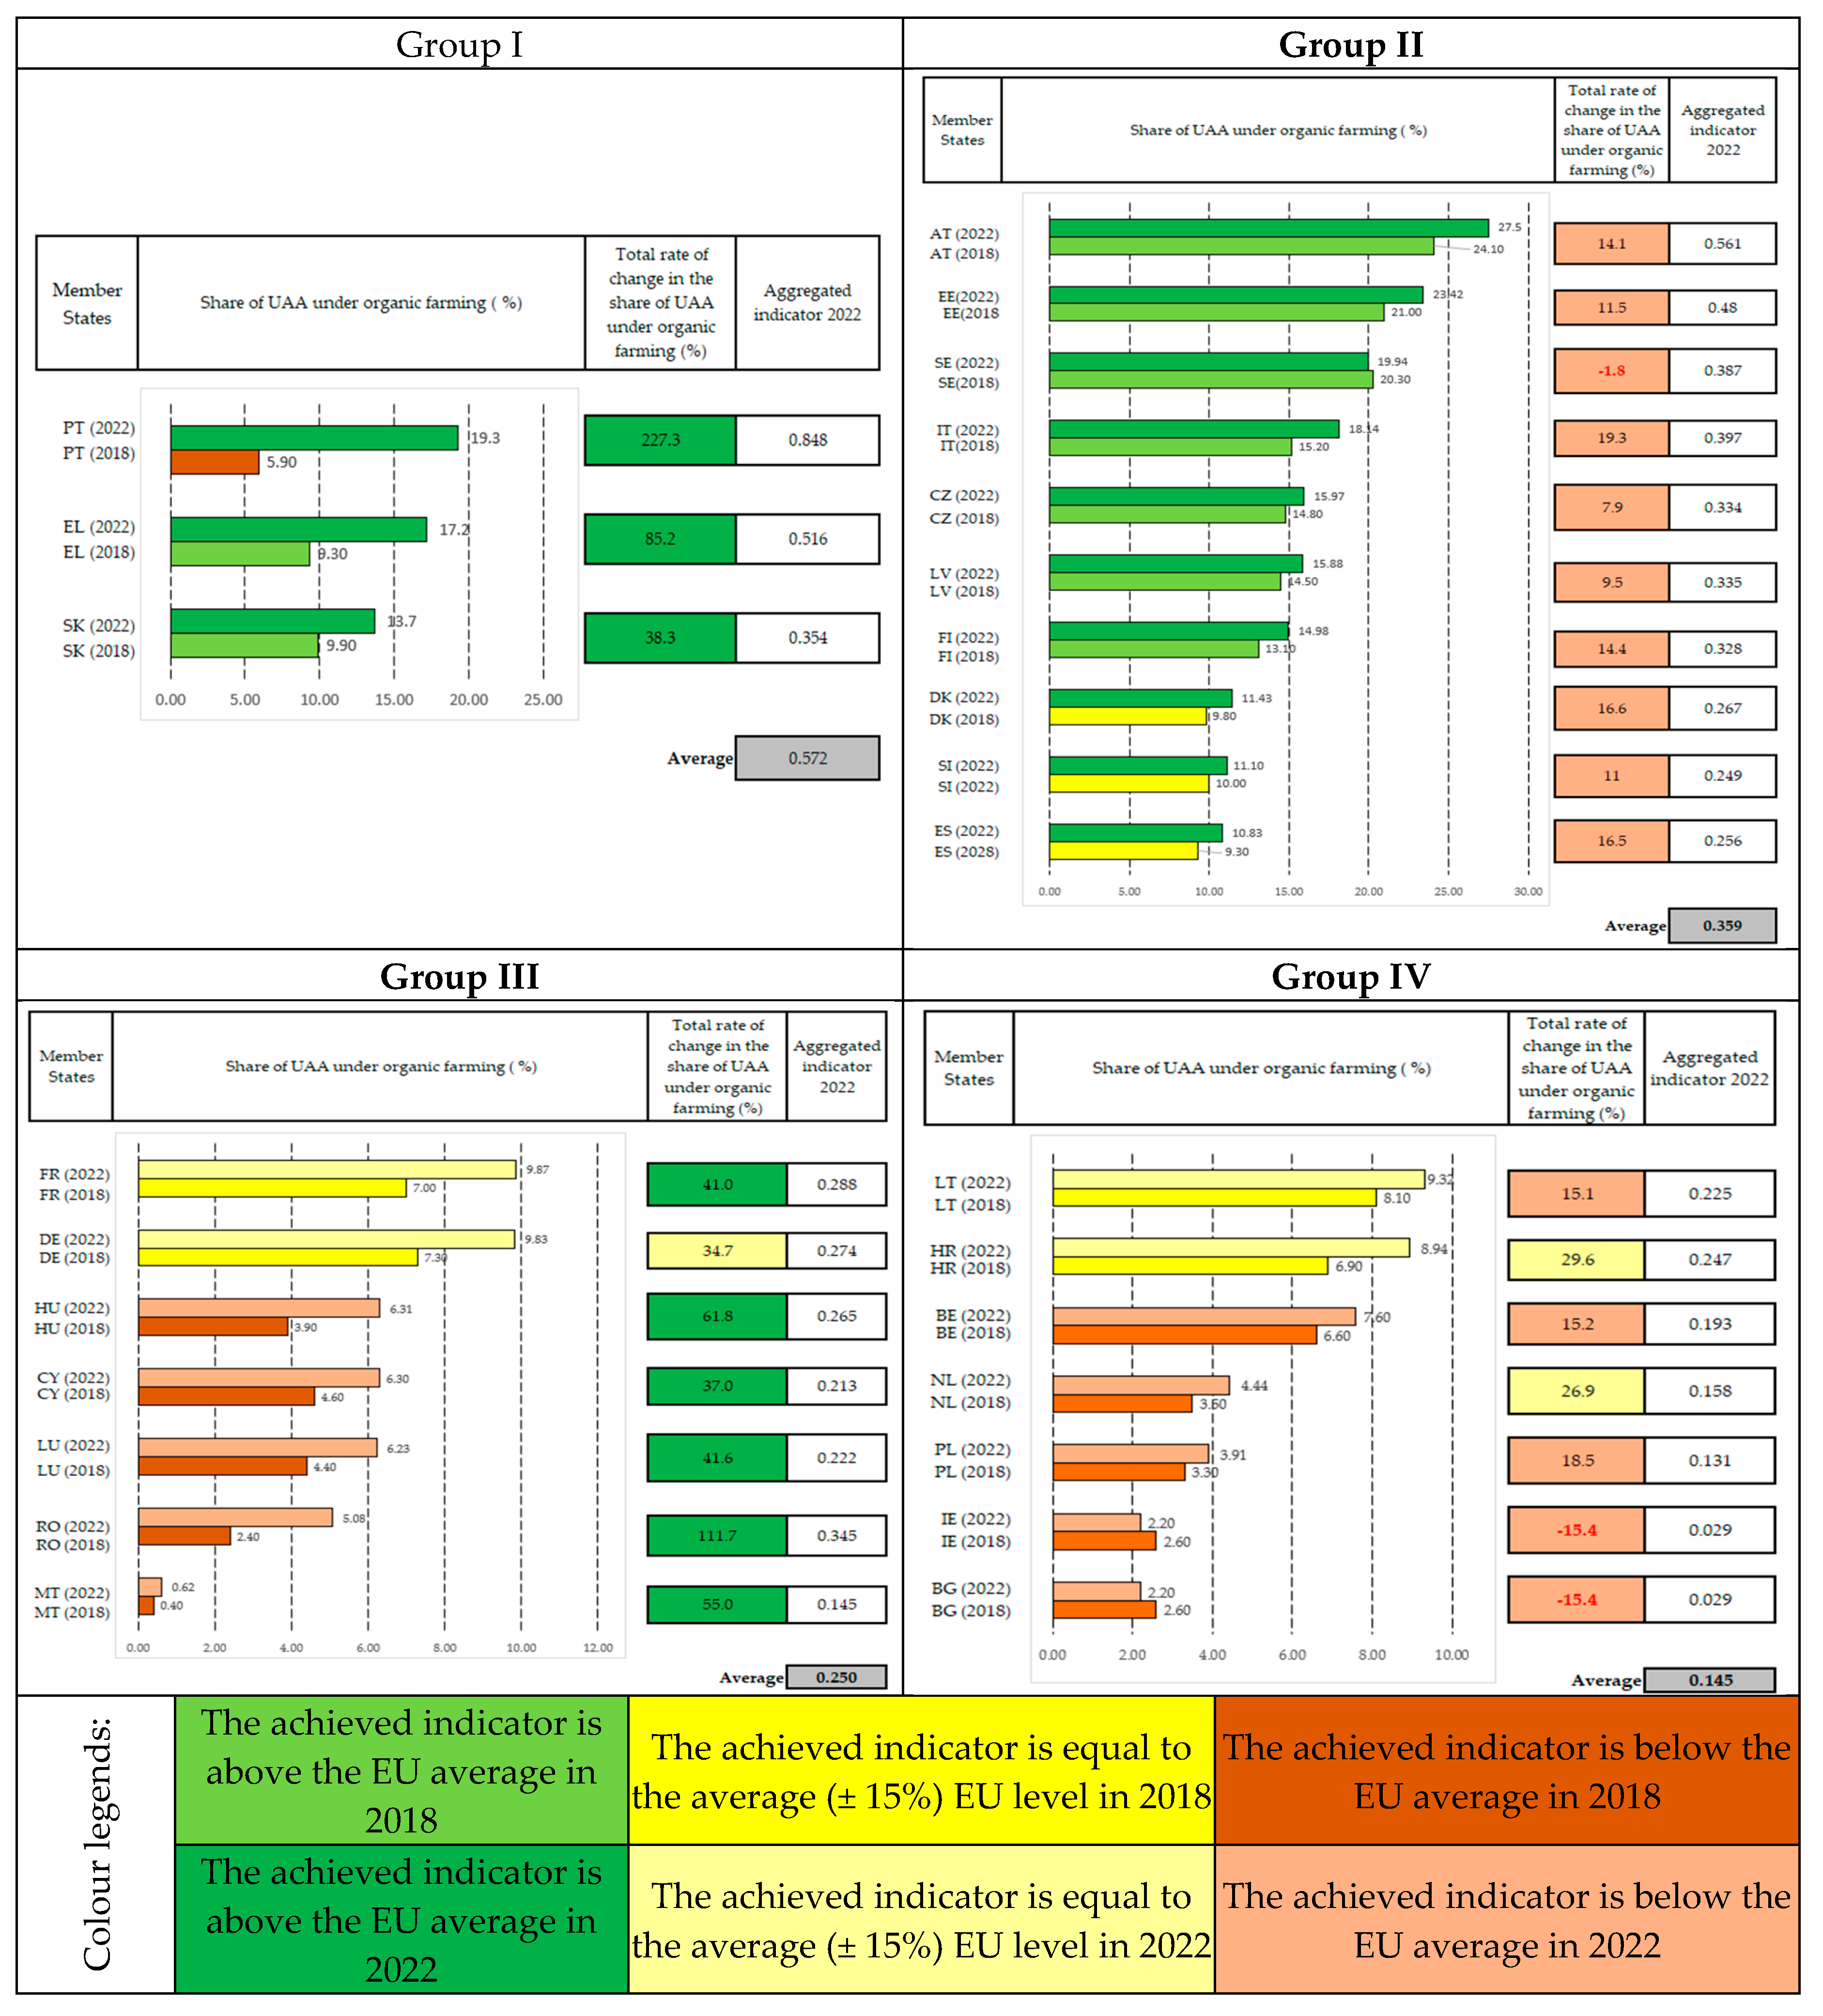
Figure 3.
Spatial summary of the contributions of EU Member States to achieving the objective set by the F2F Strategy—to increase the organic farming area during the progress period as well as the forecast and target period.
Figure 3.
Spatial summary of the contributions of EU Member States to achieving the objective set by the F2F Strategy—to increase the organic farming area during the progress period as well as the forecast and target period.
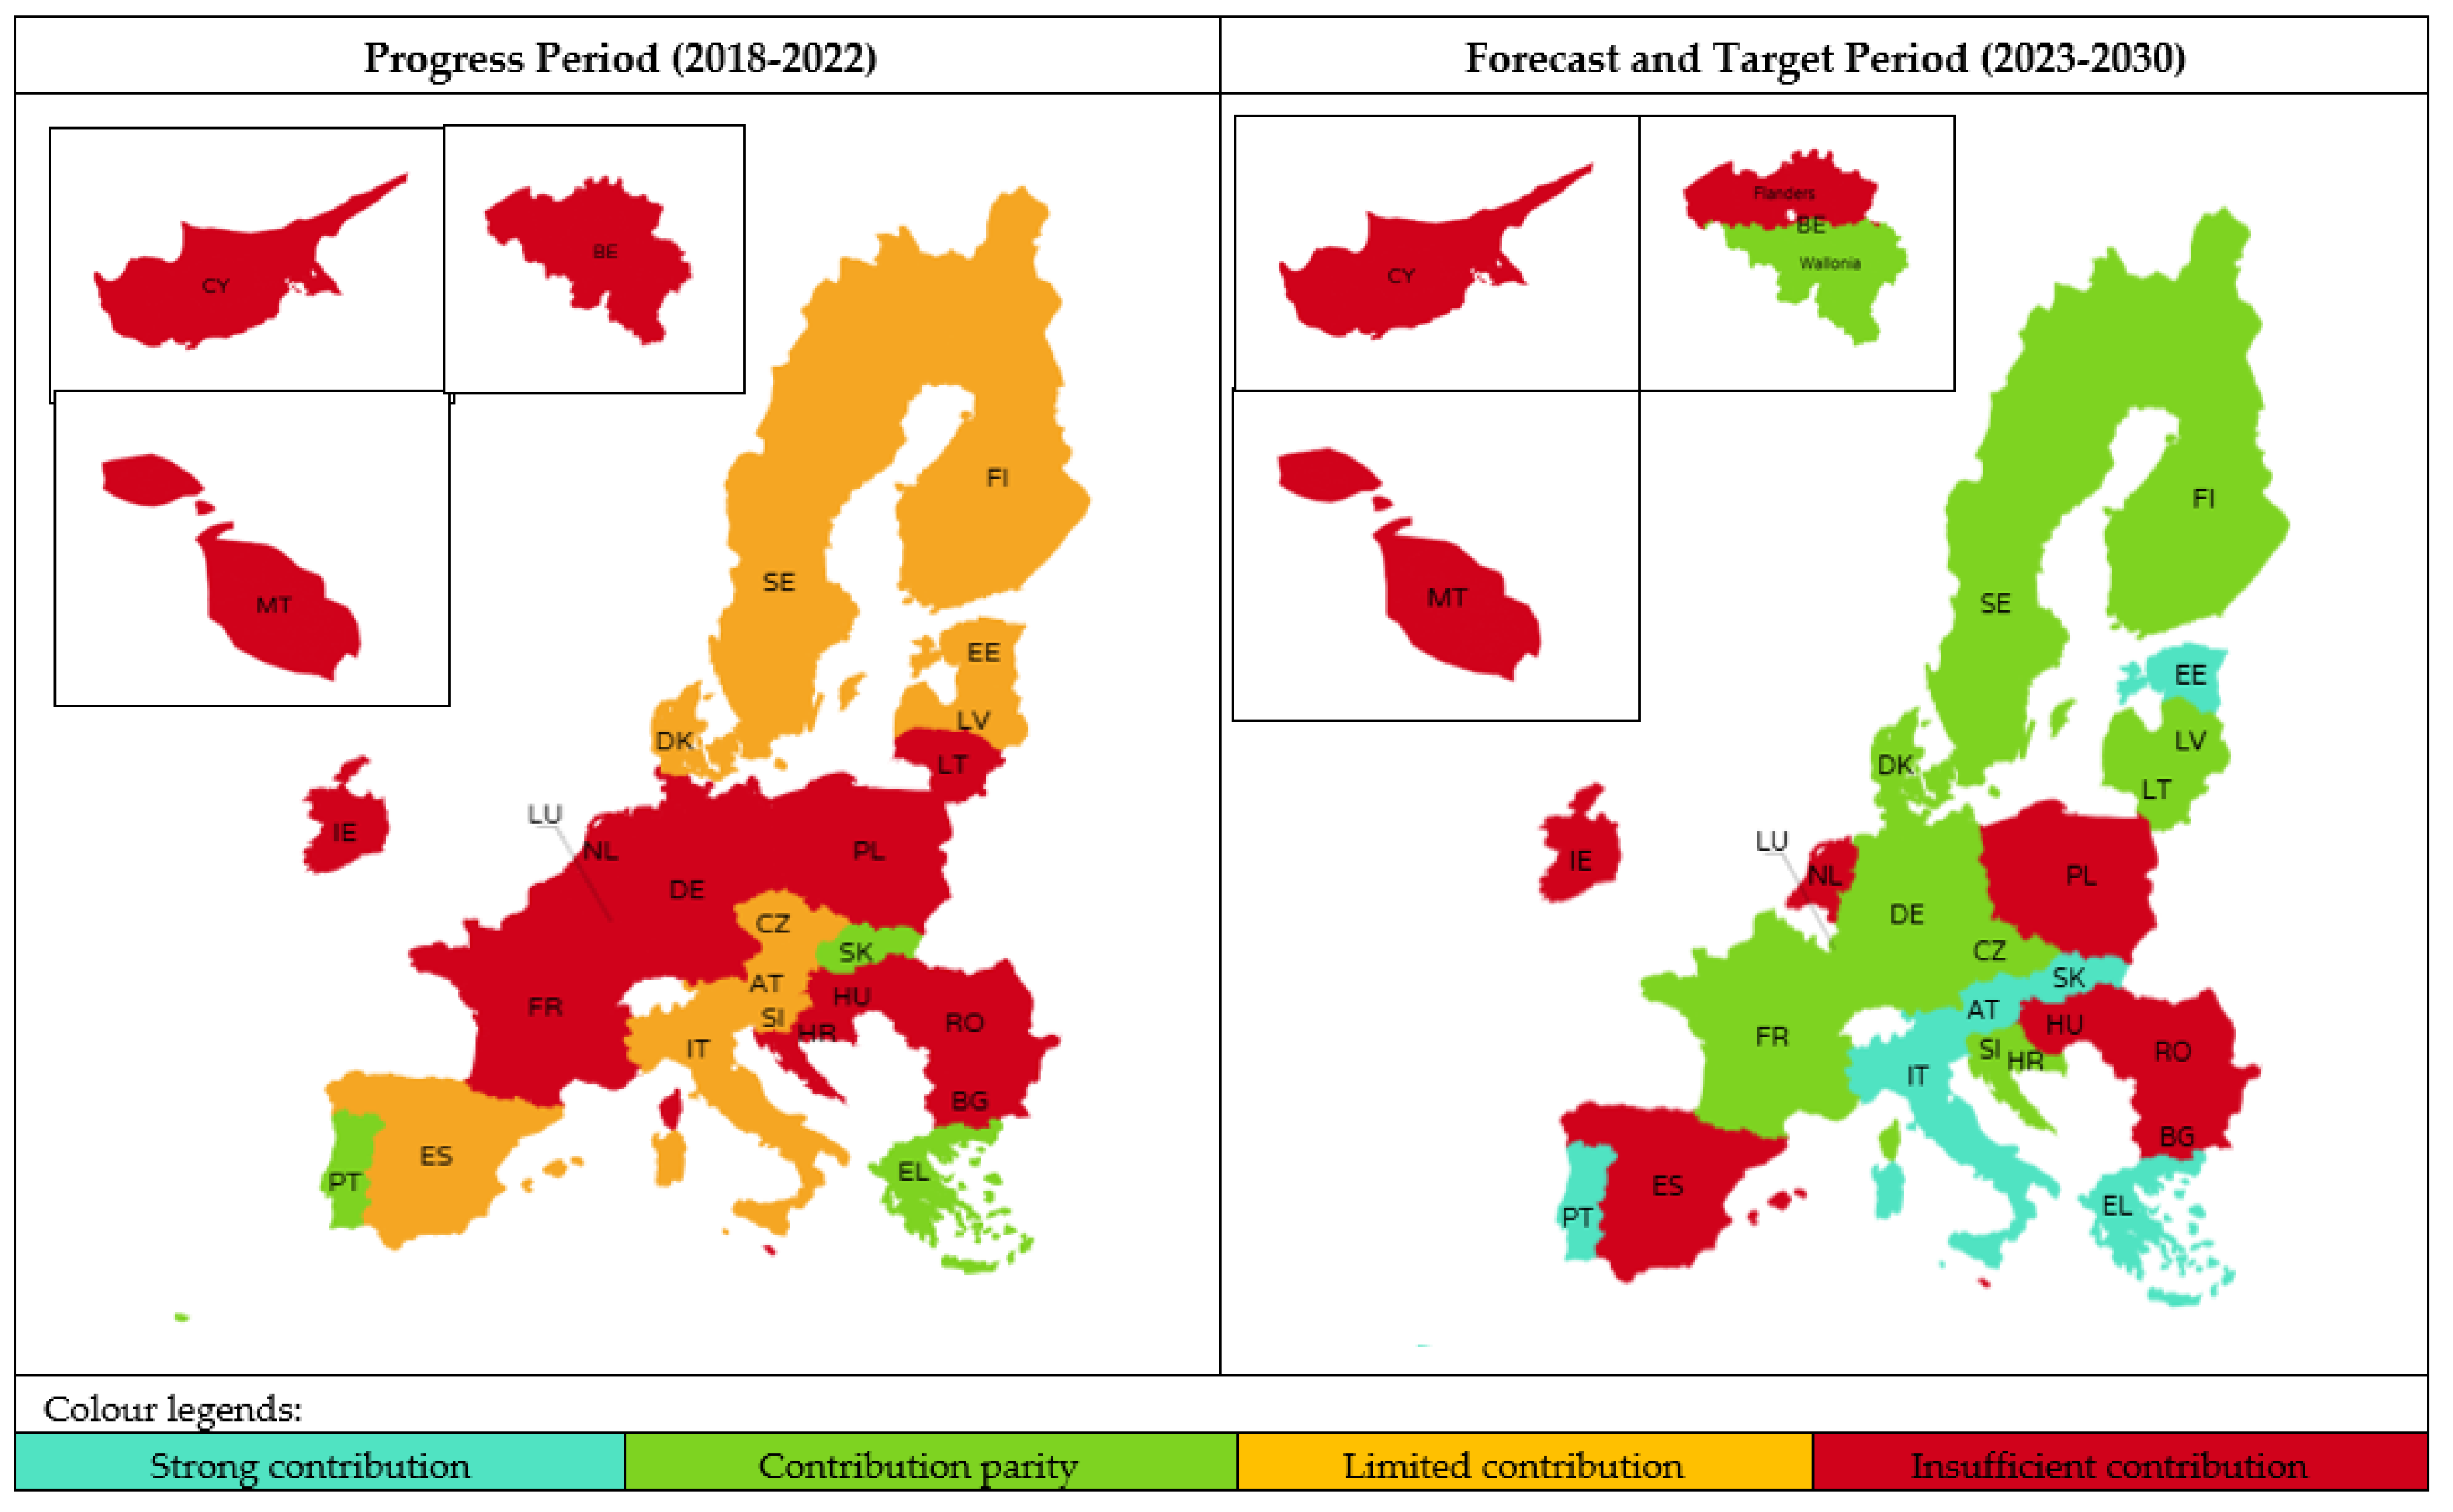
Figure 4.
Summary of changes in the performance of EU Member States to achieve the objective set by the F2F Strategy—to increase the organic farming area during the progress period as well as the forecast and target period.
Figure 4.
Summary of changes in the performance of EU Member States to achieve the objective set by the F2F Strategy—to increase the organic farming area during the progress period as well as the forecast and target period.
| Member States | 2018 | 2022 | 2022 vs.2018 | |||
| ha | Share, % | ha | Share, % | ha | Share, % | |
| AT | 639 097 | 4.9 | 705 835 | 4.2 | 66 738 | -0.7 |
| BE | 89 025 | 0.7 | 103 437 | 0.6 | 14 412 | -0.1 |
| BG | 128 839 | 1.0 | 110 441 | 0.7 | -18 398 | -0.3 |
| HR | 103 166 | 0.8 | 129 374 | 0.8 | 26 208 | 0.0 |
| CZ | 519 910 | 4.0 | 563 702 | 3.3 | 43 792 | -0.7 |
| CY | 6 022 | 0.0 | 7 749 | 0.0 | 1 727 | 0.0 |
| DK | 256 711 | 2.0 | 300 057 | 1.8 | 43 346 | -0.2 |
| EE | 206 590 | 1.6 | 231 011 | 1.4 | 24 421 | -0.2 |
| FI | 297 442 | 2.3 | 339 459 | 2.0 | 42 017 | -0.3 |
| FR | 2 034 115 | 15.7 | 2 821 462 | 16.7 | 787 347 | 1.0 |
| DE | 1 221 303 | 9.4 | 1 630 984 | 9.7 | 409 681 | 0.2 |
| EL | 492 627 | 3.8 | 924 853 | 5.5 | 432 226 | 1.7 |
| HU | 209 382 | 1.6 | 320 517 | 1.9 | 111 135 | 0.3 |
| IE | 74 307 | 0.6 | 95 701 | 0.6 | 21 394 | 0.0 |
| IT | 1 957 937 | 15.1 | 2 349 475 | 13.9 | 391 538 | -1.2 |
| LV | 280 383 | 2.2 | 312 820 | 1.9 | 32 437 | -0.3 |
| LT | 239 691 | 1.9 | 271 329 | 1.6 | 31 638 | -0.2 |
| LU | 5 782 | 0.0 | 8 255 | 0.0 | 2 473 | 0.0 |
| MT | 47 | 0.0 | 66 | 0.0 | 19 | 0.0 |
| NL | 63 809 | 0.5 | 80 086 | 0.5 | 16 277 | 0.0 |
| PL | 484 676 | 3.7 | 554 632 | 3.3 | 69 956 | -0.5 |
| PT | 213 118 | 1.6 | 759 977 | 4.5 | 546 859 | 2.9 |
| RO | 326 260 | 2.5 | 644 520 | 3.8 | 318 260 | 1.3 |
| SK | 188 986 | 1.5 | 253 156 | 1.5 | 64 170 | 0.0 |
| SI | 47 848 | 0.4 | 53 202 | 0.3 | 5 354 | -0.1 |
| ES | 2 246 475 | 17.4 | 2 675 331 | 15.9 | 428 856 | -1.5 |
| SE | 608 754 | 4.7 | 597 204 | 3.5 | -11 550 | -1.2 |
| EU-27 | 12 942 302 | 100.0 | 16844635 | 100.0 | 3 902 333 | 0.0 |
Table 3.
Group 2 EU Member States classified according to the required average annual growth rate and result indicator R.29 set by the Member States’ CAP SPs for the forecast and target period [30,35,37].
Disclaimer/Publisher’s Note: The statements, opinions and data contained in all publications are solely those of the individual author(s) and contributor(s) and not of MDPI and/or the editor(s). MDPI and/or the editor(s) disclaim responsibility for any injury to people or property resulting from any ideas, methods, instructions or products referred to in the content. |
© 2025 by the authors. Licensee MDPI, Basel, Switzerland. This article is an open access article distributed under the terms and conditions of the Creative Commons Attribution (CC BY) license (http://creativecommons.org/licenses/by/4.0/).
Copyright: This open access article is published under a Creative Commons CC BY 4.0 license, which permit the free download, distribution, and reuse, provided that the author and preprint are cited in any reuse.


