
Submitted:
17 April 2025
Posted:
17 April 2025
You are already at the latest version
Abstract
The European Green Deal, including the Farm to Fork and Biodiversity strategies, assume an increase in the area under organic farming to 25% by 2030. In order to achieve this purpose, it is important to understand the factors that lead to the development of organic farming. Data from Lithuanian and Polish Farm Accountancy Data Network datasets and logistic regression was used to evaluate factors influencing the adoption of organic farming in two neighboring countries – Lithuania and Poland – which have quite different agricultural sectors. Study period was 2009-2019.The results indicated that multiple factors affected the probability of adopting organic farming in both Lithuania and Poland. However, the results were somewhat different at the beginning and at the end of the research period. The findings also demonstrated an important role of subsidies in the adoption of organic farming. These findings are particularly important for policy makers to design effective policies and programs aimed at supporting the development of organic farming in both Lithuania and Poland.
Keywords:
family farms
; logistic regression
; organic farming
; sustainable agriculture
; agricultural finance
1. Introduction
In recent years, in many developed countries the consumption model is changing, which is reflected in the growing demand for high-quality food products (i.e., organic products, traditional and regional products and products produced under quality systems), produced in a way that is not harmful to the environment and climate [1,2]. This trend likely will continue in the future as sustainable agriculture is becoming increasingly important in many countries. Sustainable agriculture also plays a central role in the European Green Deal, including organic farming as a key element of transition to more sustainable agriculture.
Organic farming is a production system that minimizes pressure on the environment. It excludes the use of synthetic fertilizers and plant protection products and requires the use of complex crop rotation and soil protection measures, which positively affects the quality of soil, water, and air [3,4]. Furthermore, organic farming increases soil organic matter and is beneficial for the climate [5,6,7,8]. It also has a positive impact on biodiversity [9,10,11].
Organic farming, which fits into the sustainable development paradigm of the bioeconomy, should be considered in terms of planetary boundaries. Today and in the future, the greatest threats to agriculture are and will continue to be progressive climate change and the accompanying intensification of extreme weather events, loss of biodiversity and adverse eco-system changes and at so-called ‘tipping points’ within planetary boundaries. These boundaries relate to Earth Systems, of which there are nine: climate change; biodiversity loss; biogeochemical (anthropic nitrogen removed from the atmosphere and anthropic phosphorus entering the oceans); ocean acidification; land use (percentage of land surface converted to cropland); freshwater; ozone depletion; chemical pollution. Critical points/thresholds, on the other hand, are the values of the above components of the Earth Systems, beyond which a sudden, non-linear and irreversible change in the natural environment may occur on a continental or global scale, making sustainable development very difficult. Climate change and biodiversity loss are considered the most important, as they are affected by all other systems. At the end of 2023, it is estimated that only the ozone layer, chemi-pollution and ocean acidification are within established ranges [12,13,14,15,16,17,18,19,20].
The study aims to evaluate factors influencing the adoption of organic farming in Lithuania and Poland. In order to achieve the aim of this study the following tasks were set:
1. To explore selected characteristics of both organic and conventional farms in Lithuania and Poland.
2. To determine factors that have a significant effect on the decision to engage in organic farming in two neighboring countries – Lithuania and Poland – which have quite different agricultural sectors.
3. To propose measures to encourage the development of organic farming in the countries analyzed.
To our best knowledge, this is the first such comprehensive empirical study on the identification and exploration of the determinants of adoption to organic farming in two Central and Eastern Europe (CEE) countries. The novelty of the study is twofold: firstly, the recognition, in addition to the traditional factors recognised in the literature, of the role of agri-environmental schemes (AES) from the point of view of the adoption of organic farming; secondly, a detailed empirical analysis of the determinants of adoption of organic farming in two CEECs based on data from the FADN (Farm Accountancy Data Network) database.
2. Literature Review
2.1. Determinants of Organic Farming
When analyzing the factors of organic farming, various classifications can be found in scientific literature, but they can basically be divided into two groups: internal factors that depend on a specific producer, and external factors that do not depend on a specific producer. The first group includes agricultural producers’ characteristics, while the second consists off actors related to market and policy.
Several studies found an association between the adoption of organic farming and the age of farm operators. The studies by Liu et al. [21], López and Requena [22] and Malá and Malý [23] found that the adoption of organic farming was higher among younger farm operators. A possible explanation is that younger operators are more educated, open to innovations and better understand the advantages of organic farming. Furthermore, older operators have lower ability to find additional employees, which are often necessary for organic farming. Organic farming may not be also attractive to older operators because the financial benefits of organic production usually are obtained only after a longer period. However, the studies by Karki et al. [24], Khaledi et al. [25] and Xie et al. [26] showed that older farm operators were more likely to adopt organic farming than younger operators. This might be due to more experience in farming.
The adoption of organic farming is also influenced by farm location. A study by Kujala et al. [27] revealed that organic farming was mainly developed in those regions where soil quality was lower, and farms achieved worse productivity indicators. Similarly, a study by Heinrichs et al. [28] stated that organic farming in Germany was more frequent in regions characterized by lower intensity of agricultural production and higher degree of land fragmentation. A study by Lu and Cheng [29] suggested that organic farming in Taiwan was more likely to adopt in agriculturally less favored regions. A study by Zieliński et al. [30] showed that in Poland most organic farms operated in less favourable agricultural areas. A possible explanation is that farms located in agriculturally less favoured regions achieve worse productivity indicators, therefore, organic farming offers excellent opportunities to improve their income.
Among the factors that influence the adoption of organic farming are also various farm production and economic indicators. The studies by Genius et al. [31], Kafle [32], Karki et al. [24], Koesling et al. [33] and Xia et al. [34] suggested that larger farms had an increased probability of converting to organic farming. It is possible that larger farms often enjoy higher prices with lower production costs. Furthermore, due to easier access to credit, larger farms can introduce new technologies. Contrary to the results above, the studies by Bartulović and Kozorog [35], Khaledi et al. [25], Liu et al. [21] and Malá and Malý [23] stated that small farms were more likely to adopt organic farming. A possible explanation is that small farms are very often family farms, where a substantial majority of laborers are from the family, which are necessary for organic production. Therefore, the studies by Wollni and Andersson [36] and Xie et al. [26] argued that the increase in family members was a stimulus for organic farming. Also, the studies by Läpple [37] and Läpple and van Rensburg [38] pointed out that higher number of livestock units was an obstacle to the adoption of organic farming. This is mainly due to lower support for animal production.
As regards farm economic indicators, a study by Wiśniewski et al. [39] claimed that agricultural producers’ decision to convert to organic farming were not driven by environmental conditions, but rather economic (income) reasons. The studies by Hoque et al. [40] and Li et al. [41] stated that farms with lower income levels were more likely to adopt organic farming. The studies by Heinze and Vogel [42] and Sriwichailamphan and Sucharidtham [43] mentioned that also income from off-farm sources encouraged agricultural producers to participate in organic farming. A study by Pornpratansombat et al. [44] found that low costs were a decision driver for the adoption of organic farming. A study by Mrinila et al. [45] showed that interest in organic farming decreased when agricultural producers were in debt. All these indicators are important determinants for adoption because they directly affect the profitability of farms.
Finally, the adoption of organic farming is related to some external factors, among them financial support and factors related to the market. A study by Verburg et al. [46] showed that, among other factors considered, an important factor for the development of organic farming in the Netherlands was governmental support. A study by Ambrosius et al. [47] revealed that organic farming in the Netherlands was also affected by the demand for organic products. Similar results were obtained by Ferreira et al. [48]. According to them, the main factors determining the expansion of organic farming in Portugal were public support, especially during the conversion period, prices for organic products and the existence of sales channels. A study by Serra et al. [49] showed that price premiums and subsidies were important factors influencing the adoption of organic farming in Spain. A study by Malá and Malý [23] suggested that organic payments were one of the key determinants leading to the adoption of organic farming practices in the Czech Republic. Thus, according to them, through agricultural policy it is possible to influence the development of organic farming. Similarly, a study by Palšová [50] argued that financial support was the key driver for the adoption of organic farming in Slovak Republic. A study by Rozman et al. [51] found that subsidies were also the main motivation for the adoption of organic farming in Slovenia. A study by Łuczka and Kalinowski [52] revealed that most Polish agricultural producers, especially having mixed and grazing livestock farms, intend to continue organic farming only if support is provided. As noted by Siepmann and Nicholas [53], one way to develop organic farming in Germany is to increase financial support. As stated by Yanakittkul and Aungvaravong [54] support was also a decision driver for the adoption of organic farming in Thailand. However, a study by Kerselaers et al. [55] suggested that the current support system motivates only crop farms to adopt organic farming. Therefore, according to them, in order to ensure the development of organic farming, it is important to increase the variety of support measures.
2.2. Public Policies vs. Organic Farming
The issue of agri-enviromental schemes (AES) is important from the perspective of adoption of organic farming. Most of the subsidies going to EU farmers are direct payments. In general, they are quite easy to obtain and generate relatively low administrative and transaction costs [56,57]. Last but not least, their beneficiaries are fully free to spend the funds they receive. This further means that these funds on farms are subject to volatility (the fungibility of money) and can therefore crowd out money from other sources. In this context, the relationship between direct payments and bank loans and economic insurance is particularly important [58]. Following this, neoclassical economic theory suggests that direct payments in models can be unreservedly related to utility maximisation and expected utility problems [59]. However, the case is different for subsidies from Pillar II of the CAP and, for example, the reimbursement of excise duties contained in agricultural fuel. We will examine this problem more closely using the example of EU agri-environmental payments (The Agri- environmental Schemes, AES).
AES in the CAP already appeared around the , but became compulsory from 1992 onwards, nevertheless the interest of farmers in this type of support was not high. This was due to a number of reasons. Firstly, it is a complex instrument from the structural implementation and settlement design side [60]. Secondly, farmers' use of it is often associated with high opportunity costs, which significantly reduces the profitability of their participation in applied programmes [61]. This problem particularly affects my farm. Thirdly, the multiplicity of economic-financial, social and psychological determinants of farmers' participation in an ES makes it a major challenge to make the right decision and ES for agricultural policy makers and intervention designers is also a major problem that additionally generates one of the highest relative administrative and transaction costs. Finally, it should be mentioned that despite the use of a great number of complex econometric tools for the evaluation of AES (e.g. laboratory experiments, randomised experiments and elections), researchers have so far not offered convincing procedures that would lead to a significant increase in farmers' interest in this type of subsidy and at the same time rationalise its spending [62]. Increasingly, there is therefore a call to start drawing more extensively on the work of behavioural economics [63].
Agricultural interventions underpinned by the theoretical underpinning of the findings of behavioural economics should primarily appeal to the loss aversion effects of sponsorship and having mental accounts and reference points [64]. Loss aversion is a tendency in which people give greater weight in their choices to expected losses than to equal amounts of gains [65]. Consequently, they keep financial instruments on which they incur losses for too long because they fear their materialisation. This is how the disposition effect manifests itself.
Another form of version to losses: is the too rapid divestment by stock market investors of instruments that are gaining in value. In part, this is also due to the presence here of the holding effect, i.e. prescribing a higher value to what one already has.
In agriculture, loss aversion and the above two effects explain quite well the low demand of farmers for index insurance. The term "mental accounting" or mental bookkeeping was introduced into scientific circulation by Thaler [66]. Economic agents treat the sources and directions of spending money differently, using peculiar mental accounts for these purposes, and this implies a lack of the already mentioned fungibility of funds and a feeling among people of gaining more control over their money and assets. One important implication of mental accounting in relation to AES is that farmers, under certain conditions, may even agree to a lower cost of the amount of support in exchange for a radical simplification of its rules [64].
Reference points or otherwise reference points are one of the main concepts in Tversky and Kahneman's theory of perspective. In their article they also call them adaptation levels. In general, they are used to determine the zeros on the value scales against which gains and losses are measured. This is more about the difference than their absolute values. In a broader sense, these points can be seen as the context of measurement. It should be added here that Tversky and Kahnnemann introduced this concept based on an article by H. Markowitz's 1952 paper on the measurement of asset utility and H. Nelson's 1964 book, which focused on an experimental approach to behaviourism [67] The novelty of prospect theory, on the other hand, lies in the fact that Tversky and Kahneman very sensibly documented the relevance of introducing these points with results from psychological research from the field of neuroscience. The reference points are usually current asset and wealth states and various categories of well-being. In more advanced work, expected values are also used.
A very interesting study among British farmers oriented towards improving AES after Brexit was conducted by Ocean and Howley, which drew on the work of behavioural economics [64]. They used the logic of a randomised experiment, whose primary advantage is to invoke counterfactuals, thus constructing specific control conditions, and this makes it possible to estimate the causal effects of proposed changes to the AES. The study technically consisted of sending questionnaires electronically to a randomly drawn 138,379 beneficiaries who were to determine responses to various issues and events from the years 1999-2013. 860 questionnaires were returned which corresponded to 7.6% of the documents sent. The results obtained are summarised below.
1. The majority of farmers regarded the AES as a difficult subsidy to obtain and a labour-intensive unpleasant to apply for. Some of them would actually be prepared to agree to a reduction in payments for sure, as long as the labour input and overall costs of publishing for them were reduced at the same time. On average, the maximum reduction could be as high as 31% if the labour intensity of applications fell from 10 to 1 hour. The recommended strategy, on the other hand, would be to integrate payments and costs into a single account, so that farmers can see the net cost-effectiveness of participating in the AES.
2. If the name of the AES contains unambiguous references to environmental issues that farmers understand and significant benefits for society, the chances increase that they would be more likely to spend the money thus obtained on improving the environmental friendliness of their farms. This means that the assumption about the fungibility of funds is thus undermined. This therefore confirms the validity of mental accounting.
3. In line with loss aversion and the logic of reference points, farmers pay very close attention to cost-effectiveness, but also to environmental aspects in their decision-making when applying for AES support. It may be that the marginal utility of cost-effectiveness is on average rated higher than the marginal utility of environmental benefits. Therefore, if a new AES instrument is to be introduced, it must be done in such a way that farmers do not perceive it as less beneficial compared to existing ones. What is also important is that agricultural policy should first ensure satisfactory profitability of agricultural activities before encouraging farmers to participate more widely in AES.
3. Materials and Methods
Based on the analysis of existing literature, the following variables suggested as factors influencing the adoption of organic farming were selected: age of farm operator (in years), total costs per 1 ha of utilized agricultural area (UAA) (in EUR and PLN), family labor force (in family work units (FWU), total utilized agricultural area (in hectares), share of crop output in total output (in %), income per 1 ha of UAA (in EUR and PLN), income from off-farm sources (dummy variable(equal to one if the farm has income from off-farm sources, and zero if not), total liabilities per 1 ha of UAA (in EUR and PLN), location in agriculturally less favoured areas (dummy variable (equal to one if the farm is located in agriculturally less favoured areas, and zero if not), total subsidies (excluding on investment) per 1 ha of UAA (in EUR and PLN).
Selected characteristics were presented to compare organic and conventional farms in both Lithuania and Poland. Logistic regression was applied to investigate the factors influencing the adoption of organic farming:
where: are explanatory variables, is a binary dependent variable which represents whether or not a farm is organic, is the conditional probability that (a farm is organic) given the values of .
The data used in this study were obtained from Lithuanian and Polish Farm Accountancy Data Network (FADN) databases. As one can note, these data reflect main production and economic indicators of farms producing marketable products. Farms cover all districts and reflect different natural zones and farming conditions. Study period was 2009-2019. Figure 1 summarizes the methodological approach used in this study. Logistic regression models were developed using EViews software.
4. Results and Discussion
Increase in demand for high-quality products creates an attractive market space for Lithuanian and Polish organic producers. However, there is still a gap in organic farming in Lithuania and Poland and highly developed European Union (EU) countries (Figure 2). This is due to both supply and demand factors.
In 2019, there were 2 429 certified organic farms in Lithuania. A total of 246.6 thousand ha was in organic production (8.3% of the total agricultural area). During the research period, the production of organic wheat, oats and cereal mixtures prevailed, i.e., products that can be sold unprocessed. The production of organic livestock products was little developed. The area of certified organic production increased by 82.8% during 2009–2019, whereas the number of organic farms changed unevenly, and since 2016 was constantly decreasing (organic farms were getting bigger) [69].
In 2019, there were 18 637 organic farms operating in Poland. The area of organic agricultural land amounted to a total of 507.6 thousand ha. Organic farms covered 3.5% of the total agricultural area. In the structure of organic agricultural land, the largest part was occupied by cereals, forage crops, and meadows and pastures [70].
Looking at the dynamics in area of organic agricultural land in Poland, the share of organic agricultural land in relation to the total UAA in individual years ranged from 2.7% in 2009 to 4.6% in 2013. In 2013, there were both the largest number of organic farms (26 598) as well as the area of organic agricultural land (670 thousand ha). Since 2013, there has been a downward trend in terms of the number of organic farms and the area of organic agricultural land. In 2019, the area of organic agricultural land started to grow again despite a further decline in the number of farms [70,71].
Table 1 and Table 2 explore some characteristics of Lithuanian and Polish organic and conventional farms. As can be seen in Table 1, during the research period, Lithuanian conventional farms were, on average, larger in terms of utilized agricultural area than organic farms. On average, conventional farms generated higher income per 1 ha of UAA. Those farms also had higher costs and liabilities than organic farms. Nevertheless, during 2009-2019 organic producers received, on average, more subsidies than their conventional counterparts. This is an outcome of the possibility of benefiting from different measures under the Common Agricultural Policy (CAP). Other indicators, such as age of farm operator, share of crop output in total output, were rather similar between these two groups. Table 1 also shows that most indicators showed an increase during the research period.
As shown in Table 2, similar trends were observed in Polish farms. During the research period, most of the analyzed economic indicators, such as costs per 1 ha of UAA, income per 1 ha of UAA or liabilities per 1 ha of UAA, were higher in traditional farms. However, organic farms received, on average, more subsidies per 1 ha of UAA. Other indicators, such as family labor force, farm area, share of crop output in total output, were quite similar between these two groups. It should be also emphasized that the analyzed indicators changed unevenly during 2009-2019. This might be due to the development of technologies, policy and market changes and other factors.
Note that the multicollinearity was detected among total costs per 1 ha of UAA and income per 1 ha of UAA after calculating the correlation coefficients among explanatory variables. Thus, in order to satisfy the assumptions of regression analysis, income per 1 ha of UAA were not used for further analysis.
Table 3 and Table 4 present factors influencing the adoption of organic farming in Lithuania and Poland. As can be seen in Table 3, during the research period, multiple factors affected the probability of adopting organic farming in Lithuania. At the beginning of the research period the probability of adopting organic farming was higher among producers who operate larger farms. This finding corroborates the studies by Genius et al. [31] and Karki et al. [24] that showed that larger farms were more likely to adopt organic farming. As noted by Genius et al. [31], larger farms have greater potential to adopt organic farming due to high costs of conversion. Furthermore, larger farms have less financial pressure to search for ways to improve their income, introduce new technologies. In addition, the adoption of organic farming was more likely for farms having higher liabilities.
At the end of the research period the effect of liabilities on the adoption of organic farming remained unchanged. In addtion, the adoption of organic farming was more likely for producers who have income from off-farm sources. The same results were achieved by Heinze and Vogel [42] and Sriwichailamphan and Sucharidtham [43], who suggested that income from off-farm sources were important in encouraging producers to shift towards organic farming. A possible explanation for this is that off-farm income provides financial resources, thus creating incentives to bear risk situations which include, for instance, higher input costs, low market demand. The probability of adopting organic farming was also higher among farms having less family laborers. Finally, the adoption of organic farming was more likely for farms that operate outside less favoured areas. This is mainly due to higher yield variability in less favoured areas.
Note that two factors, namely costs, and subsidies, were significant throughout the research period. As can be seen in Table 3, during 2009–2019, the probability of adopting organic farming was higher among farms that have lower costs. As regards costs, such results can be explained by the fact that lower costs can allow producers to allocate more funds to investment, since switching to organic farming often requires some investment. In addition, the adoption of organic farming was stimulated by higher subsidies. The same results were achieved, for instance, by Ferreira et al. [48] and Malá and Malý [23], who suggested that subsidies were one of the key determinants leading to the adoption of organic farming practices.
As shown in Table 4,at the beginning of the research period the adoption of organic farming was more likely for older Polish producers. Similar results were also obtained, for instance, by Khaledi et al. [25] and Xie et al. [26], who showed that older farm operators were more likely to adopt organic farming than their younger counterparts. A possible explanation is that older farm operators have more knowledge and experience in farming. Furthermore, the probability of adopting organic farming was higher among producers with less family labor and a lower share of crop output in total output. In addition, the adoption of organic farming was more likely for producers having higher liabilities. A study also revealed that the adoption of organic farming was influenced by farm location. Specifically, the adoption of organic farming was more likely for producers located in agriculturally less favoured areas. The same results were achieved, for instance, by Lu and Cheng [29] and Zieliński et al. [30]. This can be explained by the fact that producers in these areas achieve worse productivity indicators, therefore, organic farming is an excellent opportunity to improve their income.
At the end of the research period the effect of four indicators, namely, age of farm operator, family labor force, share of crop output in total output, and total liabilities, on the adoption of organic farming remained unchanged. Moreover, the adoption of organic farming was more likely for smaller producers. This finding corroborates the studies by Bartulović and Kozorog [35], Khaledi et al. [25], Liu et al. [21] and Malá and Malý [23]. The key reason for suchlike result is that small farms are usually family farms selling directly to consumers and aiming to reduce the environmental effects and ensure sustainability, therefore, they are more interested in organic farming.
Similar to findings in Lithuania, two factors, namely costs, and subsidies, were significant throughout the research period. Thus, this study once again confirmed that support is the key factor for the development of organic farming. Therefore, in order to encourage the development of organic farming, a particular focus should be paid on policy to support organic farms. Specifically, in both Lithuania and Polandpayments for conversion to and maintenance of organic farming should be maintained at an appropriate level during the 2023–2027 programming period. In addtion, the policy measures for the development of organic farming should be targeted to improve the economic condition of organic producers (increase their market potential by investing in the development of farms, processing organic products, and shortening supply chains). It is also important to support demand for organic products and build consumer confidence. Only such like complex approach can ensure the development of this sector in the future.
We found that organic farms in both countries may be described a complex business profile. While they may have higher revenues per unit of land, on the other hand they incur higher costs, especially for labour, marketing and insurance [72]. To this must be added the costs of obtaining the right certificates and the uncertainty of future profitability and the problems of accessing subsidised insurance [73]. From the point of view of insurance companies, ecological farms are sometimes treated as dealing with special crops and therefore difficult for technical-insurance modelling and, consequently, causing difficulties in the precision of rate calculation processes and their tarification [74,75,76]. Organic farms may be less risky than conventional ones if risk is measured by the loss ratio, i.e. the ratio of claims to premiums [77].
5. Conclusions
During the research period, similar trends were observed in Lithuanian and Polish farms. In both countries most of the analyzed economic indicators, such as costs, income and liabilities, were higher in traditional farms. However, organic farms received, on average, more subsidies than their conventional counterparts. Other indicators, such as family labor force, share of crop output in total output, were rather similar between these two groups.
During the period of 2009–2019, multiple factors affected the probability of adopting organic farming in both Lithuania and Poland. Moreover, these factors were somewhat different at the beginning and at the end of the research period. However, subsidies had significant effect on the adoption of organic farming throughout the research period thus indicating that they were one of the key factors leading to the adoption of organic farming practices in both Lithuania and Poland.
In order to encourage the development of organic farming in both Lithuania and Poland, a specific focus should be paid on policy to support organic farms. More specifically, without effective utilization of existing measures, new policy initiatives that aim to improve the economic condition of organic producers, support demand for organic products and build consumer confidence should be developed. Suchlike holistic approach can ensure sustainable development of organic agriculture thereby achieving the intended objectives.
Organic farming in Lithuania and Poland in a near future should be linked to regenerative agriculture that emphasizes the restoration and enhancement of agroecosystem health, diverging from intensive, industrial practices. It synthesizes principles from integrated, organic, and precision agriculture, with influences from permaculture. Our future research should be focused on adaptation of regenerative farming practices in organic farms.
Author Contributions
Conceptualization, W.R. and M.S.; methodology, W.R and M.S.; software, W.R. and M.S.; validation, J.K., A.G. and A.K.K.; formal analysis, W.R. and J.K.; investigation, W.R. and A.G.; resources, W.R. and A.K.K.; data curation, W.R. and M.S.; writing—original draft preparation, W.R., M.S. and J.K.; writing—review and editing, A.G. and A.K.K.; visualization, W.R. and M.S.; supervision, M.S. All authors have read and agreed to the published version of the manuscript.
Funding
This research received no external funding.
Conflicts of Interest
The authors declare no conflicts of interest.
References
- Kułyk, P.; Dubicki, P. Uwarunkowania zachowań konsumentów na rynku żywności ekologicznej. Problems of World Agriculture/ Problemy Rolnictwa Światowego 2019, 19, 79–87. [Google Scholar] [CrossRef]
- Van Stappen, F.; Loriers, A. , Mathot, M.; Planchon, V.; Stilmant, D.; Debode, F. Organic versus conventional farming: the case of wheat production in Wallonia (Belgium). Agriculture and Agricultural Science Procedia 2015, 7, 272–279. [Google Scholar] [CrossRef]
- Geissen, V.; Silva, V.; Lwanga, E. H.; Beriot, N.; Oostindie, K.; Bin, Z.; Ritsema, C.J. Cocktails of pesticide residues in conventional and organic farming systems in Europe–Legacy of the past and turning point for the future. Environmental Pollution 2021, 278, 116827. [Google Scholar] [CrossRef]
- Kostensalo, J.; Lemola, R.; Salo, T.; Ukonmaanaho, L.; Turtola, E.; Saarinen, M. A site-specific prediction model for nitrogen leaching in conventional and organic farming. Journal of Environmental Management 2024, 349, 119388. [Google Scholar] [CrossRef]
- Diacono, M.; Persiani, A.; Testani, E.; Montemurro, F.; Ciaccia, C. Recycling agricultural wastes and by-products in organic farming: Biofertilizer production, yield performance and carbon footprint analysis. Sustainability 2019, 11, 3824. [Google Scholar] [CrossRef]
- Gomiero, T.; Pimentel, D.; Paoletti, M.G. Environmental impact of different agricultural management practices: conventional vs. organic agriculture. Critical Reviews in Plant Sciences 2011, 30, 95–124. [Google Scholar] [CrossRef]
- Lambotte, M.; De Cara, S.; Brocas, C.; Bellassen, V. Organic farming offers promising mitigation potential in dairy systems without compromising economic performances. Journal of Environmental Management 2023, 334, 117405. [Google Scholar] [CrossRef]
- Squalli, J. , & Adamkiewicz, G. The spatial distribution of agricultural emissions in the United States: The role of organic farming in mitigating climate change. Journal of Cleaner Production, 2023; 137678. [Google Scholar] [CrossRef]
- Adhikari, S.; Menalled, F.D. Supporting beneficial insects for agricultural sustainability: The role of livestock-integrated organic and cover cropping to enhance ground beetle (Carabidae) communities. Agronomy 2000, 10, 1210. [Google Scholar] [CrossRef]
- Mishra, P.; Singh, P.P.; Singh, S.K.; Verma, H. Sustainable agriculture and benefits of organic farming to special emphasis on PGPR. Role of plant growth promoting microorganisms in sustainable agriculture and nanotechnology 2019, 75–87. [Google Scholar] [CrossRef]
- Rotchés-Ribalta, R.; Marull, J.; Pino, J. Organic farming increases functional diversity and ecosystem service provision of spontaneous vegetation in Mediterranean vineyards. Ecological Indicators 2023, 147, 110023. [Google Scholar] [CrossRef]
- Rockstrom, J.; Steffen, W.; Noone, K.; Persson, Å.; Chapin, F. S. I.; Lambin, E.; Lenton, T. M.; Scheffer, M.; Folke, C.; Schellnhuber, H. J.; Nykvist, B.; de Wit, C. A.; Hughes, T.; van der Leeuw, S.; Rodhe, H.; Sörlin, S.; Snyder, P. K.; Costanza, R.; Svedin, U.; Falkenmark, M.; Karlberg, L.; Corell, R. W.; Fabry, V. J.; Hansen, J.; Walker, B.; Liverman, D.; Richardson, K.; Crutzen, P.; Foley, J. Planetary Boundaries: Exploring the Safe Operating Space for Humanity. Ecology and Society 2009, 14, 1. [Google Scholar] [CrossRef]
- PIU. Polska Izba Ubezpieczeń. Klimat rosnących strat. Rola ubezpieczeń w ochronie klimatu i transformacji energetycznej. /A climate of mounting losses. The role of insurance in climate protection and the energy transition/. Warszawa, Poland 2023. Available online: https://piu.org.pl/raporty/klimat-rosnacych-strat/ (accessed on 5 January 2025).
- Richardson, K. , Steffen, W., et al. Earth beyond six of nine planetary boundaries. Science Advances 2023, 9. [Google Scholar] [CrossRef]
- Bendyk, E. Przestrzelona przyszłość. Polityka, 2024; 49. [Google Scholar]
- Buchner, B. COP 29’s climate investment imperative. Science 2024, 386. [Google Scholar] [CrossRef]
- Copernicus Climate Change Service. 2024 – first year exceed 1.5°C above pre-industrial level. Available online: https://climate.copernicus.eu (accessed on 11 January 2025).
- Hansen, E. J.; Karecha, P.; Sato, M.; Kelly, J. Global warming has accelerated: Are the United Nations and the public well-informed? Environment: Science and Policy for Sustainable Development, 2025; 6. [Google Scholar] [CrossRef]
- Sommer, M. Punkt krytyczny dla klimatu. Dziennik Gazeta Prawna, 2025; 25. [Google Scholar]
- World Economic Forum. (2025). The Global Risks Report 2025 (20th ed.).
- Liu, X.; Pattanaik, N.; Nelson, M.; Ibrahim, M. The choice to go organic: Evidence from small US farms. Agricultural Sciences 2019, 10, 1566–1580. [Google Scholar] [CrossRef]
- López, C.P.; Requena, J.C. Factors related to the adoption of organic farming in Spanish olive orchards. Spanish Journal of Agricultural Research 2005, 3, 5–16. [Google Scholar] [CrossRef]
- Malá, Z.; Malý, M. The determinants of adopting organic farming practices: A case study in the Czech Republic. Agricultural Economics 2013, 59, 19–28. [Google Scholar] [CrossRef]
- Karki, L.; Schleenbecker, R.; Hamm, U. Factors influencing a conversion to organic farming in Nepalese tea farms. Journal of Agriculture and Rural Development in the Tropics and Subtropics 2011, 112, 113–123. [Google Scholar]
- Khaledi, M.; Weseen, S.; Sawyer, E.; Ferguson, S.; Richard, G. Factors influencing partial and complete adoption of organic farming practices in Saskatchewan, Canada. Canadian Journal of Agricultural Economics 2011, 58, 37–56. [Google Scholar] [CrossRef]
- Xie, Y.; Zhao, H.; Pawlak, K.; Gao, Y. The development of organic agriculture in China and the factors affecting organic farming. Journal of Agribusiness and Rural Development, 2016; 1644-2016-135466. [Google Scholar] [CrossRef]
- Kujala, S.; Hakala, O.; Viitaharju, L. Factors affecting the regional distribution of organic farming. Journal of Rural Studies 2022, 92, 226–236. [Google Scholar] [CrossRef]
- Heinrichs, J.; Kuhn, T.; Pahmeyer, C.; Britz, W. Economic effects of plot sizes and farm-plot distances in organic and conventional farming systems: A farm-level analysis for Germany. Agricultural Systems 2021, 187, 102992. [Google Scholar] [CrossRef]
- Lu, C.F.; Cheng, C.Y. Exploring the distribution of organic farming: Findings from certified rice in Taiwan. Ecological Economics 2023, 212, 107915. [Google Scholar] [CrossRef]
- Zieliński, M.; Wrzaszcz, W.; Sobierajewska, J.; Adamski, M. Development and Effects of Organic Farms in Poland, Taking into Account Their Location in Areas Facing Natural or Other Specific Constraints. Agriculture 2024, 14, 297. [Google Scholar] [CrossRef]
- Genius, M.; Pantzios, C.J.; Tzouvelekas, V. Information acquisition and adoption of organic farming practices. Journal of Agricultural and Resource Economics 2006, 93–113. [Google Scholar]
- Kafle, B. Factors affecting adoption of organic vegetable farming in Chitwan District, Nepal. World Journal of Agricultural Sciences 2011, 7, 604–606. [Google Scholar]
- Koesling, M.; Flaten, O.; Lien, G. Factors influencing the conversion to organic farming in Norway. International Journal of Agricultural Resources, Governance and Ecology, 2008; 7, 78–95. [Google Scholar] [CrossRef]
- Xia, M.; Xiang, P.; Mei, G.; Liu, Z. Drivers for the Adoption of Organic Farming: Evidence from an Analysis of Chinese Farmers. Agriculture 2023, 13, 2268. [Google Scholar] [CrossRef]
- Bartulović, A.; Kozorog, M. Taking up organic farming in (pre-) Alpine Slovenia: Contrasting motivations of dairy farmers from less-favoured agricultural areas. Anthropological Notebooks 2014, 20. [Google Scholar]
- Wollni, M.; Andersson, C. Spatial patterns of organic agriculture adoption: Evidence from Honduras. Ecological Economics 2014, 97, 120–128. [Google Scholar] [CrossRef]
- Läpple, D. Adoption and abandonment of organic farming: an empirical investigation of the Irish drystock sector. Journal of Agricultural Economics 2010, 61, 697–714. [Google Scholar] [CrossRef]
- Läpple, D.; van Rensburg, T. Adoption of organic farming: Are there differences between early and late adoption? Ecological Economics 2011, 70, 1406–1414. [Google Scholar] [CrossRef]
- Wiśniewski, Ł.; Biczkowski, M.; Rudnicki, R. Natural potential versus rationality of allocation of Common Agriculture Policy funds dedicated for supporting organic farming development–Assessment of spatial suitability: The case of Poland. Ecological Indicators 2021, 130, 108039. [Google Scholar] [CrossRef]
- Hoque, M.N.; Saha, S.M.; Imran, S.; Hannan, A.; Seen, M.M.H.; Thamid, S.S.; Tuz-zohra, F. Farmers' agrochemicals usage and willingness to adopt organic inputs: Watermelon farming in Bangladesh. Environmental Challenges 2022, 7, 100451. [Google Scholar] [CrossRef]
- Li, H.; Yang, S.; Yan, J.; Gao, W.; Cui, J.; Chen, Y. From Conventional to Organic Agriculture: Influencing Factors and Reasons for Tea Farmers’ Adoption of Organic Farming in Pu’er City. Sustainability 2024, 16, 10035. [Google Scholar] [CrossRef]
- Heinze, S.; Vogel, A. Reversion from organic to conventional agriculture in Germany: An event history analysis. German Journal of Agricultural Economics 2017, 66, 13–25. [Google Scholar] [CrossRef]
- Sriwichailamphan, T.; Sucharidtham, T. Factors affecting adoption of vegetable growing using organic system: A case study of Royal Project Foundation, Thailand. International Journal of Economics and Management Sciences 2014, 3. [Google Scholar] [CrossRef]
- Pornpratansombat, P.; Bauer, B.; Boland, H. The adoption of organic rice farming in Northeastern Thailand. Journal of Organic Systems 2011, 6, 4–12. [Google Scholar]
- Mrinila, S.; Keshav, L.M.; Bijan, M. Factors impacting adoption of organic farming in Chitwan district of Nepal. Asian Journal of Agriculture and Rural Development 2015, 5, 1–12. [Google Scholar] [CrossRef]
- Verburg, R.W.; Verberne, E.; Negro, S.O. Accelerating the transition towards sustainable agriculture: The case of organic dairy farming in the Netherlands. Agricultural Systems 2022, 198, 103368. [Google Scholar] [CrossRef]
- Ambrosius, F.H.; Kramer, M.R.; Spiegel, A.; Bokkers, E.A.; Bock, B.B.; Hofstede, G.J. Diffusion of organic farming among Dutch pig farmers: An agent-based model. Agricultural Systems 2022, 197, 103336. [Google Scholar] [CrossRef]
- Ferreira, S.; Oliveira, F.; Gomes da Silva, F.; Teixeira, M.; Gonçalves, M.; Eugénio, R.; Gonçalves, J. M. Assessment of factors constraining organic farming expansion in Lis Valley, Portugal. AgriEngineering 2020, 2, 111–127. [Google Scholar] [CrossRef]
- Serra, T.; Zilberman, D.; Gil, J.M. Differential uncertainties and risk attitudes between conventional and organic producers: the case of Spanish arable crop farmers. Agricultural Economics 2008, 39, 219–229. [Google Scholar] [CrossRef]
- Palšová, L. Organic farming versus interest of the state for its support. Polish Journal of Environmental Studies 2019, 28, 2773. [Google Scholar] [CrossRef]
- Rozman, Č.; Pažek, K.; Kljajić, M.; Bavec, M.; Turk, J.; Bavec, F.; Škraba, A. The dynamic simulation of organic farming development scenarios–A case study in Slovenia. Computers and electronics in agriculture 2013, 96, 163–172. [Google Scholar] [CrossRef]
- Łuczka, W.; Kalinowski, S. Barriers to the development of organic farming: A Polish Case Study. Agriculture 2020, 10, 536. [Google Scholar] [CrossRef]
- Siepmann, L.; Nicholas, K.A. German winegrowers’ motives and barriers to convert to organic farming. Sustainability 2018, 10, 4215. [Google Scholar] [CrossRef]
- Yanakittkul, P.; Aungvaravong, C. A model of farmers intentions towards organic farming: A case study on rice farming in Thailand. Heliyon 2020, 6. [Google Scholar] [CrossRef] [PubMed]
- Kerselaers, E.; De Cock, L.; Lauwers, L.; Van Huylenbroeck, G. Modelling farm-level economic potential for conversion to organic farming. Agricultural Systems 2007, 94, 671–682. [Google Scholar] [CrossRef]
- Thoyer, S.; Préget, R. Enriching the CAP evaluation toolbox with experimental approaches: introduction to the special issue. European Review of Agricultural Economics 2019, 46, 347–366. [Google Scholar] [CrossRef]
- Vanslembrouck, I.; Van Huylenbroeck, G.; Verbeke, W. Determinants of the Willingness of Belgian Farmers to Participate in Agri-environmental Measures. Journal of Agricultural Economics 2002, 53, 489–511. [Google Scholar] [CrossRef]
- Lampe, I.; Würtenberger, D. Loss aversion and the demand for index insurance. Journal of Economic Behavior & Organization 2019, 180, 678–693. [Google Scholar] [CrossRef]
- Lastra-Bravo, X.B.; Hubbard, C.; Garrod, G.; Tolón-Becerra, A. What drives farmers' participation in EU agri-environmental schemes?: Results from a qualitative meta-analysis. Environmental Science & Policy 2015, 54, 1–9. [Google Scholar] [CrossRef]
- Defrancesco, E.; Gatto, P.; Runge, F.; Trestini, S. Factors Affecting Farmers' Participation in Agri-environmental Measures: a Northern Italian Perspective. Journal of Agricultural Economics 2008, 59, 114–131. [Google Scholar] [CrossRef]
- Espinosa-Goded, M.; Barreiro-Hurlé, J.; Ruto, E. What do farmers want from Agri-Environmental Scheme Design? a choice experiment approach. Journal of Agricultural Economics 2010, 61, 259–273. [Google Scholar] [CrossRef]
- Behaghel, L.; Macours, K.; Subervie, J. How can randomised controlled trials help improve the design of the common agricultural policy? European Review of Agricultural Economics 2019, 46, 473–493. [Google Scholar] [CrossRef]
- Dessart, F. J.; Barreiro-Hurlé, J.; Van Bavel, R. Behavioural factors affecting the adoption of sustainable farming practices: a policy-oriented review. European Review of Agricultural Economics 2019, 46, 417–471. [Google Scholar] [CrossRef]
- Ocean, N.; Howley, P. Using Choice Framing to Improve the Design of Agricultural Subsidy Schemes. Land Economics 2021, 97, 933–950. [Google Scholar] [CrossRef]
- Tversky, A.; Kahneman, D. , Loss Aversion in Riskless Choice: A Reference-Dependent Model. The Quarterly Journal of Economics 1991, 106, 1039–1061. [Google Scholar] [CrossRef]
- Thaler, R. Mental accounting and consumer choice. Marketing Science 1985, 4, 199–214. [Google Scholar] [CrossRef]
- Wilkinson, N.; Klaes, M. An Introduction to Behavioral Economics. (3rd ed.) Palgrave Macmillan 2017.
- Eurostat 2020. Organic farming statistics. Statistics explained. Available online: https://ec.europa.eu/eurostat/statistics-explained/index.php?title=Organic_farming_statistics (accessed on 25 June 2024).
- Ekoagros. (2022). Veiklosataskaitos. Available online: https://www.ekoagros.lt/veiklos-ataskaitos-2 (accessed on 11 January 2025).
- Główna Inspekcja Jakości Handlowej Artykułów Rolno-Spożywczych. Raport o stanie rolnictwa ekologicznego w Polsce w latach 2019-2020. Warszawa, Poland 2021.
- Główny Urząd Statystyczny. (2022). Roczniki Statystyczne. Available online: https://stat.gov.pl/obszary-tematyczne/roczniki-statystyczne/roczniki-statystyczne/ (accessed on 5 January 2025).
- Uematsu, H.; Mishra, K.A. Organic farmers or conventional farmers: Where's the money? Ecological Economics 2012, 37. [Google Scholar] [CrossRef]
- Ligon, E. Supply and effects of specialty crop insurance. NBER Working Paper 2011, 16709. [Google Scholar]
- Belasco, E.; Galinato, S.; Marsh, T.; Miles, C.; Wallace, R. High tunnels are my crop insurance: An assessment of risk management tools for small-scale specialty crop producers. Agricultural and Resource Economics Review 2013, 42. [Google Scholar] [CrossRef]
- Singerman, A. , Hart, E. C., & Lence, S. H. (2012). Revenue protection for organic producers: Too much or too little? Journal of Agricultural and Resource Economics, 37. [CrossRef]
- Goodwin, B.; Smith, V. What harm is done by subsidizing crop insurance. American Journal of Agricultural Economics 2013, 95. [Google Scholar] [CrossRef]
- Belasco, E.; Schahczenski, J. Is organic farming risky? An evaluation of WFRP in organic and conventional production systems. Agricultural and Resource Economics Review 2021, 50. [Google Scholar] [CrossRef]
Figure 1.
Methodological approach for evaluating factors influencing the adoption of organic farming in Lithuania and Poland.
Figure 1.
Methodological approach for evaluating factors influencing the adoption of organic farming in Lithuania and Poland.
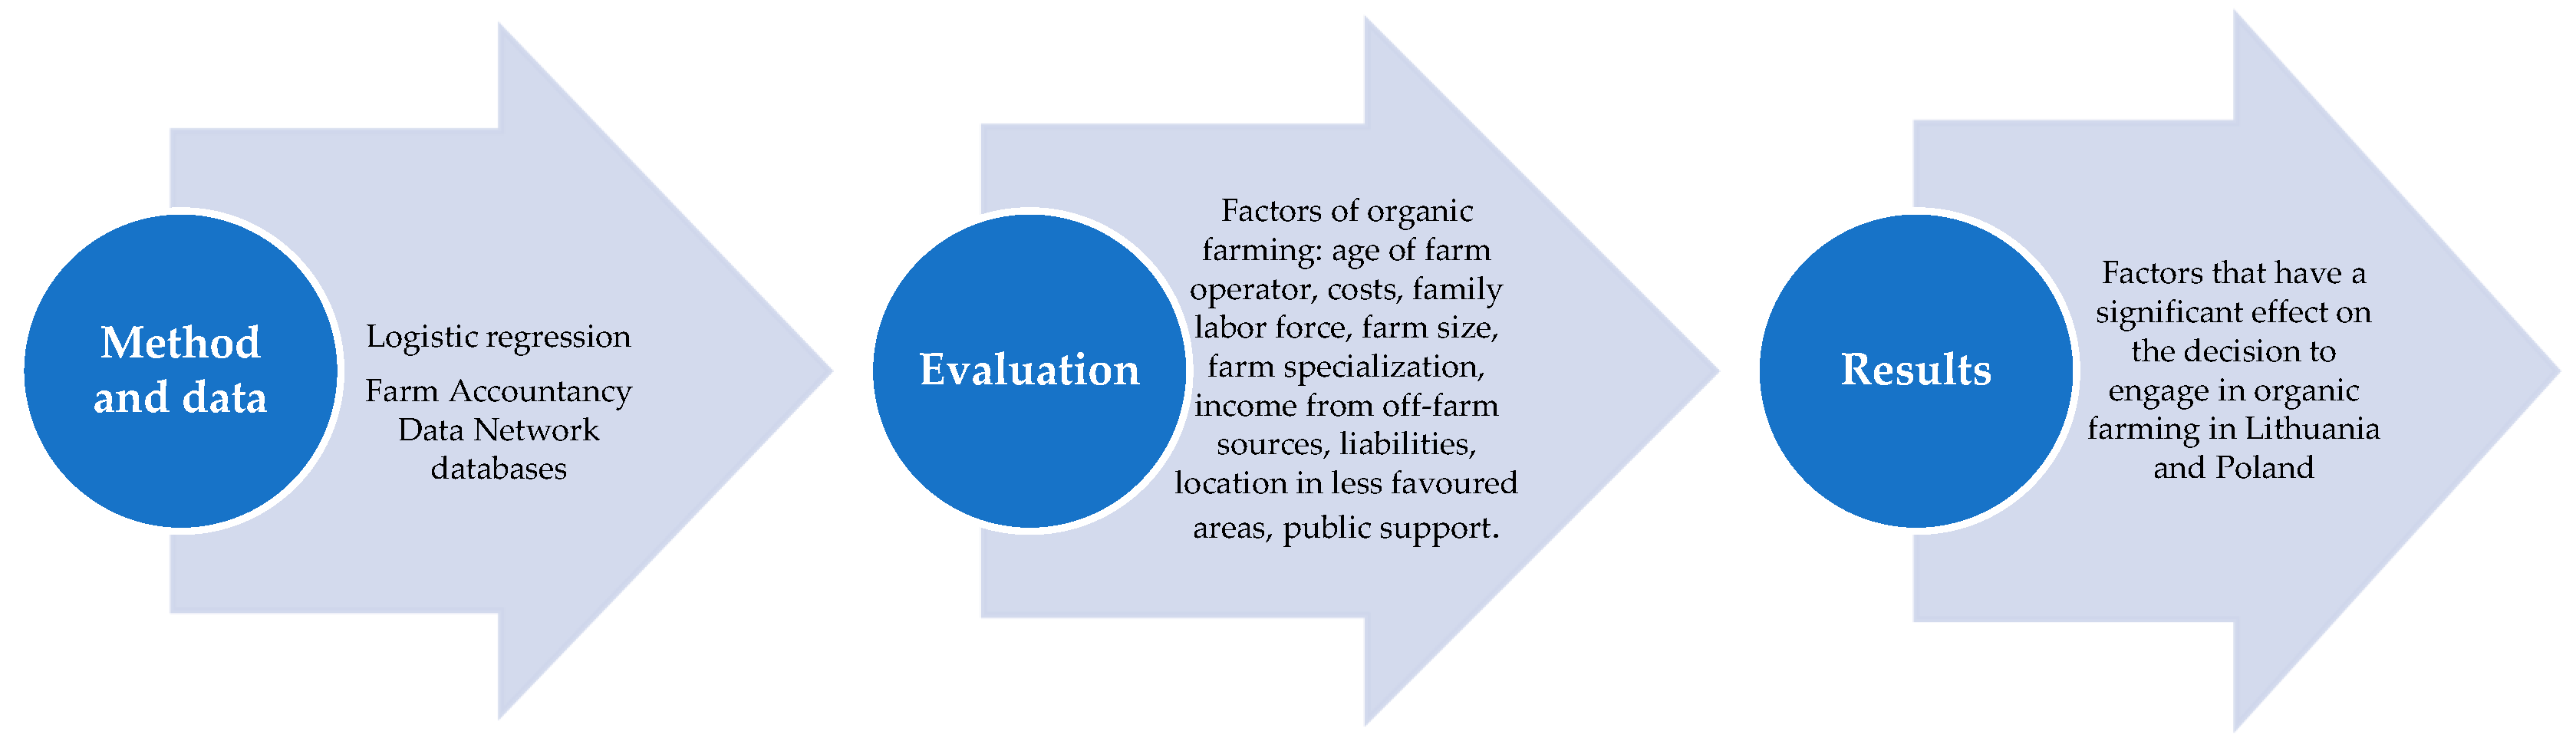
Figure 2.
Share of area under organic farming in total UAA in the EU countries in 2018 (%). Source: [68].
Figure 2.
Share of area under organic farming in total UAA in the EU countries in 2018 (%). Source: [68].
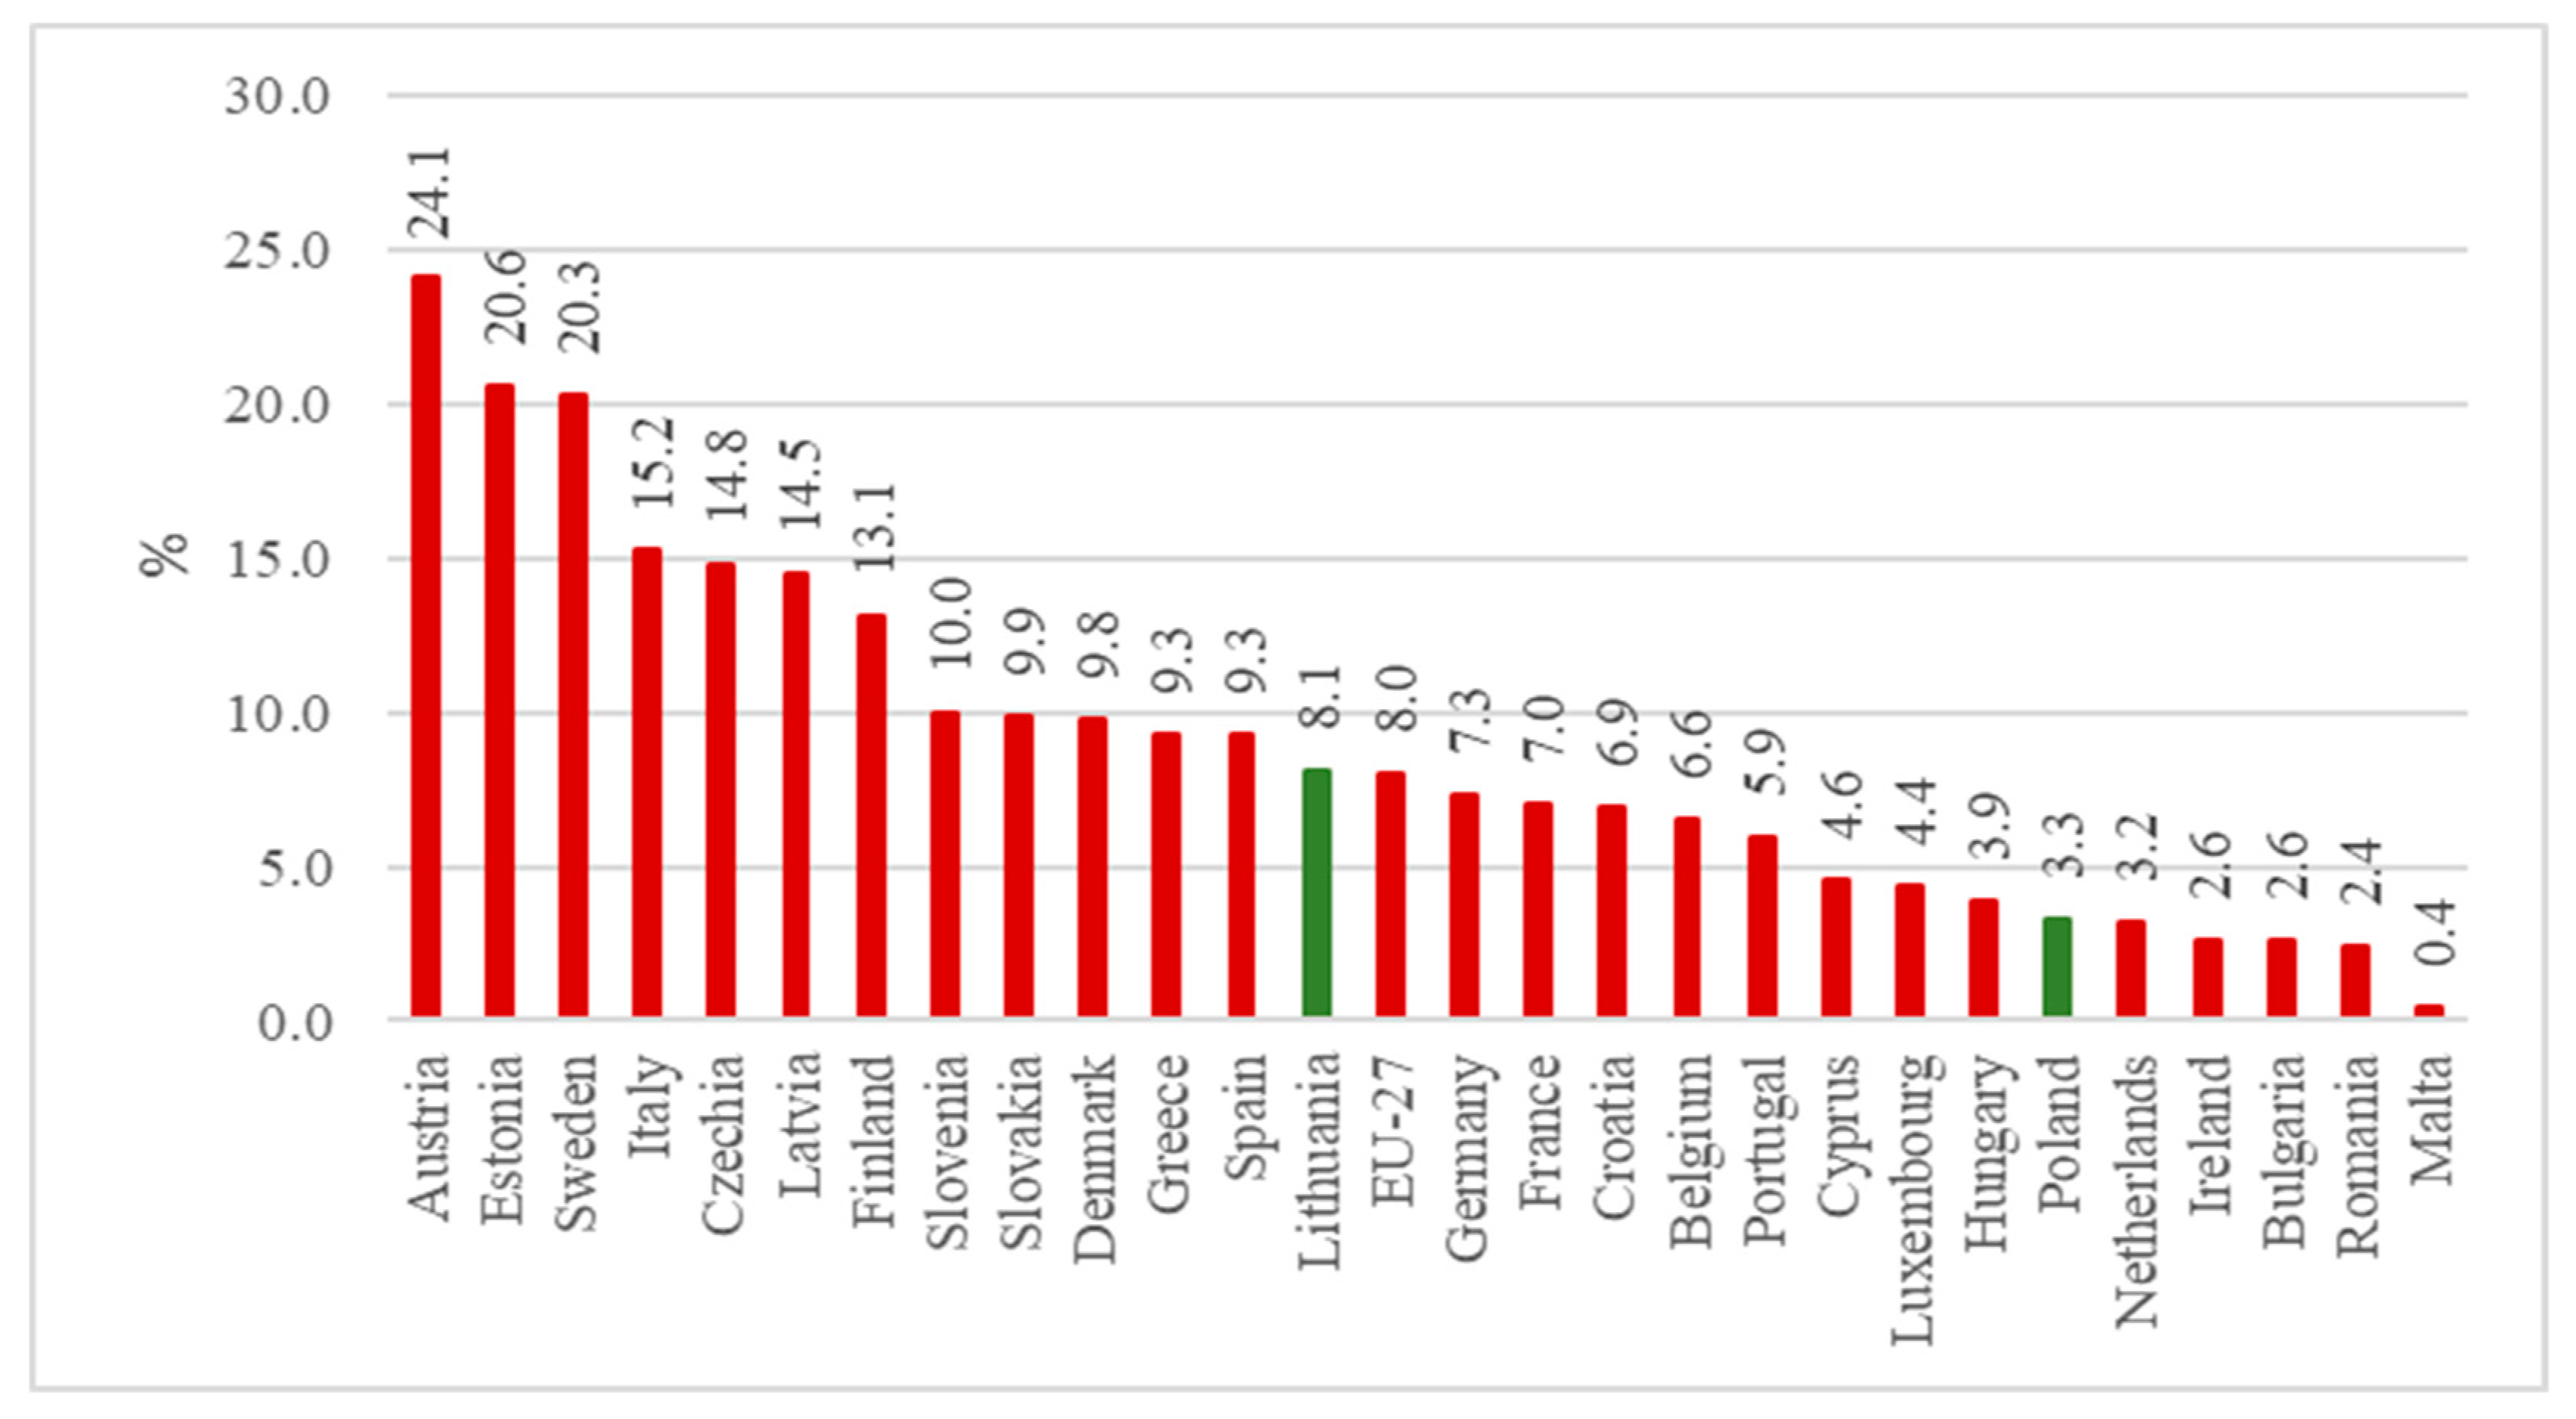

Table 1.
Selected characteristics of Lithuanian organic and conventional farms.
| Variable | 2009 | 2019 | Change 2019 compared to 2009 (%) | |||
|---|---|---|---|---|---|---|
| Organic farms | Conventional farms | Organic farms | Conventional farms | Organic farms | Conventional farms | |
| Age of farm operator (years) | 44 | 45 | 48 | 48 | 9.1 | 6.7 |
| Total costs per 1 ha of UAA (EUR) | 448 | 654 | 632 | 951 | 41.1 | 45.4 |
| Family labor force (FWU) | 1.4 | 1.6 | 1.3 | 1.3 | -7.1 | -18.7 |
| Total utilized agricultural area (hectares) | 113 | 137 | 105 | 166 | -7.1 | 21.2 |
| Share of crop output in total output (%) | 74 | 68 | 61 | 69 | -17.6 | 1.5 |
| Income, per 1 ha of UAA (EUR) | 294 | 601 | 405 | 836 | 37.8 | 39.1 |
| Total liabilities per 1 ha of UAA (EUR) | 218 | 326 | 462 | 607 | 2.1 * | 86.2 |
| Total subsidies (excluding on investment) per 1 ha of UAA (EUR) | 359 | 163 | 361 | 223 | 0.6 | 36.8 |
*Times; Source: own elaborations on FADN data.
Table 2.
Selected characteristics of Polish organic and conventional farms.
| Variable | 2009 | 2019 | Change 2019 compared to 2009 (%) | |||
|---|---|---|---|---|---|---|
| Organic farms | Conventional farms | Organic farms | Conventional farms | Organic farms | Conventional farms | |
| Age of farm operator (years) | 45.1 | 43.8 | 47.4 | 45.2 | 5.1 | 3.2 |
| Total costs per 1 ha of UAA (EUR) | 3199 | 12636 | 3722 | 7868 | 16.3 | -37.7 |
| Family labor force (FWU) | 1.6 | 1.7 | 1.4 | 1.6 | -12.5 | -5.9 |
| Total utilized agricultural area (hectares) | 34 | 35 | 29 | 34 | -14.7 | -2.9 |
| Share of crop output in total output (%) | 49 | 50 | 60 | 59 | 22.4 | 18.0 |
| Income, per 1 ha of UAA (EUR) | 1811 | 4236 | 2594 | 3719 | 43.2 | -12.2 |
| Total liabilities per 1 ha of UAA (EUR) | 1481 | 6352 | 1532 | 2736 | 3.4 | -56.9 |
| Total subsidies (excluding on investment) per 1 ha of UAA (EUR) | 1782 | 1180 | 2155 | 1535 | 20.9 | 30.1 |
Source: own elaborations on FADN data.
Table 3.
Factors influencing the adoption of organic farming in Lithuania.
|
Variable |
Years | ||||||||||
|---|---|---|---|---|---|---|---|---|---|---|---|
| 2009 | 2010 | 2011 | 2012 | 2013 | 2014 | 2015 | 2016 | 2017 | 2018 | 2019 | |
| Age of farm operator | -0.017 (0.012) | -0.039 (0.013)*** | -0.015 (0.011) | -0.015 (0.012) | -0.004 (0.012) | -0.012 (0.012) | 0.022 (0.009)** |
0.007 (0.011) | 0.022 (0.010)** | 0.027 (0.010)*** | 0.014 (0.009) |
| Total costs | -0.006 (0.001)*** | -0.005 (0.001)*** | -0.004 (0.001)*** | -0.002 (0.001)*** | -0.006 (0.001)*** | -0.006 (0.001)*** | -0.005 (0.001)*** |
-0.005 (0.001)*** | -0.004 (0.000)*** | -0.003 (0.000)*** | -0.003 (0.000)*** |
| Family labor force | -0.268 (0.246) | -0.009 (0.254) | 0.122 (0.253) | -0.300 (0.300) | 0.147 (0.285) | -0.065 (0.292) | -0.035 (0.226) | -0.509 (0.290)* | -0.640 (0.299)** | -0.601 (0.275)** | -0.519 (0.261)** |
| Total utilized agricultural area | 0.002 (0.001)* | 0.002 (0.001)*** | 0.001 (0.001)* | 0.001 (0.001)* | 0.003 (0.001)*** | 0.003 (0.001)*** | 0.002 (0.001)*** | 0.003 (0.001)*** | 0.002 (0.001)*** | 0.001 (0.001)* | 0.001 (0.001) |
| Share of crop output in total output | 0.002 (0.003) | 0.000 (0.005) | 0.008 (0.006) | 0.017 (0.006)*** | 0.011 (0.006)* | 0.036 (0.007)*** | 0.018 (0.005)*** | 0.018 (0.006)*** | 0.001 (0.005) | 0.001 (0.004) | -0.002 (0.003) |
| Income from off-farm sources | 0.268 (0.325) | 0.356 (0.323) | 0.178 (0.279) | 0.246 (0.301) | 0.227 (0.314) | 0.399 (0.333) | 1.013 (0.274)*** | 1.295 (0.320)*** | 1.227 (0.289)*** | 0.653 (0.278)** | 0.916 (0.252)*** |
| Total liabilities | 0.001 (0.000)* | 0.000 (0.000) | 0.000 (0.000) | -0.000 (0.000) | 0.001 (0.000)* | 0.000 (0.000) | 0.000 (0.000) | 0.000 (0.000) | 0.000 (0.000) | 0.000 (0.000) | 0.000 (0.000)*** |
| Location in agriculturally less favoured areas | 0.034 (0.277) | -1.777 (0.357)*** | -0.776 (0.308)*** | -0.317 (0.316) | -1.304 (0.354)*** | -1.593 (0.371)*** | -0.498 (0.262)* | -0.676 (0.297)** | -0.489 (0.293)* | -0.687 (0.252)*** | -0.677 (0.235)*** |
| Total subsidies (excluding on investment) | 0.027 (0.002)*** | 0.037 (0.003)*** | 0.029 (0.002)*** | 0.034 (0.002)*** | 0.037 (0.003)*** | 0.045 (0.003)*** | 0.026 (0.002)*** | 0.026 (0.002)*** | 0.023 (0.002)*** | 0.021 (0.002)*** | 0.017 (0.001)*** |
Note: cells contain binary logistic regression coefficients with standard errors in parentheses (*** p< 0.01; ** p< 0.05; * p< 0.1). Source: own elaborations on FADN data.
Table 4.
Factors influencing the adoption of organic farming in Poland.
|
Variable |
Years | ||||||||||
|---|---|---|---|---|---|---|---|---|---|---|---|
| 2009 | 2010 | 2011 | 2012 | 2013 | 2014 | 2015 | 2016 | 2017 | 2018 | 2019 | |
| Age of farm operator | 0.020 (0.002)*** | 0.010 (0.109) | 0.016 (0.006)*** | 0.016 (0.003)*** | 0.017 (0.001)*** | 0.017 (0.001)*** | 0.028 (0.000)*** | 0.032 (0.000)*** | 0.022 (0.000)*** | 0.024 (0.000)*** | 0.027 (0.000)*** |
| Total costs | -0.000 (0.000)*** | -0.000 (0.000)*** | -0.000 (0.000)*** | -0.000 (0.000)*** | -0.000 (0.000)*** | -0.000 (0.000)*** | -0.000 (0.000)*** | -0.000 (0.000)*** | -0.000 (0.000)*** | -0.000 (0.000)*** | -0.000 (0.000)*** |
| Family labor force | -0.491 (0.000)*** | -0.500 (0.000)*** | -0.585 (0.000)*** | -0.571 (0.000)*** | -0.442 (0.000)*** | -0.441 (0.000)*** | -0.380 (0.001)*** | -0.235 (0.035)** | -0.128 (0.223) | -0.161 (0.115) | -0.204 (0.051)* |
| Total utilized agricultural area | -0.001 (0.247) | -0.002 (0.176) | -0.002 (0.202) | -0.001 (0.648) | -0.002 (0.166) | -0.001 (0.303) | -0.005 (0.021)** | -0.008 (0.001)*** | -0.005 (0.013)** | -0.006 (0.003)*** | -0.004 (0.037)** |
| Share of crop output in total output | -0.763 (0.001)*** | -0.651 (0.004)*** | -0.601 (0.006)*** | -0.417 (0.039)** | -0.535 (0.002)*** | -0.249 (0.186) | 0.079 (0.683) | 0.109 (0.573) | -0.012 (0.950) | -0.384 (0.021)** | -0.445 (0.010)** |
| Income from off-farm sources | 0.122 (0.527) | -0.017 (0.925) | -0.134 (0.503) | 0.086 (0.621) | 0.294 (0.045)** | 0.237 (0.134) | 0.230 (0.172) | 0.113 (0.448) | 0.067 (0.658) | -0.120 (0.443) | 0.139 (0.312) |
| Total liabilities | 0.000 (0.009)*** | 0.000 (0.000)*** | 0.000 (0.761) | 0.000 (0.247) | 0.000 (0.135) | 0.000 (0.804) | 0.000 (0.662) | 0.000 (0.199) | 0.000 (0.697) | 0.000 (0.161) | 0.000 (0.001)*** |
| Location in agriculturally less favoured areas | 0.659 (0.000)*** | 0.917 (0.000)*** | 0.949 (0.000)*** | 0.933 (0.000)*** | 0.967 (0.000)*** | 1.117 (0.000)*** | 1.003 (0.000) *** | 1.108 (0.000)*** | 1.013 (0.000)*** | 1.017 (0.000)*** | 0.444 (0.204) |
| Total subsidies (excluding on investment) | 0.001 (0.000)*** | 0.001 (0.000)*** | 0.001 (0.000)*** | 0.000 (0.000)*** | 0.001 (0.000)*** | 0.000 (0.000)*** | 0.000 (0.000)*** | 0.001 (0.000)*** | 0.000 (0.000)*** | 0.000 (0.000)*** | 0.001 (0.000)*** |
Note: cells contain binary logistic regression coefficients with standard errors in parentheses(*** p< 0.01; ** p< 0.05; * p< 0.1). Source: own elaborations on FADN data.
Disclaimer/Publisher’s Note: The statements, opinions and data contained in all publications are solely those of the individual author(s) and contributor(s) and not of MDPI and/or the editor(s). MDPI and/or the editor(s) disclaim responsibility for any injury to people or property resulting from any ideas, methods, instructions or products referred to in the content. |
© 2025 by the authors. Licensee MDPI, Basel, Switzerland. This article is an open access article distributed under the terms and conditions of the Creative Commons Attribution (CC BY) license (http://creativecommons.org/licenses/by/4.0/).
Copyright: This open access article is published under a Creative Commons CC BY 4.0 license, which permit the free download, distribution, and reuse, provided that the author and preprint are cited in any reuse.


