
Submitted:
25 June 2025
Posted:
26 June 2025
You are already at the latest version
Abstract
Steel reinforcement corrosion is a predominant cause of deterioration in reinforced concrete structures, significantly impacting their service life and structural integrity. This review focuses specifically on the various methods used to evaluate the corrosion of steel rebars. It categorizes the techniques into electrochemical, physical, and advanced non-destructive approaches, emphasizing their principles, advantages, limitations, and field applicability. This paper aims to provide a comparative overview that assists in selecting appropriate evaluation strategies for different structural conditions.
Keywords:
steel reinforcement
; corrosion evaluation
; non-destructive
1. Introduction
Steel reinforcement, commonly referred to as rebar, plays a vital role in cement-based structures by providing tensile strength and enhancing the overall structural integrity of concrete [1,2,3]. Concrete alone is strong in compression but weak in tension; embedding steel reinforcement compensates for this weakness, allowing for the construction of durable bridges, buildings, and other infrastructure.
However, one of the most serious durability issues affecting reinforced concrete structures is the corrosion of the embedded steel reinforcement [4,5,6]. Corrosion compromises the bond between steel and concrete, reduces the cross-sectional area of the rebar, and leads to cracking, spalling, and ultimately structural failure. As such, corrosion is not only a maintenance concern but also a significant safety risk.
Figure 1 shows the corrosion mechanism of steel rebar [7,8,9]. The corrosion of steel in concrete typically begins when the protective passive film on the steel surface is disrupted. This film is maintained by the highly alkaline environment of the surrounding concrete. Two primary mechanisms are responsible for the breakdown of this protective layer:
Carbonation: Carbon dioxide from the atmosphere penetrates the concrete and reacts with calcium hydroxide to form calcium carbonate. This reaction lowers the pH of the concrete, reducing the protective environment and making the steel vulnerable to corrosion.
Chloride Ingress: Chloride ions, often from de-icing salts or marine environments, penetrate the concrete and accumulate at the steel surface. When the chloride concentration exceeds a critical threshold, it breaks down the passive film, initiating localized pitting corrosion.
Once initiated, corrosion progresses through electrochemical reactions in which iron is oxidized, forming rust. The corrosion products occupy a greater volume than the original steel, generating internal pressures that crack and delaminate the surrounding concrete. This deterioration accelerates the ingress of harmful substances, creating a self-reinforcing cycle of damage.
Figure 2 illustrates the corrosion progression of steel rebar within a concrete structure over its in-service life span, segmented into distinct phases: incubation period, progress period, acceleration period, and deterioration period.
In the initial stage of the incubation period, the concrete and embedded steel remain in good condition. The internal environment of the concrete is highly alkaline, forming a passive protective film on the steel surface that prevents corrosion. In the progress period, external agents such as chloride ions and carbon dioxide begin to penetrate the concrete. These agents reduce the pH and break down the passive film on the steel surface. Corrosion starts when the protective film is damaged. Though corrosion of steel rebar has initiated, there are usually no visible signs on the surface of the concrete structure. This is the ideal time for corrosion evaluation. With the corrosion progress, the expansion of corrosion products (rust) causes internal pressure, leading to cracking of the surrounding concrete, and cracks appear on the surface of the concrete structure. Water and air can penetrate easily through the concrete to the steel rebar, which accelerates the corrosion of the steel rebar. In the deterioration period, cracks propagate, spalling occurs, and corrosion spreads more rapidly. The steel cross-section is reduced, compromising load-bearing capacity. The cost of repair increases, and safety risks rise. If left untreated, the structure may become unsafe or fail prematurely.
Early detection through electrochemical and non-destructive techniques can provide critical data for maintenance planning. Corrosion evaluation is most effective during the progress stage, before visible damage occurs. Early detection and preventive maintenance can increase the service life and safety of concrete infrastructure. The life span of a concrete structure is directly tied to how early corrosion is detected and addressed. By performing systematic corrosion evaluation, it is possible to intervene before structural damage escalates, ensuring durability, safety, and cost efficiency over the structure’s service life. This review specifically examines the different techniques used to assess steel rebar corrosion, highlighting their underlying principles, practical benefits, potential limitations, and suitability for field applications.
2. Steel Rebar Corrosion Evaluation and Methods
Numerous techniques have been developed to detect the corrosion of steel rebar in concrete. Commonly used methods include electrochemical techniques, ultrasonic methods, X-ray tomography, infrared thermography method, ground penetration radar method, magnetic flux leakage method, and eddy current testing. This paper focuses on summarizing these non-destructive evaluation approaches, while methods involving embedded sensors within the concrete will not be covered.
2.1. Electrochemical Techniques
Electrochemical techniques are widely used for assessing the corrosion behavior of steel rebar in concrete due to their sensitivity, quantitative capabilities, and suitability for both laboratory and field applications. These methods are based on the electrochemical nature of corrosion and provide valuable information about the corrosion potential, rate, and mechanisms. The most common electrochemical techniques include: half-cell potential measurement, linear polarization resistance (LPR), and electrochemical impedance spectroscopy (EIS).
2.1.1. Half-Cell Potential Measurement
Half-Cell Potential (HCP) measurement is also called Open Circuit Potential (OCP) measurement, which is a widely used non-destructive technique to assess the corrosion activity of steel reinforcement in concrete structures [10,11,12]. Figure 3 shows the schematic diagram. It measures the electrical potential difference between the embedded steel and a standard reference electrode placed on the concrete surface. The technique is based on electrochemical principles. When steel corrodes in concrete, electrochemical cells are formed, creating anodic (corroding) and cathodic (non-corroding) regions.
A saturated calomel electrode (SCE), copper/copper sulfate electrode (CSE), or silver/ silver chloride electrode is usually used as the standard reference electrode. As per ASTM C 876 [13] standards, the probability of reinforcement corrosion is as follows in Table 1.
The HCP measurement does not directly measure the corrosion rate but indicates the likelihood of corrosion activity.
2.1.2. Linear Polarization Resistance
The Linear Polarization Resistance (LPR) method is used to measure the corrosion rate of metal in an electrolyte [14,15,16]. Figure 4 shows the schematic diagram of LPR method.
If we apply a small potential perturbation (typically ±10–20 mV) to the metal’s open-circuit potential (Ecorr), the electrochemical reaction at the metal surface will respond by developing a small current. Within this small polarization range, the current (ΔI) is directly proportional to the applied potential (ΔE). This linear relation obeys Ohm’s law:
Here Rp is the polarization resistance. Then, the corrosion current icorr can be calculated by the Stern-Geary equation:
The constant B (Stern-Geary constant) typically falls within 13–52 mV for steel in concrete, depending on conditions. Once icorr is known, we can compute the corrosion rate (v) in millimeters per year by applying Faradays’ law:
k is a conversion constant that depends on: the atomic weight of iron, the valence of the metal dissolution reaction (typically 2 for iron), the density of steel, and the Faradays’ constant.
The LPR method is a powerful tool to quickly and non-destructively assess the corrosion rate of steel rebars in concrete structures. In order to overcome the problem of confining the current to a predetermined area, the use of a second auxiliary guard ring electrode surrounding the inner auxiliary electrode has been developed [17]. Table 2 shows the relationship between the condition of steel rebar and the corrosion current [18].
2.1.3. Electrochemical Impedance Spectroscopy
Electrochemical impedance spectroscopy (EIS) is a powerful, non-destructive electrochemical method used to investigate the corrosion mechanisms and kinetics of metal in an electrolyte [19,20,21]. Instead of applying a small DC polarization (like in LPR), EIS involves applying a small alternating voltage (AC) of low amplitude (typically 5–10 mV) to the rebar's surface and measuring the resulting AC current. The frequency is varied over a wide range (e.g., 0.01 Hz to 100 kHz) to probe different electrochemical processes. The system's impedance (Z) is measured as a complex quantity (real Z’ and imaginary Z” components). The response depends on the electrochemical processes at the rebar-concrete interface (e.g., charge transfer, diffusion, oxide film behavior).
Electrochemical impedance spectroscopy (EIS) has been applied to investigate the corrosion of steel rebars within concrete structures. Dawson et al. [22] performed impedance measurements on mild steel rebars embedded in concrete using two-electrode or three-electrode configurations and subsequently interpreted these spectra with the Randles equivalent circuit. Multiple equivalent circuits have been put forward to describe the dissolution process of steel rebars in concrete or mortar, based on impedance spectra collected with two or three-electrode setups [23,24,25]. Although these EIS methods have successfully been used for decades to assess rebar corrosion in concrete, they typically require a physical connection to the steel, which can be cumbersome.
To avoid having to connect directly to the steel rebar, some researchers have investigated an indirect approach employing a four-electrode or two-electrode configuration [26,27], shown in Figure 5.
Electrochemical methods are powerful for real-time, non-destructive, and quantitative evaluation of rebar corrosion, enabling the assessment of the corrosion rate of steel rebar. However, the electrode placements are needed, corrosion level cannot be evaluated, and environmental conditions, surface properties, and the configuration of the measurement setup can influence their accuracy and interpretability.
2.2. Ultrasonic Method
Ultrasonic testing is a powerful non-destructive method for evaluating the condition of steel rebars in reinforced concrete structures. Figure 6 shows the approach of ultrasonic testing. It operates by sending high-frequency stress waves into the material and analyzing their propagation, reflection, and attenuation to assess internal conditions.
As ultrasound propagates through the concrete and reaches the steel, it reflects toward the transducer, allowing for measurement of travel time and reflection amplitude. A reduction in cross-sectional area due to corrosion, the presence of voids, or poor bond conditions can affect these signals, making it possible to identify and quantify damage without physically removing material. Ultrasonic testing is frequently used on-site because it is lightweight, portable, and can provide localized information about a small area of a structure.
The pulse velocity (UPV) method has been broadly applied to assess the condition of concrete structures. This approach, which involves measuring the speed of acoustic waves traveling through the material, is sensitive to the bond between steel and concrete and to the presence of cracks [28]. However, UPV measurements are less effective at detecting distributed micro-cracks that form during the initial phases of steel corrosion in concrete [29].
The impact echo (IE) method, which relies on striking the surface mechanically and then recording the signals captured by nearby sensors, has been used less frequently to identify damage stemming from corrosion of embedded steel [30]. Some researchers have pointed out that the reliability of IE decreases as the thickness of the concrete increases [31].
Nonlinear ultrasonic (NLU) techniques have demonstrated potential for evaluating material deterioration [32,33]. Specifically, these methods are well-suited to detecting early-stage cracking [34]. NLU is based on the principle that the interaction of ultrasound with a flawed material produces higher-frequency components in the acoustic signals [35].
Nevertheless, factors such as surface roughness, material heterogeneity, and moisture content can influence the signals and sometimes make their interpretation challenging. Nevertheless, when applied by skilled inspectors, ultrasonic testing is a valuable tool for condition assessment and maintenance planning of reinforced concrete structures.
2.3. X-Ray Tomography Method
X-ray tomography, particularly X-ray Computed Tomography (X-CT), has become a powerful non-destructive tool for evaluating the internal condition of steel rebars in reinforced concrete structures [36,37,38,39,40]. It utilizes X-rays to generate a series of radiographic images from different angles. These two-dimensional projections are then computationally reconstructed into a high-resolution, three-dimensional view of the material's internal structure. X-ray tomography enables a direct visualization of the rebar's geometry, surface morphology, and any internal defects or abnormalities that may be present due to corrosion.
This method operates on the principle of X-rays being differentially absorbed by materials of different density and atomic number. Steel has a higher density than the surrounding concrete, which results in greater absorption of X-rays. Furthermore, areas where corrosion has removed metal or filled voids with rust products appear as regions of lower density. The result is a detailed 3D map of the rebar's condition, allowing engineers to quantify the depth of pitting, reduction in cross-sectional area, and the distribution of corrosion products.
Figure 7 shows the schematic diagram of the X-ray tomography method to evaluate the corrosion of steel rebar. The X-ray Source emits a beam of X-rays that penetrates the concrete sample containing the steel rebar. The intensity of X-rays is attenuated differently by various materials (concrete, steel, corrosion products), enabling contrast in the captured images. The concrete sample with embedded steel rebar, is mounted on a rotating foundation. The X-ray detector is positioned on the opposite side of the X-ray source, the detector collects the transmitted X-rays after they pass through the sample. A reconstructed 2D cross-sectional image of the sample shows the internal structure. By combining multiple cross-sectional slices, a 3D volume image is reconstructed. This 3D view enables comprehensive visualization of corrosion morphology, such as pit depth, distribution, and volume loss.
One key advantage of X-ray tomography is its ability to produce high-resolution, non-destructive, and volumetric data. Traditionally, assessing internal corrosion required cutting or coring, which is invasive and destroys the specimen. X-CT avoids this by allowing a complete view of the interior without physical intervention. Furthermore, it can resolve fine details, often at a micron scale, which makes it suitable for identifying small defects and initiation sites of corrosion that might not be detectable by surface methods.
Despite its capabilities, X-ray tomography has some limitations. The method typically requires specialized equipment, a radiation-safe environment, and extensive computing resources for data reconstruction and analysis. Furthermore, the size of the specimen that can be scanned at high resolution is limited by the dimensions of the X-ray imaging apparatus. Dense materials, large dimensions, or thick protective covers can diminish resolution and contrast. Nonetheless, for small cores or segments of reinforced concrete, X-CT provides unparalleled insight into internal conditions and damage mechanisms.
2.4. Infrared Thermography Method
Infrared thermography (IRT) is a non-destructive testing (NDT) technique that enables surface and subsurface defect detection based on thermal imaging. In the field of civil engineering, IRT has emerged as a promising tool for evaluating the corrosion of steel reinforcement (rebar) in concrete structures [41,42,43,44]. All materials emit infrared radiation in proportion to their temperature; by employing a thermal camera, this radiation can be captured and processed into a thermal image. The principle of infrared thermography for corrosion evaluation lies in the thermal anomalies that arise from differences in material properties, defects, or damage beneath the surface.
When corrosion occurs in a steel rebar, the products of corrosion (such as rust) typically have different thermal properties, including thermal conductivity and emissivity, than the base metal. Furthermore, the formation of corrosion products can affect the bond between steel and the surrounding concrete, creating small voids or detachments. These abnormalities manifest as localized temperature variations on the surface of the structure.
Two main approaches are used in IRT for corrosion detection: passive thermography and active thermography. The passive Thermography relies on naturally occurring thermal gradients (e.g., solar heating) to reveal anomalies [45,46]. The active Thermography involves external stimulation (e.g., heat lamps, flash lamps, eddy current) to induce thermal waves, allowing for better subsurface defect detection [47,48,49,50].
Figure 8 shows the schematic setup of eddy current heating infrared thermography method to evaluate the corrosion of steel rebar [50]. A coil is positioned above the concrete surface. When an alternating current is applied to the coils, eddy currents are induced within the steel rebar. The eddy current generates localized heating in the rebar due to its electrical resistance (Joule heating). The heat generated in the steel rebar diffuses outward through the surrounding concrete. Any variations in the diffusion pattern—caused by corrosion or defects—affect the temperature distribution on the concrete surface. An infrared (IR) camera is used to monitor the surface temperature changes by capturing the emitted infrared radiation. The camera records a sequence of thermal images showing how the heat propagates over time. A PC controls the system, including both the heating pulse (timing and intensity) and the infrared camera. The captured image sequence is processed on the PC to analyze thermal contrasts and detect anomalies associated with corrosion.
Infrared thermography is a quick, non-invasive, and non-contact technique. Large areas of a structure can be scanned rapidly, making it well-suited for the preliminary screening of extensive reinforced concrete components, such as bridges, decks, and parking garages. The captured thermal images can be processed to highlight regions of potential deterioration, guiding further investigations with more invasive or localized methods if necessary.
However, the IRT method has some limitations. The accuracy of infrared thermography depends on environmental conditions, such as solar radiation, wind, and surface wetness, which can affect temperature signals. The depth of defects detectable by infrared is typically limited to shallow abnormalities — typically 2~3 centimeters below the surface — and the method may be less effective for detecting deep or uniformly distributed corrosion. Furthermore, proper data interpretation requires specialized knowledge and experience to account for these influencing factors.
2.5. Ground Penetrating Radar Method
Ground Penetrating Radar (GPR) is a non-destructive testing method that utilizes electromagnetic waves to image the interior of materials [51,52,53]. Figure 9 shows the schematic diagram of GPR system. The microwave Source generates high-frequency electromagnetic pulses (usually in the range 10 MHz to 2.6 GHz), and the transmitter (Tx) antenna directs the microwave signal into the concrete structure. As the signal penetrates the concrete, it interacts with embedded objects, such as steel rebar. The presence of steel rebar causes part of the microwave signal to reflect due to its different dielectric properties. The level and characteristics of this reflection can be affected by corrosion, which alters the electrical and magnetic properties of the rebar [54,55,56]. The receiver (Rx) antenna captures the reflected microwave signals after interaction with the steel rebar. The time delay and amplitude of the received signal provide information about the depth and condition of the rebar. The pulse extender enhances and shapes the received signal for better analysis and resolution. It helps distinguish between reflections from different layers or objects. The A/D converter (Analog-to-Digital Converter) converts the analog microwave signals into digital data for computational processing. The processor analyzes the digitized signals to extract meaningful information about the location and condition of the steel rebar. It may apply signal processing techniques like filtering, deconvolution, or time-domain analysis. The visual display presents the processed data as images or graphs. It typically shows rebar position, potential corrosion zones, or signal amplitude vs. depth.
The principle of GPR for evaluating corrosion lies in the contrast in electromagnetic properties — particularly the permittivity and conductive properties [57]. As a rebar corrodes, rust products form and microcracks develop in the surrounding concrete, affecting its ability to reflect radar signals. Furthermore, the thinning of the steel due to corrosion weakens the reflection from the rebar. The degree of reflection attenuation and the spreading of the radar pulse can be indicators of the condition of the rebar.
GPR is a high-resolution, non-invasive, and rapid method for scanning large areas of reinforced concrete structures. It is frequently used to produce two-dimensional and, by collecting data on a grid, even three-dimensional images of the internal configuration of rebars. GPR can provide valuable information on the depth, spacing, and condition of the reinforcements without disturbing or damaging the structure [58,59,60].
However, GPR has some limitations. The depth of penetration is influenced by concrete properties, moisture content, and frequency of the antenna [61]. Higher-frequency antennas provide greater resolution but less penetration depth. Additionally, GPR signals can become weak or distorted in materials with high clay content or heavy chloride contamination [62]. The interpretation of GPR data also requires expertise and experience, as signals can be influenced by numerous factors unrelated to corrosion.
2.6. Magnetic Flux Leakage Method
The Magnetic Flux Leakage (MFL) method is a well-established non-destructive testing (NDT) technique used for the inspection of ferromagnetic materials [63,64,65]. It has been increasingly adopted for the evaluation of corrosion in steel reinforcement bars (rebars) embedded in concrete structures [66,67,68]. The principle of MFL relies on the distortion of magnetic fields in regions where metal loss or structural discontinuities, such as corrosion pits, are present.
Figure 10 shows the setup of the MFL method for the corrosion evaluation of steel rebar. The excitation coils, on either side of a magnetic yoke, generate a controlled magnetic field that passes through the concrete and steel rebar. The coils are driven by a function generator and power amplifier connected to a PC, which allows precise control of excitation current and waveform (typically sinusoidal or pulsed). The magnetic yoke provides a path for the magnetic field to flow through and concentrate over the steel rebar. It ensures that magnetic flux enters the steel bar and returns to the coil circuit, creating a closed magnetic loop. When the rebar is magnetized, intact regions guide the flux smoothly, while corroded regions cause magnetic flux leakage due to air gaps or material discontinuities from rust loss. The leakage field appears on the concrete surface and can be detected above the rebar. The magnetic Sensor is positioned in the center of the magnetic yoke, the magnetic sensor (e.g., Hall-effect sensor, giant magnetoresistance sensor) detects changes in magnetic flux density. Anomalies in the measured signal indicate the presence and severity of corrosion.
The MFL method is a powerful tool for detecting and quantifying rebar corrosion, offering advantages in speed and accuracy. Recent advancements in sensor technology [69,70,71] and AI-driven signal processing have enhanced its reliability [72,73,74]. However, challenges like concrete cover interference necessitate further research. Future developments in multi-sensor fusion and automated inspection systems will broaden MFL’s applicability in structural health monitoring.
2.7. Eddy Current Testing Method
Eddy current testing (ECT) is a non-destructive testing technique widely used for inspecting conductive materials. Its ability to detect surface and near-surface flaws makes it a powerful tool in various industries, including aerospace, automotive, and civil infrastructure [75,76,77,78,79]. The principle of this technique relies on alternating current passing through a coil, which generates an alternating magnetic field. When this coil is brought close to a conductive material, eddy currents are induced in the material's surface. The flow of these eddy currents depends directly on the material's properties, such as its electrical conductivity, permeability, dimensions, and its condition, including the presence of defects or corrosion.
Figure 11 shows the principle of the ECT method to evaluate the corrosion of steel rebar. The excitation coil generates a primary oscillating magnetic field when powered by the AC source. The magnetic field penetrates the concrete and induces eddy currents in the conductive steel rebar located beneath the surface. Corrosion in the rebar affects the magnitude and distribution of these eddy currents. The detection coil detects the secondary magnetic field produced by the eddy currents in the steel rebar. The strength and phase of this induced field are influenced by changes in the rebar’s condition (e.g., due to corrosion or section loss). The lock-in amplifier is used to filter out noise and extract the desired signal that is synchronized with the reference signal from the AC source.
ECT is used to detect pitting corrosion, loss of cross-sectional area, and surface cracks in steel rebars [80,81,82,83,84,85,86]. It is particularly effective in early-stage corrosion detection, where minimal visual signs are present. The technique can be applied in laboratory settings and on-site inspections, using portable equipment [87,88].
Figure 12 shows a portable compact ECT system for the corrosion evaluation of steel rebar. Figure 13 shows the block diagram of the system [88]. The frequency of 80 kHz is used. All the core components, including the excitation coil, detection coil, signal amplifier, lock-in amplifier, signal generator, and analog-to-digital (AD) converter, were integrated into a compact plastic probe box with a size of 17 cm in length, 8.5 cm in width, and 6 cm in height. The probe connected to a computer via a single USB cable, which served a dual function by supplying both electrical power and enabling data communication. The total power consumption of the system was under 1 watt, making it highly energy-efficient. Using a Helmholtz excitation coil with a diameter of 5 cm and a differential detection coil with a diameter of 1 cm. The corrosion of steel rebar with the covering depth of 75 mm can be detected [88].
With the advancement of sensor technologies and data processing algorithms, eddy current testing is expected to become more accurate and accessible. Developments in high-frequency probes, machine learning for signal analysis, and integration with other NDT techniques may improve the reliability of corrosion assessment in complex structural elements. ECT remains a valuable technique for ensuring the long-term performance of reinforced concrete infrastructure.
3. Summary and Discussion
The evaluation of corrosion in steel rebars is a crucial aspect of structural health monitoring and maintenance. A range of methods — electrochemical, ultrasonic, radiographic, thermal, electromagnetic — are available to assess the condition of rebars in a non-destructive or minimally invasive manner. Each method operates on different physical principles and has unique capabilities, limitations, and applications. Table 3 lists the comparison of different steel rebar corrosion evaluation methods.
Electrochemical methods, such as Half-Cell Potential, Polarization Resistance, and Electrochemical Impedance Spectroscopy, directly measure electrochemical parameters at the metal’s surface. They are well-suited for identifying active corrosion and estimating its rate of progression. Nevertheless, these techniques typically require physical contact and careful surface preparation, which can be challenging in some cases.
Ultrasonic methods rely on the propagation of high-frequency stress waves through materials. Disruptions in wave signals can reveal defects and thinning in rebars. Ultrasonic testing is useful for deep penetration and imaging internal defects, although it may be affected by surface conditions and material heterogeneity.
X-Ray Tomography provides a non-destructive, high-resolution, 3D view of internal structures. It can visualize corrosion damage directly and accurately; however, it requires specialized equipment and radiation safety measures, and is typically unsuitable for large structures in situ.
Infrared Thermography detects abnormalities by measuring temperature distributions on a structure’s surface. It can quickly scan large areas to find regions of potential damage. Nevertheless, it mainly reveals near-surface abnormalities and is influenced by surface conditions and environmental factors.
GPR emits electromagnetic signals into a structure and detects reflection signals from rebars and defects. GPR is effective for mapping rebars’ depth and spacing and identifying areas of deterioration, although it has limited resolution at greater depth, and signals may be affected by material properties and moisture.
MFL is a powerful method for detecting localized metal thinning and pitting by measuring disturbances in a magnetic field. However, the method mainly responds to metal-loss defects, not sensitive to the initial corrosion of steel rebar. The device is normally heavy and needs big working space.
Eddy Current Testing utilizes electromagnetic induction to generate eddy currents in the metal. It is highly sensitive, contactless, and well-suited for the detection of early stage corrosion of steel rebar; and small compact ECT device can be realized, although its depth of penetration is limited, and signals can be influenced by nearby conductive materials.
Each method for detecting corrosion of steel rebar in concrete structures has its own advantages and limitations. No single technique can fully satisfy all the requirements for accuracy, applicability, cost-effectiveness, and ease of use under diverse field conditions. Electrochemical methods offer quantitative insights but often require direct contact with the rebar. Non-destructive methods such as ultrasonic testing, X-ray tomography, ground penetrating radar, infrared thermography, magnetic flux leakage, and eddy current testing provide varying degrees of effectiveness depending on concrete cover, environmental conditions, and signal interpretation complexity.
Given these constraints, a combined approach utilizing multiple techniques may be necessary to achieve comprehensive and reliable corrosion assessment. Hybrid systems or integrated diagnostic frameworks that merge different sensing principles can leverage the strengths of each method while compensating for their individual weaknesses. Future developments are expected to focus on improving sensor sensitivity, data fusion algorithms, miniaturization of hardware, and automated data interpretation through machine learning. These advances will contribute to more accurate, efficient, and non-invasive corrosion monitoring in reinforced concrete infrastructures.
Data Availability Statement
Data are available upon request.
References
- Amir, O. A topology optimization procedure for reinforced concrete structures. Computers & Structures 2013, 114, pp. 46-58. [CrossRef]
- Melchers, R.E. Long-Term Durability of Marine Reinforced Concrete Structures. Journal of Marine Science and Engineering 2020, 8 (4), No.290. [CrossRef]
- Nishiyama, M. Mechanical properties of concrete and reinforcement - state-of-the-art report on HSC and HSS in Japan. Journal of Advanced Concrete Technology 2009, 7 (2), pp. 157-182.
- Cabrera, J.G. Deterioration of concrete due to reinforcement steel corrosion. Cement & Concrete Composites 1996, 18, pp. 47-59. [CrossRef]
- Abosrra L.; Ashour, A.F.; Youseffi, M. Corrosion of steel reinforcement in concrete of different compressive strengths. Construction and Building Materials 2011, 25 (10), pp. 3915-3925. [CrossRef]
- Pradhan, B. Corrosion behavior of steel reinforcement in concrete exposed to composite chloride-sulfate environment. Construction and Building Materials 2014, 72, pp. 398-410.
- Green, W.K. Steel reinforcement corrosion in concrete - an overview of some fundamentals. Corrosion Engineering Science and Technology 2020, 55 (4), pp. 289-302. [CrossRef]
- Okeniyi, J.O.; Loto, C.A.; Popoola, A.P.I. Investigating the corrosion mechanism of morinda lucida leaf extract admixtures on concrete steel rebar in saline/marine simulating environment. International Journal of Electrochemical Science 2015, 10 (12), pp. 9893-9906.
- Ahmad, S. Reinforcement corrosion in concrete structures, its monitoring and service life prediction - a review. Cement & Concrete Composites 2003, 25, pp. 459-471.
- Yodsudjai, W.; Pattarakittam, T. Factors influencing half-cell potential measurement and its relationship with corrosion level. Measurement 2017, 104, pp. 159-168. [CrossRef]
- Ohtsu, M.; Tomoda, Y. Compensated half-cell potential technique for NDE of rebar corrosion. 26th Seiken Symposium on Non-Destructive Testing in Civil Engineering 2000, Non-Destructive Testing in Civil Engineering 2000, pp. 615-624.
- Pour-Ghaz, M.; Isgor, O.B.; Ghods, P. Quantitative interpretation of half-cell potential measurements in concrete structures. Journal of Materials in Civil Engineering 2009, 21 (9), pp. 467-475. [CrossRef]
- 1999; 13. ASTM C876-91(1999) Standard test method for half-cell potentials of uncoated reinforcing steel in concrete.
- So, H.S.; Millard, S.G. On-site measurements on corrosion rate of steel in reinforced concrete. ACI Materials Journal 2007, 104 (6), pp. 638-642.
- Sadowski, L. New non-destructive method for linear polarisation resistance corrosion rate measurement. Archives of Civil and Mechanical Engineering 2010, 10 (2), pp. 109-116. [CrossRef]
- Videm, K.; Myrdal, R. Electrochemical behavior of steel in concrete and evaluation of the corrosion rate. Corrosion 1997, 53 (9), pp. 734-742. [CrossRef]
- Milliard, S.G.; Law, D.W.; Bunsey J.H.; Cairus, J. Environmental influences on linear polarization corrosion rate measurement in reinforced concrete. NDT & E International, 2001, 34 (6), pp. 409-417.
- Andrade, C,; Alonso, M.C.; Gonzalez, J.A. An initial effort to use corrosion rate measurements for estimating rebar durability corrosion rates of steel in concrete. ASTM STP 1065, N.S. Berke et al., editors. ASTM, Philadelphia 1990, pp. 29-37.
- Dhouibi, L.; Triki, E.; Raharinaivo, A. The application of electrochemical impedance spectroscopy to determine the long-term effectiveness of corrosion inhibitors for steel in concrete. Cement & Concrete Composites 2002, 24 (1), pp. 35-43.
- Zhao, X.Q.; Xiong, J. Effectively analysis of concrete bridge deck corrosion using electrochemical impedance spectroscopy. International Journal of Electrochemical Science 2016, 11 (7), pp. 5702-5709.
- Bensabra, H.; Azzouz, N. Study of rust effect on the corrosion behavior of reinforcement steel using impedance spectroscopy. Metallurgical and Materials Transactions A-Physical Metallurgy and Materials Science 2013, 44A, pp. 5703-5710. [CrossRef]
- Dawson J.L.; Callow L.M.; Hladky K.; and Richardson, J.A. Use of electrochemical impedance measurements applied to the corrosion of reinforcing steel in concrete. Corrosion '78, NACE, Houston, 1978, Paper No. 125.
- Feliu, V.; Gonzalez, J.A.; Andrade, C.; Feliu, S. Equivalent circuit for modelling the steel-concrete interface. I. Experimental evidence and theoretical predictions. Corrosion Science 1998, 40, pp. 975-993. [CrossRef]
- Choi, Y.S.; Kim, J.G.; Lee, K.M. Corrosion behavior of steel bar embedded in fly ash concrete. Corros. Sci., 2006, 48, pp. 1733-1745. [CrossRef]
- Hoshi, Y.; Hasegawa, C.; Okamoto, T.; Soukura, M.; Tokieda, H.; Shitanda, I.; Itagaki, M.; Kato, Y. Electrochemical impedance analysis of corrosion of reinforcing bars in concrete. Electrochemistry 2019, 87, pp. 78-83.
- Andrade, C.; Martinez, I.; Castellote, M. Feasibility of determining corrosion rates by means of stray current-induced polarization. J. Appl. Electrochem., 2008, 38, pp. 1467-1476.
- Hoshi, Y.; Koike, T.; Tokieda, H.; Shitanda, I.; Itagaki, M.; Kato, Y. Non-contact measurement to detect steel rebar corrosion in reinforced concrete by electrochemical impedance spectroscopy. J. Electrochem. Soc. 2019, 166, pp. C3316-C3319. [CrossRef]
- Sharma, S.; Mukherjee, A. Longitudinal guided waves for monitoring chloride corrosion in reinforcing bars in concrete. Struct. Health Monit. 2010, 9, pp. 555–567. [CrossRef]
- Shah, A.A.; Ribakov, Y. Non-destructive evaluation of concrete in damaged and undamaged states. Mater. Des. 2009, 30, pp. 3504–3511.
- Liang, M.T.; Su, P.J. Detection of the corrosion damage of rebar in concrete using impact-echo method. Cem. Concr. Res. 2001, 31, pp. 1427–1436.
- Zaki, A.; Chai, H.K.; Aggelis, D.G.; Alver, N. Non-destructive evaluation for corrosion monitoring in concrete: A review and capability of acoustic emission technique. Sensors 2015, 15, pp. 19069–19101. [CrossRef]
- Jhang, K.Y. Nonlinear ultrasonic techniques for non-destructive assessment of microdamage in materials: A review. Int. J. Precis. Eng. Manuf. 2009, 10, pp. 123–135.
- Climent M.Á.; Miró M.; Carbajo J.; Poveda P.; de Vera G.; Ramis J. Use of non-linear ultrasonic techniques to detect cracks due to steel corrosion in reinforced concrete structures. Materials (Basel). 2019,12(5), 813. [CrossRef]
- Shah, A.A.; Ribakov, Y.; Hirose, S. Nondestructive evaluation of damaged concrete using nonlinear ultrasonics. Mater. Des. 2009, 30, pp. 775–782.
- Xiang, H.; Newtson, C.M.; Woodward, C. Optimization of nonlinear ultrasound results to determine dynamic properties of concrete. J. Mater. Civ. Eng. 2008, 20, pp. 700–706.
- Robuschi, S.; Tengattini, A.; Dijkstra, J.; Fernandez, I.; Lundgren, K. A closer look at corrosion of steel reinforcement bars in concrete using 3D neutron and X-ray computed tomography. Cement and Concrete Research 2021, 144, 106439. [CrossRef]
- Dong, ].B.; Shi, G.; Dong, P.; Ding, W.; Teng, X.; Qin, S.; Liu, Y.; Xing, F.; Hong, S. Visualized tracing of rebar corrosion evolution in concrete with x-ray microcomputed tomography method. Cement and Concrete Composites 2018, 92, pp. 102–109.
- Michel, A.; Pease, B.J.; Geiker, M.R.; Stang, H.; Olesen, J.F. Monitoring reinforcement corrosion and corrosion-induced cracking using non-destructive x-ray attenuation measurements, Cem. Concr. Res. 2011, 41, pp. 1085–1094. [CrossRef]
- Xi, X.; Yang, S.T. Investigating the spatial development of corrosion of corner-located steel bar in concrete by X-ray computed tomography. Construction and Building Materials 2019, 221, pp. 177-189.
- Alhusain, M.; Quayle, T.G.; Al-Mayah, A. Three-dimensional characterization of naturally corroded steel-reinforced concrete using computed tomography. 10th International Conference on Fibre-Reinforced Polymer (FRP) Composites in Civil Engineering (CICE) 2022, 198, pp. 706-713.
- Maldague, X. P. V. Theory and practice of infrared technology for nondestructive testing. Wiley-Interscience 2001.
- Avdelidis, N.P.; Moropoulou, A. Applications of infrared thermography for the investigation of historic structures. Journal of Cultural Heritage 2004, 5(1), pp. 119–127.
- Sfarra, S.; Paoletti, D.; Perilli, S.; et al. Lock-in thermography for the detection of corrosion in reinforced concrete. NDT & E International 2018, 98, pp. 98–106.
- Yuan, F.; Liu, Q.; Liu, G.; Wang, J. Application of UAV-based infrared thermography in detecting subsurface delamination of bridge decks. Automation in Construction 2020, 112, 103102.
- Ichi, E.O. Validating NDE dataset and benchmarking infrared thermography for delamination detection in bridge decks. Theses and Dissertations 2021, 4170. https://commons.und.edu/theses/4170.
- Leon-Salas W.D.; Halmen C. A RFID sensor for corrosion monitoring in concrete. IEEE Sensors J. 2015, 16(1), pp. 32–42. [CrossRef]
- Baek, S.; Bortolin, A.; Ferrarini, G.; Molinas, B.; Giantin, D.; Zonta, P.; Bison, P. Nondestructive corrosion detection in RC through integrated heat induction and IR thermography. J. Nondestruct. Eval. 2012, 31, pp. 181–190.
- Na, S.; Paik, I. Application of thermal image data to detect rebar corrosion in concrete structures. Appl. Sci. 2019, 9, 4700. [CrossRef]
- Keo, S.A.; Brachelet, F.; Breaban, F.; Defer, D. Steel detection in reinforced concrete wall by microwave infrared thermography. NDT&E International 2014, 62, pp. 172–177. [CrossRef]
- He, Y.; Tian, G.; Pan, M.; Chen, D. Eddy current pulsed phase thermography and feature extraction. Appl. Phys. Lett. 2013, 103, 084104.
- Neal, A. Ground-penetrating radar and its use in sedimentology: principles, problems and progress. Earth-Science Reviews 2004, 66, pp. 261-330.
- Maierhofer, C. Nondestructive evaluation of concrete infrastructure with ground penetrating radar. J. Mater. Civil. Eng. 2003, 15, pp. 287–297. [CrossRef]
- Barnes, C.L.; Trottier, J.F.; Forgeron, D. Improved concrete bridge deck evaluation using GPR by accounting for signal depth–amplitude effects. NDT & E Int. 2008, 41, pp. 427–433.
- Sbartaï, Z.M.; Laurens, S.; Rhazi, J.; Balayssac, J.P.; Arliguie, G. Using radar direct wave for concrete condition assessment: correlation with electrical resistivity. J. Appl. Geophys. 2007, 62, pp. 361–374. [CrossRef]
- Lai, W.L.; Derobert, X.; Annan, P. A review of ground penetrating radar application in civil engineering: a 30-year journey from locating and testing to imaging and diagnosis. NDT & E Int. 2018, 96, pp. 58–78. [CrossRef]
- Bungey, J.H. Sub-surface radar testing of concrete: a review. Constr. Build. Mater. 2004, 18 pp. 1–8.
- Annan, A.P. Electromagnetic principles of ground penetrating radar. In: Jol HM (ed) Ground penetrating radar: theory and applications, 1st edn. Elsevier, Amsterdam, Netherlands 2009, pp. 4–40.
- Chang, C.W.; Lin, C.H.; Lien, H.S. Measurement radius of reinforcing steel bar in concrete using digital image GPR. Constr. Build. Mater. 2009, 23, pp. 1057–1063.
- Varnavina, A.V.; Khamzin, A.K.; Sneed, L.H.; Torgashov, E.V.; Anderson, N.L.; Maerz, N.H.; Boyko, K.J. Concrete bridge deck assessment: relationship between GPR data and concrete removal depth measurements collected after hydrodemolition. Constr. Build. Mater. 2015, 99, pp. 26–38.
- Zaki, A.; Johari, M.; Azmi, M.; Hussin, W; Aminuddin, W.M.; Jusman, Y. Experimental assessment of rebar corrosion in concrete slab using ground penetrating radar (GPR). International Journal of Corrosion 2018, 5389829.
- Hugenschmidt, J.; Loser, R. Detection of chlorides and moisture in concrete structures with ground penetrating radar. Mater. Struct. 2008, 41, pp. 785–792.
- Tarussov, A.; Vandry, M.; Haza, A.D.L. Condition assessment of concrete structures using a new analysis method: ground-penetrating radar computer-assisted visual interpretation. Constr. Build. Mater. 2013, 38, pp. 1246–1254.
- Feng, B.; Wu, J.; Tu, H.; Tang, J.; Kang, Y. A review of magnetic flux leakage nondestructive testing. Materials 2022, 15, 7362. [CrossRef]
- Sun, Y.; Kang, Y. Magnetic mechanisms of magnetic flux leakage nondestructive testing. Appl. Phys. Lett. 2013, 103, 184104.
- Shi, Y.; Zhang, C.; Li, R.; Cai, M.; Jia, G. Theory and application of magnetic flux leakage pipeline detection. Sensors 2015, 15, 31036–31055.
- Qiu, J.; Zhang, W.; Jing, Y. Quantitative linear correlation between self-magnetic flux leakage field variation and corrosion unevenness of corroded rebars. Measurement 2023, 218, 113173,. [CrossRef]
- Yousaf, J.; Harseno, R.W.; Kee, S.-H.; Yee, J.-J. Evaluation of the size of a defect in reinforcing steel using magnetic flux leakage (MFL) measurements. Sensors 2023, 23, 5374.
- Yang, M.; Zhou, J.; Zhao, Q.; Xia, Q.; Zhang, H.; Wang, L. Quantitative detection of corroded reinforced concrete of different sizes based on SMFL, KSCE Journal of Civil Engineering 2022, 26, pp. 143-154.
- Jin, Z.; Mohd Noor Sam, M.A.I.; Oogane, M.; Ando, Y. Serial MTJ-based TMR sensors in bridge configuration for detection of fractured steel bar in magnetic flux leakage testing. Sensors 2021, 21, 668.
- Wang, B.; Zhang, S.; Wang, J.; Jing, L.; Mao, F. A novel magnetic flux leakage method incorporating TMR sensors for detecting zinc dross defects on the surface of hot-dip galvanized sheets. Magnetochemistry 2024, 10, 101. [CrossRef]
- Nicolicea, A.; Oliveros-Mata, E.S.; Zabila, Y.; Makarov, D.; Melzer, M.; Pelkner, M. Flexible anisotropic magnetoresistive sensors for novel magnetic flux leakage testing capabilities. NDT & E International 2024, 146, 103160.
- Huang, S.; Peng, L.; Sun, H.; Li, S. Deep learning for magnetic flux leakage detection and evaluation of oil & gas pipelines: a review. Energies 2023, 16, 1372. [CrossRef]
- Kim, J.-W.; Park, S. Magnetic Flux Leakage Sensing and Artificial Neural Network Pattern Recognition-Based Automated Damage Detection and Quantification for Wire Rope Non-Destructive Evaluation. Sensors 2018, 18, 109.
- Li, S.; Bai, L.; Ren, C.; Zhang, X.; Ai, J.; Zhang, J. A multidirectional magnetic flux leakage detection based crack 3-D profile reconstruction method. Mechanical Systems and Signal Processing 2025, 228, 112408.
- Machado, M.A. Eddy Currents Probe Design for NDT Applications: A Review. Sensors 2024, 24, 5819.
- García-Martín, J.; Gómez-Gil, J.; Vázquez-Sánchez, E. Non-destructive techniques based on eddy current testing. Sensors 2011, 11, 2525–2565. [CrossRef]
- Alvarenga, T.A.; Carvalho, A.L.; Honorio, L.M.; Cerqueira, A.S.; Filho, L.M.A.; Nobrega, R.A. Detection and Classification System for Rail Surface Defects Based on Eddy Current. Sensors 2021, 21, 7937.
- He, D.; Kusano, M.; Watanabe, M. Detecting the defects of warm-sprayed Ti-6Al-4V coating using Eddy current testing method. NDT & E International 2022, 125, 102565.
- He, D.F.; Zhang, Y.Z.; Shiwa, M.; Moriya, S. Development of eddy current testing system for inspection of combustion chambers of liquid rocket engines. Review of Scientific Instruments 2013, 84, 014701. [CrossRef]
- Gaydecki, P.A.; Burdekin, F.M. An inductive scanning system for two dimensional imaging of reinforcing components in concrete structures. Meas. Sci. Techno. 1994, 5, pp. 1272-1280.
- Yu, Z.Z; Gaydecki, P.A.; Silva, I.; Fernandes, B.T.; Burdekin, F.M. Magnetic field imaging of steel reinforcing bars in concrete using portable scanning systems. Review of Progress in Quantitative Nondestructive Evaluation 1999, 18, pp. 2145-2152.
- Gaydecki, P.; Silva, I.; Fernandes, B.T.; Yu, Z.Z A portable inductive scanning system for imaging steel-reinforcing bars embedded within concrete. Sensors and Actuators A 2000, 84, pp. 25-32.
- Miller, G.; Gaydecki, P.; Quek, S.; Fernandes, B.; Zaid, M. A combined Q and heterodyne sensor incorporating real-time DSP for reinforcement imaging, corrosion detection and material characterization. Sensors and Actuators A, Physical 2005, 121, pp. 339–346. [CrossRef]
- Ricken, W.; Mehlhorn, G.; Becker, W. Determining of the concrete cover thickness and the bar diameter in reinforced concrete with a method of eddy current testing. Proc. Int. Symp. Non-Destructive Testing Civil Eng., Berlin, Germany, 1995, pp. 197–204.
- Miller, G.; Gaydecki, P.; Quek, S.; Fernandes, B.T.; Zaid, M.A.M. Detection and imaging of surface corrosion on steel reinforcing bars using a phase-sensitive inductive sensor intended for use with concrete. NDT&E International 2003, 36, pp. 19–26.
- He, D. Surface corrosion evaluation of steel cable for suspension bridge using electromagnetic method. Surf. Sci. Tech. 2023, 1, 16.
- He, D. Corrosion evaluation of steel rebar using electromagnetic induction method. Studies in Applied Electromagnetics and Mechanics 2020, pp. 141-146.
- He, D. Detecting the Corrosion of a Steel Rebar Using the Eddy Current Testing Method. Standards 2024, 4, 286-299. [CrossRef]
Figure 1.
Corrosion mechanism of steel rebar.
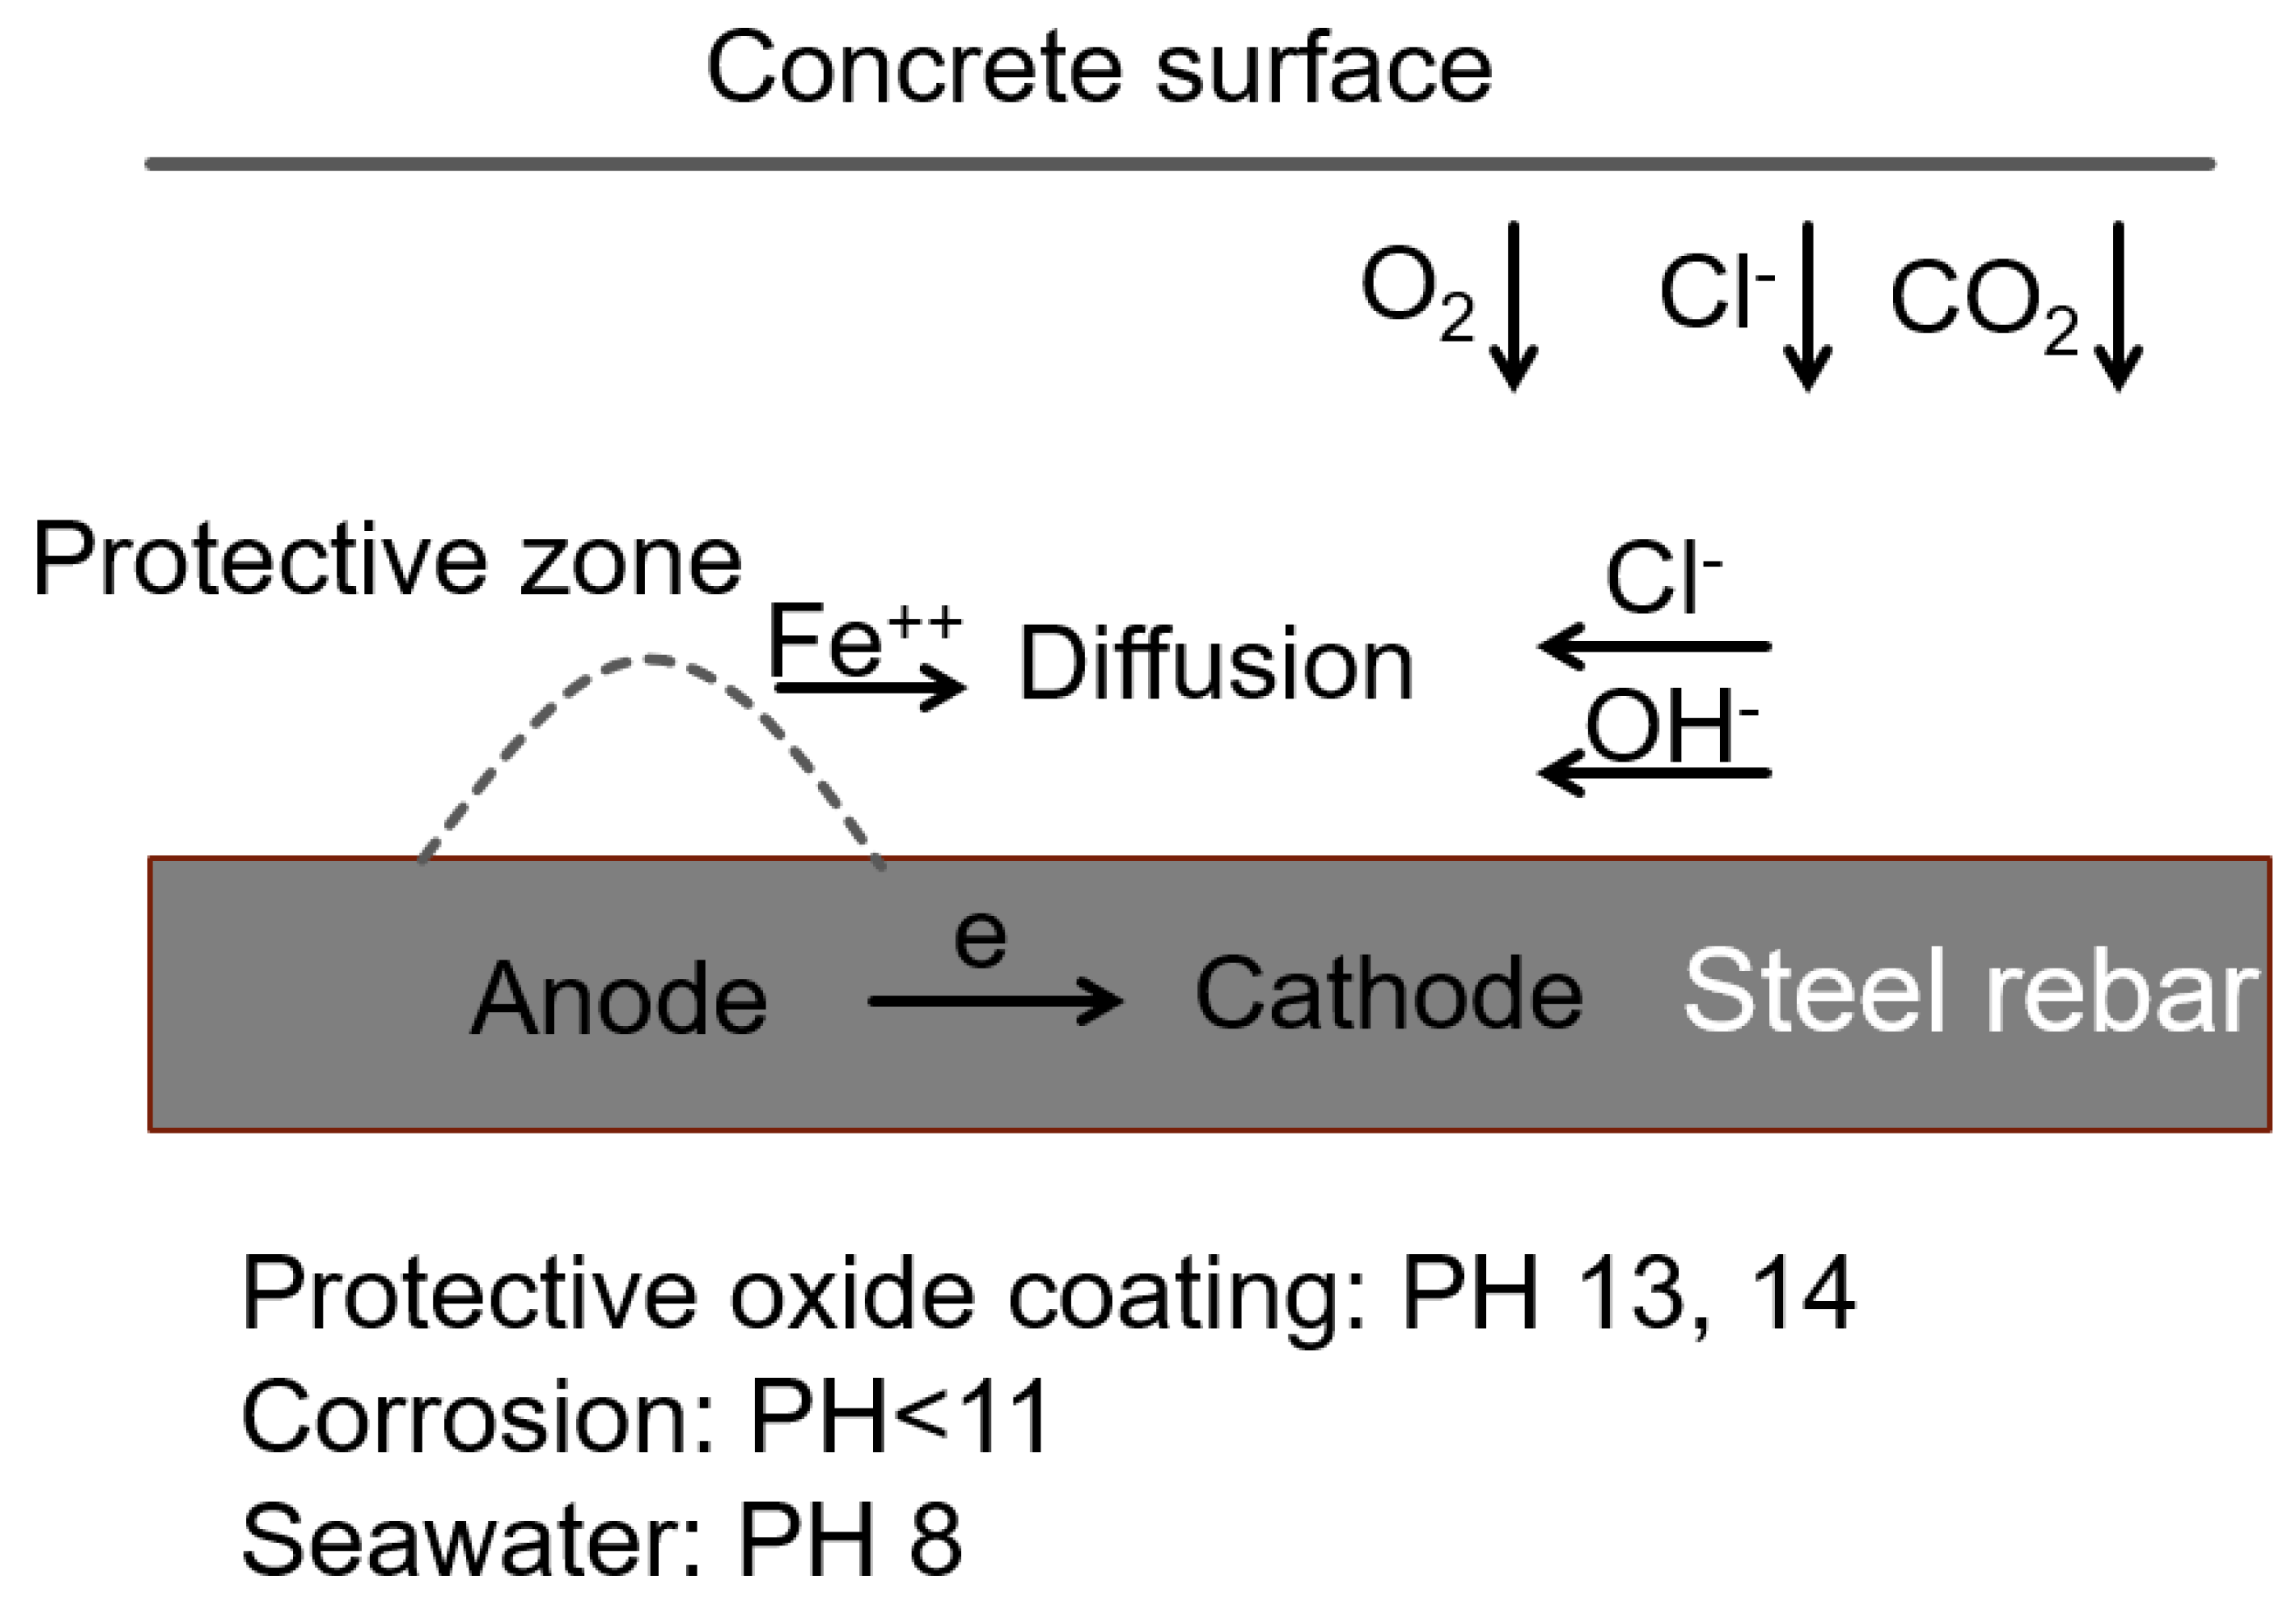
Figure 2.
Corrosion progression of steel rebar and the lifespan of a concrete structure.
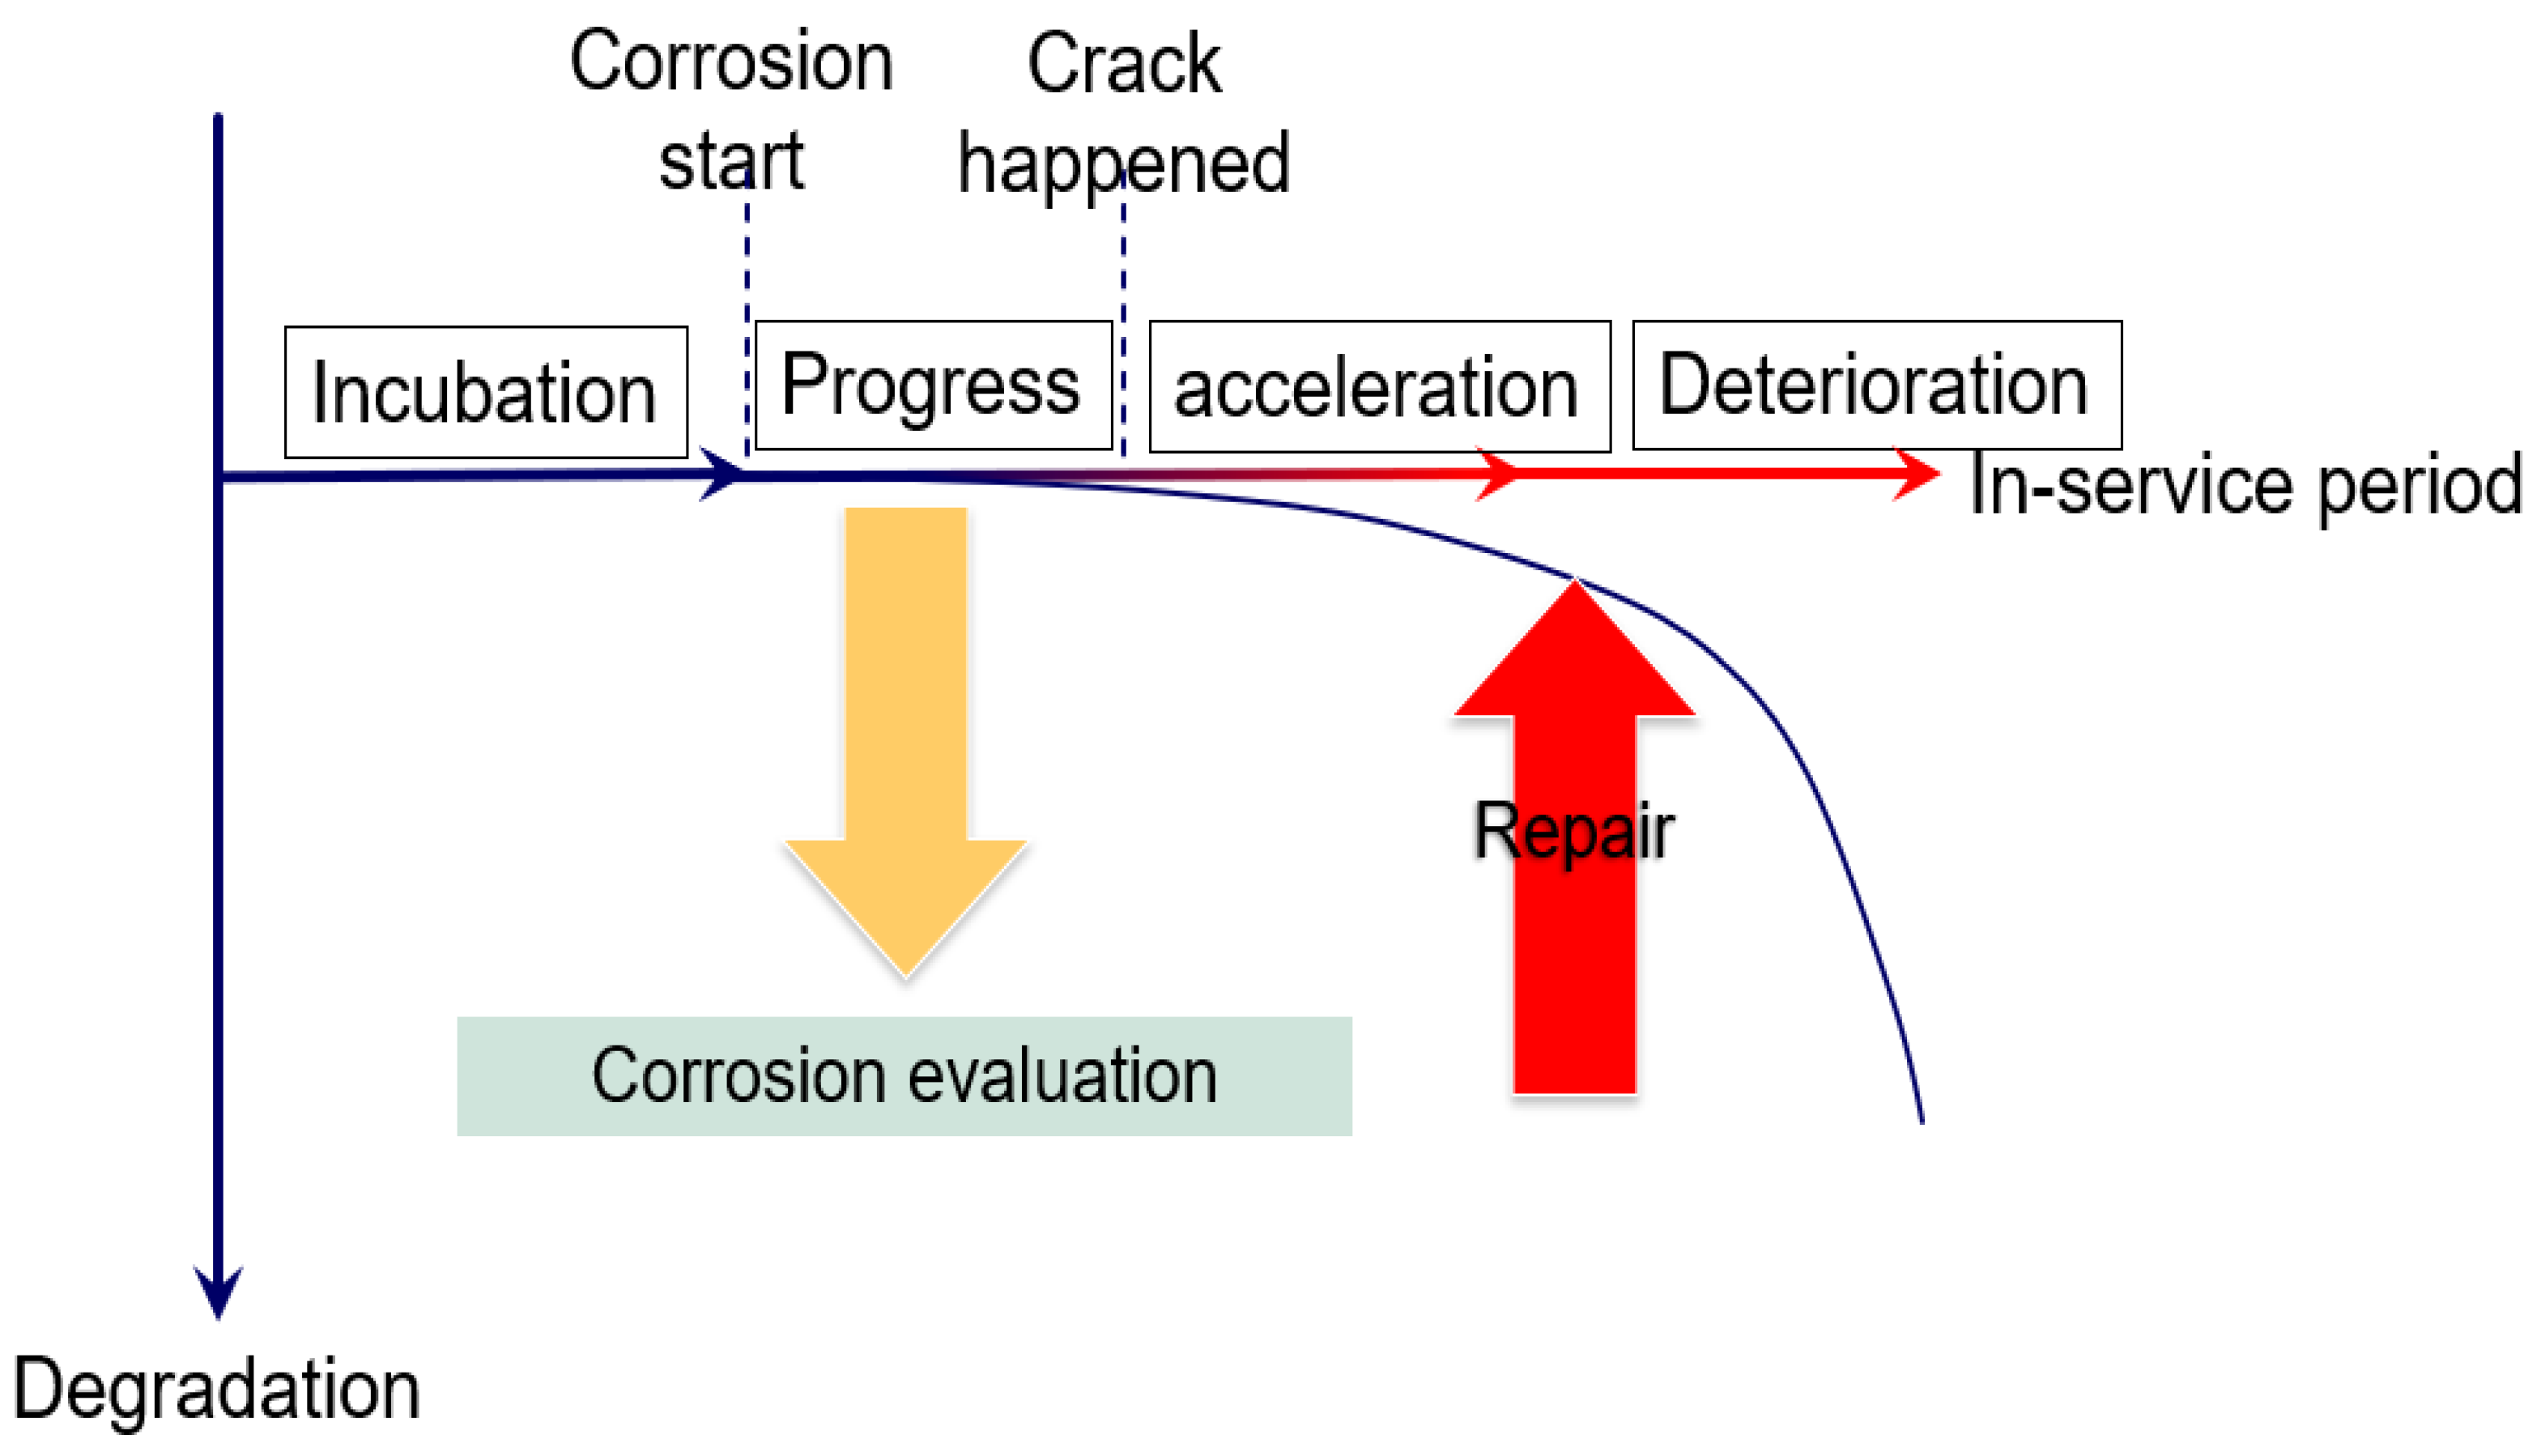
Figure 3.
Schematic diagram of half-cell potential measurement. .
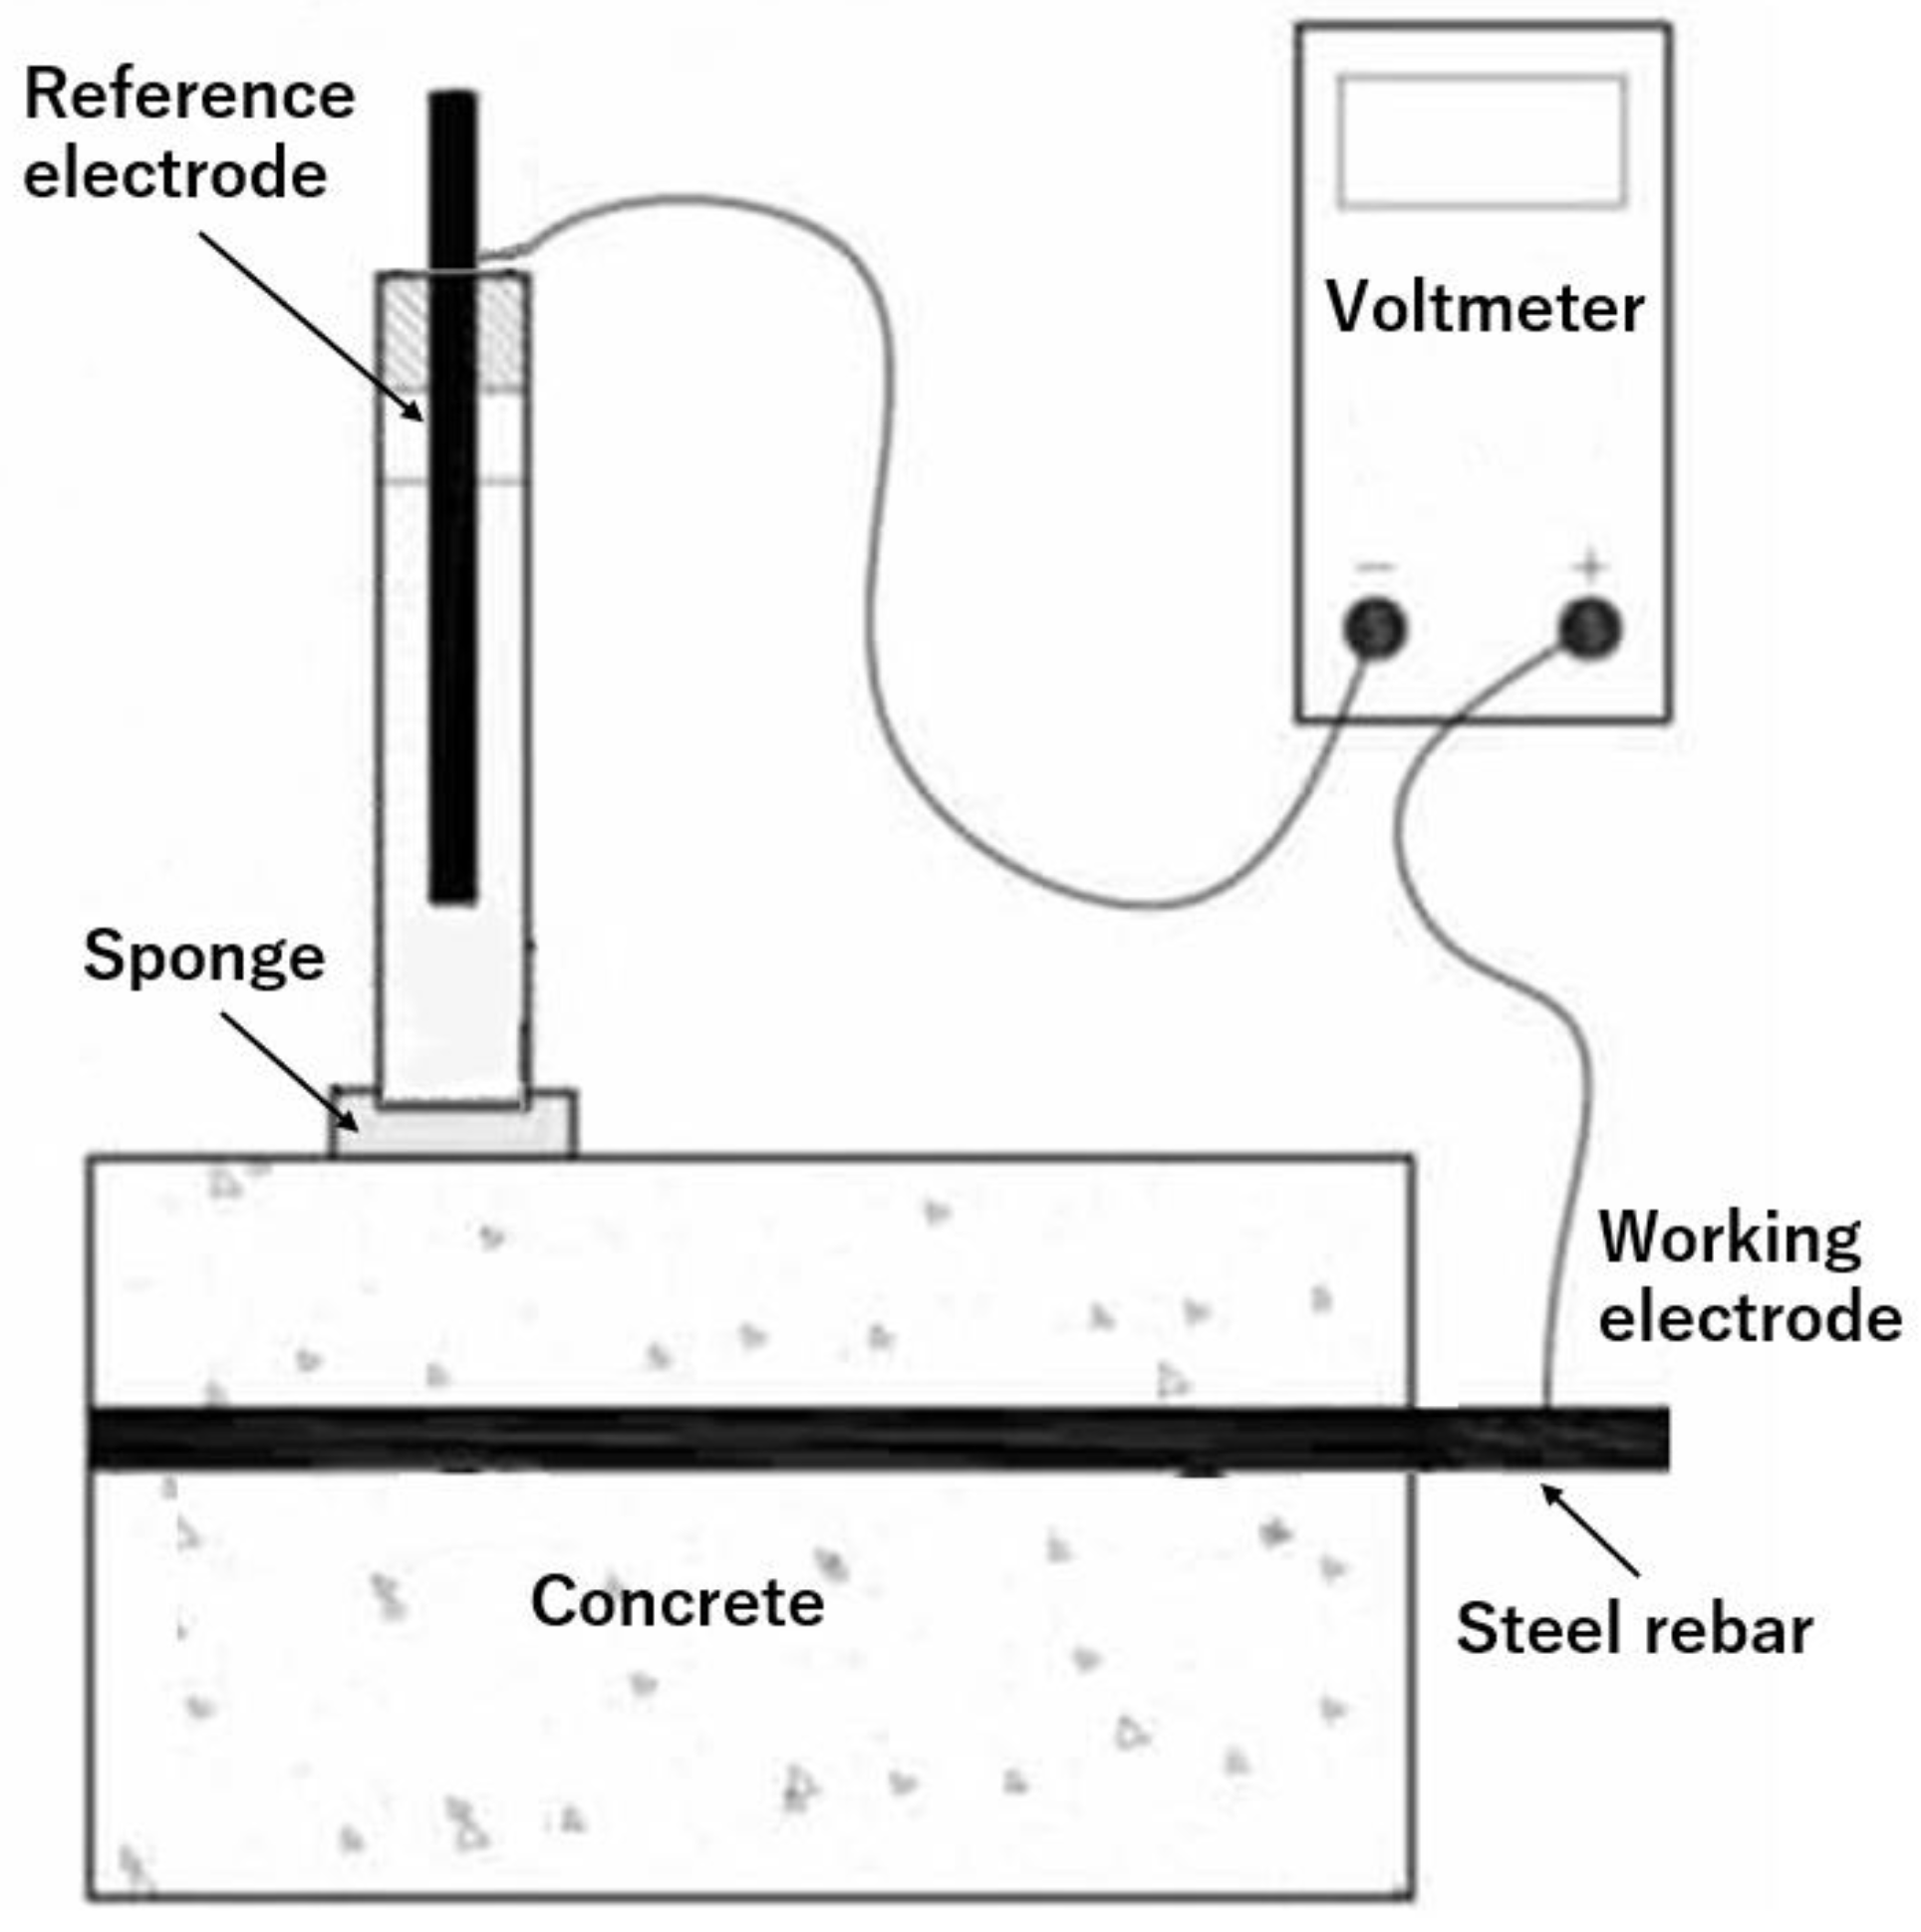
Figure 4.
Setup of Linear polarization resistance measurement.
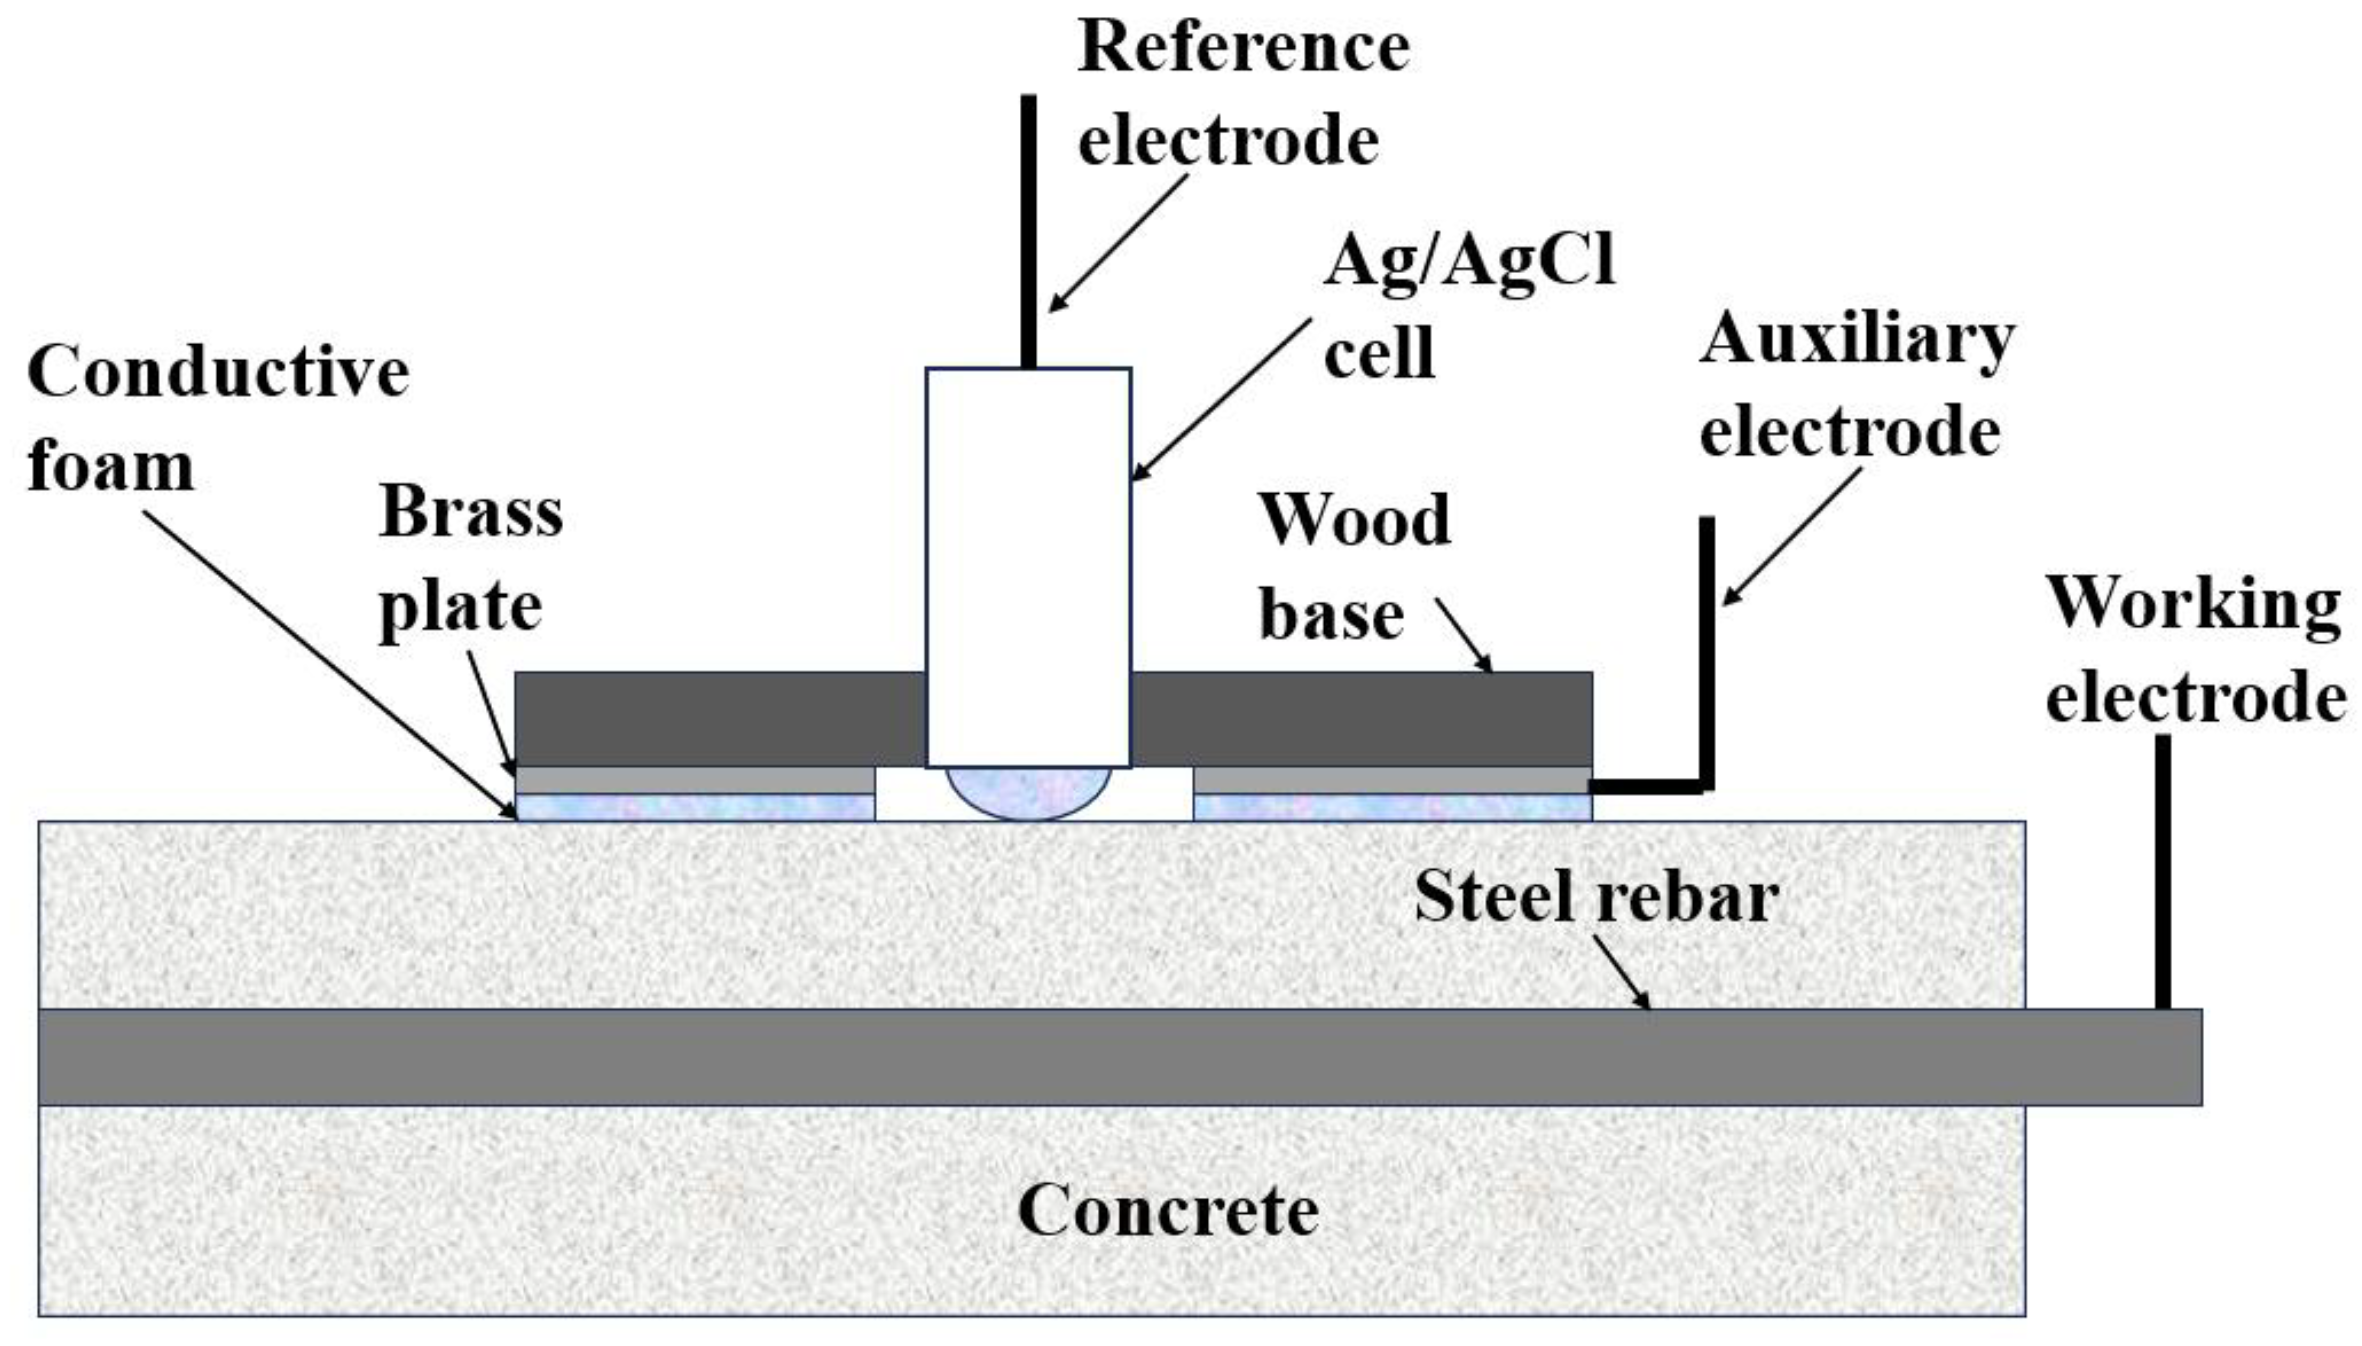
Figure 5.
Schematic of (a) the four-electrode setup and (b) the two-electrode setup of electrochemical impedance spectroscopy.
Figure 5.
Schematic of (a) the four-electrode setup and (b) the two-electrode setup of electrochemical impedance spectroscopy.
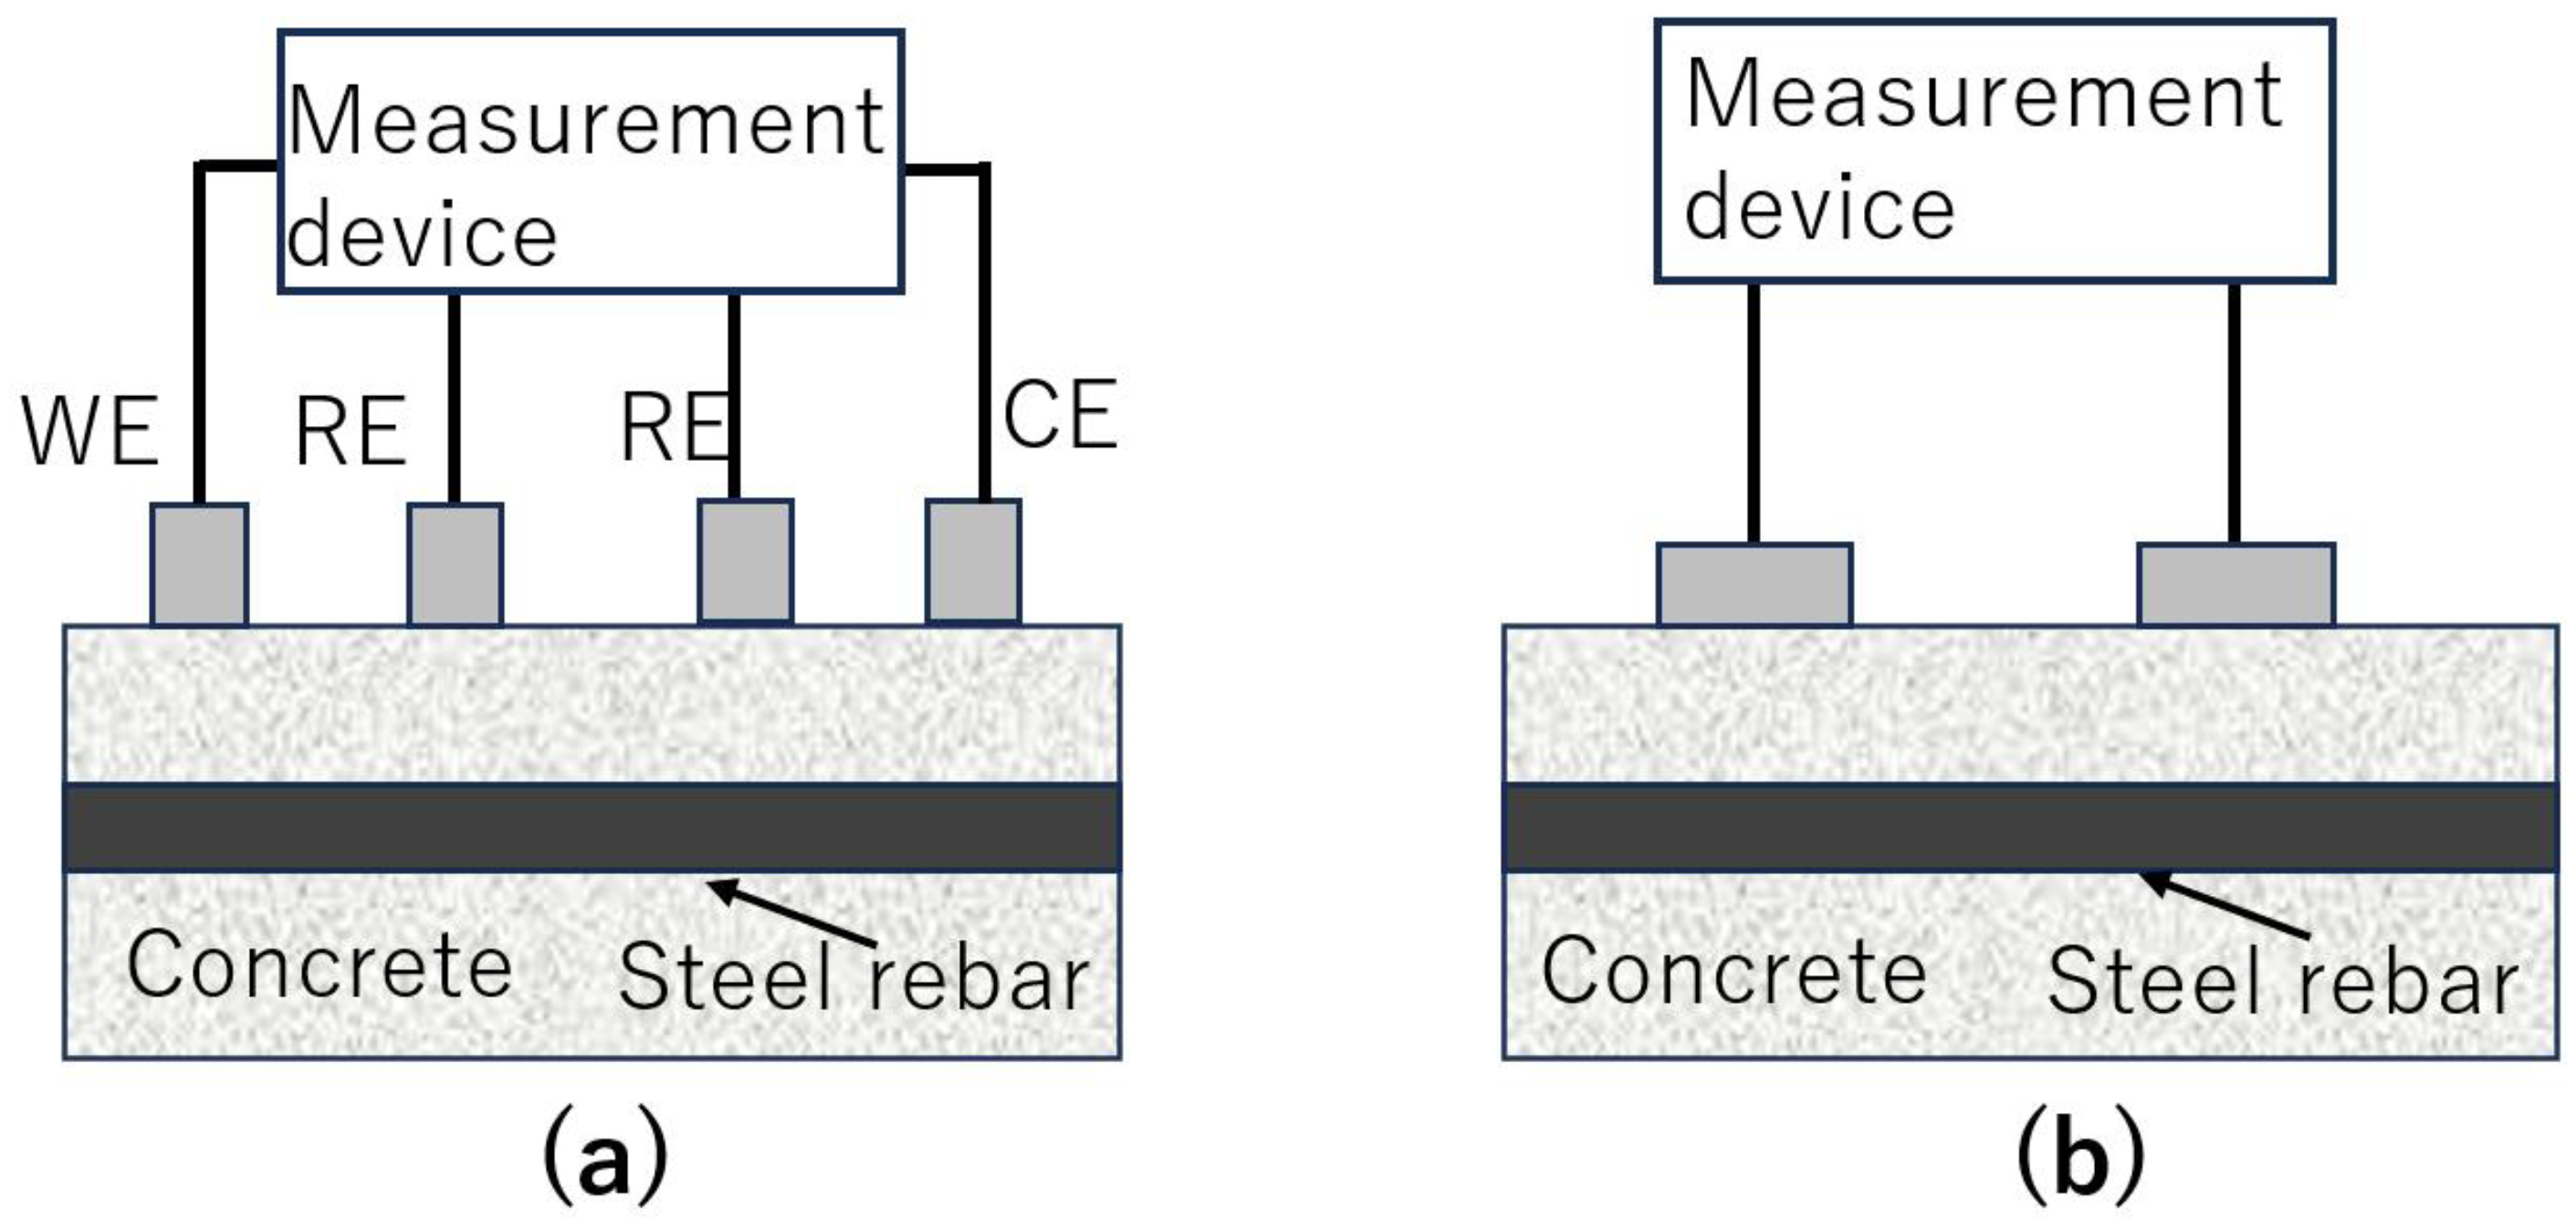
Figure 6.
Approach of ultrasonic testing.
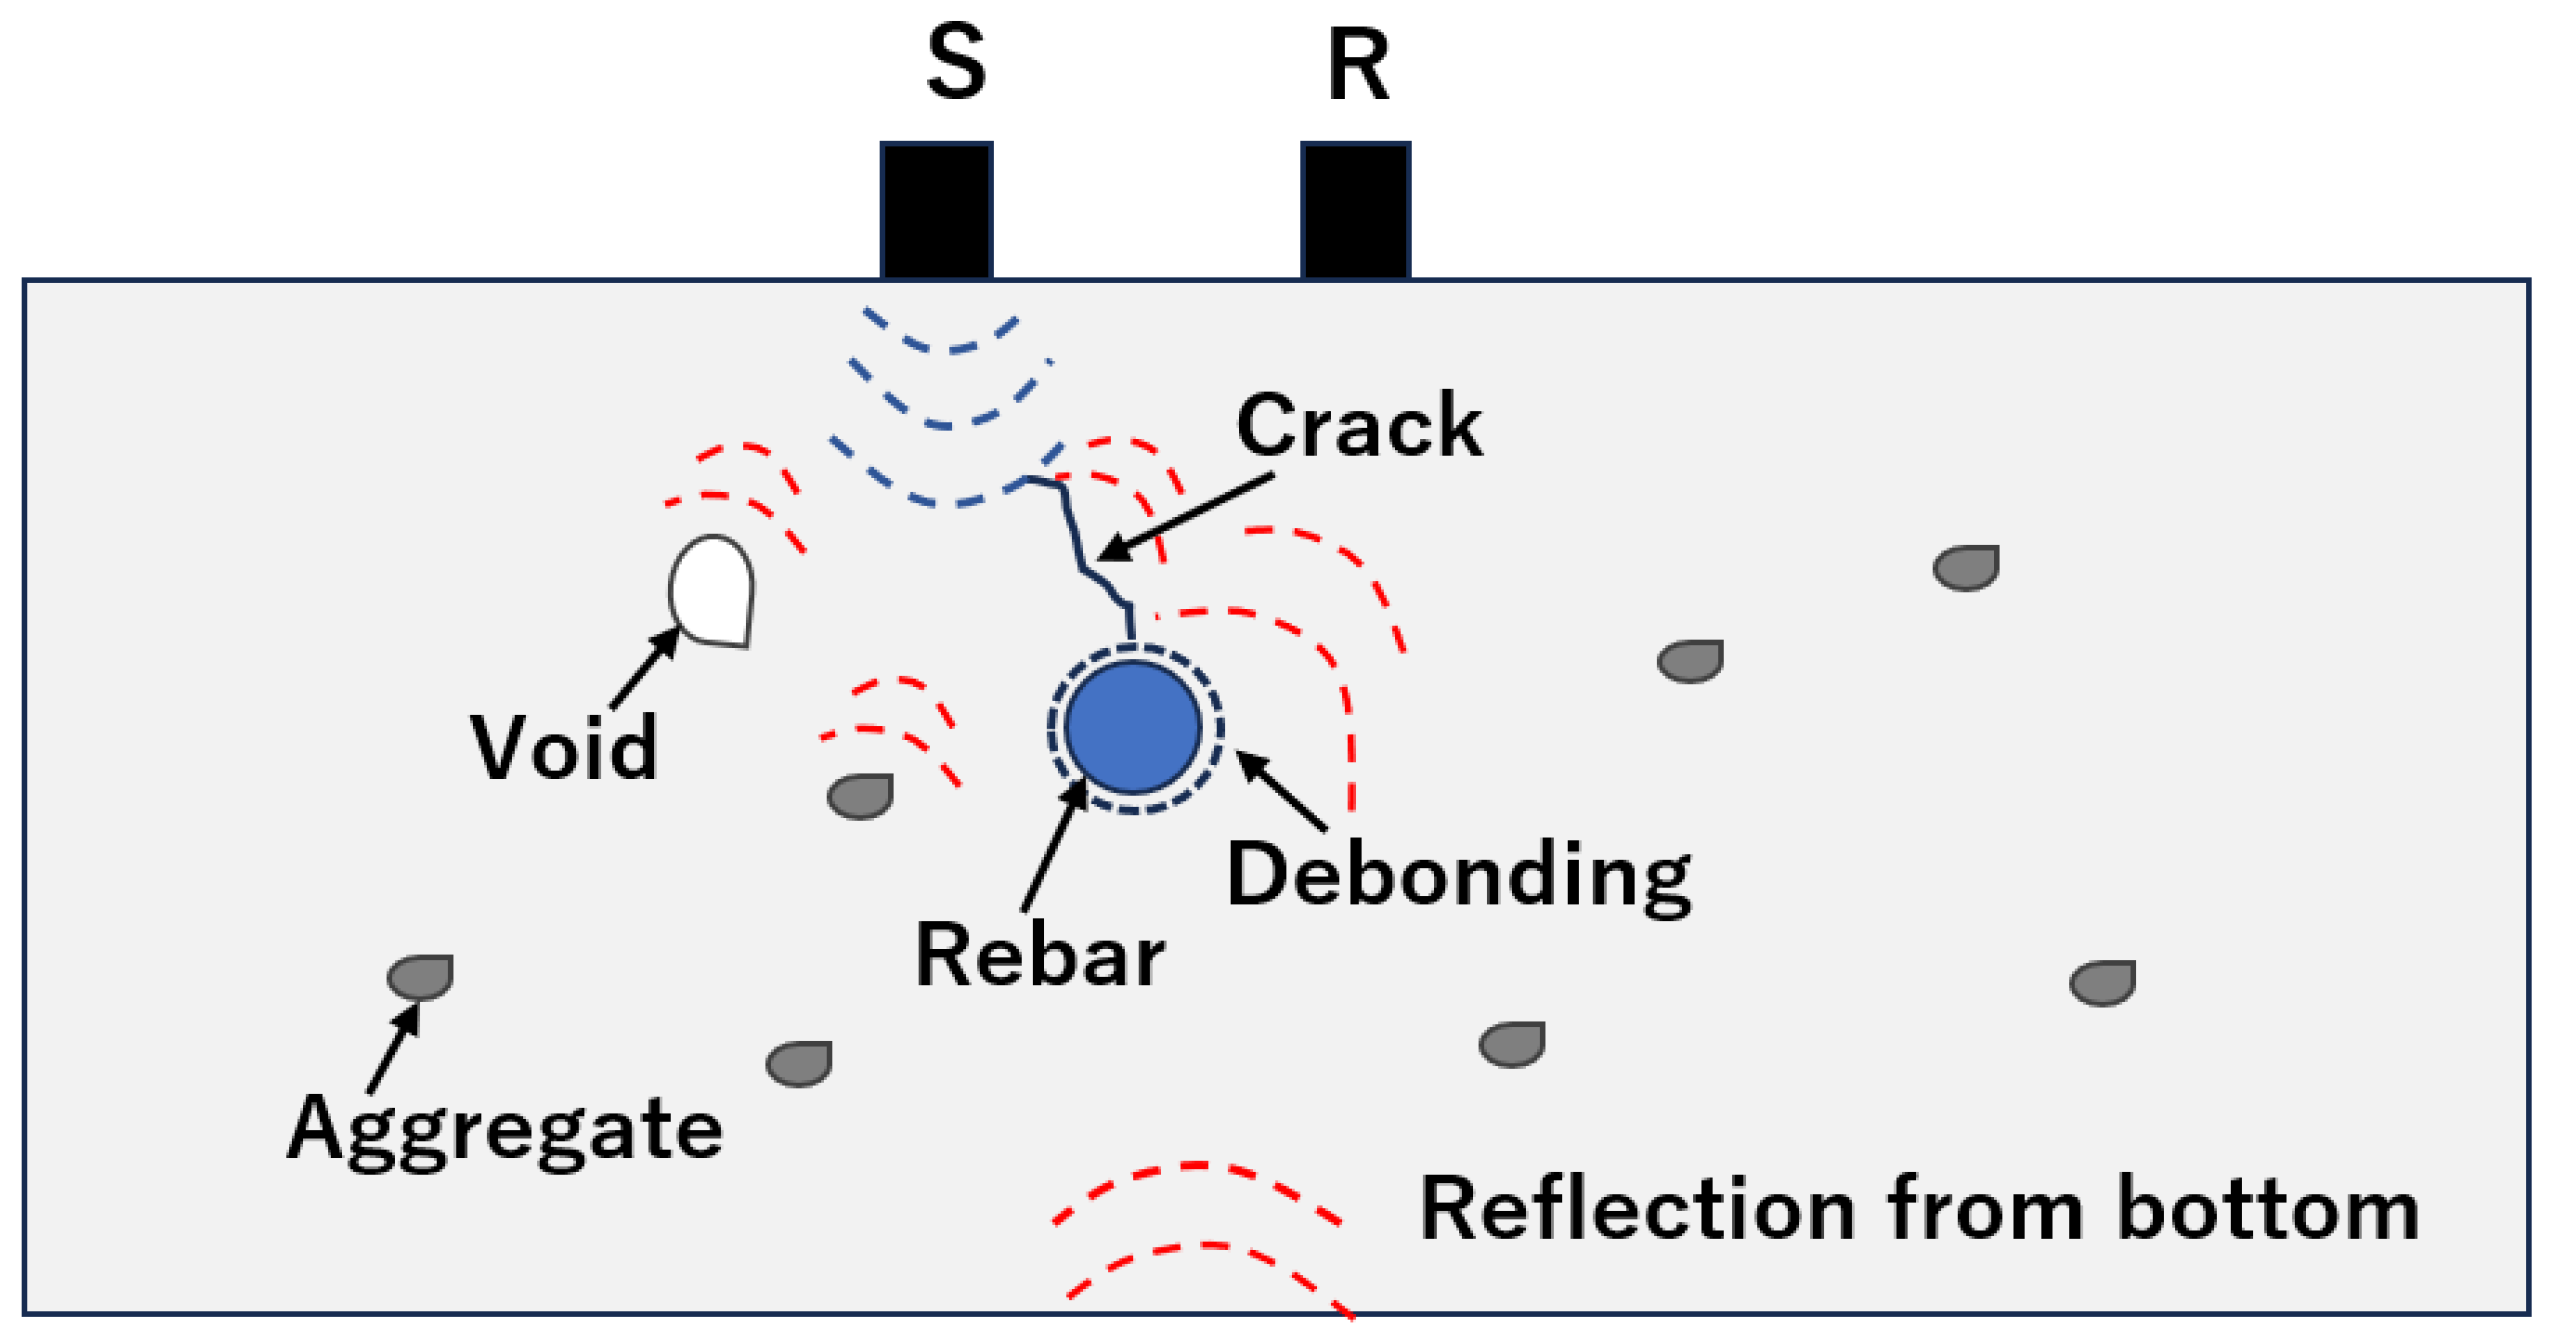
Figure 7.
Schematic diagram of the X-ray tomography method. .
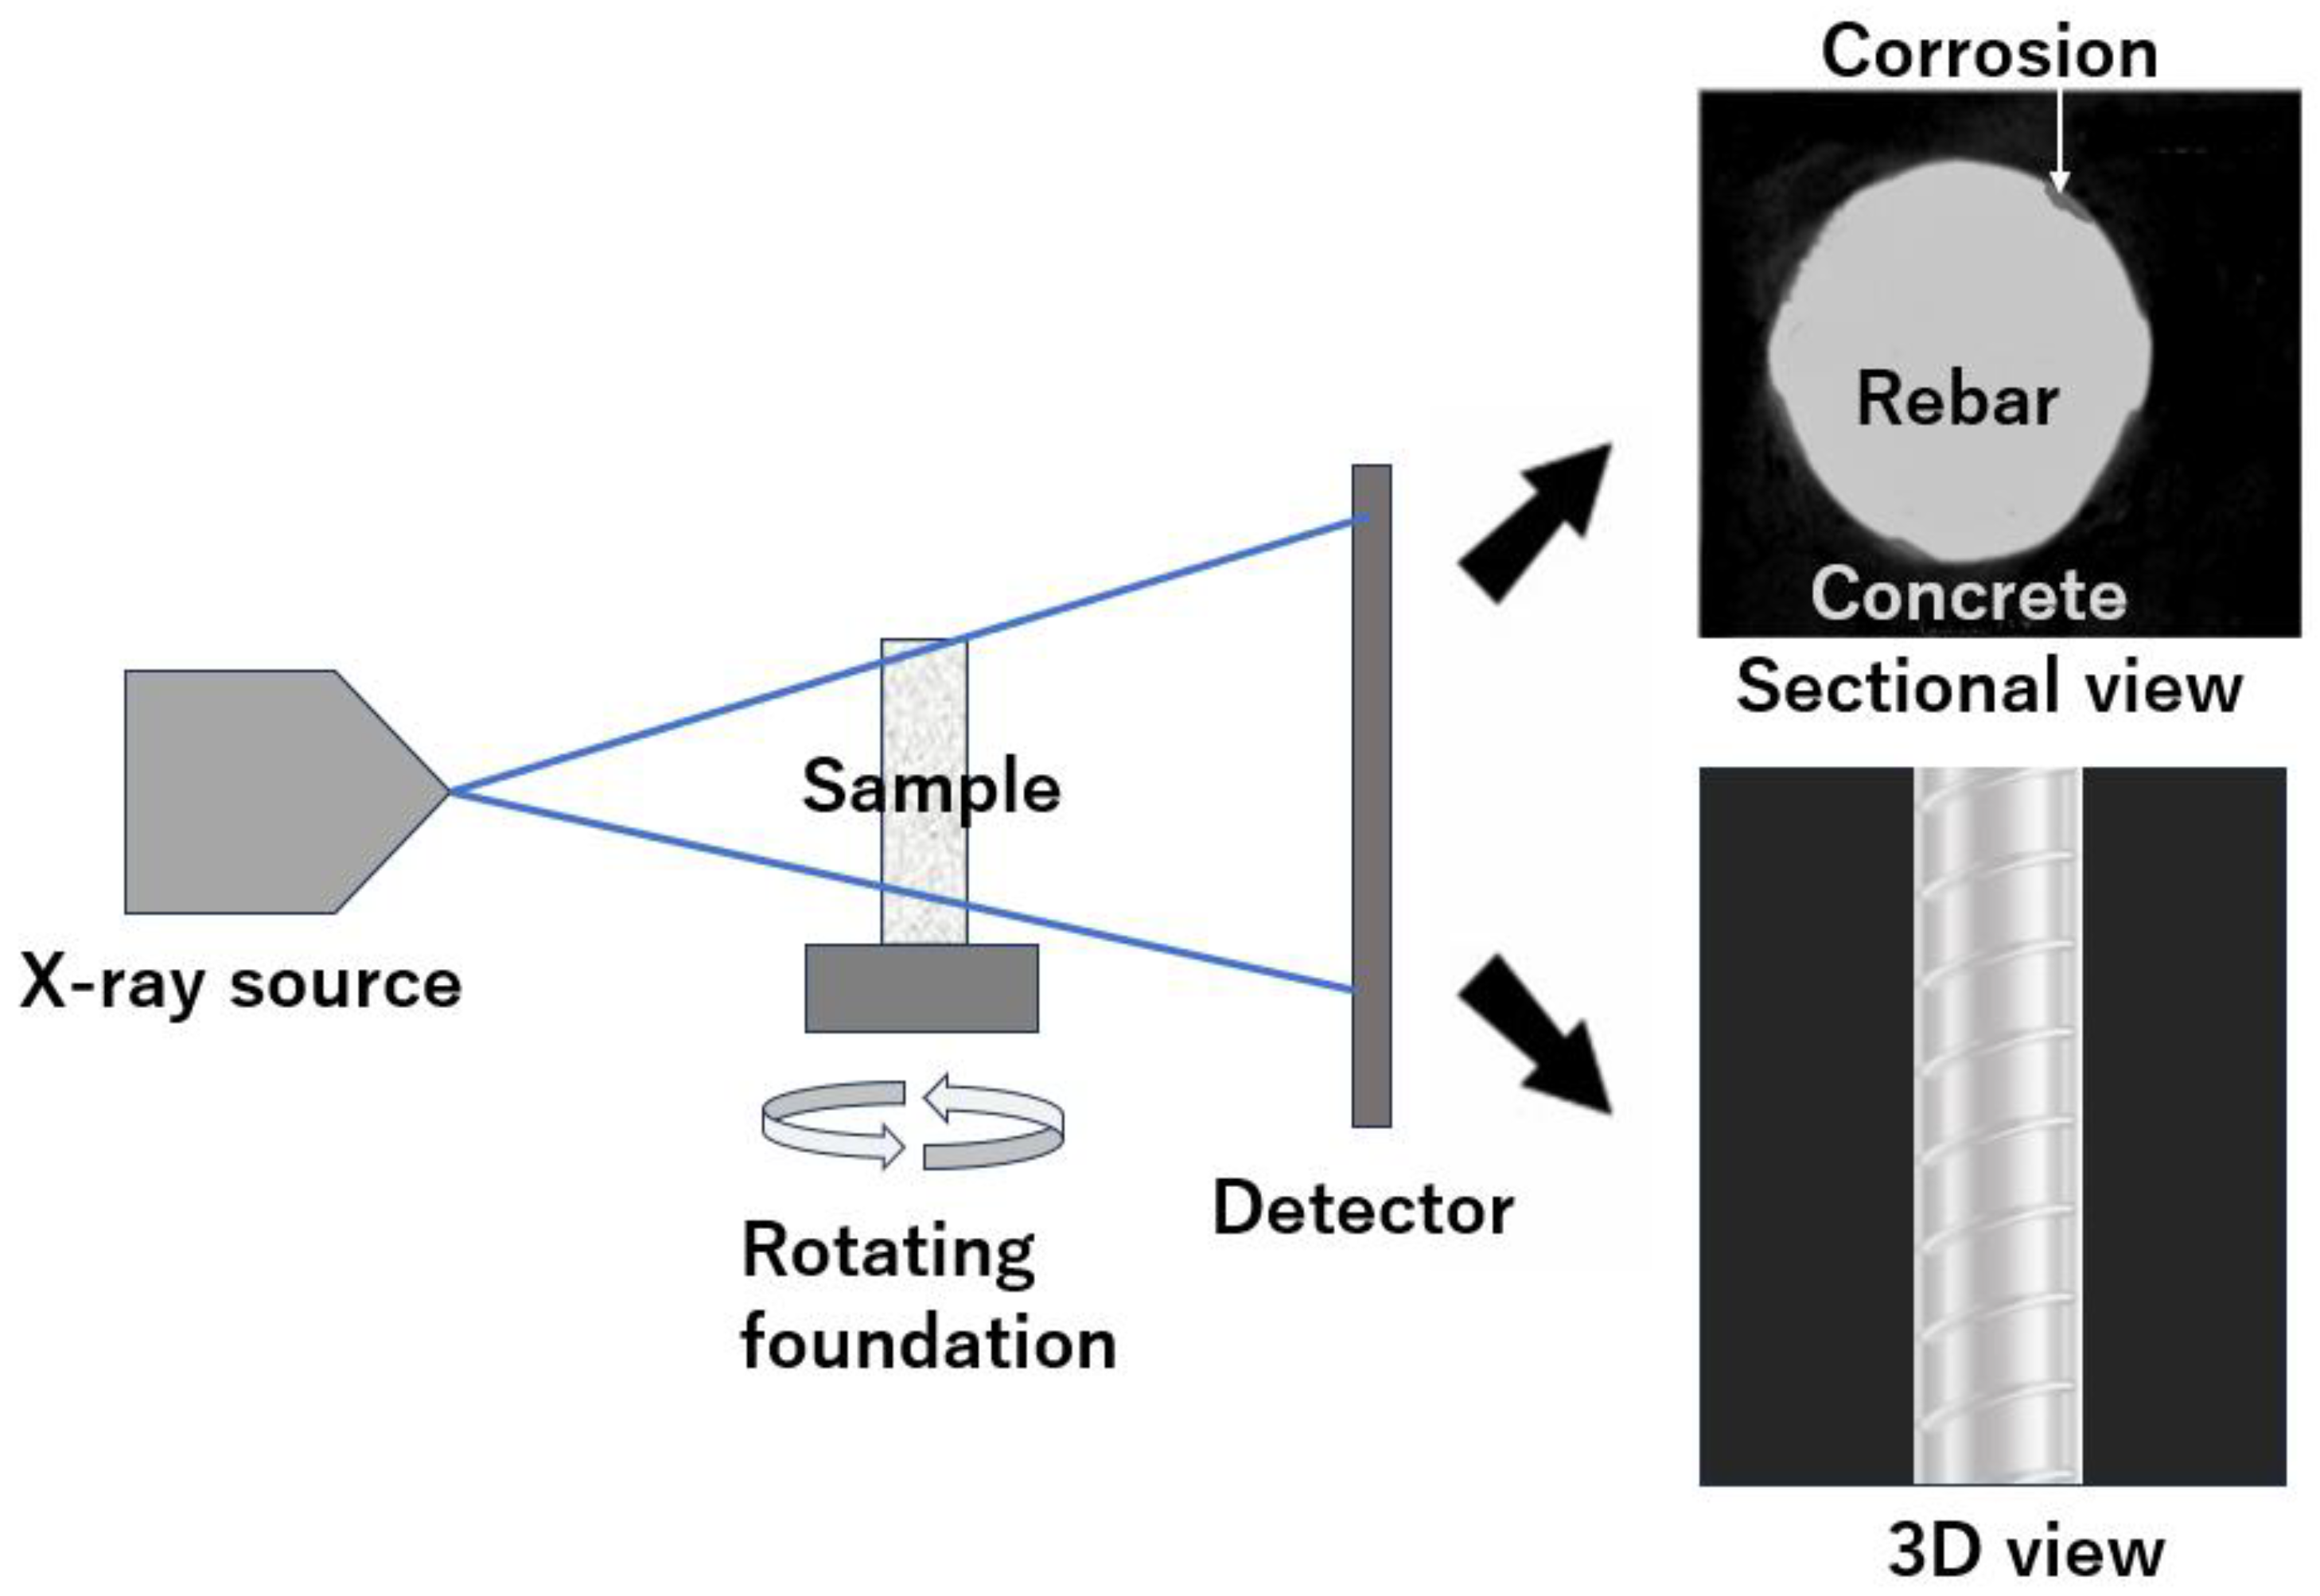
Figure 8.
Setup of eddy current heating infrared thermography method to evaluate the corrosion of steel rebar.
Figure 8.
Setup of eddy current heating infrared thermography method to evaluate the corrosion of steel rebar.
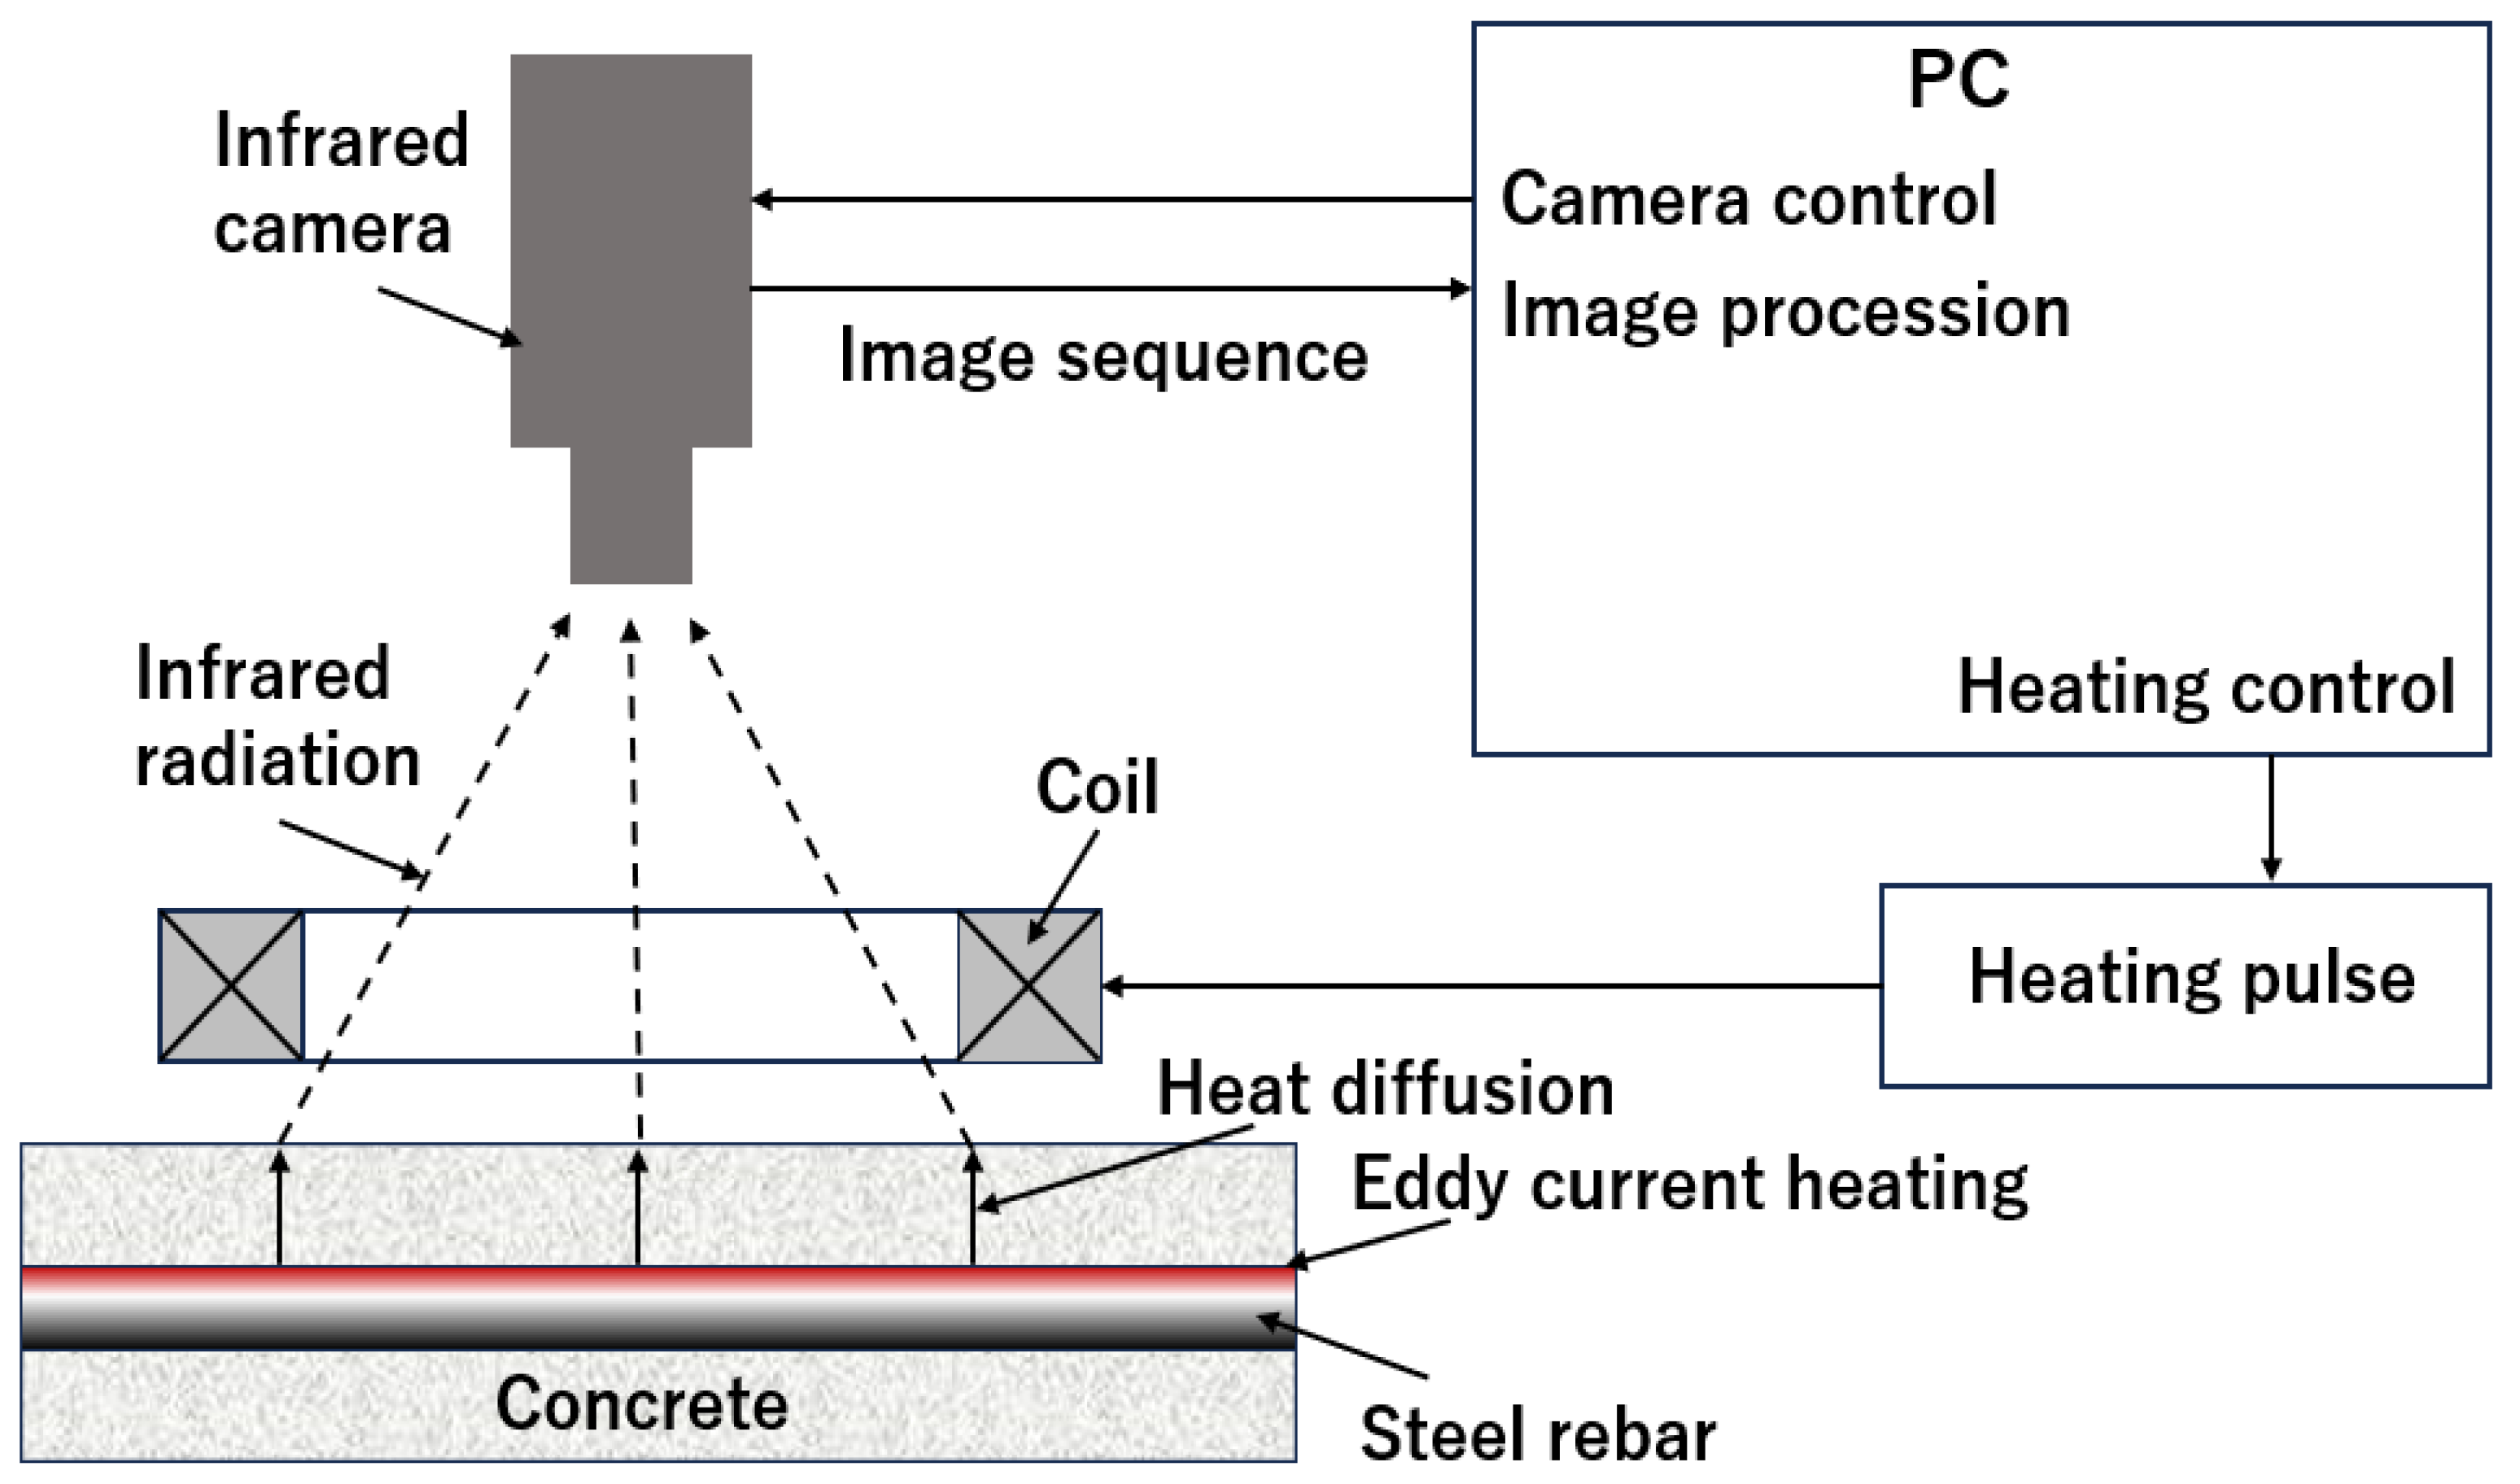
Figure 9.
Schematic diagram of ground penetrating radar for the evaluation of steel rebar. .
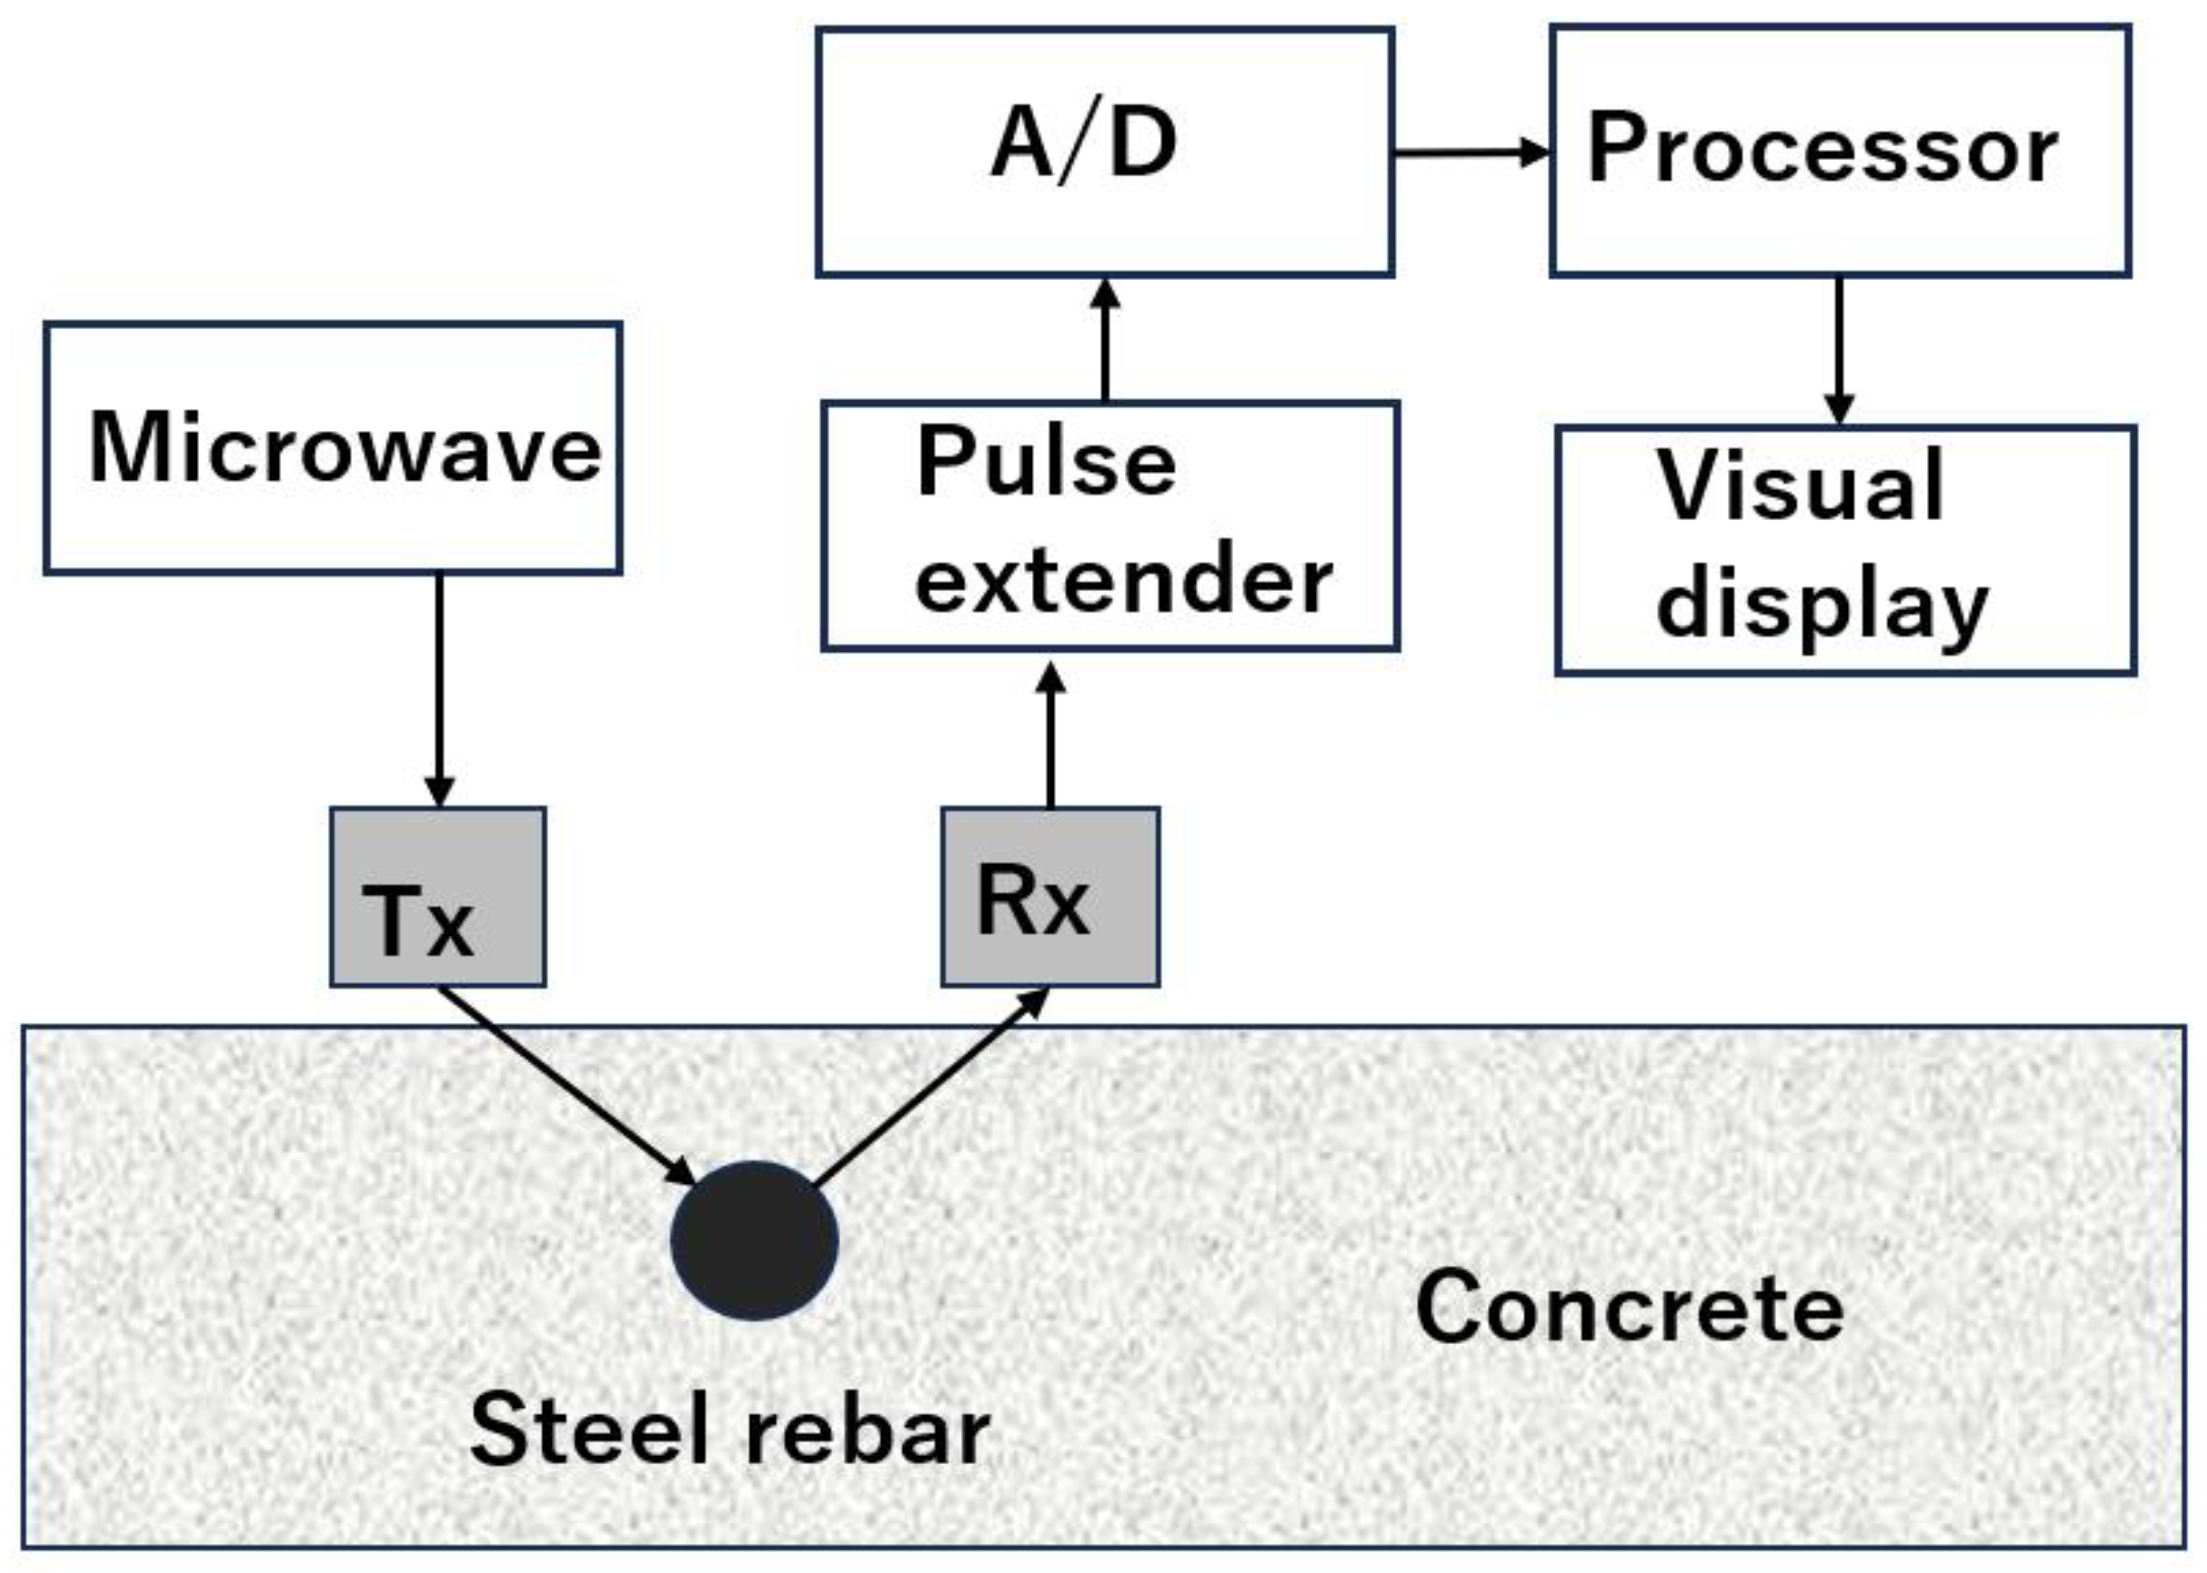
Figure 10.
Setup of magnetic flux leakage device for the evaluation of steel rebar. .
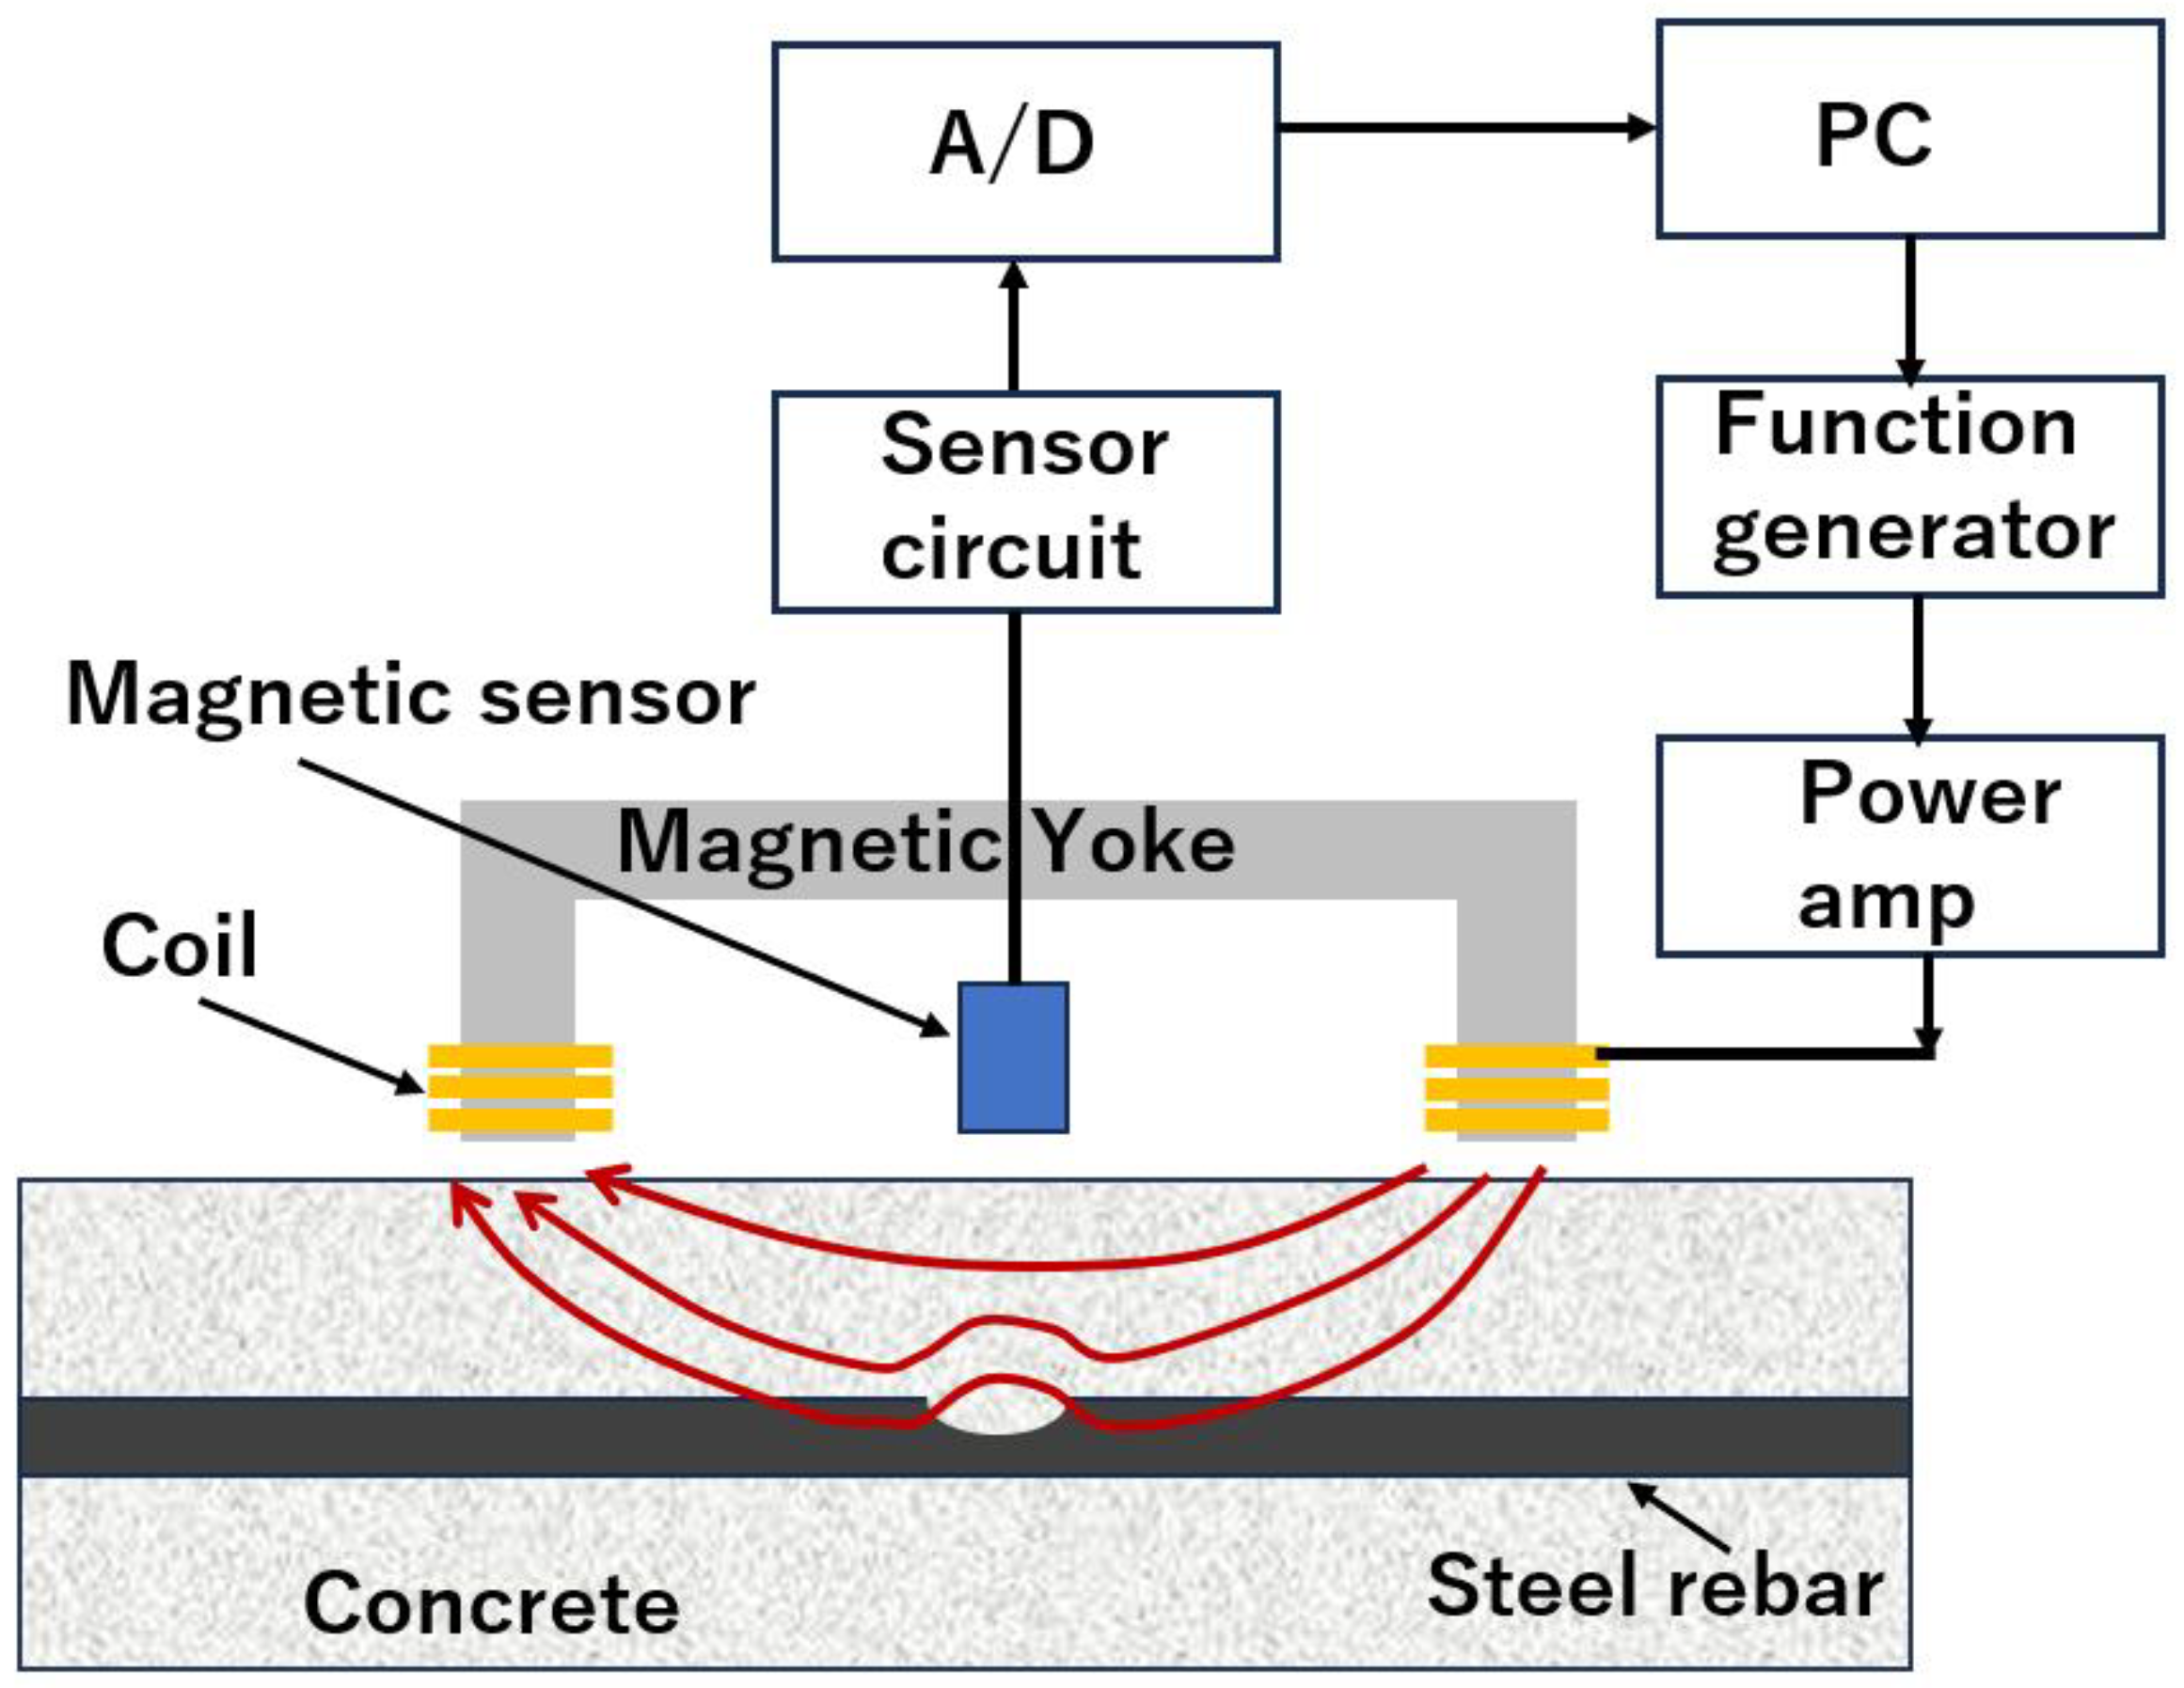
Figure 11.
Principle of the eddy current testing method for the corrosion detection of steel rebar.
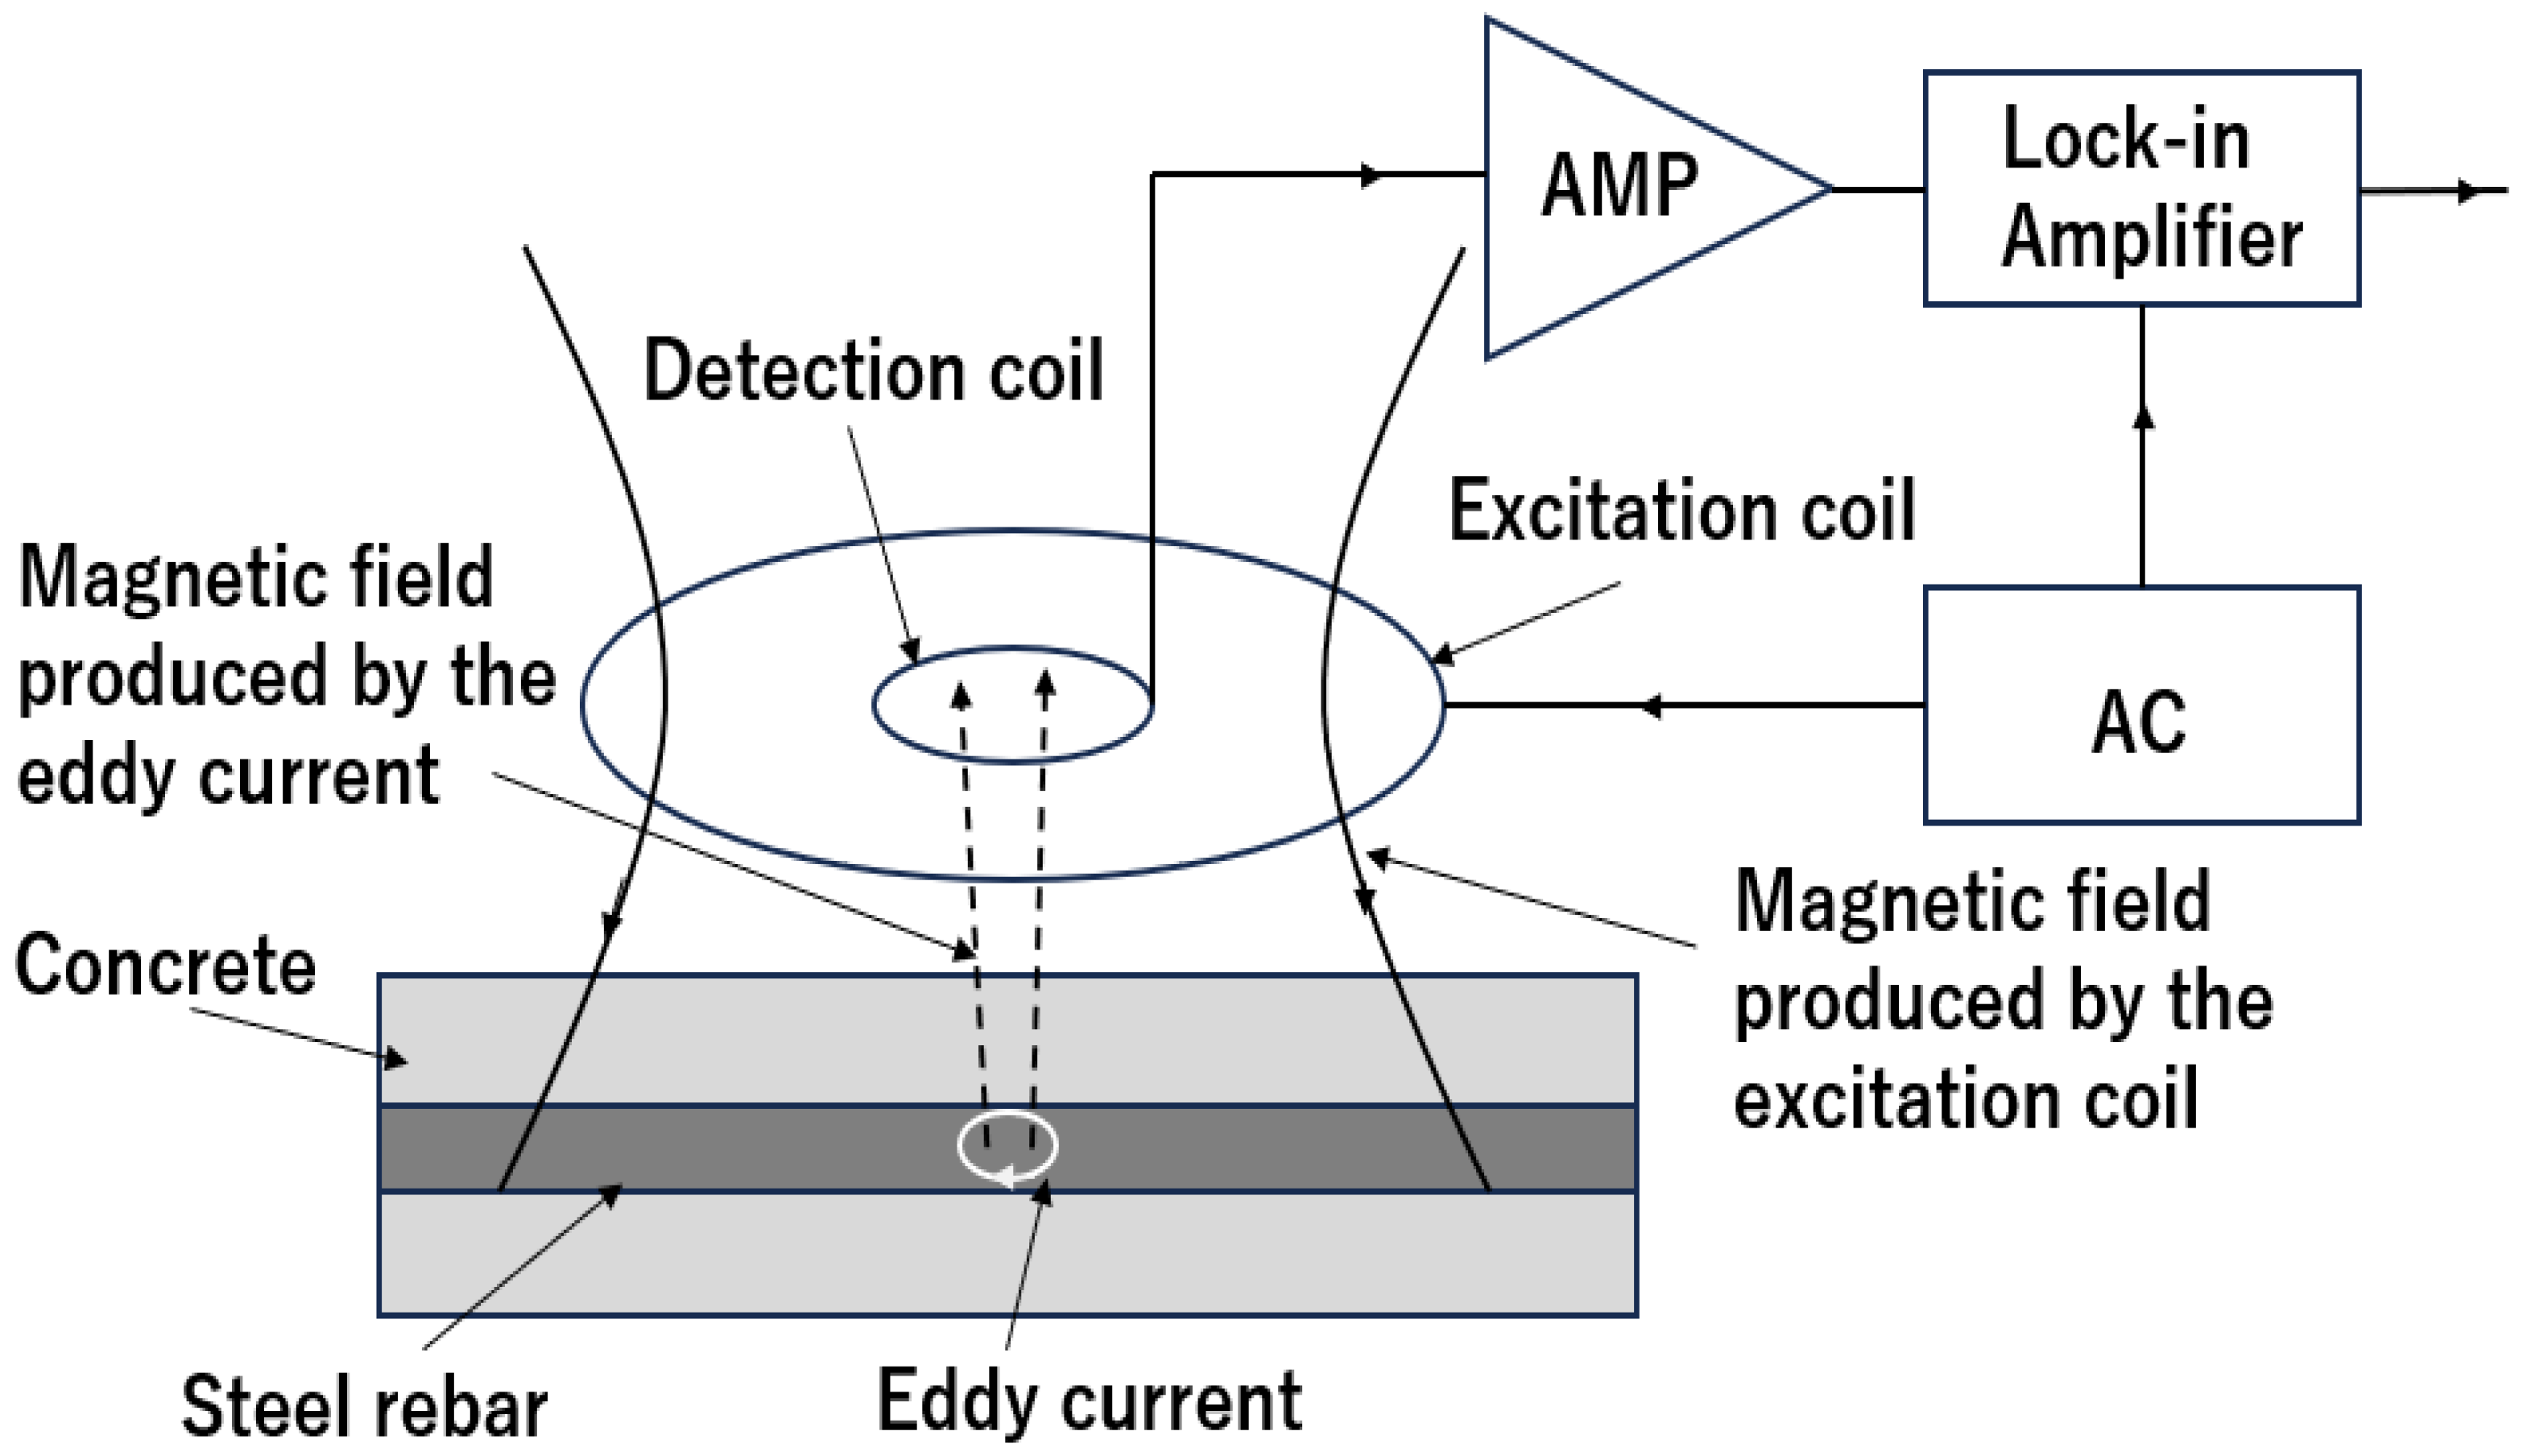
Figure 12.
Photo of the corrosion detection system with eddy current testing method.
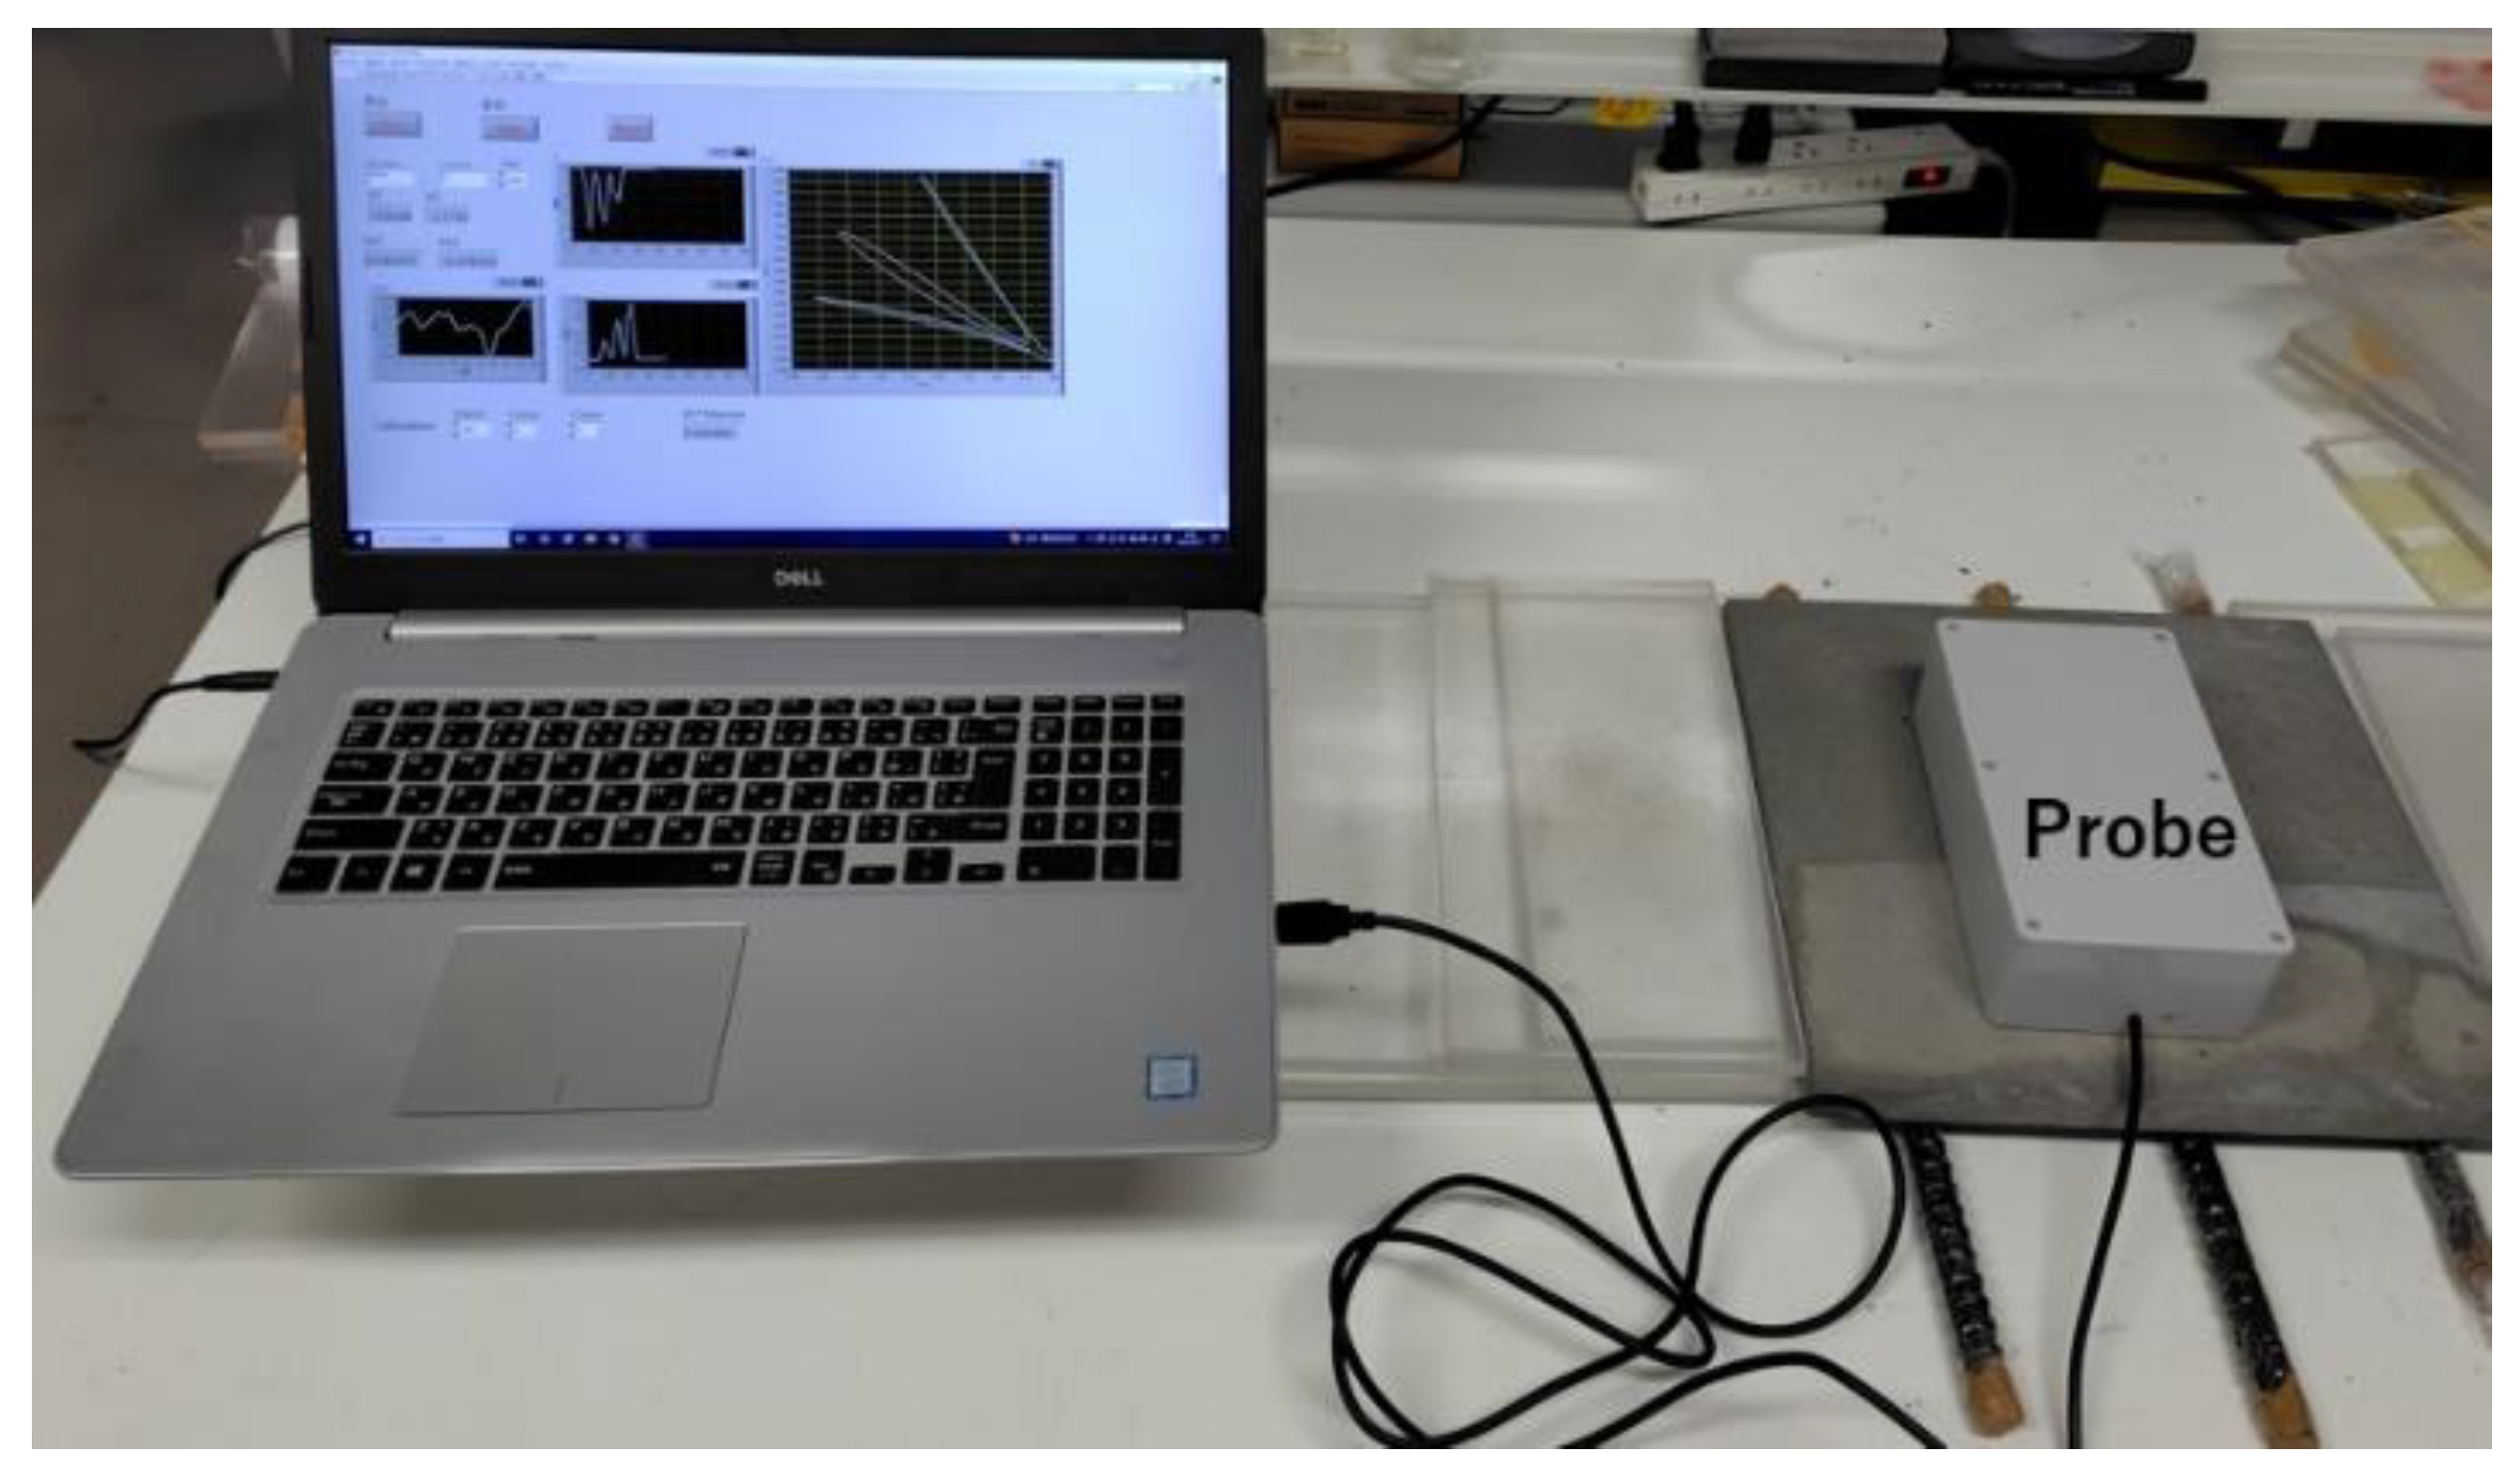
Figure 13.
Block diagram of the ECT system for the corrosion detection of steel rebar.
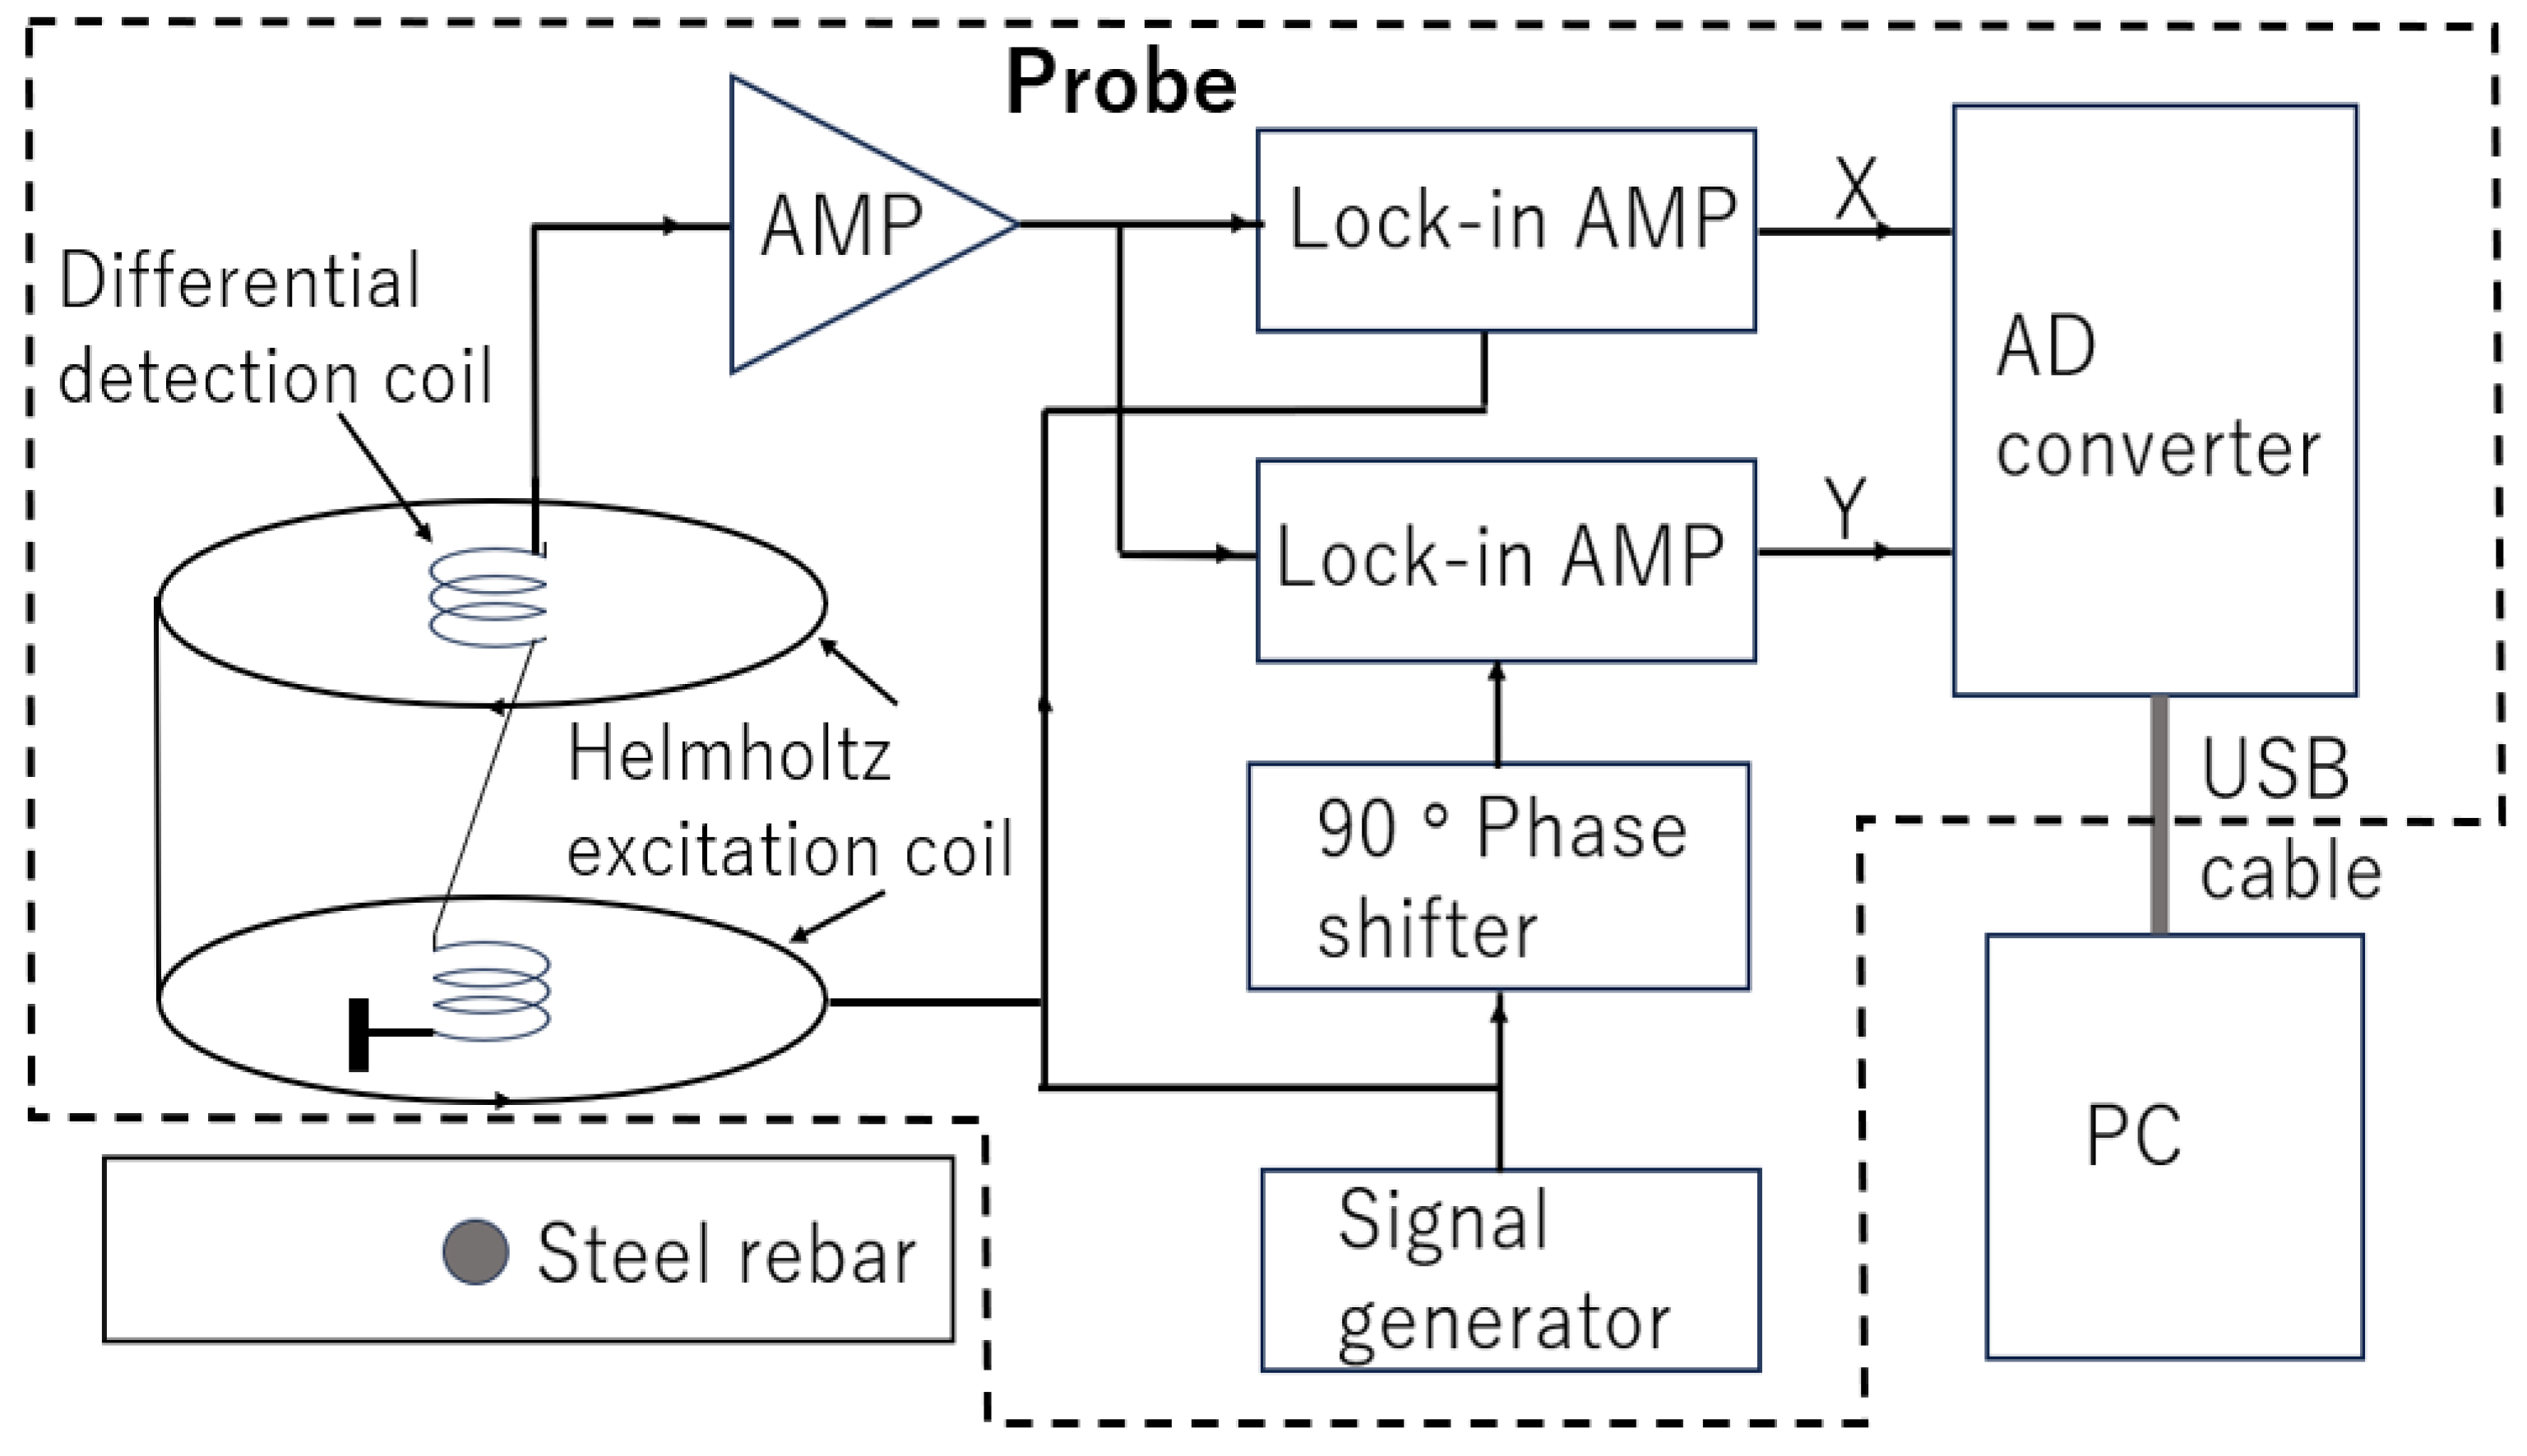

Table 1.
Corrosion condition related with HCP measurements.
| Potential value (mV vs. SCE) |
Potential value (mV vs. CSE) |
Corrosion condition |
|---|---|---|
| ≥ -125 | ≥ -200 | Low (10% risk of corrosion) |
| -126 to -275 | -201 to -350 | Intermediate corrosion risk |
| -276 to -425 | -351 to -500 | High (<90% risk of corrosion) |
| ≤ -426 | ≤ -501 | Severe corrosion |
Table 2.
Relationship between the condition of steel rebar and the corrosion current.
| Corrosion current (Icorr) | Condition of steel rebar |
|---|---|
| < 0.2 µA/cm2 | No corrosion expected |
| 0.2 ~ 1.0 µA/cm2 | Corrosion possible in 10 -15 years |
| 1.0 ~ 10 µA/cm2 | Corrosion expected in 2-10 years |
| > 10 µA/cm2 | Corrosion expected in 2 years or less |
Table 3.
Comparison of different steel rebar corrosion evaluation methods.
| Method | Principle | Advantages | Limitations | Applications |
|---|---|---|---|---|
| Electrochemical | Measures electrochemical signals |
Quantitatively measure corrosion rate |
Requires physical contact; furface preparation; localized measurement |
Bridge decks, parking structures |
| Ultrasonic | Sends stress waves and measures reflection |
Penetrates deep; measures thickness and defects |
Requires coupling medium; surface conditions affect signals |
Large structures, internal defect mapping |
| X-Ray tomography |
Uses X-rays to produce 3D view |
Detailed internal view; high resolution; quantitative |
Requires specialized equipment; limited size; radiation safety |
Small components, laboratory investigations |
| Infrared thermography |
Measures surface temperature; abnormalities |
Large area scanning; non-contact; fast |
Shallow depth; Influenced by surface conditions, solar loading |
Bridge decks, large structures |
| GPR | Detects reflection of electromagnetic signals; | Measures depth, abnormalities; large area scanning |
Affected by moisture, material properties |
Bridge decks, highway structures |
| MFL | Magnetic flux disturbance signals |
Localized pitting; cross-section reduction of steel rebar |
Requires strong magnet; limited depth; less effective through thick covers |
Pipelines, rebars, storage tanks |
| Eddy current | Measure the eddy current induced by AC magnetic field | Small defects; initial corrosion; non-contact; |
Shallow depth; influenced by nearby conductive materials |
Bridge decks, aircraft components, small rebars |
Disclaimer/Publisher’s Note: The statements, opinions and data contained in all publications are solely those of the individual author(s) and contributor(s) and not of MDPI and/or the editor(s). MDPI and/or the editor(s) disclaim responsibility for any injury to people or property resulting from any ideas, methods, instructions or products referred to in the content. |
© 2025 by the authors. Licensee MDPI, Basel, Switzerland. This article is an open access article distributed under the terms and conditions of the Creative Commons Attribution (CC BY) license (http://creativecommons.org/licenses/by/4.0/).
Copyright: This open access article is published under a Creative Commons CC BY 4.0 license, which permit the free download, distribution, and reuse, provided that the author and preprint are cited in any reuse.


