Submitted:
31 October 2023
Posted:
02 November 2023
You are already at the latest version
Abstract
The present work analyzes the behavior in terms of corrosion resistance of three reinforced concrete formulations over a period of 1 year. The samples were accompanied by creating a monitoring methodology using the Electrochemical Impedance Spectroscopy (EIE) technique, working only with the real component over time. Three mixtures were used, one conventional without pozzolanic addition (REF) and two others with pozzolanic additions, rice husk ash (RCA) and metakaolin (MK). Prototypes were created and exposed to the action of a 165g/l NaCl sodium chloride solution. The characterization of the materials was carried out by determining the chloride diffusion profile (ASTM 1556), analyzing images using tomography and with the support of analytical techniques such as x-ray fluorescence and x-ray diffraction. The monitoring methodology using the EIE demonstrated the positive effect of the insertion of pozzolans, rice husk ash (RCA) and metakaolin (MK), by delaying the process of chloride diffusion in the concrete, resulting in greater resistance to corrosion. The EIE also showed that the active mineral addition in concrete, of aluminum-silicic composition (MK), had a predominant protective effect on the steel//concrete interface against the attack of chloride ions.
Keywords:
reinforced concrete
; corrosion
; chlorides
; pozzolan.
1. Introduction
Concrete is one of the most used materials in the construction industry. The presence of reinforcing steel makes it a composite material, of great importance from the beginning of its use in ancient Rome to the present day. For proper use, standards today require adequate performance based on structural parameters, which include structural safety, functionality and durability. These parameters, over time, can be affected by the reinforcement reinforcement corrosion process.
Addressing the durability aspect, several researchers have shown that the criteria for its parameterization are still not sufficient to guarantee service life [1,2,3], being simply based on the minimum cement content, w/c ratio, pore -ity, minimal coating and in some patterns applied to the diffusion process of chlorides. These criteria remain, implying a significant inaccuracy when projecting the service life and supporting alternatives for monitoring and controlling deterioration processes that may affect the material, being insufficient to define the durability of a structure.[4]
According to Tutti in 1982 [5], service life can be described as the time elapsed until the rupture of the passive layer that protects the steel reinforcement in contact with the concrete against corrosion. This rupture occurs due to the absorption of chloride that spreads from the external environment through the concrete, reaching the steel locally. Carbon dioxide has a similar effect by reducing the pH of the concrete, compromising the passivation conditions. Based on this concept, understanding the chloride diffusion process is considered essential for durability estimation. This process can be monitored with the help of electrochemical techniques, including Electrochemical Impedance Spectroscopy (EIS). Some durability criteria can be proposed based on parameters obtained using the EIA technique. These parameters cover information about the stage of evolution of the concrete/steel set, over the time of exposure to chloride ions, allowing the monitoring of the process until the incidence of corrosion, making it possible to reduce the uncertainties inherent to predictive criteria of durability, giving support, to correlate with structural integrity analyses.
Other electrochemical techniques are used to monitor durability parameters, for example qualitative measurements of potential, to know the electrochemical potential (E) of steel at its interface with concrete. These measurements allow inferring the existence of corrosion and passivation conditions, based on concepts of equilibrium thermodynamics. Measurements over time inform the evolution of this potential, which, according to the criteria of the ASTM C876 standard, can be translated in terms of corrosion risks. Another technique used is based on the measurement of resistance to polarization, which would quantify the intensity of the corrosion process, informing a parameter defined as corrosion current (Icorr), which leads to an estimate of corrosion rates mm/year, based on Faraday's law [4].
However, corrosion remains a threat to structures located in coastal areas because of chloride ions. This form of corrosion occurs quickly and punctually, where initiated, it is detectable by conventional methods only in advanced stages, with the structure often at risk. [two]. In this context, EIE gains importance because it is a technique that indicates changes that occur in the electrolyte (in this case, the concrete), and in the passive layer formed between the steel and the concrete. It is one of the electrochemical techniques with the greatest potential for application and may eventually be used to monitor the evolution of materials in the field.[6]
Considering that EIE is a technique widely used in the area of corrosion, being non-destructive in nature (NDT), it can also be used in the area of civil construction with regard to corrosion in concrete. It provides a set of parameters, which, once understood and correlated, has the capacity to analyze the dynamics of deterioration of concrete structures, in a predictive way, allowing to anticipate demands for intervention in structures before the incidence of critical corrosion processes. Additionally, it allows determining differences in behavior between materials, clearly pointing out materials with better performance in terms of corrosion resistance.
With the consolidation of parameters obtained from testing materials under controlled laboratory conditions, it will be able to subsidize the development of field methods for diagnosing and monitoring structures on a real scale. More consistent results and predictive methods are now available for service life estimation models.[6] The objective of this work is to develop a methodology for monitoring the process of chloride absorption by concrete, using electrochemical impedance spectroscopy. This methodology will be used to investigate the process over time triggered by the absorption of chloride ions, allowing to comparatively identify the characteristics of a conventional concrete and two concretes modified by additions of active mineral particles (pozzolana).
2. Experimental Study
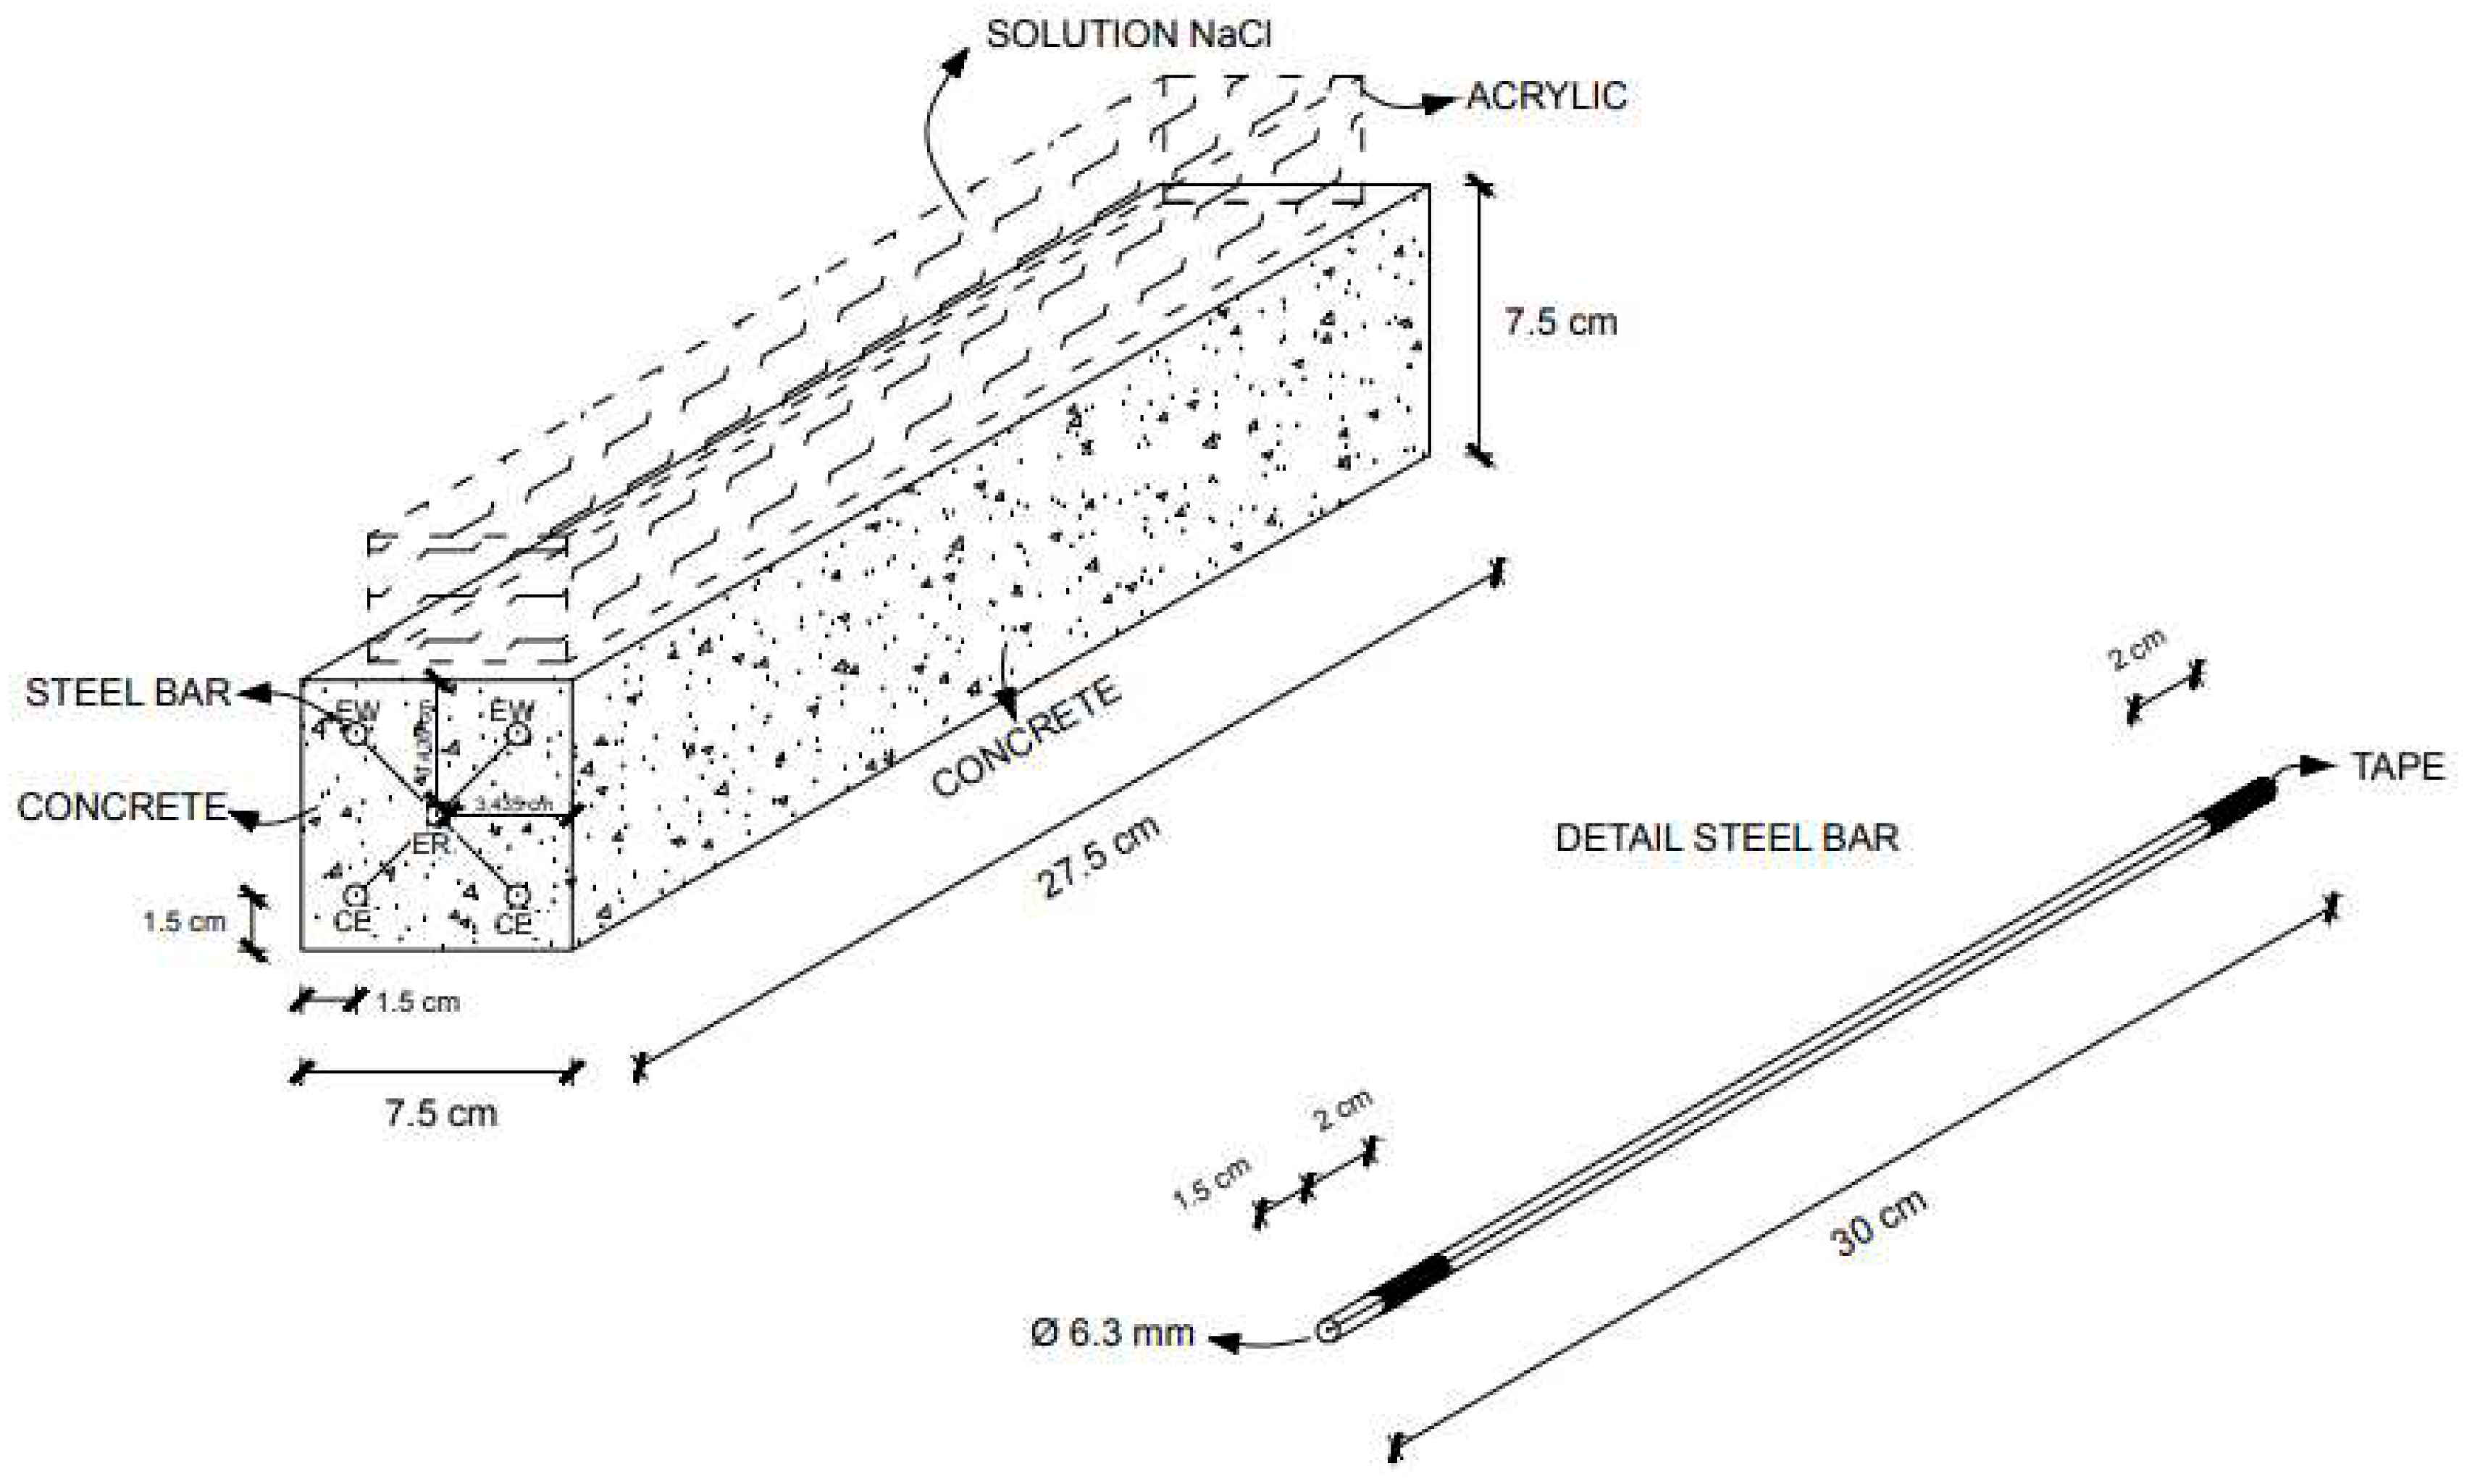
The experimental program of the present work was based on the design and construction of a bench test cell, designed to perform Electrochemical Impedance Spectroscopy (EIS) measurements. The necessary electrochemical instrumentation was coupled to a specimen with geometry similar to a reinforced concrete beam, on a small scale, using longitudinal carbon steel bars capable of connection to a digital potentiostat. In this configuration, bars identical to the reinforcement ones, in CA-50 carbon steel, performed the function of working electrode (EW), reference electrode (ER) and counter electrode (CE).
On the upper surface of the rectangular bar, a container, or cell, containing a NaCl solution at a concentration of (165g/l) was installed. The device described is shown in Figure 1. With this arrangement, it is possible to carry out electrochemical measurements over time, using steel bars as electrodes, with concrete as the electrolyte. From the upper surface, there is a diffusion process of chloride through the concrete, in a downward direction and in the direction of the bars that act as working electrodes. The existing electrochemical conditions at the concrete/steel interface can be evaluated, as well as the evolution of the electrolyte characteristics.
The evolution over time of samples of the three materials was monitored using the (EIE) technique over a period of 1 year. 3 types of concrete were prepared, one of reference (REF) without additions, a second with the addition of 10% of cement replacement by rice husk ash (RCA), a third with the addition of 10% of replacement of rice metakaolin (MK), both active mineral additions, called pozzolans.
3. Materials and Methods
3.1. Mix Desing
The concrete was projected using the methodology recommended by IPT/EPUSP [7], which allows, based on a mathematical equation obtained through the dosing diagram and considering the mortar content, to determine, in unitary weight, the content of each one of the component materials (cement, sand, stone). Considering for all mixtures used in this work a water-cement ratio - w/c - equal to 0.7. The high w/c ratio was defined to obtain a high porosity microstructure, since the diffusion phenomenon is very slow for lower porosities.
The chemical composition of the carbon steel (CA-50S) used in this study is presented in Table 1, determined by optical emission spectrometry.
3.1.2. Cement
Initial high strength Portland cement (CP-V ARI HOLCIM) was characterized by X-ray fluorescence analysis. Table 2 shows the chemical composition of the cement obtained by this method.
3.1.3. Pozzolans
Pozzolans are active mineral additions which, when incorporated into Portland cement, can generate the same hydration products as cement. In its chemical composition, its amorphous compounds are responsible for controlling the greater or lesser formation of products by the hydration reaction. In the present study, the mineral additions responsible for the hydration reaction will be reactive silica SiO2 and reactive alumina (Al2O3) [8].
The results of the structural analysis of the CCA and MK pozzolans are presented in Tables 3 and 4. It was carried out using the Fire Loss X-Ray Fluorescence technique (XRF/DRX).
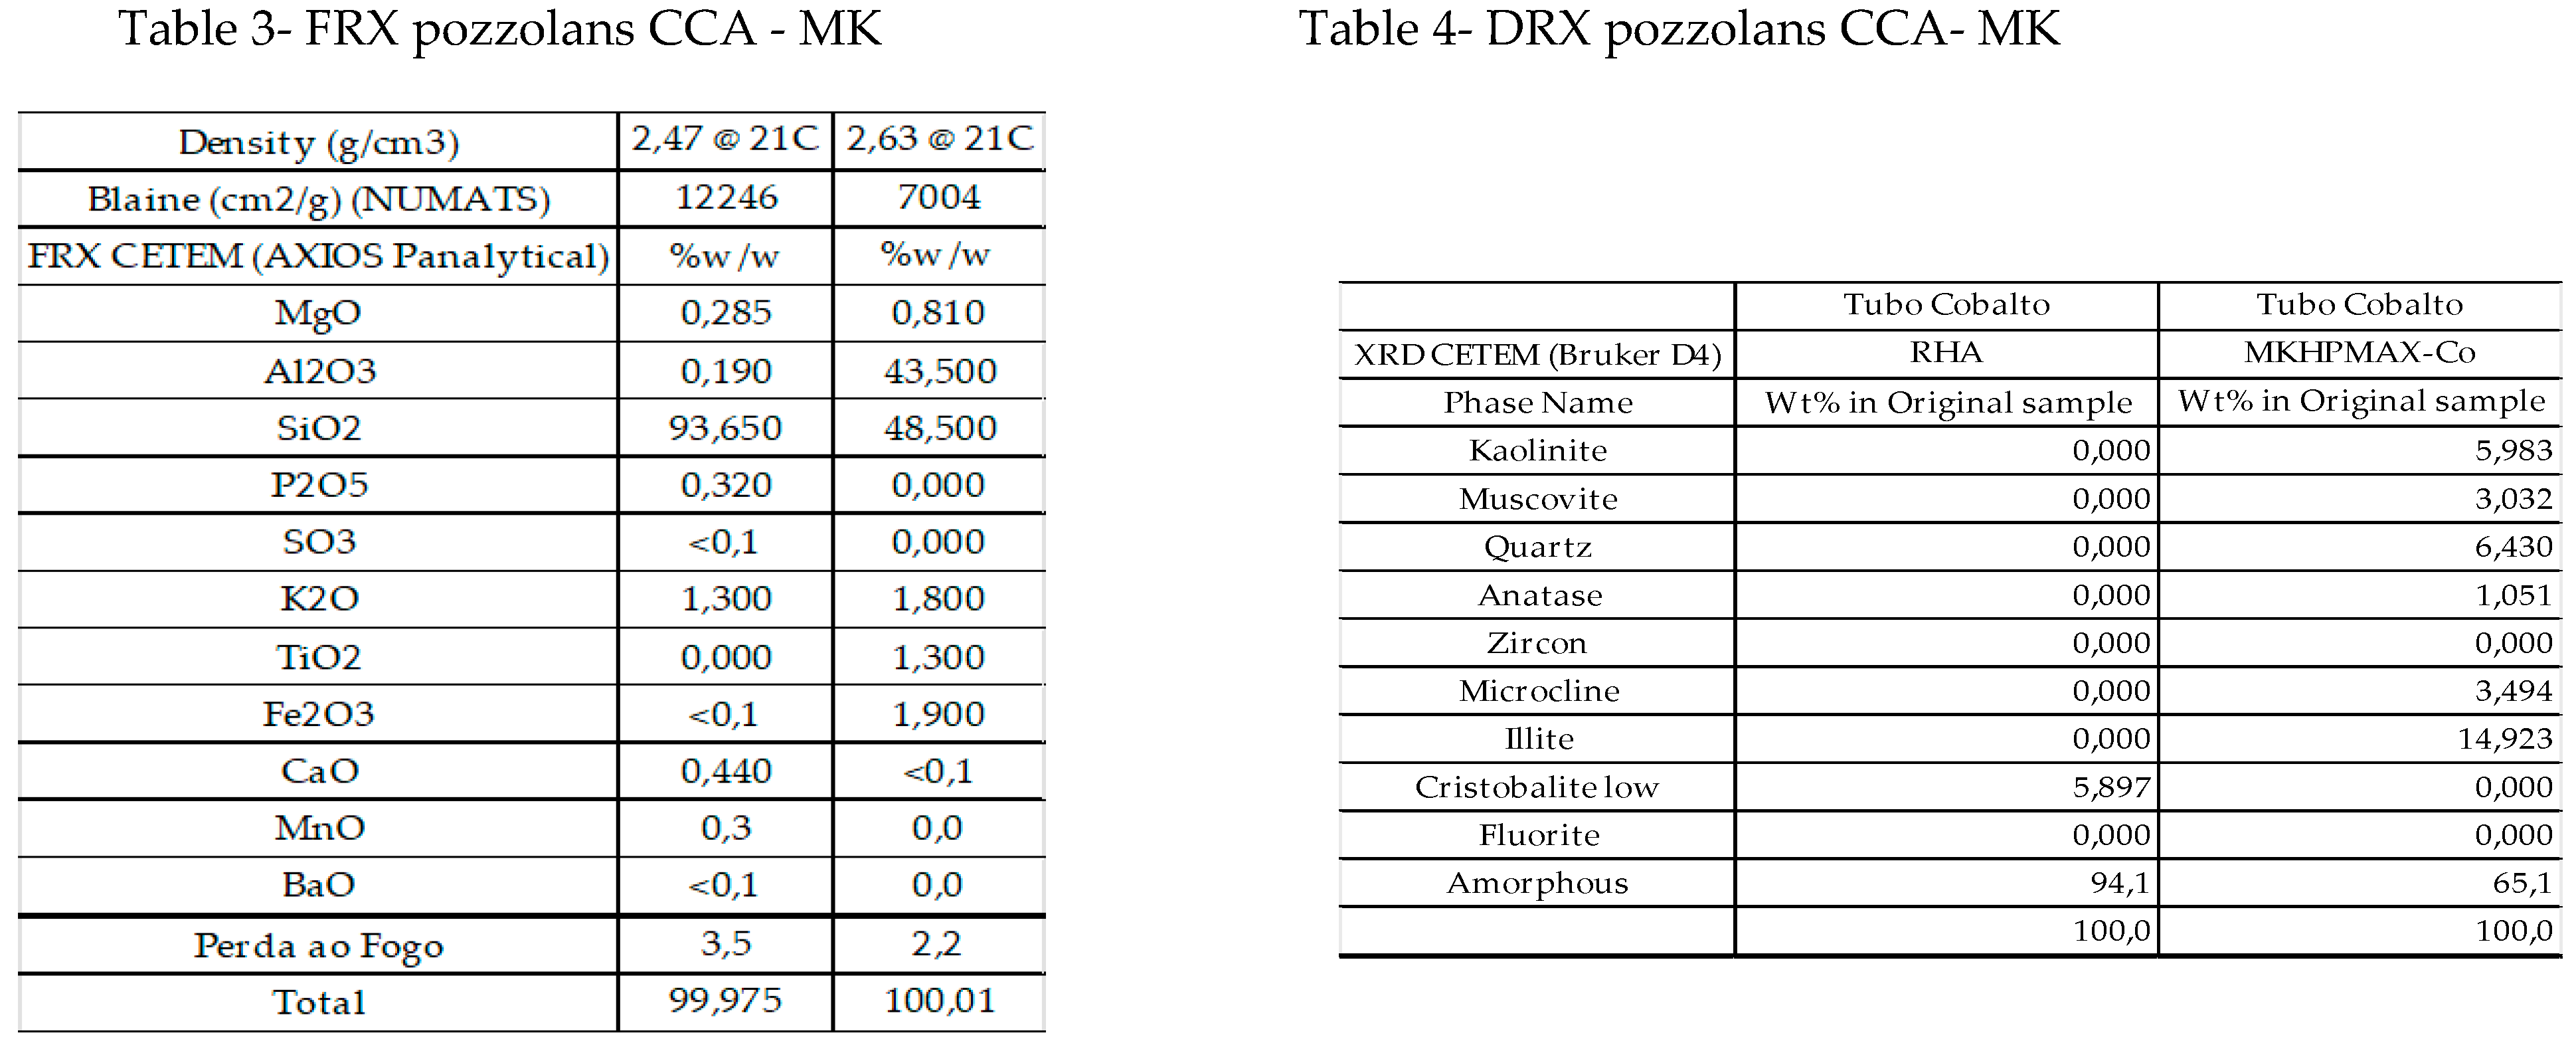
CETEM laboratories/ university city.
After the characterization of all the materials, also using the IPT/EPUSP method (HELENE and TERZIAN, 1992), the reference trait was determined, with the result shown in Table 5.
1-Trace REF - Cement consumption - 308 kg/m3 cement, 825.13 kg/m3 sand, 1004.70 kg/m3 gravel.
2-Trace CCA - 277 kg/m3 cement, 30.8 kg/m3 pozzolana CCA, 825.13 kg/m3 sand, 1004.70 kg/m3 gravel.
3- Trace MK - 277 kg/m3 cement, 30.8 kg/m3 pozzolan MK, 825.13 kg/m3 sand, 1004.70 kg/m3 gravel.
The three concrete mixtures were processed in a vertical axis mixer. A similar procedure was used in the production of the three concretes, adding the step of placing the pozzolanic additions. The densification of the concrete in the forms was carried out on a vibrating table. One day after molding, the samples were placed in a humid chamber (temperature 24oC and 70% relative humidity), remaining in cure until 28 days of age. After a curing period of 28 days in a humid chamber, tests of aged specimens were used to carry out the compressive strength tests.
It was determined that 5 cylindrical specimens (Ø7.5 cm x W 15 cm) would be tested for each material, to carry out a mechanical test of resistance to axial compression. For the corrosion study (EIE), 6 prismatic samples (7.5 cm x 7.5 cm x 27.5 cm) were prepared. For the chloride accelerated diffusion test, 6 samples were used for each trait. For the tomographic examination, 6 samples per mixture were used. In total, 69 concrete samples were used in the experimental work.
The evaluation of the accelerated diffusion process of chloride in the three materials was carried out in accordance with ASTM 1556. The standard indicates that the analysis be carried out from a concrete sample exposed to a NaCl environment for a period of 35 days, being determined -Ned the chloride profiles created in 5g samples of concrete, extracted at different depths. In this work, a potentiometric titrator Metrohm Titrando 805 was used for the detection and dosing of chlorides, following the instructions of the AFREM TEST 1999, and the free chloride profiles were determined [9]. Subsequently, with the use of mathematical methods implemented in R computational language, it was possible to perform a non-linear regression, based on Fick's second law, analytically adjusting the free chloride profiles. Subsequently, the values of the apparent diffusion Da and the surface concentration Cs of the chlorides, for the stipulated exposure time, were obtained through an optimization, using equation 1.

3.3. Tomography to determine porosity
To determine the porosity of the samples submitted to the accelerated test according to the parameters of ASTM 1556, image processing resources obtained from a tomograph were used. The specifications of the equipment used are, GE-Vtomex / m tomograph, with a pixel size of 100 (µm). The tomography technique was chosen so as not to alter the microstructure of the concrete attacked by chloride ions, as a conventional test, such as the effective porosity test, would require water, which was avoided.
A methodology was created for performing tomography compatible with the accelerated test type of ASTM 1556, depending on the questions raised, before and after the attack of chloride ions. A scan was performed on the images of each sample, in the same diffusion direction of chloride ions. Histograms of pore descriptor parameters were constructed, determining their quantity, for the materials before and after chloride absorption. This information, based on image processing, offers parameters that can be correlated with the chloride diffusion process.
3.4. Electrochemical Impedance Spectroscopy - EIE
The EIE tests were carried out following the instructions of the Spanish standard for the accelerated test for natural chlorides (UNE 83992-1 EX), with some adaptations made in the present study (sample dimensions, NaCl concentration, geometry). As shown in Figure 2, the steel bars themselves were used to compose the working electrochemical cell. The two upper bars were used as working electrodes (EW), the reference electrode (ER) was the central intermediate bar, and the two lower bars were used as counter electrodes (CE). The measurement frequency sweep was fixed between 100 KHz to 10 mHz, with 7 points per decade. The potential signal amplitude was xx mV. The equipment used was an AUTOLAB (Figure 2) PGSTAT 302 with NOVA 10.1 software. The evolution of the 3 materials was monitored over time (1 year), using a NaCl solution with a concentration of (165g / l) as an aggressive agent in each of them.
Figure 2.
Details of the test body used for impedance testing.
Defining a nomenclature to detail the system on the surface of the electrode, as shown in Figure 3:
Figure 3.
Célula eletroquímica montada al AUTOLAB.
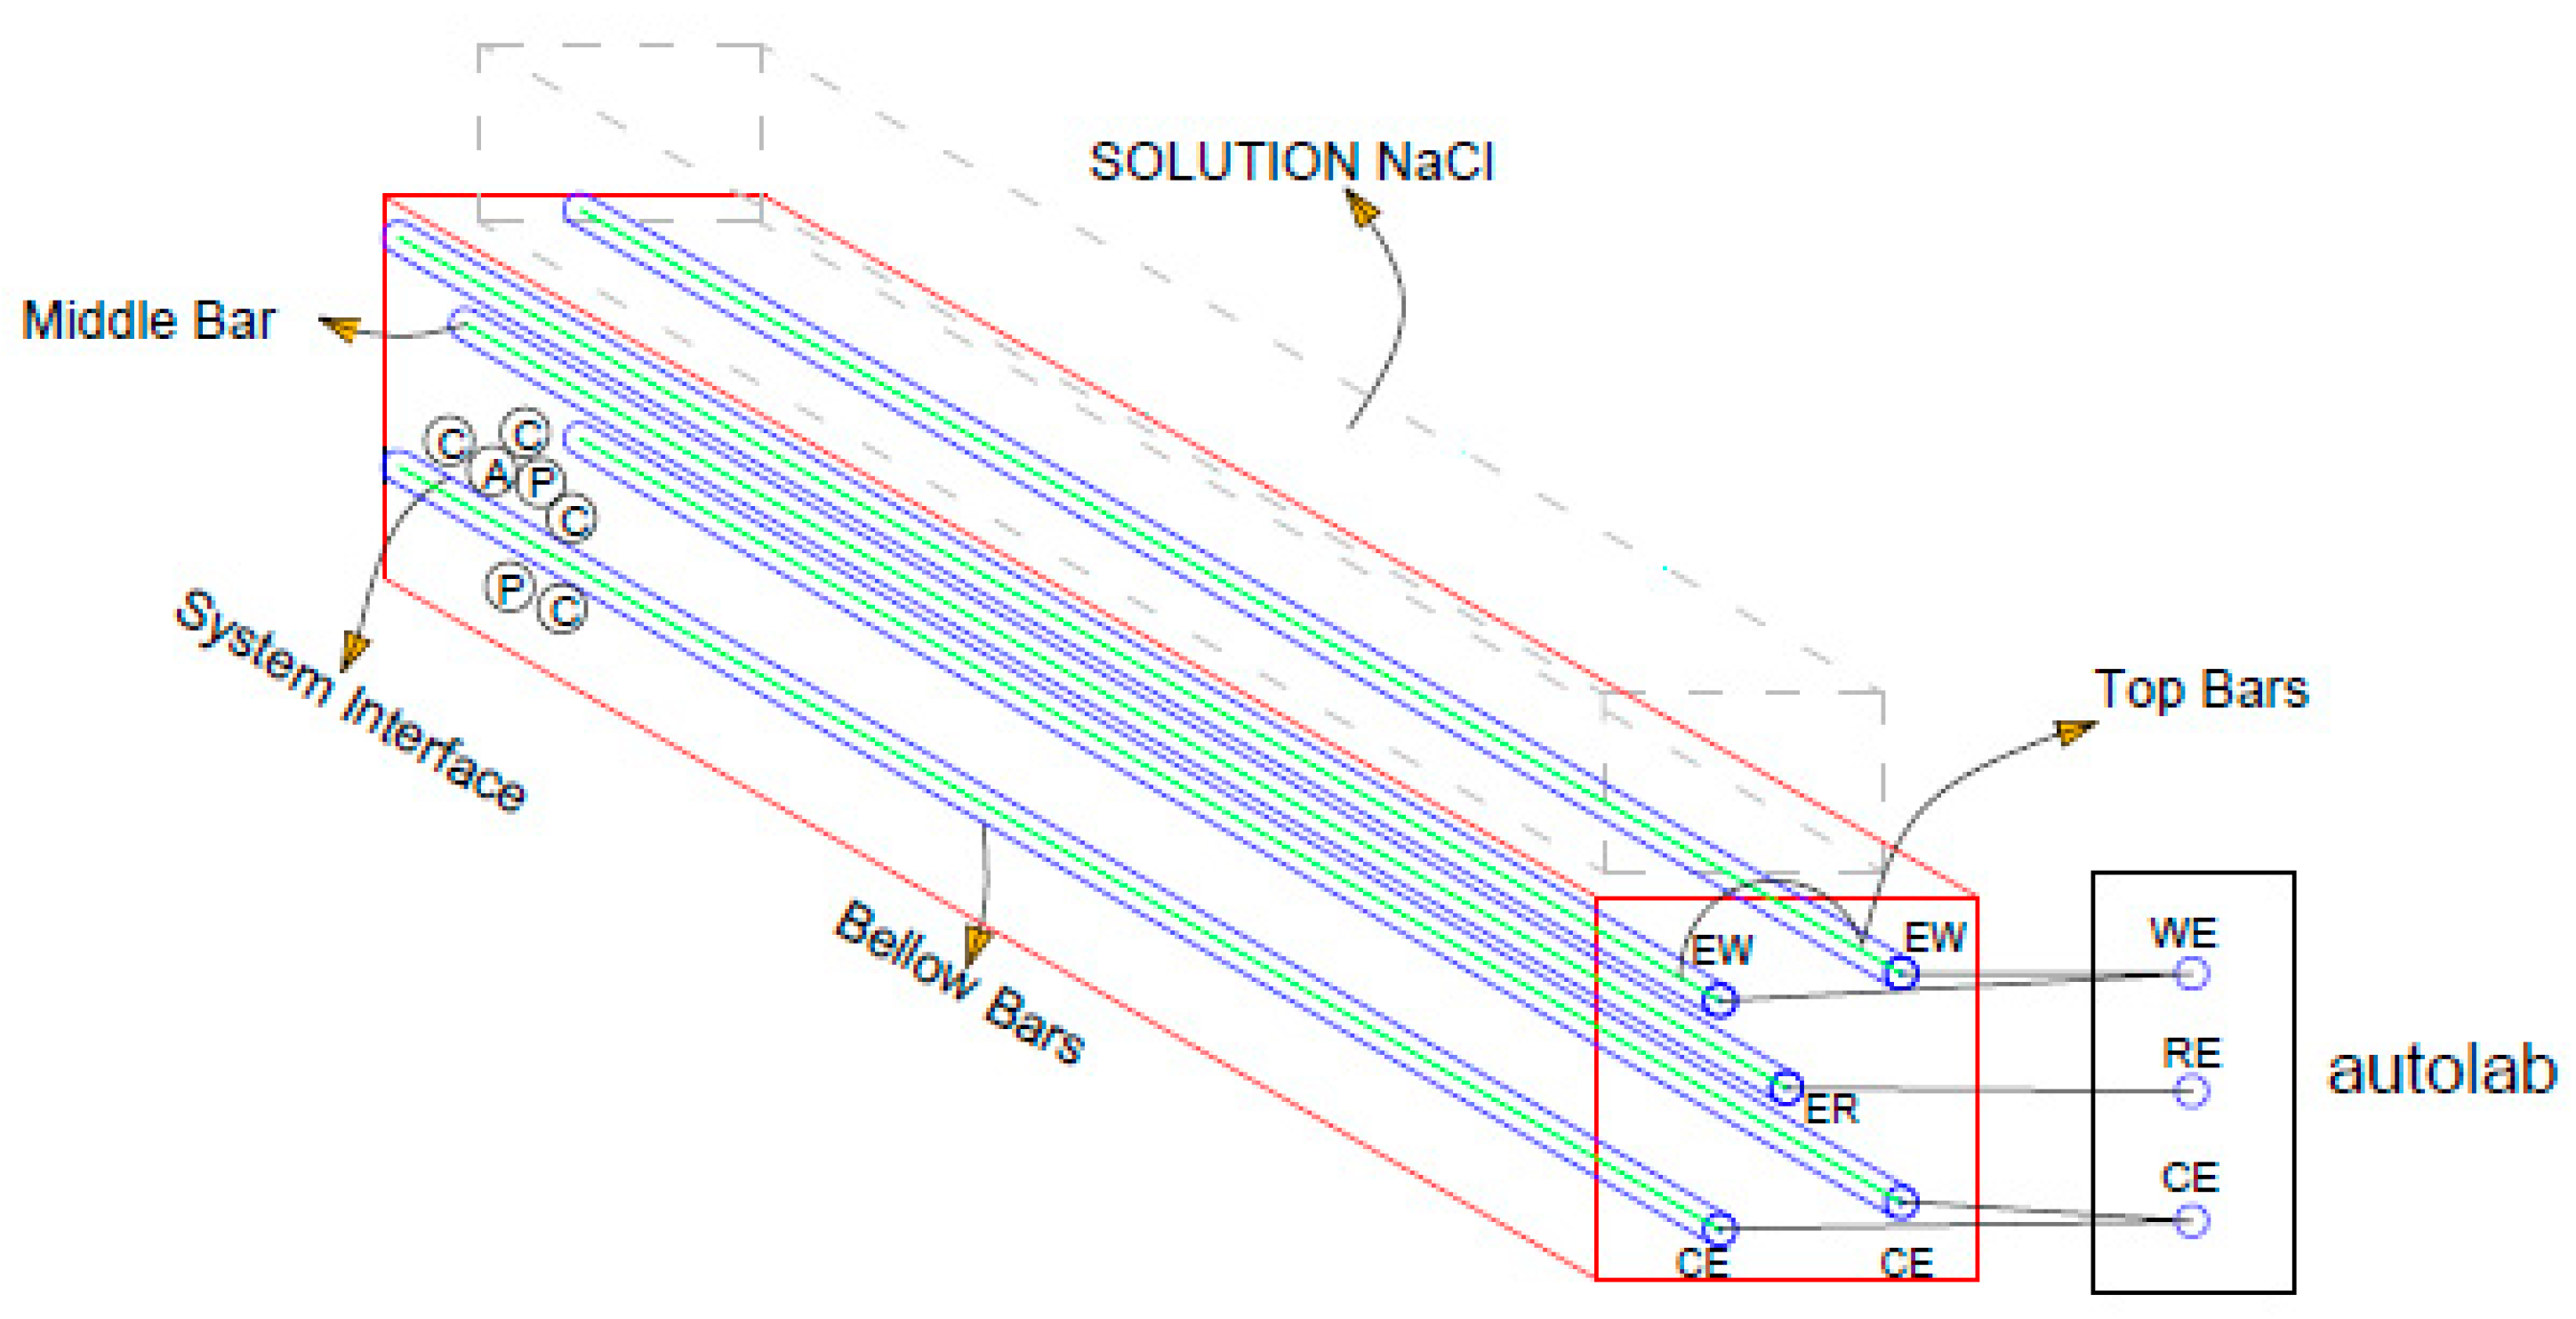
C- Agregado miudo, graudo e concreto.
A- Agua de poro/película de agua
P- Poros
I- Interface barra/concreto
The results obtained were represented as Nyquist diagrams, orthogonal representation of the real and imaginary components of the electrochemical impedance. This diagram is composed of measurement points corresponding to each frequency in the interval, with the measurement points distributed by frequency decade. In impedance notation the real part is given by Z″ and the imaginary part is given by Z″. For an equation to be expressed in coordinates (rectangular-Cartesian) the denominator must be converted into a real number instead of a complex number. The position of the vector represented by Cartesian coordinates (x,y), the X axis represents the real component and the Y axis represents the imaginary component.
When we talk about a notation using the Nyquist graph, we will obtain a complex impedance plane. Where each represented data point corresponds to a different measurement frequency. This type of notation needs to label characteristic frequencies, as they are not obtained explicitly, to allow a better compression of the time constants of underlying phenomena.
4. Results and Discussion
4.1. Accelerated test of chlorides according to ASTM 1556
Table 6 shows the results of the chloride absorption evaluation tests, according to the procedure defined by the ASTM C 1556 standard for the three types of concrete under study (REF, MK, CCA). The surface concentration of chlorides Cs% was obtained as a function of the weight of the concrete, using 5g of solute, as indicated by the test in the AFREM TEST 1999. Through the free chloride profile fig. 4, the apparent diffusion coefficient, Da, whose values are presented below, was obtained.
Figure 4.
the apparent diffusion coefficient, Da.
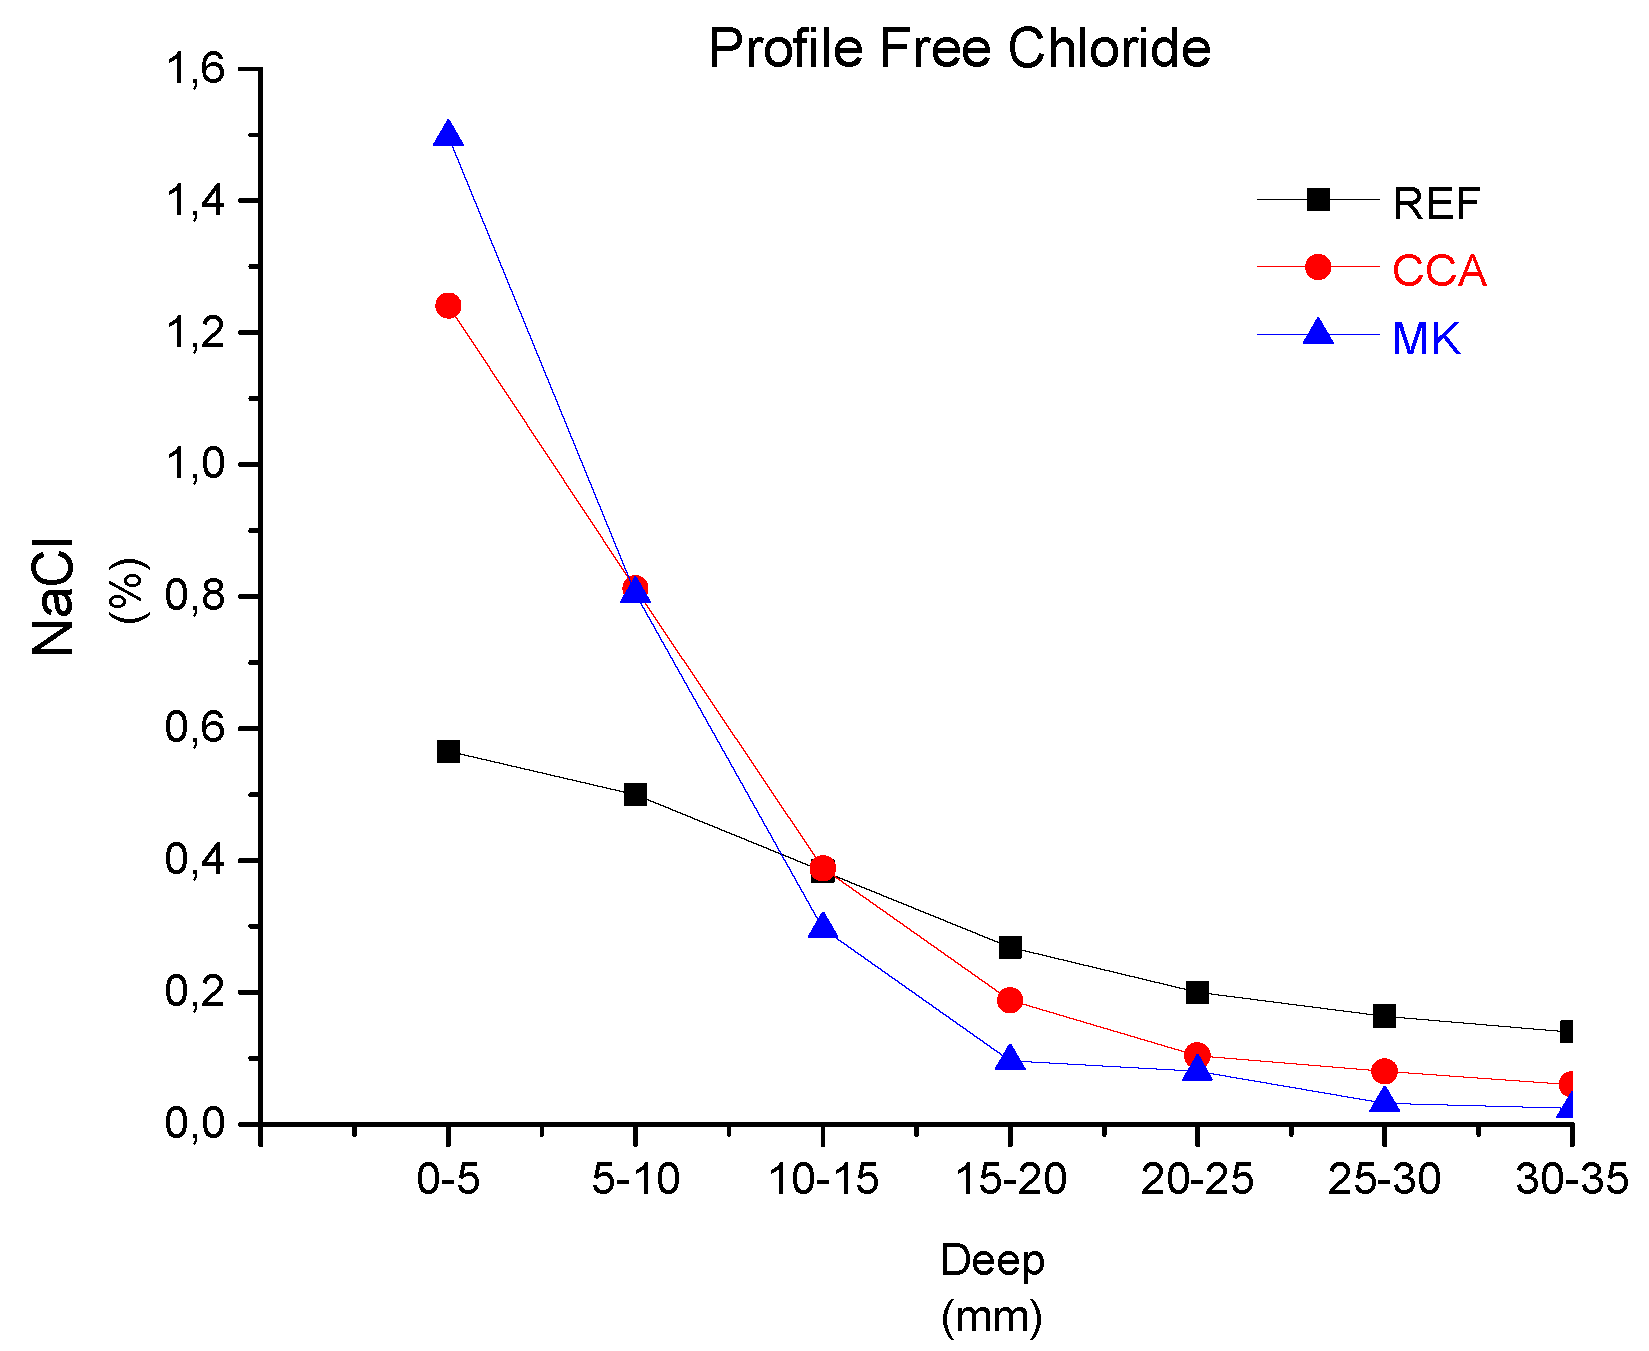
As the results show, the highest apparent diffusion coefficient is for Portland cement concrete without REF addition of 8.458503 e-11 m2/s. The value for the diffusion coefficient in concrete with the addition of rice husk ash CCA was 1.240761e-11 m2/s. The lowest apparent diffusion coefficient was recorded for concrete with MK metakaolin addition, with a value of 9.291956e-12 m2/s.
It is important to consider that in each of the materials under study, chloride anions are found inside the concrete in different states. As the free chlorides are dissolved in the liquid phase of the concrete pores, there are others, exactly in this state, but prevented by a physical barrier, from penetrating the reinforcement. Also physically bonded, attracted by Van de Waals forces at the pore surface or chemically bonded by reaction with hydration compounds in Portland cement [10].
In order to better understand the results obtained, an initial assessment can be made by analyzing the behavior of conventional reinforced concrete, REF, formulated with Portland cement only. In this material, the protection mechanism against the entry of chloride ions is active when the Portland cement components are in the form of tricalcium aluminate C3A and tetracalcium ferrite aluminate C4AF, which can chemically bind to chloride anions. Forming a hydrated compound called friedel salt, which is attributed to a greater effect in reducing the mobility of the chloride anion [11].
In CCA concrete, which contains silicon-based pozzolans, this protective effect takes place according to a different mechanism. The protective effect will also be physical, in addition to the action of existing physical-chemical mechanisms. This interaction will result in a denser and lower porosity matrix, which reduces the physical mobility of these anions.
In the case of MK concrete with the addition of aluminum-silicic pozzolana, protection against attack by chloride is provided by two mechanisms. The first is similar to the mechanism observed in the case of Portland cement. In addition to this mechanism, there is the action of reactive alumina Al2 O3 component of pozzolan, which will chemically react with the chlorides, originating the friedel salt [12,13].
The results obtained in the diffusion tests in the present work agree with [13]. The pozzolanic additions of aluminum and aluminium-silicium, mainly due to their chemical character, will reduce the attack of chlorides on the steel reinforcement, which does not occur in the case of silicic pozzolans. The results show how active mineral additions based on aluminum can be beneficial in structures exposed to an atmosphere of chloride ions, especially in marine environments. In the three materials, the factor that most influenced to reduce the mobility of chloride ions was the chemical character of the material constituting the concrete, with a greater reach of a chemical-physical interaction than a physical-chemical one.
4.2. Tomography
With the objective of searching for more elements of information to better understand the physical state in the microstructure of the analyzed concrete, it was decided to use a non-destructive imaging technique (NDT), using a tomograph [14]. With this analysis technique, the internal structural conditions of the materials remain unchanged. As the durability test carried out according to ASTM 1556 involves immersion of concrete in sodium chloride, the mercury porosimetry technique was discarded. According to [15], in cement-based systems, the technique overestimates the volume of fine capillary pores and underestimates the volume of coarse capillary pores, although it remains a valuable technique to compare pore refinement in a given system [16]. The technique based on measuring the pore volume, defined according to the ASTM C642-13 standard, was discarded in the present work, as it requires the use of water, which would make it difficult to clearly perceive the physical changes caused by the absorption of NaCl in the pores.
Initially, a scan was performed on the cylindrical concrete samples, visualizing the pore system in 3D, which allowed viewing only the largest pores. As we were interested in visualizing the entire pore system, including the smallest ones, in approximately one scale (100µm), the highest resolution was used [10]. The results are presented below, in Table 7, Table 8 and Table 9, for reference concrete (REF), concrete with addition of rice husk ash (RCA) and concrete with addition of metakaolin (MK). Likewise, it will be possible to compare the concrete itself, without exposure to NaCl and with exposure to it [17].
The tables show the distribution of the amount of pores as a function of the pore area measured before and after NaCl absorption, for a scan with a resolution of 100 µm. A greater number of pores was detected as being, in the central value of the range, 8.38 mm2 and the smallest number of 0.004 mm2. In both cases, the number of pores in each interval and the total that they represent in the sample were quantified, with numerical data detailed in Table 7. The data show that for the concrete REF- without NaCl absorption, the total porosity was 2 .48%, increasing after chloride absorption to 2.80%, representing an increase of 11%.
A similar analysis was carried out on the CCA concrete samples, with results shown in Table 8, representing the CCA sample without chloride absorption, and CCA concrete after NaCl absorption. The distribution of pore dimensions, for a scan with a resolution of 100 µm, showed the largest pore being 16.75 mm2 for the CCA-without chloride concrete and 33.5 mm2 for the concrete after chloride absorption. The smallest void size detected was 0.004 mm2 for both conditions. It is observed that for the CCA-concrete without chloride the total porosity was 1.06%, increasing after the absorption of chloride to 1.32%, representing an increase of 26%.
The results corresponding to the MK concrete are shown in Table 9, representing the MK sample without chloride and Fig. 9, after the absorption of chloride. The total distribution of pore sizes is also plotted, for a scan with a resolution of 100 µm. The largest pore size detected was 16.76 mm2 for MK concrete without chloride absorption and 8.38 mm2 after absorption. Similarly, the smallest pore size detected was 0.004 mm2 in both conditions. For concrete MK- without chloride absorption, the total porosity was 2.43%, increasing when it was analyzed after chloride absorption, passing to 2.60%, representing an increase of 17%.
The reduction of porosity in concrete with pozzolanic additions, in relation to common concrete, could be explained by the specificity of the physico-chemical reactions that occur between the different components of the same mixture. These reactions directly influence the content of amorphous, glassy or crystalline fraction, its silicic or calcareous nature, its acidic or basic chemical character and particle size, among other parameters. When analyzing the behavior of common portland cement concrete (REF), one must consider that hydration stimulation occurs directly, according to a purely physical mechanism, in which once the cement particles are hydrated, the fraction water runs out. By adding a pozzolanic component to this cement, there will be an effect of a physical-chemical nature, in addition to the first stimulation mentioned, introducing a second variant of stimulation of hydration of the CP indirectly. [8,18,19].
As a result, in concrete with mineral additions, a denser matrix is obtained, as is the case with CCA and MK concrete when compared to REF. Having the physical protective effect against the entry of chloride ion, more accentuated. Specifically with silicic-based additions, as observed in the CCA concrete proving to be the least porous when compared to the aluminum-silicic-based MK, therefore, it will create a matrix of low porosity[20]
4.3. Electrochemical Impedance Spectroscopy
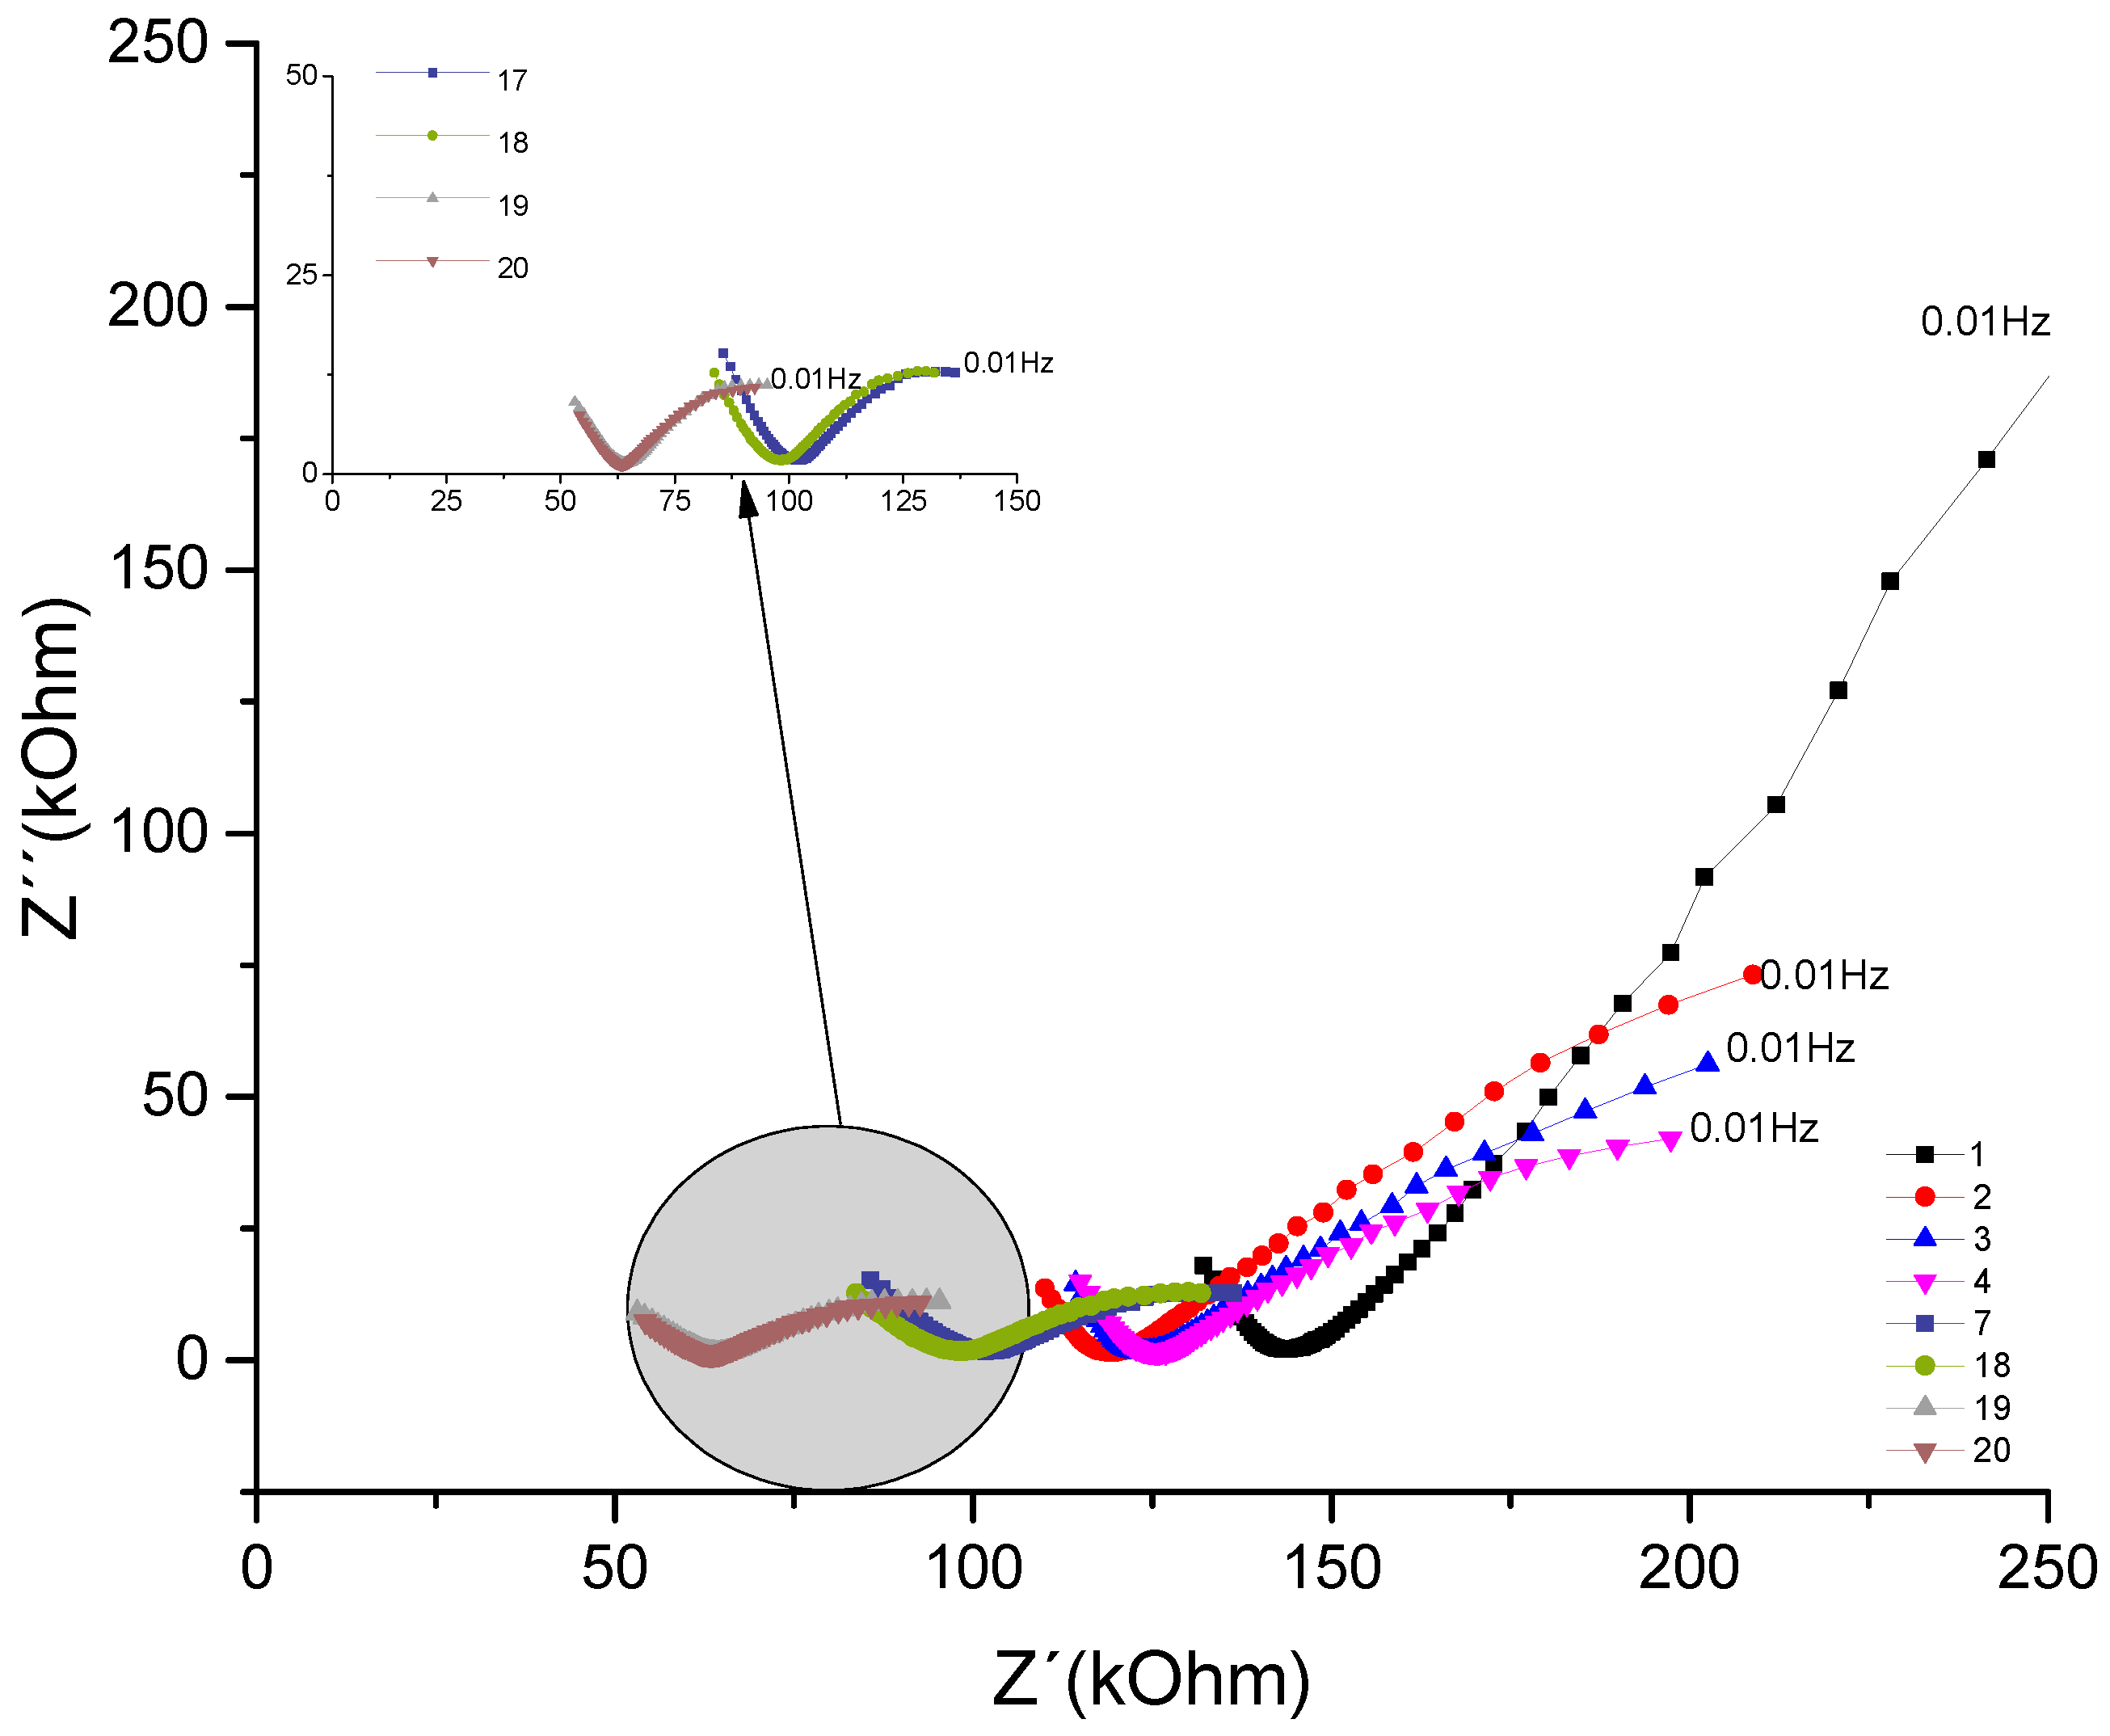
Next, the results are presented and discussed through Nyquist graphs, for the 3 materials (REF, CCA, MK). Using the EIE technique as a basis for obtaining them, with the application specifications described above in epigraph 3.4.
Figure 5 presents the Nyquits graph for the REF concrete, which was monitored over a period of 1 year, exposed to NaCl. The spectra of the first 4 measurements and the last 4 are shown, for the lowest frequency in 10 mHz.
Figure 5.
- Nyquist plot for the concrete system REF for 1 year with NaCl.
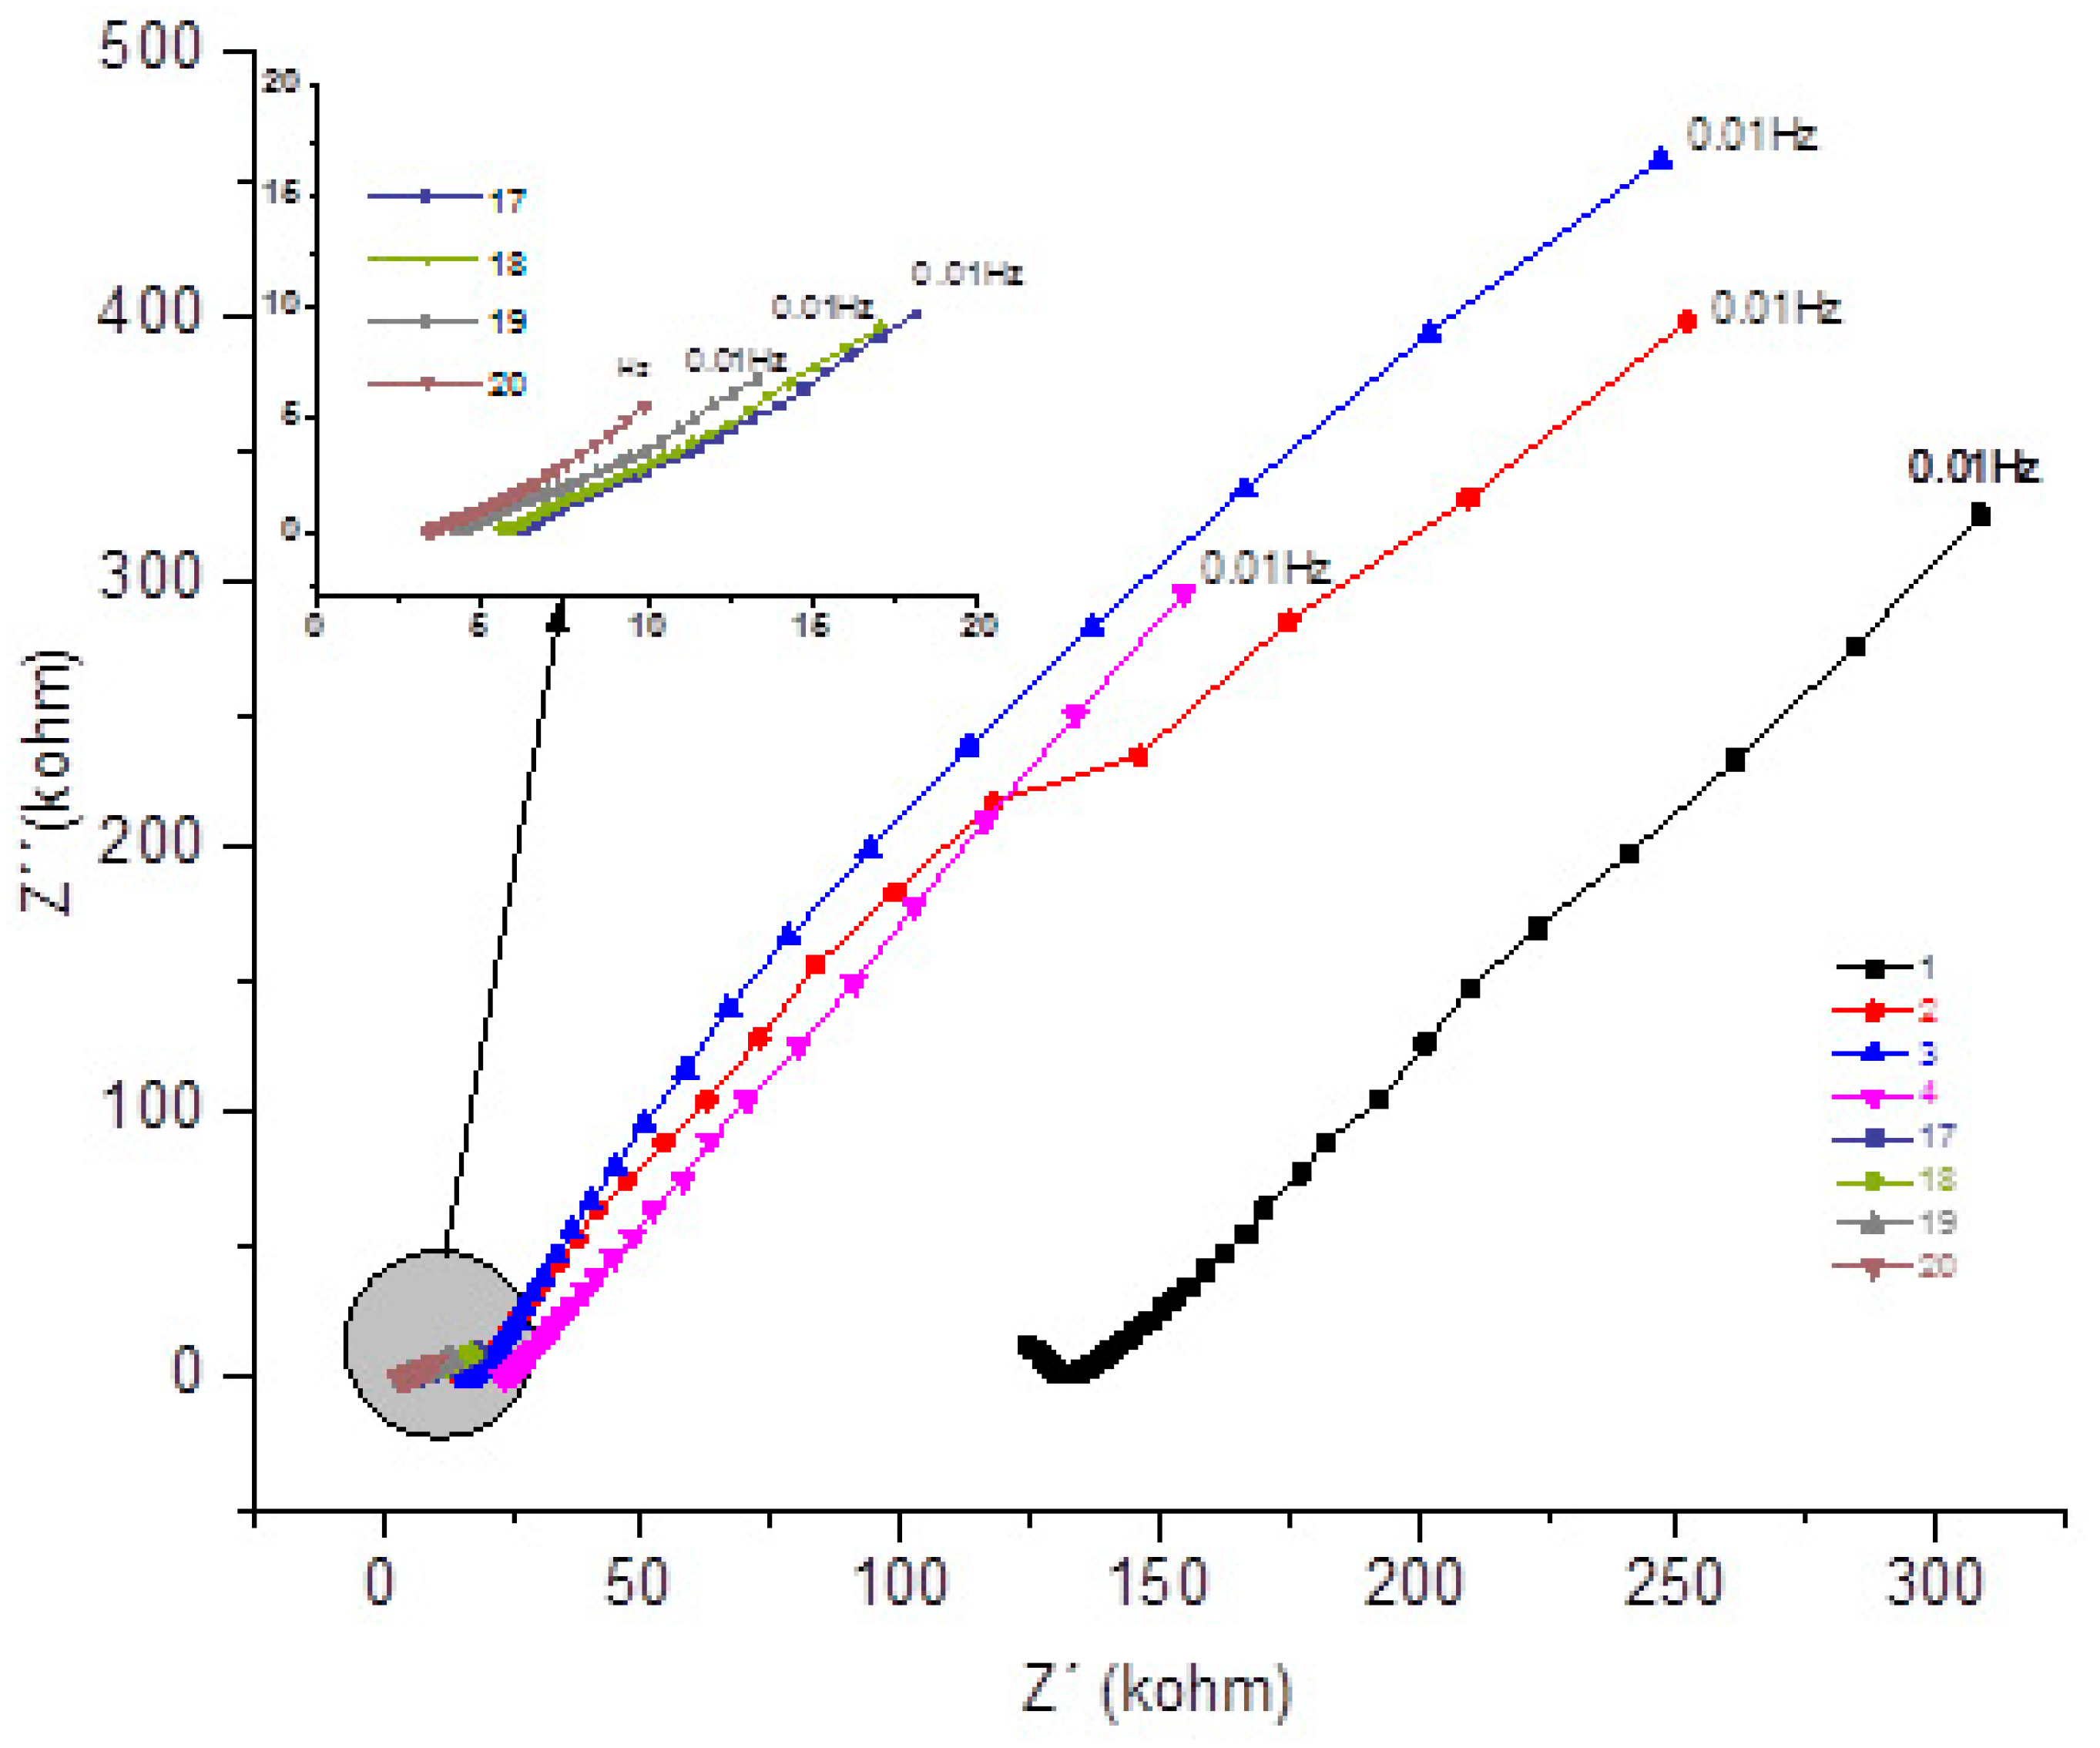
Comparing the evolution over time of the real component attributed to the system's resistance to the corrosive process, this decreases with the time of exposure to NaCl. Comparing the impedances at 10mHz, for example, the decreasing value of the real component can be observed as a function of the exposure time (308 kΩ); (154 KΩ); (26 kΩ); (19 kΩ); (9 kΩ). Showing a significant decrease with the passage of it, of the resistance of the system, from the second month of exposure. This decreasing phenomenon of the real component as a function of time is also repeated for high frequencies, as shown in Table 10. Being at low frequencies, associated with resistance (R4), which would be the resistance to the polarization of the electrical charges that the electrodes accumulate, i.e. from the reinforcing bars.
Analyzing the behavior of the material at medium frequencies of the real component, for example 39Hz, the decrease in system resistance is repeated over time, ranging from (134 kΩ); (24 KΩ); (11 kΩ); (7 kΩ); (3 kΩ). This fact may be associated with the resistance of the system bar (electrode) / concrete (electrolyte) R2, behaving in the analysis of the spectra as a critical point.
Observing the imaginary component, comparing the values, also at 10mHz, it is observed the decrease of the imaginary component with the passage of time (325 kΩ); (295KΩ); (13 kΩ); (10 kΩ); (5 kΩ). Component associated with the system reactance, which shows the opposition to the flow of current, decreasing at all frequencies, as shown in Table 11.
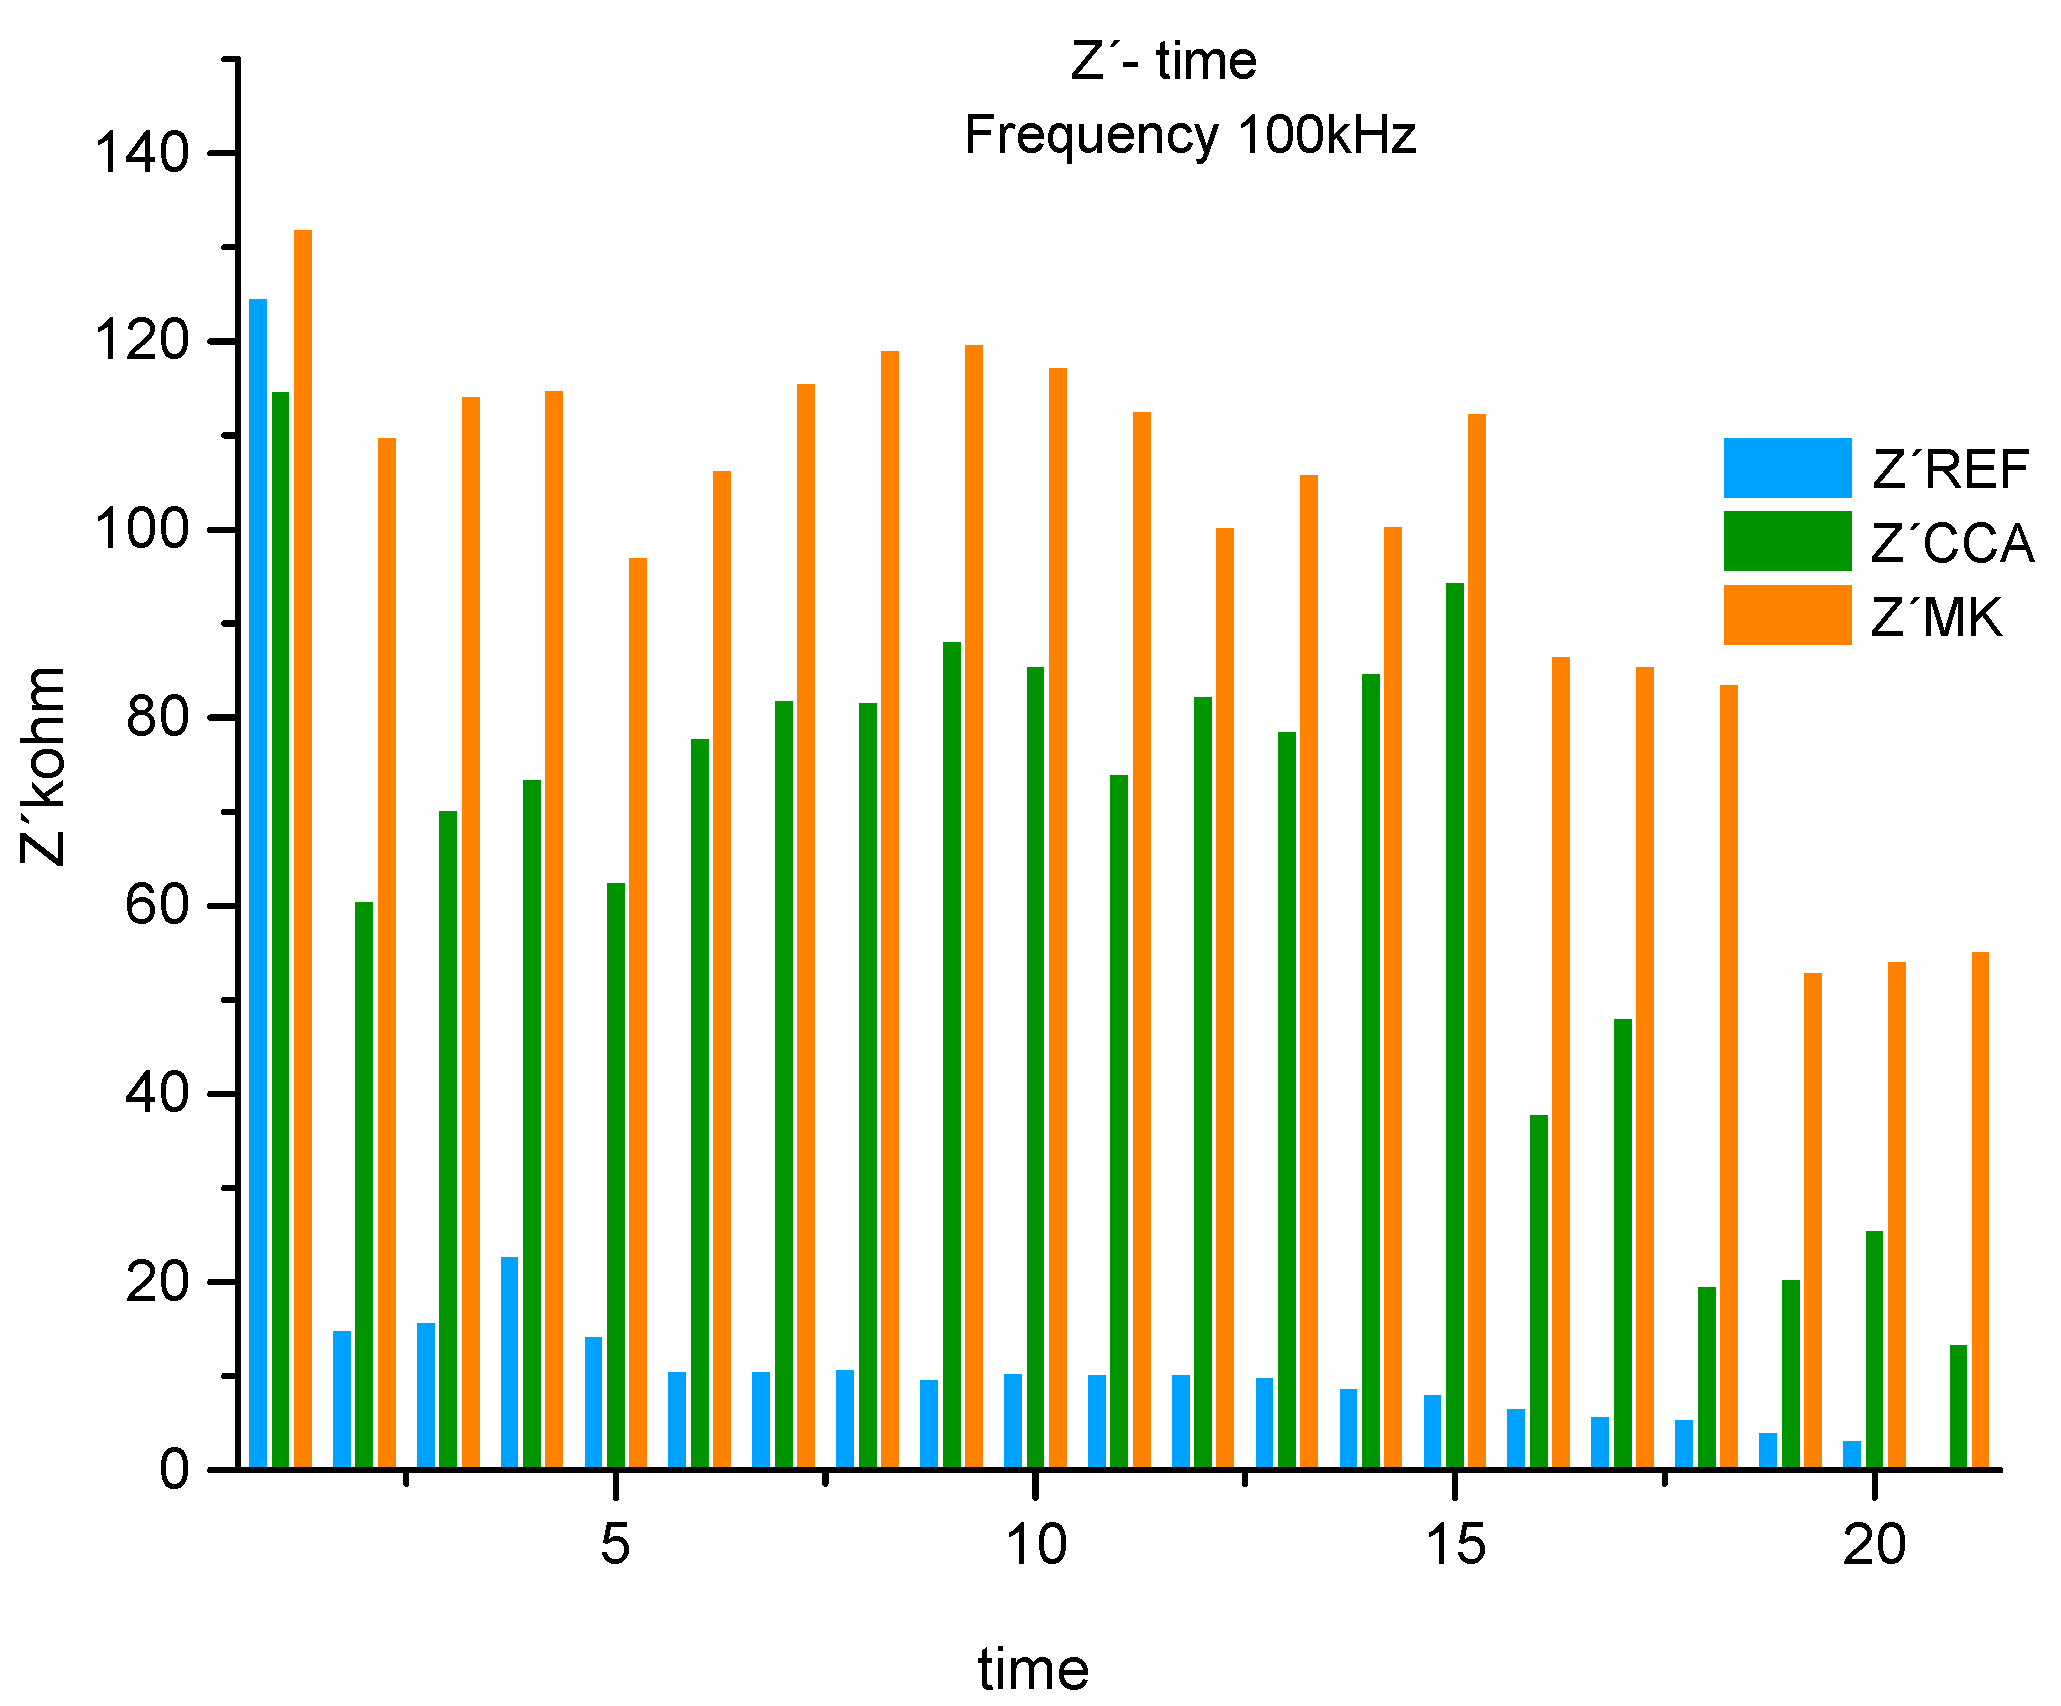
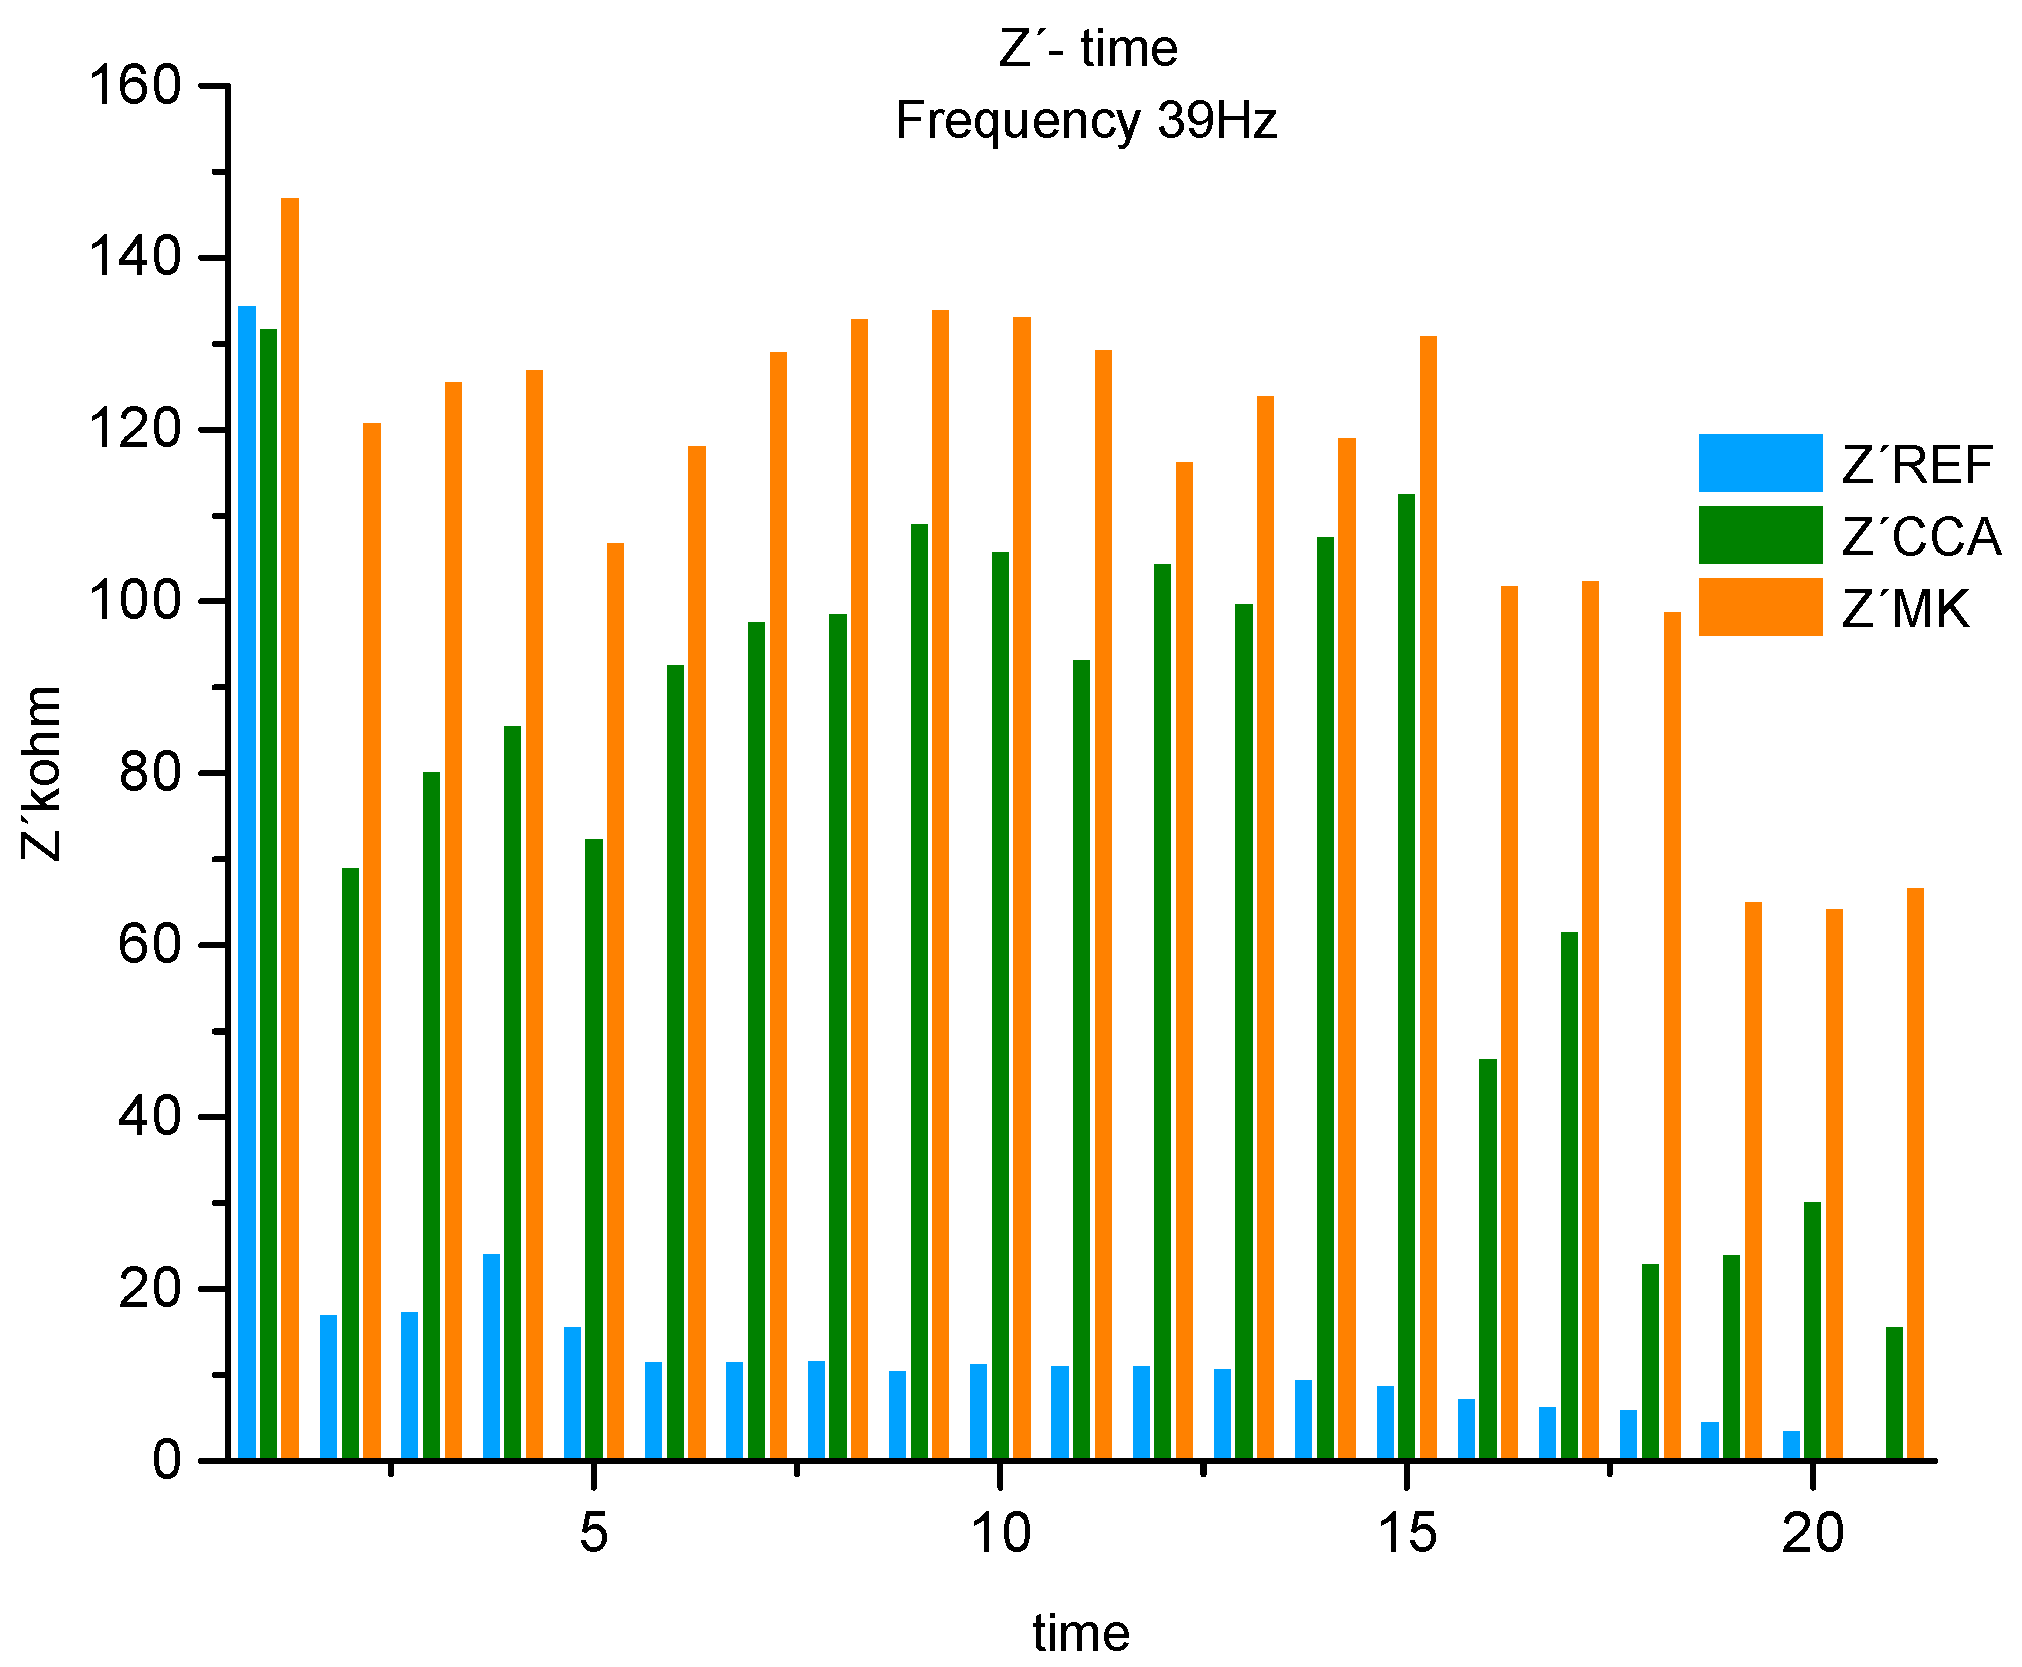
Figure 6, shown below, serves to visualize the decreasing behavior described above for the real component, associated with the system resistance. Where 3 frequency ranges were selected, observing a decreasing trend over time
Figure 6.
Real component of the histogram (Z') for REF associated with the system resistance at 3 frequencies, 100kHz, 39Hz 0.01Hz.
Figure 6.
Real component of the histogram (Z') for REF associated with the system resistance at 3 frequencies, 100kHz, 39Hz 0.01Hz.
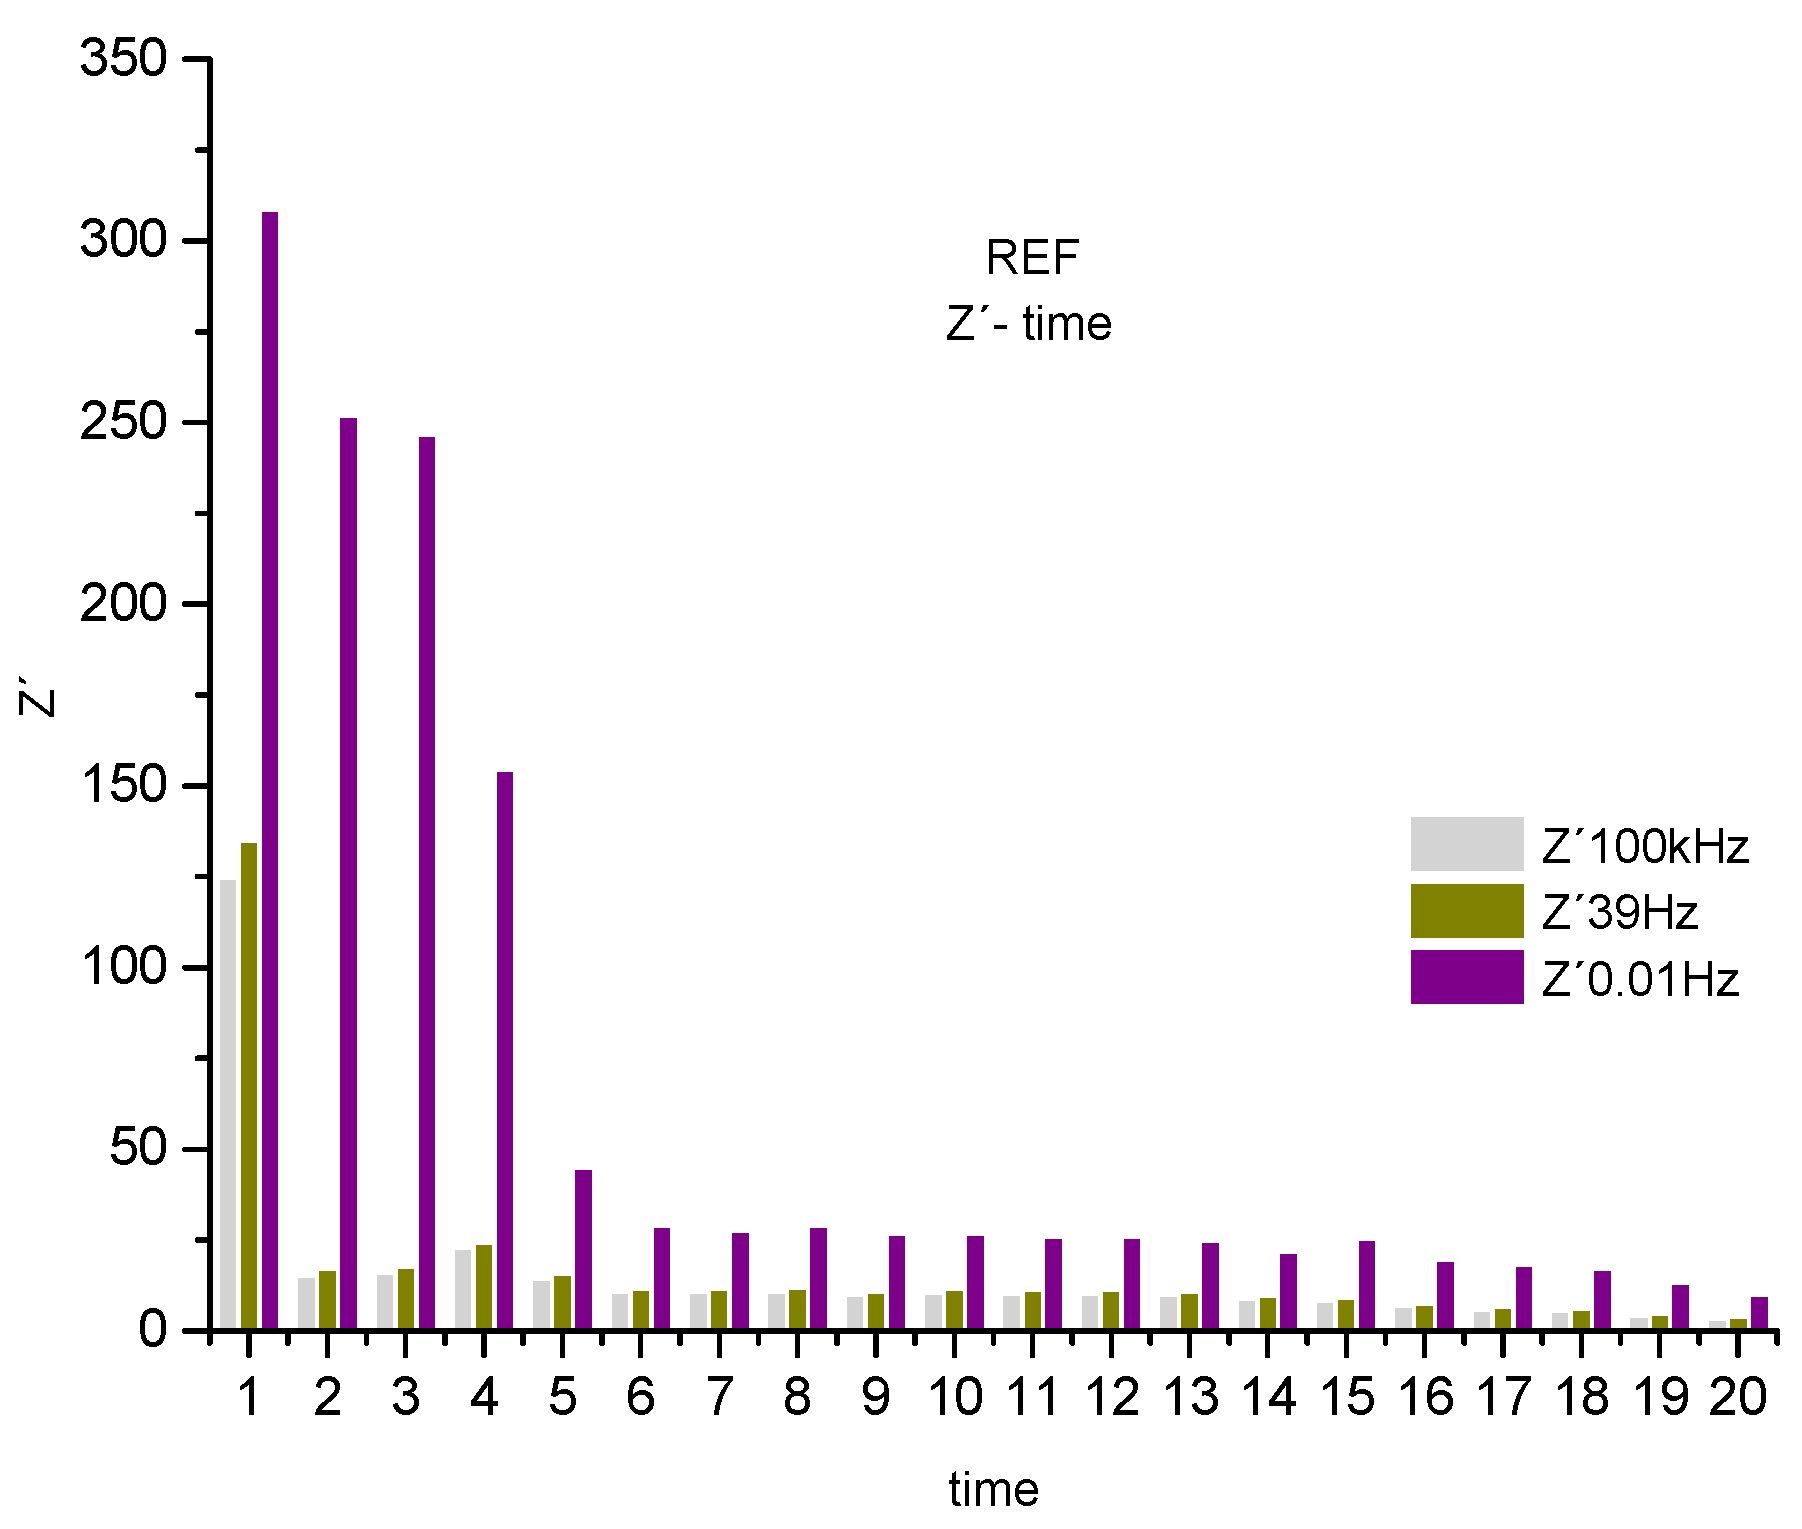
An abrupt drop in the real component is observed, associated with the system's resistance to the corrosive process, represented by the frequencies 0.01Hz, 39Hz and 100KHz. De-scribing a drop in resistance of the sweep frequency system, from 0.01 Hz to the highest 100 kHz of 68%. Showing a system, where none of the parameters that compose it, such as the electrolyte and the steel-concrete bar system, presents resistance to the polarization of the electric charges accumulated in the R4 electrodes. Affecting the protection of the steel armor and, consequently, allowing the attack of chloride ions to the reinforced, endangering its integrity. [21]
The Nyquist plot below represents the concrete sample named CCA, which contains rice husk ash addition, for the same w/c ratio of 0.7.
Figure 7.
- Nyquist plot for the concrete system CCA for 1year with NaCl.
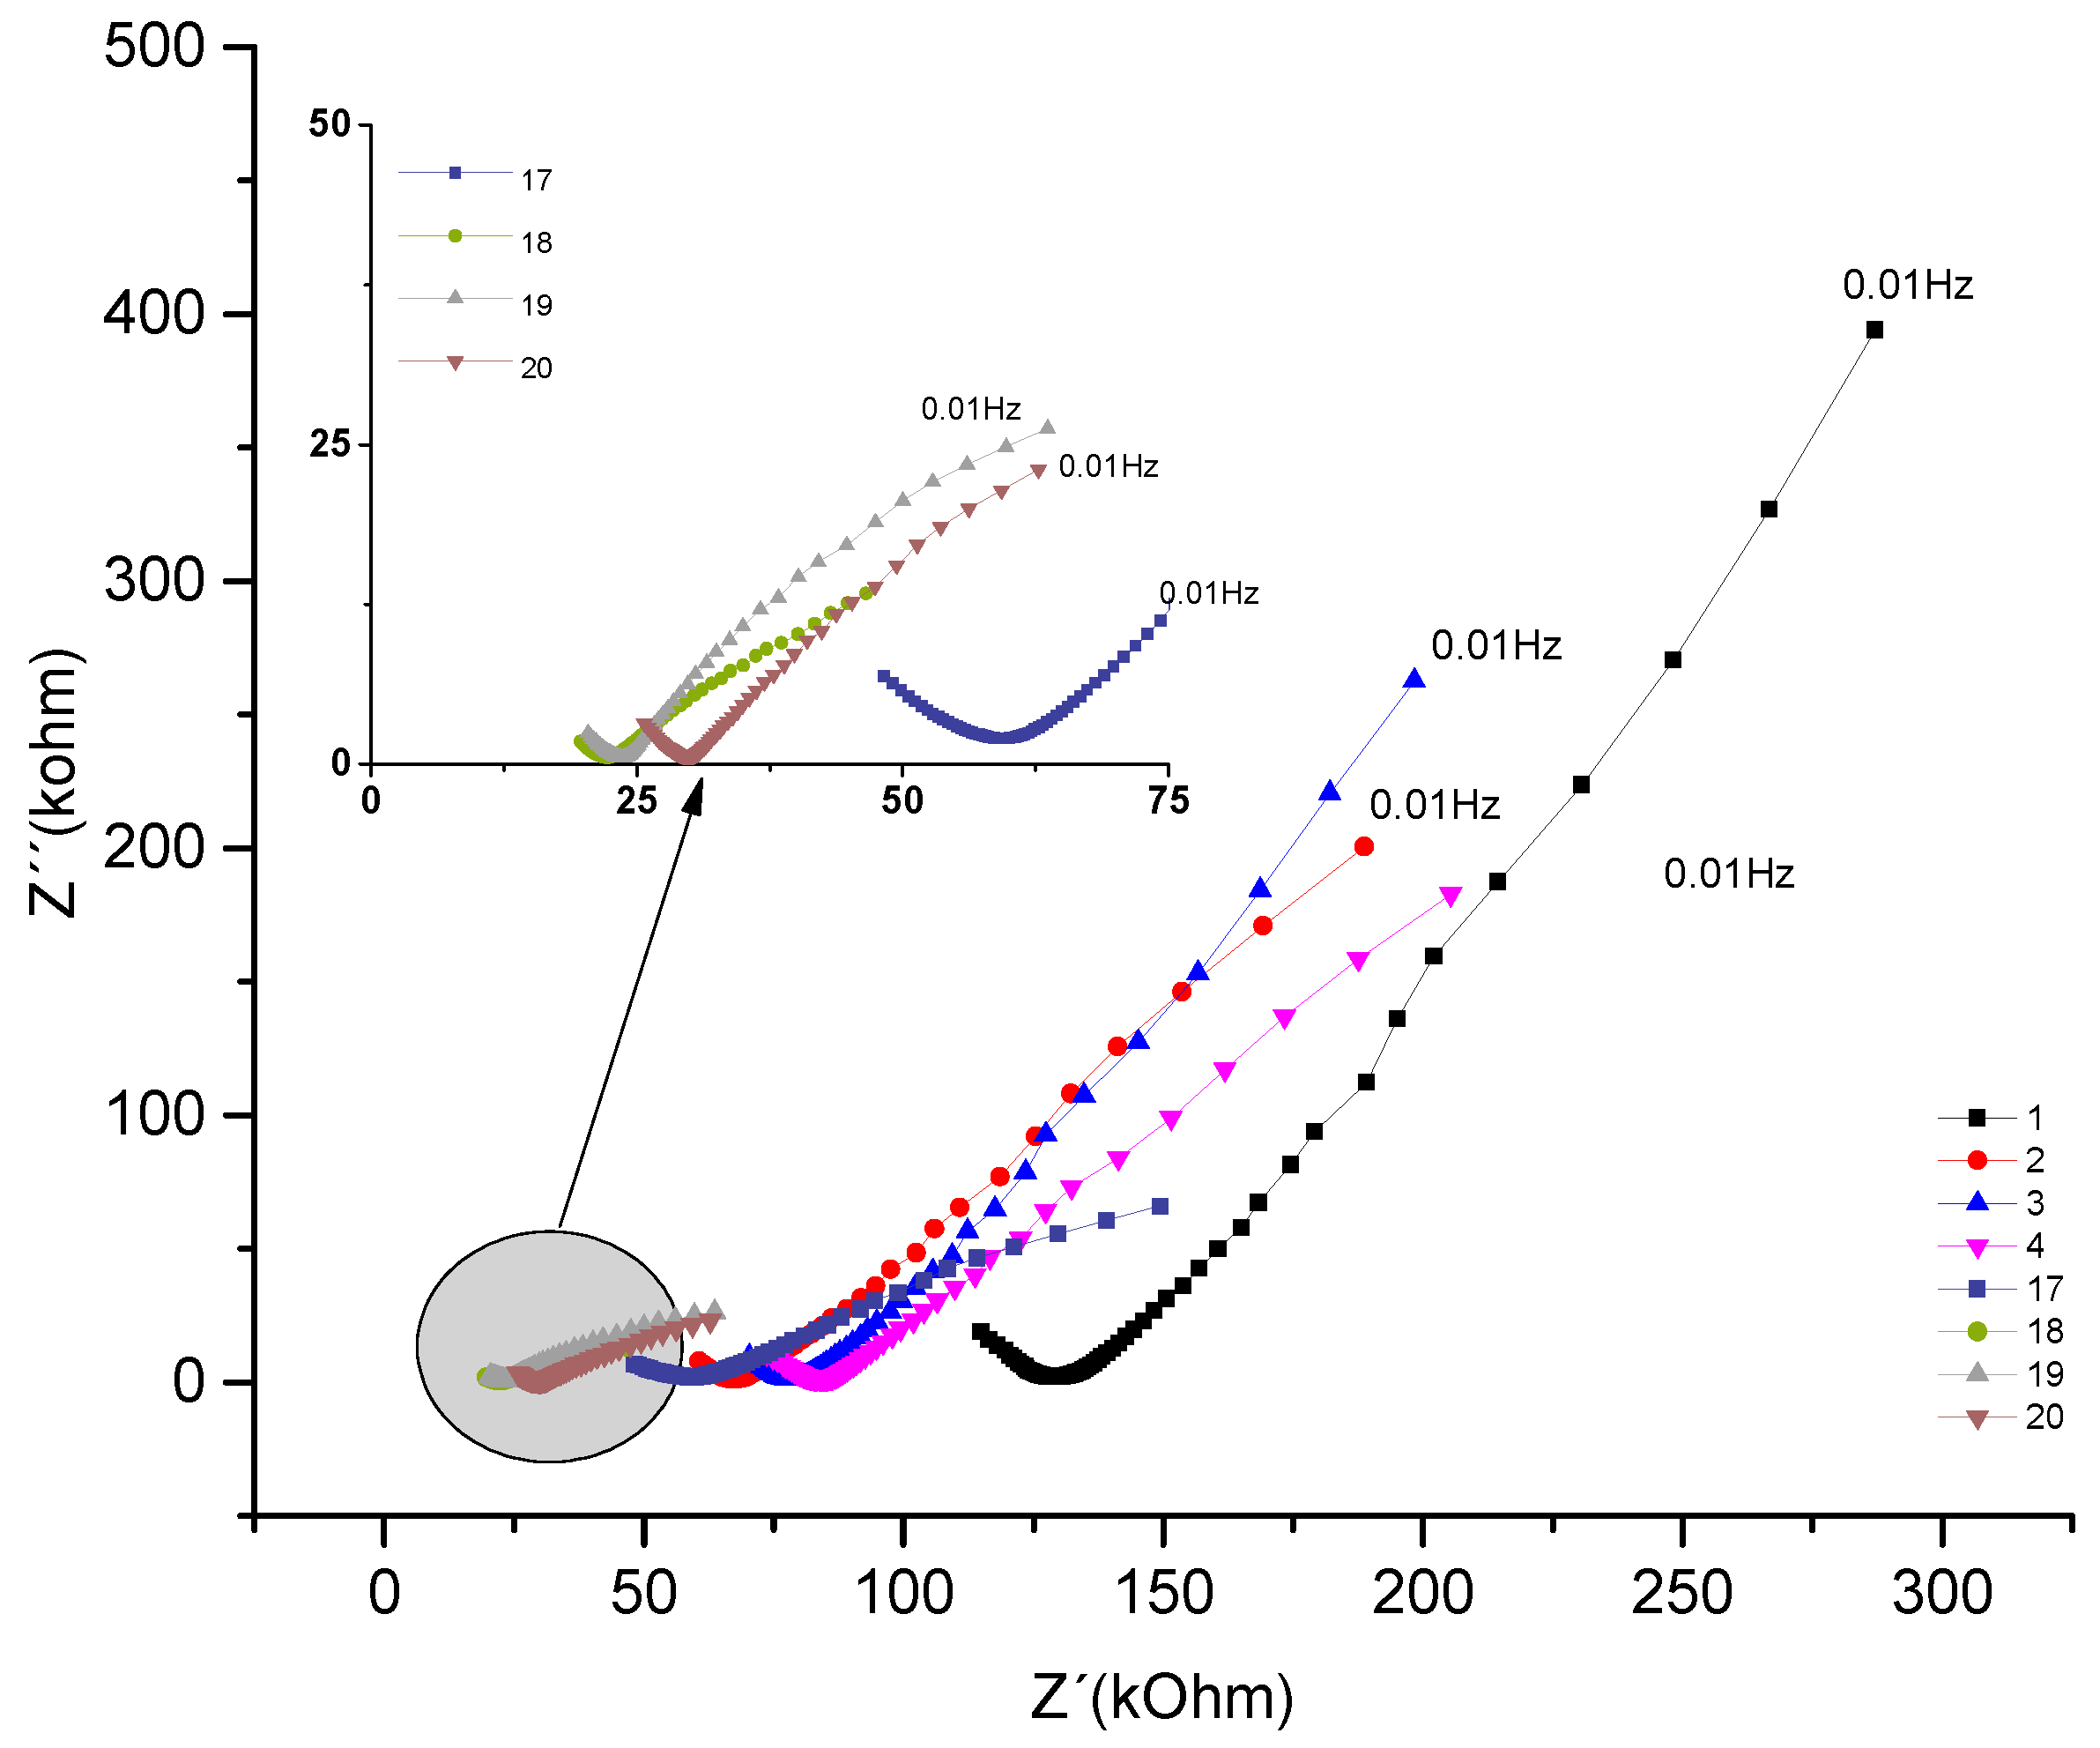
Analyzing the evolution over time of the real component attributed to the system's resistance to the corrosive process and comparing the impedances at low frequencies of 10mHz. The behavior that initially decreases as a function of exposure time from 287 kΩ to 198 kΩ. The behavior increased from the fourth test from (205 KΩ) to (244kΩ), later the values decreased in the 13th measurement from (149kΩ); a (34 kΩ). This range of frequencies is associated with resistance (R4), which would be the resistance to the polarization of electrical charges that accumulate in this region, of the armatures (electrode) / electrolyte (concrete).
Analyzing the behavior of the material's real component at medium frequencies, for example 39Hz. It is observed how this is decreasing, initially from 131 kΩ to 72kΩ. Then, from the sixth test, from 92kΩ it increases to 15 measurements with 112kΩ. From the 16th measurement, it gradually decreases by 47 kΩ until it reaches 15kΩ. This fact is associated with the resistance of the R2 bar//concrete system, and when compared to the REF material, the addition of pozzolans gains importance. Showing, as described in section 4.1, the protective effect of adding pozzolans against chloride attack.
By observing the imaginary component and comparing the values at 10mHz, a behavior that initially decreases as a function of exposure time is shown, which ranges from 394 kΩ to 145kΩ. From the sixth test, it increases from 167 KΩ to 183kΩ; being again decreasing from the 10th measurement with (117kΩ) until reaching (10 kΩ). Component associated with the system reactance, which shows the opposition to the flow of current, as can be seen in Table 13.
Figure 8, shown next, serves to visualize the previously described alterations of the real component, associated with the resistance of the system. Where 3 frequency bands 0.01 Hz, 39 Hz and 100 KHz were selected.
Figure 8.
Real component histogram (Z´) for CCA associated with the system resistance at 3 frequencies, 100kHz, 39Hz 0.01Hz.
Figure 8.
Real component histogram (Z´) for CCA associated with the system resistance at 3 frequencies, 100kHz, 39Hz 0.01Hz.
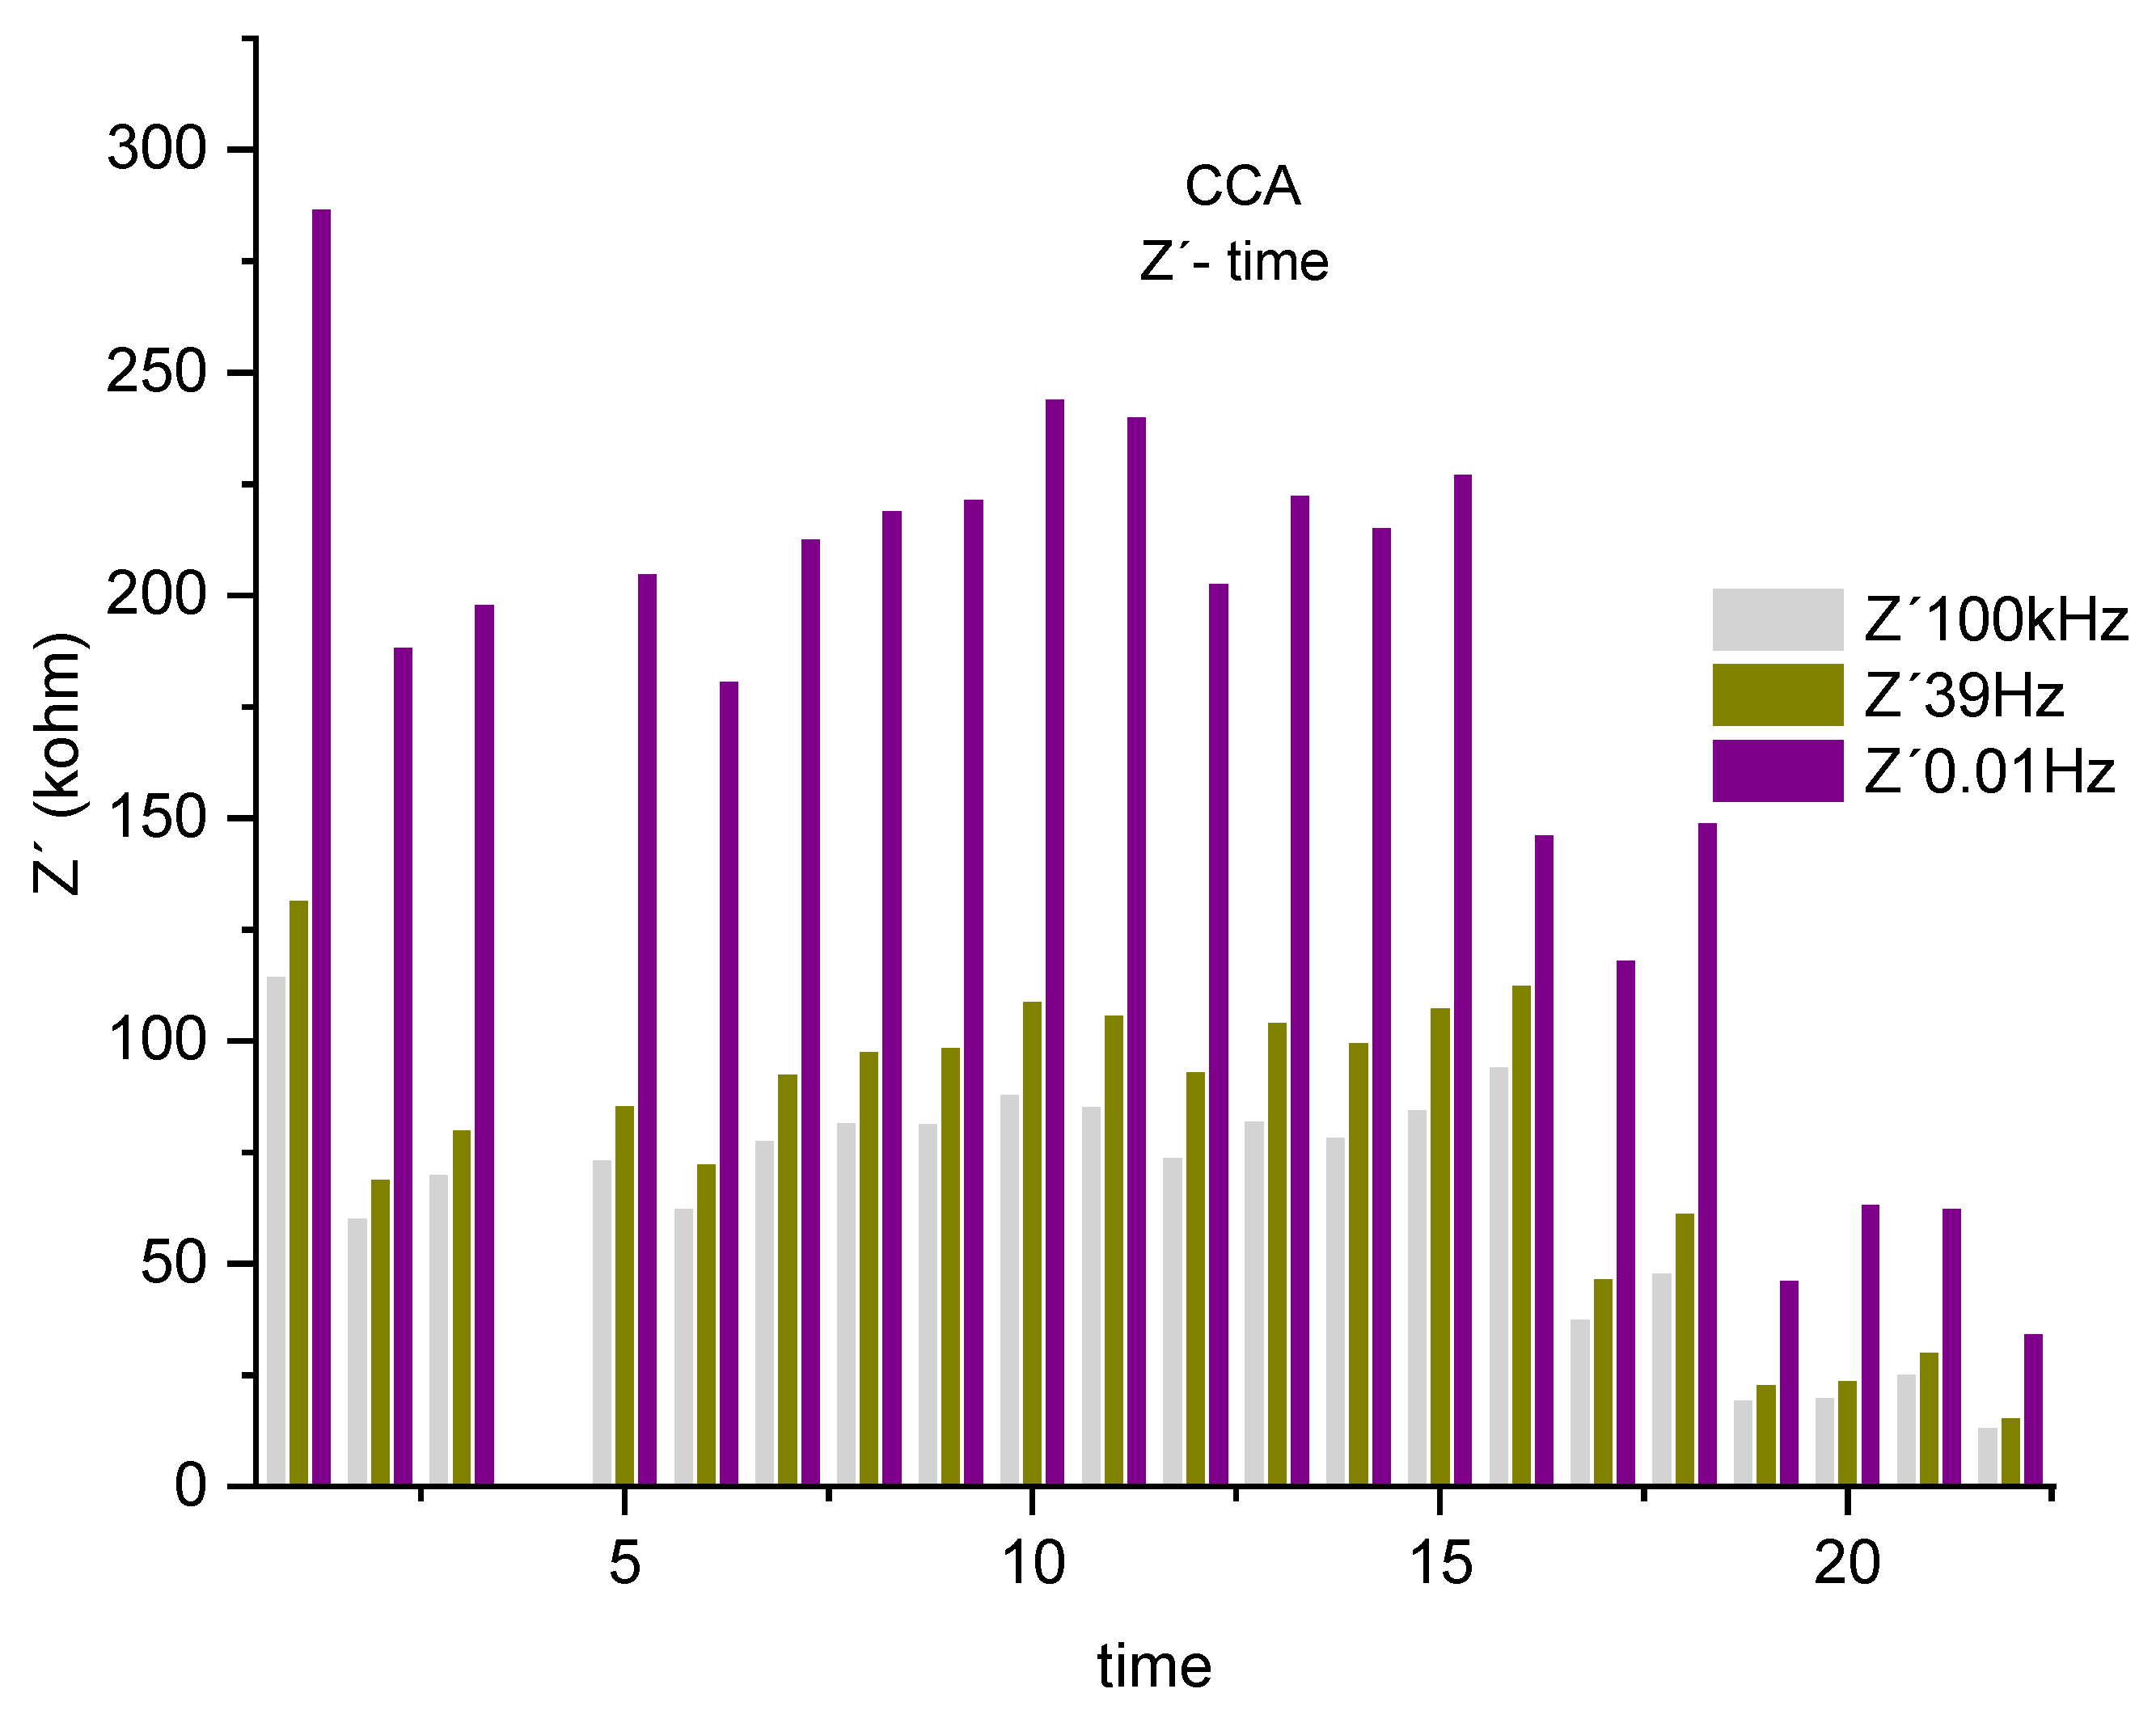
A drop in the real component is observed, associated with the system's resistance to the corrosive process, represented by the frequencies 0.01Hz, 39 Hz and 100KHz. Describing a decreasing trend up to the sixth test, it increases as described in the impedance spectrum up to the 14th measurement. This phenomenon is repeated from the lowest frequency of 0.01 Hz to the highest 100 kHz, varying around 62%. Showing a system, where all the parameters that compose it, such as electrolyte, steel-concrete bar system, present at certain times, an increase in the resistance offered by the system. An effect that may be associated with decreased mobility of chloride ions [8]. As a result of the higher density of the matrix due to the hydration reaction, caused by the addition of the active mineral, based on silicon, where the physical effect is predominant.
Next, the spectra are presented through the Nyquist graph resulting from the concrete sample called MK, which contains an addition of 10% metakaolin replacing the cement
Figure 9.
- Nyquist plot for the concrete system MK for 1 year with NaCl.
By observing the evolution over time of the real component attributed to the system's resistance to the corrosive process and comparing the impedances at low frequencies 10mHz. A decreasing behavior is noticed, depending on the exposure time, which initially goes from 337 kΩ until the sixth measurement of 170kΩ. As this range of frequencies is associated with resistance (R4), which would be the resistance to the polarization of the electrical charges that accumulate in this region, that is, resistance (bar electrode) // electrolyte (concrete). After the seventh measurement it shows relative stability, going from 181 kΩ to 168 kΩ. After the 15th measurement, it starts to decrease from 168 kΩ to 92 kΩ.[1].
When analyzing the behavior of the material at average frequencies of the real component, for example 39Hz, a decreasing behavior is repeated initially from 147kΩ to 107kΩ in the fifth measurement. From the sixth test with 118kΩ it maintains stability until the 15th measurement 131kΩ. After the 16th measurement, it gradually decreases from 102kΩ to 66kΩ. This fact may be associated with the resistance of the bar / concrete R2 system, and when compared with the REF material, the addition of pozzolan to concrete gains importance, especially when these are based on aluminum-silicon [8], as described. in section 4.1 shows the chemical-physical protective effect of this pozzolan against chloride attack.[13] .
The component would imagine that when comparing the resulting values, at 10mHz, it is possible to initially observe a decrease as a function of the exposure time from 337 kΩ to 170 kΩ. In the seventh test it increased to 181 KΩ, until the eighth measurement the values again decreased from 180kΩ to 92 kΩ. Remember that the component associated with the reactance of the system, which shows the opposition to the passage of current that varies with frequency, as shown in Table 15.
The following figure is used to visualize the changes previously described in the real component, associated with the resistance of the system. Where 3 frequency bands 0.01Hz, 39Hz and 100KHz were selected for the concrete MK.
Figure 10.
Real component of the histogram (Z') associated with the resistance of the MK system at 3 frequencies, 100kHz, 39Hz 0.01Hz.
Figure 10.
Real component of the histogram (Z') associated with the resistance of the MK system at 3 frequencies, 100kHz, 39Hz 0.01Hz.

When checking the real component, associated with the system's resistance to the corrosive process, there is a decreasing trend up to the sixth test, showing some stability, as described in the impedance spectrum up to the 15th measurement. This phenomenon is repeated from the lowest frequency of 0.01 Hz to the highest of 100 kHz, varying around 39%. This shows a system where all the parameters that compose it are present, such as the electrolyte, steel-concrete bar system, where the first mentioned resists the passage of chloride ions, which will provide the integrity or not of the reinforcement.
Through an analysis of all Nyquist spectra over 1 year for all 3 materials (REF, CCA, MK). It was possible to observe an equivalent circuit, in principle, it can be represented by Resistance R in parallel with a pseudo-capacitor represented by Q, the total circuit would be four sub-circuits in series as shown in Figure 11 below represents.
Figure 11.
Equivalent circuit of the studied system. José Jurado Egea (JURADO, J. R) Complutense de Madrid.
Figure 11.
Equivalent circuit of the studied system. José Jurado Egea (JURADO, J. R) Complutense de Madrid.
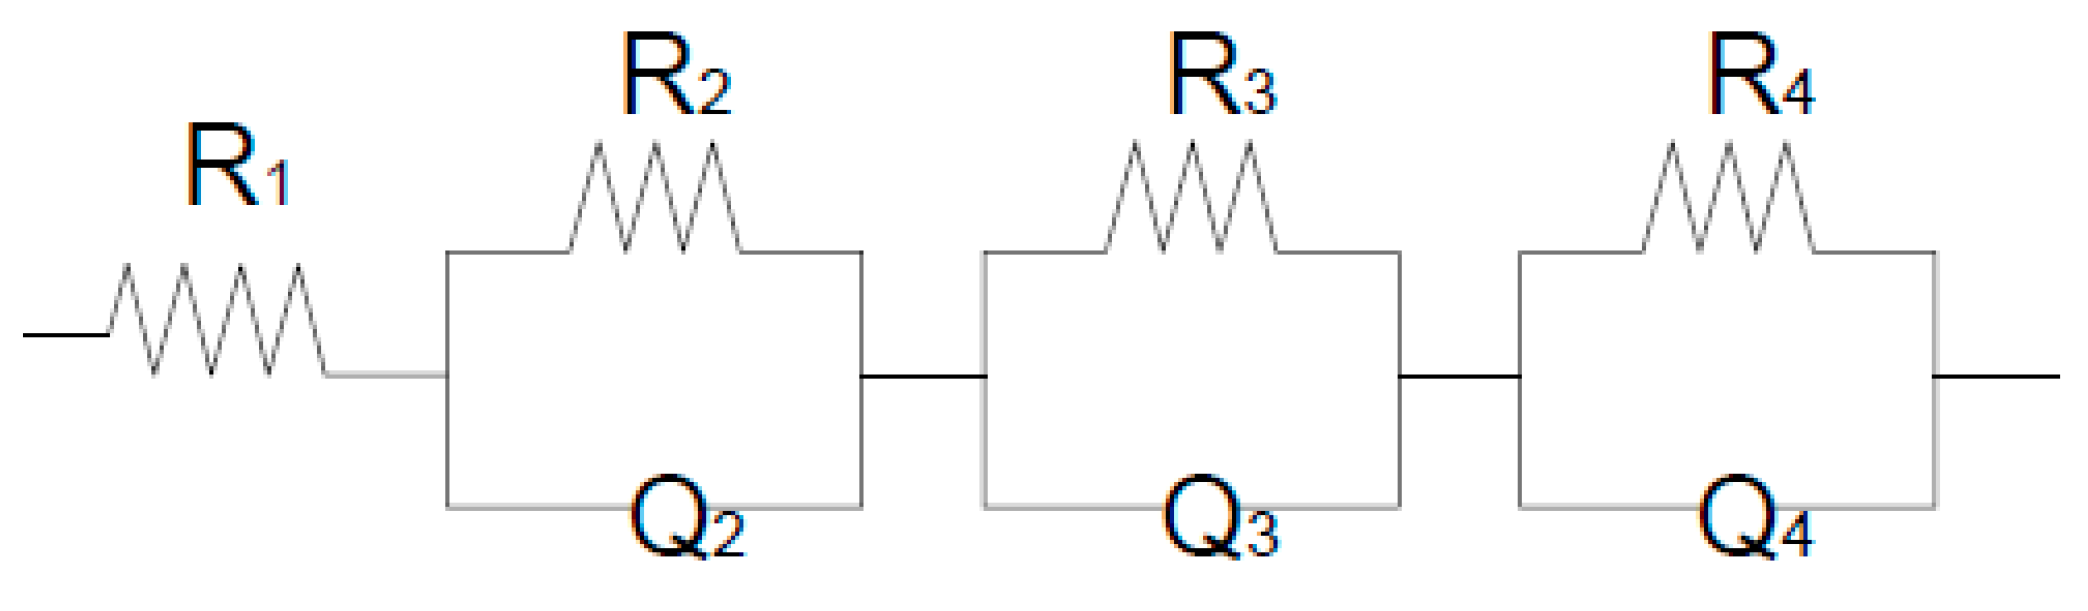
The equivalent circuit would be R1 (R2Q2) (R3Q3) (R4Q4) that is, 4 sub-circuits. The first corresponds to the resistance of the electrolyte (R1), the second would be the semicircle associated with the concrete system plus the steel bar (R2), a fact that coincides with [22]. The third arc would also be associated with the anterior interface plus the diffusion process (R3) and the fourth arc is the effect of resistance to the polarization of electrical charges, which accumulate in the electrodes (R4). From obtaining the equivalent circuit of the system under study, each of the parameters obtained in the 3 materials can be evaluated as a function of time. (Ref Jose Jurado Egea).
Figure 12.
Real component of the histogram (Z´) associated with the system resistance at 1 frequency 100kHz for REF, CCA and MK.
Figure 12.
Real component of the histogram (Z´) associated with the system resistance at 1 frequency 100kHz for REF, CCA and MK.
After having all the impedance spectra some analyzes were carried out. The first one makes an ANOVA comparison in Table 16, which is based on an assessment of the variance between groups (REF, CCA, MK) for the frequencies 100kHz, 39Hz and 0.01Hz of the real component over time. Subsequently overlapping them with the previously analyzed frequencies 100kHz, 39Hz and 0.01Hz through a histogram for each of these. The methodology used in the second analysis was based on the calculation of the maximum value among the three materials, for each of the chosen frequencies. Subsequently, the percentage in which the resulting maximum impedance varies in relation to other impedance values, which are lower[23].
At high frequencies 100kHz for the 3 materials (REF, CCA, MK) there is a significant difference when comparing the means. Since comparing MK - REF this difference was greater than when comparing CCA-REF. This difference is smaller when compared to CCA-MK.
In average frequencies for the 3 materials (REF, CCA, MK) there is a significant difference when comparing the averages. Since comparing MK - REF this difference was greater than when comparing CCA-REF. This difference is smaller when compared to CCA-MK.
At low frequencies for the 3 materials (REF, CCA, MK) there is a significant difference in terms of comparing the averages. Since comparing CCA - REF this difference was greater than when comparing MK-REF. Since there is no significant difference between the CCA-MK groups.
A seguir, os 3 materiais que fazem parte deste trabalho, REF, CCA e MK, são analisados na Figura 11.
Figure 10.
Real Component of the Histogram (Z´) associated with the system resistance at 1 frequency 0.01 Hz for REF, CCA and MK.
Figure 10.
Real Component of the Histogram (Z´) associated with the system resistance at 1 frequency 0.01 Hz for REF, CCA and MK.
Analyzing the current histogram in Figure 10 it is possible to observe, at low frequencies, referring to the System Resistance to the polarization of electric charges, in the electrodes (bars / concrete) and resistance to the transfer of charges. Where before the first measurement corresponding to the first month of exposure to NaCl, the maximum corresponds to the MK resistance, with a difference in% in relation to the CCA of 14% and with REF of 8%. From the second measurement to the third, the maximum corresponds to the REF, with a difference in relation to the CCA 22% and the MK 17%. This may be related to the delay in the hydration process of the cement grains provided by the active additions when we compare a common concrete with some concrete with pozzolanic addition [10]. There is the possibility of being described in these first measurements, that I could be mastering the cement hydration process, in each of the materials [21].
From the fourth measurement to the thirteenth, the maximum corresponds to the CCA Resistance, with a difference in relation to the REF in the fourth measurement of 24%, then varying to 86% until measurement 13. The difference of the CCA material in relation to the MK was 4 % in the fourth and fifth measure. From the fifth to the eighth measurement, it was 19% and then it increases to 27% until the 13th measurement. Showing an increase in MK and CCA resistance when compared to REF, which may be showing the efficiency of the existing pozzolanic additions and how you are doing opposing chloride ion entry, possibly overcoming opposition to chloride ions by physical over chemical process[20,24,25].
Observing from the measure number 14 to the last one in 20, the maximum refers to the Resistance of the MK, when compared to the rest of the materials. The difference between MK and REF is 88%, remaining constant until the last measurement. When we compare MK with CCA, this difference, in addition to oscillating, starts at 5%, 29%, 59%, 34%, 63% and 34%. Showing that a chemical phenomenon may be dominating the System's Resistance over physics, as described in the title of the tomography. Based on two performed techniques, one showing that the CCA material has lower porosity than the MK material. This fact would gain importance if the dominant process was physical over the chemical, but as shown by the chloride diffusion test and in the EIE results, a chemical process is dominating the physical before the entry of chloride ions.[13,26]
Figure 11.
Real component of the histogram (Z´) associated with the system resistance at 1 frequency 39Hz for REF, CCA and MK.
Figure 11.
Real component of the histogram (Z´) associated with the system resistance at 1 frequency 39Hz for REF, CCA and MK.
Analyzing the histogram of fig. 11 for the 3 materials, at a frequency of 39Hz, corresponding to the medium frequency range, referring to the Concrete Bar System (bars / concrete). The maximum value of the first measurement, from the first month of exposure to NaCl, until the last measurement 20, corresponds to the strength of the system formed by the MK concrete. When we compare the MK with the results in the REF concrete, we obtain a difference in% in relation to this one, in the first measurement of 8%, from measurement 2, a constant difference was maintained, around 90% on average that oscillates from 85%, gradually increasing until it reaches 94%. Describe the REF concrete system as a material that offers no protection (no resistance) against the passage of chloride ions.
Comparing the MK concrete with the CCA concrete, it is possible to observe in the first measurement a difference between the two resistances of the System of 10%, from the second measurement it starts to oscillate. Showing values between the second and fifth measurements with an average difference of 42%, then from the sixth to the eleventh measurement it decreases to 21%. When you reach measures 12 to 15, it decreases to 10%. Describe from measures 16 and 17 an increase to 53% and finally from 18 to measure 20 it increases again to 76%. Which represents a decrease in the resistance of the CCA material to the entry of the aggressive agent. Specifying that this behavior may be associated with a dominant chemical-physical domain at the steel//concrete interface, being even more visible after measurement 15, located in the eighth month of exposure[8]
Finally, when analyzing the histogram for the 3 materials in fig. 12, at a frequency of 100kHz, corresponding to the high frequency range, referring to the resistance of the electrolyte (concrete + water + NaCl). Since the first measurement corresponding to the first month of exposure to NaCl until the last measurement 20, the maximum corresponds to the MK resistance. Showing a difference in% in relation to the REF in the first measurement of 6%, from measurement 2 onwards a constant difference remained, around 90% of the average that varied from 86%, increasing until it reached 94%. Describing a material that offers no protection (no resistance) against the passage of chloride ions.
Comparing the MK concrete, in relation to the CCA concrete, it is possible to observe in a first measurement a difference between the two resistances of the System was 13%, from the second measurement it starts to oscillate. Showing the values from the second measurement to the fifth with an average difference of 38%, from the sixth measurement to the 13th it decreases to 27%, also decreasing in the measurement from 14 to 6%. Describing from measure 15 to 16% an increase to 44% and finally from measure 17 to measure 20 it again increases to 67%. Quantitatively justified, there is a Resistance System related to a predominantly chemical-physical process, which increased from measurement 15 onwards.
5. Conclution
- Through the results obtained with the use of the tomograph, the highest total porosity was obtained for the REF concrete with 2.48%, decreasing is in the MK with 2.43% and resulting in the smallest of the 3 materials CCA with 1.06 %.
- The diffusion coefficient of chlorides, resulting from the accelerated test regulated by ASTM 1556, presents the highest diffusion velocity for concrete REF Da m2 / s 8.458503e-11, followed by CCA Da m2 / s 1.635352e-11 and resulting with the lowest diffusion coefficient MK Da m2 / s 9.291956e-12.
- Analyzing the real component, attributed to the resistance of the system, through monitoring over time with EIE, it is possible to characterize different concretes, showing differences and quantifying them.
- Low frequencies, around 0.01Hz, related to the resistance in the system (Electrode bars) // concrete, can be related to the physical-chemical resistance provided by the material, with dominance of the physical phenomenon.
- At medium frequencies, around 39Hz, they can be related to the resistance of the concrete / bar system, they can be related to the chemical-physical resistance provided by the material, showing characteristics with dominance for the chemical process that takes place.
- High frequencies in the order of 100kHz, related in the system to the resistance of the electrolyte (concrete + water + NaCl), are related to physical-chemical protection with predominance of the first one.
- The addition of active mineral additives to concrete, of alumino-silicic composition, are extremely protective against the attack of chloride ions. Exhibiting a predominantly physical-chemical protective effect.
References
- v Ribeiro, D. Use of Electrochemical Impedance Spectroscopy (EIS) to monitoring the corrosion of reinforced concrete para monitoramento da corrosão em concreto armado. Rev. IBRACON De Estrut. E Mater. 2015, 8, 529–537. [Google Scholar] [CrossRef]
- Zhou, Y.; Gencturk, B.; Willam, K.; Attar, A. Carbonation-Induced and Chloride-Induced Corrosion in Reinforced Concrete Structures. J. Mater. Civ. Eng. 2015, 27. [Google Scholar] [CrossRef]
- Figueira, R.B. Electrochemical Sensors for Monitoring the Corrosion Conditions of Reinforced Concrete Structures: A Review. Appl. Sci. 2017, 7, 1157. [Google Scholar] [CrossRef]
- Ismail, M.; Ohtsu, M. Corrosion rate of ordinary and high-performance concrete subjected to chloride attack by AC impedance spectroscopy. Constr. Build. Mater. 2006, 20, 458–469. [Google Scholar] [CrossRef]
- Tutti, K. Corrosion of steel in concrete. Swed. Cem. Conc. Res. Ins. 1982, 17–21. [Google Scholar]
- Chi, L.; Wang, Z.; Lu, S.; Zhao, D.; Yao, Y. Development of mathematical models for predicting the compressive strength and hydration process using the EIS impedance of cementitious materials. Constr. Build. Mater. 2019, 208, 659–668. [Google Scholar] [CrossRef]
- Helene, P.; Terzian, P. Design and control of concrete manual (in Portuguese). 1993, 349.
- Talero, R.; Pedrajas, C.; Delgado, A.; Rahhal, V. Valorización de residuos agroindustriales incinerados como adición puzolánica. Estudio comparativo con el humo de sílice español. Mater. De Construcción 2009, 59, 53–89. [Google Scholar] [CrossRef]
- Banthia, N.; Zanotti, C.; Sappakittipakorn, M. Sustainable fiber reinforced concrete for repair applications. Constr. Build. Mater. 2014, 67, 405–412. [Google Scholar] [CrossRef]
- Del, D. Tesis doctoral, (n.d.).
- R.M. Rentería, Contribución al estudio analítico y físico-químico del sistema cementos portland -puzolanas y escoria siderúrgica- cloruros y agua, 49 (1997) 1997.
- R.M. Rentería, Contribución al estudio analítico y físico-químico del sistema cementos portland -puzolanas y escoria siderúrgica- cloruros y agua, 49 (1997) 1997.
- Talero, R.; Trusilewicz, L.; Delgado, A.; Pedrajas, C.; Lannegrand, R.; Rahhal, V.; Mejía, R.; Delvasto, S.; Ramírez, F. Comparative and semi-quantitative XRD analysis of Friedel’s salt originating from pozzolan and Portland cement. Constr. Build. Mater. 2011, 25, 2370–2380. [Google Scholar] [CrossRef]
- Chung, S.-Y.; Kim, J.-S.; Stephan, D.; Han, T.-S. Overview of the use of micro-computed tomography (micro-CT) to investigate the relation between the material characteristics and properties of cement-based materials. Constr. Build. Mater. 2019, 229, 116843. [Google Scholar] [CrossRef]
- Diamond, S.; Wild, S. A discussion of the paper ‘‘Mercury porosimetry—an inappropriate method for the measurement of pore size distributions in cement-based”. Cem. Concr. Res. 2001, 31, 1653–1654. [Google Scholar]
- Khatib, J.; Wild, S. Pore size distribution of metakaolin paste. Cem. Concr. Res. 1996, 26, 1545–1553. [Google Scholar] [CrossRef]
- Du Plessis, A.; Olawuyi, B.J.; Boshoff, W.P.; le Roux, S.G. Simple and fast porosity analysis of concrete using X-ray computed tomography. Mater. Struct. Constr. 2016, 49, 553–562. [Google Scholar] [CrossRef]
- Park, K.-B.; Kwon, S.-J.; Wang, X.-Y. Analysis of the effects of rice husk ash on the hydration of cementitious materials. Constr. Build. Mater. 2016, 105, 196–205. [Google Scholar] [CrossRef]
- Zain, M.; Islam, M.; Mahmud, F.; Jamil, M. Production of rice husk ash for use in concrete as a supplementary cementitious material. Constr. Build. Mater. 2011, 25, 798–805. [Google Scholar] [CrossRef]
- Shekarchi, M.; Bonakdar, A.; Bakhshi, M.; Mirdamadi, A.; Mobasher, B. Transport properties in metakaolin blended concrete. Constr. Build. Mater. 2010, 24, 2217–2223. [Google Scholar] [CrossRef]
- Figueiredo, C.P.; Santos, F.B.; Cascudo, O.; Carasek, H.; Cachim, P.; Velosa, A. The role of metakaolin in the protection of concrete against the deleterious action of chlorides O papel do metacaulim na proteção dos concretos contra a ação deletéria de cloretos. Rev. IBRACON De Estrut. E Mater. 2014, 7, 685–708. [Google Scholar] [CrossRef]
- Ribeiro, D.V. Use of Electrochemical Impedance Spectroscopy (EIS) to monitoring the corrosion of reinforced concrete para monitoramento da corrosão em concreto armado. Rev. IBRACON De Estrut. E Mater. 2015, 8, 529–537. [Google Scholar] [CrossRef]
- De, S. Modelos de circuitos equivalentes para explicar espectros de impedância de dispositivos de efeito de campo. 2013.
- Poon, C.; Kou, S.; Lam, L. Compressive strength, chloride diffusivity and pore structure of high performance metakaolin and silica fume concrete. Constr. Build. Mater. 2006, 20, 858–865. [Google Scholar] [CrossRef]
- Sakai, Y. Relationship between pore structure and chloride diffusion in cementitious materials. Constr. Build. Mater. 2019, 229, 116868. [Google Scholar] [CrossRef]
- Saraswathy, V.; Song, H.-W. Corrosion performance of rice husk ash blended concrete. Constr. Build. Mater. 2007, 21, 1779–1784. [Google Scholar] [CrossRef]

Table 1.
Chemical composition of carbon steel (%).
| Elenento | % |
| C | 0,237 |
| Si | 0,195 |
| Mn | 0,773 |
| P | 0,0044 |
| S | 0,0474 |
| Cr | 0,0809 |
| Mo | 0,0083 |
| Ni | 0,0499 |
| Al | 0,02210 |
| Co | <0,01 |
| Cu | 0,082 |
| Nb | 0,0055 |
| Ti | 0,032 |
| V | <0,001 |
| W | <0,01 |
| Pb | <0,002 |
| Sn | 0,0027 |
| Mg | <0,002 |
| B | >0,132 |
| Fe | <98,2 |
Table 2.
Chemical composition of Portland cement CP-V ARI HOLCIM, obtained by X-ray fluorescence (XRF).
Table 2.
Chemical composition of Portland cement CP-V ARI HOLCIM, obtained by X-ray fluorescence (XRF).
| FRX | CaO | SiO2 | Al2O3 | Fe2O3 | MgO | SO3 | Na2O | K2O | CaO | SrO | P2O5 | TiO2 | MnO | PPC | ||||
| % | 63,6 | 17.6 | 5.1 | 2.9 | 0.72 | 3.9 | 0.29 | 0.85 | 37.39 | 0.27 | 0.27 | 0.22 | 0.12 | 3.9 | ||||
| Composição Potencial de Bogue | Composto | C3S | C2S | C3A | C4AF | |||||||||||||
| % | 60,15 | 5,08 | 8,61 | 8,82 | ||||||||||||||
laboratorios CETEM/ cidade universitaria.
Table 5.
– mix designs based on unit weight.
| Cement | M | w/c | Mortar ratio % |
Mix Unit |
Slump cm |
Resistencia Compression (MPa) |
| CP-V ARI HOLCIM | 5,94 | 0,70 | 53 | 1:2,679:3,262 | 12 | 26 |
| 5,94 | 0,70 | 53 | 1:2,679:3,262:10% CCA | 8 | 28 | |
| 5,94 | 0,70 | 53 | 1:2,679:3,262:10% MK | 7,5 | 27 |
Table 6.
– mix designs based on unit weight.
| Deep (mm) | Ref-N (mg/l) | CCA (mg/l) | MK (mg/l) |
| 0-5 | 0,500 | 0,812 | 0,804 |
| 5-10 | 0,384 | 0,388 | 0,296 |
| 10-15 | 0,268 | 0,188 | 0,096 |
| 15-20 | 0,200 | 0,104 | 0,08 |
| 20-25 | 0,164 | 0,08 | 0,032 |
| 25-30 | 0,140 | 0,06 | 0,024 |
| 30-35 | 0,132 | 0,052 | 0,02 |
| Da m2/s | 8.458503e-11 | 1.635352e-11 | 9.291956e-12 |
| Cs% | 0.5653683 | 1.240761 |
1.49701 |
Table 7.
– Number of pores by size range or area, for REF concrete before and after chloride absorption.
Table 7.
– Number of pores by size range or area, for REF concrete before and after chloride absorption.
| Interval mm2 |
REF Sem Chloride (NaCl) |
REF Com chloride (NaCl) |
| 0.00-0.13 | 188289 | 112982 |
| 0.13-0.26 | 108828 | 147894 |
| 0.26-0.52 | 85360 | 123750 |
| 0.52-1.05 | 45006 | 53127 |
| 1.05-2.09 | 18131 | 19609 |
| 2.09-4.19 | 5319 | 5561 |
| 4.19-8.38 | 503 | 552 |
| TOTAL | 2.48% | 2.80% |
Table 8.
– Number of pores by size range or area, for CCA concrete before and after chloride absorption.
Table 8.
– Number of pores by size range or area, for CCA concrete before and after chloride absorption.
| Interval mm2 |
CCA Sin Chloride (NaCl) | CCA Com chloride (NaCl) |
| 0.00-0.13 | 35487 | 105340 |
| 0.13-0.26 | 34256 | 91903 |
| 0.26-0.52 | 25485 | 49819 |
| 0.52-1.05 | 15551 | 21077 |
| 1.05-2.09 | 8668 | 9911 |
| 2.09-4.19 | 2849 | 3233 |
| 4.19-8.38 | 348 | 462 |
| 8.38-16.75 | 1 | 11 |
| 16.75-33.5 | 1 | |
| TOTAL | 1.06% | 1.32% |
Table 9.
– Number of pores by size range or area, for MK concrete before and after chloride absorption.
Table 9.
– Number of pores by size range or area, for MK concrete before and after chloride absorption.
| Interval | MK Sem Chloride (NaCl) | MK Com chloride (NaCl) |
| 0.00-0.13 | 64516 | 112982 |
| 0.13-0.26 | 91914 | 147894 |
| 0.26-0.52 | 80558 | 123750 |
| 0.52-1.05 | 42482 | 53127 |
| 1.05-2.09 | 17430 | 19609 |
| 2.09-4.19 | 4864 | 5561 |
| 4.19-8.38 | 979 | 552 |
| 8.38-16.76 | 4 | |
| TOTAL | 2.43% | 2.60% |
Table 10.
- Real component (Z') for REF associated with system resistance at 3 frequencies, 100kHz, 39Hz 0.01Hz.
Table 10.
- Real component (Z') for REF associated with system resistance at 3 frequencies, 100kHz, 39Hz 0.01Hz.
| Frequency/Hz | REF-months/ Z´kΩ | |||||||||||||||||||
|---|---|---|---|---|---|---|---|---|---|---|---|---|---|---|---|---|---|---|---|---|
| 1 | 2 | 3 | 4 | 5 | 6 | 7 | 8 | 9 | 10 | 11 | 12 | 13 | 14 | 15 | 16 | 17 | 18 | 19 | 20 | |
| 100k | 124 | 15 | 15 | 22 | 14 | 10 | 10 | 10 | 9 | 10 | 10 | 10 | 10 | 8 | 8 | 6 | 5 | 5 | 4 | 3 |
| 39 | 134 | 17 | 17 | 24 | 15 | 11 | 11 | 11 | 10 | 11 | 11 | 11 | 10 | 9 | 9 | 7 | 6 | 6 | 4 | 3 |
| 0.01 | 308 | 251 | 246 | 154 | 44 | 28 | 27 | 28 | 26 | 26 | 25 | 25 | 24 | 21 | 25 | 19 | 18 | 17 | 13 | 9 |
Table 11.
- Imaginary component (Z”) for REF associated with system resistance at 3 frequencies, 100kHz, 39Hz 0.01Hz.
Table 11.
- Imaginary component (Z”) for REF associated with system resistance at 3 frequencies, 100kHz, 39Hz 0.01Hz.
| Frequency/Hz | REF-months/ Z´´kΩ | |||||||||||||||||||
|---|---|---|---|---|---|---|---|---|---|---|---|---|---|---|---|---|---|---|---|---|
| 1 | 2 | 3 | 4 | 5 | 6 | 7 | 8 | 9 | 10 | 11 | 12 | 13 | 14 | 15 | 16 | 17 | 18 | 19 | 20 | |
| 100k | 12 | 0.64 | 0.68 | 0.77 | 0.61 | 0.45 | 0.43 | 0.42 | 0.33 | 0.42 | 0.41 | 0.33 | 0.35 | 0.30 | 0.22 | 0.16 | 0.11 | 0.09 | 0.06 | 0.01 |
| 39 | 1.95 | 1.10 | 1.09 | 0.90 | 0.64 | 0.44 | 0.45 | 0.41 | 0.38 | 0.38 | 0.38 | 0.36 | 0.33 | 0.32 | 0.34 | 0.29 | 0.28 | 0.27 | 0.25 | 0.19 |
| 0.01 | 325 | 398 | 459 | 295 | 32 | 14 | 12 | 13 | 13 | 13 | 12 | 12 | 12 | 10 | 13 | 10 | 9.74 | 9.13 | 6 | 5 |
Table 12.
- Real component (Z') for CCA associated with system resistance at 3 frequencies, 100kHz, 39Hz 0.01Hz.
Table 12.
- Real component (Z') for CCA associated with system resistance at 3 frequencies, 100kHz, 39Hz 0.01Hz.
| Frequency/Hz | CCA-months/ Z´kΩ | |||||||||||||||||||
|---|---|---|---|---|---|---|---|---|---|---|---|---|---|---|---|---|---|---|---|---|
| 1 | 2 | 3 | 4 | 5 | 6 | 7 | 8 | 9 | 10 | 11 | 12 | 13 | 14 | 15 | 16 | 17 | 18 | 19 | 20 | |
| 100k | 114 | 60 | 70 | 73 | 62 | 77 | 81 | 88 | 85 | 74 | 82 | 78 | 84 | 94 | 37 | 48 | 19 | 20 | 25 | 13 |
| 39 | 131 | 69 | 80 | 85 | 72 | 92 | 97 | 98 | 109 | 106 | 93 | 104 | 100 | 107 | 112 | 47 | 61 | 23 | 24 | 15 |
| 0.01 | 287 | 188 | 198 | 205 | 181 | 212 | 219 | 221 | 244 | 240 | 203 | 222 | 227 | 146 | 118 | 149 | 46 | 63 | 62 | 34 |
Table 13.
- Imaginary component (Z ”) for CCA associated with system resistance at 3 frequencies, 100kHz, 39Hz 0.01Hz.
Table 13.
- Imaginary component (Z ”) for CCA associated with system resistance at 3 frequencies, 100kHz, 39Hz 0.01Hz.
| Frequency/Hz | CCA-months/ Z´´kΩ | |||||||||||||||||||
|---|---|---|---|---|---|---|---|---|---|---|---|---|---|---|---|---|---|---|---|---|
| 1 | 2 | 3 | 4 | 5 | 6 | 7 | 8 | 9 | 10 | 11 | 12 | 13 | 14 | 15 | 16 | 17 | 18 | 19 | 20 | |
| 100k | 18 | 7 | 9 | 10 | 8 | 12 | 13 | 14 | 16 | 15 | 14 | 17 | 16 | 17 | 15 | 5 | 6 | 1 | 3 | 1 |
| 39 | 2 | 1.74 | 1.85 | 1.83 | 1.57 | 1.98 | 2.1 | 2.13 | 2.42 | 2.38 | 2.3 | 2.4 | 2.3 | 2.49 | 1.8 | 1.9 | 2.4 | 0.8 | 0.70 | 0.74 |
| 0.01 | 394 | 200 | 262 | 182 | 145 | 167 | 183 | 157 | 184 | 183 | 117 | 127 | 121 | 137 | 50 | 66 | 13 | 26 | 23 | 10 |
Table 14.
- Real component (Z') for MK associated with system resistance at 3 frequencies, 100kHz, 39Hz 0.01Hz.
Table 14.
- Real component (Z') for MK associated with system resistance at 3 frequencies, 100kHz, 39Hz 0.01Hz.
| Frequency/Hz | MK-months/ Z´kΩ | |||||||||||||||||||
|---|---|---|---|---|---|---|---|---|---|---|---|---|---|---|---|---|---|---|---|---|
| 1 | 2 | 3 | 4 | 5 | 6 | 7 | 8 | 9 | 10 | 11 | 12 | 13 | 14 | 15 | 16 | 17 | 18 | 19 | 20 | |
| 100k | 132 | 109 | 114 | 114 | 97 | 106 | 115 | 119 | 119 | 117 | 112 | 100 | 106 | 100 | 112 | 86 | 83 | 53 | 54 | 55 |
| 39 | 147 | 121 | 125 | 127 | 107 | 118 | 129 | 133 | 134 | 133 | 129 | 116 | 124 | 119 | 131 | 102 | 99 | 65 | 64 | 66 |
| 0.01 | 337 | 208 | 202 | 197 | 173 | 170 | 181 | 180 | 173 | 171 | 166 | 151 | 161 | 155 | 168 | 136 | 136 | 131 | 95 | 92 |
Table 15.
- Imaginary component (Z ”) for MK associated with system resistance at 3 frequencies, 100kHz, 39Hz 0.01Hz.
Table 15.
- Imaginary component (Z ”) for MK associated with system resistance at 3 frequencies, 100kHz, 39Hz 0.01Hz.
| Frequency/Hz | MK-months/ Z´´kΩ | |||||||||||||||||||
|---|---|---|---|---|---|---|---|---|---|---|---|---|---|---|---|---|---|---|---|---|
| 1 | 2 | 3 | 4 | 5 | 6 | 7 | 8 | 9 | 10 | 11 | 12 | 13 | 14 | 15 | 16 | 17 | 18 | 19 | 20 | |
| 100k | 17 | 13 | 14 | 14 | 11 | 13 | 16 | 16 | 16 | 17 | 18 | 16 | 16 | 17 | 19 | 14 | 12 | 9 | 7 | 8 |
| 39 | 3.1 | 1.86 | 1.88 | 1.84 | 1.60 | 1.66 | 175 | 1.77 | 1.73 | 1.81 | 1.77 | 1.67 | 1.81 | 1.77 | 1.6 | 1.8 | 1.79 | 1.91 | 1.71 | 1.41 |
| 0.01 | 407 | 73 | 56 | 42 | 39 | 25 | 24 | 22 | 18 | 16 | 16 | 16 | 16 | 15 | 15 | 11 | 12 | 12 | 10 | 10 |
Table 16.
- Real component (Z') for REF, CCA, MK associated with system resistance at 3 frequencies, 100kHz, 39Hz 0.01Hz..
Table 16.
- Real component (Z') for REF, CCA, MK associated with system resistance at 3 frequencies, 100kHz, 39Hz 0.01Hz..
| DF | Sum of Squares | Mean Square | F Value | P Value | |
|---|---|---|---|---|---|
| Material | 2 | 294150,1 | 147075,1 | 64,21017 | 0 |
| Frequencias | 2 | 211040,7 | 105520,4 | 46,06819 | 1,11E-16 |
| Interaction | 4 | 23182,76 | 5795,691 | 2,53029 | 0,04219 |
| Model | 8 | 530497,1 | 66312,14 | 28,95062 | 0 |
| Error | 177 | 405423 | 2290,526 | -- | -- |
| Corrected Total | 185 | 935920,2 | -- | -- | -- |
Disclaimer/Publisher’s Note: The statements, opinions and data contained in all publications are solely those of the individual author(s) and contributor(s) and not of MDPI and/or the editor(s). MDPI and/or the editor(s) disclaim responsibility for any injury to people or property resulting from any ideas, methods, instructions or products referred to in the content. |
© 2023 by the authors. Licensee MDPI, Basel, Switzerland. This article is an open access article distributed under the terms and conditions of the Creative Commons Attribution (CC BY) license (http://creativecommons.org/licenses/by/4.0/).
Copyright: This open access article is published under a Creative Commons CC BY 4.0 license, which permit the free download, distribution, and reuse, provided that the author and preprint are cited in any reuse.


