
Submitted:
29 January 2025
Posted:
30 January 2025
You are already at the latest version
Abstract
This study investigates the long-term corrosion behavior of reinforced concrete (RC) subjected to accelerated chloride ingress over approximately 1600 days, employing electrochemical methods such as linear polarization resistance (LPR), electrochemical impedance spectroscopy (EIS), and galvanostatic pulse (GP) testing. Two concrete mixes (T1 and T2), incorporating distinct supplementary cementitious materials (SCMs), were evaluated to determine their performance in aggressive environments. Specimens with varying reservoir lengths were exposed to a 10% NaCl solution, with electromigration applied to accelerate chloride transport. Electrochemical assessments, including measurements of rebar potential, concrete solution resistance, corrosion current, and mass loss, were conducted to monitor the degradation of embedded steel. The findings revealed that smaller reservoirs (2.5 cm) significantly restricted chloride and moisture penetration, reducing corrosion, while larger reservoirs (10 cm) resulted in greater exposure and higher corrosion activity. Additionally, T1 mixes (cement replacement of 20% fly ash and 50% slag) showed higher corrosion currents and mass loss, whereas T2 mixes (cement replacement of 20% fly ash and 8% silica fume) demonstrated enhanced matrix densification, reduced permeability, and superior durability. These results underscore the importance of mix design and exposure conditions in mitigating corrosion, providing critical insights for improving the longevity of RC structures in aggressive environments.
Keywords:
Steel rebar
; Reservoir length
; Fly ash
; Slag
; Silica fume
; Corrosion current
; Mass loss
Introduction
The deterioration of reinforced concrete (RC) structures, particularly in marine environments and regions with high humidity, is predominantly driven by the corrosion of embedded steel reinforcements [1,2,3]. Corrosion critically undermines the structural integrity of these systems, resulting in a reduction of the steel reinforcement's cross-sectional area and a marked decrease in the service life of the structure. A primary factor responsible for initiating this degradation is the ingress of chloride ions, which catalyze a gradual yet persistent corrosion process [4,5,6]. The subtle and insidious nature of this progression often delays the manifestation of visible damage, making it challenging to collect timely and actionable data for implementing effective maintenance and repair strategies.
Moreover, a significant research gap exists in understanding the early stages and progression of steel reinforcement corrosion. This limitation is further exacerbated by the fact that natural corrosion damage in RC structures can take years to become apparent, thereby complicating intervention strategies and increasing the associated maintenance costs [7,8,9,10]. To mitigate these challenges, numerous studies have investigated the potential of supplementary cementitious materials (SCMs) like silica fume, fly ash, and slag in enhancing concrete durability and reducing corrosion risks [11,12,13,14]. Silica fume is particularly noted for its ability to substantially improve concrete durability, while fly ash and slag are recognized for their superior workability and cost-effectiveness.
Torii [15] demonstrated that concrete with 50% slag content provides chloride penetration resistance comparable to that of concrete containing 10% silica fume. The SCMs, when finely ground and fully hydrated, significantly improve the microstructure of concrete by reducing porosity, filling voids, and obstructing diffusion pathways for chloride ions and other aggressive agents. These microstructural enhancements greatly bolster the material's resistance to degradation in harsh environmental conditions.
The current study aimed to evaluate the performance of two innovative ternary concrete mixes under accelerated chloride exposure. The experimental design involved tailoring the anode length by modifying the solution reservoir dimensions. To expedite the chloride ion penetration process, the method of electromigration was employed, as validated by previous research [16,17,18]. This method enabled controlled initiation of steel reinforcement corrosion within weeks to a month, offering a practical and time-efficient alternative to the prolonged timelines required for natural corrosion processes.
The corrosion in reinforced concrete was monitored for about 1600 days using electrochemical techniques like linear polarization resistance (LPR), electrochemical impedance spectroscopy (EIS), and the galvanostatic pulse (GP) method. These techniques enabled the periodic measurement of critical parameters such as rebar potential, which provided insights into the likelihood of corrosion initiation; concrete solution resistance, which reflected the ionic conductivity of the concrete matrix and its susceptibility to aggressive agents; corrosion current, which quantified the rate of steel deterioration; and mass loss, offering direct evidence of material degradation. This comprehensive data collection approach not only provided a detailed understanding of the corrosion process but also illuminated its implications for the long-term structural integrity and durability of reinforced concrete structures. The findings generated valuable insights into strategies for mitigating corrosion and enhancing the service life of such structures, particularly in environments prone to aggressive chemical exposure.
Materials and Methods
1.1. Materials and specimen preparation
For the experimental investigation, two unique RC mixtures, designated as T1 and T2, were prepared. Mix T1 comprised 20% fly ash and 50% ground granulated blast furnace slag (GGBS) as partial replacements for cement, while mix T2 consisted of 20% fly ash and 8% silica fume. The detailed mix proportions are provided in Table 1, with additional specifications available in reference [19].
The preparation of steel reinforcement rebar was meticulous to ensure uniformity and accuracy. The rebars were cut to the desired size and thoroughly wire-brushed to remove rust, mill scale, and other contaminants. A hexane solution was used to clean the rebars, eliminating any residual grease or impurities to ensure optimal bonding with the concrete matrix during casting. Concrete specimens, measuring 30.5 cm × 30.5 cm × 7.6 cm, were cast, each embedding three rebar segments with a diameter of 0.63 cm and a concrete cover of 2.5 cm. A total of four specimens were cast for each mix type, T1 and T2.
The specimens were then placed on the surface where they would eventually serve as the bottom during the testing process. The embedded stainless steel mesh or titanium mixed metal oxide (TiMMO) mesh was carefully aligned at the center of the embedded rebar to maintain uniform contact with the chloride ions. The mesh dimensions varied, with lengths ranging between 2.5 cm and 10 cm and a width of approximately 3 cm, strategically designed to facilitate the accelerated migration of chloride ions. After 24 hours, the molds were stripped, and the specimens were transferred to a fog room to begin the curing process.
The curing phase was conducted in multiple stages to ensure optimal hydration and material performance. Initially, the specimens were kept in a high humidity environment at the State Materials Office of the Florida Department of Transportation (FDOT- SMO) for about one month. Following this initial curing period, the specimens were transported to the FAU-SeaTech campus for further conditioning. At FAU-SeaTech, the specimens were initially stored in a high humidity chamber to maintain moisture levels while preparations for the experimental setup were finalized.
Around 40 days post-casting, a key experimental element—the solution reservoir—was securely attached to the top surface of each specimen using marine-grade adhesives to create a watertight seal. These reservoirs played a vital role in initiating corrosion by being filled with a 10% sodium chloride (NaCl) solution to mimic chloride exposure. Prior to their installation, the specimens were kept in a controlled high-humidity environment for an additional 3 to 7 days to maintain moisture levels and ensure the surfaces were adequately prepared.
Once the reservoirs were in place, stainless steel or TiMMO electrodes, matching the dimensions of the embedded meshes, were installed on the reservoir's surface. This ensured a direct connection between the external electrodes and the embedded mesh system, completing the electrochemical setup. To minimize chemical leaching from the concrete surface during testing, a 1 cm wide section of the concrete around the reservoir was treated with a saturated calcium hydroxide solution. Finally, the specimens were placed on white plastic mesh supports to prevent contamination and ensure consistent exposure conditions, thus maintaining the integrity of the experimental setup.
1.1. Electromigration experimental setup
A power source was utilized to develop an electric field between the bottom and top meshes of each sample to help accelerate the chloride ions' entry into the concrete structures. This method aims to drive the NaCl solution above the rebar into the reinforcement matrix. The setup consisted of attaching the negative terminal of the power supply to the electrode immersed in the NaCl solution reservoir, while the positive terminal was connected to the mesh embedded within the concrete specimen. A schematic representation of this electromigration experimental setup is provided in Figure 1.
The application of the electromigration technique began with an initial voltage of 9 V across the system. During this phase, the rebar potential relative to a saturated calomel reference electrode (SCE) was continuously monitored, and a value exceeding +2 V was observed. After a duration of 7 days, the applied voltage was reduced to 3 V to adjust for changes in system behavior. The current flowing through the system was determined by measuring the voltage drop across a 100-ohm resistor, providing insights into the current magnitude during extended application periods. When the power supply was disconnected, the rebar potential was recorded with respect to the SCE to assess the progression of corrosion.
Although there was no direct electrical connection to the rebars, they became polarized due to the ionic current generated by the applied electric field. The corrosion activity was evaluated by monitoring the rebar potential over a specified period, typically up to two hours, after disconnecting the system. If the potential readings indicated that corrosion had not yet occurred, the applied electric field was reactivated, and the process continued. The electromigration procedure was sustained until the rebar exhibited an "off" potential of -0.150 Vsce or a more negative value, which is recognized as a threshold for corrosion initiation. This threshold value is supported by previous studies, which identified a potential of -0.150 Vsce, equivalent to -0.220 VCSE, as indicative of corrosion initiation [16].
To organize and interpret the experimental data, Table 2 summarizes the labeling system for each specimen. Table 2 includes key details such as sample names, the length of the solution reservoir, the total duration of the electromigration process, and the accumulated total Ampere-hour values applied. It is noteworthy that during the initial stages of the experiment, multiple electromigration cycles were conducted on each specimen to ensure thorough chloride penetration and to replicate natural conditions more effectively.
Electrochemical Measurements
Following the completion of the electromigration process, the rebar potential was monitored during the corrosion propagation phase using a SCE and a high-impedance voltmeter. To ensure accurate results, concrete solution resistance (Rs) and polarization resistance (Rc) measurements were taken at least 48 hours after disconnecting the system. The Rc value was calculated by subtracting Rs from the apparent polarization resistance. The EIS test was conducted across a frequency range of 10 kHz to 1 Hz, with Rs determined at an impedance magnitude of 54.51 Hz. These measurements were performed prior to LPR testing. The LPR procedure initially spanned a potential range from 10 mV below the open circuit potential (OCP) to 1 mV above it. After six months, LPR measurements were refined to cover 8 mV below the OCP to the OCP, using a precise scan rate of either 0.1 mV/s or 0.05 mV/s. The LPR and EIS tests were conducted at least once per month.
Beginning in April 2017, GP tests were introduced as an alternative technique for determining the values of Rs and Rc. These measurements were conducted approximately once a month during the corrosion propagation stage. Initially, a current pulse of 10 μA was applied. However, to ensure that the polarization potential did not exceed 25 mV from the instantaneous "on" value (defined as the voltage difference between the value at 0.2 seconds and the final "on" reading of the test), the current was adjusted when required.
The duration of the GP tests varied to accommodate the evolving behavior of the rebar. Early tests ran for 140 seconds, but this was extended to 300 seconds in subsequent measurements, as the slope of the potential-time curve for some rebars had not stabilized within the shorter timeframe. A compromise was reached for later tests, which were conducted for 200 seconds. The GP device first measured the OCP of the rebar for several seconds before applying the pulse. Once the current pulse was applied, the rebar potential was recorded at 0.2-second intervals to observe changes over time. The Rs from the GP test, was calculated using the rebar potential immediately prior to the current pulse and the initial "on" potential reading. The Rc was determined from the difference between the initial "on" potential and the rebar's potential at 200 seconds, divided by the applied current.
To estimate the corrosion rate, Rc values derived from LPR and GP readings were converted into corrosion current (Icorr) using the Stern-Geary equation, Icorr = B/Rp, where Rp is the polarization resistance (equivalent to Rc), and B is the Stern-Geary coefficient. For active corrosion conditions in concrete, a B value of 26 mV was selected, as this value is frequently recommended by researchers for steel experiencing active corrosion [20,21,22]. This approach aligns with established practices that use a B value of 52 mV for passive steel and 13–52 mV depending on corrosion activity [20,21,22]. The calculated Icorr values were further used to estimate steel mass loss using Faraday's law.
Results and Discussion
1.1. Evolution of rebar potential, Rs, and Rc
In the figures (Figure 2 and Figure 3), "Day zero" marks the start of solution introduction into the reservoir, not the specimen's age. Corrosion propagation is shown to the right of the dashed line, with arrows indicating the post-electromigration phase. When two dashed lines appear, the interval between them represents the total electromigration exposure time, while the blue prisms highlight the "system on" period when the electric field was applied.
Figure 2 illustrates the evolution in rebar potential, Rs, and Rc, measured via the LPR/EIS technique, for three rebars (25X-A, 25X-B, and 25X-C) within the T1 sample, which employed a 5 cm reservoir length. All rebars exhibited negative potential values and relatively low Rc values, with significant changes observed within approximately 40 days during the electromigration phase. For 25X-A, the potential dropped sharply after electromigration ended, reaching -0.592 Vsce by day 288, before gradually shifting towards more positive values. During this period, Rs values steadily increased, while Rc values remained below 2 kΩ throughout the monitoring period. For 25X-B, the potential similarly declined after electromigration ceased, reaching -0.545 Vsce by day 195. Following this, the potential fluctuated until day 750, gradually trending more positive. The Rs values showed a consistent rise, while Rc values varied but mostly stayed below 1.5 kΩ. In the case of 25X-C, the potential significantly dropped to -0.579 Vsce by day 167 post-electromigration and gradually became more positive over time. The Rs values continued to rise, while Rc values exhibited fluctuations during the monitoring period. By day 534, the rebar potentials were measured at -0.581 Vsce for 25X-A, -0.499 Vsce for 25X-B, and -0.306 Vsce for 25X-C, highlighting distinct differences among the rebars. These findings align with similar observations reported in previous studies [19,23,24,25].
Figure 3 depicts the evolution in rebar potential, Rs, and Rc, measured through the LPR/EIS technique, for three rebars in the T2 sample (32X), identified as 32X-A, 32X-B, and 32X-C, with a 5 cm reservoir length. All rebars showed negative potential values and lower Rc values within approximately 12 days during the electromigration process. For 32X-A, the rebar potential dropped significantly after electromigration ended, reaching -0.594 Vsce by day 244, then fluctuated and gradually moved toward more positive values. The Rs values steadily increased, while Rc values varied throughout the monitoring period. Similarly, the rebar potential of 32X-B sharply decreased to -0.620 Vsce by day 244 after electromigration ceased, eventually trending more positive over time. Both Rs and Rc values fluctuated during the observation period. For 32X-C, the rebar potential also declined significantly to -0.619 Vsce by day 244, fluctuating before gradually becoming more positive. The Rs values showed a consistent upward trend, while Rc values exhibited fluctuations throughout the monitoring period. By day 513, the recorded rebar potentials were -0.367 Vsce for 32X-A, -0.369 Vsce for 32X-B, and -0.323 Vsce for 32X-C, highlighting variations across the rebars. These findings emphasize the distinct behaviors of rebar potential, Rs, and Rc values over time, with additional comparisons provided in references [19,26,27] for other T1 and T2 specimens.
The variation in rebar (corrosion) potential observed in reinforced concrete samples can be attributed to the varying levels of corrosion activity in different areas of the material. Several factors contribute to these changes, including differences in the concrete mix, oxygen availability, moisture levels, and chloride concentrations. These elements create localized areas of corrosion, leading to fluctuations in the overall potential. Additionally, environmental conditions such as temperature and humidity significantly affect the electrochemical reactions occurring at the steel reinforcement, further influencing the corrosion potential. As these conditions change, they alter the rate of corrosion and modify the electrochemical behavior, causing shifts in rebar potential. Therefore, the fluctuations in rebar potential reflect the complex and dynamic nature of the corrosion process, shaped by the interaction of these environmental factors.
1.1. Evolution of Icorr with time
This section presents the temporal evolution of Icorr, measured via the GP technique, for specimens made from different concrete mixes and containing three rebars. It is important to highlight that in most of the plots shown in Figure 4 and Figure 5, day zero represents the introduction of the solution into the reservoir, rather than the actual age of the specimens. Since the solution reservoirs were installed at different times, the number of days since the initial filling varies across samples. For the T1 and T2 specimens with three rebars, Icorr readings were taken from day 200 to day 1600, and the corresponding plots in Figure 4 and Figure 5 were generated based on these readings using the GP method.
Figure 4 illustrates the variation of Icorr over time for T1 specimens with different reservoir lengths and three embedded rebars (A, B, and C). For the specimen with a 2.5 cm reservoir length (T1-26X), Icorr begins at a high level (around 40-50 µA), rapidly declines within the first 200 days, and stabilizes below 10 µA by 600 days. This indicates an initial phase of active corrosion likely due to aggressive chloride ingress, followed by the formation of protective layers and limited ion availability. In the case of a 5 cm reservoir length (T1-25X), Icorr starts at moderate levels (around 20-25 µA) with significant fluctuations during the first 600 days, stabilizing around 10-15 µA between 600 and 1400 days, and showing a late-phase increase (up to ~30 µA for rebar C) after 1400 days. The larger reservoir likely prolonged moisture and ion ingress, causing periodic spikes in corrosion activity and suggesting a localized breakdown of protective layers. Meanwhile, the specimen with a 5 cm reservoir length (T1-28X) demonstrates superior corrosion resistance, with Icorr starting low (around 5-10 µA) and remaining stable with minimal fluctuation, likely due to enhanced densification and reduced chloride diffusion achieved by the fly ash and slag. For the specimen with a 10 cm reservoir length (T1-27X), Icorr initially starts high (around 30–40 µA) during the first 200 days, reflecting active corrosion due to incomplete hydration. Between 200 and 1000 days, Icorr decreases significantly (around 10–20 µA) as the fly ash and slag improve the concrete's durability by reducing permeability and ion ingress. After 1000 days, a slight increase (around 10–30 µA) indicates possible re-initiation of corrosion due to chloride accumulation. When comparing all cases, smaller reservoirs (2.5 cm) exhibit rapid corrosion initiation due to aggressive ion ingress in the early stages. However, the limited size of the reservoir restricts the continuous supply of chlorides and moisture, resulting in lower long-term corrosion rates as the system stabilizes. In contrast, larger reservoirs (10 cm) provide a sustained pathway for chloride and moisture ingress, leading to prolonged corrosion activity over time, as reflected by higher long-term corrosion rates and periodic spikes in the Icorr values. Among the specimens, T1-28X specimen demonstrates significantly better performance compared to T1-25X specimen. The consistently lower Icorr values observed in T1-28X highlights the superior corrosion resistance achieved through the optimized material composition, specifically the use of fly ash and slag, which improve the concrete's microstructure by reducing porosity and permeability. Additionally, effective curing conditions contribute to enhanced densification and the formation of robust passive layers on the steel rebars.
Figure 5 presents the evolution of Icorr over time for T2 specimens with varying reservoir lengths and three embedded rebars (A, B, and C). For T2(30X) specimens with a 2.5 cm reservoir length, Icorr begins low (around 10 µA) during the early phase (0–200 days), stabilizing below 10 µA after 200 days with minimal fluctuations, except for a spike (around 15 µA) around 1000–1200 days in rebar B, likely due to localized chloride ingress or passivation disruption. The smaller reservoir restricts ion ingress, maintaining low corrosion rates. For T2(31X) specimens with a 5 cm reservoir length, Icorr peaks higher (around 20–30 µA) during the first 250 days, indicating greater ion availability. It decreases to around 5–10 µA by 600 days, stabilizing with occasional late-phase spikes (around 15 µA for rebar B at 1430 days), reflecting prolonged ion ingress. For T2(32X) specimens with a 5 cm reservoir length, the Icorr initially peaks at 30–33 µA during the first 200 days due to higher moisture and chloride availability. It then decreases to around 10 µA by 200–600 days as the hydration of fly ash and silica fume reduces permeability and ion ingress. Beyond 600 days, Icorr stabilizes at 5–10 µA, indicating a passive state with minimal corrosion activity, apart from occasional late-phase spikes due to localized disruptions. For T2(29X) specimens with a 10 cm reservoir length, during the initial phase (0–200 days), all rebars show low Icorr values (<15 µA), followed by a significant rise for rebar A (peaking at 20–25 µA) between 200–600 days, indicating increased environmental susceptibility. The rebars B and C exhibit smaller peaks and the Icorr values were mostly less than 10 µA. After 600 days, fluctuations in rebar A’s Icorr suggest wet-dry cycles, while rebars B and C stabilize with moderate corrosion activity. Beyond 1200 days, all rebars stabilize below 10 µA, possibly due to protective layer formation or reduced availability of corrosive agents. The reservoir length affects Icorr values by controlling ion availability. The smaller reservoirs (2.5 cm, T2-30X) restrict ion ingress, maintaining low Icorr values with minimal fluctuations. The medium reservoirs (5 cm, T2-31X and T2-32X) show higher initial Icorr peaks due to greater ion availability but stabilize at around 5–10 µA after 600 days as concrete densifies. The larger reservoirs (10 cm, T2-29X) exhibit delayed yet significant Icorr increases, particularly for rebar A, due to prolonged exposure. As the time passed, all specimens stabilize, demonstrating the protective effects of fly ash and silica fume. Therefore, smaller reservoirs limit long-term corrosion by restricting ion ingress, while larger reservoirs sustain higher initial and long-term corrosion activity. The supplementary cementitious materials like fly ash and silica fume improve durability by reducing permeability and enhancing passivation, but larger reservoirs emphasize the need for additional protective measures to manage long-term corrosion risks. A comparable findings regarding Icorr values for T1 and T2 samples were documented in several studies [19,28,29,30]. These studies consistently highlighted similar trends in corrosion activity, where the Icorr values aligned closely with those observed in the current investigation. The reported data not only corroborate the present results but also reinforce the influence of various experimental conditions and mix compositions on the corrosion performance of the samples. This consistency across studies suggests a robust relationship between the experimental parameters and the measured Icorr values for both T1 and T2 specimens.
Table 3 presents the average Icorr values and their corresponding standard deviation (STD) values, derived from the last 15 sets of readings obtained through the LPR method for T1 and T2 concrete mixes. It also showcases the average Icorr and STD values across three rebar specimens (A, B, and C) at varying reservoir lengths of 2.5 cm, 5 cm, and 10 cm. This data underscores the significant influence of material composition and exposure conditions on the corrosion behavior of reinforced concrete mixes. The T1 specimens consistently exhibits higher Icorr values and greater STDs across all reservoir lengths, indicating more severe corrosion activity and greater variability in corrosion behavior compared to T2 specimens. This disparity is attributed to the distinct effects of the SCMs on the concrete microstructure. In T2 specimens, the inclusion of silica fume significantly refines the microstructure by reducing pore sizes and enhancing density, resulting in improved resistance to chloride ingress and reduced corrosion rates. In contrast, T1 specimen, containing fly ash and slag, experiences slower microstructural densification due to the delayed reactivity of slag, which prolongs the period of vulnerability to corrosion. The reservoir length further influences Icorr and STD values, highlighting the role of environmental factors in corrosion dynamics. At shorter reservoir lengths, restricted ionic mobility leads to intensified localized corrosion, as evidenced by higher Icorr values and greater variability. The longer reservoir lengths, however, provide a more extensive diffusion path, promoting uniform ion distribution and consequently reducing both corrosion intensity and variability. Despite this trend, T2 specimen demonstrates superior performance at all reservoir lengths, maintaining lower Icorr values and smaller STDs, underscoring the ability of silica fume to mitigate corrosion effectively, even under conditions of restricted ion mobility. These findings reinforce the importance of selecting appropriate SCMs, such as silica fume, to enhance the durability of reinforced concrete structures. Additionally, they underscore the significance of optimizing reservoir design to minimize corrosion rates and variability, ultimately contributing to the construction of long-lasting and reliable infrastructure.
Table 4 highlights the average Icorr values along with the STD values, which were calculated from the last 15 sets of readings obtained using the GP method for T1 and T2 concrete mixes. Table 3 also presents average Icorr and STD values across three rebar specimens (A, B, and C) at varying reservoir lengths (2.5 cm, 5 cm, and 10 cm), demonstrating how the combination of material composition and exposure conditions influences corrosion behavior. The influence of reservoir length is evident in both T1 and T2 samples. As the reservoir length increases from 2.5 cm to 10 cm, there is a consistent rise in Icorr values for both sets of samples, indicating higher corrosion activity due to increased chloride and moisture ingress. However, T2 samples consistently exhibit lower Icorr values compared to T1 samples, especially at 5 cm and 10 cm, suggesting that the incorporation of silica fume in T2 sample enhances corrosion resistance by reducing permeability and improving the microstructure of the concrete. The STD values also highlight the stability of corrosion behavior in T2 samples, with lower variability compared to T1 samples at all reservoir lengths. The role of SCMs is critical in controlling corrosion rates. The T1 samples, which incorporates fly ash and slag, exhibits higher Icorr and STD values compared to T2 samples, which combines fly ash and silica fume. The combination of fly ash and slag improves durability and reduces permeability but does not offer the same level of protection as silica fume, which significantly enhances the concrete matrix’s density and reduces permeability. Silica fume's contribution results in more stable corrosion behavior across different exposure conditions. Therefore, the findings underline the importance of selecting appropriate SCMs, such as silica fume, and optimizing environmental exposure, such as reservoir length, to mitigate corrosion in reinforced concrete structures effectively. Moreover, comparisons of selected rebars between T1 and T2 groups suggest that reservoir length plays a crucial role in determining corrosion behavior, with longer reservoir lengths correlating with higher average Icorr values and greater variability. The average Icorr values for FA samples (containing 20% fly ash as a cement replacement) varied between 39.9 and 91.0 µA, as reported by Balasubramanian [31]. These samples were installed vertically and subjected to electromigration techniques to expedite chloride ion transport [31]. In contrast, the present study positioned the samples horizontally, with chloride ponds created directly above the embedded rebar within the specimens. Kayali and Zhu documented Icorr values ranging from 9.7 to 25.3 µA for T2 specimens [32]. Additionally, for concrete mixes incorporating fly ash as a partial cement replacement, Otieno et al. reported an average Icorr value of 49.9 µA [3], while O'Reilly et al. observed an average Icorr value of 38.5 µA [33].
Figure 6 illustrates the variation in average Icorr with reservoir length for T1 and T2 concrete mixes, comparing LPR and GP measurement methods. Across both methods, the shorter reservoir lengths (2.5 cm) yield the highest Icorr values for both mixes, indicating more intense corrosion activity, with T1 specimens consistently showing higher values than T2 specimens. In LPR measurements, T1 specimen exhibits significantly higher Icorr (around 40 μA) at 2.5 cm compared to T2 specimen, which demonstrates a comparatively lower Icorr values, reflecting better resistance to corrosion. At medium (5 cm) and longer reservoir lengths (10 cm), Icorr values increase for both mixes, though T1 specimen still shows consistently higher corrosion activity than T2 specimens. The GP measurements exhibit a similar trend but generally record lower Icorr values than LPR measurements, particularly for T2 specimens, emphasizing T2 specimen superior performance in mitigating corrosion. The results highlight that T2 specimens (containing silica fume) provides enhanced durability and reduced corrosion rates across all reservoir lengths, and GP measurements appear to be more conservative than LPR measurements in quantifying corrosion.
The variations in Icorr values observed in T1 and T2 specimens highlight the combined impact of reservoir length, material composition, curing conditions, and environmental exposure on corrosion behavior. The shorter reservoir lengths (2.5 cm) restricted chloride and moisture ingress, resulting in lower Icorr values and reduced corrosion activity. Conversely, longer reservoirs (10 cm) enabled sustained ionic ingress, leading to higher Icorr values over time due to enhanced exposure to corrosive agents. The incorporation of SCMs played a crucial role in enhancing durability, with silica fume in T2 specimens outperforming fly ash and slag in T1 specimens. Silica fume refined the microstructure by reducing pore size and permeability, resulting in lower Icorr values and improved corrosion resistance. In contrast, the delayed reactivity of slag in T1 specimens prolonged the vulnerability to chloride penetration, leading to higher Icorr values and greater variability. The curing conditions further influenced the corrosion performance by promoting the development of a denser, more protective concrete matrix, reducing the susceptibility of the reinforcement to corrosion. The environmental conditions, particularly wet-dry cycles in specimens with larger reservoirs, caused periodic spikes in Icorr values due to fluctuating moisture levels. Over time, however, these values tended to stabilize as protective layers formed on the reinforcement surface, though localized disruptions occasionally occurred due to environmental or structural factors.
A comparative analysis of Icorr and STD values from LPR and GP measurements reinforced these findings. The LPR measurements demonstrated higher sensitivity to localized corrosion, with T1 specimens exhibiting consistently higher Icorr values and greater STDs across all reservoir lengths compared to T2 specimens. This confirmed the superior performance of silica fume in mitigating corrosion and stabilizing the corrosion behavior under various exposure conditions. The GP measurements, although less sensitive to localized corrosion, followed similar trends, with T2 specimens consistently showing lower Icorr values and STDs. Therefore, these observations underline the importance of selecting SCMs like silica fume, optimizing reservoir design, and managing environmental exposures to effectively control corrosion rates. While LPR offers detailed insights into localized corrosion dynamics, GP provides a rapid, simplified assessment suitable for routine monitoring. These complementary methods emphasize the need for a holistic approach to designing durable reinforced concrete structures capable of withstanding corrosive environments, ultimately extending their service life and ensuring long-term performance.
1.1. Icorr vs. Rs
Figure 7 and Figure 8 present the average Icorr vs. average Rs plots derived from GP readings for T1 and T2 concrete mixes, each reinforced with three rebars. The plotted averages represent data collected per rebar over the monitoring period spanning from day 200 to day 1600.
Figure 7 illustrates the relationship between the average Icorr and the average Rs for T1 specimens with three embedded rebars, categorized by reservoir size. The data reveals that rebars in samples with a 5 cm reservoir size exhibited higher Rs values compared to those in other reservoir sizes. In contrast, rebars in the 10 cm reservoir size consistently showed lower Rs values. It is interesting to note that despite the larger Rs values associated with the 5 cm reservoir, the Icorr values for rebars under 5 cm and 10 cm reservoirs were often comparable. This suggests that the active corroding areas for these reservoir sizes may be of similar scale. Notably, the Icorr values for rebars under the 10 cm reservoir size tended to be higher, indicating a greater corrosion activity in these samples. Additionally, the Icorr vs. Rs pairs for rebars in 2.5 cm and 10 cm reservoirs were closely aligned, while the data for the 5 cm reservoir showed a more scattered distribution in both Icorr and Rs values. This spread highlights variability in the corrosion behavior of rebars under the 5 cm reservoir size, potentially influenced by localized factors such as moisture or chloride ingress. Similar findings have been reported in previous studies [19, 28], highlighting consistent trends and supporting the observations made in this research.
Figure 8 presents the relationship between the average Icorr and the average Rs for T2 specimens reinforced with three rebars, differentiated by reservoir size. The data indicates that rebars in the 2.5 cm reservoir size exhibited the highest Rs values compared to those in other reservoir sizes, while the 10 cm reservoir samples consistently showed the lowest Rs values. It is noted that the Icorr values for rebars under the 2.5 cm reservoir size were found to be similar to those observed in the 5 cm reservoir samples, and the Icorr values for the 5 cm reservoir samples closely aligned with those in the 10 cm reservoir samples. This suggests that the size of the actively corroding area under different reservoir conditions may be comparable, as the Icorr shows similar trends across these reservoir sizes. Another noteworthy observation is the distribution of the Icorr vs. Rs data points. For the 2.5 cm reservoir size, the values are tightly clustered, indicating more uniform corrosion behavior. In contrast, the data for the 5 cm and 10 cm reservoir samples exhibit greater variability, with a wider spread in both Icorr and Rs values. This variability could reflect differences in localized environmental factors, such as moisture ingress or chloride penetration, influencing the corrosion process. Previous studies [19, 28] have reported similar findings, demonstrating consistent trends and further reinforcing the observations made in this research.
Figure 9 and Figure 10 present the Icorr vs. Rs plots obtained from GP measurements for T1 and T2 concrete mixes, each incorporating three rebars. The plots on the left illustrate the initial Icorr vs. Rs values, based on the first three measurement sets taken shortly after GP monitoring commenced. In contrast, the plots on the right display the most recent Icorr vs. Rs values, derived from the last two measurement sets. This comparison highlights the progression of rebar corrosion behavior over time, revealing how the relationship between Icorr and Rs changes as the concrete specimens mature and are exposed to varying environmental conditions.
Figure 9 displays the Icorr vs. Rs relationship for T1 concrete specimens with three rebars, highlighting differences between initial and recent measurements across various reservoir sizes. A noticeable trend is that recent Rs values are consistently higher than the initial ones across all reservoir sizes. Among these, the 10 cm reservoir samples exhibit the smallest Rs values for both initial and recent measurements. It is interesting to note that the initial Icorr values for rebars under the 5 cm and 10 cm reservoirs are often similar, while the recent Icorr values align more closely for rebars under the 2.5 cm and 5 cm reservoirs. This similarity in Icorr suggests that the size of the actively corroding area might not vary significantly between these reservoir conditions. Another notable observation is that initial Icorr values are highest for the 2.5 cm reservoir samples, while the recent Icorr values peak for the 5 cm reservoir samples, reflecting a shift in corrosion dynamics over time. The recent Icorr vs. Rs data for the 2.5 cm reservoir samples show a tight clustering, indicating more consistent corrosion behavior. In contrast, the 5 cm and 10 cm reservoir samples display a wider spread in Icorr values, while their Rs values remain relatively uniform. This variability points to differences in the progression and extent of corrosion activity influenced by the reservoir size.
Figure 10 presents the Icorr vs. Rs plots for T2 concrete samples with three rebars, revealing notable trends in the corrosion behavior across various reservoir sizes. It is observed that the recent Rs values are consistently higher than the initial Rs values for all reservoir sizes. However, the 10 cm reservoir samples exhibit the smallest Rs values, both initially and recently. The initial Icorr values for rebars in the 2.5 cm and 5 cm reservoir sizes, as well as the 5 cm and 10 cm reservoir sizes, are often quite similar. Conversely, the recent Icorr values for rebars under 2.5 cm, 5 cm, and 10 cm reservoirs show comparable trends across different pairs, suggesting that the extent of the corroding area may be roughly similar across these reservoir sizes. The initial Icorr values are observed to be higher for the 5 cm reservoir samples, with the most recent Icorr values also reaching their peak for the same reservoir size. This suggests a progression in corrosion activity over time, with sustained or evolving conditions favoring higher corrosion rates in these samples. A key observation is that the recent Icorr vs. Rs pairs for the 2.5 cm and 10 cm reservoir samples are closely clustered, reflecting more uniform corrosion behavior. In contrast, for the 5 cm reservoir samples, while the Icorr values are more spread out, the Rs values remain relatively consistent, signaling a less variable resistance to corrosion despite changes in corrosion current.
The Icorr vs. Rs plots for T1 and T2 concrete mixes reveal evolving corrosion behavior influenced by reservoir size and time. The Rs values consistently increase over time for all reservoir sizes, reflecting enhanced resistivity as concrete matures. The 10 cm reservoir samples consistently exhibit the lowest Rs values, indicating higher ionic mobility. The initial Icorr values peak for the 2.5 cm reservoir in T1 samples and the 5 cm reservoir in T2 samples, while recent Icorr values reach their maximum for the 5 cm reservoir in both mixes, indicating a shift in corrosion activity. The tight clustering of Icorr vs. Rs pairs in the 2.5 cm and 10 cm reservoirs suggests uniform corrosion behavior, whereas variability in the 5 cm samples reflects heterogeneous corrosion progression. These variations highlight the dynamic interplay between material properties, environmental conditions, and reservoir size in influencing corrosion trends.
1.1. Theoretical (Faradaic) calculation of mass loss
In this study, a theoretical mass loss approach was employed, as no visible cracks were observed in any of the samples. The LPR and GP method was periodically conducted to measure Rc values, which were then used to estimate the corrosion current. The corrosion current for each time interval was calculated as the average of two consecutive Rc values. This average current was multiplied by the duration of the interval to determine the total charge for that period, and the cumulative charge for each rebar was obtained using Equation (1). Using Faraday's law, the apparent mass loss was subsequently calculated, as described in Equation (2).
where C is in coulombs and t is in seconds.
The mass loss calculated using Faraday's law is expressed as-
where Atomic Mass is 55.85g (for Fe), n is 2 (# of electrons), and F is 96,500 C (Faraday’s constant).
Table 5 and Table 6 highlight the estimated mass loss values obtained from the LPR and GP method for T1 and T2 samples with three rebars. The mass loss was determined based on measurements collected over a period of approximately 1600 days using both the LPR and GP methods.
The estimated mass loss values obtained from LPR readings for T1 and T2 concrete mixes, as presented in Table 5, are influenced by the reservoir lengths (2.5 cm, 5 cm, and 10 cm), the type of SCMs used, and the three rebars tested (A, B, and C). The shorter reservoir lengths, such as 2.5 cm, show higher mass loss for both T1 and T2 mixes, likely due to the localized concentration of corrosive agents. For T1 specimens, the highest mass loss occurs at 2.5 cm (26X) with Rebar B (1.423 g), while T2 specimen also experiences its highest mass loss at this length (30X), particularly for Rebar A (1.023 g). The medium reservoir lengths (5 cm) exhibit varied results; T1 (28X) specimen shows much lower mass loss compared to other reservoir lengths, while T2 (31X and 32X) specimens demonstrate reduced and consistent mass loss values, highlighting improved protection. At longer reservoir lengths (10 cm), both T1 (27X) and T2 (29X) specimens display moderate and relatively lower mass loss values, suggesting that longer reservoirs dilute the aggressiveness of the corrosive agents. In terms of SCM influence, T1 specimens, incorporating fly ash and slag, shows greater variability in mass loss values, with better resistance noted in certain cases like 5 cm reservoir length (28X). The T2 specimens, containing fly ash and silica fume, generally exhibit superior corrosion resistance, with lower mass loss values across most scenarios, likely due to silica fume’s ability to enhance concrete density and reduce permeability. Therefore, T2 specimens outperform T1 specimens in mitigating mass loss values, though shorter reservoir lengths exacerbate localized corrosion in both mixes. The variability among individual rebars further emphasizes the impact of local environmental conditions on corrosion behavior.
Table 6 offers a comprehensive comparison of the mass loss values (in grams) obtained from GP readings for T1 and T2 concrete mixes, each containing three rebar specimens (A, B, and C), and subjected to varying reservoir lengths (2.5 cm, 5 cm, and 10 cm). These mass loss values serve as an indicator of corrosion-induced degradation at the rebar-concrete interface. Table 4 provides insight into how both the length of exposure (reservoir length) and the type of SCMs used affect the extent of corrosion, as reflected by the mass loss values. The data clearly demonstrates that mass loss increases with longer reservoir lengths, indicating that extended exposure to chloride and moisture leads to more substantial corrosion in both T1 and T2 samples. For example, at a 10 cm reservoir length, T1 specimens exhibit mass losses ranging from 0.458 g to 0.535 g, significantly higher than the 0.260 g to 0.303 g range observed at the 2.5 cm length. Similarly, T2 specimens show increased mass loss at 10 cm (0.229 g to 0.394 g) compared to the shorter 2.5 cm length (0.148 g to 0.165 g). This trend, with longer reservoir lengths leading to greater corrosion activity, is consistent across all samples and supports the observation that prolonged exposure increases the penetration of corrosive agents into the concrete matrix, thus enhancing corrosion rates. When comparing the two mixes, T2 consistently shows lower mass loss values across all reservoir lengths, demonstrating superior corrosion resistance. For example, at the 10 cm reservoir length, T2 specimens mass losses range from 0.229 g to 0.394 g, while T1 shows higher mass losses between 0.458 g and 0.535 g. This superior performance of T2 is attributed to the inclusion of silica fume, a highly reactive pozzolan that improves the density and impermeability of the concrete matrix. Silica fume’s ability to reduce permeability prevents the deeper penetration of chlorides and moisture, effectively reducing corrosion at the rebar interface. In contrast, while the fly ash and slag in T1 samples enhance the durability of the concrete, they are less effective in minimizing corrosion compared to silica fume, which further highlights the significant impact of material selection on corrosion resistance in reinforced concrete.
The mass loss trends in Figure 11 for T1 and T2 concrete mixes obtained from LPR and GP measurements show distinct variations across reservoir lengths. In both methods, shorter reservoir lengths (2.5 cm) consistently exhibit the highest mass loss for both mixes, with T1 specimens showing greater values compared to T2 specimens, particularly under LPR measurements. At medium reservoir lengths (5 cm), the mass loss significantly decreases, with T2 specimens outperforming T1 specimens in both methods, highlighting the enhanced resistance provided by silica fume in T2 specimens. For longer reservoir lengths (10 cm), the mass loss further reduces for both mixes, with GP measurements indicating slightly lower values than LPR measurements, especially for T2 specimens, likely due to the reduced impact of localized corrosive agents. Therefore, T2 specimens exhibit better performance across all reservoir lengths and methods, while the GP measurements generally show more conservative mass loss values compared to LPR measurements, emphasizing their potential differences in sensitivity to corrosion.
Torres-Acosta's study on concrete beams and cylindrical specimens with chloride-contaminated mixes exposed to 75% RH and a 100 μA/cm² impressed current found mass loss ranging from 0.3–14.4 g (beams) and 0.7–5.1 g (cylinders) via forensic analysis, with similar Faradaic values (0.3–12.5 g for beams; 0.6–5.8 g for cylinders) [34]. Corrosion-induced cracks were observed in all specimens, contrasting with the current study, where higher moisture levels prevented cracking despite some external rebar corrosion. Balasubramanian's research on reinforced concrete pipes prepared with either fly ash or Portland cement, under 95% RH and electromigration-induced corrosion, showed mass loss of 2.0–10.3 g (fly ash) and 0.6–3.2 g (Portland cement) by forensic analysis, with slightly higher Faradaic values [31]. The fly ash specimens in vertical exposure showed 0.6–1.2 g mass loss (forensic) and 2.0–5.9 g (Faradaic), while horizontal exposure reduced these to 0.1–0.3 g and 1.9–2.0 g, respectively [31]. No cracks were observed in Balasubramanian’s study, likely due to high moisture enabling corrosion products to diffuse into the concrete, reducing localized stresses [17,18,19,30].
General Discussion
The experimental investigation highlighted the influence of reservoir size and concrete mix composition on the corrosion behavior of reinforced concrete, as evidenced by variations in rebar potential, Rs, Rc, Icorr, the relationship between Icorr and Rs, and estimated mass loss values. Two mix types, T1 and T2, exhibited distinct performance characteristics under different reservoir conditions, shedding light on the impact of supplementary cementitious materials and environmental exposure on corrosion processes.
The analysis of rebar potential, Rs, and Rc in both T1 and T2 concrete mix highlights the complex and evolving nature of corrosion within reinforced concrete. A significant change was observed shortly after the electromigration phase, with a marked decline in rebar potential following the cessation of electromigration. Both T1 and T2 mixes initially exhibited negative potential values, which gradually became more positive over time, accompanied by fluctuations in Rs and Rc values. These fluctuations are largely driven by local corrosion activity, which is influenced by factors like concrete composition, chloride concentration, moisture, and environmental conditions such as temperature and humidity.
The progression of Icorr values varied significantly with reservoir size and mix composition. For T1 specimens, the 2.5 cm reservoir exhibited rapid initial corrosion followed by stabilization at low values due to restricted ion ingress, while larger reservoirs (5 cm and 10 cm) allowed sustained moisture and chloride ingress, leading to prolonged corrosion activity. The T1-28X specimen, with optimized fly ash and slag proportions and a 5 cm reservoir, demonstrated the best performance, maintaining consistently low Icorr values. Similarly, T2 specimens displayed trends indicating lower long-term corrosion activity for smaller reservoirs, while larger reservoirs promoted higher initial Icorr and periodic late-phase spikes due to prolonged exposure to aggressive agents. These trends emphasize the role of reservoir size in controlling ion ingress and the superior performance of silica fume in enhancing durability. The findings from this study have important implications for the long-term performance of RC structures in corrosive environments. Corrosion-induced damage can significantly impair the structural integrity and reduce the ultimate capacity of reinforced concrete members, as reported in earlier studies [35,36].
The relationship between Icorr and Rs for T1 and T2 specimens revealed that larger reservoirs (10 cm) consistently resulted in lower Rs values, indicating higher ionic conductivity and more aggressive environments. It is interesting to note that despite these low Rs values, smaller reservoirs (2.5 cm) showed tightly clustered Icorr vs. Rs values, reflecting uniform corrosion behavior and reduced variability. The medium-sized reservoirs (5 cm) exhibited greater scatter in both Icorr and Rs values, particularly for T1 specimens, suggesting localized variations in corrosion dynamics. The T2 specimens showed more consistent trends, attributed to the superior densification and reduced permeability offered by silica fume, which improved resistance against chloride ingress and moisture diffusion.
The mass loss analysis reinforced the findings from Icorr measurements. Both T1 and T2 samples with larger reservoirs (10 cm) recorded the highest mass loss values due to prolonged exposure to aggressive agents, while smaller reservoirs (2.5 cm) consistently showed the lowest mass loss, reflecting restricted environmental exposure. It is noted that T1 specimens exhibited higher mass loss compared to T2 specimens across all reservoir sizes, highlighting the beneficial effects of silica fume in reducing permeability and enhancing corrosion resistance. The variability in mass loss for T1 specimens with 5 cm reservoirs further underscored the influence of mix composition and curing conditions on corrosion behavior. The influence of reservoir size on the corrosion resistance of concrete samples was investigated in a study that evaluated the behavior of reinforced concrete beams in a corrosive environment [37]. The results indicated that the long-term effectiveness of reinforced concrete beams was dependent on the severity of the corrosive environment, with larger reservoirs leading to higher mass loss and more extensive corrosion [37].
The comparison between T1 and T2 mixes demonstrated that silica fume in T2 specimens contributed to lower Icorr values, reduced mass loss, and improved overall durability compared to T1 specimens [23,38]. While fly ash and slag in T1 mixes enhanced early-stage densification, their higher permeability under certain conditions may have facilitated chloride and moisture ingress, leading to more significant long-term corrosion [23,38]. The observed trends highlight the need for optimized mix designs that balance workability, permeability, and long-term durability, particularly for structures exposed to aggressive environments [23,27].
The findings underscore the critical role of reservoir size, material composition, and environmental exposure in determining corrosion rates and durability. The smaller reservoirs effectively limit corrosion by restricting chloride and moisture ingress, while larger reservoirs require additional protective measures to mitigate long-term risks. The superior performance of T2 specimens with silica fume emphasizes the importance of incorporating advanced supplementary cementitious materials to enhance resistance against aggressive environments. These insights can inform the design of durable concrete structures and maintenance strategies, ensuring long-term performance and sustainability. Studies have demonstrated the ability of carbon fiber-reinforced polymer to enhance the durability of reinforced concrete structures exposed to aggressive conditions [37].
Conclusions
The experimental investigation emphasizes the significant impact of both reservoir size and concrete mix composition on the corrosion behavior of reinforced concrete. The results show that the T1 mix, exhibited higher long-term corrosion activity, particularly in larger reservoirs. This is attributed to the higher permeability of fly ash and slag, which facilitates greater chloride and moisture ingress for T1 mixes. Conversely, the T2 mix, which included silica fume, demonstrated superior performance, particularly in smaller reservoirs. The improved densification and reduced permeability of the T2 mix led to lower corrosion current values, reduced mass loss, and enhanced durability, showcasing the importance of controlling ion ingress and the protective role of silica fume.
The study also revealed that the size of the solution reservoir plays a pivotal role in the progression of corrosion. The smaller reservoirs (2.5 cm) effectively limited ion ingress, resulting in lower initial and long-term corrosion rates. The larger reservoirs (10 cm), on the other hand, allowed sustained exposure to aggressive agents, leading to higher corrosion activity. These findings underscore the importance of reservoir size in controlling the ingress of chloride and moisture, with larger reservoirs contributing to more severe and prolonged corrosion. The impact of the reservoir size highlights the need for appropriate management of environmental exposure in concrete structures.
The influence of supplementary cementitious materials, such as fly ash, slag, and silica fume, was clearly reflected in the corrosion performance of the specimens. The T1 specimens, which contained fly ash and slag, exhibited higher corrosion current values and mass loss compared to the T2 specimens with silica fume. The incorporation of silica fume in the mix enhanced the concrete's resistance to chloride and moisture diffusion, leading to more stable corrosion current values over time. This emphasizes the critical role of material composition in improving the durability of concrete in aggressive environments. Therefore, the study advocates for optimized mix designs, with a particular focus on silica fume, and highlights the importance of controlling both reservoir size and mix composition to mitigate long-term corrosion risks and ensure the sustainability of reinforced concrete structures.
Author Contributions
Kazi Naimul Hoque: Conceptualization, Methodology, Resources, Data curation, Writing-Original draft preparation, Visualization, Investigation, Writing-Reviewing and Editing. Francisco Presuel-Moreno: Conceptualization, Methodology, Writing-Reviewing and Editing, Supervision.
Funding
This research is funded through grants provided by Florida Atlantic University, as well as the Florida Department of Transportation (FDOT).
Data Availability Statement
The data collected and analyzed in this study are available from the corresponding author on reasonable request.
Acknowledgements
The authors extend their heartfelt gratitude to the Florida Department of Transportation (FDOT) for their assistance with sample preparation. The authors sincerely thank Florida Atlantic University (FAU) and the students of the Marine Materials and Corrosion Laboratory at FAU for their hard work in the lab and data collection. The views expressed in this paper are solely those of the authors and do not necessarily reflect the perspectives of FAU, or FDOT.
Conflict of Interest
The authors declare no conflict of interest.
References
- Castel, T. Vidal, R. Francois, and G. Arliguie, “Influence of steel-concrete interface quality on reinforcement corrosion induced by chlorides,” Mag. Concr. Res., vol. 55(2), pp. 151-160, 2003.
- R. Francois, and G. Arliguie, “Influence of service cracking on reinforcement steel corrosion,” J. Mater. Civ. Eng., vol. 10(1), pp. 14-20, 1998.
- M. Otieno, H. Beushausen, and M. Alexander, “Chloride-induced corrosion of steel in cracked concrete-part I: experimental studies under accelerated and natural marine environments,” Cem. Concr. Res., vol. 79, pp. 373-385, 2016. [CrossRef]
- T. Vidal, A. Castel, and R. Francois, “Corrosion process and structural performance of a 17-year-old reinforced concrete beam stored in chloride environment,” Cem. Concr. Res., vol. 37(11), pp. 1551-1561, 2007. [CrossRef]
- R. Zhang, A. Castel, and R. Francois, “Serviceability limit state criteria based on steel-concrete bond loss for corroded reinforced concrete in chloride environment,” Mater. Struct., vol. 42(10), pp. 1407-1421, 2009. [CrossRef]
- W. Zhang, R. François, Y. Cai, J.P. Charron, and L. Yu, “Influence of artificial cracks and interfacial defects on the corrosion behavior of steel in concrete during corrosion initiation under a chloride environment,” Construction and Building Materials, vol. 253, 119165, 2020. [CrossRef]
- M. Harilal, D.K. Kamde, S. Uthaman, R.P. George, R.G. Pillai, J. Philip, and S.K. Albert, “The chloride-induced corrosion of a fly ash concrete with nanoparticles and corrosion inhibitor,” Construction and Building Materials, vol. 274, 122097, 2021. [CrossRef]
- M. Harilal, R.P. George, S.K. Albert, and J. Philip, “A new ternary composite steel rebar coating for enhanced corrosion resistance in chloride environment,” Construction and Building Materials, vol. 320, 126307, 2022. [CrossRef]
- Y. Tian, G. Zhang, H. Ye, Q. Zeng, Z. Zhang, Z. Tian, X. Jin, N. Jin, Z. Chen, and J. Wang, “Corrosion of steel rebar in concrete induced by chloride ions under natural environments,” Construction and Building Materials, vol. 369, 130504, 2023. [CrossRef]
- M.G. Sohail, R. Kahraman, N.A. Alnuaimi, B. Gencturk, W. Alnahhal, M. Dawood, and A. Belarbi, “Electrochemical behavior of mild and corrosion resistant concrete reinforcing steels,” Construction and Building Materials, vol. 232, 117205, 2020. [CrossRef]
- E.F. Irassar, M. Gonzalez, and V. Rahhal, “Sulphate resistance of type V cements with limestone filler and natural pozzolana,” Cem. Concr. Compos., vol. 22, pp. 361-368, 2000. [CrossRef]
- K.M.A. Hossain, and M. Lachemi, “Corrosion resistance and chloride diffusivity of volcanic ash blended cement mortar,” Cem. Concr. Res., vol. 34 (4), pp. 695-702, 2004. [CrossRef]
- GjArv, “Effect of condensed silica fume on steel corrosion in concrete,” ACI Mater. J., 92-M60, pp. 591-598, 1995.
- K.N. Hoque, “Analysis of structural discontinuities in ship hull using finite element method,” M.Sc. Thesis, Department of Naval Architecture and Marine Engineering, Bangladesh University of Engineering and Technology (BUET), Dhaka, Bangladesh, 2016.
- K. Torii, T. Sasatani, and M. Kawamura, “Effects of fly ash, blast furnace slag, and silica fume on resistance of mortar to calcium chloride attack,” Proceedings of Fifth International Conference on Fly Ash, Silica Fume, Slag, and Natural Pozzolans in Concrete, American Concrete Institute, SP-153, vol. 2, pp. 931-949, 1995.
- F. Presuel-Moreno, H. Balasubramanian, and Y.-Y. Wu, “Corrosion of reinforced concrete pipes: an accelerated approach,” Corrosion 2013, paper no. C2013-0002551, Houston, TX: NACE, 2013.
- K.N. Hoque, F. Presuel-Moreno, and M. Nazim, “Corrosion of carbon steel rebar in binary blended concrete with accelerated chloride transport,” J. Infrastruct. Preserv. Resil., vol. 4(26), 2023. [CrossRef]
- K.N. Hoque, F. Presuel-Moreno, and M. Nazim, “Accelerated Electromigration Approach to Evaluate Chloride-Induced Corrosion of Steel Rebar Embedded in Concrete,” Advances in Materials Science and Engineering, vol. 2023, Article ID 6686519, 2023. [CrossRef]
- F. Presuel-Moreno, M. Nazim, F. Tang, K. Hoque, and R. Bencosme, “Corrosion Propagation of Carbon Steel Rebars in High Performance Concrete,” BDV27-977-08 Final Report for FDOT, 2018.
- Andrade, and C. Alonso, “Corrosion rate monitoring in the laboratory and on-site,” Constr. Build. Mater., vol. 10(5), pp. 315-328, 1996. [CrossRef]
- V. Feliu, J.A. Gonzalez, and S. Feliu, “Corrosion estimates from transient response to a potential step,” Corros. Sci., vol. 49(8), pp. 3241-3255, 2007. [CrossRef]
- J.A. Gonzalez, J.M. Miranda, and S. Feliu, “Consideration on the reproducibility of potential and corrosion rate measurements in reinforced concrete,” Corros. Sci., vol. 46(10), pp. 2467-2485, 2004. [CrossRef]
- K.N. Hoque, and F. Presuel-Moreno, “Electromigration-Based Investigation of Corrosion Behaviour in Ternary Blended Reinforced Concrete,” International Journal of Structural and Civil Engineering Research, vol. 13(3), pp. 90-95, 2024.
- K.N. Hoque, and F. Presuel-Moreno, “Accelerated Corrosion of Steel Rebar in Concrete by Electromigration: Effect of Reservoir Length and Concrete Mixes,” Proceedings of the 13th International Conference on Marine Technology (MARTEC), 2023.
- K.N. Hoque, and F. Presuel-Moreno, “Corrosion Propagation of Steel Rebar Embedded in Marine Structures Prepared with Binary Blended Concrete Containing Slag,” Proceedings of the 13th International Conference on Marine Technology (MARTEC), 2023.
- K.N. Hoque, and F. Presuel-Moreno, “Corrosion Behaviour of Reinforcing Steel Embedded in Fly Ash Concrete,” Proceedings of the 13th International Conference on Marine Technology (MARTEC), 2023.
- K.N. Hoque, and F. Presuel-Moreno, “Corrosion of Steel Rebar Embedded in Ternary Blended Concrete Exposed to High Humidity Environment,” Proceedings of the 13th International Conference on Marine Technology (MARTEC), 2023.
- K.N. Hoque, “Corrosion propagation of reinforcing steel embedded in binary and ternary concrete,” Ph.D. Dissertation, Department of Ocean and Mechanical Engineering, Florida Atlantic University (FAU), Boca Raton, Florida, USA, 2020.
- F. Presuel-Moreno, K.N. Hoque, and A. Rosa-Pagan, “Corrosion propagation monitoring using galvanostatic pulse on reinforced concrete legacy samples,” 2020-FAU-02 Final Report for National University Transportation Center TriDurLE, 2022.
- F. Presuel-Moreno, and K.N. Hoque, “Corrosion propagation of carbon steel rebar embedded in concrete,” Corrosion 2019, Nashville, Tennessee, USA, 2019.
- H. Balasubramanian, “Initiation and Propagation of Corrosion in Dry Cast Reinforced Concrete Pipes with Environmental Effects,” Ph.D. Dissertation, Department of Ocean & Mechanical Engineering, Florida Atlantic University, USA, 2019.
- O. Kayali, and B. Zhu, “Chloride induced reinforcement corrosion in lightweight aggregate high-strength fly ash concrete,” Construction and Building Materials, vol. 19, pp. 327-336, 2005. [CrossRef]
- M. O’Reilly, F. Omid, and D. Darwin, “Effect of Supplementary Cementitious Materials on Chloride Threshold and Corrosion Rate of Reinforcement,” ACI Materials Journal, Title No. 116-M12, pp. 125-133, 2019. [CrossRef]
- A.A. Torres-Acosta, “Cracking Induced by Localized Corrosion of Reinforcement in Chloride Contaminated Concrete,” Ph.D. Dissertation, Department of Civil & Environmental Engineering, University of South Florida, USA, 1999.
- I. Fernandez, M.F. Herrador, A.R. Marí, and J.M. Bairán, “Ultimate Capacity of Corroded Statically Indeterminate Reinforced Concrete Members,” Int J Concr Struct Mater 12:75, 2018. [CrossRef]
- R.E. Melchers, “Nonlinear trending of corrosion of high nickel alloys in extended marine and atmospheric exposures,” Corrosion Reviews, vol. 38, no. 6, pp. 515-528, 2020. [CrossRef]
- K. Soudki, E. El-Salakawy, and B. Craig, “Behavior of CFRP Strengthened Reinforced Concrete Beams in Corrosive Environment,” Journal of Composites for Construction, vol. 11, no. 3, 2007. [CrossRef]
- K.N. Hoque, and F. Presuel-Moreno, “Chloride-induced corrosion of reinforcing steel embedded in ternary blended concrete,” Journal of Naval Architecture and Marine Engineering, vol. 21(2), pp. 195–206, 2024.
Figure 1.
Experimental setup used for electromigration.
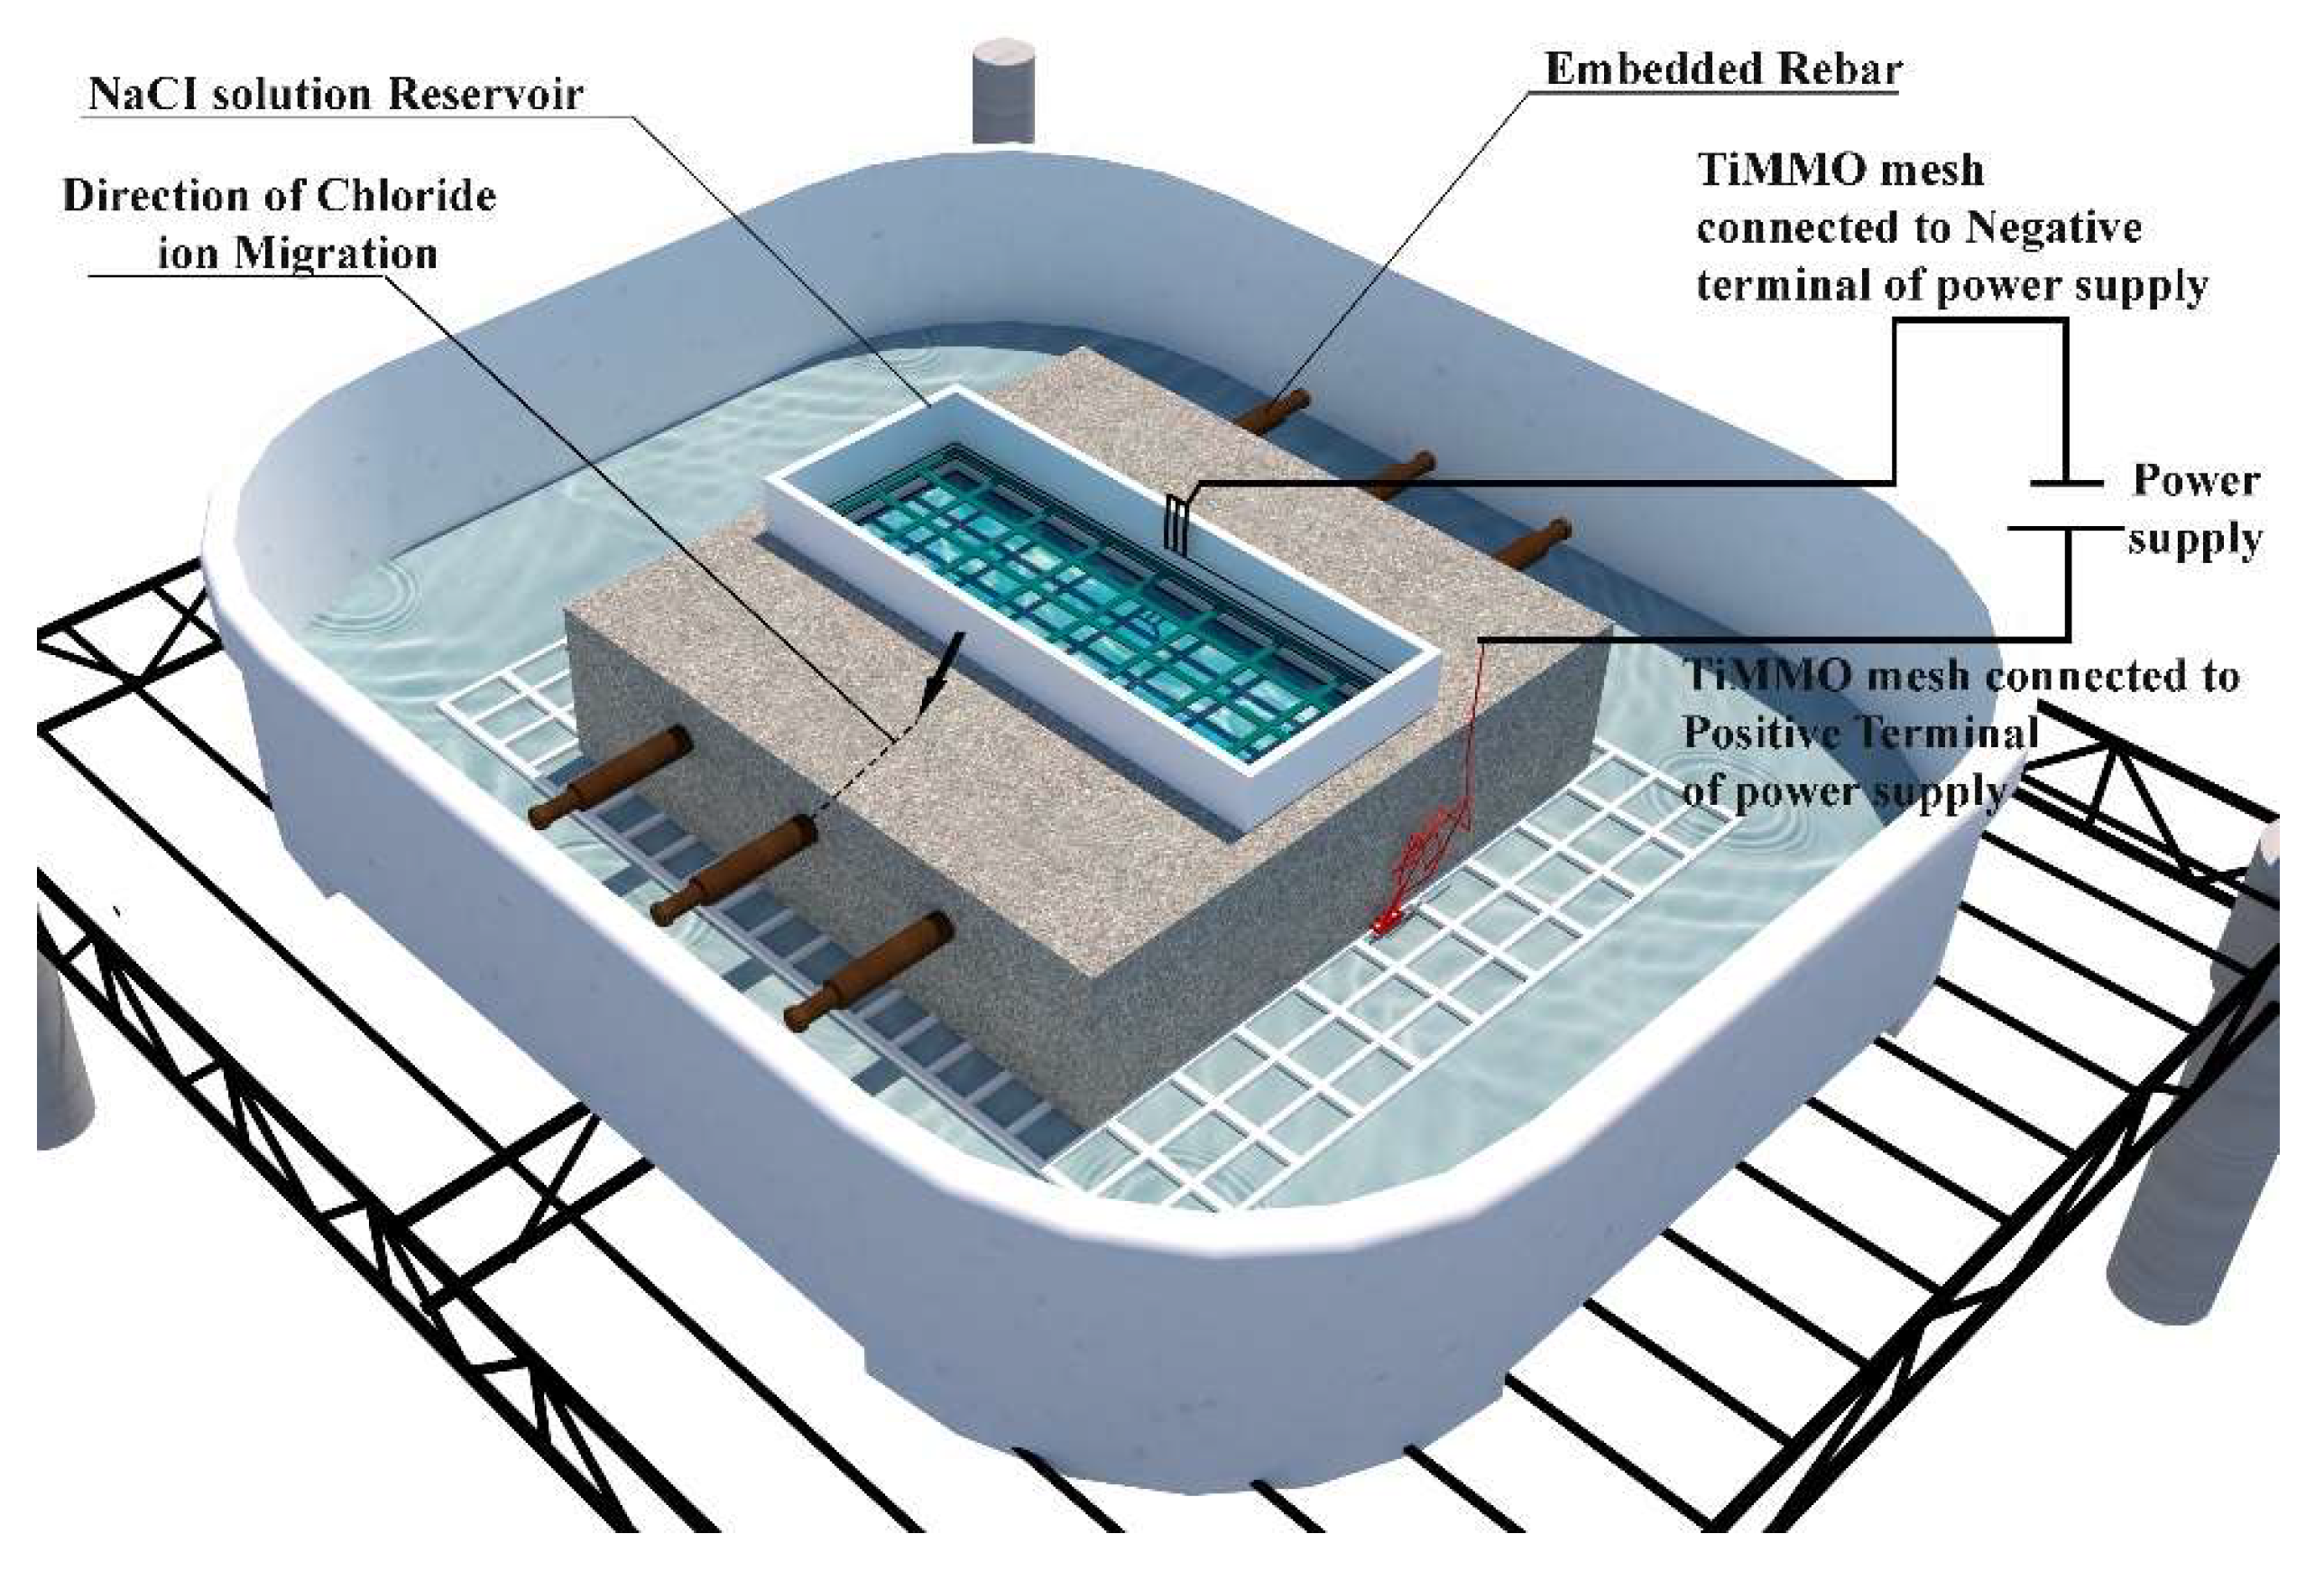
Figure 2.
Rs, Rc, and rebar potential measured on selected T1 sample (25X) under 5 cm reservoir length.
Figure 2.
Rs, Rc, and rebar potential measured on selected T1 sample (25X) under 5 cm reservoir length.
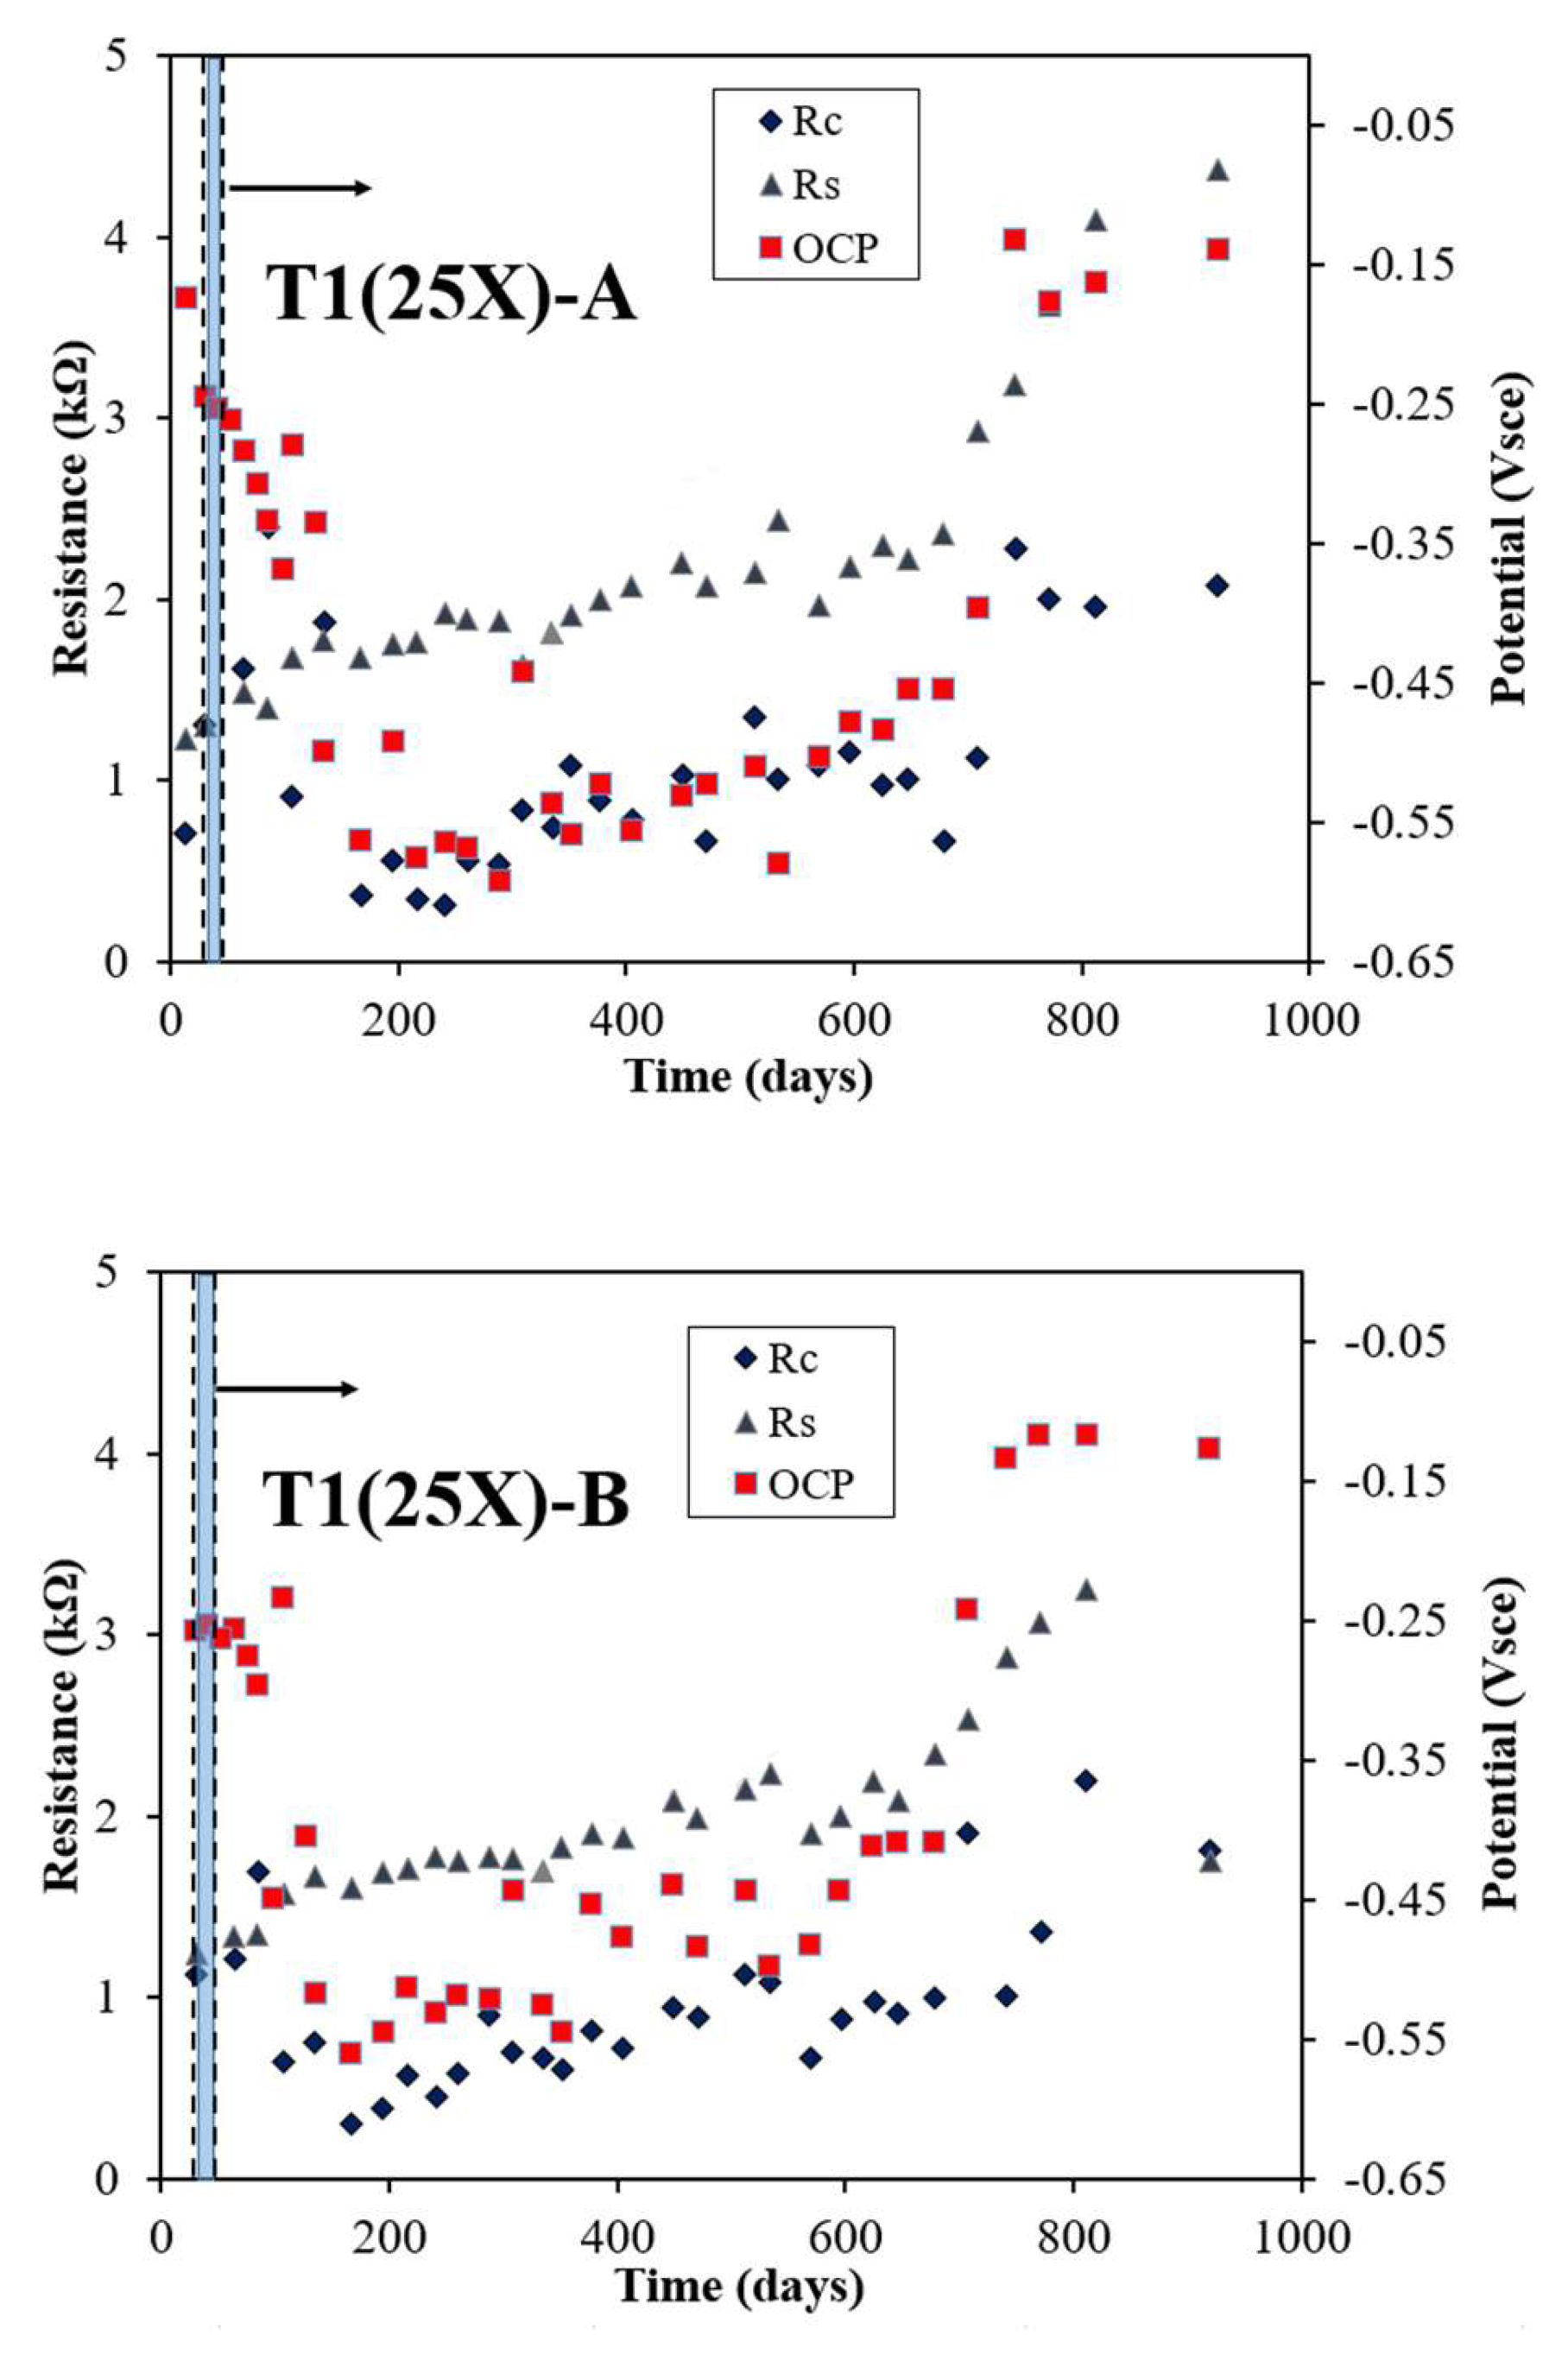
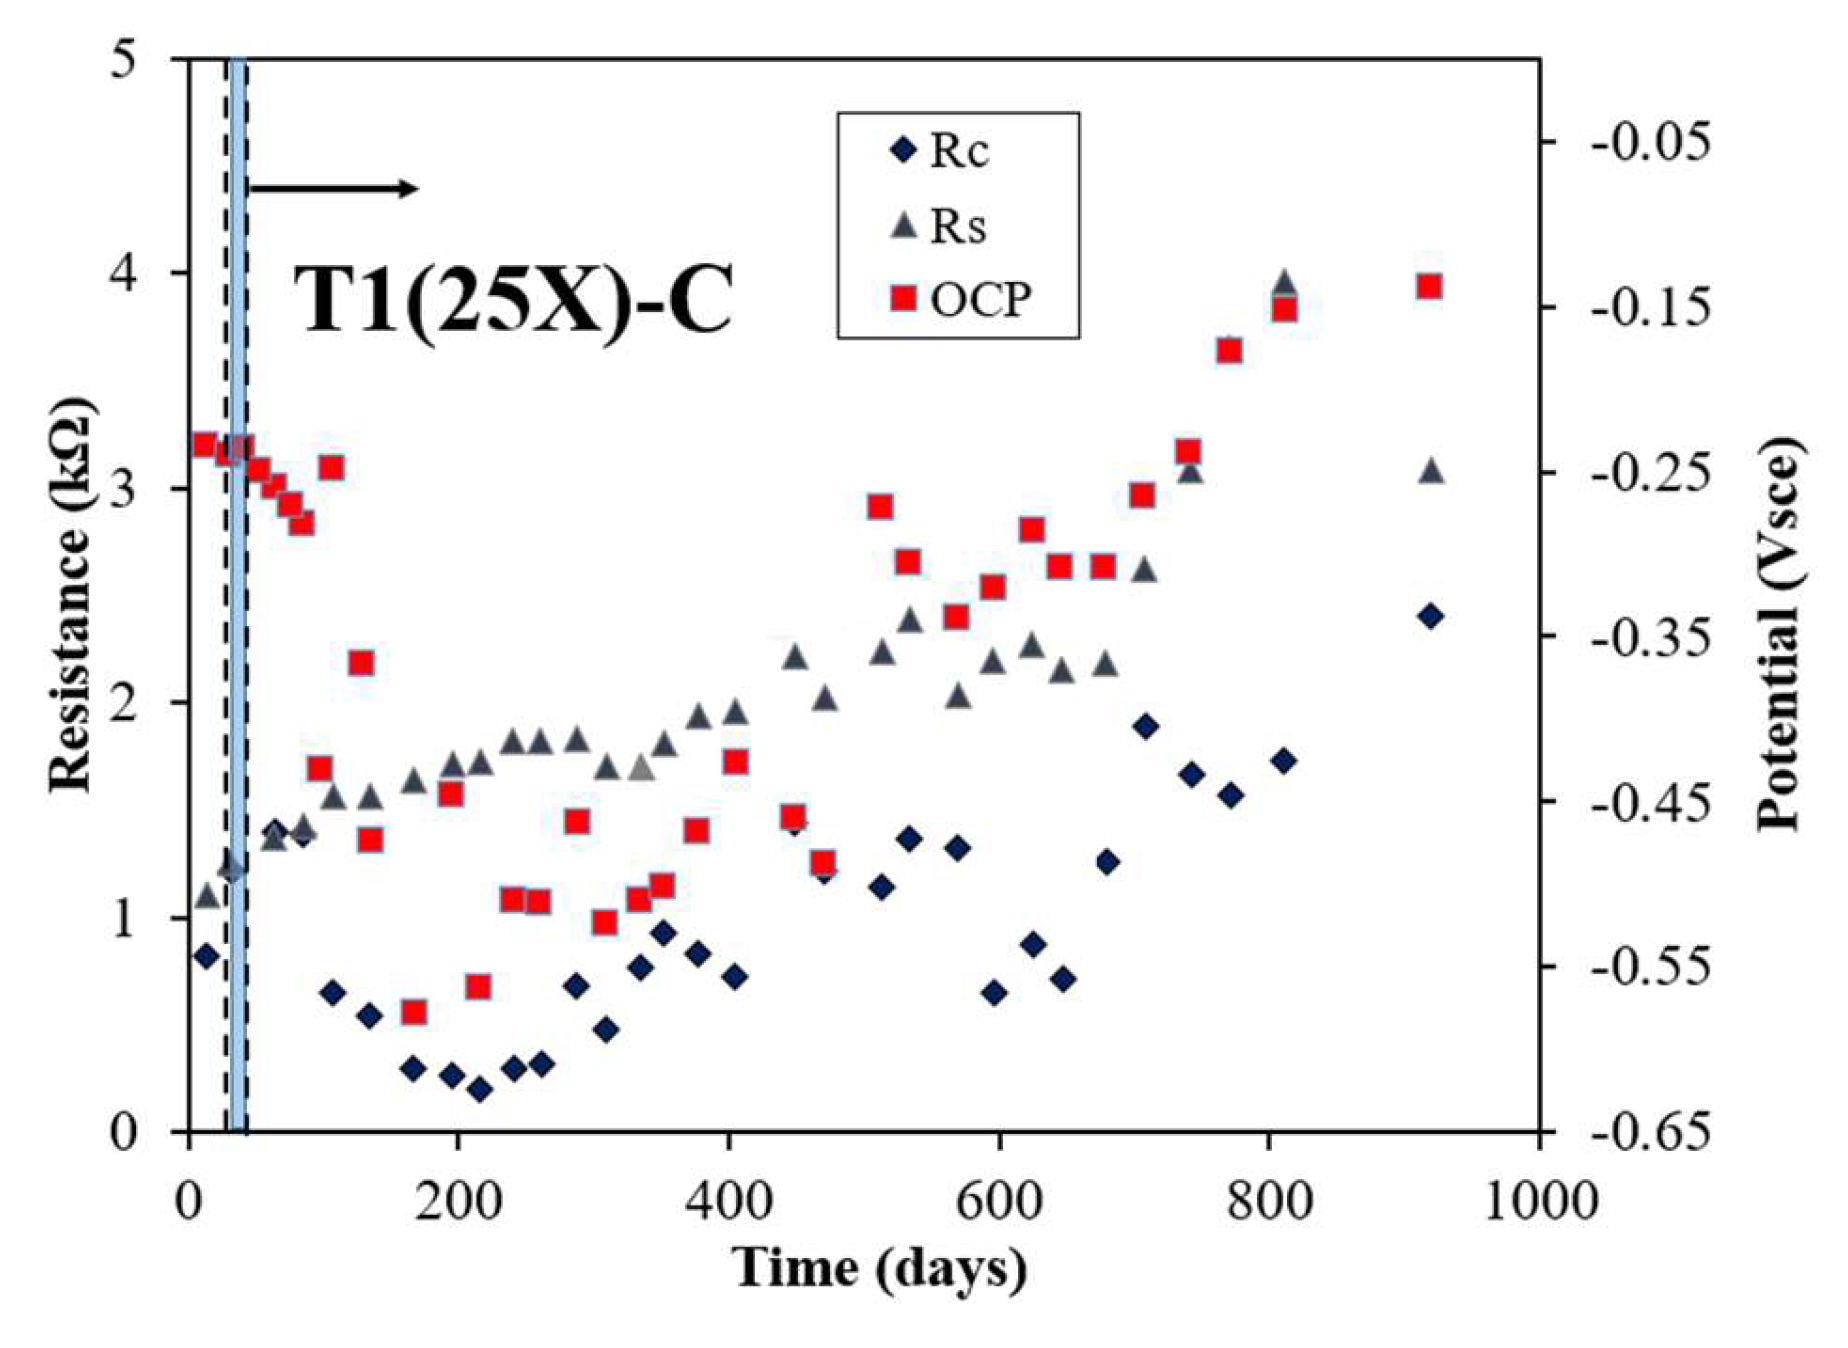
Figure 3.
Rs, Rc, and rebar potential measured on selected T2 sample (32X) under 5 cm reservoir length.
Figure 3.
Rs, Rc, and rebar potential measured on selected T2 sample (32X) under 5 cm reservoir length.
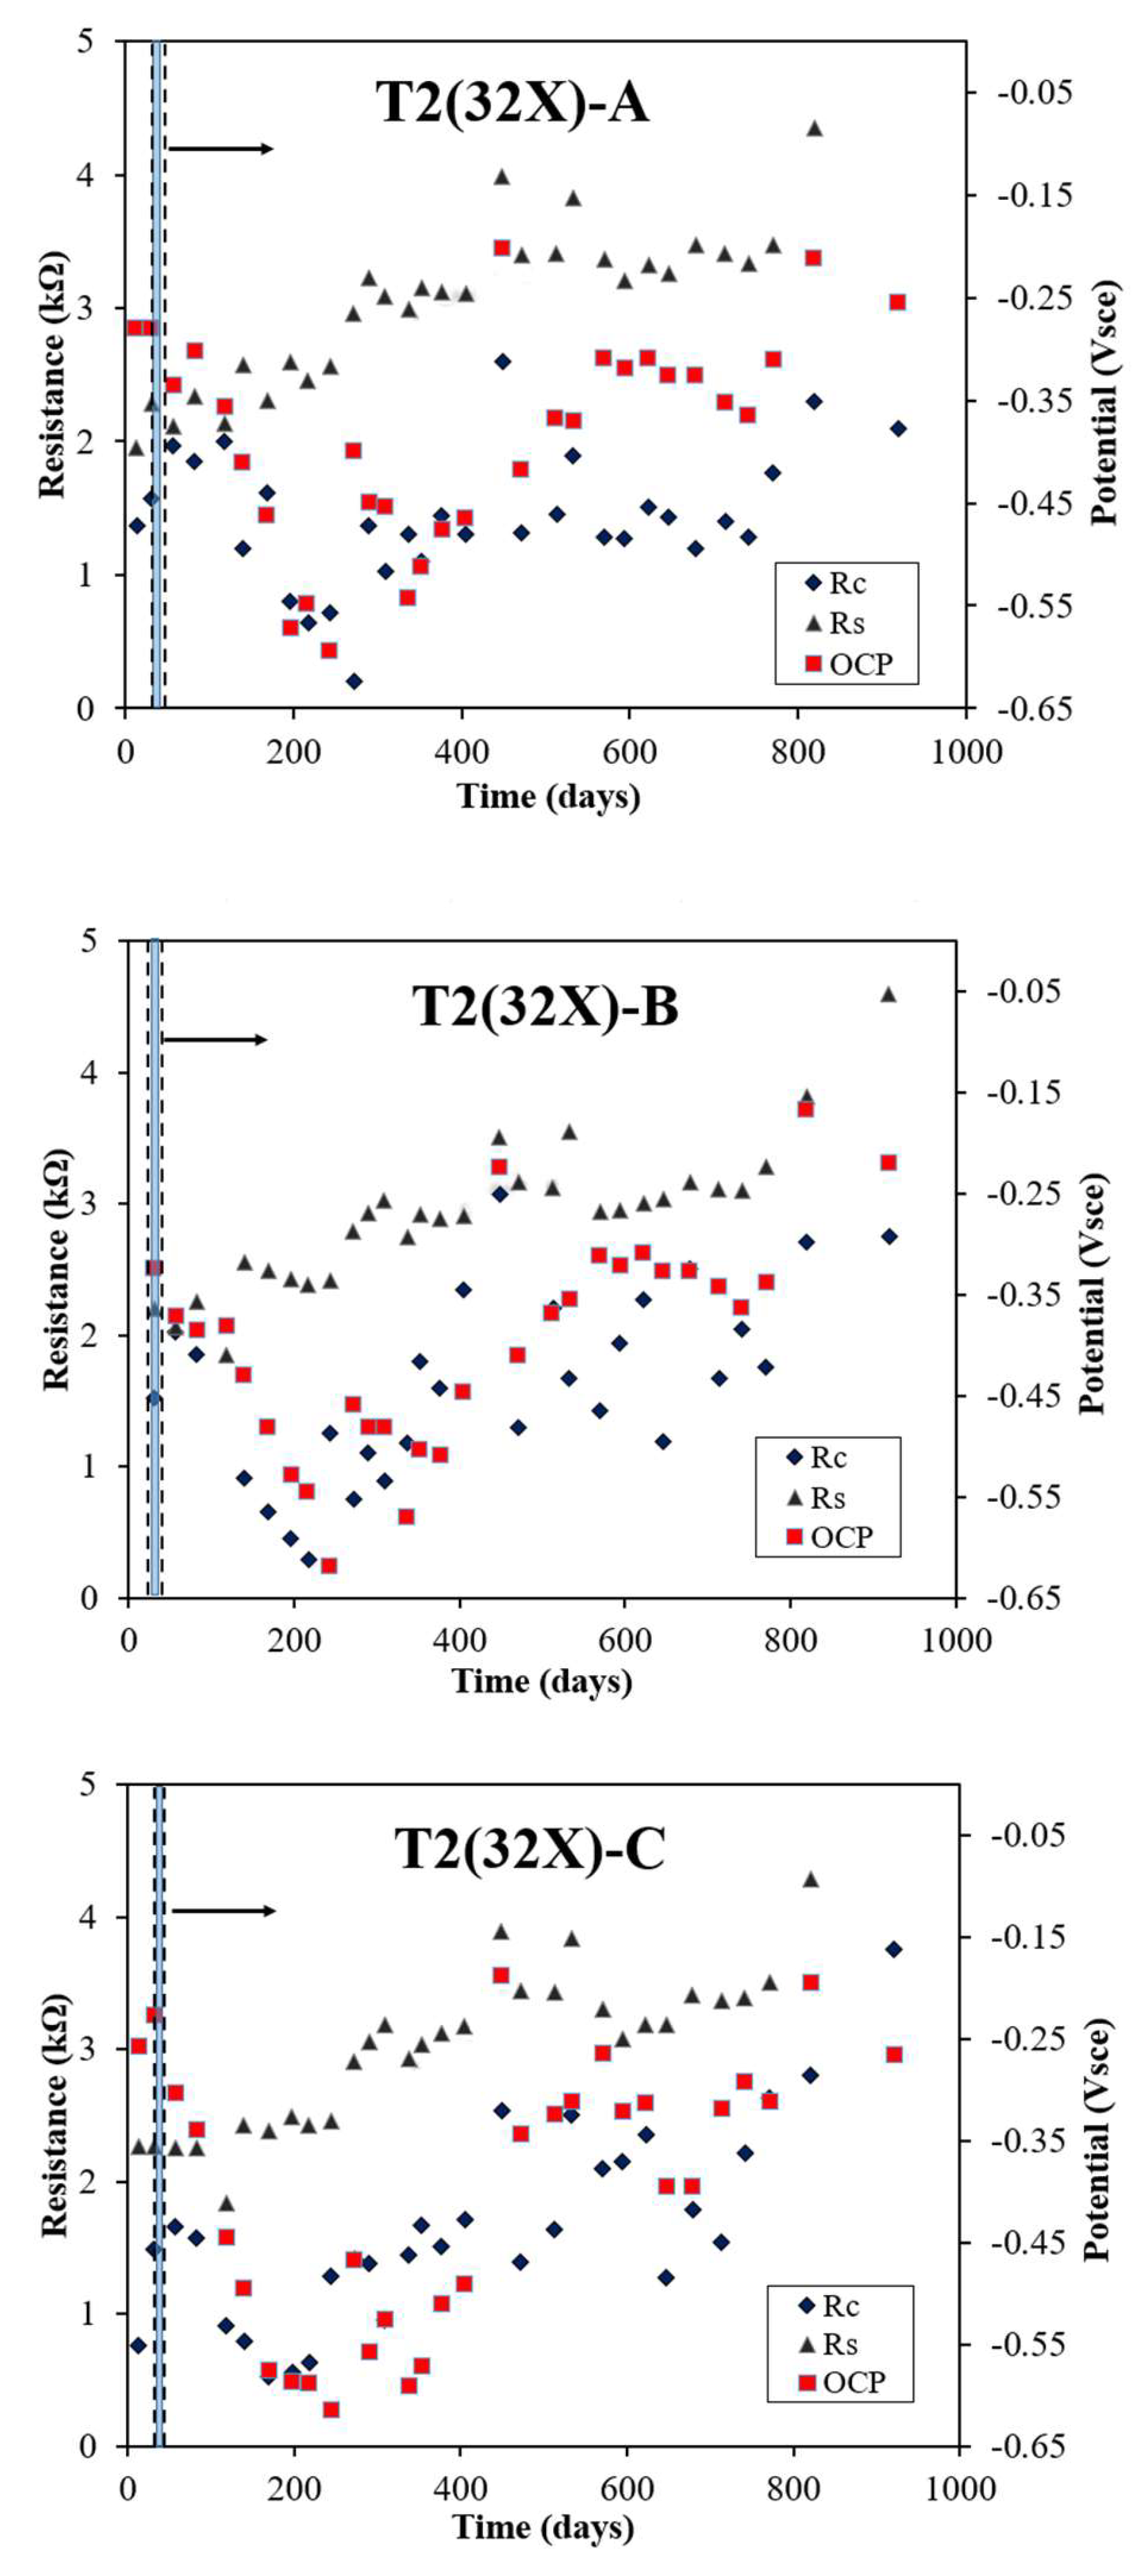
Figure 4.
Icorr with time obtained from GP method for three rebar T1 samples under different size reservoirs.
Figure 4.
Icorr with time obtained from GP method for three rebar T1 samples under different size reservoirs.
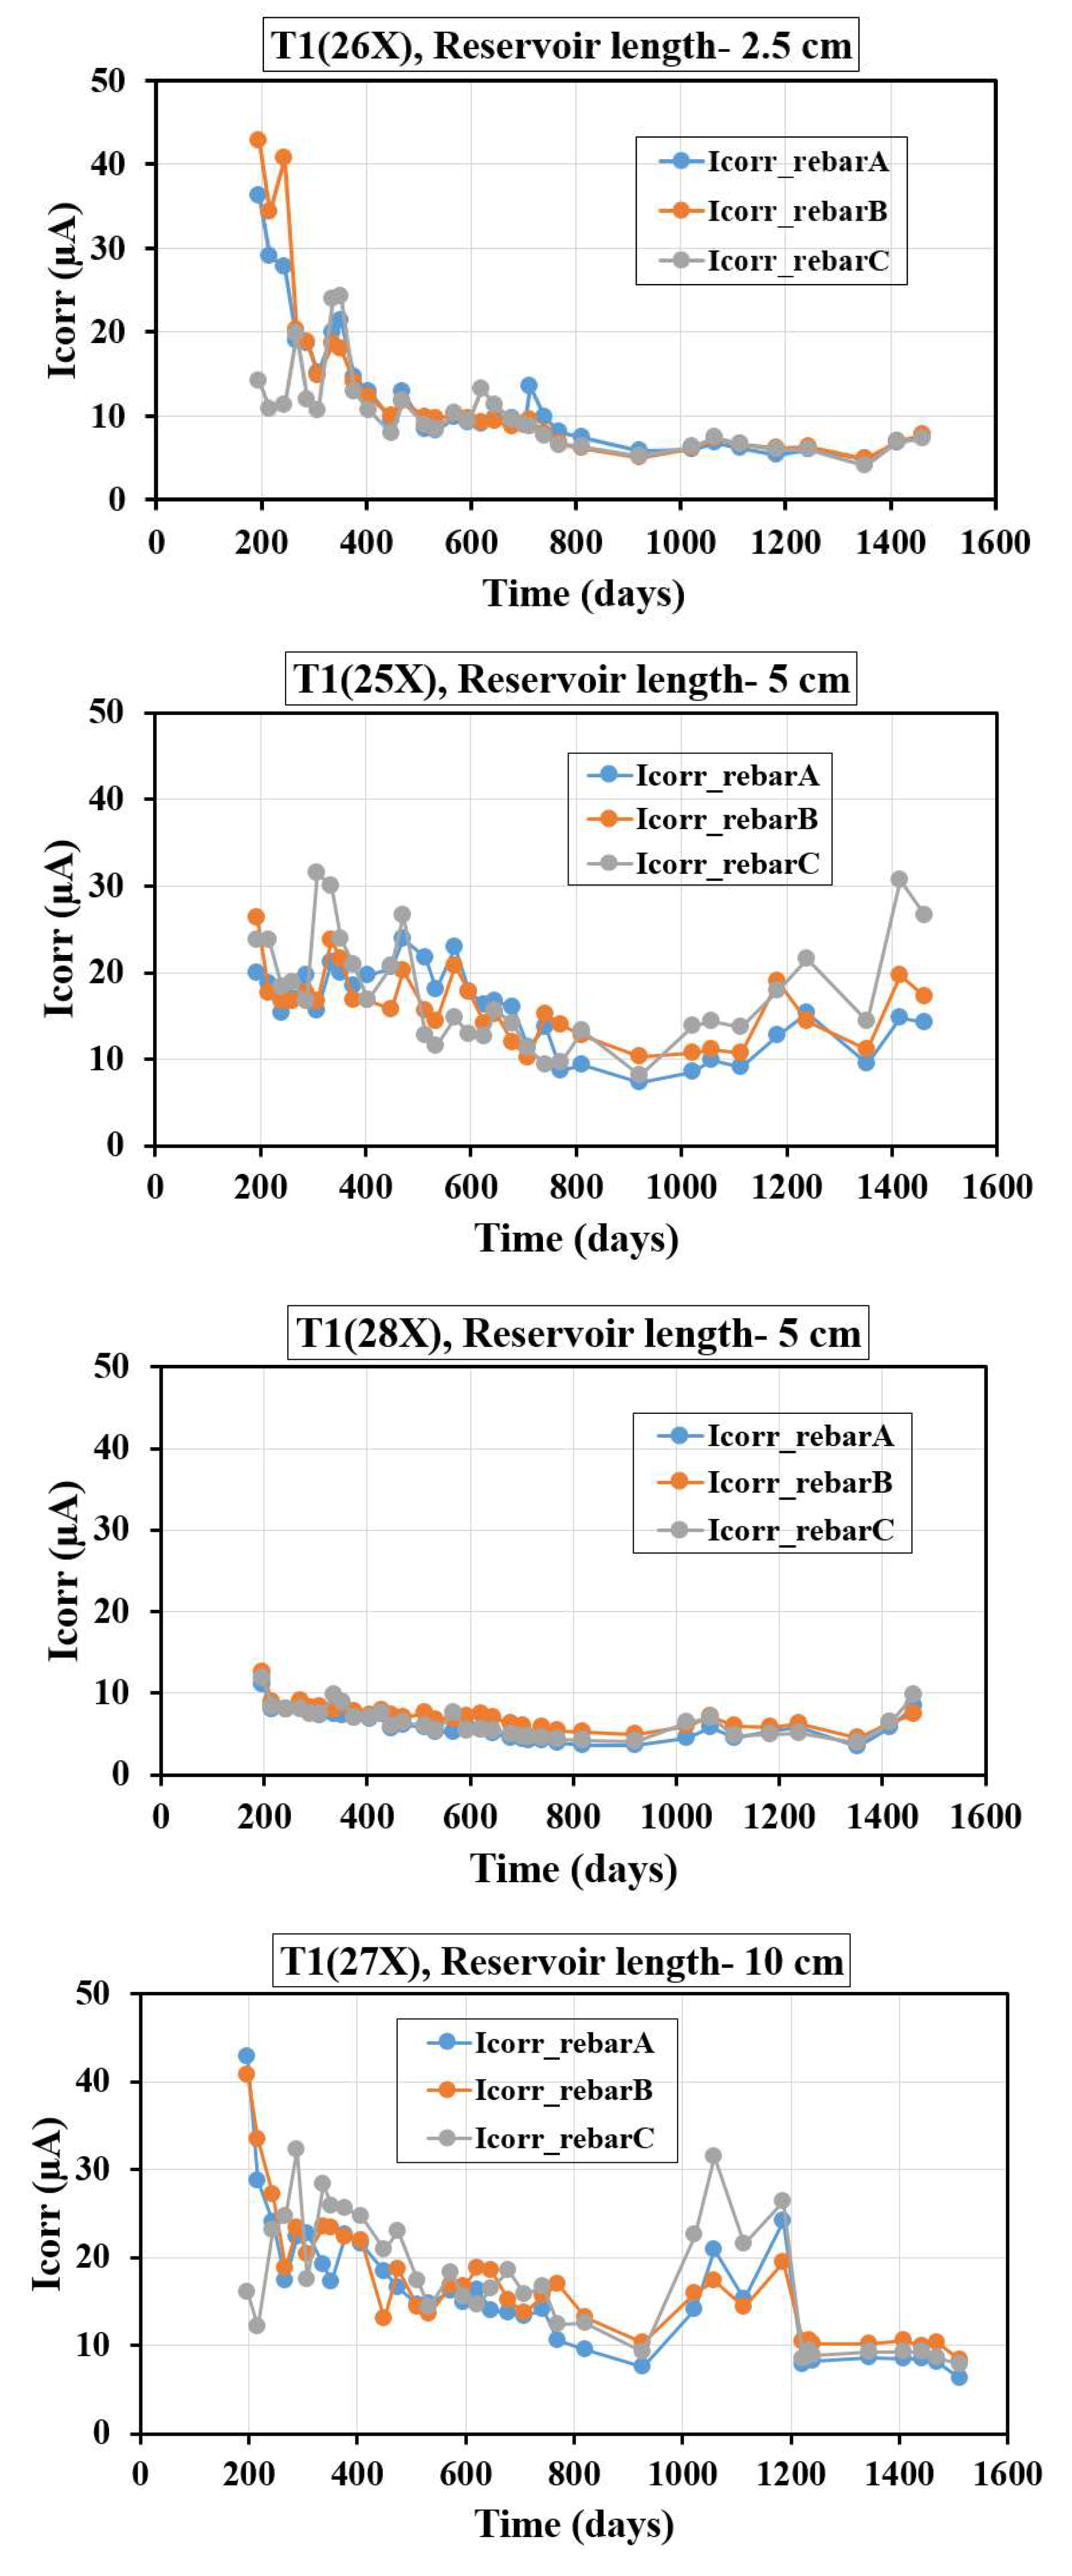
Figure 5.
Icorr with time obtained from GP method for three rebar T2 samples under different size reservoirs.
Figure 5.
Icorr with time obtained from GP method for three rebar T2 samples under different size reservoirs.
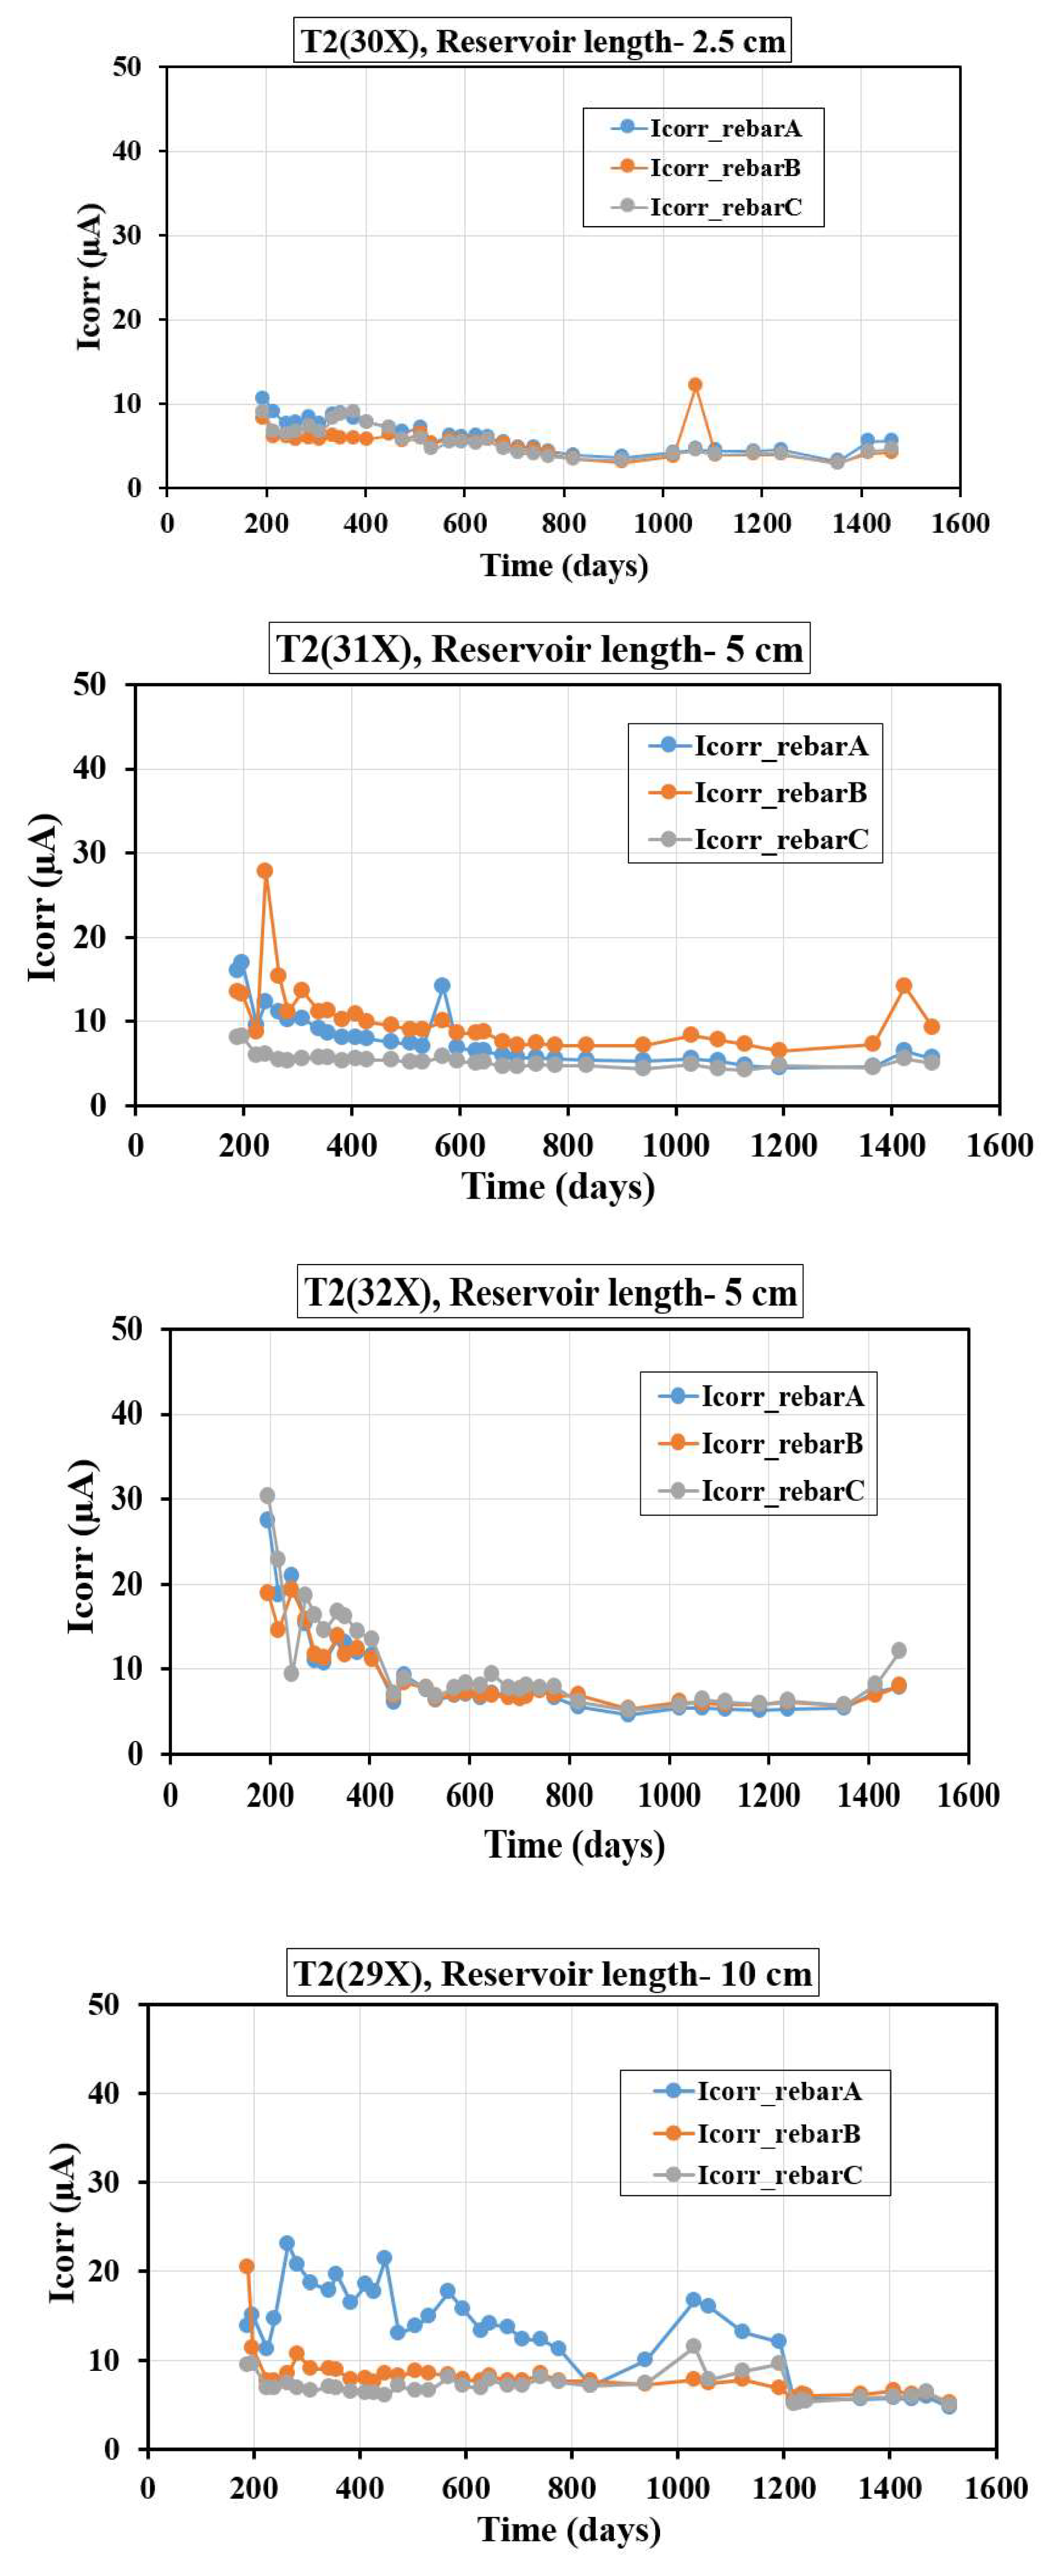
Figure 6.
Variation of average Icorr with reservoir length and concrete mixes cast with three rebar.
Figure 6.
Variation of average Icorr with reservoir length and concrete mixes cast with three rebar.
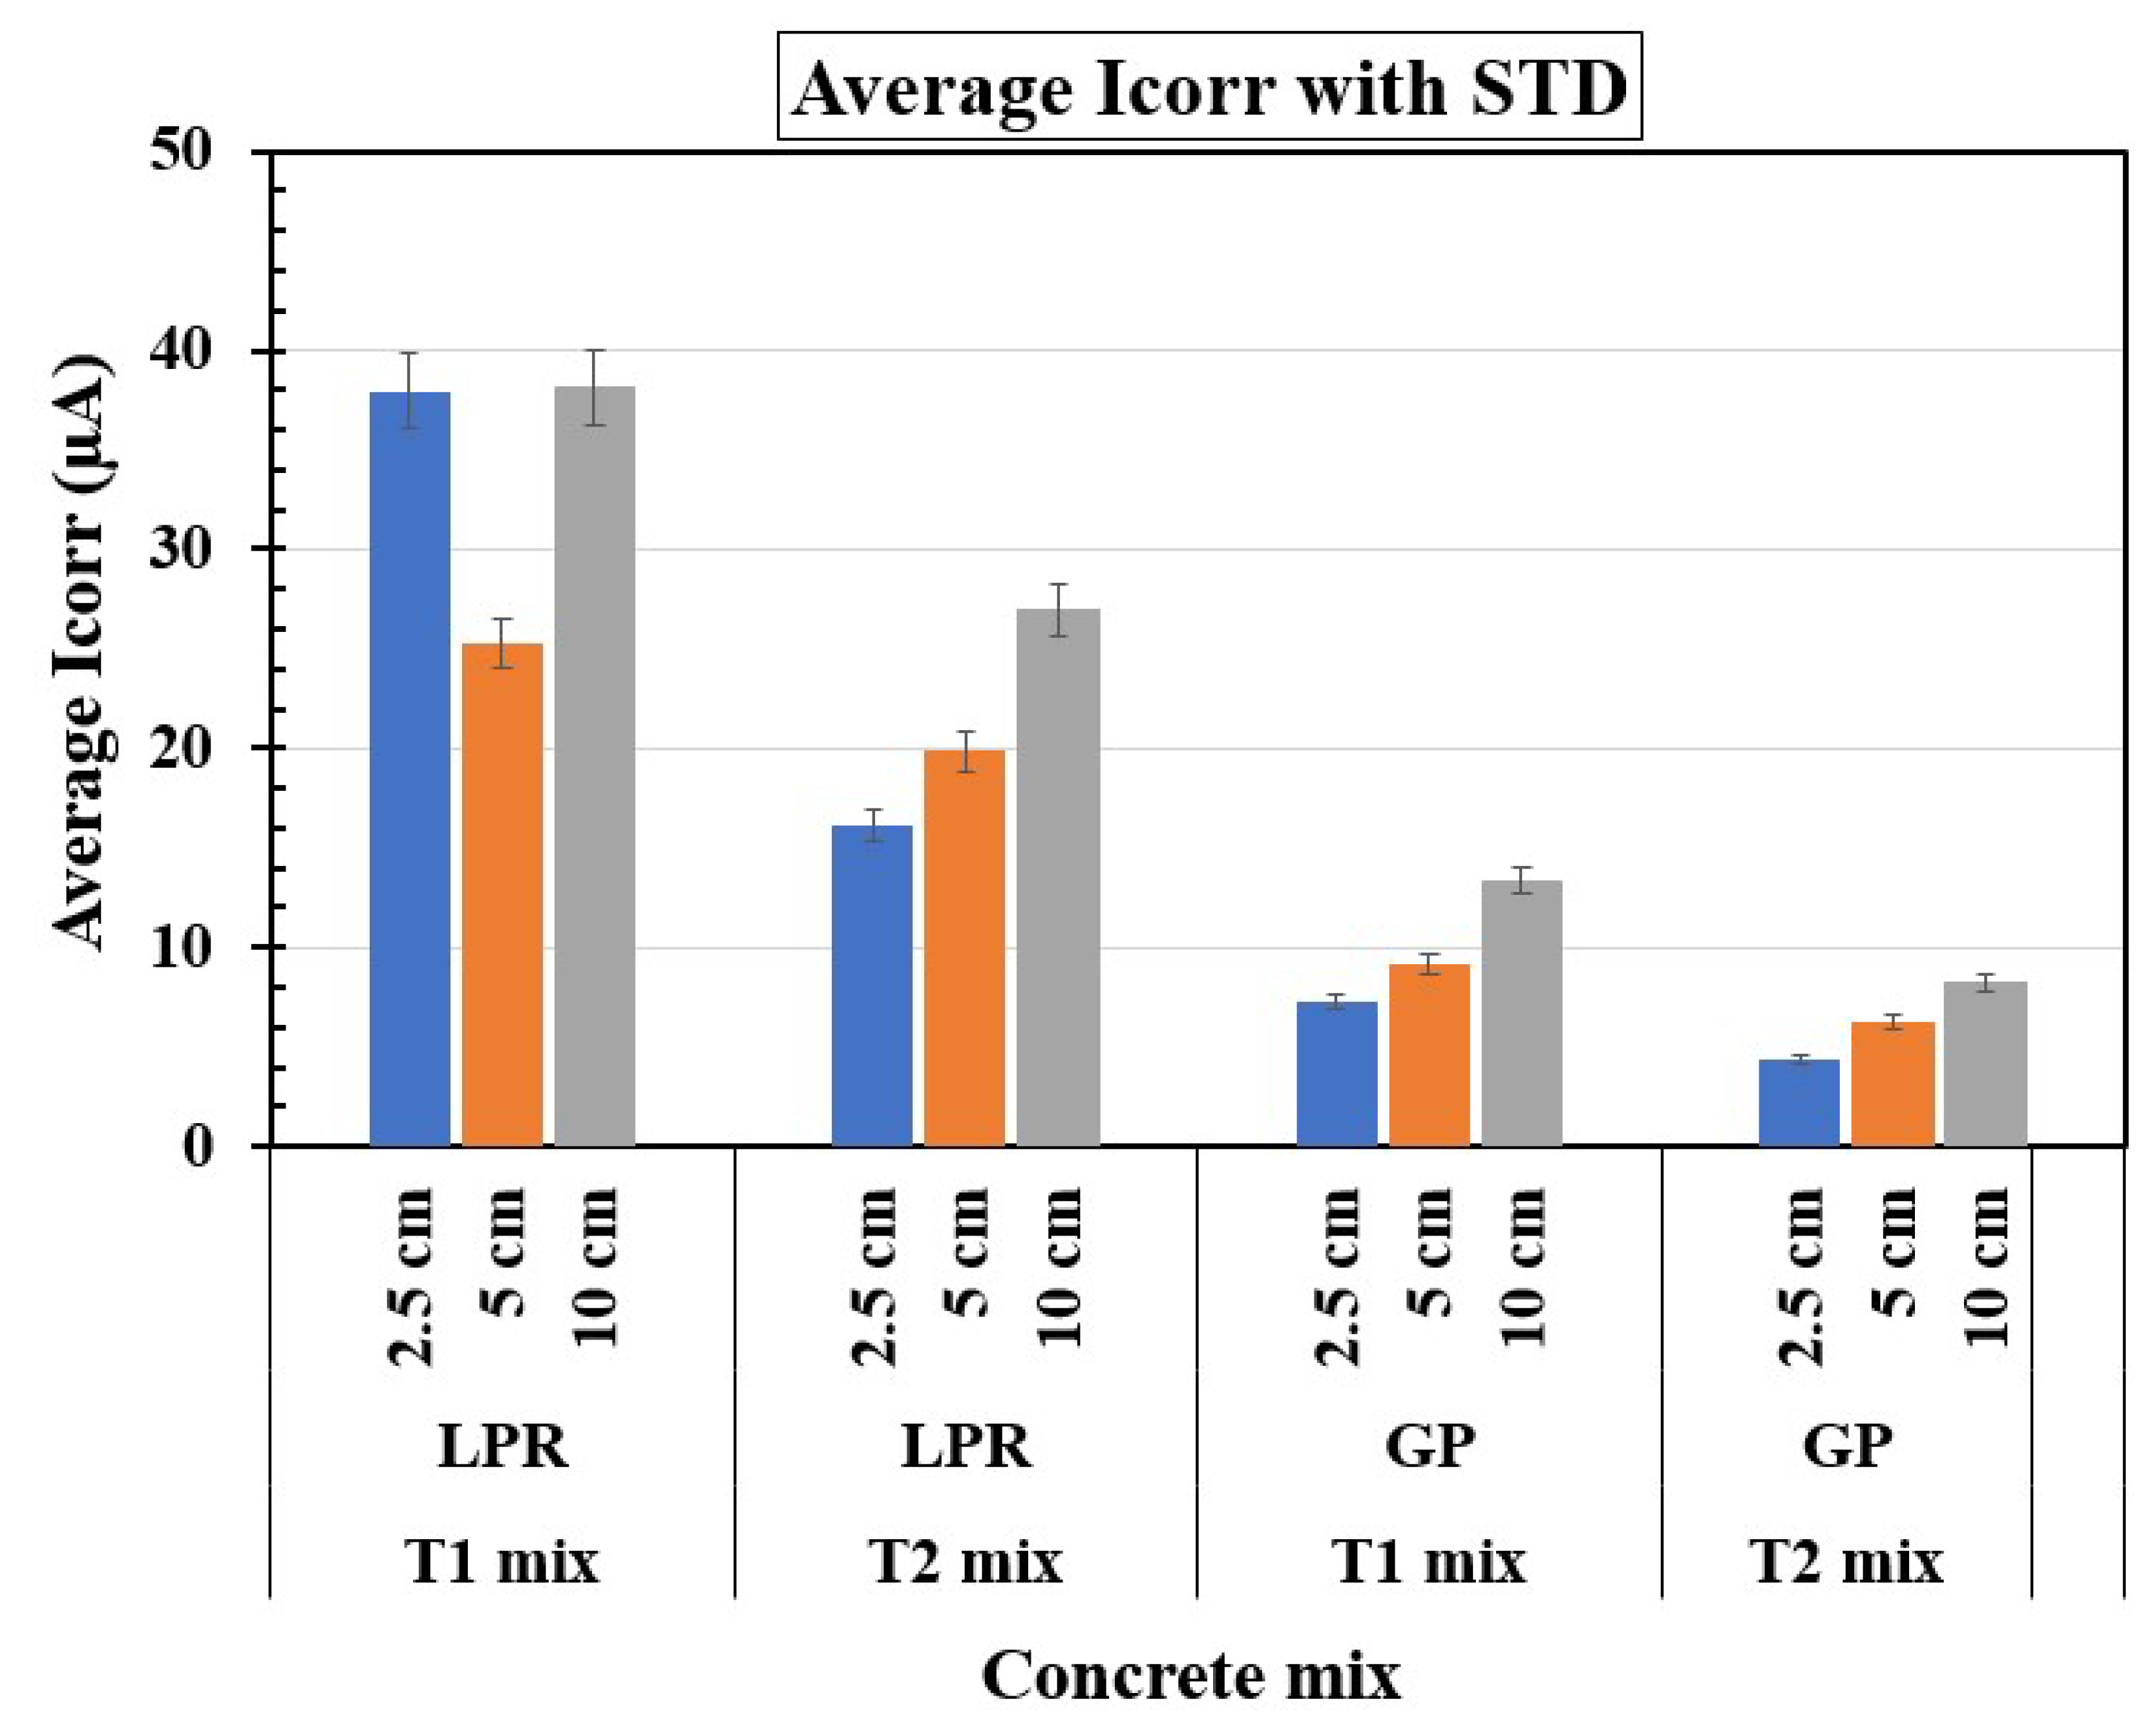
Figure 7.
Icorr vs. Rs plot for T1 three rebar samples.
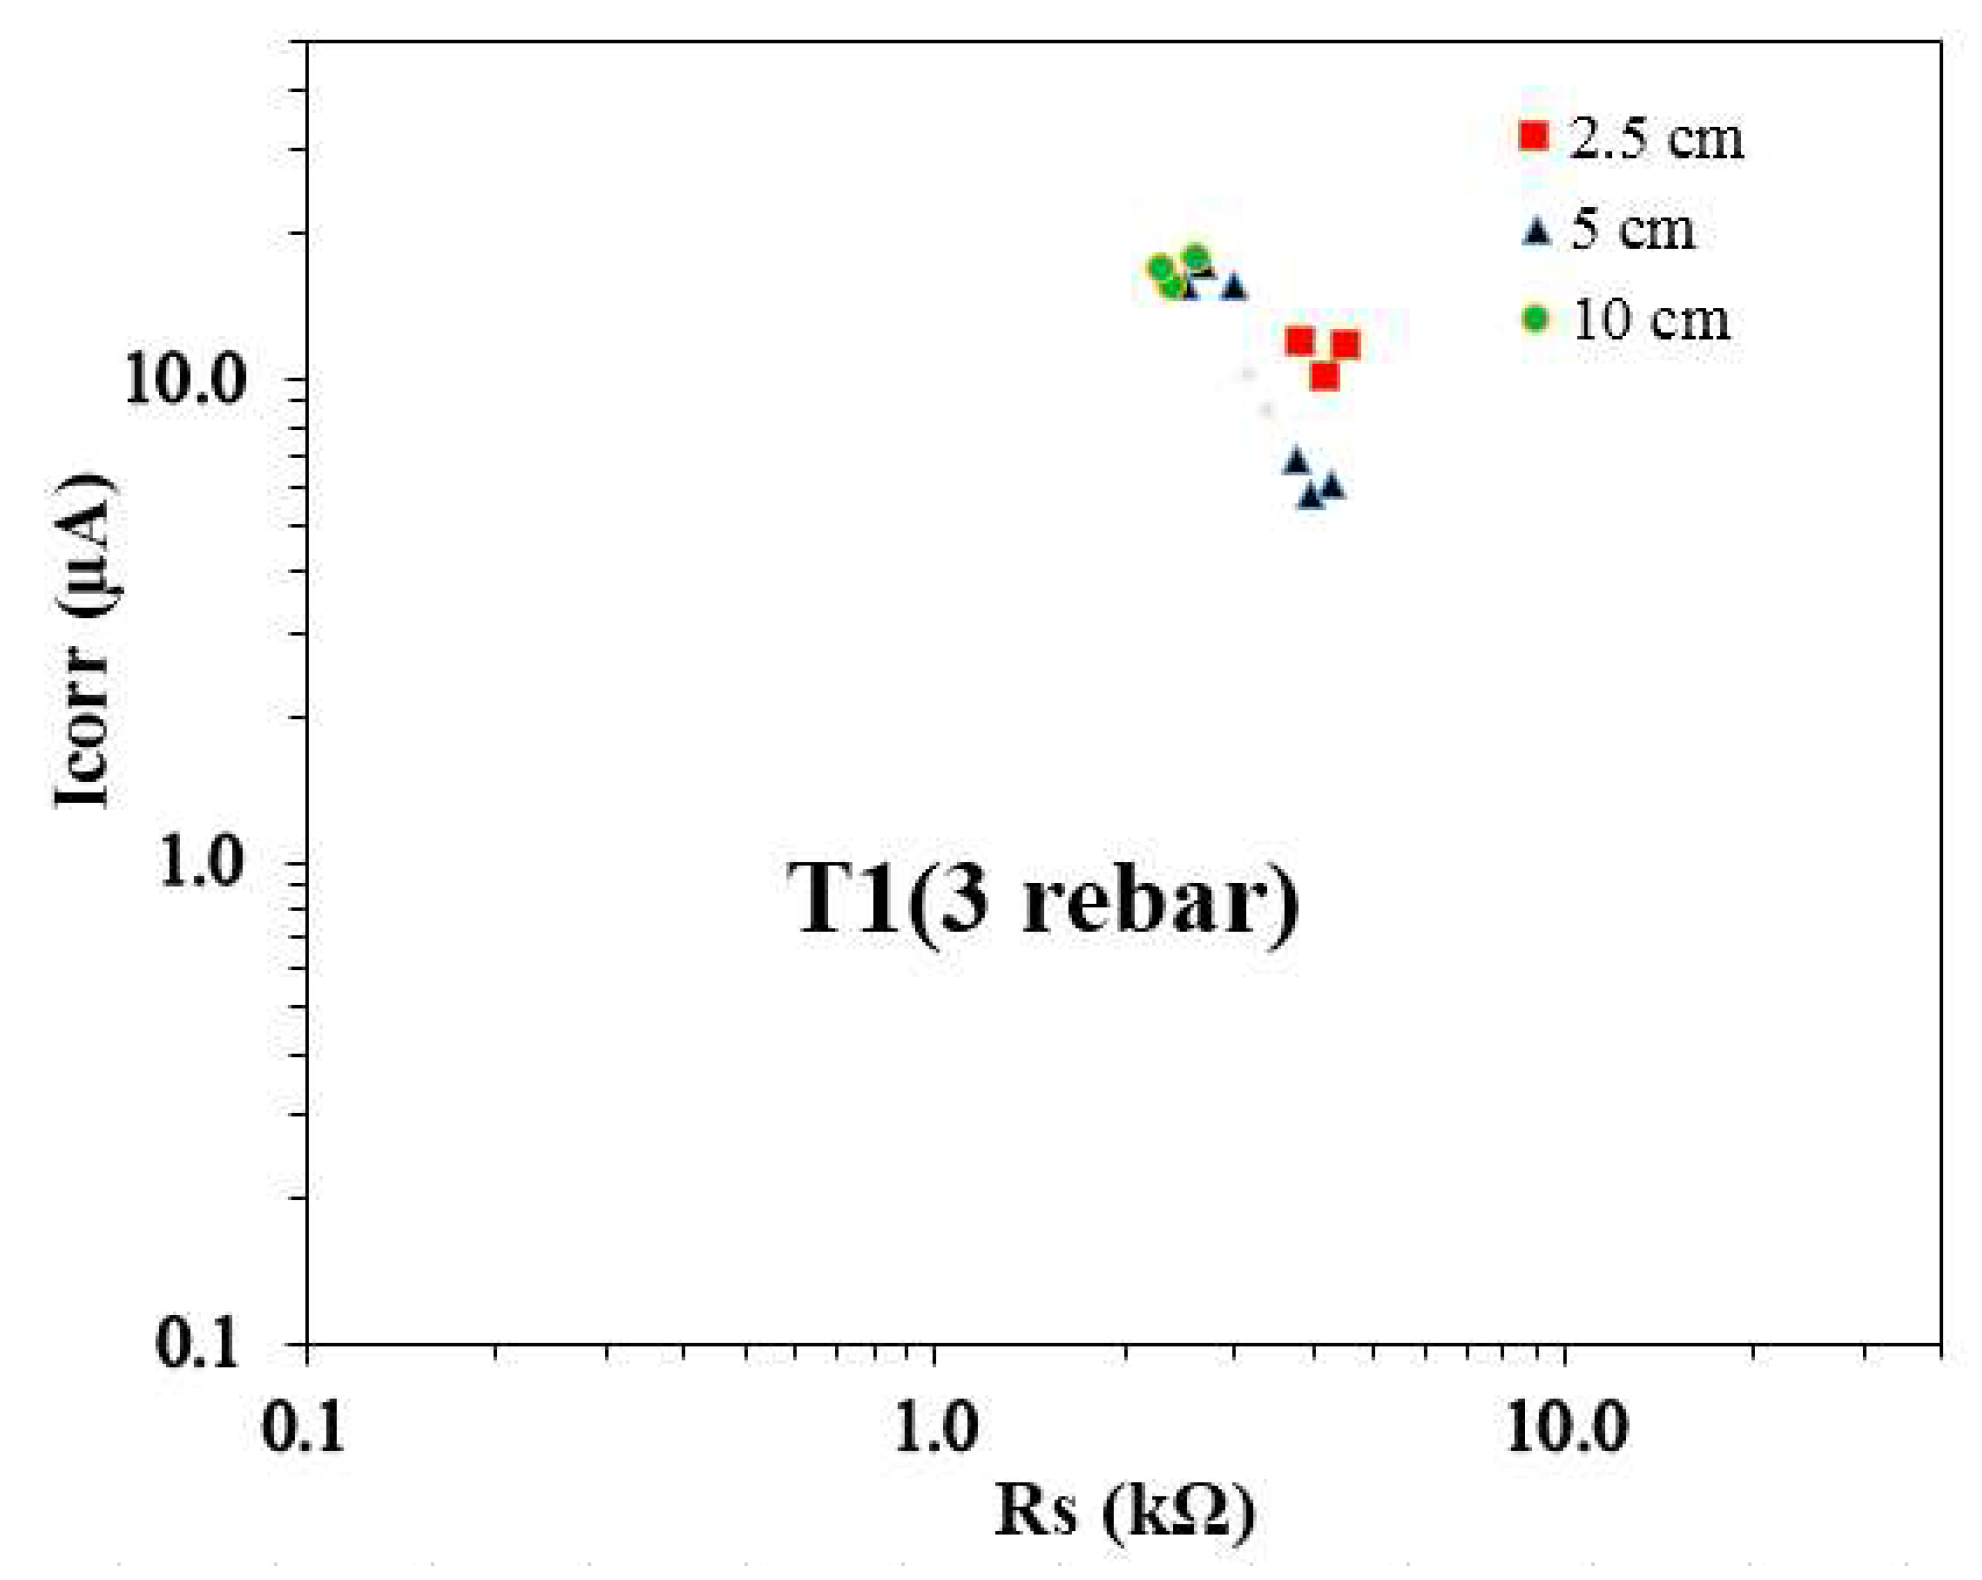
Figure 8.
Icorr vs. Rs plot for T2 three rebar samples.
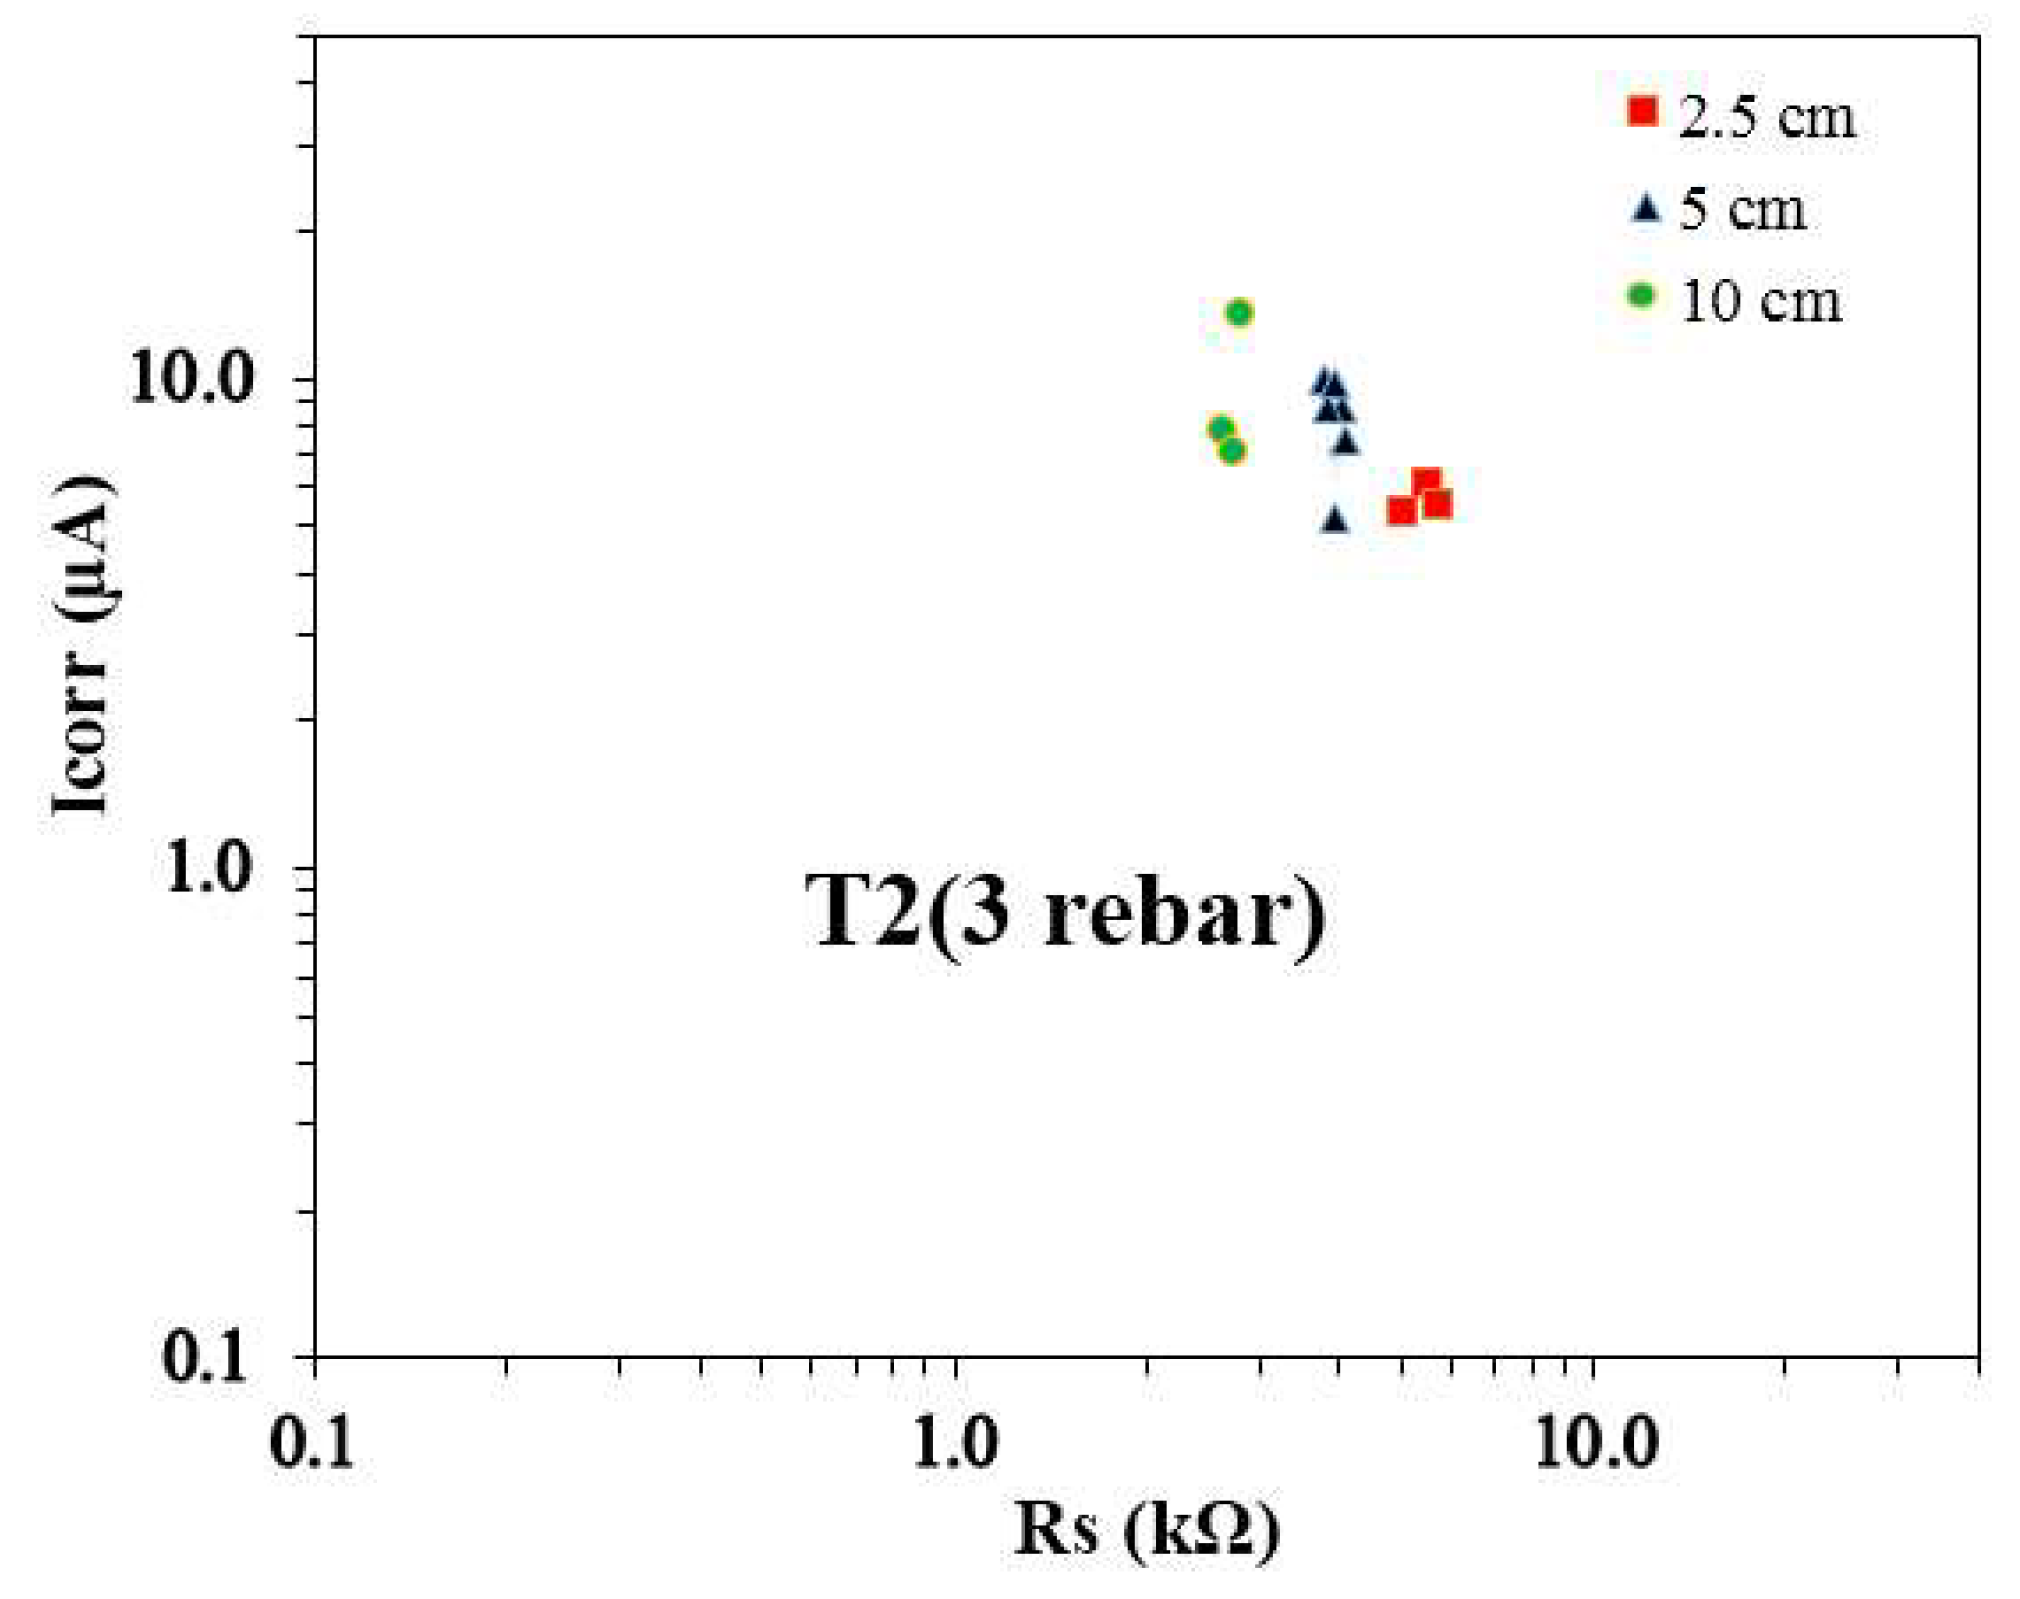
Figure 9.
Icorr vs. Rs plot for T1 three rebar samples.
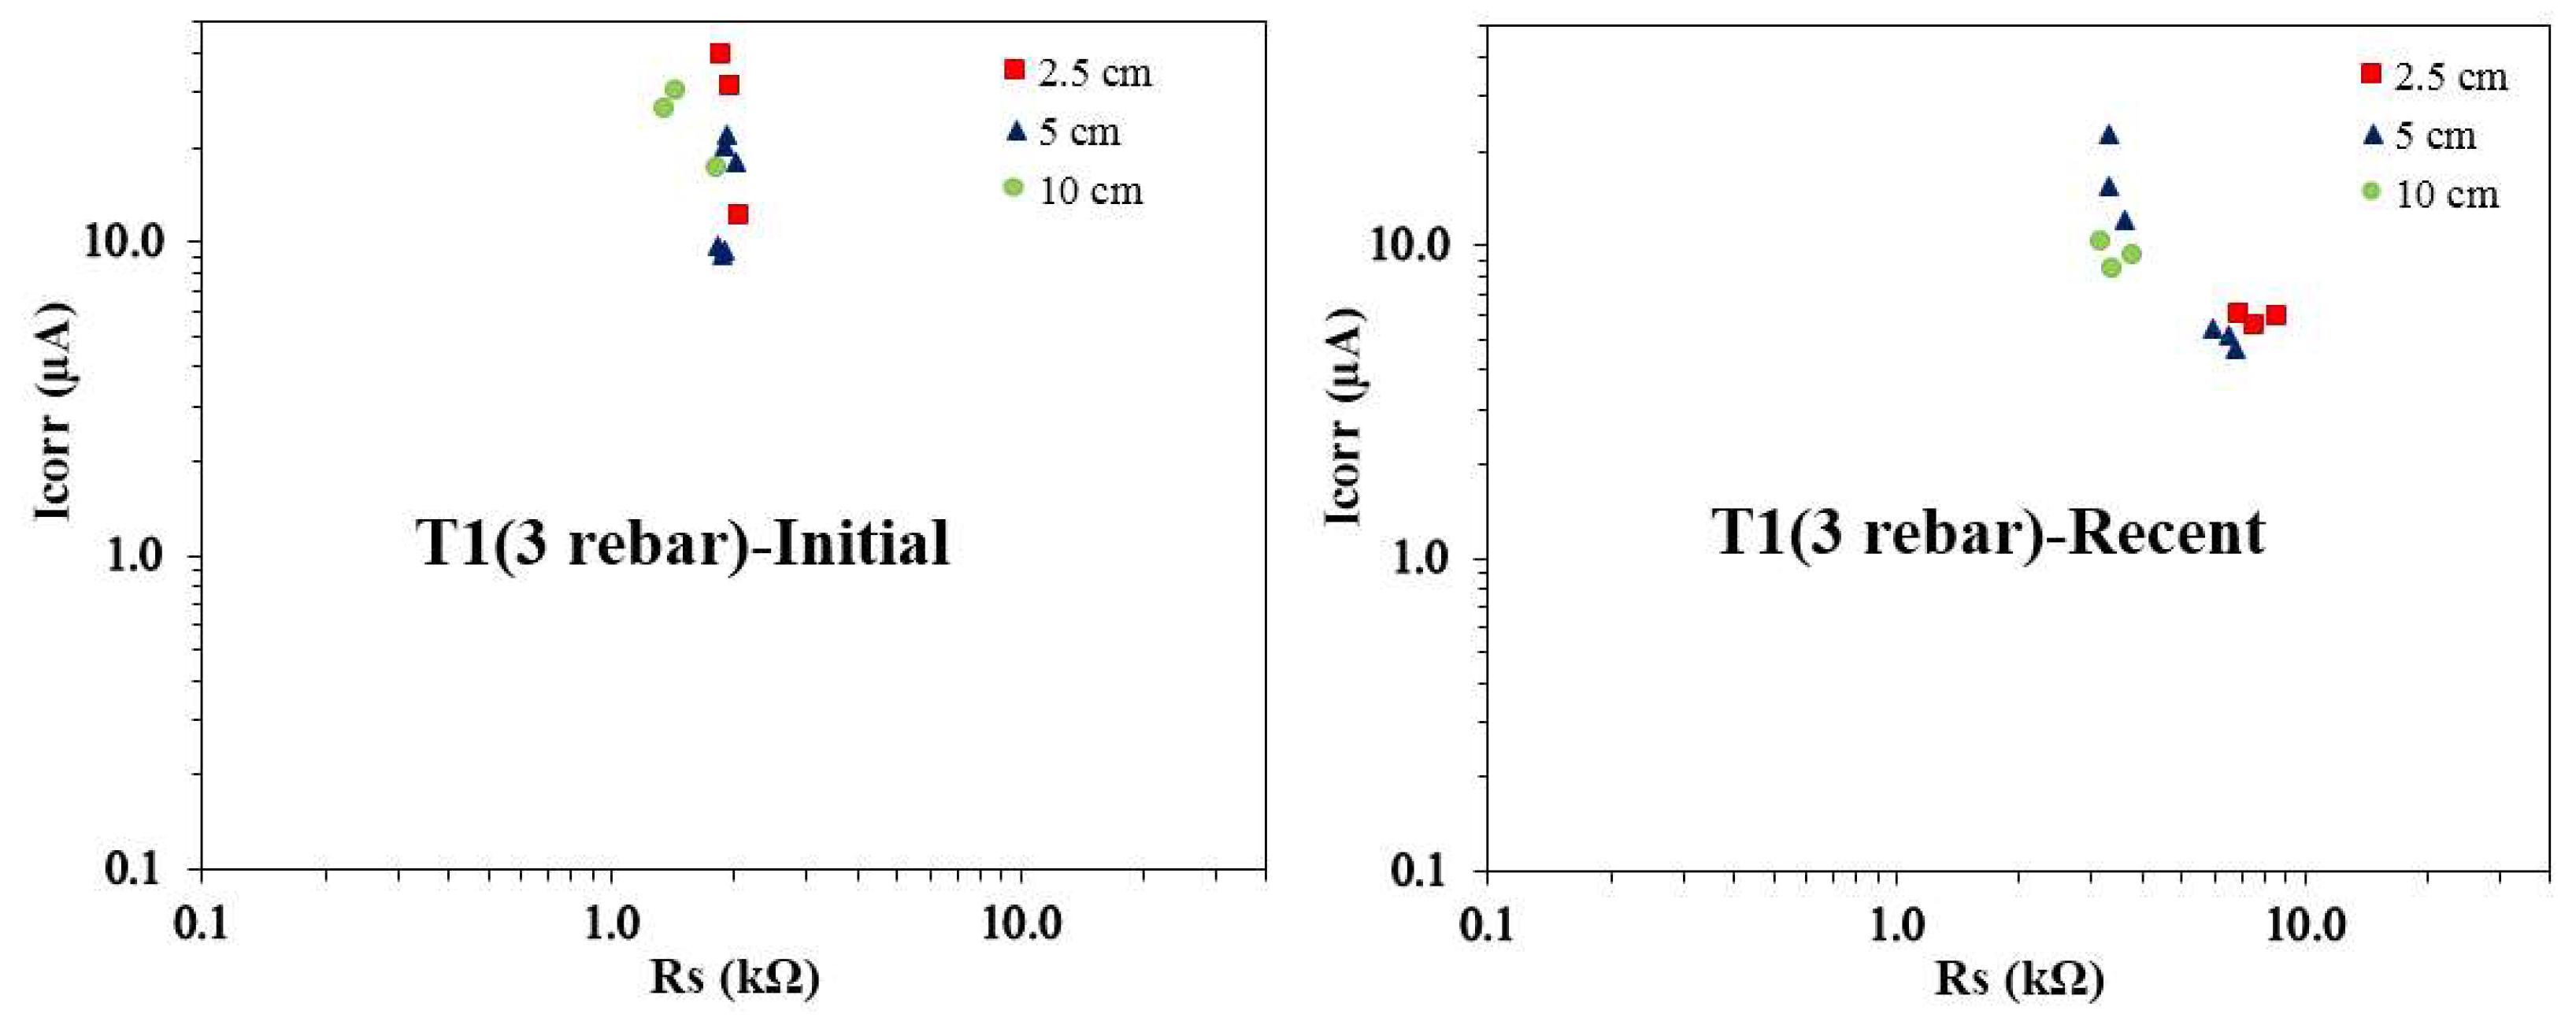
Figure 10.
Icorr vs. Rs plot for T2 three rebar samples.
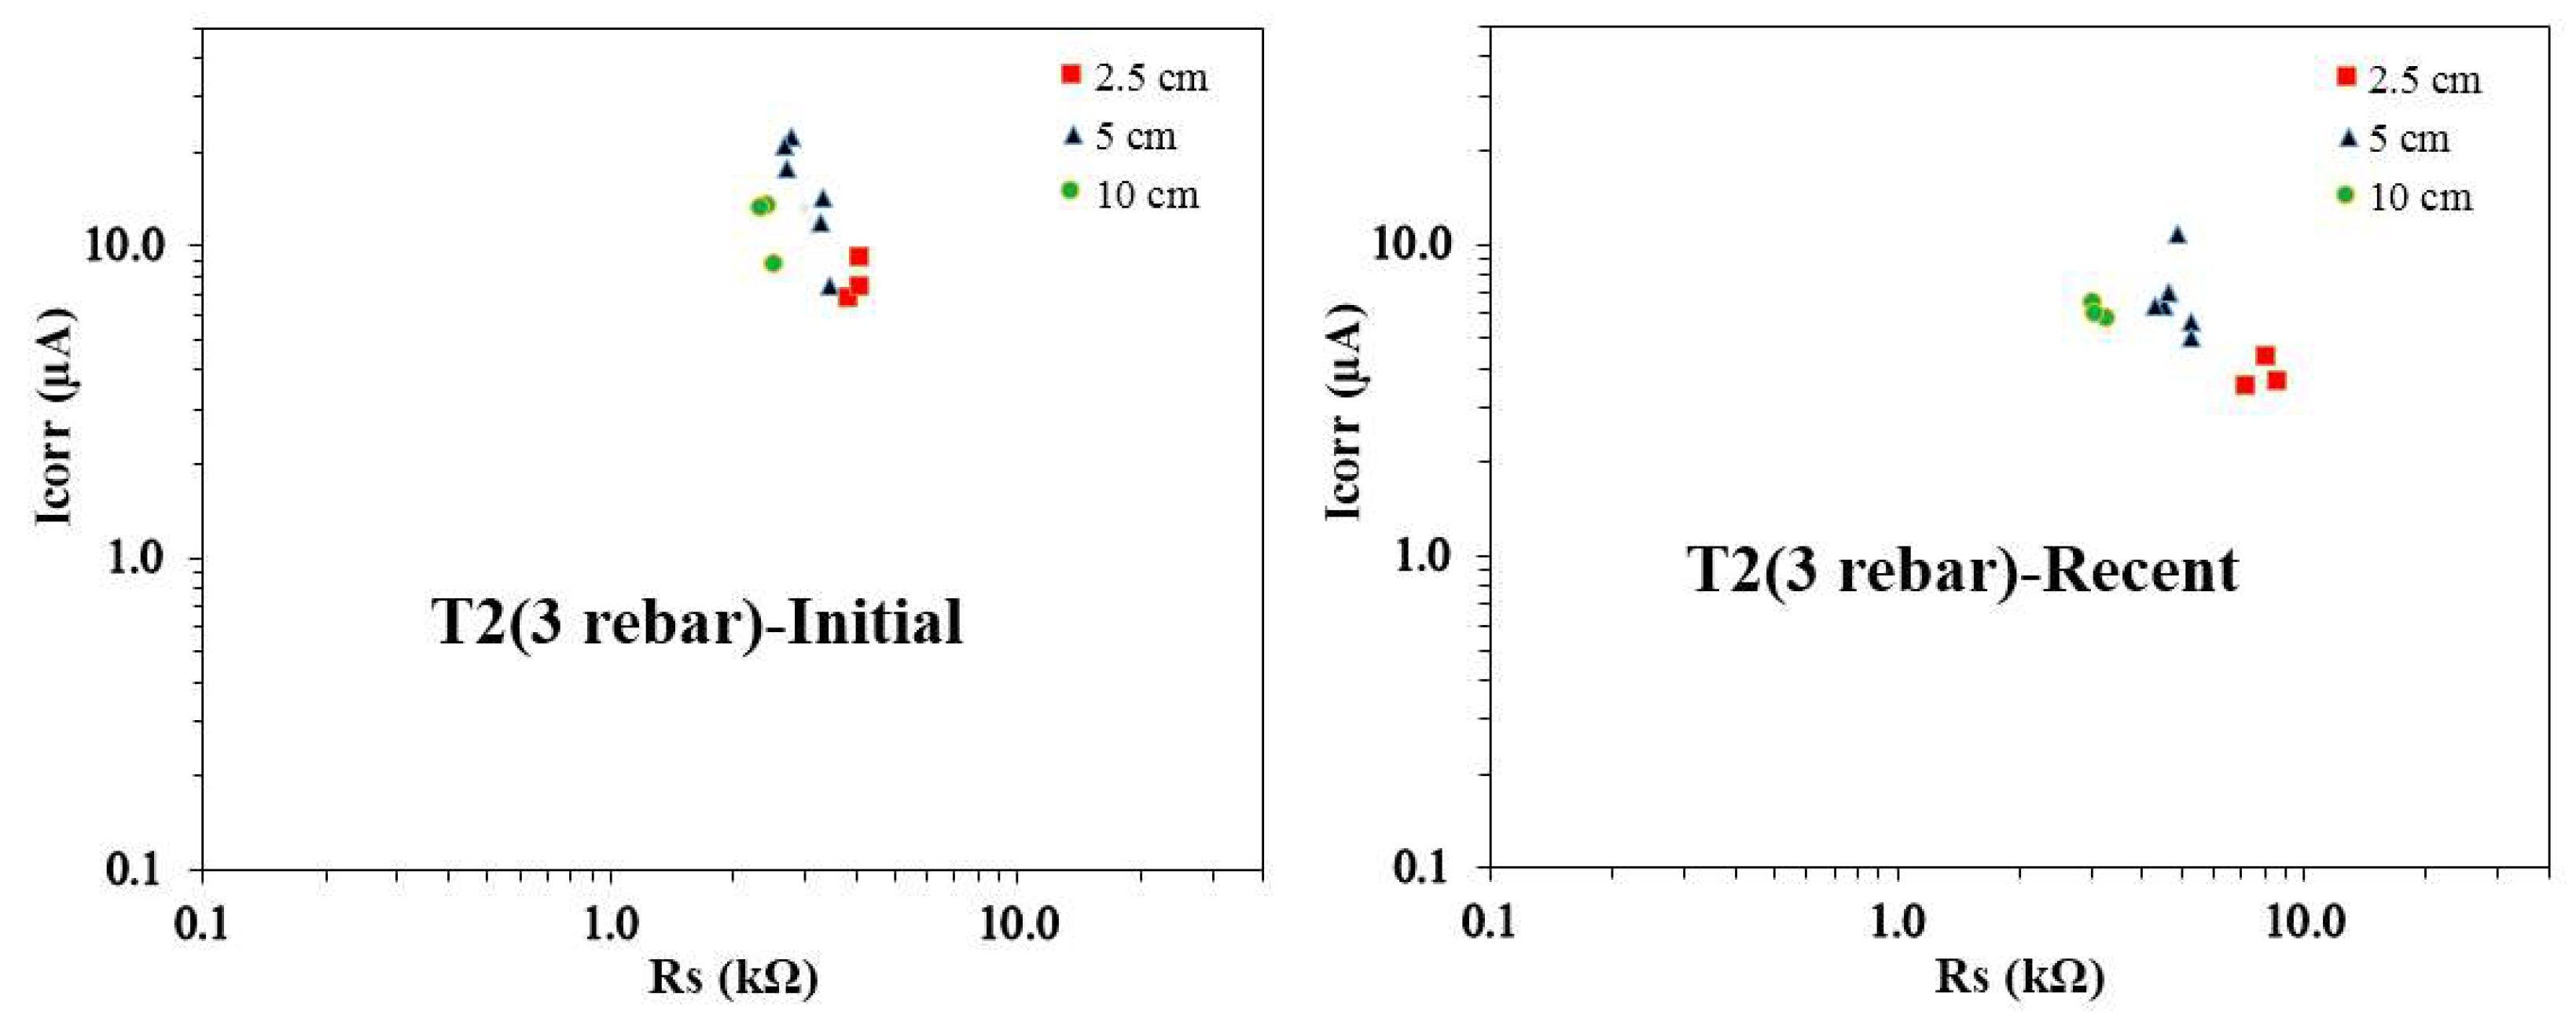
Figure 11.
Variation of mass loss with reservoir length and concrete mixes cast with three rebar.
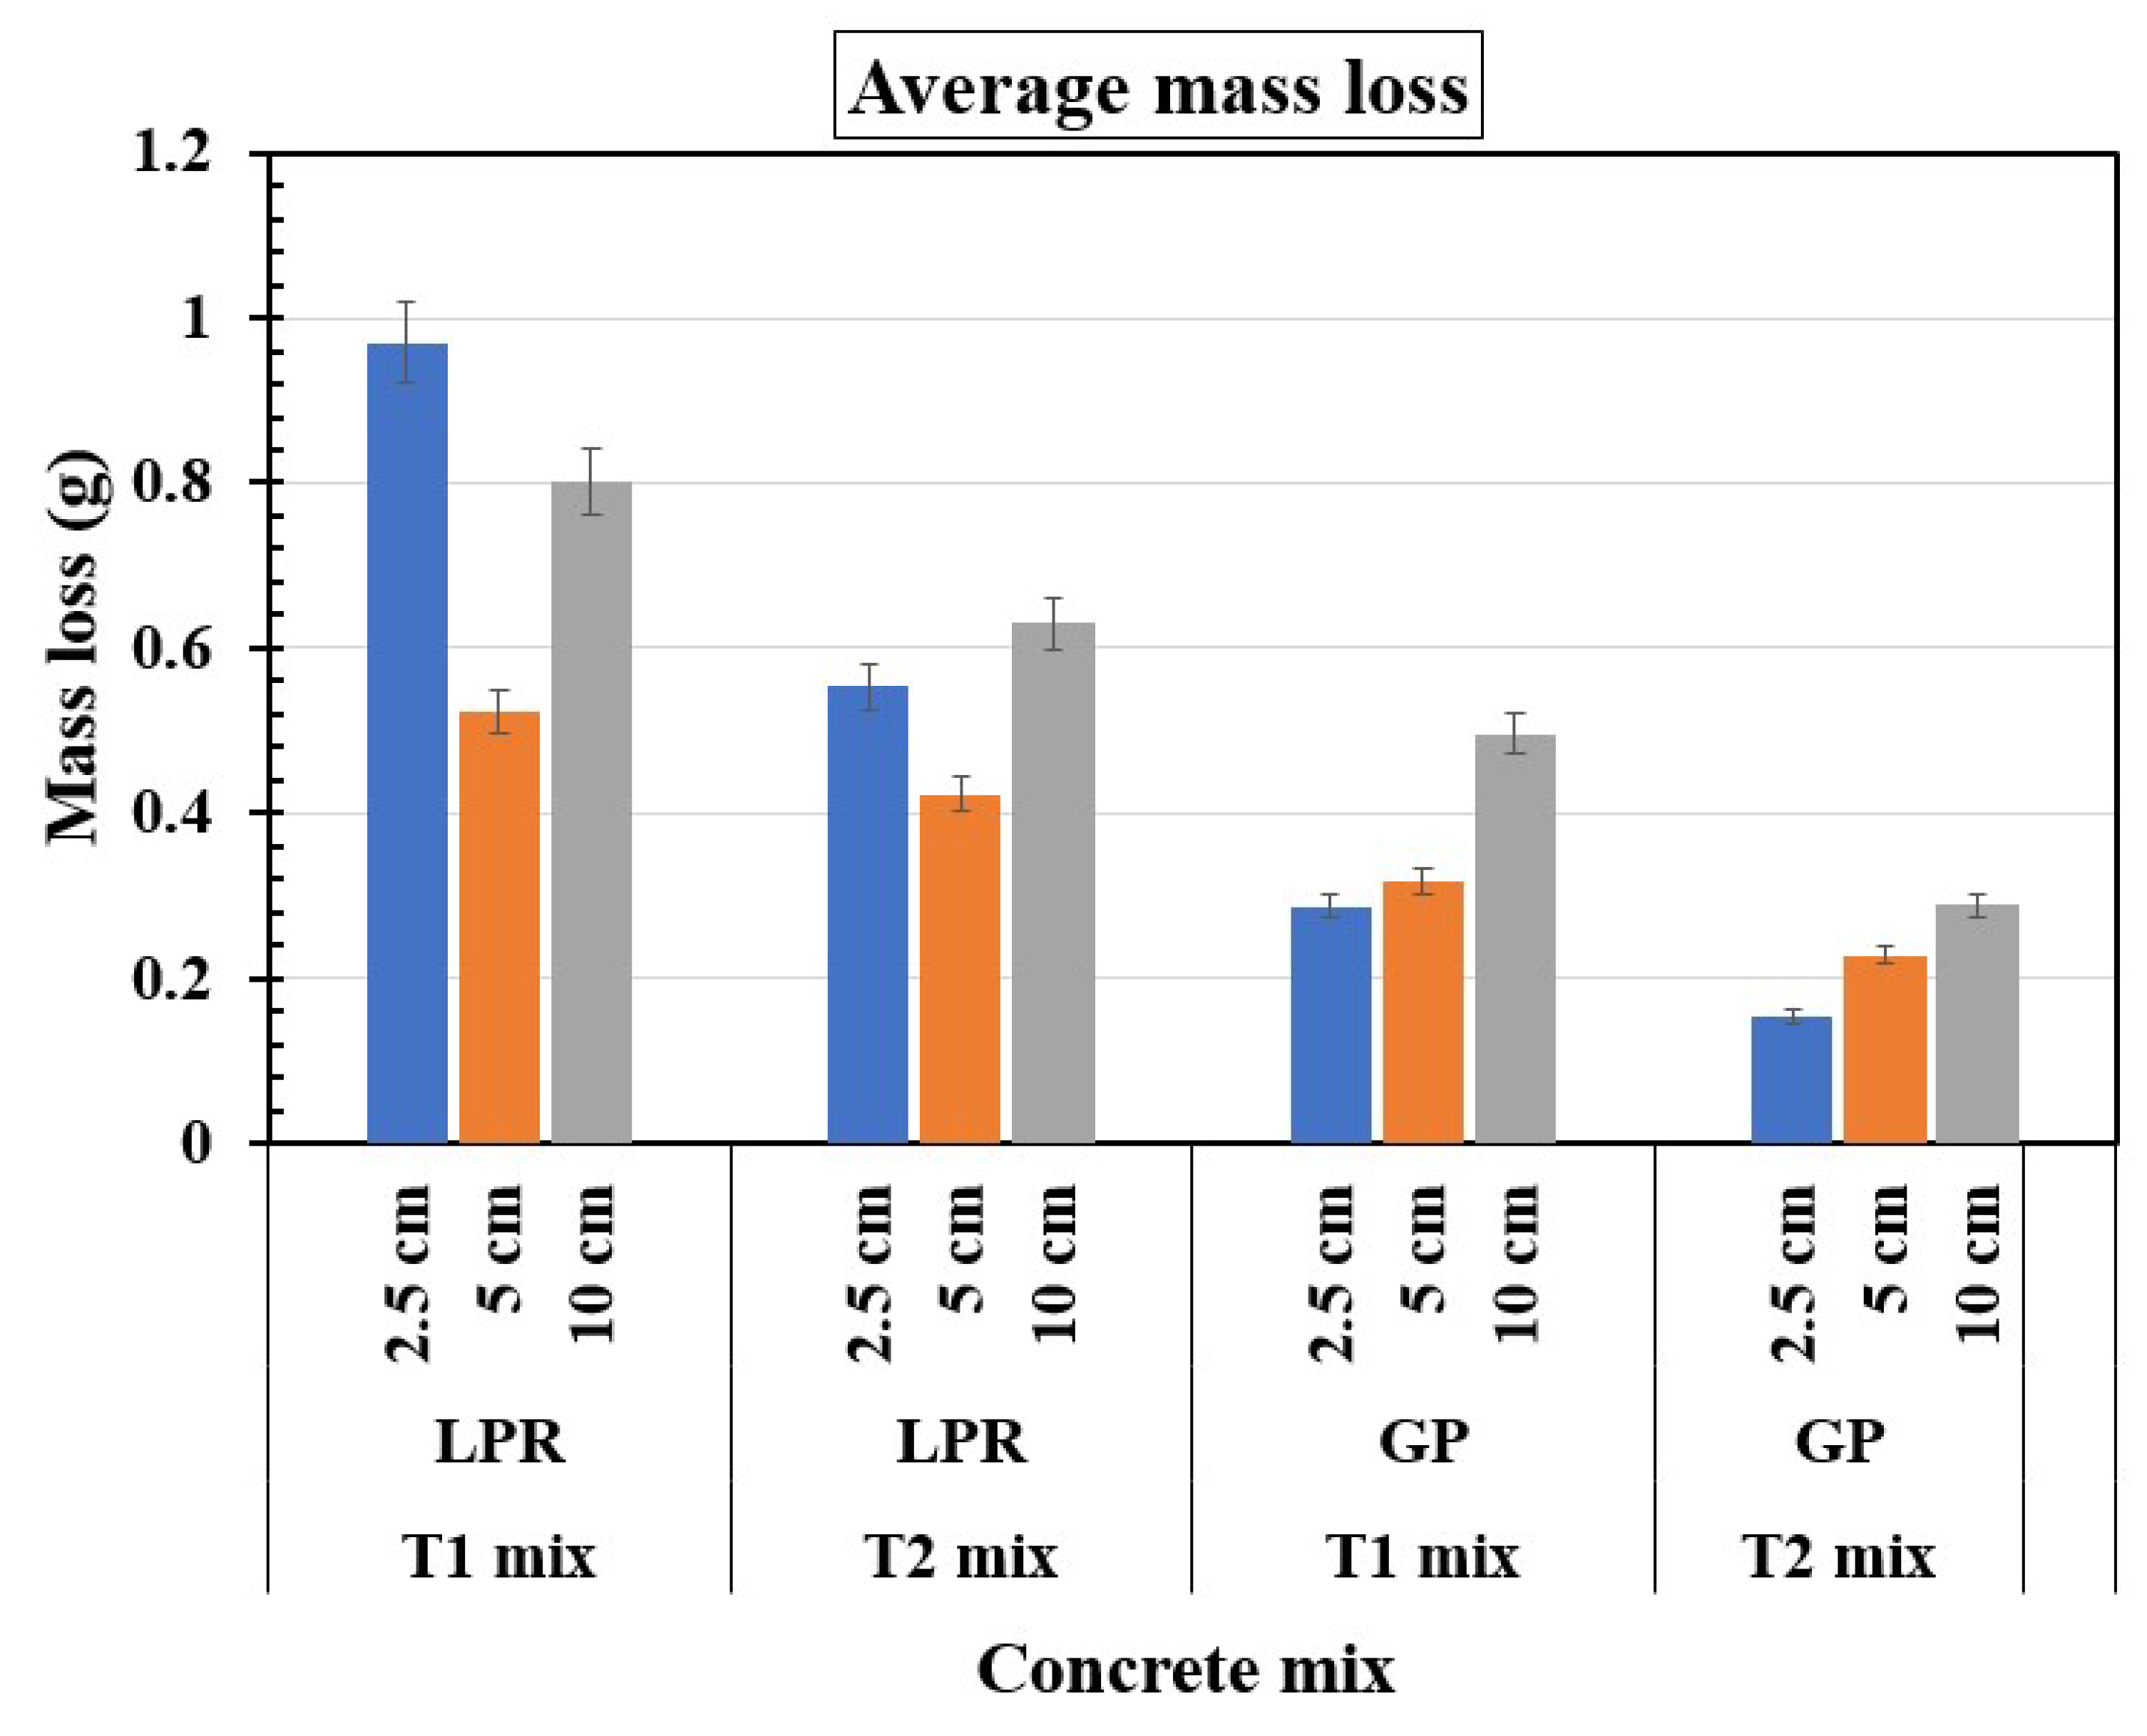

Table 1.
Detailed concrete mix compositions for the T1 and T2 specimens.
| Mix | Cementitious Content | Cement Content | 20% FA |
8% SF |
50% Slag | Fine agg. | Coarse agg. | w/cm ratio |
|---|---|---|---|---|---|---|---|---|
| (kg/ m3) |
(kg/ m3) |
(kg/ m3) |
(kg/ m3) |
(kg/ m3) |
(kg/ m3) |
(kg/ m3) |
||
| T1 | 390 | 117.5 | 78.3 | 0 | 195.2 | 761 | 1009 | 0.41 |
| T2 | 390 | 289 | 70 | 31 | 0 | 790 | 1046 | 0.37 |
Table 2.
Different three rebar samples made with T1 or T2 mixes.
| Sample Name | Reservoir Length (cm) |
Migration Time Started | Migration Ending Date |
Total Ampere- Hour |
|---|---|---|---|---|
| T1(25X) | 5 | 10/31/2016 | 12/9/2016 | 0.40 |
| T1(26X) | 2.5 | 10/31/2016 | 11/11/2016 | 0.81 |
| T1(27X) | 10 | 10/31/2016 | 11/11/2016 | 0.81 |
| T1(28X) | 5 | 10/31/2016 | 11/11/2016 | 0.81 |
| T2(29X) | 10 | 10/31/2016 | 12/9/2016 | 0.51 |
| T2(30X) | 2.5 | 10/31/2016 | 12/9/2016 | 0.30 |
| T2(31X) | 5 | 11/1/2016 | 12/9/2016 | 0.46 |
| T2(32X) | 5 | 10/31/2016 | 11/11/2016 | 0.81 |
Table 3.
Average Icorr and STD obtained from LPR readings for T1 & T2 three rebar specimens.
| Sample Name | Reservoir Length (cm) |
Rebar Number | |||||
|---|---|---|---|---|---|---|---|
| A | B | C | |||||
| Avg. Icorr (μA) | STD (μA) |
Avg. Icorr (μA) | STD (μA) |
Avg. Icorr (μA) | STD (μA) |
||
| 26X (T1) | 2.5 | 43.9 | 25.7 | 42.2 | 25.8 | 27.8 | 13.6 |
| 25X (T1) | 5 | 31.7 | 16.9 | 33.1 | 16.1 | 38.4 | 19.3 |
| 28X (T1) | 16.0 | 9.1 | 17.9 | 9.9 | 14.6 | 8.2 | |
| 27X (T1) | 10 | 42.8 | 24.5 | 38.6 | 18.9 | 33.1 | 17.7 |
| 30X (T2) | 2.5 | 17.9 | 10.2 | 16.0 | 8.6 | 14.5 | 8.9 |
| 31X (T2) | 5 | 22.3 | 11.4 | 20.6 | 11.0 | 12.1 | 4.7 |
| 32X (T2) | 23.2 | 11.2 | 20.9 | 10.8 | 19.9 | 10.9 | |
| 29X (T2) | 10 | 36.3 | 19.9 | 24.1 | 8.9 | 20.5 | 7.4 |
Table 4.
Average Icorr and STD obtained from GP readings for T1 & T2 three rebar specimens.
| Sample Name | Reservoir Length (cm) |
Rebar Number | |||||
|---|---|---|---|---|---|---|---|
| A | B | C | |||||
| Avg. Icorr (μA) | STD (μA) |
Avg. Icorr (μA) | STD (μA) |
Avg. Icorr (μA) | STD (μA) |
||
| 26X (T1) | 2.5 | 7.7 | 2.3 | 7.1 | 1.5 | 7.1 | 1.8 |
| 25X (T1) | 5 | 11.6 | 3.2 | 13.3 | 3.1 | 14.8 | 5.7 |
| 28X (T1) | 4.6 | 0.8 | 5.8 | 0.8 | 5.0 | 0.9 | |
| 27X (T1) | 10 | 12.0 | 4.7 | 13.5 | 3.3 | 14.8 | 6.9 |
| 30X (T2) | 2.5 | 4.5 | 0.8 | 4.6 | 2.3 | 4.0 | 0.7 |
| 31X (T2) | 5 | 5.5 | 0.6 | 8.0 | 1.9 | 4.7 | 0.3 |
| 32X (T2) | 6.1 | 1.0 | 6.4 | 0.6 | 6.9 | 1.2 | |
| 29X (T2) | 10 | 10.4 | 4.0 | 7.1 | 0.9 | 7.2 | 1.7 |
Table 5.
Estimated mass loss in grams obtained from LPR readings for T1 and T2 three rebar samples.
| Mass loss in grams (LPR) | ||||
|---|---|---|---|---|
| Sample Name | Reservoir Length (cm) |
Rebar Number | ||
| A | B | C | ||
| 25X (T1) | 5 | 0.677 | 0.707 | 0.804 |
| 26X (T1) | 2.5 | 0.905 | 1.423 | 0.581 |
| 27X (T1) | 10 | 0.900 | 0.818 | 0.688 |
| 28X (T1) | 5 | 0.339 | 0.359 | 0.257 |
| 29X (T2) | 10 | 0.847 | 0.567 | 0.475 |
| 30X (T2) | 2.5 | 1.023 | 0.328 | 0.312 |
| 31X (T2) | 5 | 0.479 | 0.433 | 0.268 |
| 32X (T2) | 5 | 0.494 | 0.439 | 0.425 |
Table 6.
Estimated mass loss in grams obtained from GP readings for T1 and T2 three rebar samples.
| Mass loss in grams (GP) | ||||
|---|---|---|---|---|
| Sample Name | Reservoir Length (cm) |
Rebar Number | ||
| A | B | C | ||
| 25X(T1) | 5 | 0.426 | 0.446 | 0.495 |
| 26X(T1) | 2.5 | 0.298 | 0.303 | 0.260 |
| 27X(T1) | 10 | 0.458 | 0.496 | 0.535 |
| 28X(T1) | 5 | 0.162 | 0.195 | 0.173 |
| 29X(T2) | 10 | 0.394 | 0.242 | 0.229 |
| 30X(T2) | 2.5 | 0.165 | 0.148 | 0.148 |
| 31X(T2) | 5 | 0.208 | 0.275 | 0.155 |
| 32X(T2) | 5 | 0.234 | 0.238 | 0.259 |
Disclaimer/Publisher’s Note: The statements, opinions and data contained in all publications are solely those of the individual author(s) and contributor(s) and not of MDPI and/or the editor(s). MDPI and/or the editor(s) disclaim responsibility for any injury to people or property resulting from any ideas, methods, instructions or products referred to in the content. |
© 2025 by the authors. Licensee MDPI, Basel, Switzerland. This article is an open access article distributed under the terms and conditions of the Creative Commons Attribution (CC BY) license (http://creativecommons.org/licenses/by/4.0/).
Copyright: This open access article is published under a Creative Commons CC BY 4.0 license, which permit the free download, distribution, and reuse, provided that the author and preprint are cited in any reuse.


