Submitted:
03 July 2025
Posted:
07 July 2025
You are already at the latest version
Abstract
This study presents the outcomes of a comprehensive experimental investigation focused on the bond behavior between reinforcing steel bars and concrete, assessed through standardized pull-out tests. The primary objective was to evaluate the influence of some key parameters: reinforcement bar diameter, concrete age (and associated compressive strength), steel microfiber content, and bentonite coating on rebar surfaces. Experiments were conducted under controlled laboratory conditions in accordance with relevant standards. Slip between steel and concrete was measured using a sophisticated high-precision optical laser device, enabling accurate assessment of bond characteristics. A large, i.e. statistically sufficient number of specimens was tested, allowing the results to be analyzed using analysis of variance (ANOVA) technique to determine the statistical significance of each parameter. Findings indicate that bentonite suspension coating do not significantly affect bond strength. Similarly, variations in bar diameter and microfiber content showed no statistically significant impact within the tested ranges. In contrast, concrete age — closely related to its compressive strength — exhibited a statistically significant influence, confirming that concrete maturity is a dominant factor in bond development. The results contribute to a better understanding of bond mechanisms in reinforced concrete and thus assist in optimizing design strategies where bond performance is critical.
Keywords:
concrete
; reinforcement
; rebars
; bentonite suspension
; bond strength
; pull out force
1. Introduction
Reinforced concrete structures are designed such that concrete primarily resists compressive stresses, while the embedded steel reinforcement carries the tensile stresses. The interaction between concrete and reinforcement is of paramount importance and is made possible primarily due to their similar coefficients of thermal expansion, the alkaline environment provided by the surrounding concrete—which protects the steel from corrosion—and the quality of the bond between the embedded (ribbed) reinforcement and the concrete.
The bond quality between concrete and embedded ribbed reinforcement significantly influences the load-bearing capacity of a reinforced concrete element as well as the entire concrete structure, in addition to the inherent properties of the concrete and the reinforcement itself. This is particularly critical in structures subjected to dynamic loads during their service life. Accordingly, current standards, especially those concerning seismic design, require the exclusive use of ribbed reinforcement bars in concrete.
In such cases, the bond between the reinforcement and surrounding concrete is often reported to be ensured through three primary mechanisms: adhesion, friction between the reinforcement bar and the concrete, and mechanical interlocking of the ribs with the surrounding concrete [1-3]. Adhesion, which mainly develops during early stages of cement hydration through the binding of hydrating cement particles to the steel surface, is the dominant mechanism at low load levels. As the load increases, adhesion fails, and the bond is maintained primarily by friction and mechanical interlocking [2]. Naaman [4] determined that at higher load levels, mechanical interlocking of the reinforcement ribs with the surrounding concrete becomes the predominant mechanism for ensuring bond strength between the embedded reinforcement and concrete.
Due to the importance of a high-quality bond between the surrounding concrete and the embedded reinforcement in terms of the load-bearing capacity, stability, and durability of reinforced concrete structures, many researchers frequently investigate the influence of various concrete and reinforcement parameters on the magnitude of the pull-out force Fpull (also referred to as “pull-off” force) and the bond stress τ between the embedded reinforcement and the surrounding concrete.
The bond stress τ between the reinforcement bar and the surrounding concrete is determined using Equation (1), where Φ stands for the nominal diameter of the reinforcement bar and le represents the embedment length, i.e., the length over which the reinforcement is in direct contact with the surrounding concrete. The maximum bond stress τmax stands for the peak bond stress occurring at the maximum pull-out force Fmax, as defined by Equation (2).
Saje and Lopatič [2] analyzed the influence of conventional ribbed steel reinforcement and various types of basalt reinforcement on the maximum bond strength τmax between embedded reinforcement and both normal-strength and high-strength concrete. They reported that, for specimens with both steel and basalt reinforcement of 12 mm diameter, the compressive strength of concrete significantly affected the bond strength between the concrete and reinforcement. In both cases, the values of τmax were approximately 70–80% higher when high-strength concrete was used, compared to normal-strength concrete. Specimens with embedded basalt reinforcement achieved approximately 30% lower τmax values than those with ribbed steel reinforcement bars.
Gangolu et al.l. [5] investigated the influence of rib geometry on bond strength τmax in high-strength concrete. They found that the τmax value for smooth (plain) bars was about 40–50% lower than for bars with spiral ribs. Furthermore, spiral rib orientation yielded higher τmax values compared to ribs oriented transversely (i.e., perpendicular to the longitudinal axis of the bar). The effect of reinforcement bar diameter on τmax was found to be minimal, whereas increasing the embedment length le resulted in a decrease in τmax.
Similar findings were reported by Bashir et al.l. [6], who examined the effects of Φ and le, as well as various rib geometries, on the value of τmax. They found that although the pull-out force Fmax generally increased with larger bar diameters and longer embedment lengths, the bond strength τmax tended to decrease with increasing bar diameter and embedment length, regardless of rib type or orientation.
Despite numerous studies and findings reported in the literature, the influence of individual parameters of embedded reinforcement bars and surrounding concrete on the bond behavior between reinforcement and concrete remains relatively under-researched. Moreover, the results from different studies are often contradictory. This is partly due to the limited number of test specimens used in existing studies, which does not allow for robust or advanced statistical analysis of the obtained results.
In this paper, we employ an advanced statistical method—analysis of variance (ANOVA)—to analyze the results of an extensive experimental campaign aimed at determining the influence of various reinforcement and concrete parameters on the bond behavior between embedded reinforcement and the surrounding concrete. Specifically, the influence of reinforcement bar diameter, concrete age (and thus its compressive strength), and steel fiber content in the concrete matrix were analyzed in detail. Additionally, in all cases, we analyze the effect of a prior bentonite coating on the reinforcement bars on the bond with the surrounding concrete. The experimental work was conducted in the concrete laboratories of Igmat and Irma, Slovenia.
2. Materials and Methods
2.1. Materials
2.1.1. Concrete
For specimen preparation, contractor-grade concrete was used, with the binder component consisting of two types of cement: CEM I 42.5 N SRO (20% of the total cement content) and CEM III/B 32.5 N – LH/SR (80%), in a total amount of 470 kg/m³. Microsilica in suspension was added at a dosage of 3.2% of the total cement mass in the fresh concrete mixture. The effective water-to-binder ratio (w/b)eff was determined according to the following equation:
Crushed limestone aggregate from the Calcit Kamnik separation plant was used, with nominal fractions of 0/2 mm (30% of the total aggregate content), 0/4 mm (29%), 4/8 mm (16.5%), and combined 8/16 mm and 16/32 mm fractions (24.5%), along with limestone filler in the amount of 15% of the cement mass. Three chemical admixtures were used: a high-range water-reducer (superplasticizer), a set retarder, and a stabilizer. The dosages of these admixtures were determined experimentally to achieve a target workability of 550 ± 100 mm slump flow (measured using the slump flow method), with an air content in the fresh concrete mixture of less than 3.0%.
In the case of micro-reinforced concrete, short hooked-end steel fibers were added, which do not significantly affect the workability of the fresh mix. The fibers were 16 mm in length and 0.5 mm in diameter (Figure 1).
Prior to casting, selected fresh concrete properties were determined in accordance with the applicable standards. The results of these measurements are presented in Table 1, with all tests conducted under standard laboratory conditions. The values shown represent the average results of three specimens.
At concrete ages of 28 and 90 days, selected hardened concrete properties were determined under standard laboratory conditions, also in accordance with the relevant standards. These results are presented in Table 2 and represent average values obtained from three specimens. Compressive strength was determined on 150 mm cube specimens.
2.1.2. Reinforcement
Ribbed steel reinforcement bars of two nominal diameters Φ12 mm and Φ22 mm were used in the study. The fundamental properties of the reinforcement bars, determined through a standard tensile test in accordance with EN 6892-1:2020 [15], as well as the rib ratio fR determined according to EN ISO 15630-1:2019 [16], are summarized in Table 3.
In this context, Rp0,2, Rm, Rm/Rp0,2, dfmax and Agt represent the 0.2% proof stress, ultimate tensile strength, the ratio of ultimate tensile strength to yield strength, total elongation at maximum force Fmax, and maximum diameter of the bar ribs, respectively. The rib ratio is denoted as fR and represents the proportion of ribs relative to the cross-sectional area of the reinforcement bar.
2.1.3. Bentonite Coating
A bentonite coating is commonly used in diaphragm wall construction. In this process, the excavated trench is first filled with a bentonite slurry, after which concrete is placed using the contractor method. The contractor concrete displaces the bentonite slurry, and it is essential to ensure adequate bond between the concrete and the embedded reinforcement.
2.2. Preparation of Test Samples
Prior to testing, test specimens were prepared in accordance with Annex D of EN 10080:2005 standard [17]. The specimens consisted of concrete cubes with 20 cm sides and a centrally embedded reinforcement bar. Special molds with integrated openings for bar placement were used (Figure 2). The standard prescribes a minimum cube side length of 20 cm or at least 10 times the bar diameter, which in the case of 22 mm diameter bars would require a minimum side length of 22 cm. However, since no damage to the concrete specimens was observed during testing, it was concluded that the slightly smaller cube size did not affect the test results.
The total length of the reinforcement bar was approximately 1.0 m, with 50 mm protruding below the specimen and 750 mm above. In accordance with the standard, the bond between the concrete and the reinforcement was ensured only along a length of 5Φ which corresponds to an embedment length le = 60 mm for bars of Φ = 12 mm, and le = 110 mm for Φ = 22 mm bars. On the remaining bar length—i.e., 140 mm for Φ = 12 mm and 90 mm for Φ = 22 mm—bond was completely prevented by fitting a plastic sleeve over the bar.
After proper positioning of the reinforcement bars in the molds, the specimens were filled with concrete. Placement of contractor-grade concrete, such as that used in this study, must be performed without vibration, a requirement that was adhered to during specimen casting. Adequate consolidation, without segregation or bleeding, was achieved through the previously described optimization of the fresh concrete mix and the resulting satisfactory fresh concrete properties.
After casting, the specimens were cured for 24 hours under standard laboratory conditions at a relative humidity of RH 60 ± 5% and ambient temperature of 20 ± 2°C before demolding. Following demolding, the specimens were cured until testing (i.e., at 28 and 90 days) in accordance with EN 12390-2:2019 standard [18].
2.3. Experimental methods
2.3.1. Determination of Basic Characteristics of Reinforcement Bars and Rebar Ratio
The basic properties of the reinforcement bars used, presented in Table 3, were determined using a standard tensile test according to EN 6892-1:2020 standard [15]. The test was conducted using Zwick Z400 universal testing machine equipped with special grips designed to ensure adequate clamping of the reinforcement bars, thereby completely preventing any slippage at the gripping points during the test. The reinforcement bar specimens were loaded until failure in accordance with Method A224 of the EN 6892-1:2020 standard [15], which prescribes displacement-controlled (or strain-controlled) loading of the specimen. The tensile test setup in accordance with the EN 6892-1:2020 standard [15] is shown in Figure 3.
Deformations during the test were measured using advanced laserXtens Array HP Zwick optical sensors (Figure 3), with a resolution of 0.11 µm. The results of the tensile test indicate that the reinforcement bars used conform to the S500B grade reinforcing steel.
The rebar ratio fR, defined as the proportion of ribs relative to the circumference of the bar, was determined using a specialized measurement system PSARON HTI RIB3D, along with its dedicated software. The optical measurement system enables 3D imaging of reinforcement bars with diameters up to 50 mm, providing automatic measurement of their key properties (nominal diameter, rib orientation, spacing and height, and ribbed surface area). It also allows for precise assessment of corrosion damage after exposure to aggressive environments. With accurate measurements of local corrosion pit depths, affected surface area, surface topography, cross-sectional reduction, and volume loss of corroded material, the system supports reliable analysis of corrosion damage and the calculation of both local and general corrosion rates. Figure 4 shows the procedure for determining fR on a ribbed reinforcement bar.
The results indicate that the rebar ratio complies with the requirements of the relevant standard.
2.3.2. Determination of Pull-Out Force Between Concrete and Embedded Reinforcement
The pull-out test was carried out in accordance with Annex D of EN 10080:2005 standard [17]. For testing, the specimen was mounted into a suitable adapter such that the load was applied at the upper, longer end of the reinforcement bar in an upward direction (Figure 5). Accordingly, a supporting system was used to fully restrain any upward movement of the concrete specimen during testing.
Displacement, or slip, between the reinforcement bar and the surrounding concrete was measured using a specialized optical laser system, representing a significant improvement over the standard method prescribed in EN 10080:2005 standard [17], which recommends the use of mechanical dial gauges.
The relative slip d between the reinforcement and the concrete was determined by measuring the change in distance between two reference points (Figure 5). The moving reference point was fixed to the reinforcement bar (upper point in Figure 5), while the fixed reference point was attached to a custom steel plate measuring 50 × 50 mm, rigidly mounted on the bottom face of the concrete cube (lower point in Figure 5). This setup provided higher resolution and, consequently, very accurate measurement of bar displacement during the test.
2.3.3. Analysis of Variance and Hypothesis Testing
In addition to basic statistical analyses, an advanced statistical technique—Analysis of Variance (ANOVA)—was used to assess the influence of individual parameters on the maximum pull-out force Fmax and the corresponding bond stress τmax, as well as to evaluate the test results. A more detailed theoretical background of the ANOVA method can be found elsewhere in the literature, e.g., [19].
We calculated the F-statistic and the critical F-value (denoted as Fcrit, and formulated the following null (H₀) and alternative (H₁) hypotheses:
- H₀ – The influence of the analyzed parameter (i.e., concrete age, reinforcement bar diameter, fiber content in concrete, or prior bentonite coating) on the value of Fmax (or τmax) is statistically significant.
- H₁ – The influence of the analyzed parameter (i.e., concrete age, reinforcement bar diameter, fiber content in concrete, or prior bentonite coating) on the value of Fmax (or τmax) is not statistically significant.
If F ≥ Fcrit, the null hypothesis cannot be rejected, indicating that the parameter has a statistically significant influence on Fmax (or τmax). If F < Fcrit, the null hypothesis is rejected, implying that the parameter does not have a statistically significant effect. A confidence level of α=0.05 was chosen, as is common in similar studies.
3. Results
3.1. General Presentation of d – Fpull (d – Ƭ) Diagram
A typical diagram of the development of pull-out force Fpull (or bond stress τ) as a function of slip d between the embedded reinforcement bar and the surrounding concrete is presented in Figure 6. The maximum pull-out force Fmax (and the maximum bond stress τmax) correspond to the peak point on the curve shown in the figure.
As can be clearly seen in Figure 6, the d–Fpull (or d–τ) diagram can be logically divided into four characteristic phases:
- Phase 1: An initial increase in pull-out force Fpull (or bond stress τ), during which full bond is maintained between the reinforcement and the concrete (i.e., the relative slip d=0).
- Phase 2: A linear increase in slip d with increasing pull-out force Fpull (or bond stress τ) up to the maximum values Fmax (or τmax).
- Phase 3: A nearly linear decrease in Fpull (or τ) with further increase in d.
- Phase 4: A pronounced increase in d, with a less steep decline in Fpull (or τ).
It is estimated that during Phase 1, the bond between the reinforcement and concrete is primarily governed by adhesion; in Phases 2 and 3, the dominant mechanisms are friction between the bar and the concrete, and mechanical interlock of the ribs into the concrete. During Phase 4, bonding is mainly ensured by mechanical interlock alone.
3.2. Influence of Different Parameters on Fmax and Ƭmax Values
Figure 7 and Figure 8 show the influence of reinforcement bar diameter Φ, concrete age, and amount of fibers on Fmax and τmax values, respectively. The graphs present the average values of four results (for specimens without prior coating) and five results (for specimens with prior bentonite coating), along with the standard deviations from these averages.
As expected, increasing the diameter of the reinforcement bar resulted in a significantly higher maximum pull-out force Fmax, both for bars without bentonite coating and for those with the coating. For specimens without prior coating, increasing the bar diameter from 12 mm to 22 mm led to an average increase in Fmax of 273%. For specimens with bentonite coating, this increase was very similar and reaches 268%. In contrast, the increase in bond stress τmax with increasing bar diameter was significantly lower, i.e., 11% without prior coating and 9% with bentonite coating. It is noticeable that in both diameter groups, the presence of a bentonite coating resulted in somewhat lower values of Fmax and τmax. For 12 mm bars, Fmax and τmax were on average 21% lower with the bentonite coating, while for 22 mm bars, they were 22% lower.
Next group of results, presented in Figure 7 and Figure 8 demonstrates the effect of concrete age—and thus its compressive strength—on the maximum pull-out force Fmax and maximum bond stress τmax. In this case, the diameter of the reinforcing bars Φ was 12 mm. The presented values represent the mean results of four tests in the uncoated condition and five tests in the coated condition, including the corresponding standard deviations. As shown in Table 2, the average compressive strength of concrete was 68.4 MPa at 28 days and 79.3 MPa at 90 days. With increasing concrete age from 28 to 90 days, both Fmax and τmax increased in specimens with and without the prior bentonite coating. On average, the increase in Fmax and τmax was 28% for coated bars and 57% for uncoated bars. At both testing ages, the application of bentonite coating to the reinforcement resulted in somewhat lower Fmax and τmax values. Specifically, at 28 days, the coated bars exhibited a 27% reduction in both maximum pull-out force and bond stress compared to the uncoated bars. At 90 days, this reduction increased to 56%.
Last group of results presents the influence of steel fiber content in concrete on the Fmax and τmax values. In this case, the diameter of the reinforcing bars was 22 mm. The results represent the mean values of four tests (without prior coating) and five tests (with prior coating), along with the corresponding standard deviations from the mean. In general, a slight decrease in both Fmax and τmax was observed with increasing fiber content. With the addition of 40 kg/m³ of steel fibers, Fmax and τmax increased by approximately 4% in the case of prior bentonite coating, compared to fiber-free specimens. Conversely, in the uncoated condition, a reduction of around 6% in both Fmax and τmax was recorded under the same fiber content. With a further increase in fiber content from 40 kg/m³ to 80 kg/m³, a decrease in both Fmax and τmax was observed. Specifically, in the case of prior coating, the reduction amounted to approximately 11%, while in the uncoated condition, the reduction was about 13%. In all cases, the presence of a bentonite coating on the reinforcing bars led to a reduction in both Fmax and τmax. In fiber-free concrete, this reduction averaged 29%, whereas in fiber-reinforced concrete, the average reduction was approximately 15%.
3.3. Statistical Analysis of Influence of Different Parameters on Fmax and Ƭmax Values
The following section presents the results of a statistical analysis evaluating the influence of the prior coating of reinforcing bars on the values of Fmax and τmax, conducted using analysis of variance (ANOVA) technique. A statistically significant effect of the coating is considered to be present when the critical F-value (Fcrit) exceeds the calculated F-statistic.
As shown in Figure 9, the prior coating of reinforcing bars had a statistically significant effect on the reduction of Fmax and τmax only in two specific cases: (i) for specimens aged 90 days with a bar diameter of 12 mm, and (ii) for specimens aged 28 days with a bar diameter of 22 mm. In all other cases, the effect of the coating on Fmax and τmax was not statistically significant.
It can be clearly realized from Figure 10 that both in the case without prior coating of the reinforcing bars (Figure 10a) and with bentonite-coated bars (Figure 10b), increasing the concrete age from 28 to 90 days and increasing the bar diameter from 12 mm to 22 mm had a statistically significant effect on the increase in maximum pull-out force Fmax.
Similarly, the increase in concrete age from 28 to 90 days had a statistically significant effect on the increase in maximum bond stress τmax in both coated and uncoated conditions. In contrast, unlike its effect on Fmax, the influence of bar diameter on τmax was not statistically significant, regardless of the presence of the prior coating (Figure 11).
4. Discussion
The results presented in the previous sections show that the bond stress values between embedded ribbed reinforcement and the surrounding concrete generally fall within the range of 10–17 MPa, which is consistent with values reported in the literature [2,6].
The application of the bentonite coating to the reinforcing bars resulted in a reduction in both the maximum pull-out force Fmax and the bond stress τmax in all analyzed cases. This reduction ranged, on average, between 15% and 56%. However, statistically significant reductions in Fmax and τmax due to the coating were observed only in two cases: for 90-day-old specimens with 12 mm diameter bars and for 28-day-old specimens with 22 mm diameter bars. In all other cases, the coating did not result in statistically significant differences, likely due to the relatively high variability (variance) within each set of test results. This suggests that, in general, the bentonite wash does not have a major impact on the bond between embedded reinforcement and surrounding concrete.
While the increase in bar diameter from 12 mm to 22 mm resulted in a statistically significant increase in Fmax —both in coated and uncoated conditions, the effect of bar diameter on τmax was not statistically significant. These findings are consistent with those reported by Gangolu et al. [5], while Bashir et al. [6] and Eligehausen et al. [20] and Tayeh et al. [21] observed a slight decrease in bond stress τmax with increasing bar diameter.
The amount of steel fibers in the concrete had no statistically significant effect on either the pull-out force Fmax or the bond stress τmax. This indicates that the presence of fibers in concrete does not influence the bond between concrete and reinforcement. This result is expected, as the fiber content does not substantially affect the properties or quality of the interfacial transition zone between the reinforcement and the cementitious matrix, which plays a key role in bond performance.
In contrast, as concrete ages, its mechanical properties improve, which enhances the interfacial transition zone and consequently, the bond strength between the reinforcement and the cement matrix. This is reflected in the statistically significant increase in both Fmax and τmax with concrete age, from 28 to 90 days.
5. Conclusions
In this study, the results of a comprehensive experimental work are presented aimed to study the influence of various parameters related to concrete and embedded ribbed reinforcement on the maximum pull-out force (Fmax) and bond stress (τmax) between the reinforcement and surrounding concrete. The pull-out tests were conducted in accordance with Annex D of the standard EN 10080:2005 [17], with the most significant modification being the use of an advanced optical measurement system for monitoring deformations and displacements during testing. This allows to determine deformations/displacements values very accurately and precisely.
Based on the presented results, the following key conclusions and findings can be drawn:
- The prior bentonite coating of reinforcement bars had a statistically significant effect on the reduction of both Fmax and τmax only in two cases: for 90-day-old specimens with 12 mm diameter reinforcement and for 28-day-old specimens with 22 mm diameter reinforcement. In all other cases, the coating did not result in a statistically significant reduction in Fmax or τmax.
- In the uncoated condition, increasing the reinforcement bar diameter from 12 mm to 22 mm led to an average increase in Fmax of 273%, and in τmax of 11%. In the coated condition, the same increase in bar diameter resulted in an average increase in Fmax of 268% and in τmax of 9%. While the increase in bar diameter had a statistically significant effect on Fmax in both coated and uncoated conditions, its influence on τmax was not statistically significant.
- In the uncoated condition, increasing the concrete age from 28 to 90 days resulted in a 57% increase in both Fmax and τmax. In the coated condition, this increase averaged 28%. In both cases, the increase in concrete age had a statistically significant positive effect on Fmax and τmax.
- The addition of fibers to the concrete generally led to a slight decrease in Fmax and τmax. However, this effect was not statistically significant in either the coated or uncoated condition.
References
- Bilek, V., Bonczkova, S., Hurta, J., Pytlik, D., Mrovec, M., Bond Strength Between Reinforcing Steel and Different Types of Concrete, Procedia Engineering, 190, 243-247, 2017.
- Saje, D., Lopatič, J., Obnašanje stika med betonom in armaturnimi palicami iz bazaltnih vlaken, Gradbeni Vestnik, 70, 186-196, 2021.
- Yoo, D. Y., Shin, H. O., Bond performance of steel rebar embedded in 80–180 MPa ultra-high-strength concrete, Cement and Concrete Composites, 93, 206-217, 2018.
- Naaman, A. E., Engineered steel fibers with optim l properties for reinforcement of cement composites, Journal of advanced concrete technology, 1 (4), 241-252, 2003.
- Gangolu, A. R., Pandurangan, K., Sultana, F., Eligehausen, R., Studies on the pull-out strength of ribbed bars in high-strength concrete, Research Gate, https://www.researchgate.net/publication/288403054_Studies_on_the_pull-out_strength_of_ribbed_bars_in_high-strength_concrete, 1-6, 2007.
- Bashir, M. T., Ansar, M., Muhammad, S., Farid F., Abbas, M. I., Pull-out Behavior of Conventional Steel Reinforcement in Normal and High Strength Concrete, International Journal of Scientific Engineering and Science, 3 (4), 18-25, 2019.
- EN 12350-1:2019, Testing fresh concrete - Part 1: Sampling and common apparatus.
- EN 12350-8:2019, Testing fresh concrete - Part 8: Self-compacting concrete - Slump-flow test.
- EN 12350-7:2019, Testing fresh concrete - Part 7: Air content - Pressure methods.
- EN 12350-6:2019, Testing fresh concrete - Part 6: Density.
- SIST 1026:2016 Beton - Specifikacija, lastnosti, proizvodnja in skladnost - Pravila za uporabo SIST EN 206, Slovenski inštitut za standardizacijo, Ljubljana, 2016 (in Slovenian).
- EN 12390-3:2019, Testing hardened concrete - Part 3: Compressive strength of test specimens.
- DIN 1048-1, Testing concrete; testing of fresh concrete, DIN, 1991.
- EN 12390-8:2019, Testing hardened concrete - Part 8: Depth of penetration of water under pressure.
- EN 6892-1:2020, Metallic materials — Tensile testing — Part 1: Method of test at room temperature.
- EN ISO 15630-1:2019, Steel for the reinforcement and prestressing of concrete — Test methods, Part 1: Reinforcing bars, rods and wire.
- EN 10080:2005, Steel for the reinforcement of concrete – Weldable reinforcing steel - General.
- EN 12390-2:2019, Testing hardened concrete - Part 2: Making and curing specimens for strength tests.
- Turk, G., Verjetnostni račun in statistika, Univerza v Ljubljani, Fakulteta za gradbeništvo in geodezijo, Ljubljana, 2011 (in Slovenian).
- Eligehausen, R., Popov, E. G., Bertera, V. V., Local bond stress-slip relationships of deformed bars under generalized excitations, R.No.UCB/EERC-83/23,EERC, Berkeley, 1988.
- Tayeh, A. B., El Dada, Z. M., Shidada, S., Yusuf, M. O., Pull-out behavior of post installed rebar connections using chemical adhesives and cement based binders, Journal of King Saud University – Engineering Sciences, 31, 332-339, 2019.
Figure 1.
Steel fibers used in the study.
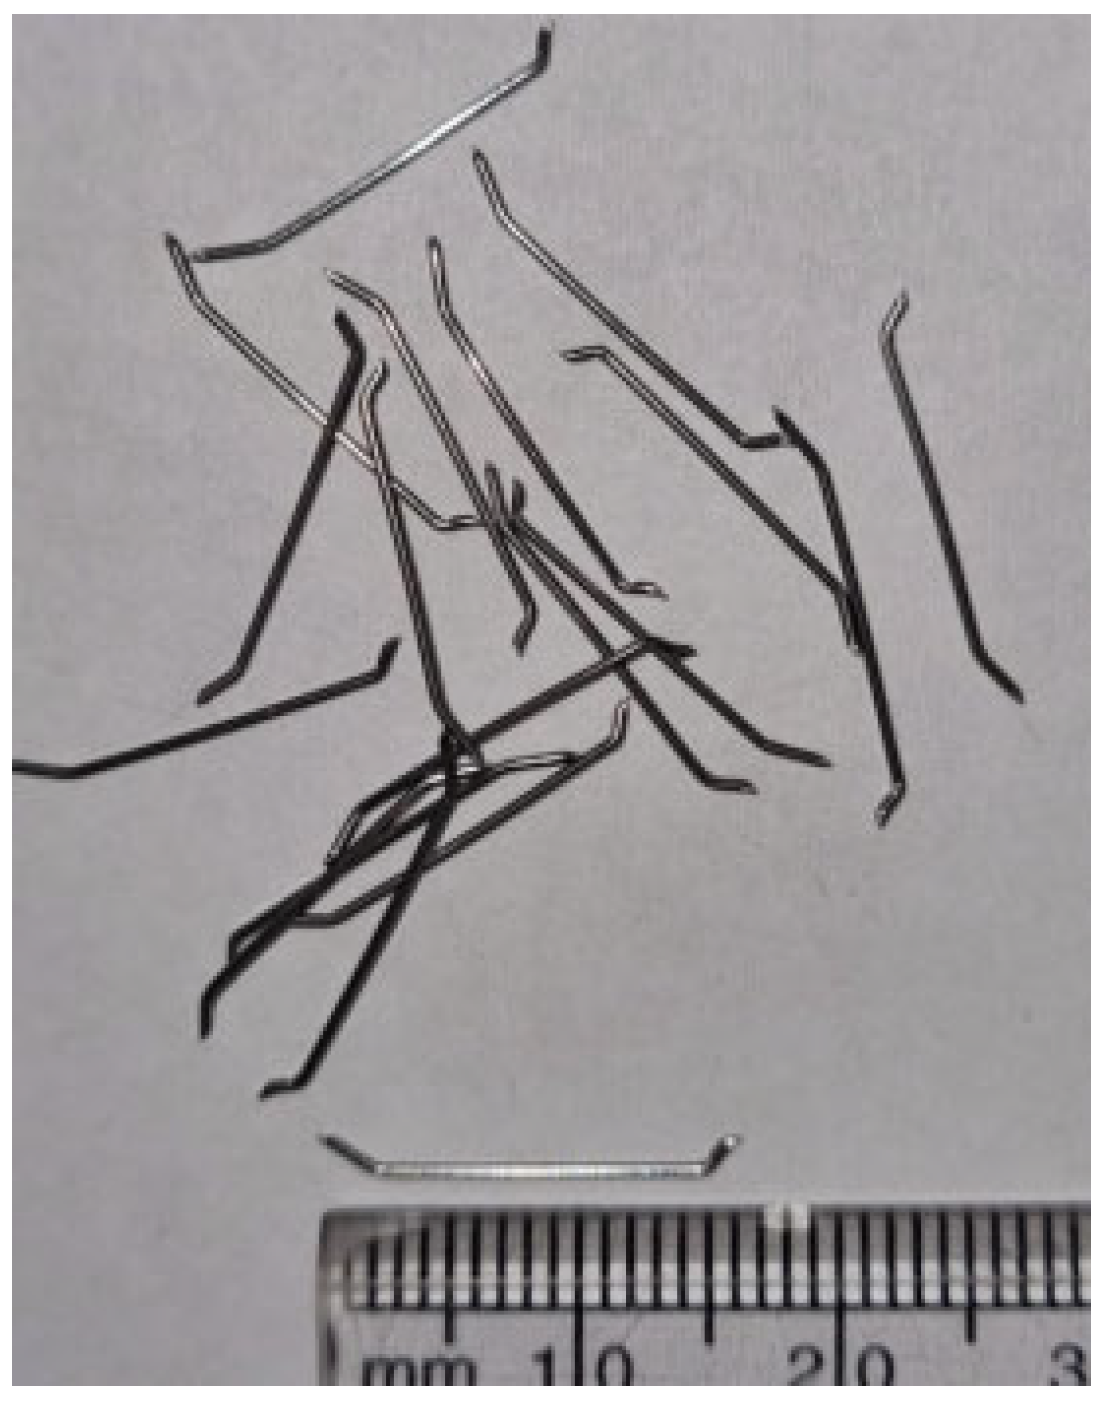
Figure 2.
Special molds with integrated openings for bar placement.
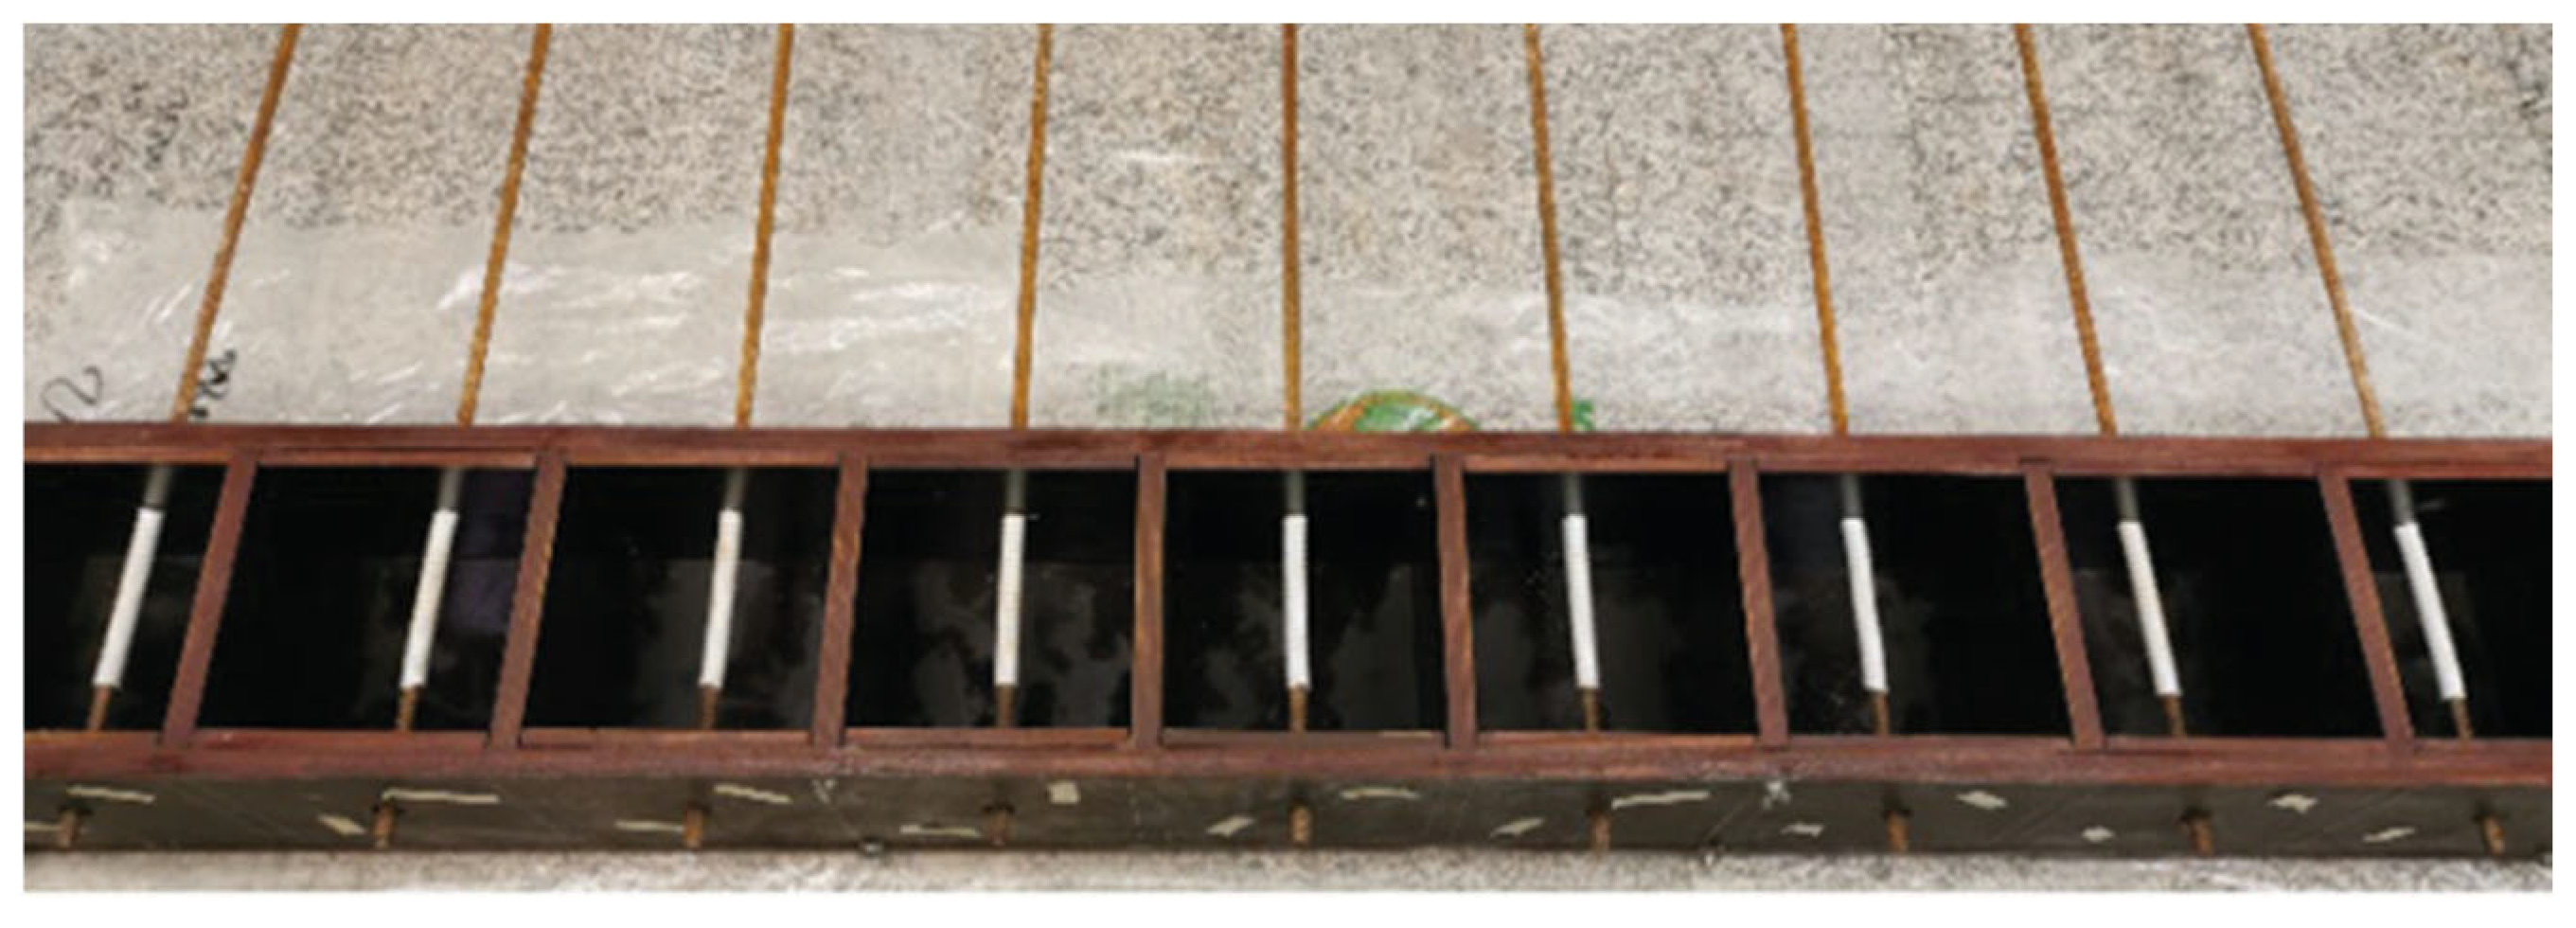
Figure 3.
Performance of tensile test of reinforcement bar according to EN 6892-1:2020 standard [15].
Figure 3.
Performance of tensile test of reinforcement bar according to EN 6892-1:2020 standard [15].
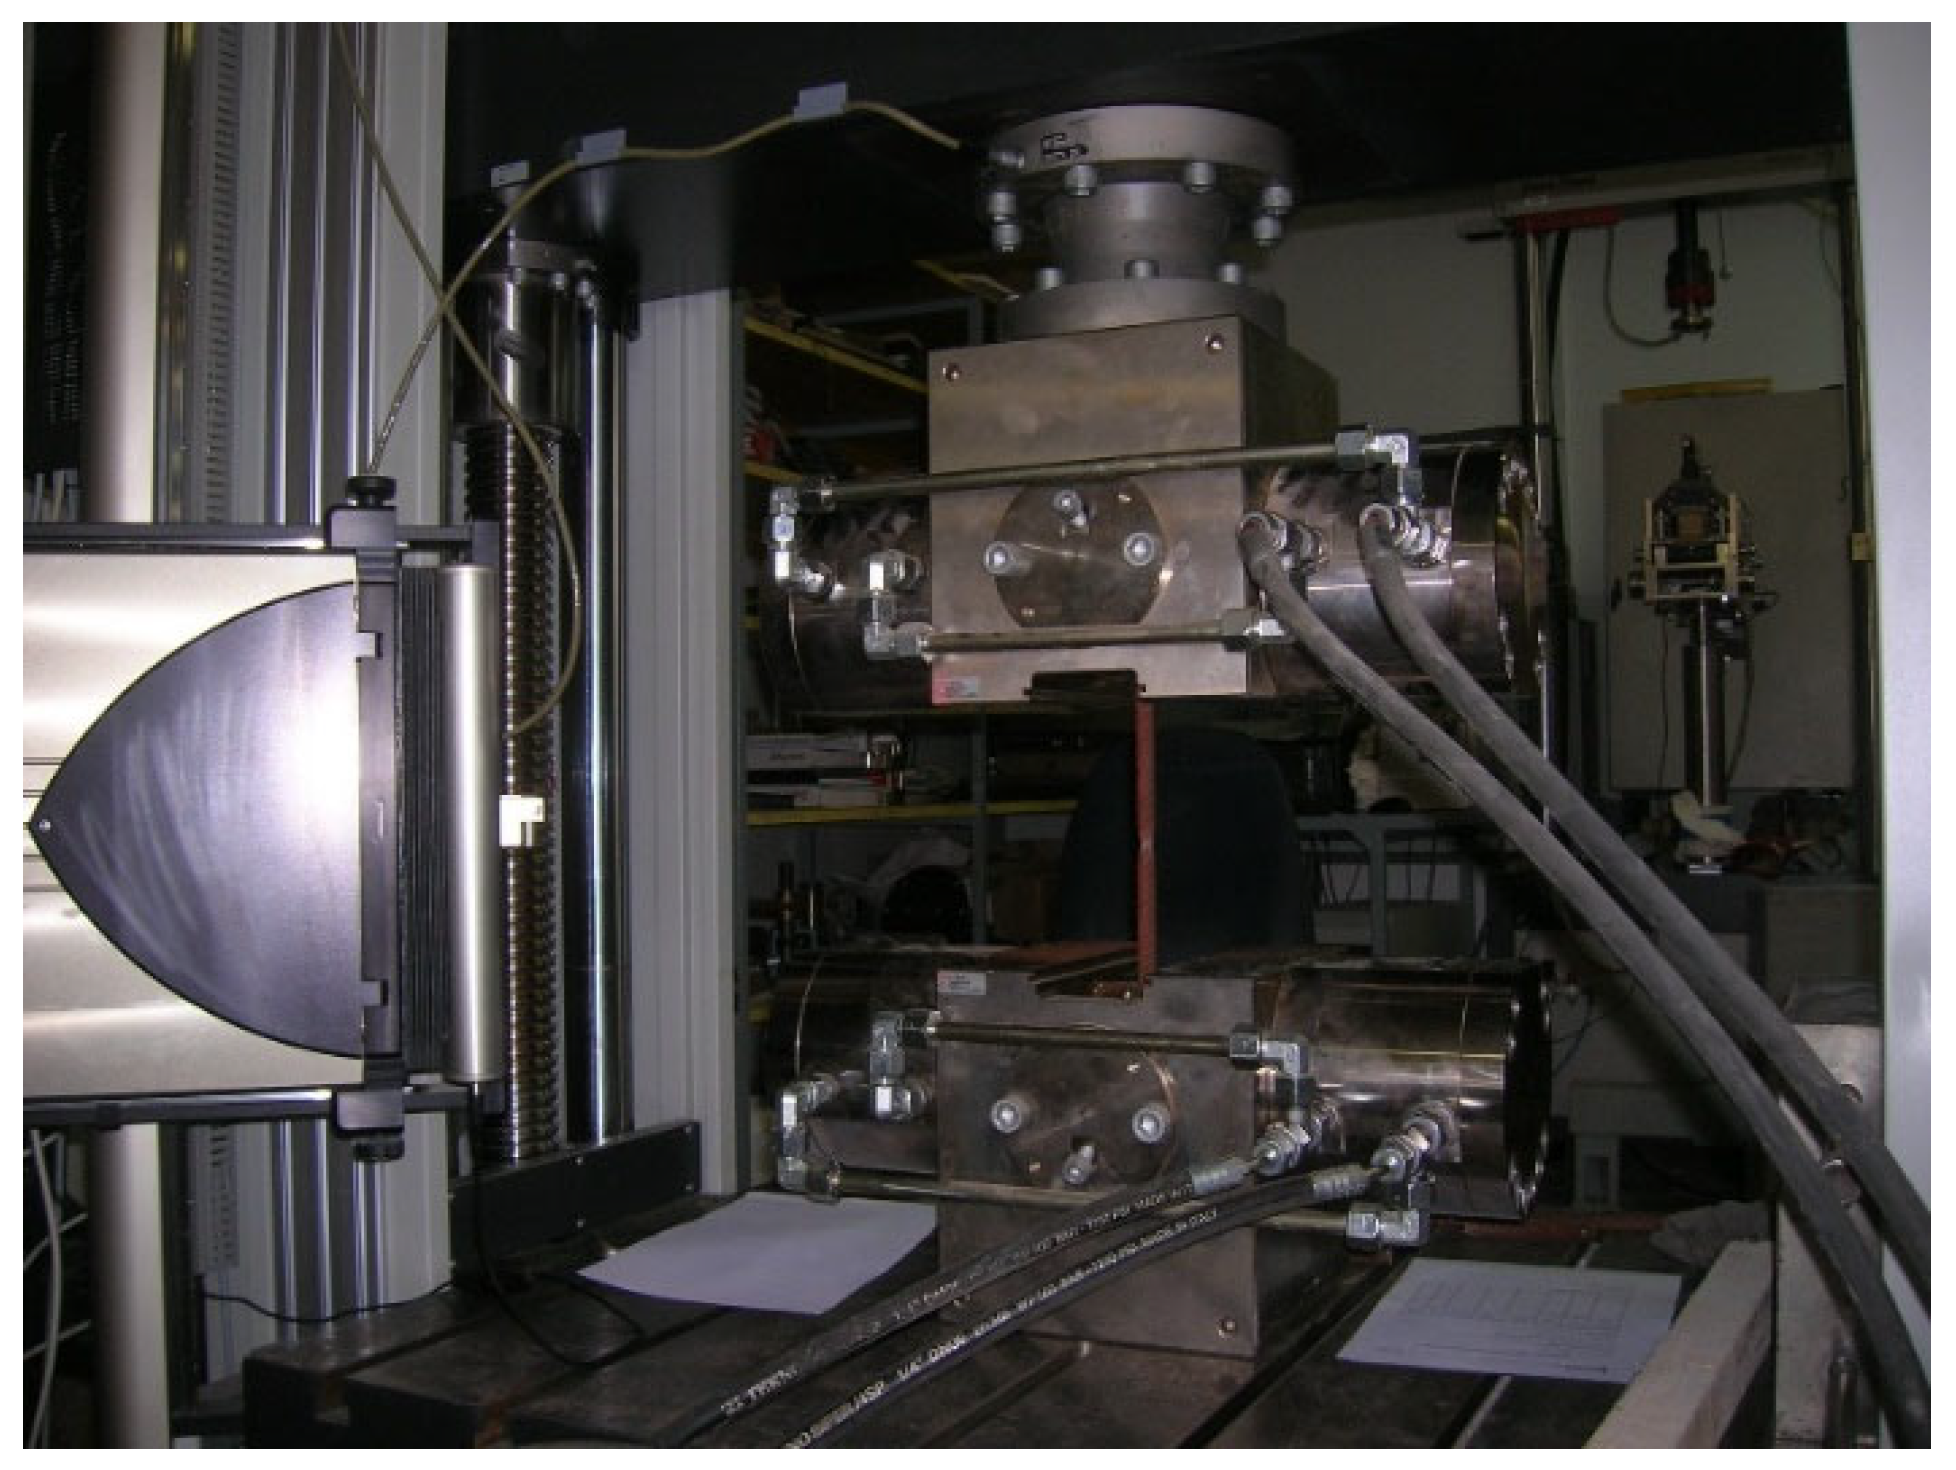
Figure 4.
The procedure for determining fR on a ribbed reinforcement bar.
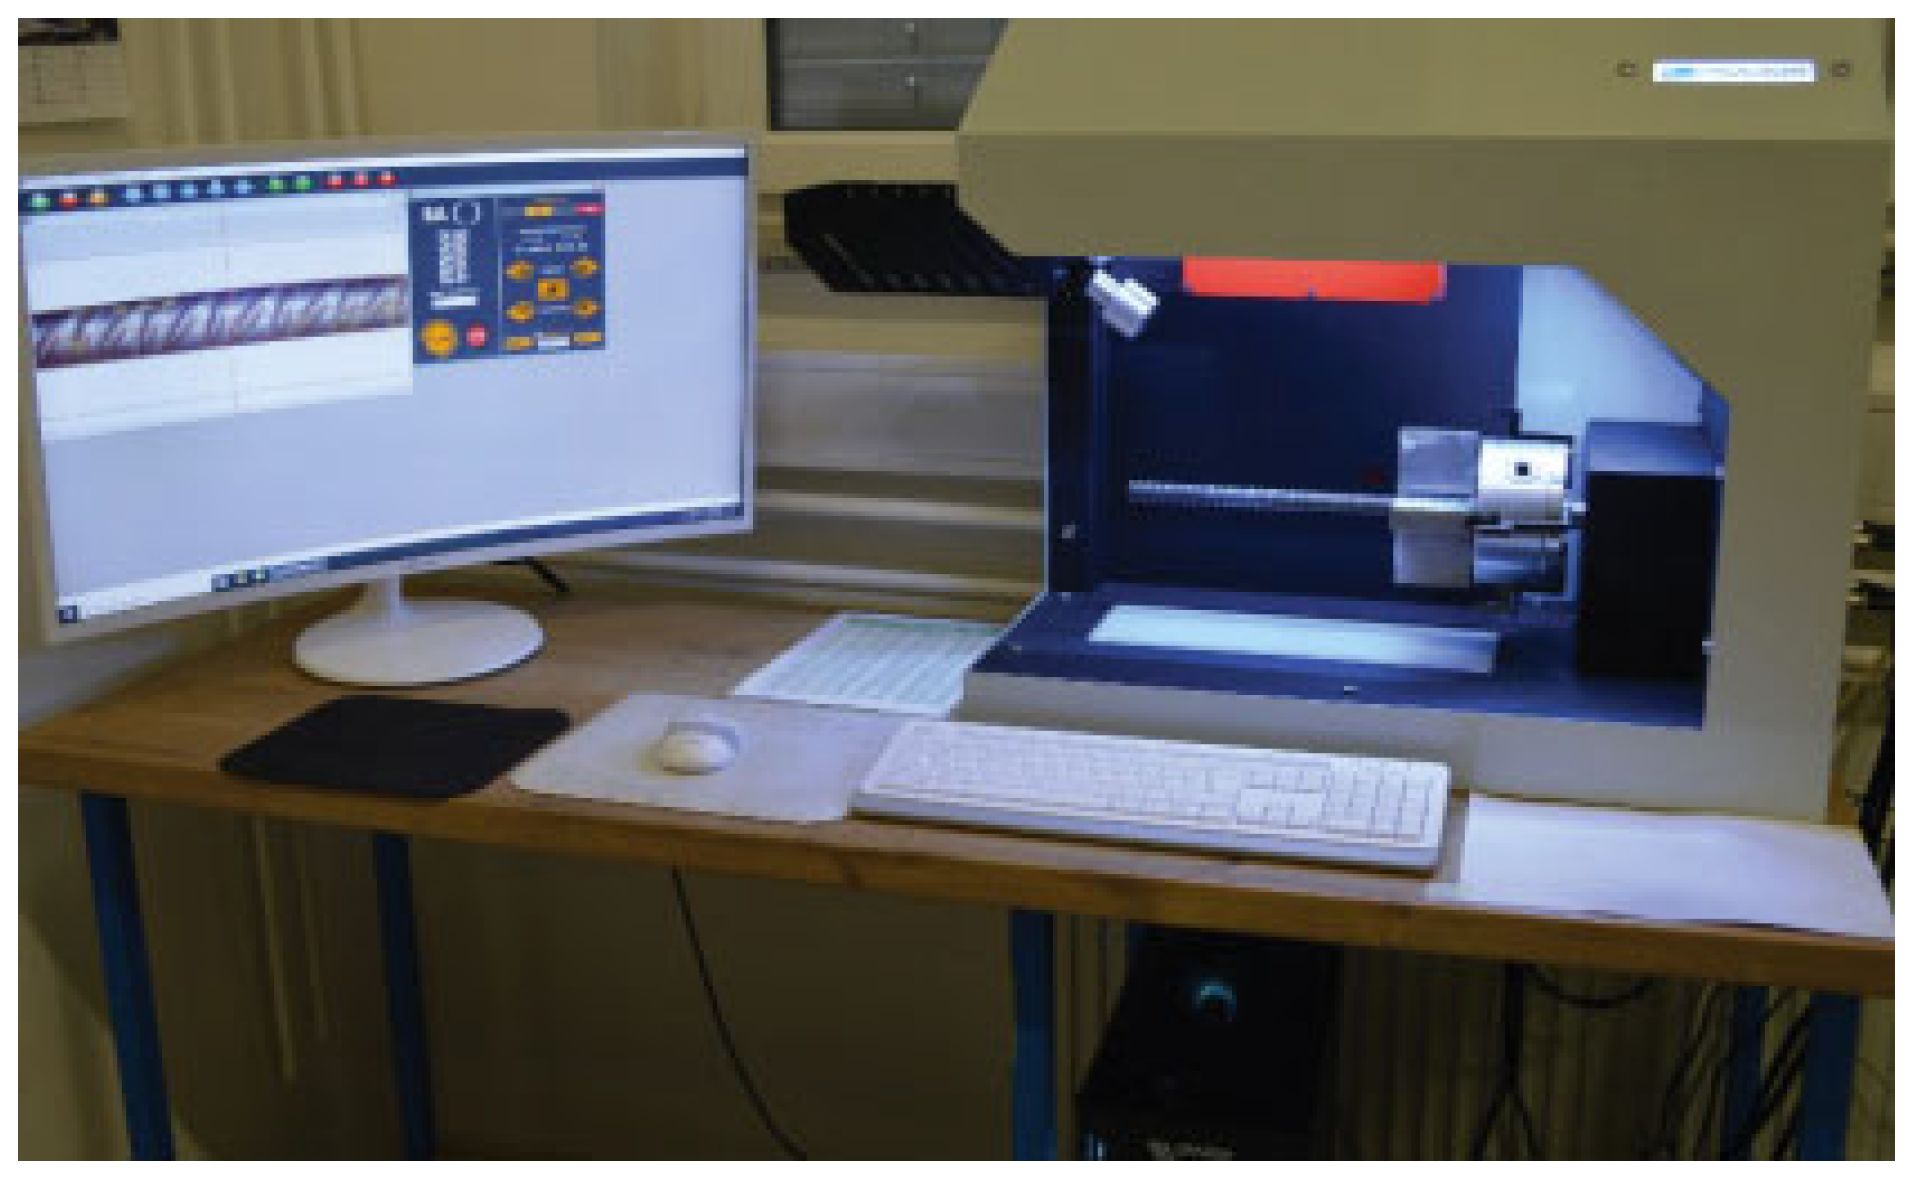
Figure 5.
a) Testing device and determination of pull-out force Fpull; b) Location of reference points used to determine slip between concrete sample and reinforcement bar during pull out test.
Figure 5.
a) Testing device and determination of pull-out force Fpull; b) Location of reference points used to determine slip between concrete sample and reinforcement bar during pull out test.
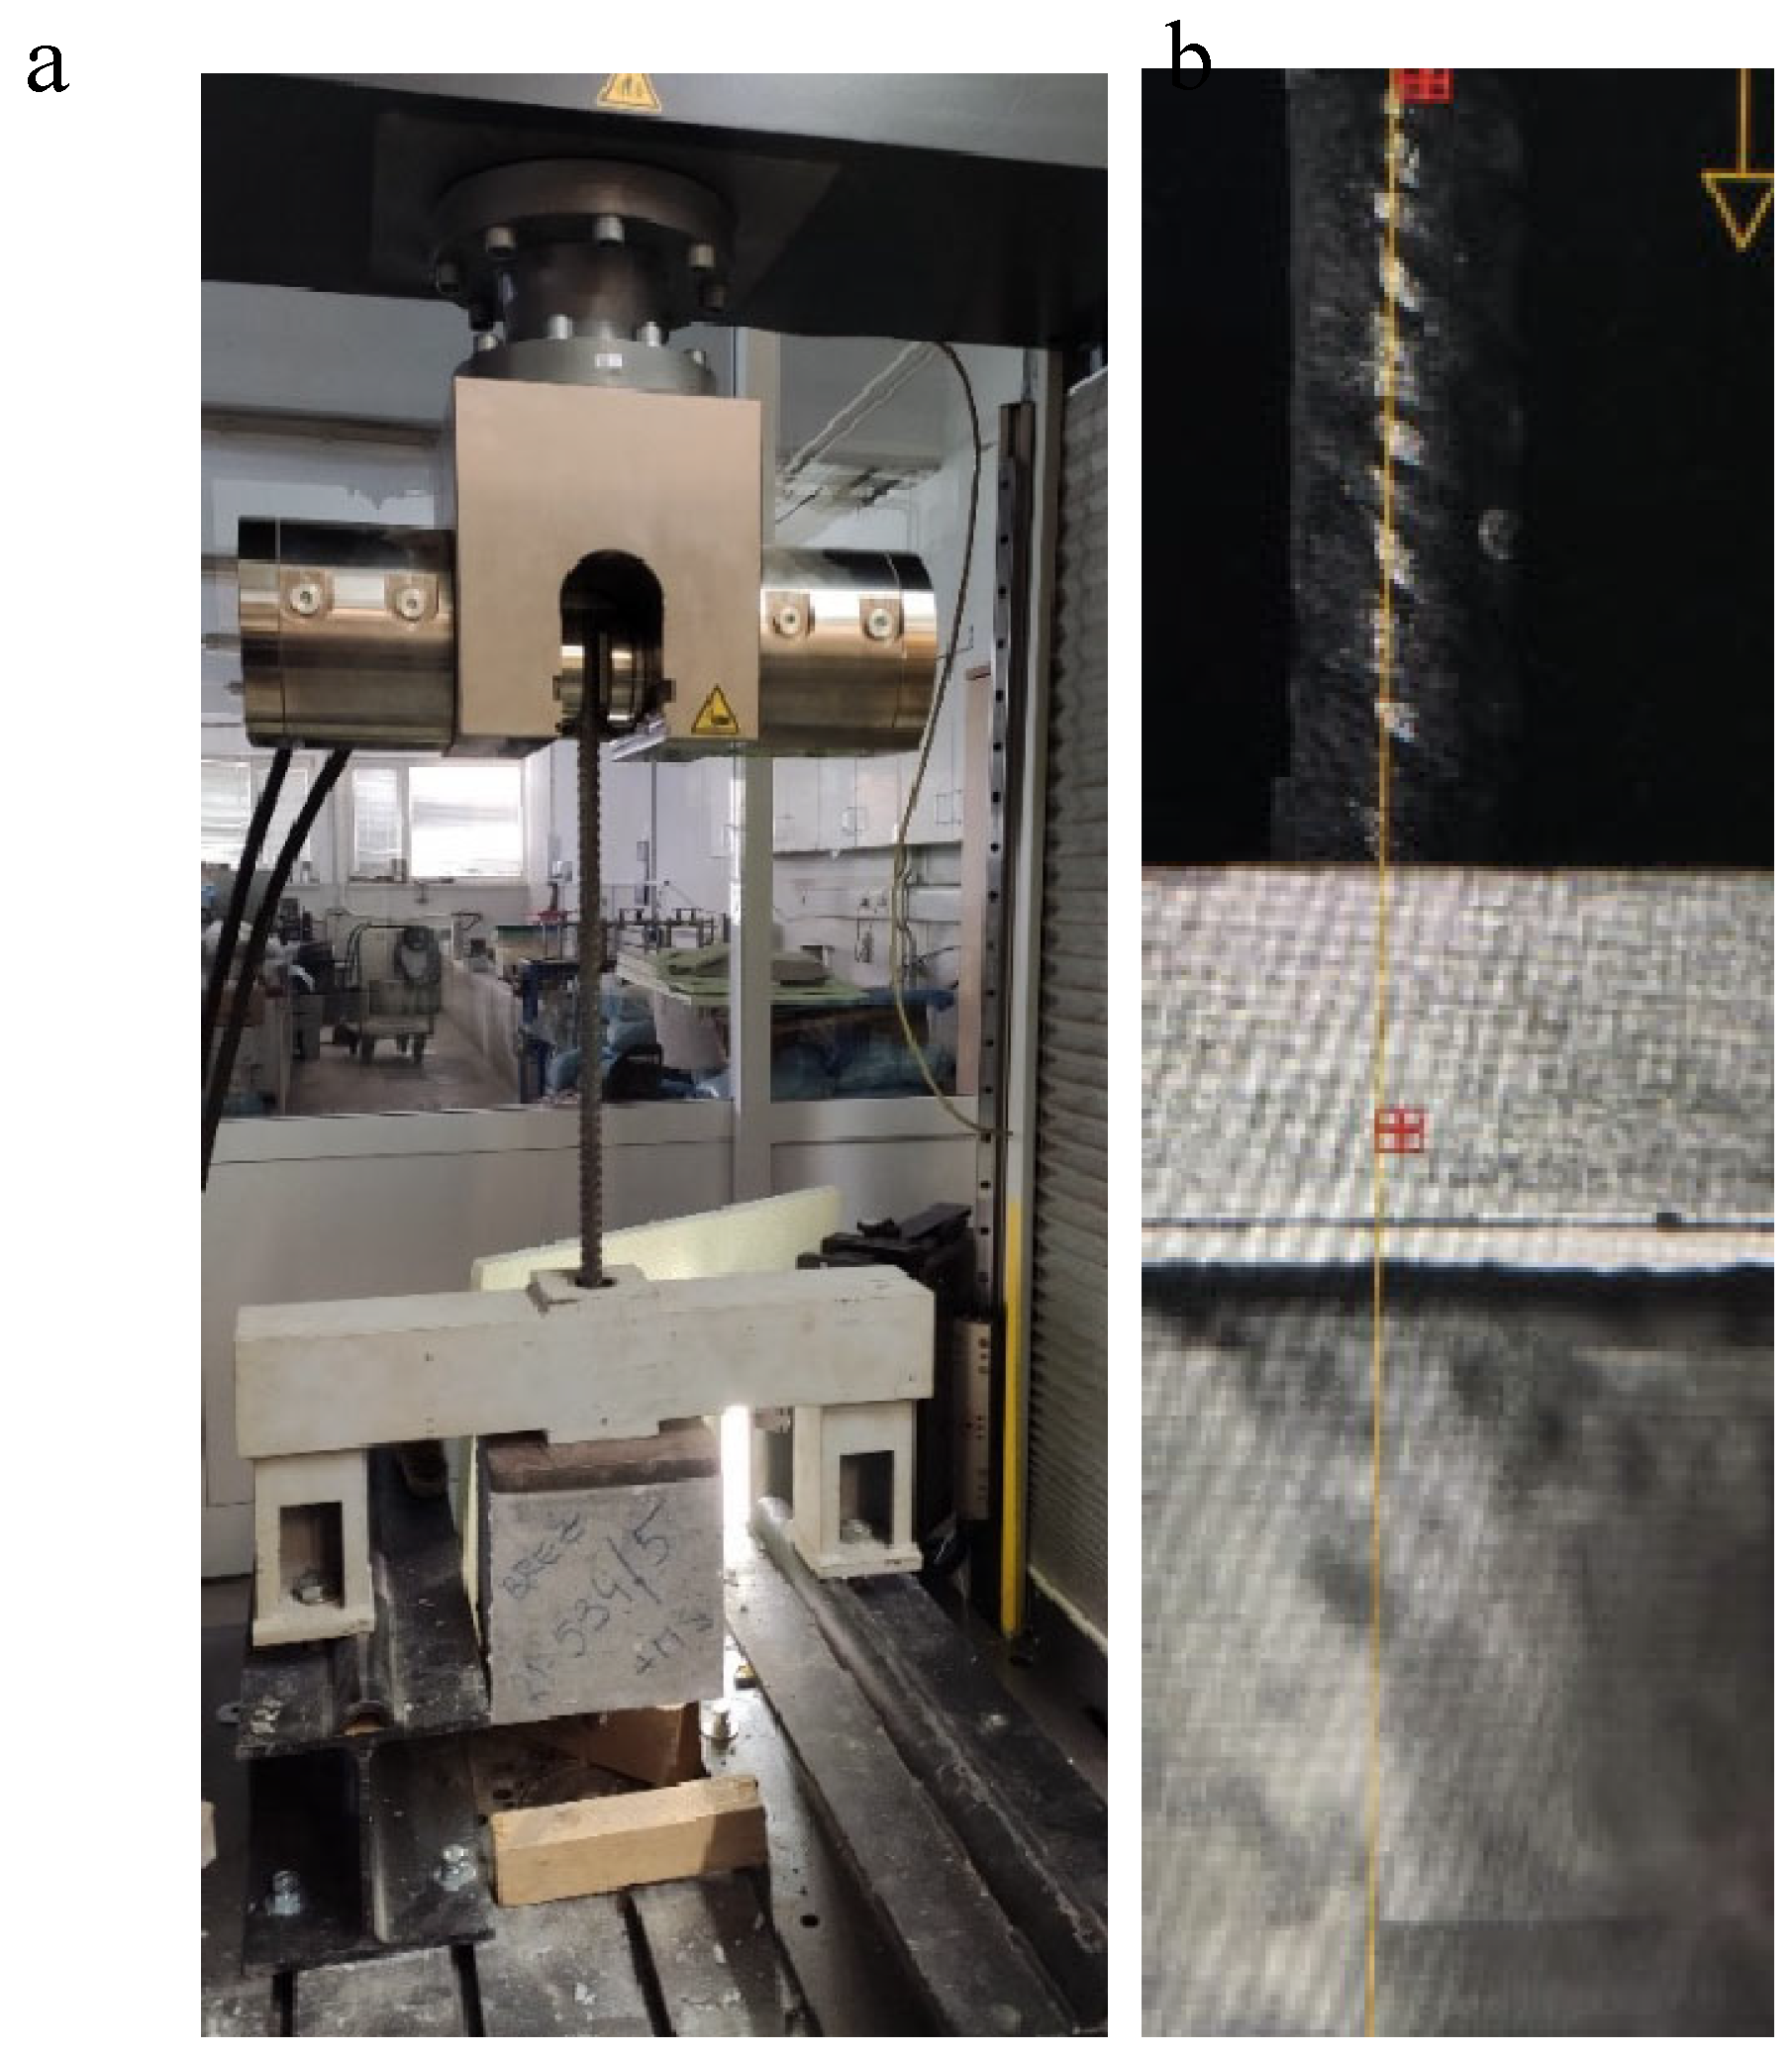
Figure 6.
General presentation of d – Fpull diagram.
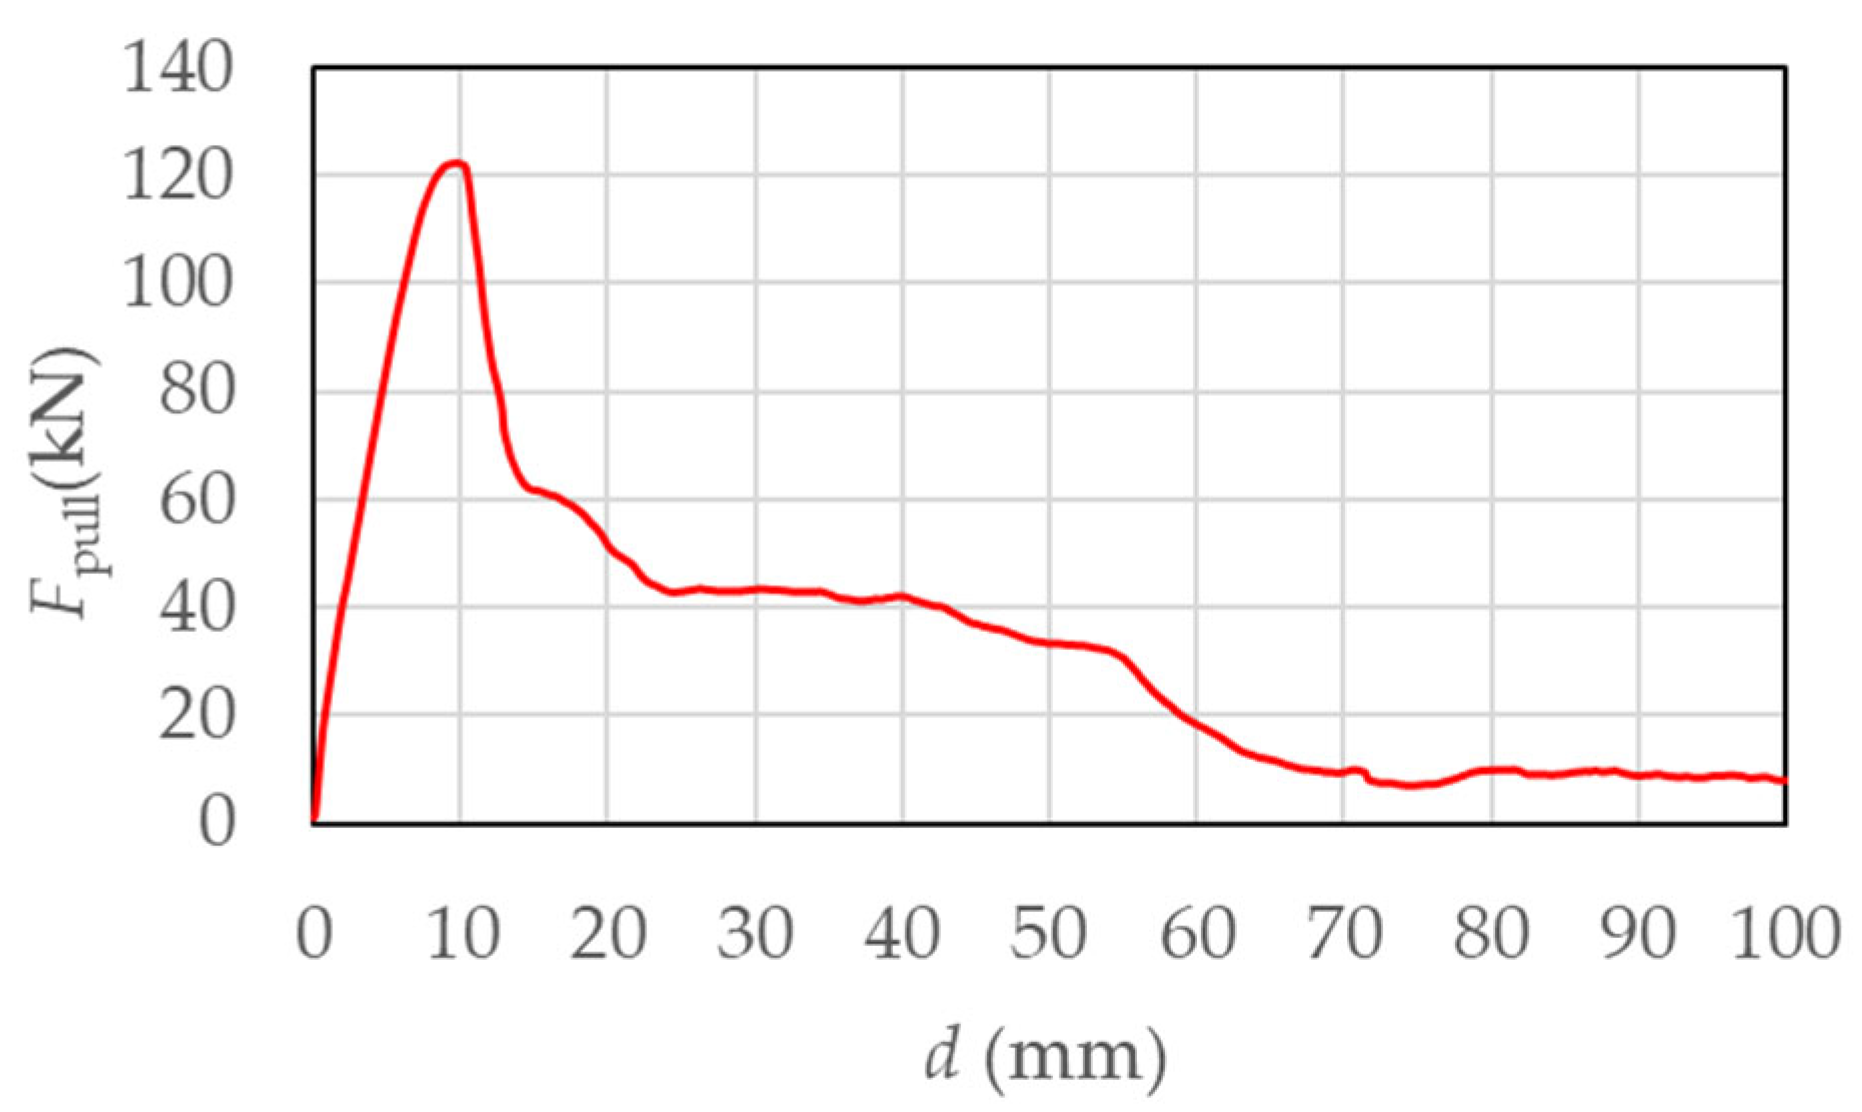
Figure 7.
Influence of different parameters on Fmax values.
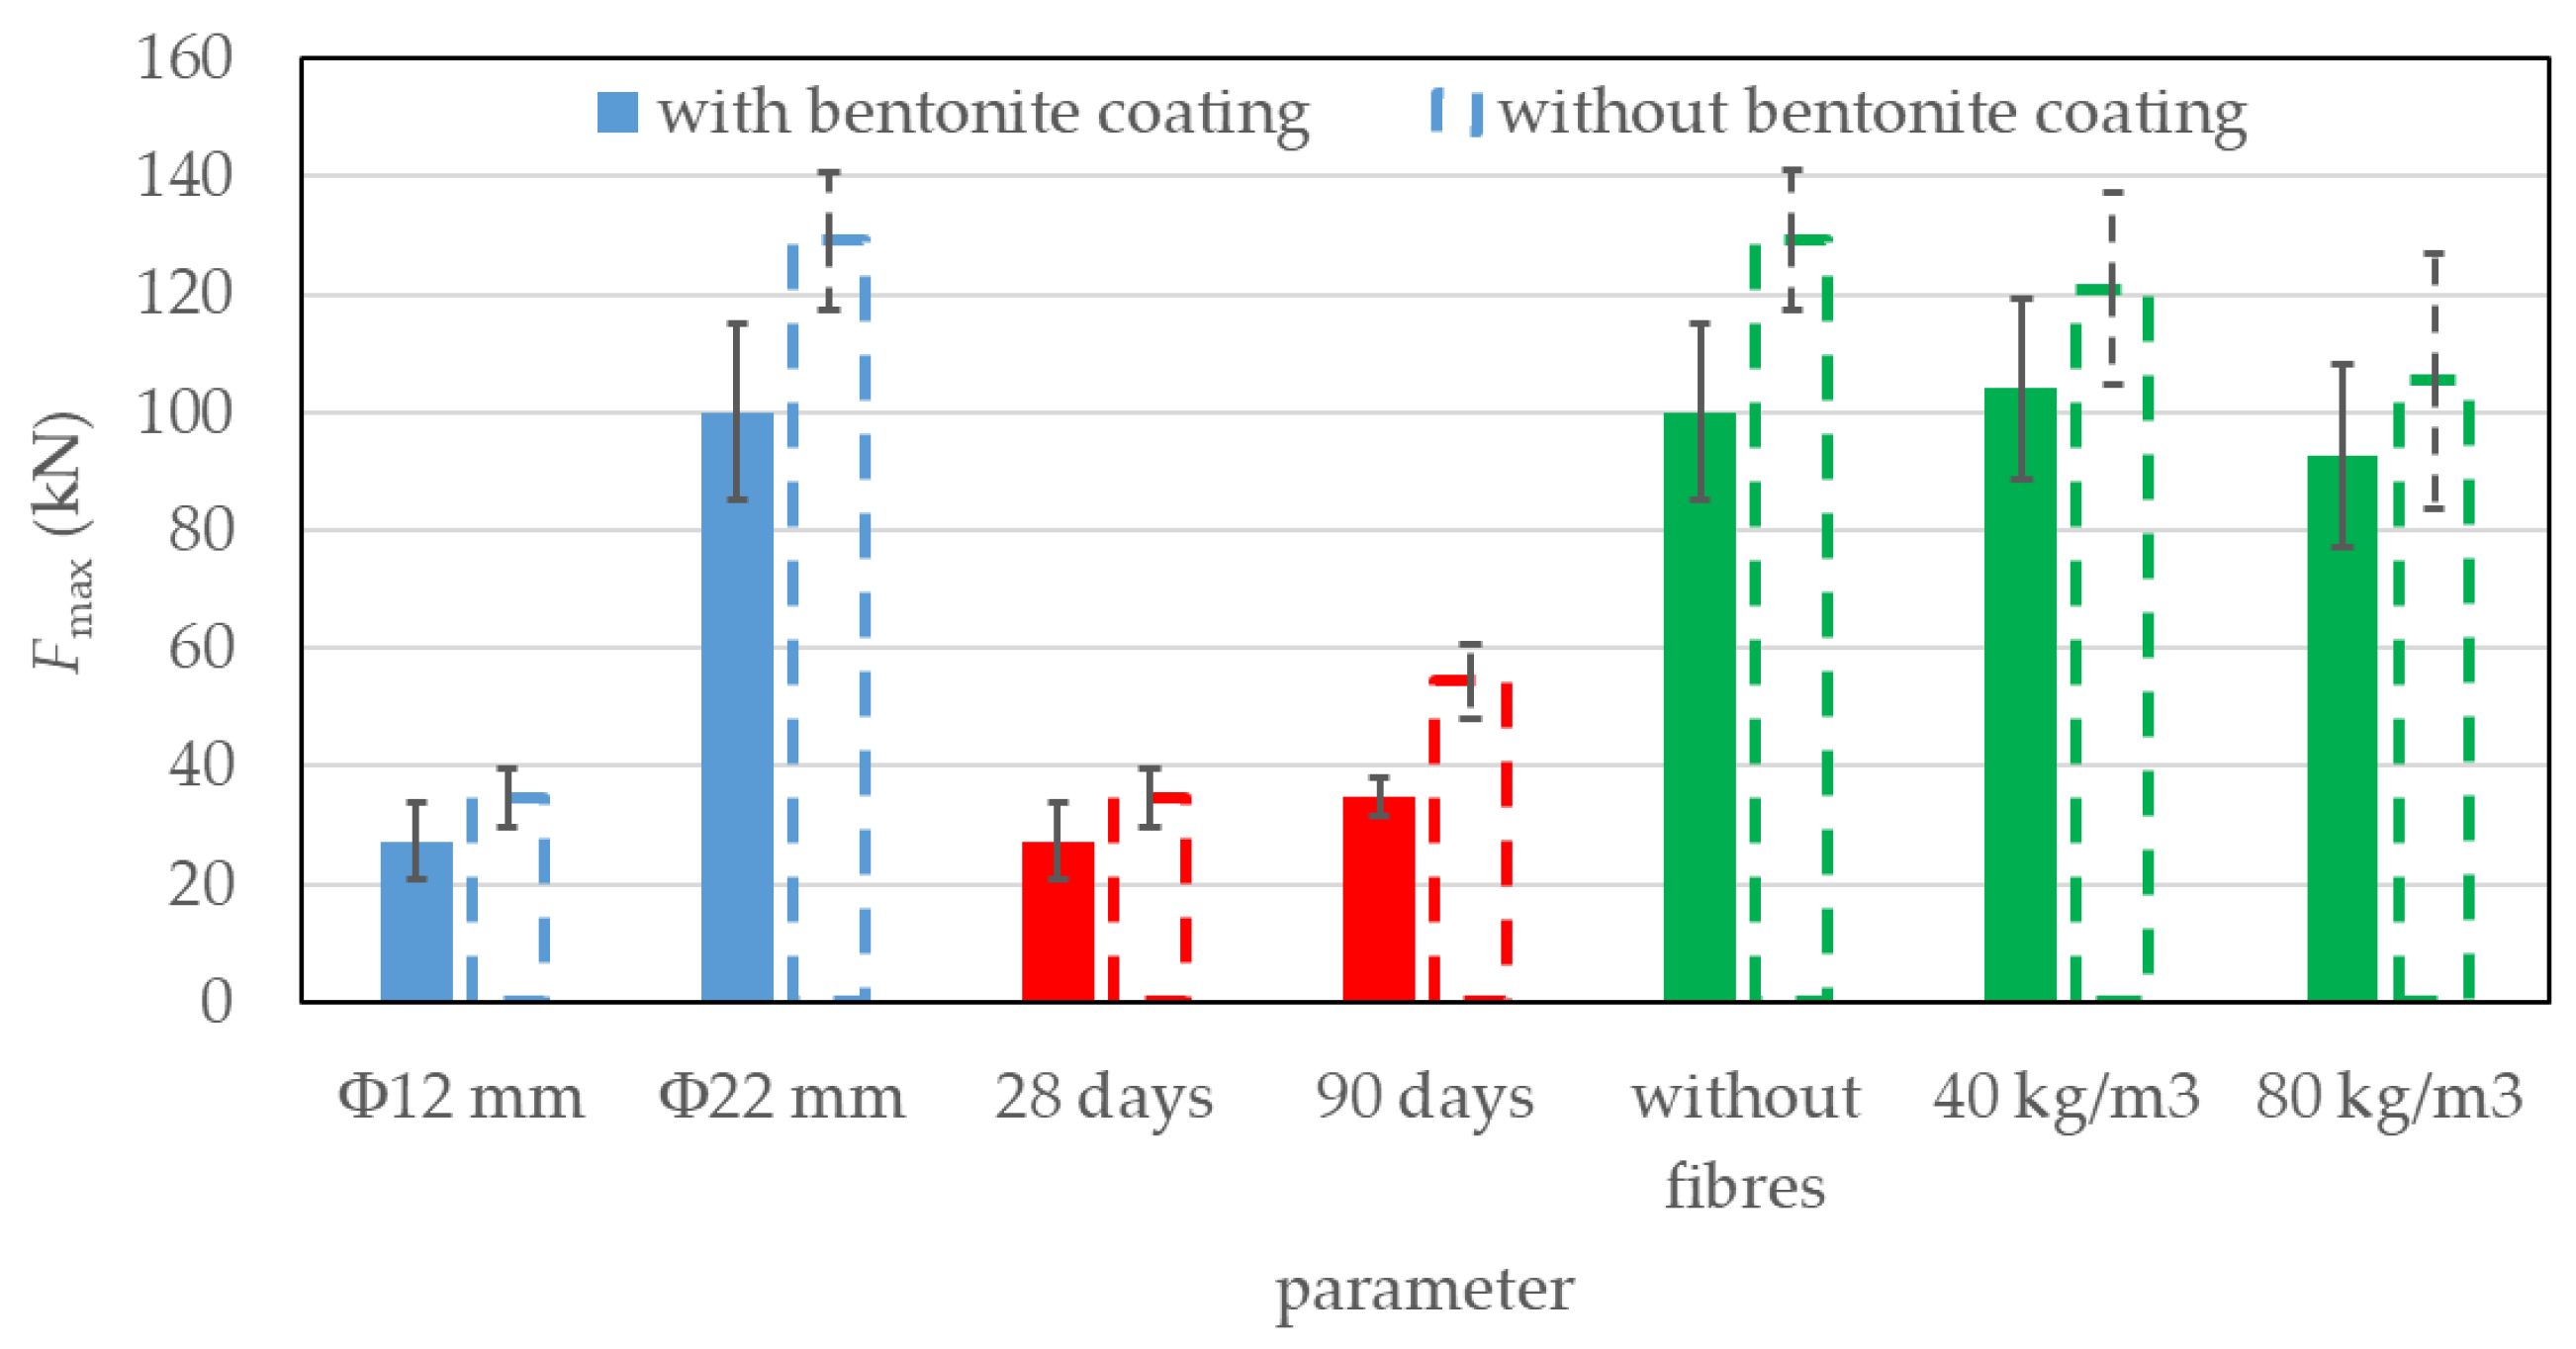
Figure 8.
Influence of different parameters on τmax values.
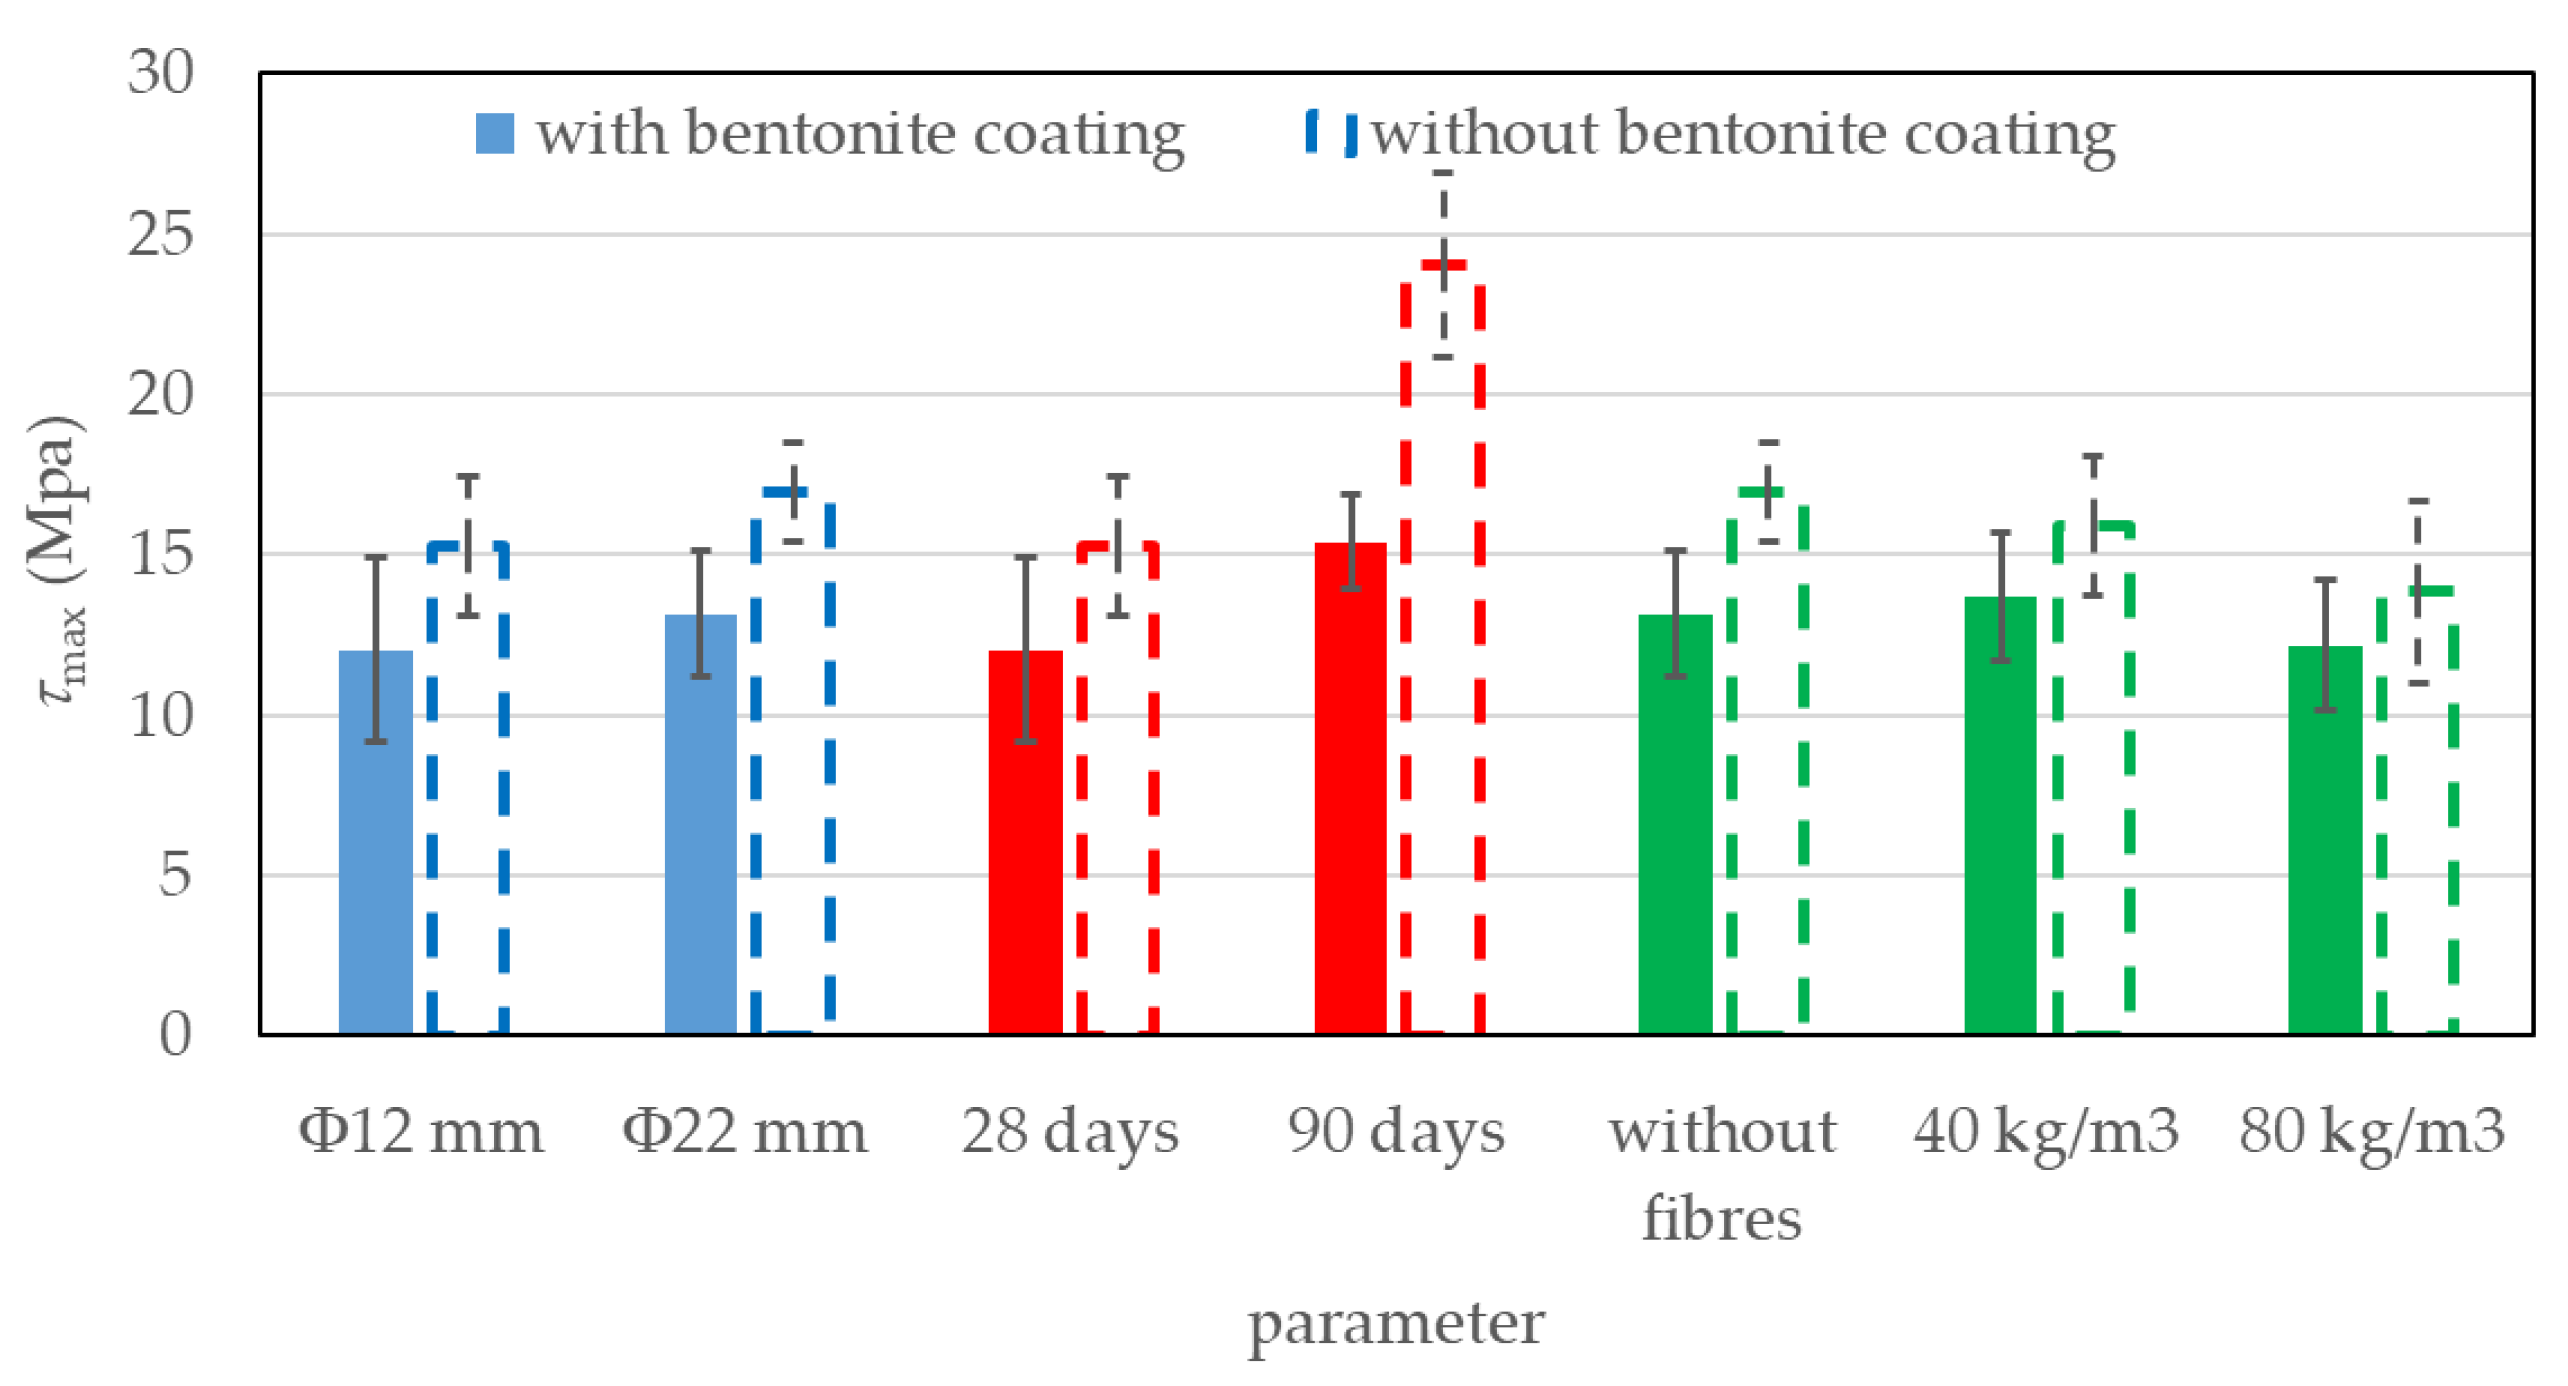
Figure 9.
Statistical analysis of influence of bentonite cover on Fmax and Ƭmax values.
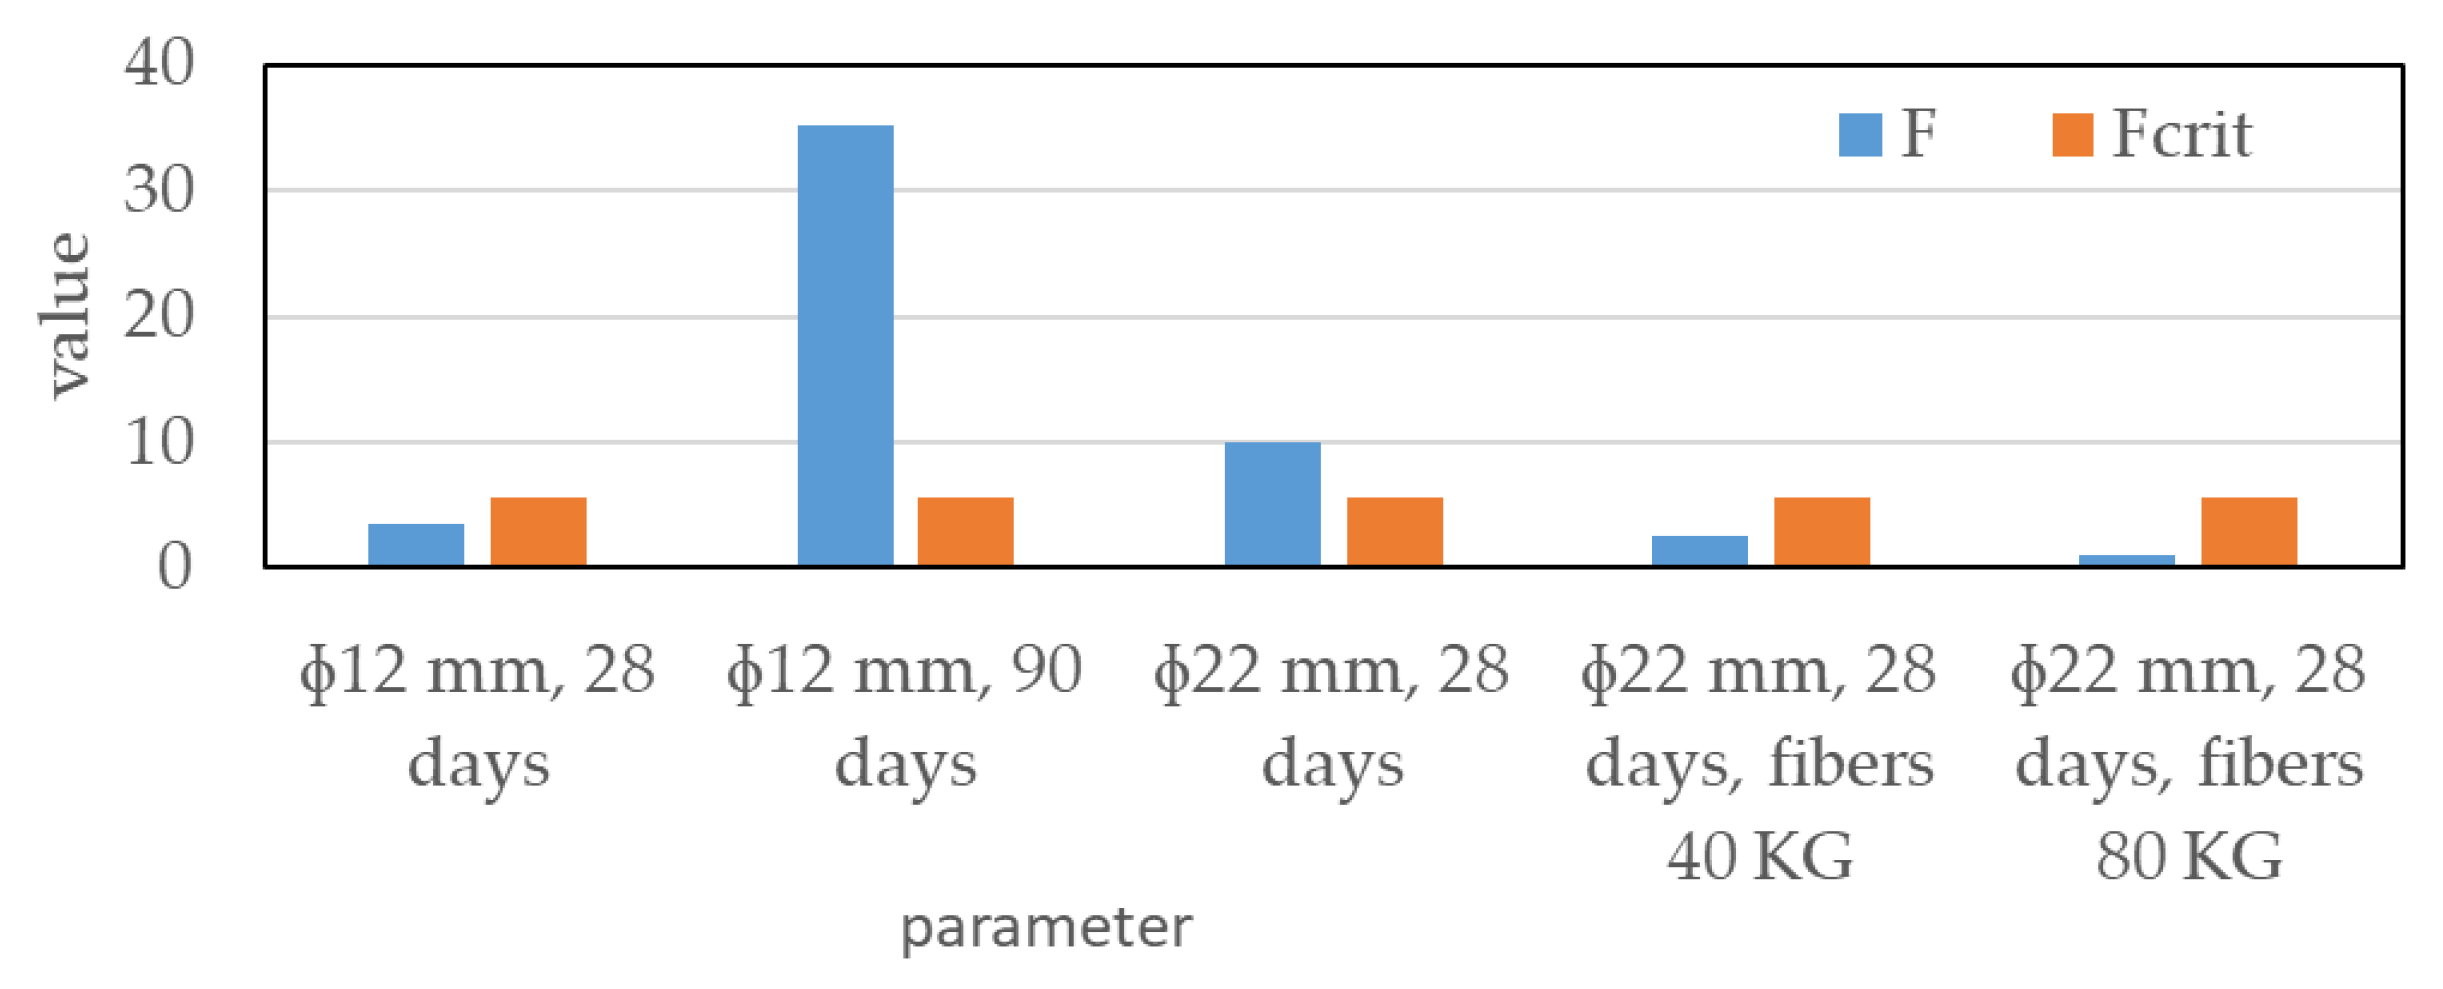
Figure 10.
Statistical analysis of influence of different parameters on Fmax values: a) without bentonite coating, b) with bentonite coating
Figure 10.
Statistical analysis of influence of different parameters on Fmax values: a) without bentonite coating, b) with bentonite coating
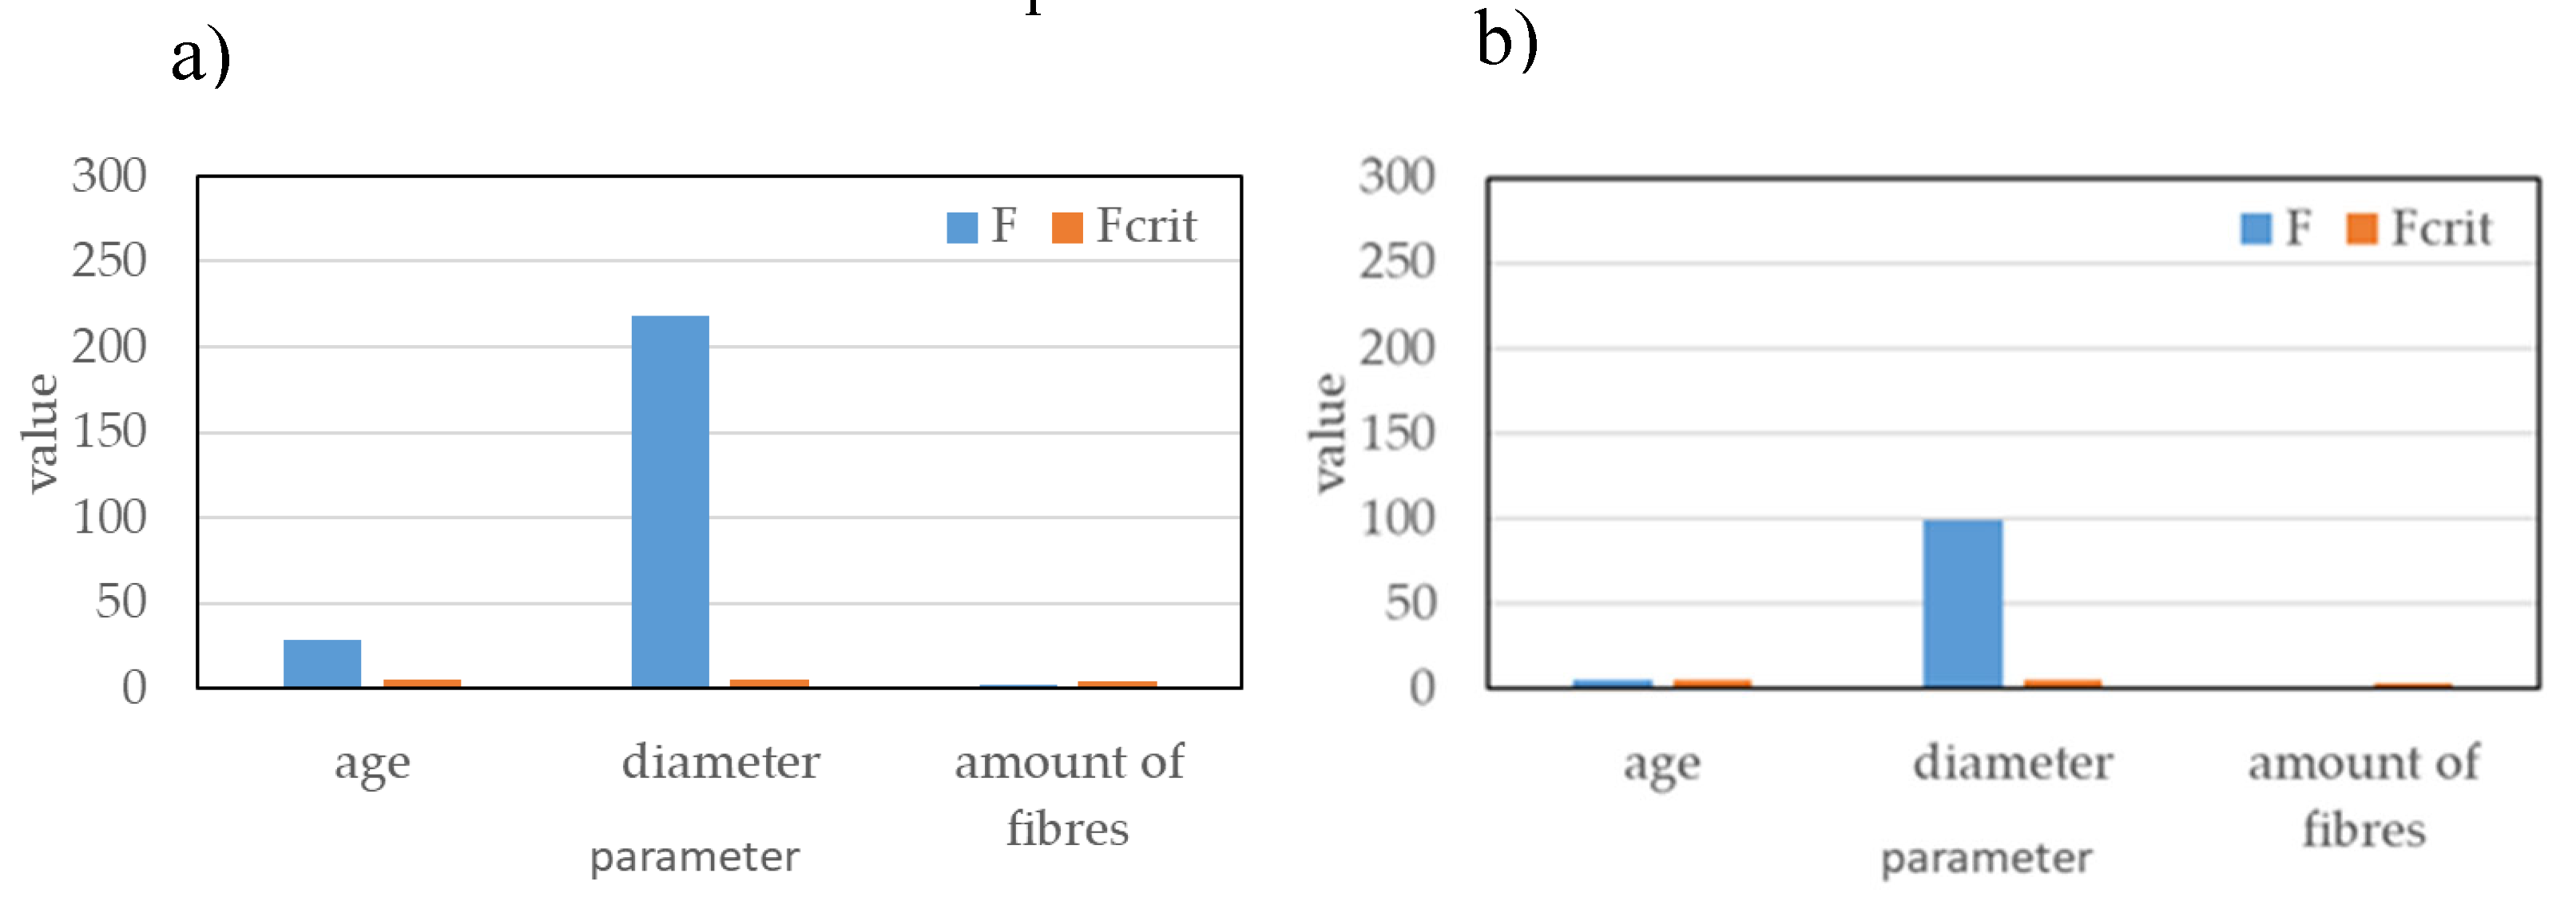
Figure 11.
Statistical analysis of influence of different parameters on Ƭmax values: a) without bentonite coating, b) with bentonite coating.
Figure 11.
Statistical analysis of influence of different parameters on Ƭmax values: a) without bentonite coating, b) with bentonite coating.
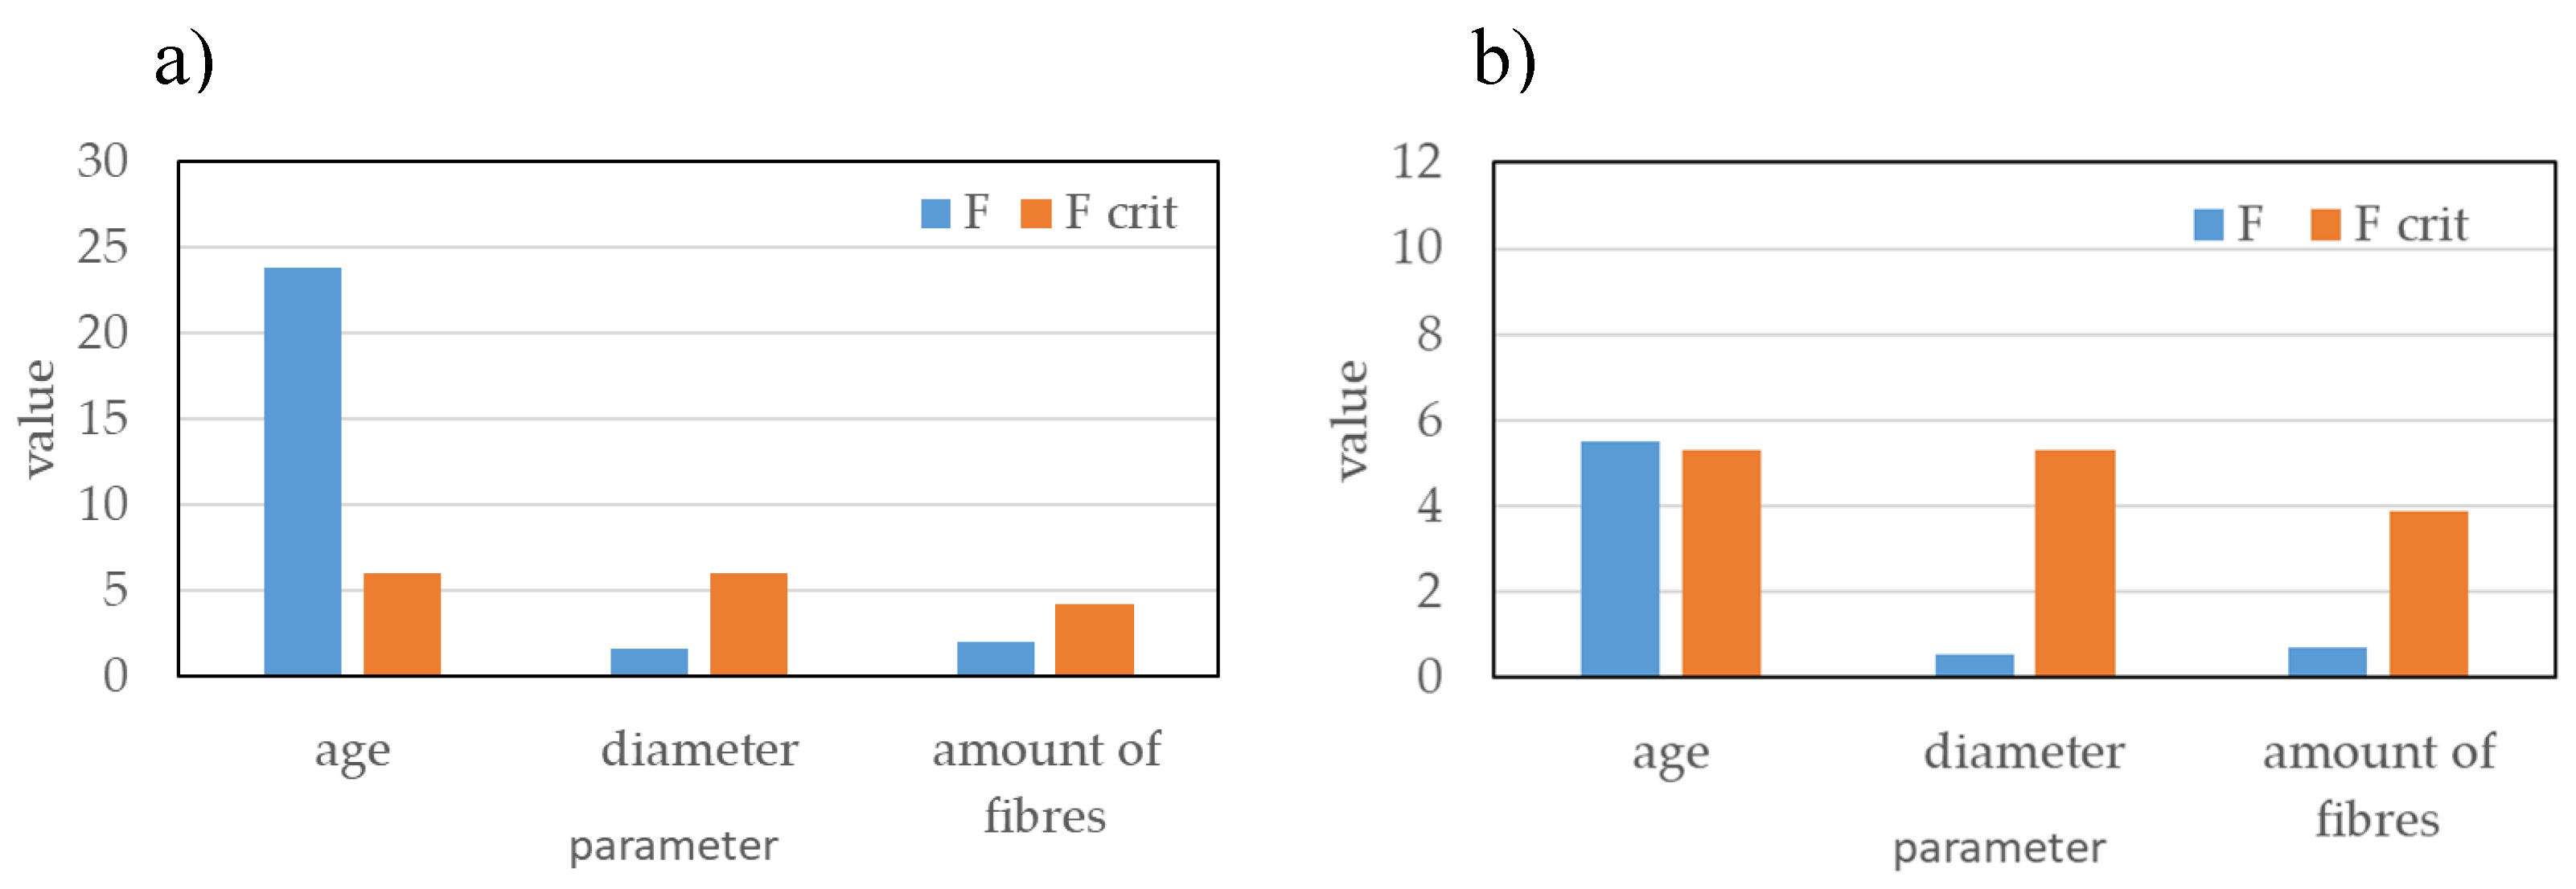

Table 1.
Results of fresh concrete experiments.
| Property | Label | Result | Standard |
| Concrete temperature | Tb | 25,5°C | EN 12350-1:2019 [7] |
| Consistency | 600/620 mm | EN 12350-8:2019 [8] | |
| Air content | Ac | 1,4 % v/v | EN 12350-7:2019 [9] |
| Density | r | 2368 kg/m3 | EN 12350-6:2019 [10] |
| Water-to-binder ratio | (v/v)eff | 0,417 | SIST 1026:2016, NC [11] |
Table 2.
Results of hardened concrete experiments after 28 and 90 days.
| Property | label | 28 days | 90 days | Standard |
| Compressive strength | fcm | 68,4 MPa | 79,3 Mpa | EN 12390-3:2019 [12] |
| Elastic modulus | E | 42,6 Gpa | 42,5 Gpa | DIN 1048 [13] |
| Water permeability | e | 9,7 mm | 8,0 mm | EN 12390-8:2019 [14] |
Table 3.
Basic characteristics of reinforcement bars.
| Φ (mm) | Rp0,2 (Mpa) | Rm (Mpa) | Agt (%) | fR |
| 12 | 596,5 | 716,1 | 9,04 | 0,067 |
| 22 | 566,0 | 699,5 | 10,12 | 0,088 |
Disclaimer/Publisher’s Note: The statements, opinions and data contained in all publications are solely those of the individual author(s) and contributor(s) and not of MDPI and/or the editor(s). MDPI and/or the editor(s) disclaim responsibility for any injury to people or property resulting from any ideas, methods, instructions or products referred to in the content. |
© 2025 by the authors. Licensee MDPI, Basel, Switzerland. This article is an open access article distributed under the terms and conditions of the Creative Commons Attribution (CC BY) license (http://creativecommons.org/licenses/by/4.0/).
Copyright: This open access article is published under a Creative Commons CC BY 4.0 license, which permit the free download, distribution, and reuse, provided that the author and preprint are cited in any reuse.


