Submitted:
18 February 2025
Posted:
18 February 2025
You are already at the latest version
Abstract
The substitution of conventional steel reinforcement with fiber-reinforced polymer (FRP) bars is a widely adopted strategy for enhancing the durability of concrete structures in chloride environments. However, due to the distinct material properties of FRP and steel bars, conventional degradation theory and formulas of bonding strength cannot be directly applied. This study investigates the bond behavior between Glass fiber-reinforced polymer (GFRP) bars and concrete under long-term chloride dry-wet cycling exposure. Pull-out tests were conducted on various specimens subjected to exposure durations of 0, 3, 6, 9, and 12 months. The experimental results demonstrated that factors such as surface textures and effective bond length significantly influenced bond behaviors and the sustained deterioration was observed with increased exposure duration. To predict the GFRP-concrete bond performance after chloride exposure, a novel bond strength model for GFRP bars embedded in concrete, considering the mechanical interlocking by ribs, was proposed and validated by the test results. Additionally, a sensitivity analysis was conducted on the main parameters in the model. Finally, the long-term GFRP-concrete bond performance deterioration was estimated using the proposed model. These findings are expected to provide valuable insights into the long-term bond performance and service life prediction of GFRP-concrete members in chloride environments.
Keywords:
GFRP bars
; bond-slip behavior
; chlorine dry-wet exposure
; pull-out tests
; analytical model
; long-term prediction
1. Introduction
The corrosion of steel rebar due to chloride ingress in concrete structures is a significant global issue, resulting in considerable economic and safety concerns [1,2]. To address this challenge, fiber-reinforced polymer (FRP) bars, particularly glass fiber-reinforced polymer (GFRP) bars, have been proposed as a viable alternative to conventional steel rebars [3,4]. GFRP bars offer numerous advantages, including high corrosion resistance, reduced weight, and superior tensile strength, making them particularly suitable for environments where steel rebar is prone to corrosion [5]. However, substituting steel rebars with FRP bars introduces complexities due to the distinct material properties of these two materials [6,7].
In reinforced concrete structures, the bond strength between reinforcement and concrete is a critical factor influencing overall structural performance [8]. Unlike steel rebars, FRP bars exhibit anisotropic behavior, and their bond performance is affected by factors such as surface texture and chemical composition [9]. These differences highlight the need for targeted research on the bond behavior of FRP bars, as existing findings on steel-concrete bond performance cannot be directly extrapolated. A comprehensive understanding of FRP-concrete bond properties is essential for the implementation of FRP bars in structural applications [10].
Previous research on the bond performance of FRP bars in concrete has identified several influential factors, including bar diameter, surface texture, and bond length [11]. However, as summarized in Table 1, most studies have focused on the bond performance of FRP bars under uncorroded conditions or short-term exposure scenarios, with insufficient attention given to the effects of prolonged chloride exposure [12]. This gap in the literature emphasizes the need for further research on the impact of long-term exposure to aggressive conditions, such as chloride-induced wet-dry cycles, on the bond performance of FRP bars. To evaluate the bond performance of FRP-concrete systems, researchers frequently utilize bond-slip curves derived from pull-out tests. As indicated in Table 1, most existing studies continues to employ traditional mathematical models, which are mostly derived from the development of steel-concrete bonding behavior. While these models offer valuable insights, they often fail to accurately predict the behavior of FRP bars with different surface geometries and do not consider the effects of chloride exposure on bond strength. Therefore, the development of a more precise and physically relevant predictive model is necessary.
The primary objective of this study is to evaluate the bond performance between GFRP bars and concrete under chloride dry-wet cycling exposure and to develop an analytical model that could accurately predict this behavior. The research involved a series of pull-out tests conducted over one year using various GFRP-concrete specimens, which were evaluated at five different exposure intervals. The specimens were categorized based on bond length and surface texture to assess their impact on bond performance as chloride exposure increased. An analytical bond-slip prediction model was also developed, incorporating the damage characteristics of both GFRP bars and concrete. This study provides valuable insights into critical factors affecting bond strength, such as surface texture, bond length, and exposure duration, while proposing a new approach to predict bond-slip behavior under long-term exposure conditions.
2. Experimental Setup
2.1. Design of Pull-Out Specimen
The experimental investigation utilized two types of 12 mm diameter GFRP bars: SG bars with a sand-coated surface and RG bars with a threaded ribbed surface. The key geometric parameters of the ribbed bars, including rib spacing, width, and height, are illustrated in Figure 1. Both GFRP bar types were manufactured by Jiangsu Feibo New Material Technology Co., Ltd., with a tensile strength of 874.1 MPa and an elastic modulus () of 36 GPa. The ribs were produced by winding a strand tightly around the smooth GFRP bundles during the manufacturing process, resulting in a helical groove pattern on the bar surface. As listed in Table 2, the conventional C40 concrete used for casting the specimens achieved a 28-day compressive strength of 47.1 MPa.
A series of pull-out test specimens were fabricated to evaluate the bond behavior between GFRP bars and conventional concrete. As shown in Figure 2, GFRP bars were cut to a length of 580 mm and concentrically embedded in concrete cubes measuring 200 mm × 200 mm × 200 mm, following the guidelines of ACI440.3R-12. A 16 mm diameter PVC pipe served as a bond breaker to control the bond length. To prevent GFRP bar rupture during testing, a steel tubes, 200 mm long, was bonded to the loaded end of the bar using epoxy adhesive. During casting, the GFRP bars were oriented perpendicular to the specimen surface to minimize micro-void formation at the bar-concrete interface. The molds were removed 24 hours after casting, and the specimens were cured under ambient conditions for 28 days. The embedded length of the bars in the pull-out specimens was set to five times the bar diameter (5d). To further investigate the effect of embedment length, an additional set of specimens was cast with an embedded length equivalent to seven times the bar diameter (7d). In addition, a certain number of 150mm cubic blocks were also prepared to assess the compressive strength variation during the dry-wet cycling test.
2.2. Chloride Dry-Wet Exposure Program
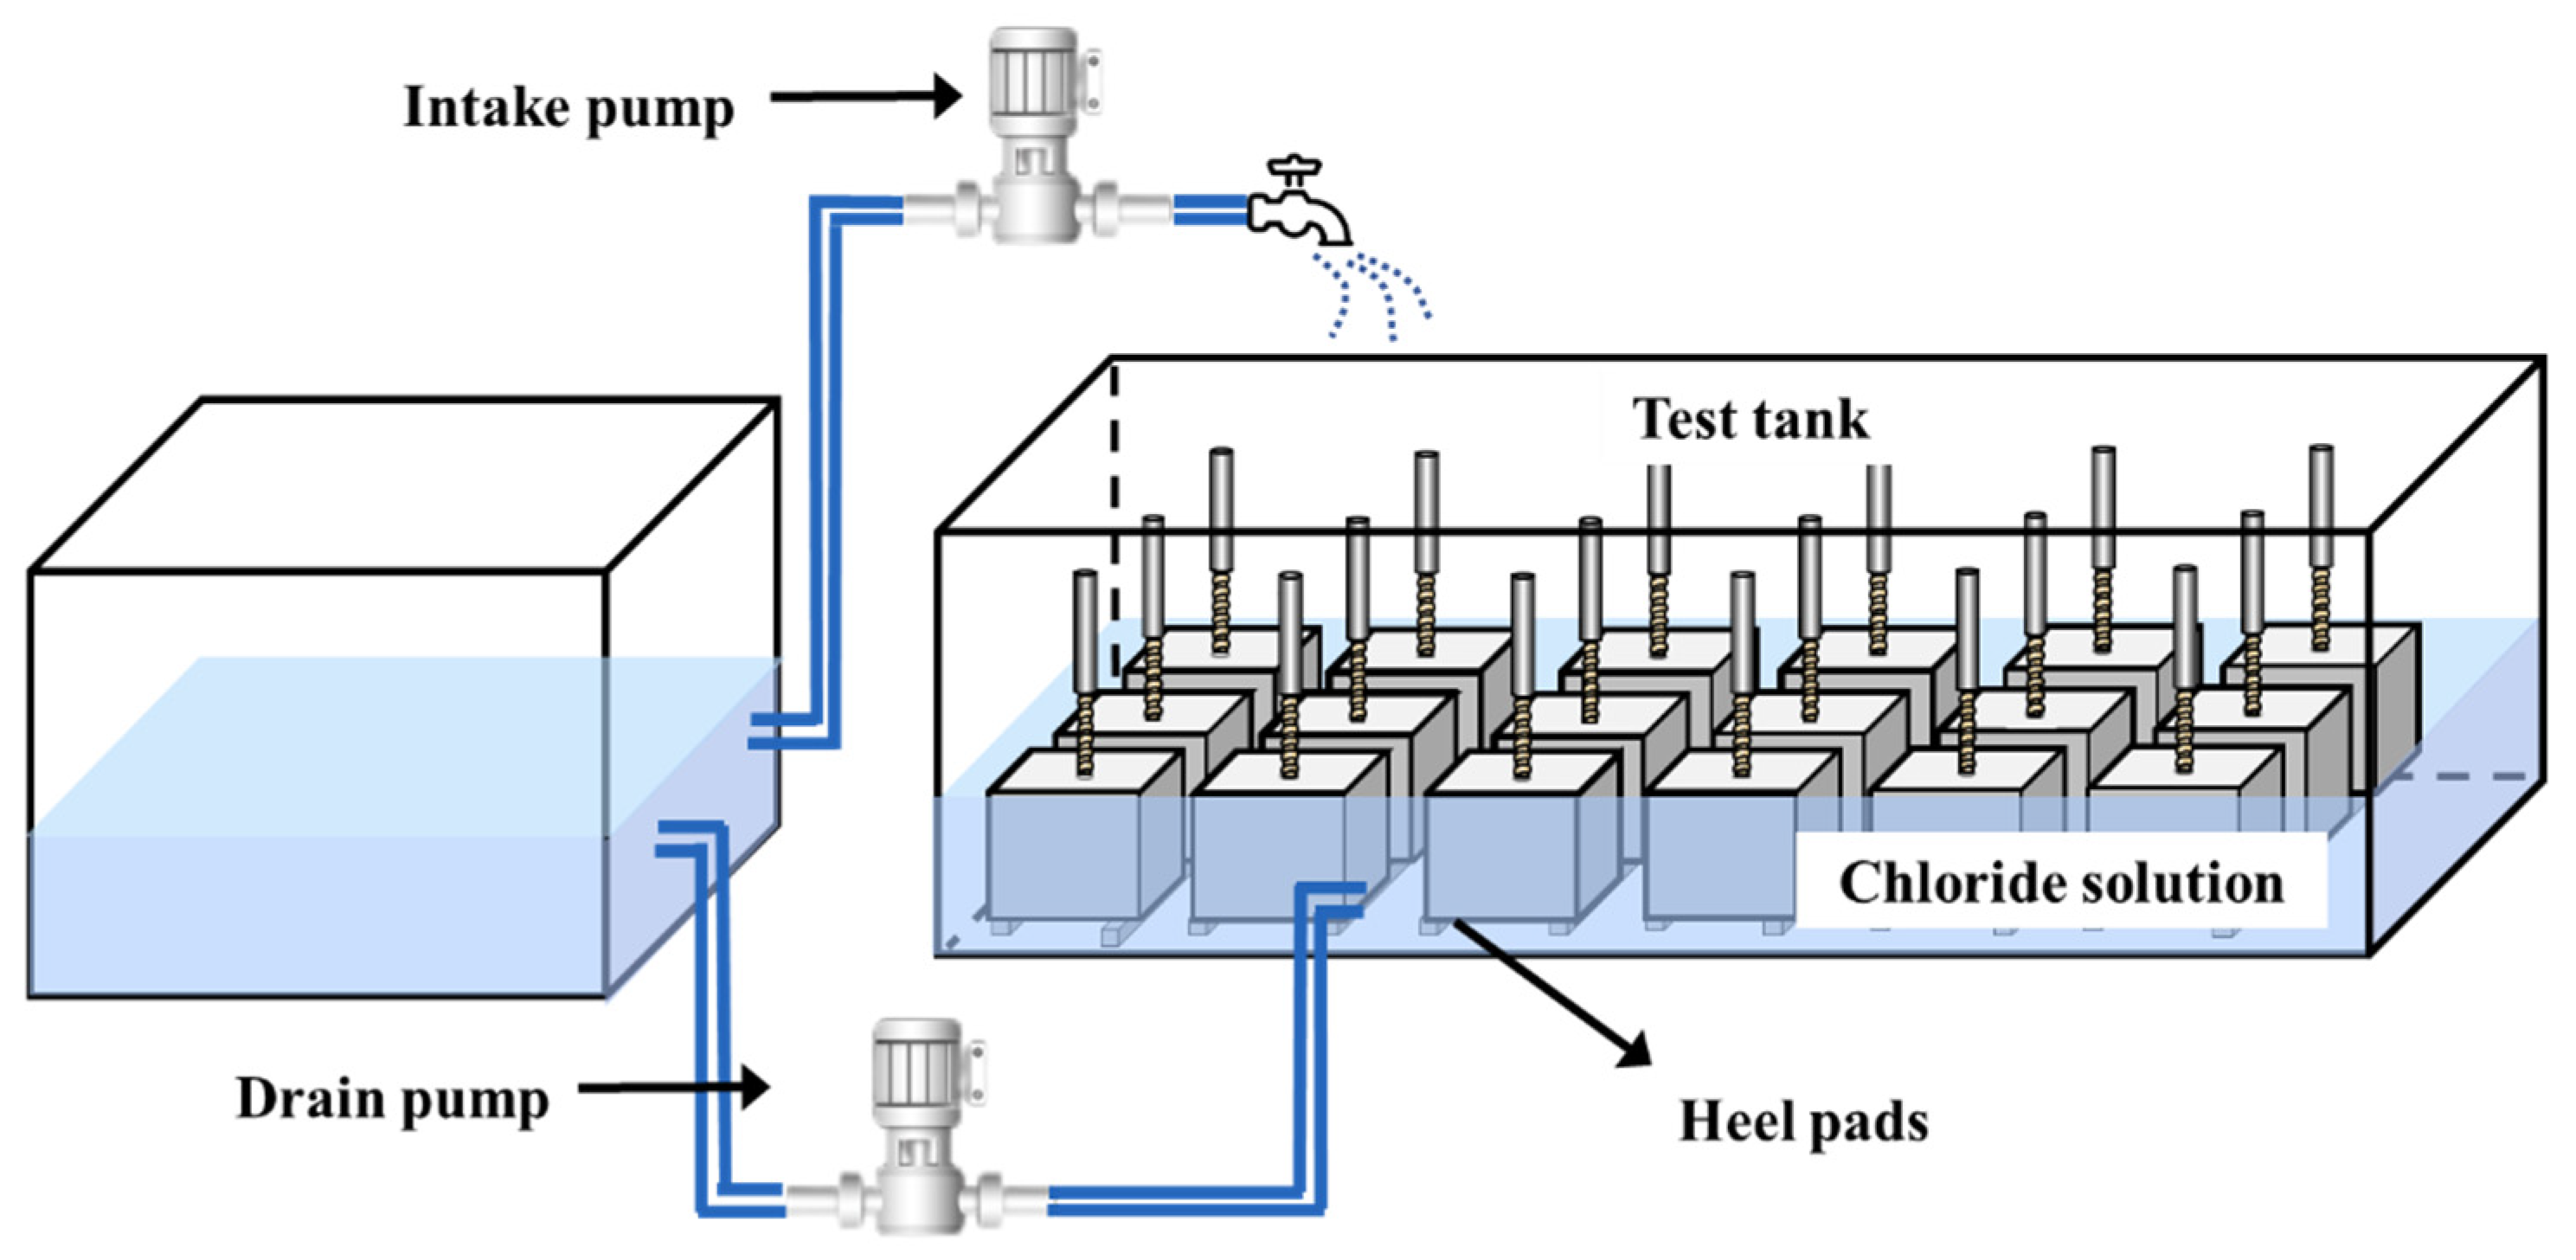
Following 28 days of natural curing, the pull-out specialties were subject to wet dry cycling in solution, and a 5% NaCl solution was chosen to approach the salinity of seawater more closely [13]. Each cycle comprised a 12-hour wet phase followed by a 12-hour dry phase, with an average temperature of 20 ± 2 °C and 80% relative humidity to simulate marine conditions [14]. During exposure, the specimens were positioned vertically on heel blocks, allowing for chloride diffusion in concrete from the free end.
Figure 3.
Automatic chloride dry-wet cycle exposure device.
To assess the degradation of GFRP-concrete bond performance due to chloride exposure, the pull-out tests were conducted at five intervals: immediately after curing (0 months), and at 3, 6, 9, and 12 months after chloride exposure. Three groups of pull-out specimens were fabricated and tested, as summarized in Table 3. As given in Table 3, the specimen identifier comprises three components: the initial letters denote the GFRP bar surface texture, the subsequent numeral indicates the effective bond length as a multiple of the bar diameter, and the final numeral specifies the duration of chloride exposure in months. For example, SG-5d-6 refers to a specimen with a sand-coated GFRP bar, an effective bond length of five times the bar diameter, and six months of chloride exposure.
2.3. Pull-Out Loading Scheme
This study followed the guidelines established by ACI 440.3R-12 and CSA S806-12 for the design of test specimens and the experimental setup. As illustrated in Figure 4, pull-out tests were performed using a 600 kN capacity servo-hydraulic testing machine manufactured by Shenzhen SUNS Technology Stock Co., Ltd. The specimens were securely positioned on a steel frame connected to the top grip system. To minimize misalignment and reduce friction between the concrete cube and the steel plate, a soft rubber pad and a low-friction film were employed. A displacement-controlled loading scheme was utilized to capture the complete post-peak behavior of the specimens. The load was applied to the GFRP bar at a rate of 1 mm/min until failure occurred (ACI440.3R-12). The control system of the machine accurately recorded the applied load throughout the test, while a LVDT monitored the displacement at the free end of the tested GFRP bar.
The bond behavior discussed in this paper is characterized by nominal bond stress () calculated using the following equation:
where, is the applied load during test; is the nominal bar diameter; is the bond length, which is 5d or 7d in this test.
3. Experimental Results and Discussions
3.1. Failure Patterns and Test Results
Two distinct failure patterns were observed from the pull-out tests: Type A, characterized by pull-out failure, and Type B, characterized by peeling-off failure. In specimens exhibiting Type A failure (Figure 5a), a substantial amount of residual concrete was retained between the ribs of the extracted GFRP bar. Conversely, Type B failures (Figure 5b) exhibited extensive wear on the bar’s ribs, with no concrete residue remaining on the bar surface after extraction. The occurrence of these failure modes is primarily influenced by the relative strengths of the GFRP bar and the concrete. The red area highlighted in Figure 5 indicates the region of weakness that experiences the most damage during the pull-out tests.
The bond-slip performance and corresponding failure patterns are summarized in Table 4. Exception of the RG-5d-0 specimen (which underwent no chloride exposure) and some RG-7d specimens subjected to shorter exposure durations, all other specimens exhibited a Type B failure. This finding suggests that the ribs of the GFRP bars deteriorated significantly after chloride dry-wet exposure. Furthermore, the tested peak bond strength () displayed a general decreasing trend with increasing the duration of chloride exposure. However, variations in slip corresponding to the peak point () differed significantly among test specimens.
Significant differences in bond strength were observed between the two rebar types under identical bond lengths and chloride exposure durations. Initially, the RG-5d-0 specimen exhibited a peak bond strength of 36.8 MPa, while the SG-5d-0 specimen recorded a lower value of 21.7 MPa. After 12 months of chloride exposure, the bond strength decreased to 21.3 MPa for the RG-5d-12 specimen and to 13.5 MPa for the SG-5d-12 specimen. Conversely, the corresponding slip displacement was slightly higher in the RG-type GFRP specimens. For instance, RG-5d-0 exhibited a slip of 5.8 mm compared to 4.7 mm for SG-5d-0. The SG-5d specimens displayed minimal changes in slip with chloride exposure, with slip values of 4.7 mm for SG-5d-0 and 4.9 mm for SG-5d-12. Additionally, an increase in bond length generally resulted in a decrease in peak bond strength. For example, the RG-5d-0 specimen had a peak bond strength of 36.8 MPa, whereas the RG-7d-0 specimen exhibited a lower value of 29.0 MPa. Longer bond lengths were also associated with greater slip displacements; the RG-7d-0 exhibited a slip of 10.7 mm compared to 5.8 mm for the RG-5d-0.
In summary, peak bond strength was affected by chloride exposure duration, surface texture, and effective bond length. While the corresponding slip displacement did not follow a consistent pattern across all specimens, it was generally higher in those with increased bond lengths and RG-type GFRP bars. These results highlight the complex interactions governing bond-slip behavior under different exposure conditions, which will be further examined in subsequent Sections.
3.2. Effects of Surface Textures
Figure 6 provides a detailed comparison of the bond-slip behavior of threaded ribbed GFRP (RG) bars and sandblasted GFRP (SG) bars. The bonding behavior of each group is similar, and one representative curve is selected for discussion. Under initial conditions without chloride exposure, specimen RG-5d-0 exhibited a significantly steeper ascending slope, reaching a peak bond strength of 36.8 MPa. In contrast, the SG-5d-0 bars displayed lower bond strength during this phase, with a more gradual increase in bond stress. As the duration of chloride exposure increased from 0 to 12 months, both RG-5d and SG-5d specimens showed a decline in bond strength. However, RG-5d specimens consistently exhibited a steeper ascending slope and higher peak values compared to SG-5d specimens throughout the chloride exposure period.
Figure 7 illustrates the peak bond strength and corresponding slip values. For RG-5d series specimens, the bond stress decreased from 36.8 MPa at 0 month to 21.3 MPa at 12 months, resulting in a retention ratio of 0.58. In comparison, the sand-coated GFRP bars (SG-5d) showed a reduction from 21.7 MPa to 13.5 MPa over the same period, corresponding to a retention ratio of 0.62. The peak strength of the RG-5d specimens was approximately 1.4 times higher than that of the SG-5d specimens during all exposure, indicating that both types experienced a comparable rate of deterioration. However, no consistent pattern of change was observed in the slip values at peak points. In general, the RG-5d specimens exhibited greater slip compared to the SG-5d specimens, suggesting that sand-coated GFRP bars demonstrate lower stiffness.
The differences in bond performance between threaded ribbed GFRP (RG) bars and sand-coated GFRP (SG) bars can be primarily attributed to the enhanced mechanical interlock provided by the spiral ribs of the RG bars with the surrounding concrete matrix [15]. In contrast, the bond strength of SG bars relies more on friction and adhesion, as the mechanical interlocking is hindered by the sand-coated surface [16]. Previous studies have shown that the sandblasted layer can gradually peel off, reducing both the contact area and frictional resistance between the GFRP bar and the concrete [17]. As a result, SG specimens consistently exhibit lower bond performance compared to RG specimens throughout the slip process, regardless of the chloride exposure duration.
3.3. Effects of Bond Length
Figure 8 presents a detailed comparison of the bond-slip behavior for GFRP bars with different bond lengths (5d and 7d). For specimens without chloride exposure, RG-5d-0 exhibited a steeper increase in average bond stress, resulting in higher average bond strength, while RG-7d-0 demonstrated greater slip displacement. These results suggest that shorter bond lengths enhance average bond strength.
With increased chloride exposure duration, both RG-5d and RG-7d specimens showed significant reductions in bond strength. Over time, the bond-slip curves for the two bond lengths converged, indicating that the influence of bond length diminished under prolonged chloride exposure.
The analysis of peak bond strength and the corresponding slip is presented in Figure 9. A distinct difference in peak bond stress was observed between the RG-5d-0 and RG-7d-0 specimens, with RG-5d-0 exhibiting a higher peak bond stress of 36.8 MPa, compared to 29.0 MPa for RG-7d-0 — a 21% reduction. Additionally, the slip displacement for RG-7d-0 was approximately 80% greater than that of RG-5d-0. After 12 months of chloride exposure, RG-5d-12 showed only a 15% higher peak bond stress than RG-7d-12; however, their slip displacements were more comparable, with RG-5d-12 being 26% greater than RG-7d-12.
This difference can be primarily attributed to the uneven stress distribution along the GFRP bar in the pull-out specimens. Under direct tensile loading, asynchronous deformation may occur between the core and outer layers of the ribbed GFRP bar, leading to uneven stress distribution across the cross-Section and shear lag [18]. During the pullout test, the bond stress along the rebar was not uniformly distributed, and the ultimate bond stress gradually migrated from the loaded end to the free end. When the bond length is short, the high-stress zone expands proportionally, causing the stress curve to bulge more prominently along the anchorage length. This results in a higher average bond stress. Conversely, when the bond length increases, the bond stress distribution becomes more uniform, leading to a lower average bond stress [19].
3.4. Effects of Chlorine Salt Erosion
Figure 10a illustrates the bond-slip variations of RG-5d specimens under different chloride exposure durations. The RG-5d-0 specimen initially exhibited a steep ascending slope, reflecting strong bond strength. However, as chloride exposure duration increased, the slope became less pronounced. Figure 10b demonstrates the bond-slip behaviors of SG-5d specimens, which experienced little changes in bond performance during the first six months of exposure, followed by a reduction in curve convexity after nine months. In Figure 10c, the bond-slip behaviors of RG-7d specimens reveal two distinct trends. Before nine months of exposure, the bond-slip curve exhibits an S-shaped trajectory characterized by a gradual increase during the initial slip phase, a sharper rise around 3 mm slip, peaking at approximately 6.5 mm. This pattern results in a higher peak slip displacement. After nine months, the curve adopts a different shape, with a steep initial slope followed by a pronounced reduction at the inflection point, resulting in lower peak slip displacement and bond strength. Overall, chloride exposure significantly impacts the pull-out behaviors of GFRP-concrete bond specimens. As exposure time increases, the bond-slip curves shift from a convex shape to a more flattened profile, reflecting the gradual deterioration in bond strength.
Figure 11a illustrates the progressive decline in peak bond strength for each group of specimens subjected to chloride exposure. Specifically, the peak bond strength of the RG-5d series decreased from 36.8 MPa (RG-5d-0) to 21.3 MPa (RG-5d-12), the SG-5d series decreased from 21.7 MPa (SG-5d-0) to 13.5 MPa (SG-5d-12), and the RG-7d series decreased from 29.0 MPa (RG-7d-0) to 18.5 MPa (RG-7d-12). This consistent decline across all groups indicates that chloride exposure induces a comparable rate of bond strength deterioration in GFRP-concrete pull-out specimens, irrespective of the specimen type. Figure 11b presents the slip values corresponding to the peak point under chloride exposure. While the RG-5d and SG-5d groups display a fluctuating pattern without a clear trend, the RG-7d group shows a significant variation in peak slip around the 9-month exposure period. For example, the peak slip of the RG-7d-6 specimen reached 10.4 mm but then decreased to 7.6 mm for the RG-7d-9 specimen, representing a reduction of 26.9%. Prolonged exposure thus results in a noticeable reduction in peak slip values for the RG-7d specimens.
As previously discussed, the pull-out behavior of GFRP-concrete bond specimens undergoes considerable changes with the increasing duration of chloride dry-wet cycles. Chloride ingress weakens the bond between the GFRP bars and the concrete, resulting in a shift in the bond-slip curves from a convex shape to a flattened trend [20]. All specimen groups exhibited a gradual decline in peak bond strength at a similar rate over the exposure period. However, the slip values of the RG-5d and SG-5d groups showed a wave-like pattern, whereas the RG-7d group displayed significant changes around the 9-month exposure mark, likely due to alterations in the failure mode of the specimens.
To assess the impact of concrete strength on bond-slip behavior under chloride exposure, the compressive strength of concrete exposed to the same environment was tested. Figure 12 compares the retention rates of concrete compressive strength and bond strength over time. The data revealed that the reduction in concrete compressive strength does not directly correlate with the degradation of bond strength in GFRP bars. While the concrete retained over 90% of its initial strength during the first four months, it dropped sharply to 76.6% after 12 months of exposure. In contrast, the bond strength of the RG-5d specimens steadily declined by 42.1% over the same period. This suggests that the reduction in concrete strength alone does not account for the observed decrease in bond strength [21,22]. The degradation of ribbed FRP bars in chloride environments appears to play a decisive role in bond strength deterioration [23].
4. Theoretical Modeling
4.1. Analytical Model for Bond Stress and Slip Behavior
According to the test descriptions in Section 3, chloride exposure significantly influenced the failure pattern and bond strength of GFRP-concrete pull-out specimens. Therefore, it is essential to develop a mechanical model for the bond-slip behavior of GFRP bars in concrete that accounts for chloride-induced damage. Considering that practical applications often prioritize the peak strength, this paper emphasizes the characteristics of the ascending segment of the bond-slip curve. As illustrated in Figure 13, the ascending segment can be typically divided into three distinct stages based on their contributions to bond stress [24]. In Stage I, bond stress is primarily attributed to adhesion (), friction () and mechanical interlock (). In Stage II, the bond-slip behavior causes a transition from static to dynamic friction, rendering the adhesive effect negligible. In Stage III, the mechanical interlock behavior enters an inelastic phase due to the plastic deformation of the ribs.
Since Stage I constitutes a relatively small portion of the entire slip process, the bond-slip model can be effectively calculated and analyzed from Stage II onward. In Stages II and III, the slip behavior of the bars is attributed to a combination of deformations in both the concrete and the GFRP ribs. Given that the rib width () is typically much larger than the rib height (), the ribs can be approximated as triangular shapes on the bar [25]. As illustrated in Figure 14a, the overall slip of the GFRP bar () can be determined as follows:
where, and are the axial deformation in concrete and GFRP ribs in Figure 14a, respectively; is the width of the GFRP rib, and is the width between the ribs.
Since GFRP bars are anisotropic materials, their transverse elastic modulus is typically lower than their longitudinal elastic modulus [26]. Therefore, in this study, the transverse modulus of elasticity for GFRP ribs is denoted as , with representing the discount factor applied to the longitudinal modulus of elasticity .
In Type B failure, the ribs of the GFRP bar are nearly completely worn away, while the concrete remains largely intact. Consequently, the concrete can be considered a rigid body during the pull-out test to analyze the elastic deformation of rib, but in fact, concrete also undergoes deformation simultaneously. At the peak of Type B failure, it is assumed that the rib width is compressed by the concrete lug to half of its original value, a hypothesis widely applied in bond slip analysis at this scale [27,28]. Therefore, the slip corresponding to the peak bond strength () can be calculated as follows:
A parameter is introduced to determine point E for the limit state of Stage II:
During these stages, bond stress is primarily influenced by the mechanical interlock between the FRP ribs and the concrete lugs. A simplified model is proposed in Figure 15 to illustrate the compressive deformation behavior of FRP ribs, suggesting that damage to ribbed FRP bars is primarily caused by the compressive crushing of ribs rather than direct slip failure at the bar surface. Figure 15a illustrates the initial state of a GFRP bar under pull-out loading, where the original blue semicircular rib is compressed by the concrete lugs, with specific geometric characteristics marked. Figure 15b shows the state of the FRP bars after experiencing rib deformation by . The deformed contact profile is divided into two components: the deformed rib (blue) and the extruded horizontal Section (green). For simplification, the blue curve is approximated as the red dotted line. Figure 15c depicts the stress distribution following rib deformation, where the red area represents compressive stress on the deformed rib, and the green area indicates radial stress exerted on the GFRP bar. Among these two regions, only the red area generates a longitudinal component force that contributes to pull-out resistance, while the green area induces radial force, enhancing the frictional effect along the GFRP bar surface.
As depicted in Figure 15c, the length of the contact surface of the FRP rod after rib compression deformation is represented by , while the maximum radial compression deformation is denoted as . Both parameters can be determined using the following equations:
It is assumed in this paper that the radial deformation on the contact surface changes linearly along the longitudinal direction of the FRP bar. Given that the vertical radius of the GFRP bar () is typically much greater than the rib height (), the average vertical strain () on the contact surface can be determined.
The average radial stress on the contact surface can be derived through Eq. (9):
The horizontal force generated at the contact surface is:
The friction force caused by rib compression deformation can be obtained as:
where, denotes the friction coefficient of the GFRP rib.
Then, the bond stress along the GFRP bars at unit length () can be obtained:
Hence, the bond stress for stages I and II (from point O to point E) can be collated as:
In stage III, the friction remains constant at the maximum friction force observed in stage II. Another way of saying it is, the friction force of stage E~P is constant as the friction force at point E, denoted as :
Based on this, the bond strength for stage III (from point E to point P) can be collated as:
This Section presents an analytical model for predicting bond-slip behavior in FRP-concrete pull-out interactions. In the model, the slip is presented in Equation (3), while the bond stresses for the OE segment and the EB segment are shown in Equations (15) and (17), respectively.
The resulting bond stress is uniformly distributed across the effective bond zone, while the calculated slip represents the cumulative displacement of the FRP bars. Furthermore, the model is applicable to specimens with a failure mode of peeling off, and this model does not account for the effects of chloride exposure.
4.2. Model Modification Under Chloride Exposure
Previous Section 4.1 presented an analytical model for bond-slip behavior without considering the effects of chloride exposure. However, as demonstrated in Section 3, the experimental results show that chloride wet-dry cycles significantly impact the bond performance of GFRP-concrete specimens. Both GFRP bars and concrete can deteriorate under these conditions, indicating the need to revise the analytical model for more accurate long-term performance predictions. To address this, two damage indicators—denoted as and , are introduced to quantify the deterioration in the elastic modulus of GFRP bars and the compressive strength of concrete, respectively. In this study, and account solely for the effects of chloride wet-dry cycles. Assuming uniform damage progression, two indicators can be calculated as follows:
The compressive strength of the concrete was measured concurrently with the pull-out test. Since the first exposure period was 3 months, the concrete had already undergone the strengthening phase. So the measurements showed the compressive strength of concrete continuously decreased with the increase in exposure time, as indicated in Figure 12. The relationship between concrete damage and erosion time can be described using the Boltzmann equation [29], as shown in Eq. (20). The Boltzmann equation is characterized by stability in the early stage, rapid changes in the medium term, and stability again in the later stage. Additionally, it is capable of representing any changes induced by parameters, as the system will return to a new equilibrium state following any disturbance applied to it [30,31]. Here, the damage indicator can be derived from the fitted test data with Eq. (20).
where, is the duration of chloride exposure in month; , , and are fitting parameters between damage and erosion time. In this experiment, these parameters were fitted as , , and , utilizing the measurements of concrete compressive strength displayed in Figure 16a.
For the GFRP bars, a constant degradation mechanism is assumed, unaffected by variations in time and temperature [32]. The damage factor of elastic modulus for the GFRP bar () can be determined using the established Arrhenius model [33], expressed as:
where, is a calculation constant, set to 0.2 in this paper; is reduction factor for GFRP degradation; is the pH value within the concrete, fixed at 13.6 for normal concrete; denotes the current temperature of the GFRP bars in Kelvin; is the reference temperature, set to 293 K; is the reference value, established at 2.0 mm; is the surface coefficient quantifying the contact area of GFRP bars with the surrounding solution, for GFRP bar placed in pure solution, this value is 1.0, while for GFRP bars in concrete, this value is defined as the porosity of cement paste surrounding GFRP bars.
The evolution of the damage indicators and are illustrated in Figure 16, highlighting the deterioration characteristics under chloride wet-dry cycles. The curve exhibits a steep slope during the first three months, indicating rapid damage accumulation in the GFRP bar. After this period, the slope decreases, suggesting a transition to a slower damage phase, likely due to saturation of chloride ion penetration, which reduces the overall diffusion rate and stabilizes surface damage [33]. In the subsequent months, the damage rate remains relatively stable with minimal fluctuations. In contrast, the curve for concrete damage follows an S-shaped pattern. Initially, the damage rate is low, with a gentle slope during the first three months. Between months three and eight, the damage accumulation accelerates significantly, as reflected by the increased slope. After the ninth month, the damage rate slows down, and the curve flattens, indicating that the concrete has entered a more stable phase of damage accumulation.
These two damage indicators, and , can be utilized to refine the analytical model presented in Section 4.1. The long-term elastic modulus of GFRP, , and the concrete compressive strength, , under chloride exposure can be expressed as follows:
This modification allows for the prediction of bond-slip curves across various chloride exposure durations. However, it is important to note that the relatively short exposure duration in the experiments may limit the predictive model's accuracy regarding long-term performance. Additional experimental data are necessary to further refine and enhance the calculation model.
4.3. Model Validation
Based on the analysis derived in Section 4.1 and Section 4.2, a predictive method was developed to estimate the bond-slip behavior between GFRP bars and concrete under the influence of chloride wet-dry cycles. The variable, , representing the friction coefficient at the interface between GFRP bars and concrete, was set to 0.5 for the RG series and 0.55 for the SG series [34]. The ratio of the transverse elastic modulus of GFRP to its longitudinal elastic modulus () was selected as 0.25 for RG series and 0.125 for SG series in this paper [35]. The coefficient , obtained through regression of experimental results, is determined to be 0.85, as shown in Figure 17.
According to ACI 318 (2012), the shear modulus of concrete can be calculated as:
where, is cylinder compressive strength, which can be assumed to be 0.8 times prism compressive strength in this test.
The predicted bond-slip curves and the statistical evaluations were compared with the experimental results and presented in Figure 18, Figure 19 and Figure 20. This study uses RMSE, R-square, MRE, and CoV to quantify the feasibility of the model. Specifically, a smaller RMSE indicates better model performance; an R-square above 0.8 typically suggests that the model fits the data well; an MRE less than 0.2 is considered a good level; and a CoV below 0.3 indicates superior predictive performance. As indicated in Figure 18, Figure 19 and Figure 20, the proposed model shows good agreement for test specimens exhibiting failure pattern B. In contrast, specimens with failure pattern A (specimens RG-7d-0, RG-7d-3, and RG-7d-6) demonstrated greater variability in the correlation metrics. This discrepancy is primarily due to the assumption in the proposed analytical model, which does not account for concrete crushing damage.
Table 5 presents a comparison of the predicted and tested peak values for GFRP bar pullout tests in concrete. The ratio of predicted bond strength () to the tested strength () is close to 1 and exceeds 0.7 for all tested specimens, indicating a strong predictive capacity of the proposed analytical model for assessing the ascending portion of the bond-slip performance. For the RG-5d group, the ratio of predicted to experimental peak strength () ranges from 0.87 to 1.17, with an average error of 2%. The ratio of predicted to experimental peak slip () varies between 0.69 and 1.32, with an average error of 1%. Notably, the highest prediction errors for both peak strength and peak slip in the RG-5d group occur in the RG-5d-0 test, attributed to different failure mode. Local concrete crushing in specimen RG-5d-0 may result in a lower measured peak strength than that predicted for GFRP rib failure.
In the SG-5d group, the ratio ranges from 0.70 to 1.01, with an average error of 19%. The ratio spans from 0.77 to 1.26, with an average error of 11%. It is evident that the predicted peak strengths for the SG-5d group are generally lower than the experimental values, which may be due to the conservative selection of the value. Additionally, the proposed GFRP damage indicator in Eqs. (22)~(23) does not account for the effects of the sand-blasted surface. Previous studies have indicated that sand-blasted surfaces are more susceptible to damage and stripping from the GFRP bar.
For the RG-7d group, the ratio lies between 0.74 and 1.15, with an average error of 7%, while the ratio ranges from 0.56 to 0.95, with an average error of 27%. The predicted peak bond strength for the RG-7d group was calculated using a reduction factor based on the RG-5d group. However, the longer bond length leads to a deeper chloride erosion pathway when exposed in the chloride solution tank, potentially enhancing chloride resistance for the RG-7d series pull-out specimens [36]. Furthermore, the for the RG-7d group was derived under the assumption of a uniform bond stress distribution along the GFRP, similar to that of the RG-5d group. This assumption overlooks the non-uniform distribution of bond stress, resulting in an overestimation of bond strength [37].
5. Model’s Application
5.1. Analysis of Parametric Sensitivity
The parameters , and are essential for the proposed bond-slip model. This Section analyzes the sensitivity of the predicted bond-slip curves to variations in , and . Initially, Figure 21a illustrates the effect of different values (0.4, 0.3, 0.2, and 0.1) on the bond-slip curves. The parameter represents the contribution of friction to the bond performance between GFRP bars and concrete during pull-out testing, where a higher value indicates a rougher contact surface and increased frictional resistance. The results show that decreasing slightly reduces the convexity of the predicted curve. Although the peak strength is only moderately reduced by approximately 11%, the strength at the end of the elastic stage exhibits a more significant decrease of around 27%. This is because friction plays a dominant role in the initial stages of the pull-out test. As the GFRP bar slip increases, the bond stress at the interface is primarily governed by mechanical interlock rather than friction [38]. Consequently, the friction coefficient primarily affects the elastic stage characteristics of the bond-slip curve, demonstrating minimal sensitivity in the subsequent phases.
In this study, the coefficient influences the elastic stage of the pull-out test, as detailed in Eq. (6). To assess the impact of on the predicted curves, different values of (1.0, 0.95, 0.90, 0.85) were incorporated into the proposed model for comparison, as illustrated in Figure 21b. As the coefficient increases, the slip for the elastic stage shortens. It clearly demonstrates that the predicted curve exhibits a diminishing "convex" trend with increasing . When changes from 0.85 to 1.00, the peak strength gradually decreases by 19%. These results indicate that the predicted curve shows a certain degree of sensitivity to variations in .
To investigate the impact of on the predicted curve, various values were introduced into the proposed model for comparison. Figure 21c illustrates the comparison among values of 0.25, 0.20, 0.15, and 0.10. The parameter represents the discount factor for the transverse elastic modulus of the GFRP. As decreases, the overall trend of the curve flattens, and the peak strength correspondingly reduces. The predictive model employed in this study is based on the elastic deformation of GFRP ribs. For specimens with identical other parameters, a smaller value indicates that the same deformation will generate a reduced elastic force. Consequently, the predicted curve declines with the decrease in .
5.2. Long-Term Bond Performance Prediction
The validated bond-slip prediction model was applied to evaluate the long-term bond performance between GFRP bars and concrete under prolonged chloride exposure. This Section examines the progressive changes in the bond-slip behavior of GFRP-concrete pull-out specimens over a 10-year period. It is assumed that concrete degradation follows the trends outlined in Section 4, while GFRP bars are exposed to stable chloride conditions, with similar environmental factors in terms of concentration, temperature, and so on. All parameters used in this analysis are consistent with those defined in Section 4.3.
Figure 22a illustrates the evolution of the bond-slip curve for GFRP-concrete (RG-5d) specimens over one year. Significant changes in the bond-slip curves are observed at different intervals, although the rate of strength degradation decreases over time. The peak bond strength declines by approximately 26.5% within the first three months, while the reduction from months 9 to 12 is only around 9%. This indicates that damage accumulation in GFRP-concrete bond specimens is more severe in the early stages under chloride dry-wet cycles.
Figure 22b extends this analysis to a 10-year exposure period. The most pronounced changes in the bond-slip curve occur within the first 24 months, after which minimal alterations are observed beyond 36 months, with peak bond strength stabilizing at 17.1 MPa. These results suggest that the bond performance degradation rate of GFRP-concrete (RG-5d) pull-out specimens diminishes with increased exposure time.
In summary, this study offers theoretical insights into predicting the long-term bond-slip behavior between GFRP bars and concrete under chloride wet-dry cycles. However, the predictive outcomes are based on a mechanical model that may not fully capture complex real-world conditions. Specifically, the model assumes uniform damage distribution within the material, while in practice, damage could be localized and heterogeneous, potentially affecting the accuracy of bond-slip behavior predictions. Therefore, future research should incorporate additional experimental data to refine and validate the model, thereby enhancing its precision and applicability.
6. Conclusions
This study systematically investigates the bond behaviors between GFRP bars and concrete under chloride wet-dry cycles, focusing on the effects of bond length and surface texture. The experimental results demonstrate that both bond length and surface texture significantly influence bond performance and degradation patterns during chloride exposure. An analytical bond-slip relation model with high applicability and accuracy is proposed. The main conclusions are summarized as follows:
(1) The application of a sand-coated surface on GFRP bars resulted in significantly lower bond strength and stiffness compared to threaded ribbed GFRP bars. However, the sand-coated GFRP bars exhibited better resistance to deterioration under chloride exposure, with a reduction of approximately 37.7% after 12 months, compared to a 42.1% reduction in threaded ribbed GFRP bars.
(2) Bond length significantly influences the failure pattern and bond-slip behaviors between GFRP and concrete. Pull-out specimens with shorter bond lengths are more prone to peeling-off failure after exposure and the failure mode in RG-7d group changes from pull-out failure to peeling-off failure as the exposure duration exceeds 9 months. GFRP bars with a shorter bond length (5d) consistently exhibit higher bond strength across all exposure durations, while increasing the bond length to 7d results in a more gradual decrease in bond strength.
(3) The test results reveal a clear relationship between chloride exposure duration and the degradation of GFRP-concrete bond performance. A comparison of the retentions in concrete compressive strength and bond strength indicates that the deterioration of GFRP bars is a critical factor contributing to bond deterioration.
(4) An analytical model was developed that incorporates GFRP bar geometry, surface texture, and bond length, and was validated against experimental data. The model successfully predicts bond behavior under varying conditions, demonstrating its effectiveness in capturing the key factors influencing bond performance. This model also predicts bond behavior over a ten-year period under continuous chloride exposure.
Author Contributions
Methodology, Chunhua. Lu.; formal analysis, Zhennan. Yang. and Hao. Ge. and Siqi. Yuan.; data curation, Ge, Hao.; writing—original draft preparation, Zhennan. Yang. and Hao. Ge.; writing—review and editing, Siqi. Yuan. and Siqi. Yuan; supervision, Siqi. Yuan. and Chunhua. Lu. All authors have read and agreed to the published version of the manuscript.
Acknowledgements
This research is financially supported by the National Natural Science Foundation of China (No. 52478177) and Natural Science Foundation for Young Scientists of Jiangsu Province (BK20240876).
References
- Li, J.; Mai, Z.; Xie, J. Durability of components of FRP-concrete bonded reinforcement systems exposed to chloride environments. Compos Struct 2022, 279, 114697. [CrossRef]
- Yan, F.; Lin, Z.; Yang, M. Bond mechanism and bond strength of GFRP bars to concrete: A review. Compos Part B-Eng 2016, 98, 56-69.
- Tafsirojjaman, T.; Fawzia, S.; Thambiratnam, D.P. Performance of FRP strengthened full-scale simply-supported circular hollow steel members under monotonic and large-displacement cyclic loading. Eng Struct 2021, 242, 112522. [CrossRef]
- Zeng, J.; Hao, Z.; Liang, Q. Durability assessment of GFRP bars exposed to combined accelerated aging in alkaline solution and a constant load. Eng Struct 2023, 297, 116990. [CrossRef]
- Wang, G.; Wei, Y.; Shen, C. Compression performance of FRP-steel composite tube-confined ultrahigh-performance concrete (UHPC) columns. Thin Wall Struct 2023, 192, 111152. [CrossRef]
- Xiong, Z.; Wei, W.; Liu, F. Bond behaviour of recycled aggregate concrete with basalt fibre-reinforced polymer bars. Compos Struct 2021, 256, 113078. [CrossRef]
- Zhou, L.; Guo, S.; Zhang, Z. Mechanical behavior and durability of coral aggregate concrete and bonding performance with fiber-reinforced polymer (FRP) bars: A critical review. J Clean Prod 2021, 289, 125652. [CrossRef]
- Machello, C.; Bazli, M.; Rajabipour, A. FRP bar and concrete bond durability in seawater: A meta-analysis review on degradation process, effective parameters, and predictive models. Structures 2024, 62, 106231. [CrossRef]
- Al-Hamrani, A.; Alnahhal, W. Bond durability of sand coated and ribbed basalt FRP bars embedded in high-strength concrete. Constr Build Mater 2023, 406, 133385. [CrossRef]
- Gravina, R.J.; Li, J.; Smith, S.T. Environmental durability of FRP bar-to-concrete bond: Critical review. J Compos Constr 2020, 24(4), 03120001. [CrossRef]
- Ke, L.; Ma, K.; Chen, Z. Bond-slip and bond strength models for FRP bars embedded in ultra-high-performance concrete: A critical review. Structures 2024, 64, 106551. [CrossRef]
- Zhao, D.; Zhou, Y. Xing, F. Bond behavior and failure mechanism of fiber-reinforced polymer bar–engineered cementitious composite interface. Eng Struct 2021, 243, 112520.
- Wang, Y.L.; Guo, X.Y.; Shu, S.Y.H. Effect of salt solution wet-dry cycling on the bond behavior of FRP-concrete interface. Constr Build Mater 2020, 254, 119317. [CrossRef]
- Dai, J.; Yin, S.; Lin, F. Study on bond performance between seawater sea-sand concrete and BFRP bars under chloride corrosion. Constr Build Mater 2023, 371, 130718.
- Solyom, S.; Balázs, G.L. Bond of FRP bars with different surface characteristics. Constr Build Mater 2020, 264, 119839. [CrossRef]
- Wang, Y.; Wang, M.; Zhang, X. Bond of steel-FRP composite bar embedded in FRP-confined concrete: Behavior, mechanism, and strength model. Eng Struct 2024, 318, 118693. [CrossRef]
- Peng, K.; Zeng, J.; Huang, B. Bond performance of FRP bars in plain and fiber-reinforced geopolymer under pull-out loading. J Build Eng 2022, 57, 104893. [CrossRef]
- Ke, L.; Ai, Z.; Feng, Z. Interfacial bond behavior between ribbed CFRP bars and UHPFRC: effects of anchorage length and cover thickness. Eng Struct 2023, 286, 116140. [CrossRef]
- Ding, Y.; Mao, W.; Wei, W. Bond behavior and anchorage length of deformed bars in steel-polyethylene hybrid fiber engineered cementitious composites. Eng Struct 2022, 252, 113675. [CrossRef]
- Machello, C.; Bazli, M.; Rajabipour, A. FRP bar and concrete bond durability in seawater: A meta-analysis review on degradation process, effective parameters, and predictive models. Structures 2024, 62, 106231. [CrossRef]
- El-Nemr, A.; Ahmed, E.A.; Barris, C. Bond performance of fiber reinforced polymer bars in normal-and high-strength concrete. Constr Build Mater 2023, 393, 131957. [CrossRef]
- Nepomuceno, E.; Sena-Cruz, J.; Correia, L. Review on the bond behavior and durability of FRP bars to concrete. Constr Build Mater 2021, 287, 123042. [CrossRef]
- Li, J.; Gravina, R.J.; Smith, S.T. Bond strength and bond stress-slip analysis of FRP bar to concrete incorporating environmental durability. Constr Build Mater 2020, 261, 119860. [CrossRef]
- Corres, E.; Muttoni, A. Local bond-slip model based on mechanical considerations. Eng Struct 2024, 314, 118190. [CrossRef]
- Liang, K.; Chen, L.; Shan, Z. Experimental and theoretical study on bond behavior of helically wound FRP bars with different rib geometry embedded in ultra-high-performance concrete. Eng Struct 2023, 281, 115769. [CrossRef]
- Yu, H.; Cox, J.V. Radial Elastic Modulus for the Interface between FRP Reinforcing Bars and Concrete. J Reinf Plastl Comp 2002, 21, 14. [CrossRef]
- He, S.; Li, L.; Lin, J. Bond performance between ribbed BFRP bar and seawater sea-sand concrete: Influences of rib geometry. Structures 2024, 65, 106660. [CrossRef]
- Liang, K.; Chen, L.; Shan, Z. Experimental and theoretical study on bond behavior of helically wound FRP bars with different rib geometry embedded in ultra-high-performance concrete. Eng Struct 2023, 281, 115769. [CrossRef]
- Karagöl, F.; Yegin, Y.; Polat, R. The influence of lightweight aggregate, freezing–thawing procedure and air entraining agent on freezing–thawing damage. Struct Concrete 2018, 19(5), 1328-1340. [CrossRef]
- Arora, S.; Singh, B.; Bhardwaj, B. Strength performance of recycled aggregate concretes containing mineral admixtures and their performance prediction through various modeling techniques. J Build Eng 2019, 24, 100741. [CrossRef]
- Choi, P.; Yeon, J. H.; Yun, K.K. Air-void structure, strength, and permeability of wet-mix shotcrete before and after shotcreting operation: The influences of silica fume and air-entraining agent. Cement Concrete Comp 2016, 70, 69-77. [CrossRef]
- Wang, Z.; Zhao, X.; Xian, G. Long-term durability of basalt- and glass-fibre reinforced polymer (BFRP/GFRP) bars in seawater and sea sand concrete environment. Constr Build Mater 2017, 139, 467-489. [CrossRef]
- Iwama, K.; Kai, M.; Dai, J. Physicochemical-mechanical simulation of the short-and long-term performance of FRP reinforced concrete beams under marine environments. Eng Struct 2024, 308, 118051. [CrossRef]
- Yuan, J.; Hadi, M.N.S. Friction coefficient between FRP pultruded profiles and concrete. Mater Struct 2018, 51(5), 120. [CrossRef]
- Yu, H.; Cox, J.V. Radial Elastic Modulus for the Interface between FRP Reinforcing Bars and Concrete. J Reinf Plastl Comp 2002, 21, 14. [CrossRef]
- Jin, L.; Yu, H.; Wang, Z. Developing a model for chloride transport through concrete considering the key factors. Case Stud Constr Mat 2022, 17, e01168. [CrossRef]
- Li, D.; A new analytical model for stress distribution in the rock bolt under axial loading. Int J Rock Mech Min 2024, 176, 105690. [CrossRef]
- Fahmy, M.F.M.; Ahmed, S.E.A.S.; Wu, Z. Bar surface treatment effect on the bond-slip behavior and mechanism of basalt FRP bars embedded in concrete. Constr Build Mater 2021, 289, 122844. [CrossRef]
- Wang, Z.; Zhao, X.; Xian, G. Long-term durability of basalt- and glass-fibre reinforced polymer (BFRP/GFRP) bars in seawater and sea sand concrete environment. Constr Build Mater 2017, 139, 467-489. [CrossRef]
Figure 1.
Geometric details of the GFRP bars.
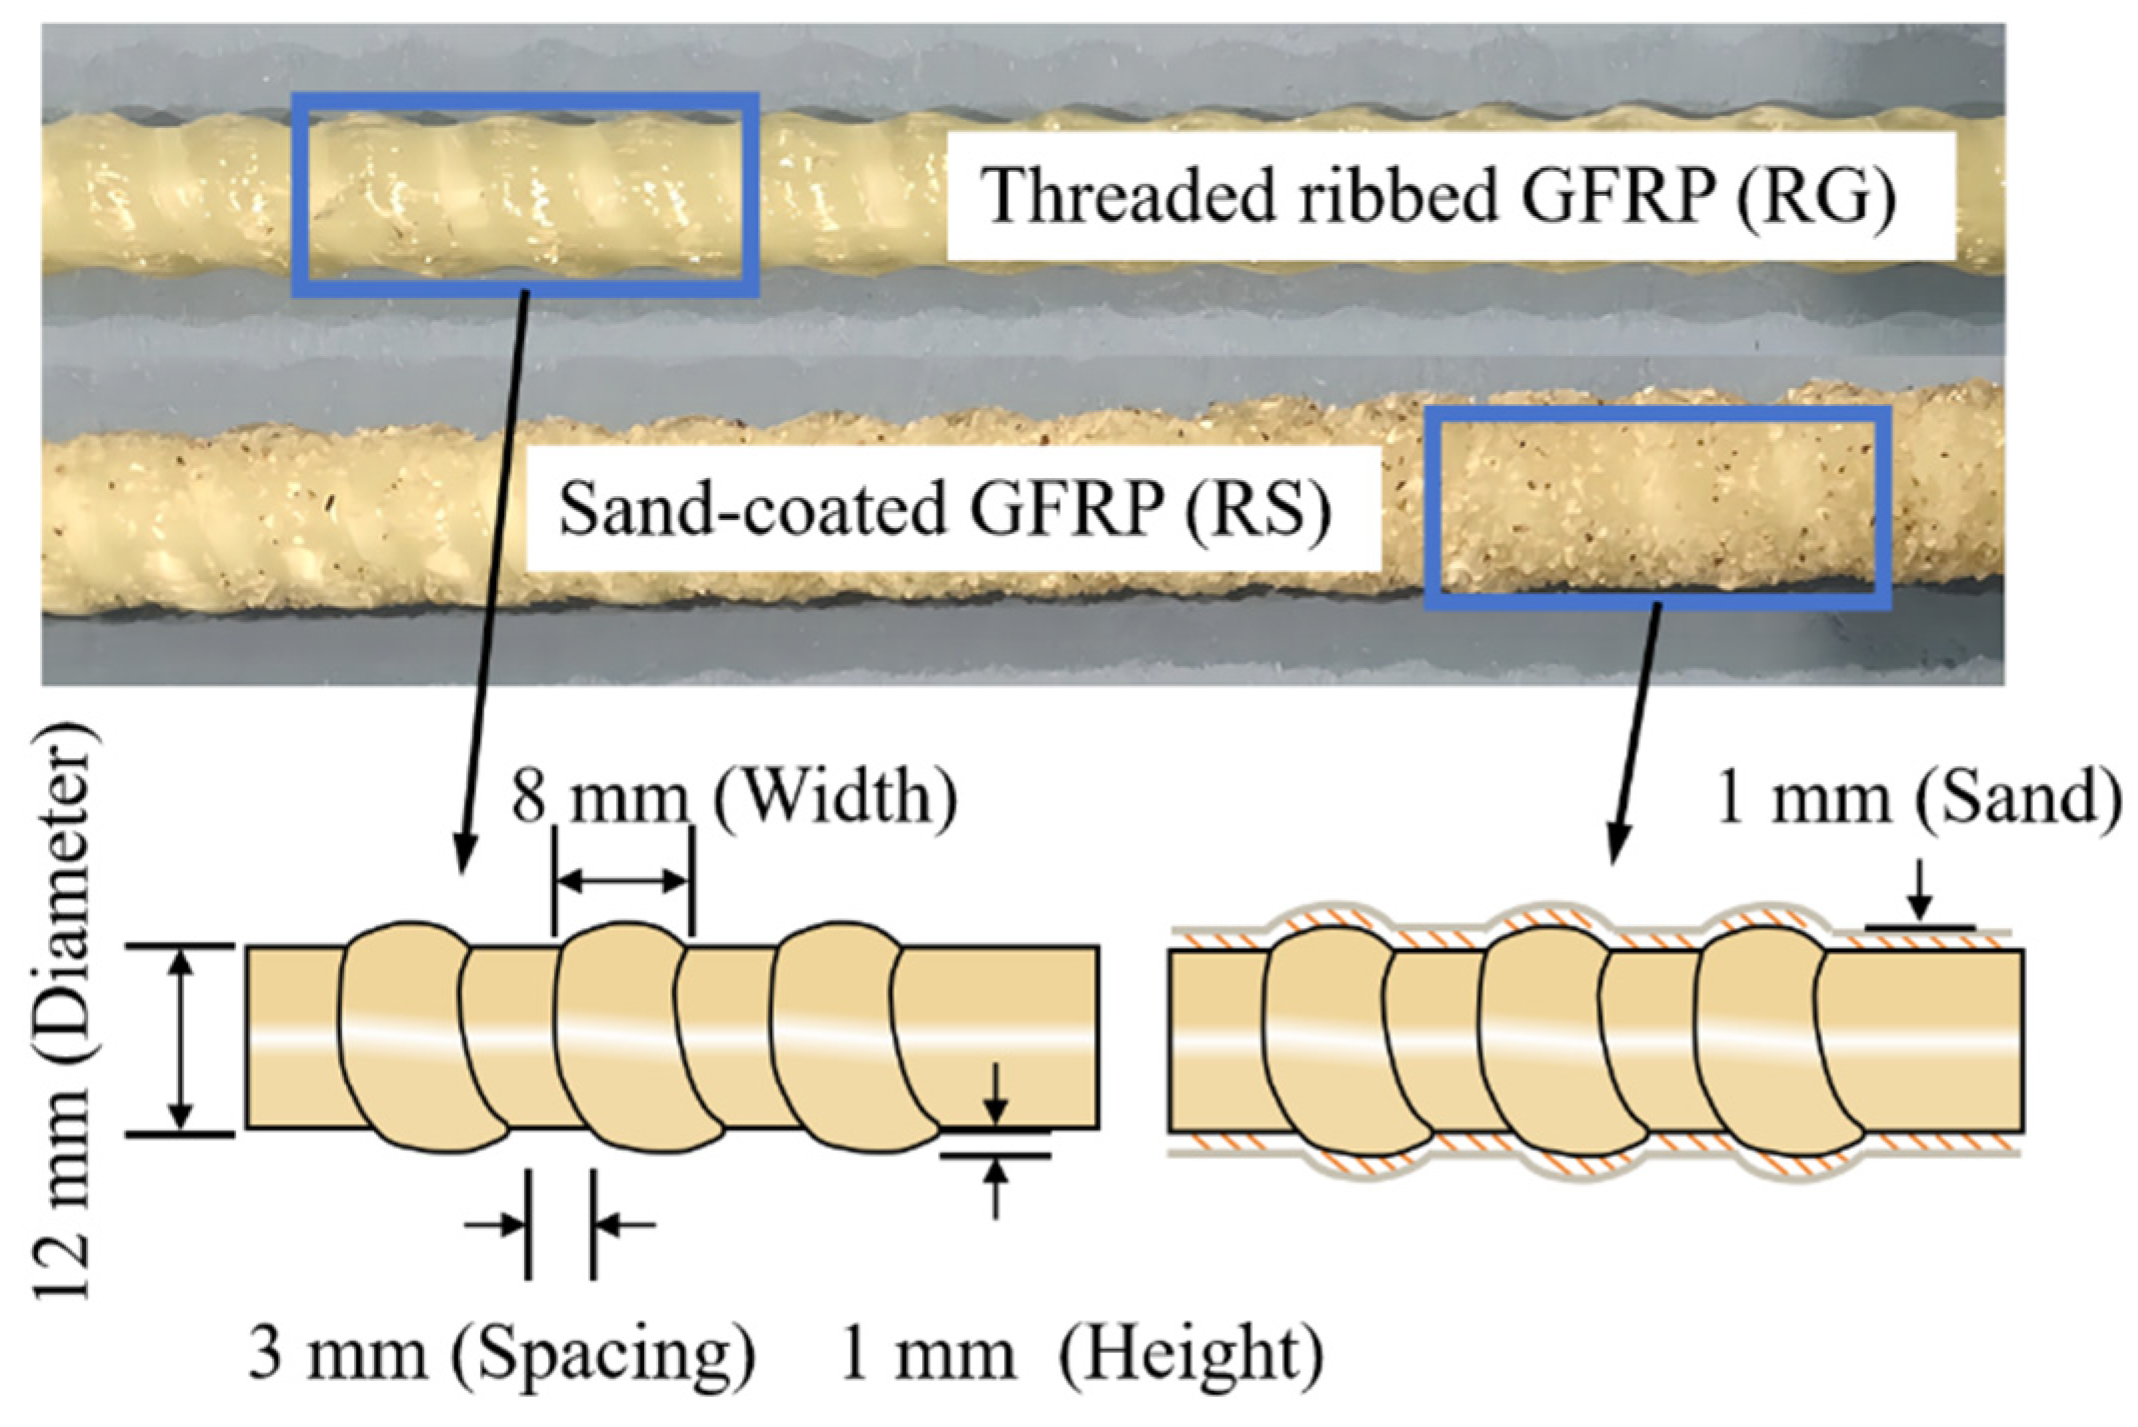
Figure 2.
Pull-out test specimen diagram.
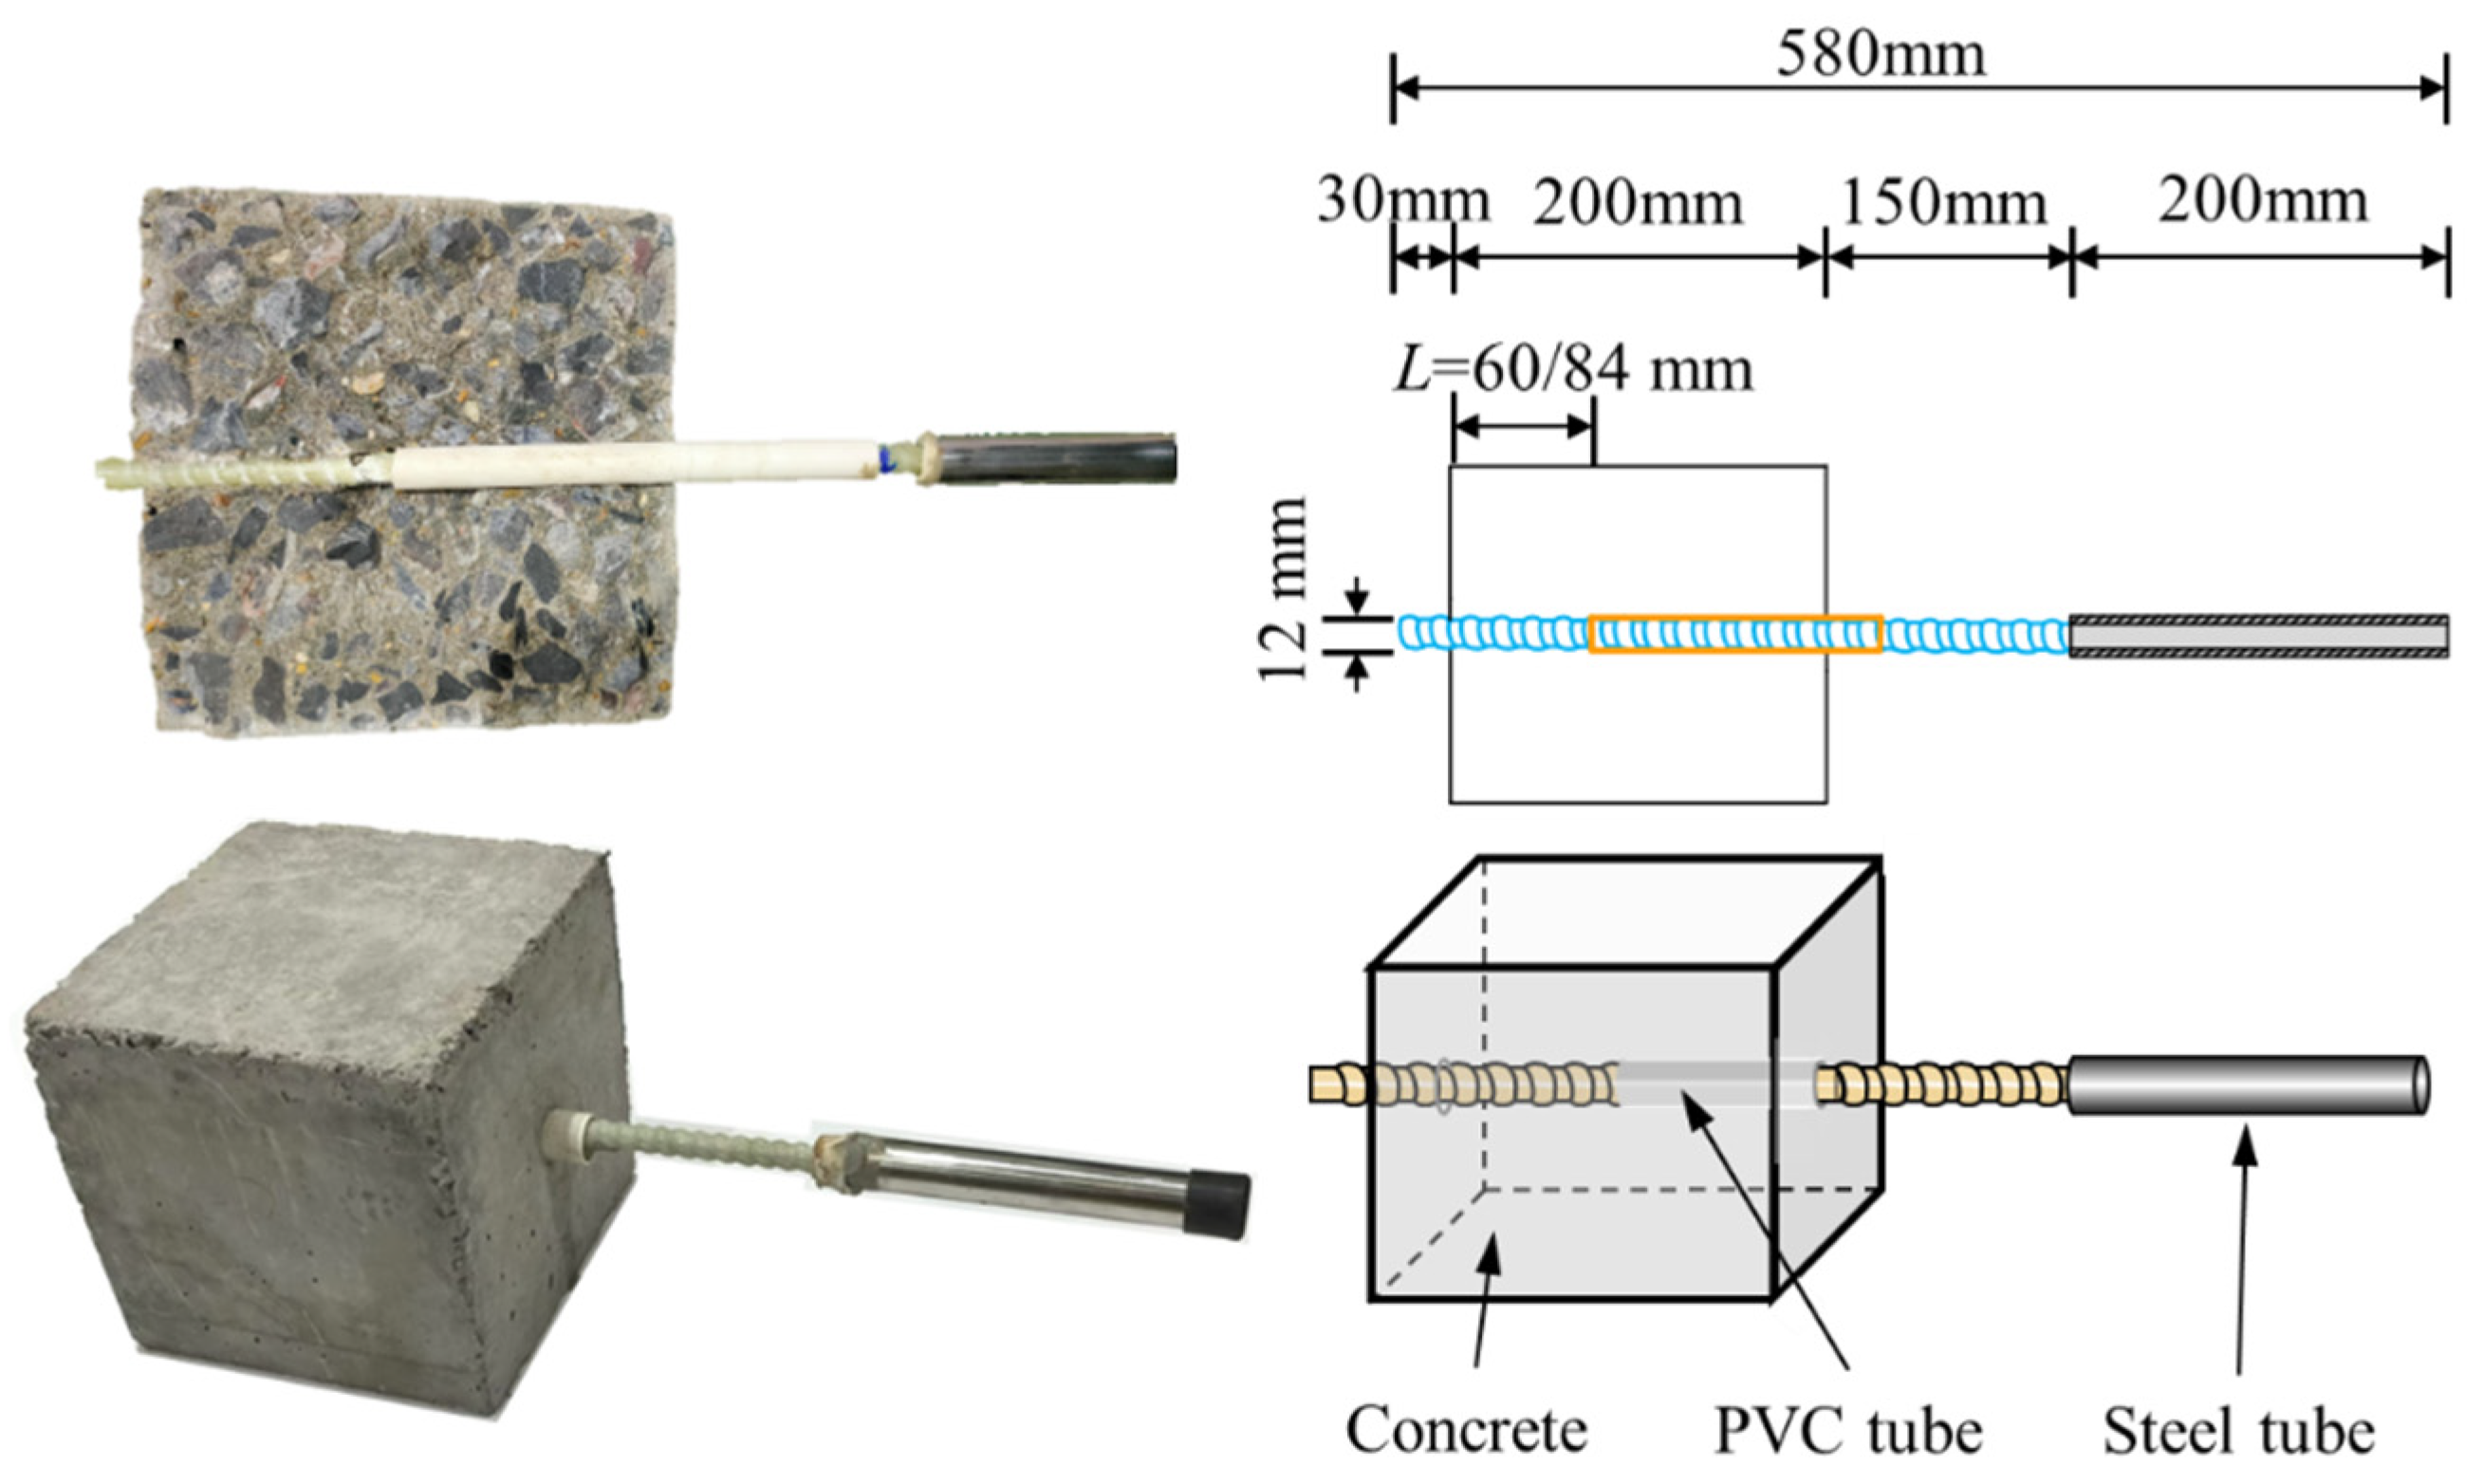
Figure 4.
Loading device for the uniaxial pull-out test.
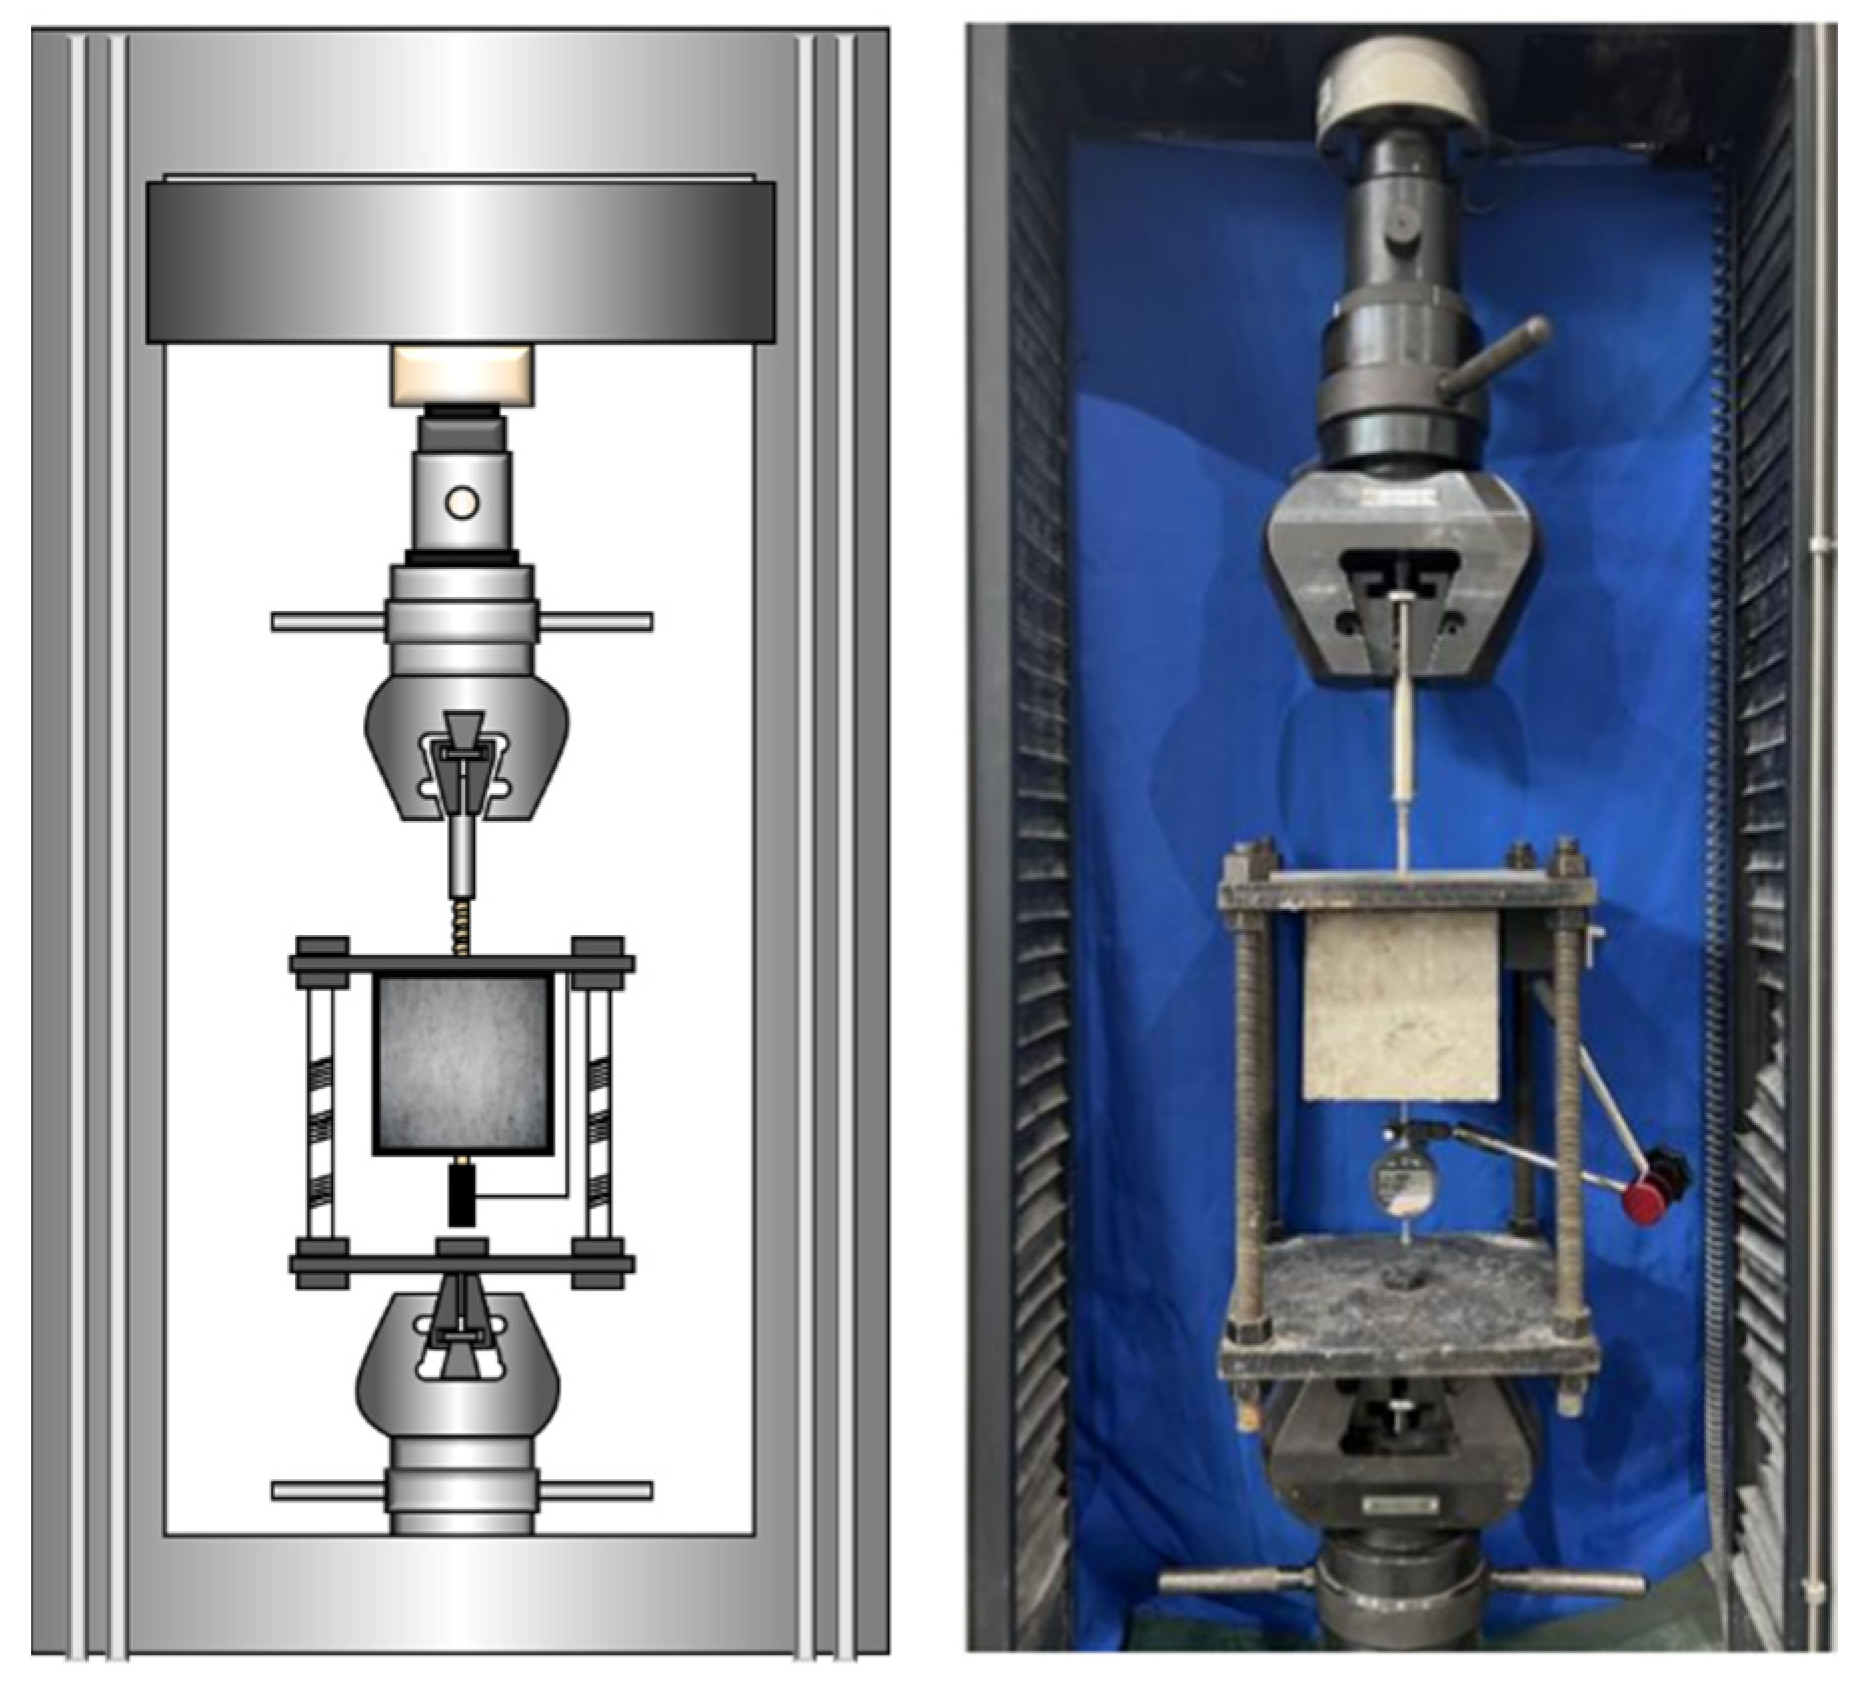
Figure 5.
Typical failure patterns of tested pull-out specimens. (a) Failure A pattern;(b) Failure B pattern.
Figure 5.
Typical failure patterns of tested pull-out specimens. (a) Failure A pattern;(b) Failure B pattern.
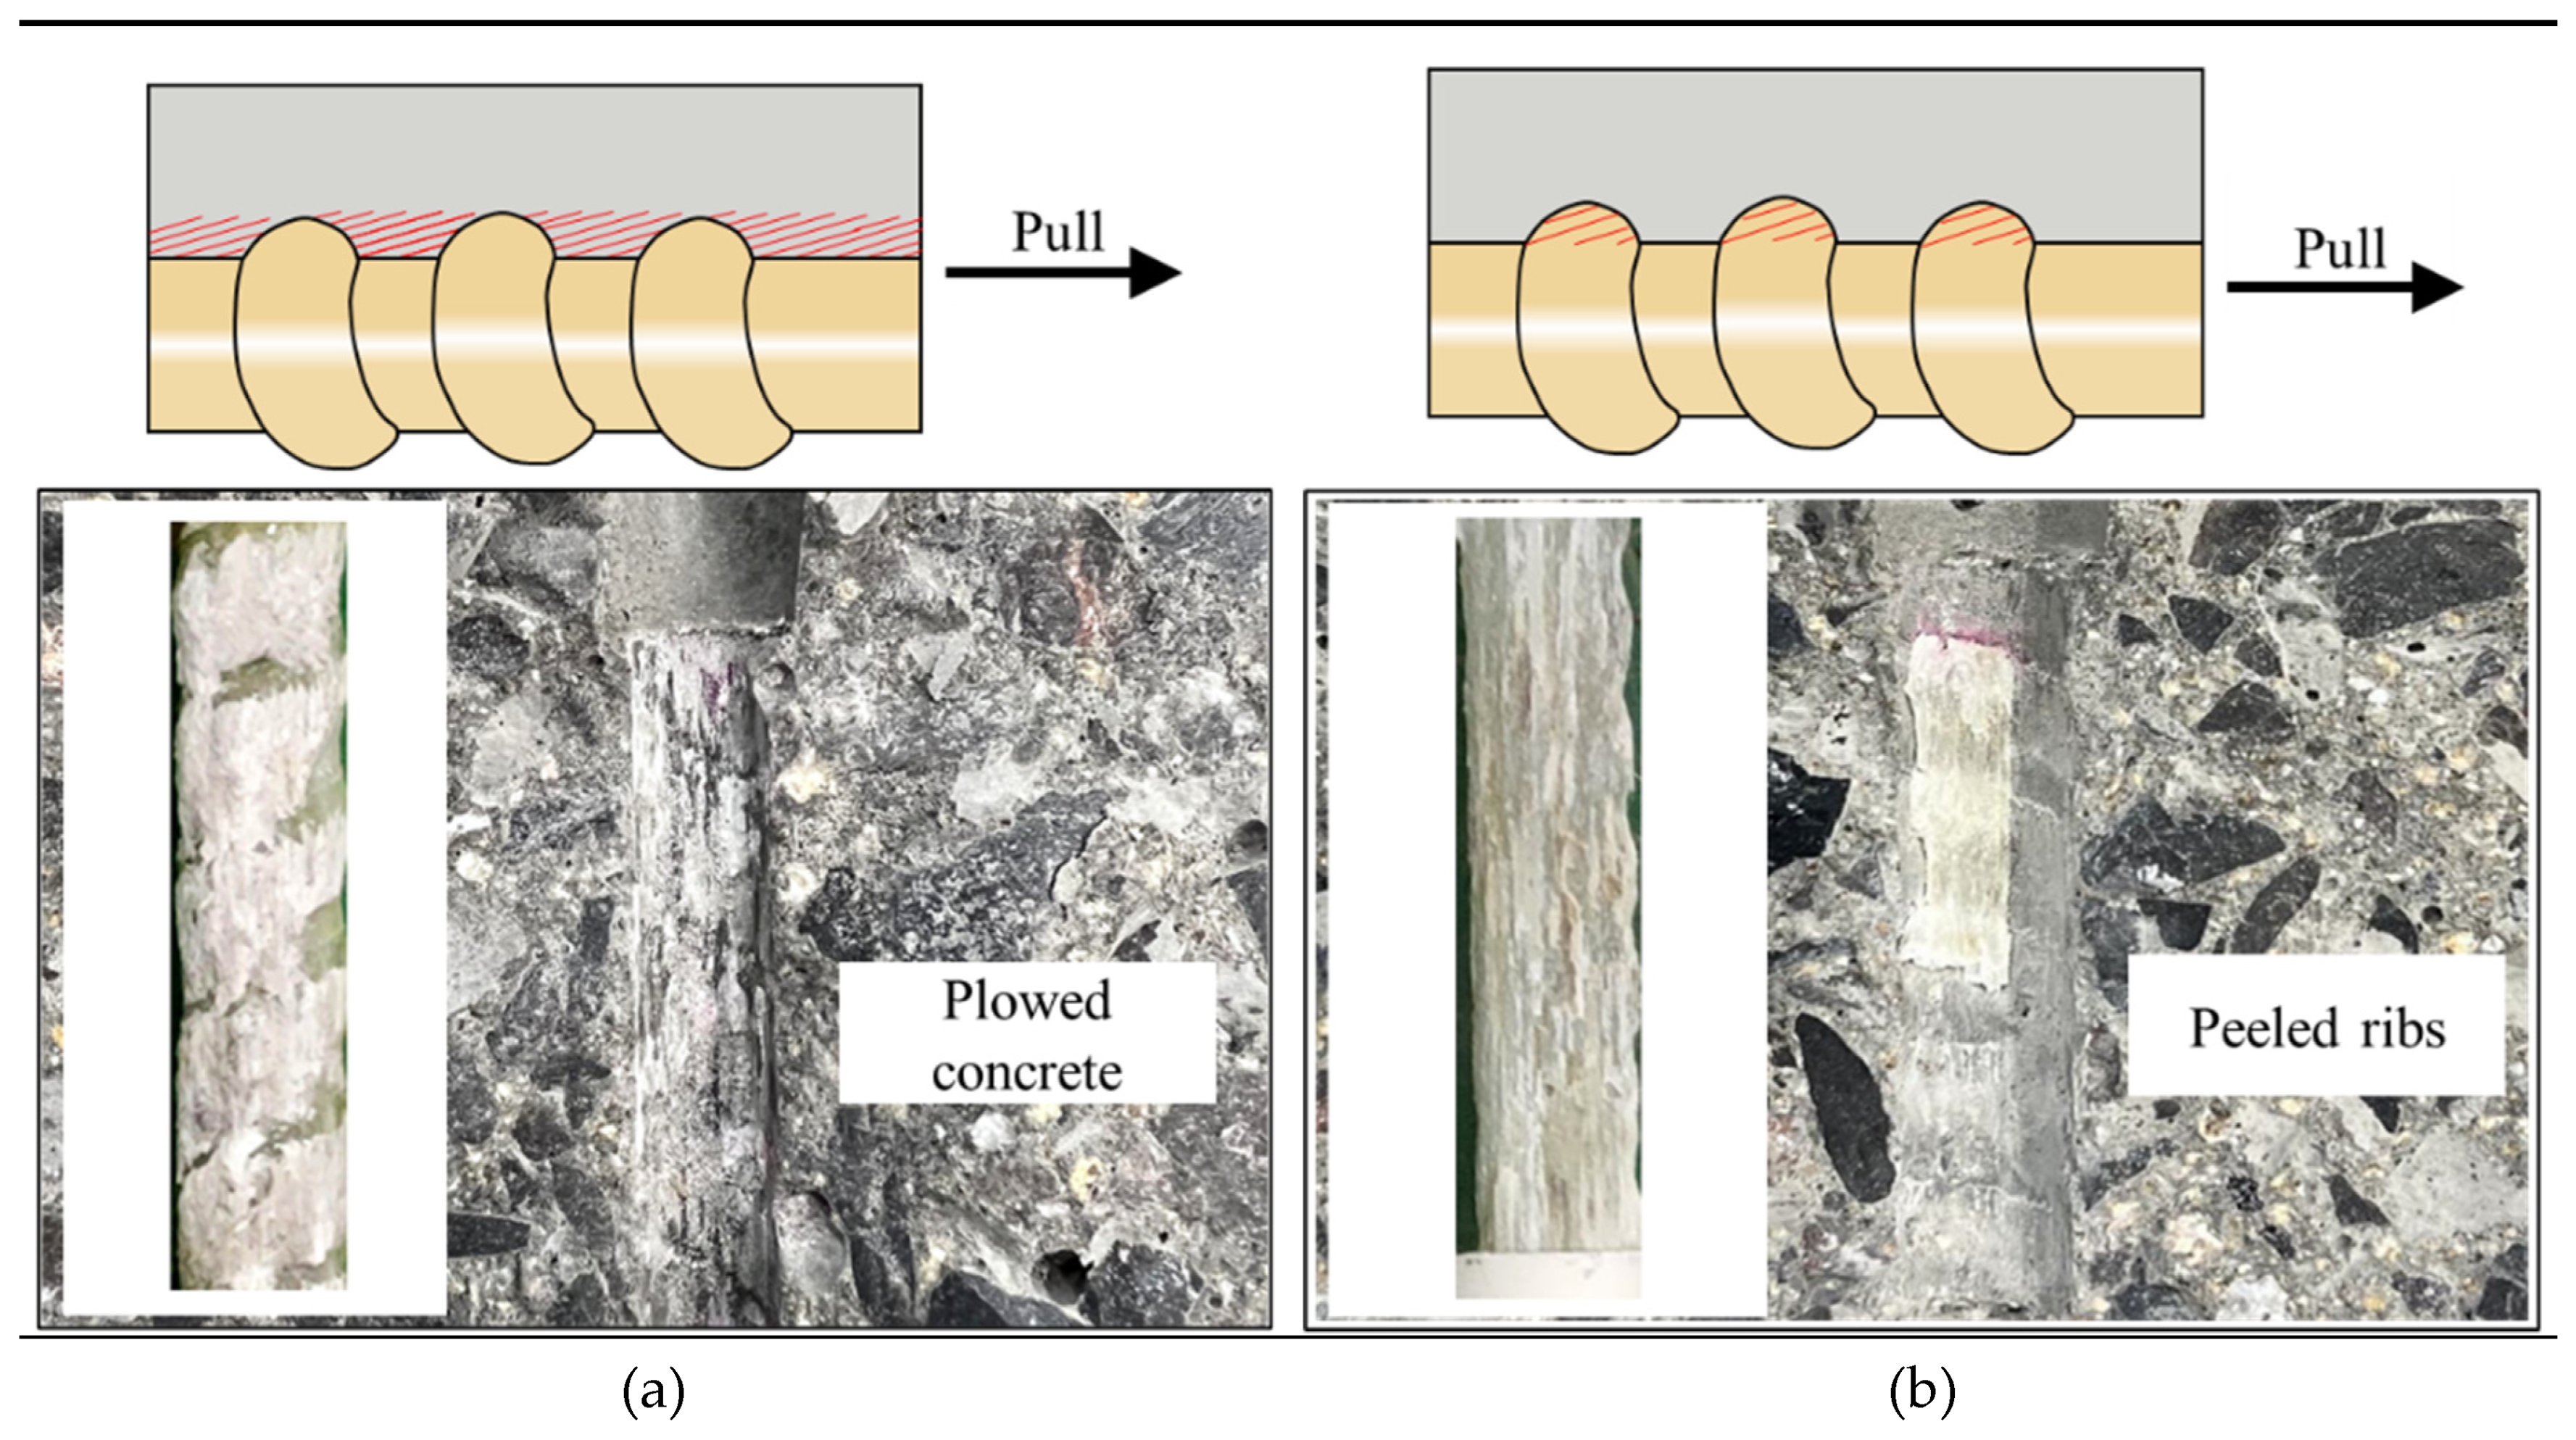
Figure 6.
Bond-slip curves of tested RG-5d and SG-5d specimens. (a) RG-5d-0 and SG-5d-0; (b) RG-5d-3 and SG-5d-3; (c) RG-5d-6 and SG-5d-6; (d) RG-5d-9 and SG-5d-9; (e) RG-5d-12 and SG-5d-12.
Figure 6.
Bond-slip curves of tested RG-5d and SG-5d specimens. (a) RG-5d-0 and SG-5d-0; (b) RG-5d-3 and SG-5d-3; (c) RG-5d-6 and SG-5d-6; (d) RG-5d-9 and SG-5d-9; (e) RG-5d-12 and SG-5d-12.
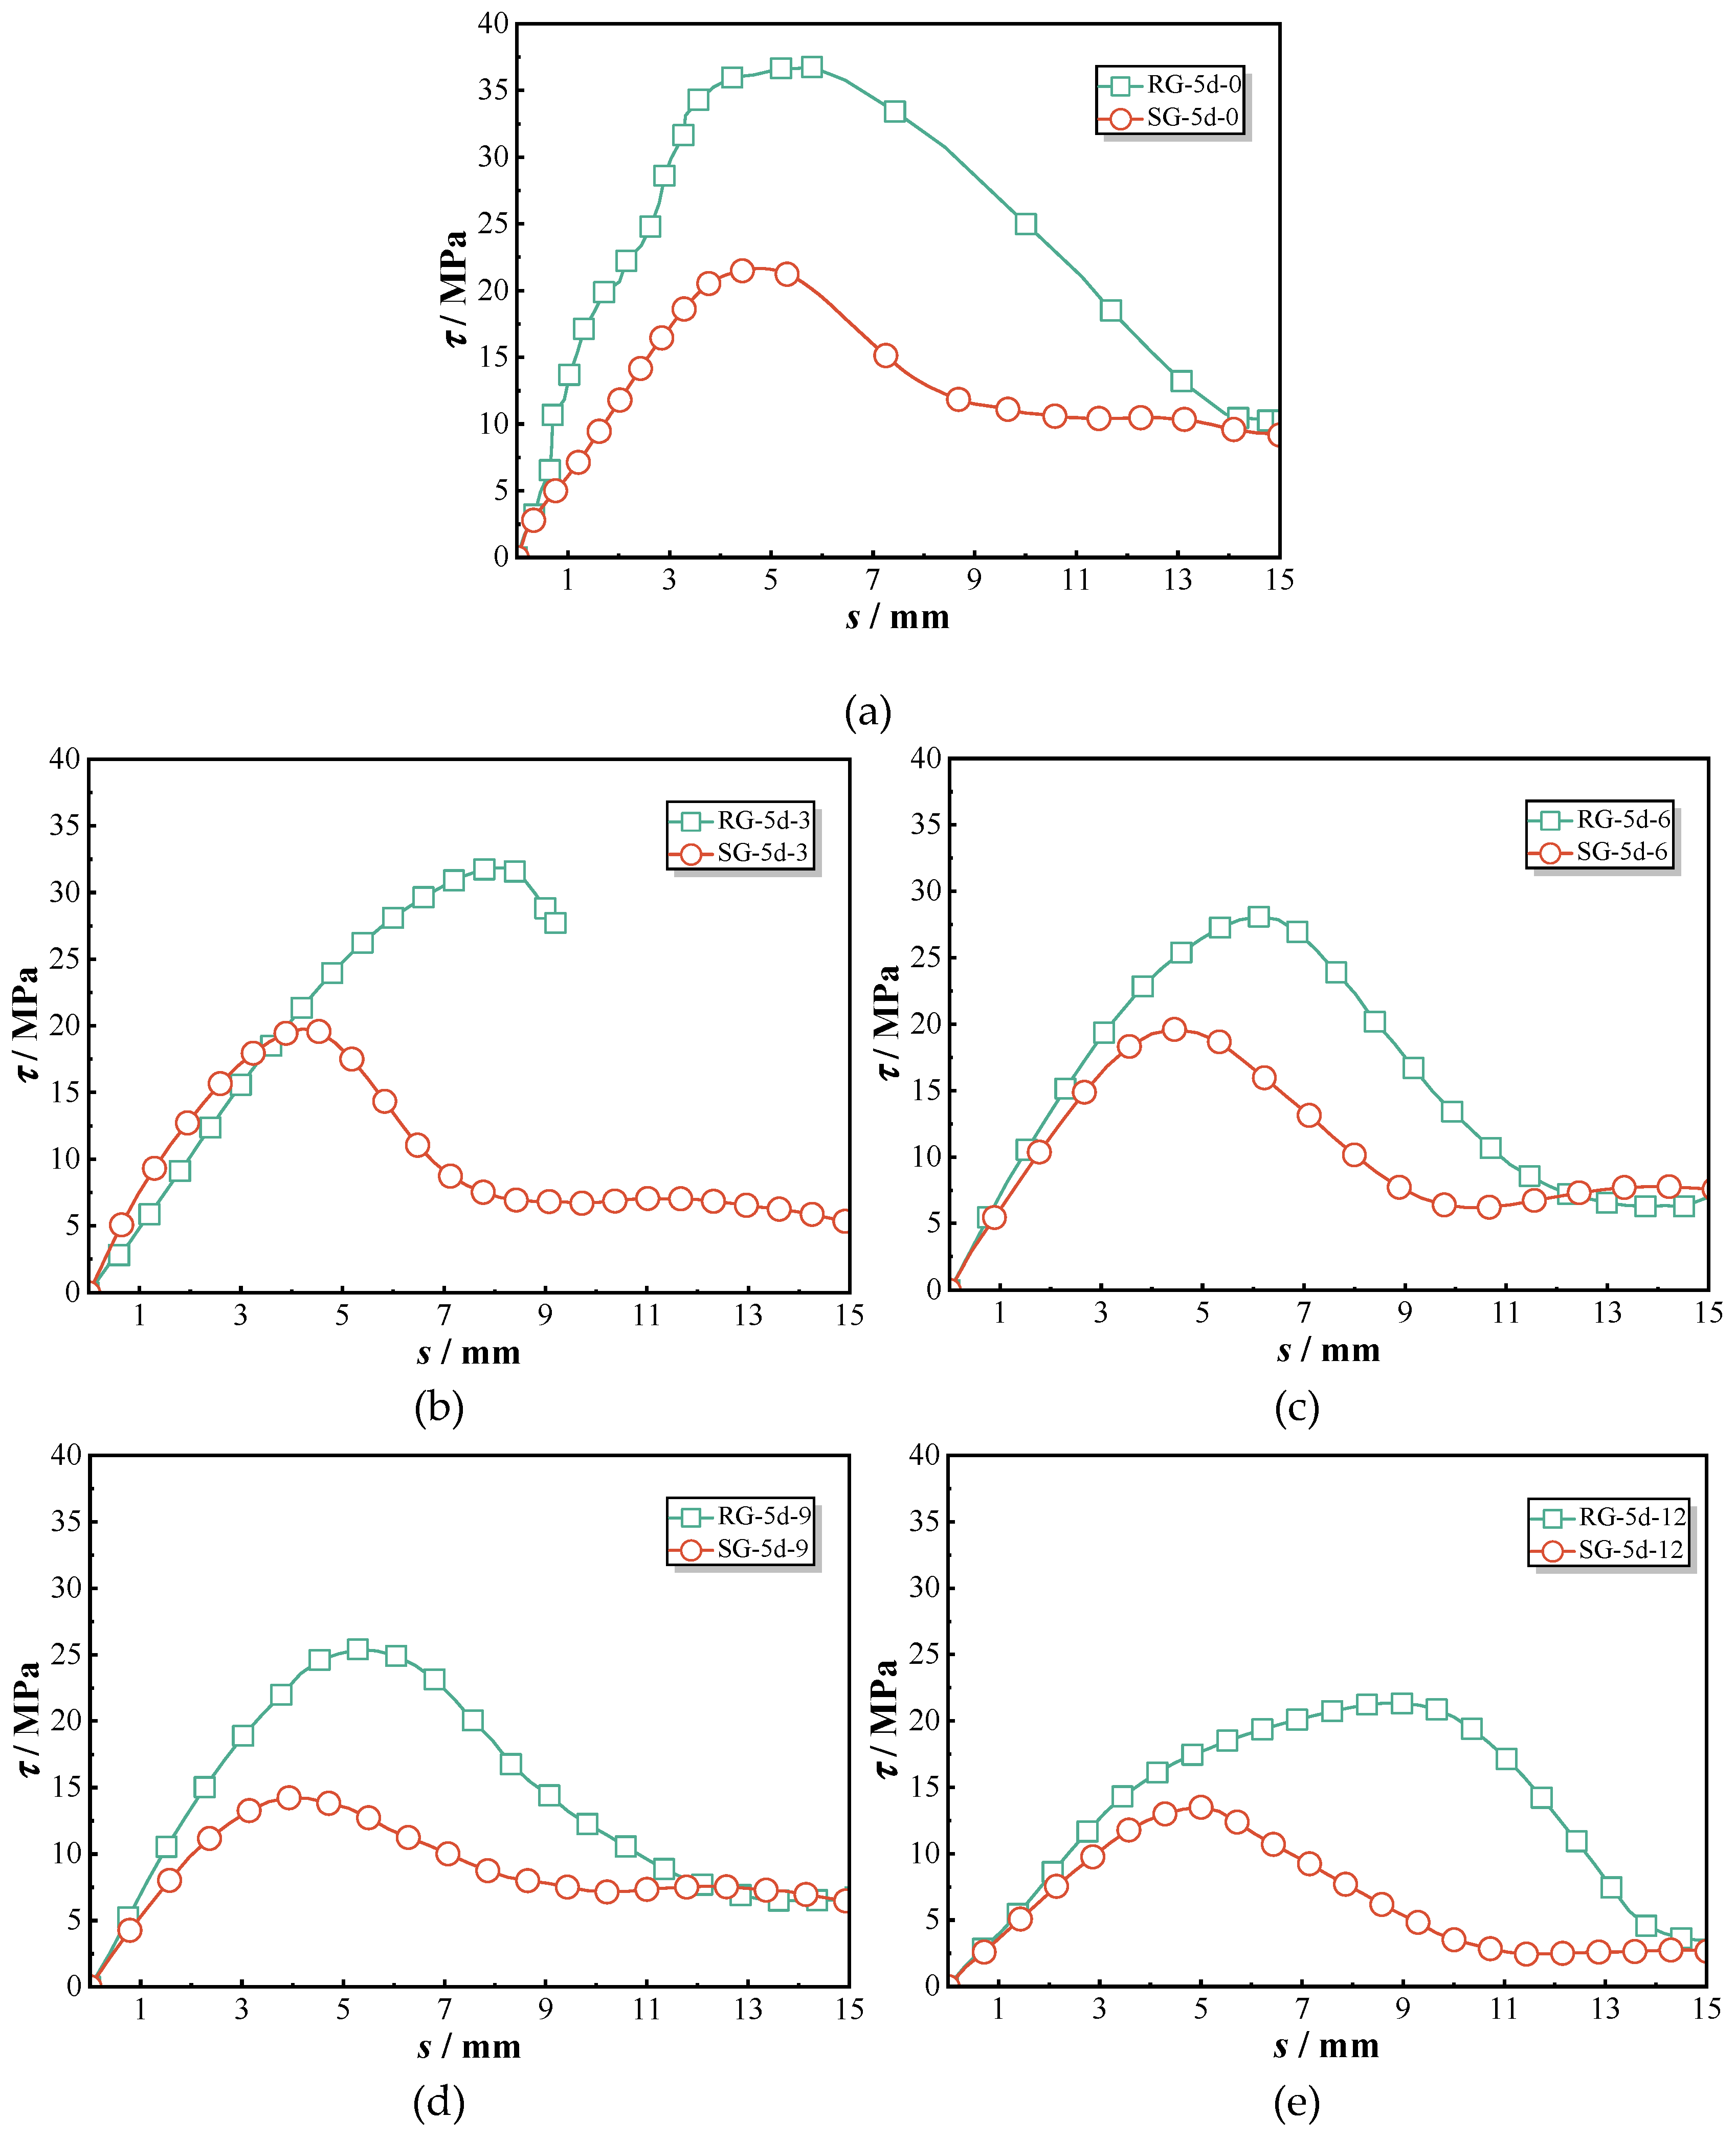
Figure 7.
Variations in peak bond strength and the corresponding slip of RG-5d and SG-5d specimens. (a) Peak bond strength; (b) Corresponding slip.
Figure 7.
Variations in peak bond strength and the corresponding slip of RG-5d and SG-5d specimens. (a) Peak bond strength; (b) Corresponding slip.
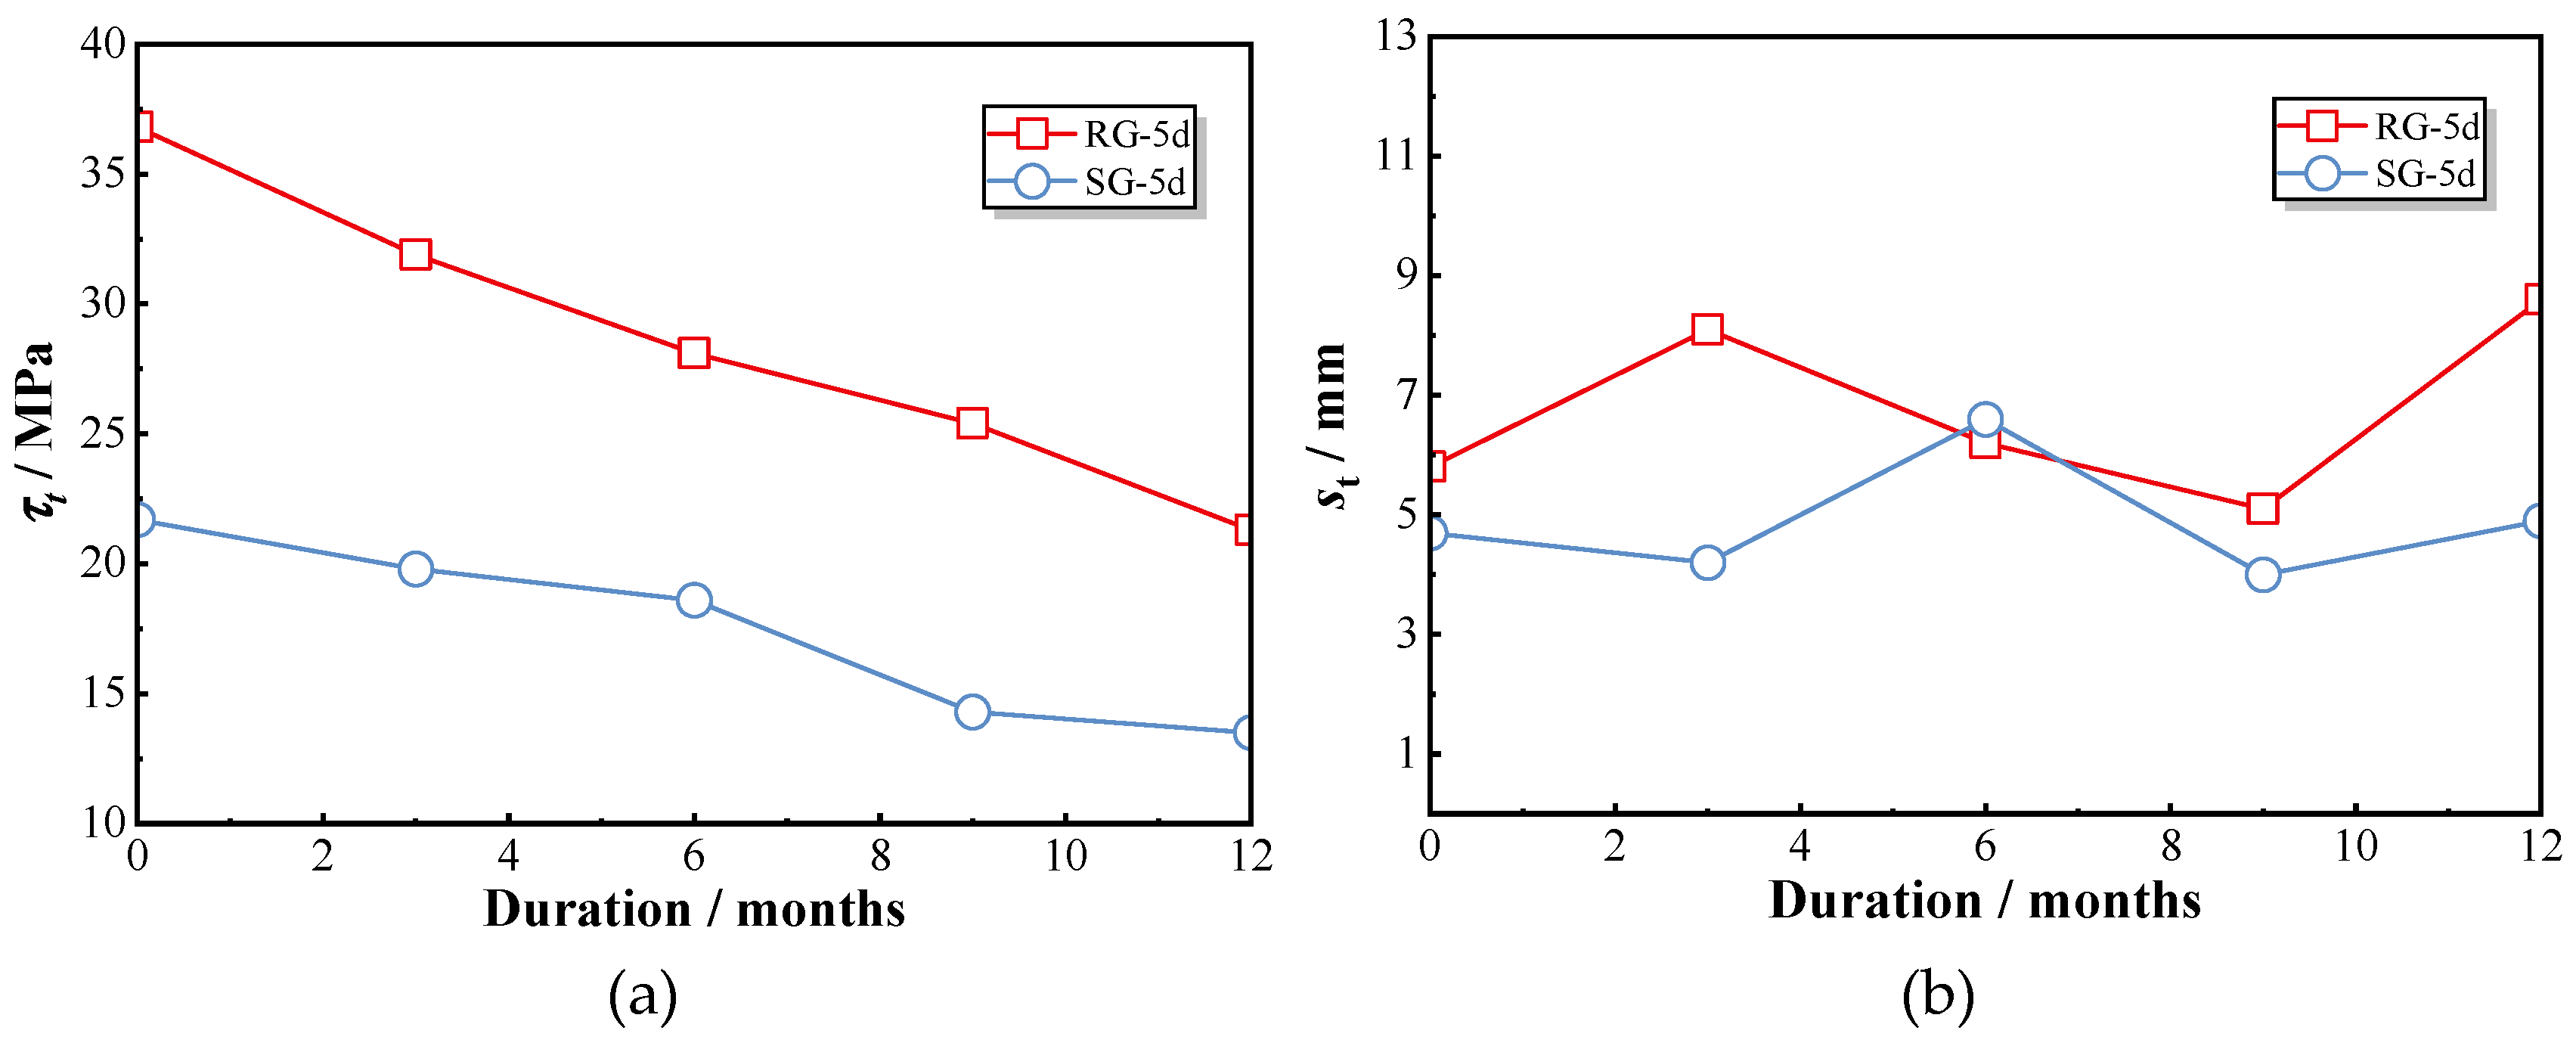
Figure 8.
Bond-slip curves of tested RG-5d and RG-7d specimens (a) RG-5d-0 and RG-7d-0; (b) RG-5d-3 and RG-7d-3; (c) RG-5d-6 and RG-7d-6; (d) RG-5d-9 and RG-7d-9(e) RG-5d-12 and RG-7d-12.
Figure 8.
Bond-slip curves of tested RG-5d and RG-7d specimens (a) RG-5d-0 and RG-7d-0; (b) RG-5d-3 and RG-7d-3; (c) RG-5d-6 and RG-7d-6; (d) RG-5d-9 and RG-7d-9(e) RG-5d-12 and RG-7d-12.
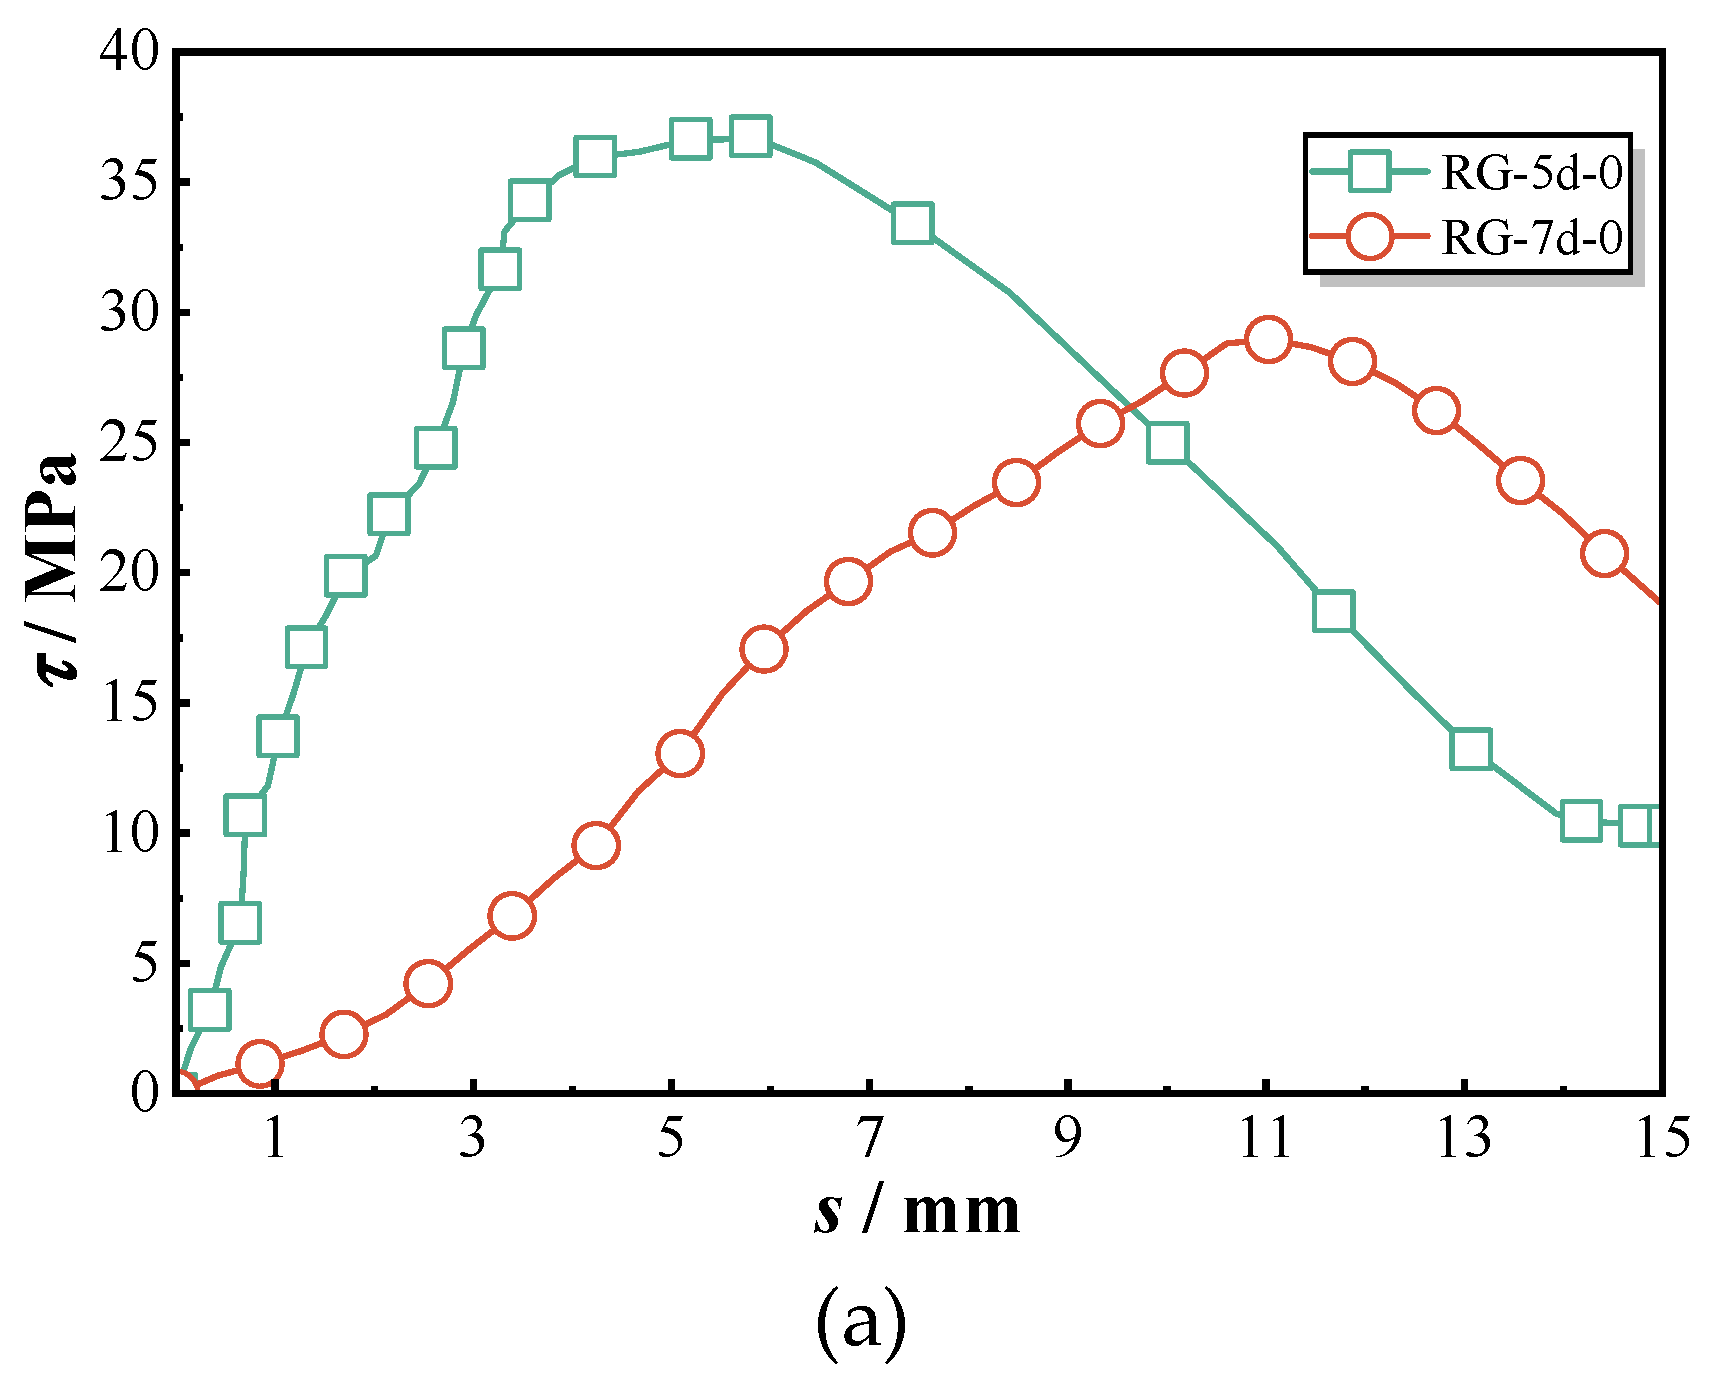
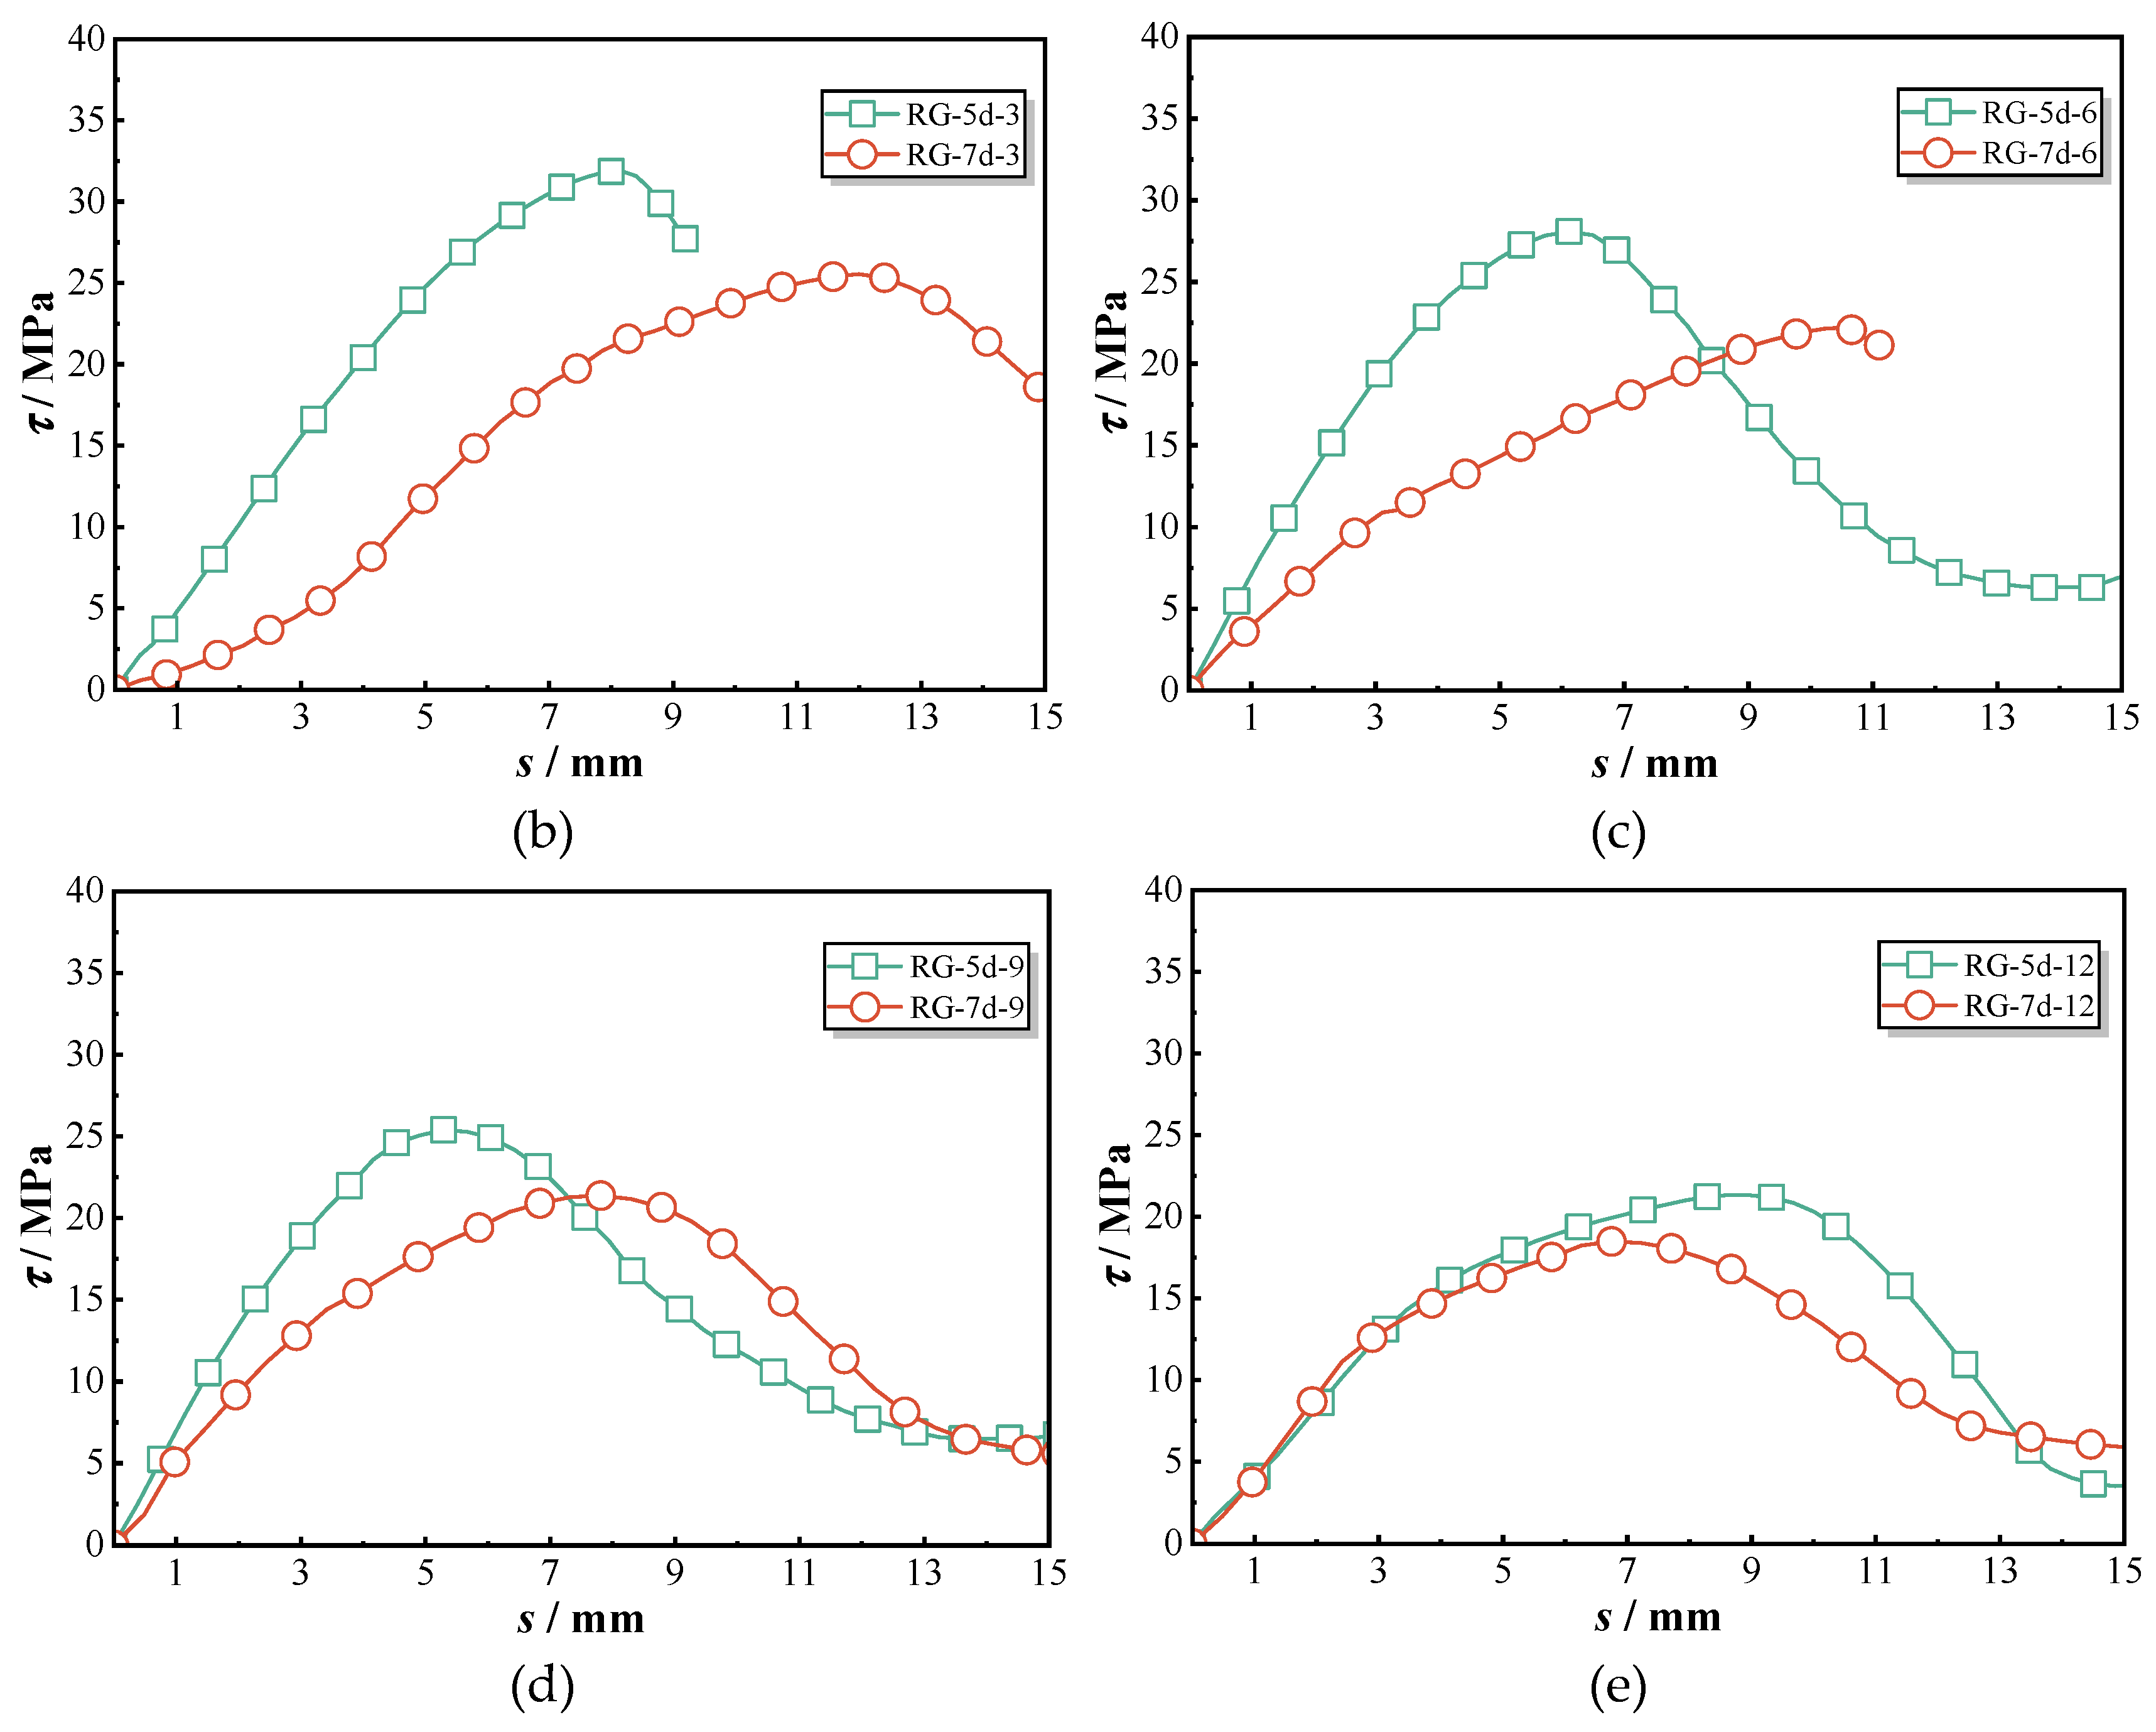
Figure 9.
Variations in peak bond strength and the corresponding slip of RG-5d and RG-7d specimens. (a) Peak bond strength; (b) Corresponding slip.
Figure 9.
Variations in peak bond strength and the corresponding slip of RG-5d and RG-7d specimens. (a) Peak bond strength; (b) Corresponding slip.
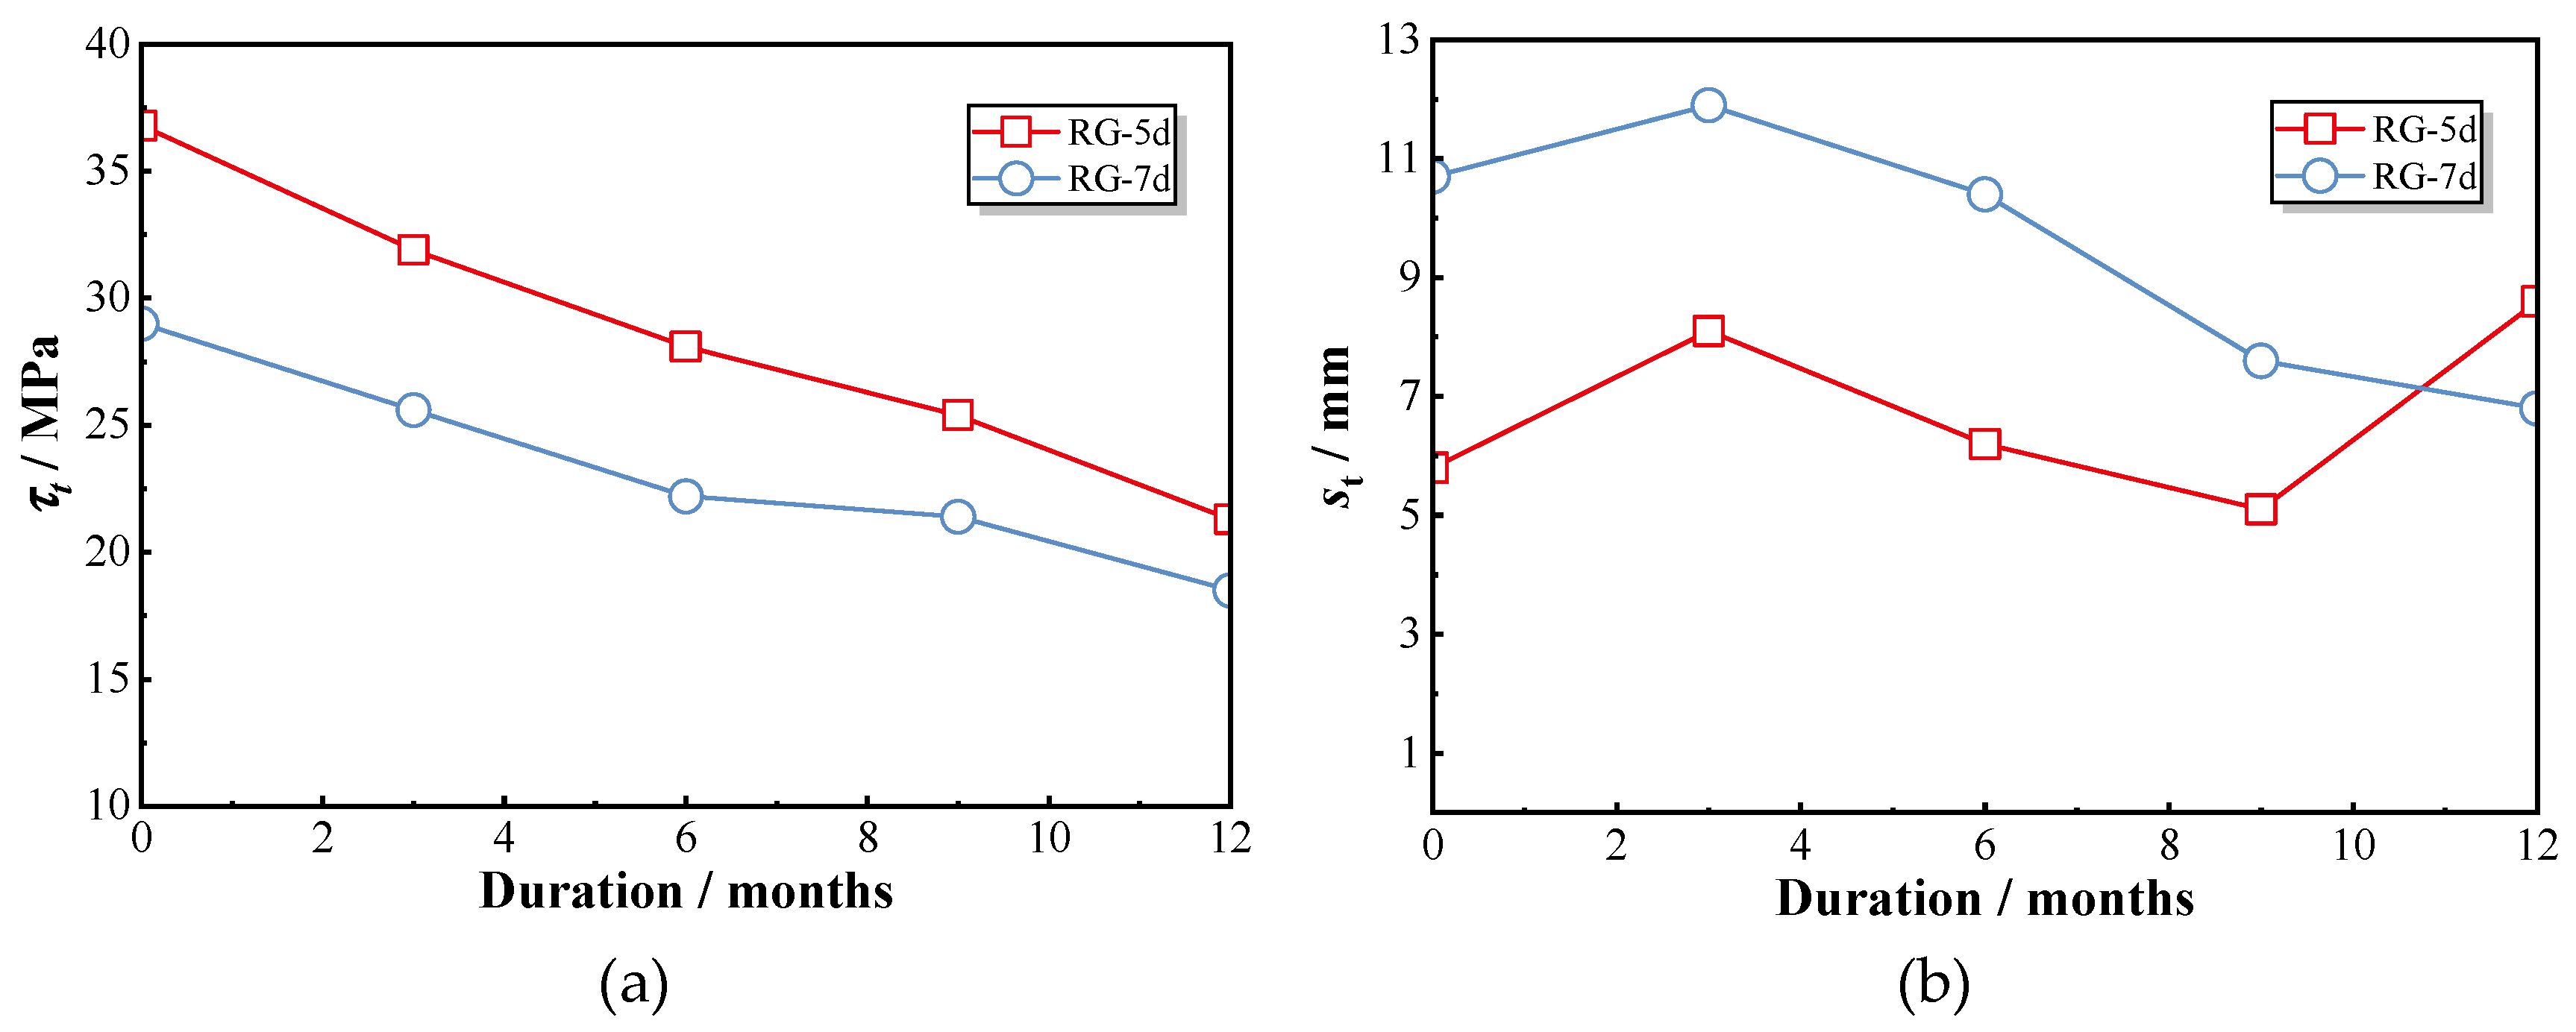
Figure 10.
Bond-slip curves of all tested specimens. (a) RG-5d group; (b) SG-5d group; (c) RG-7d group.
Figure 10.
Bond-slip curves of all tested specimens. (a) RG-5d group; (b) SG-5d group; (c) RG-7d group.
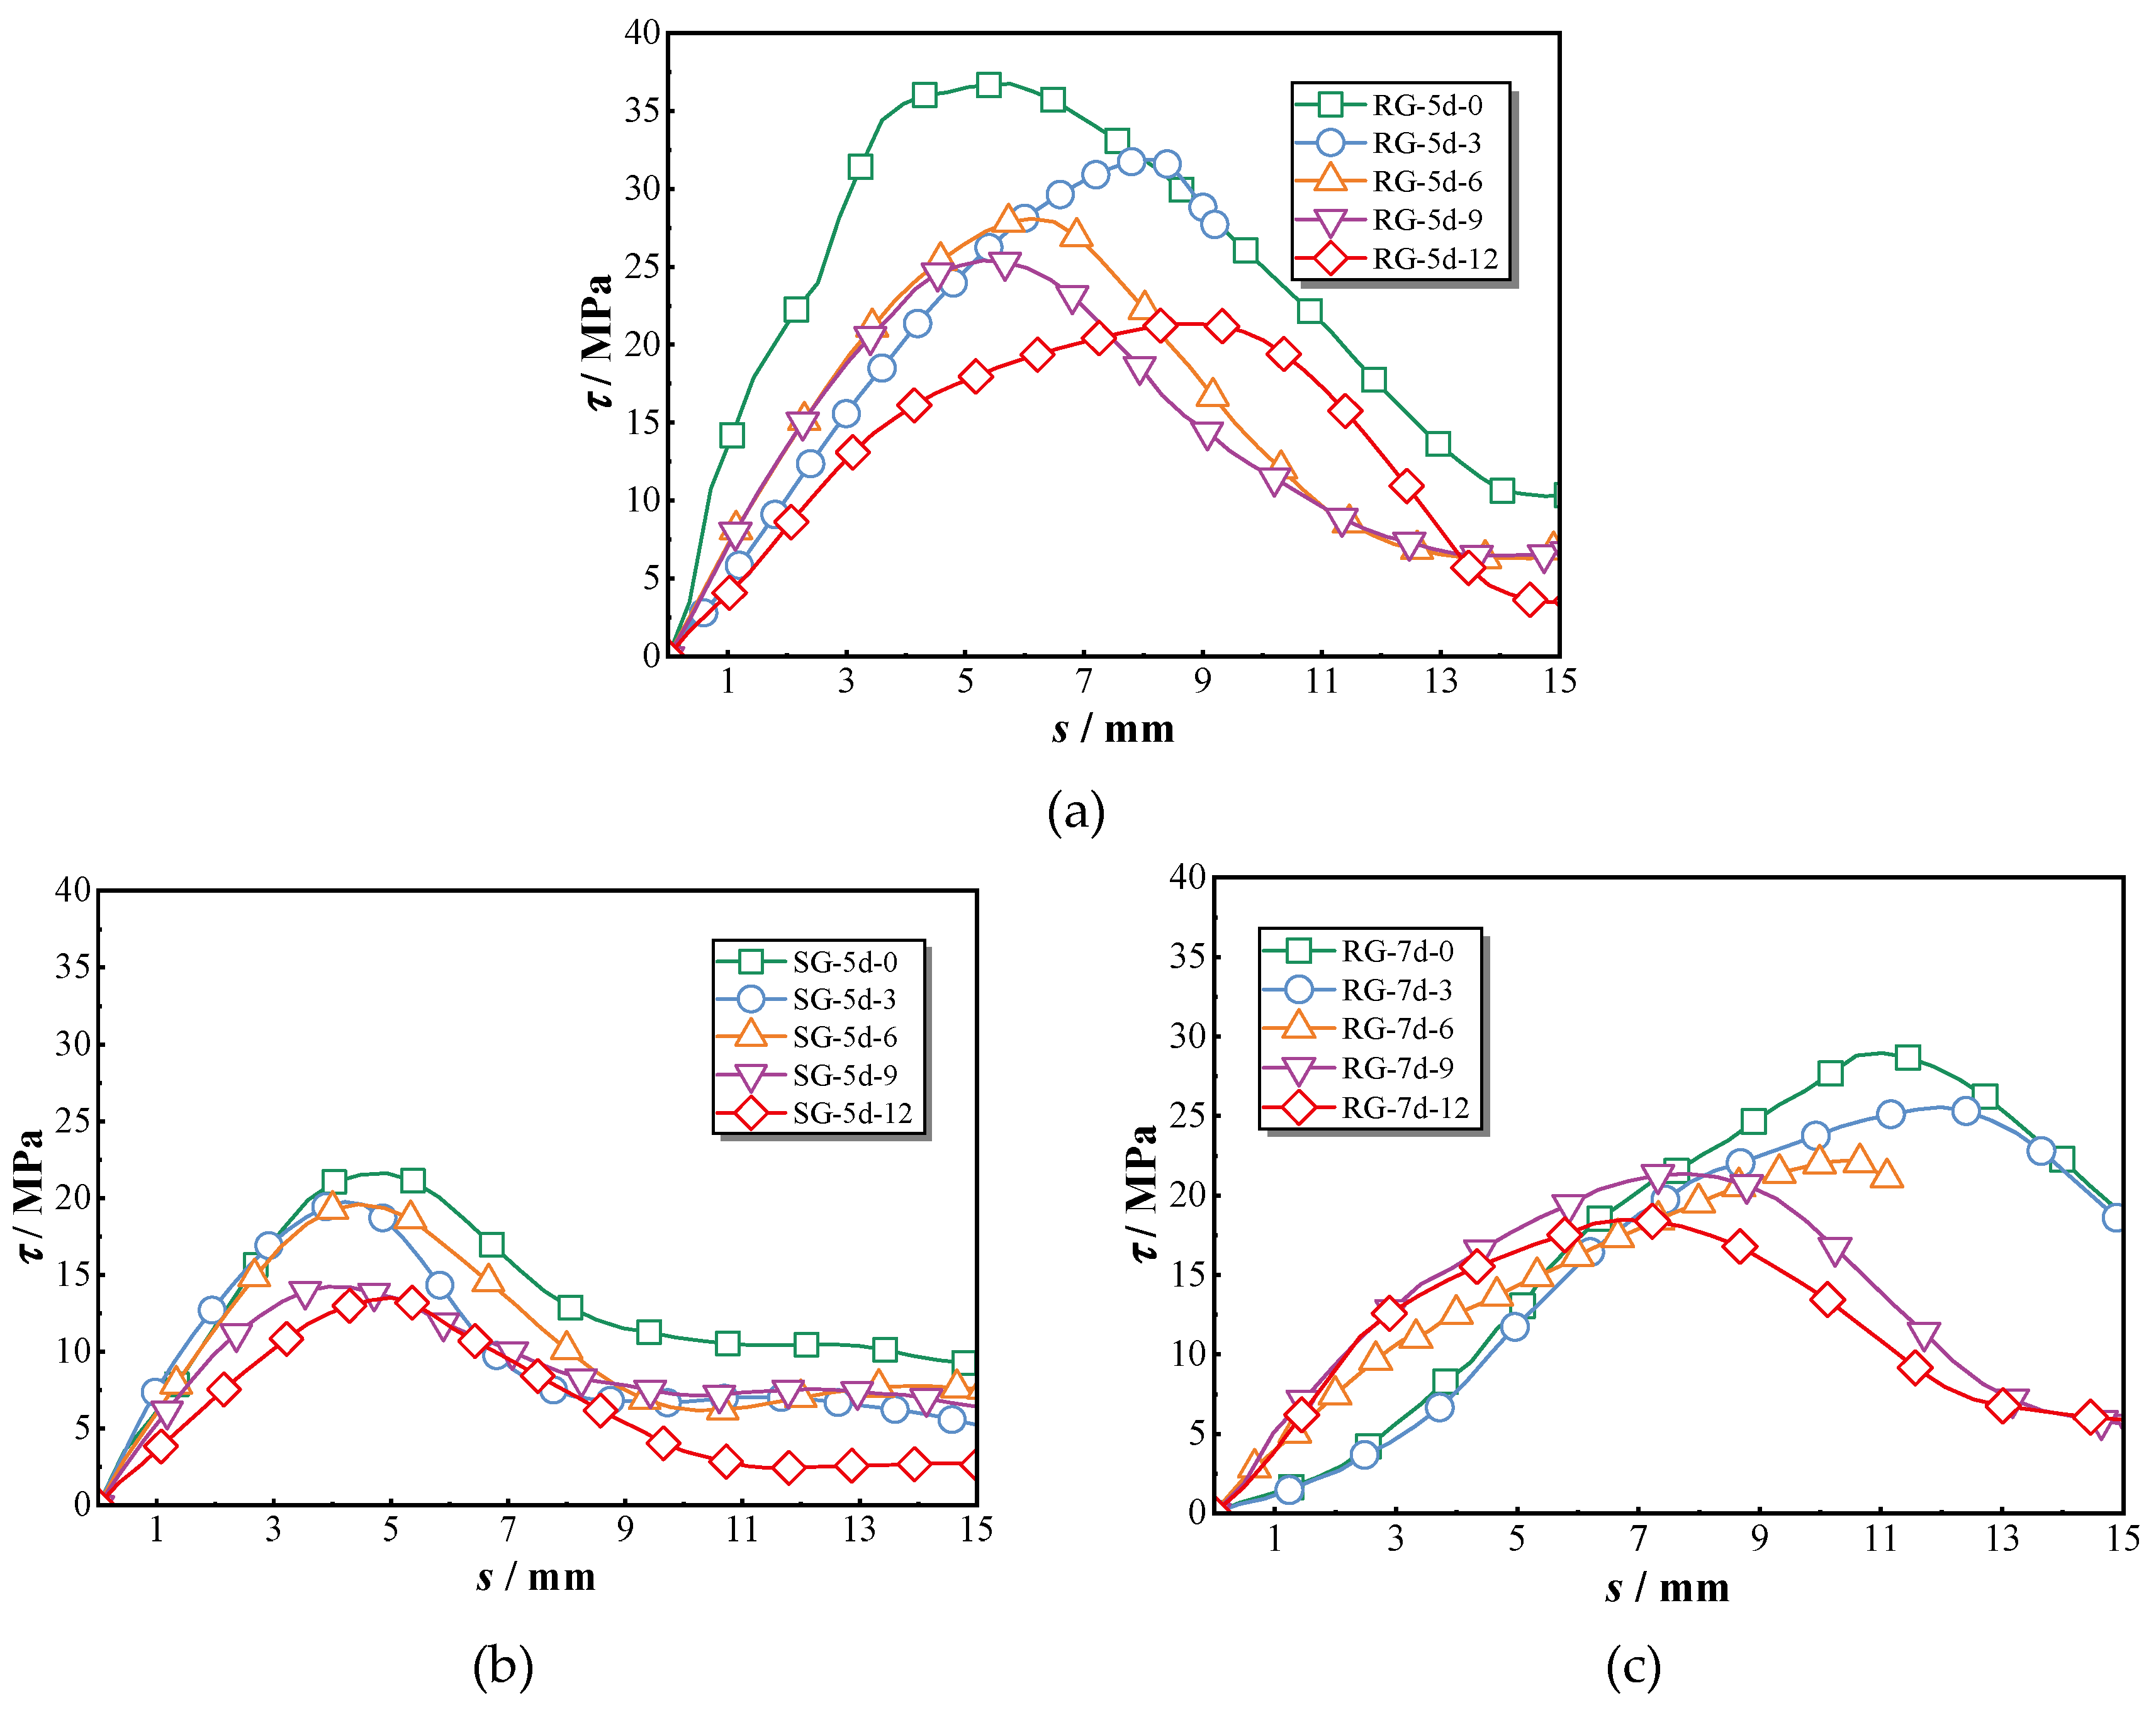
Figure 11.
Variations in peak bond strength and the corresponding slip of all tested specimens. (a) Peak bond strength; (b) Corresponding slip.
Figure 11.
Variations in peak bond strength and the corresponding slip of all tested specimens. (a) Peak bond strength; (b) Corresponding slip.
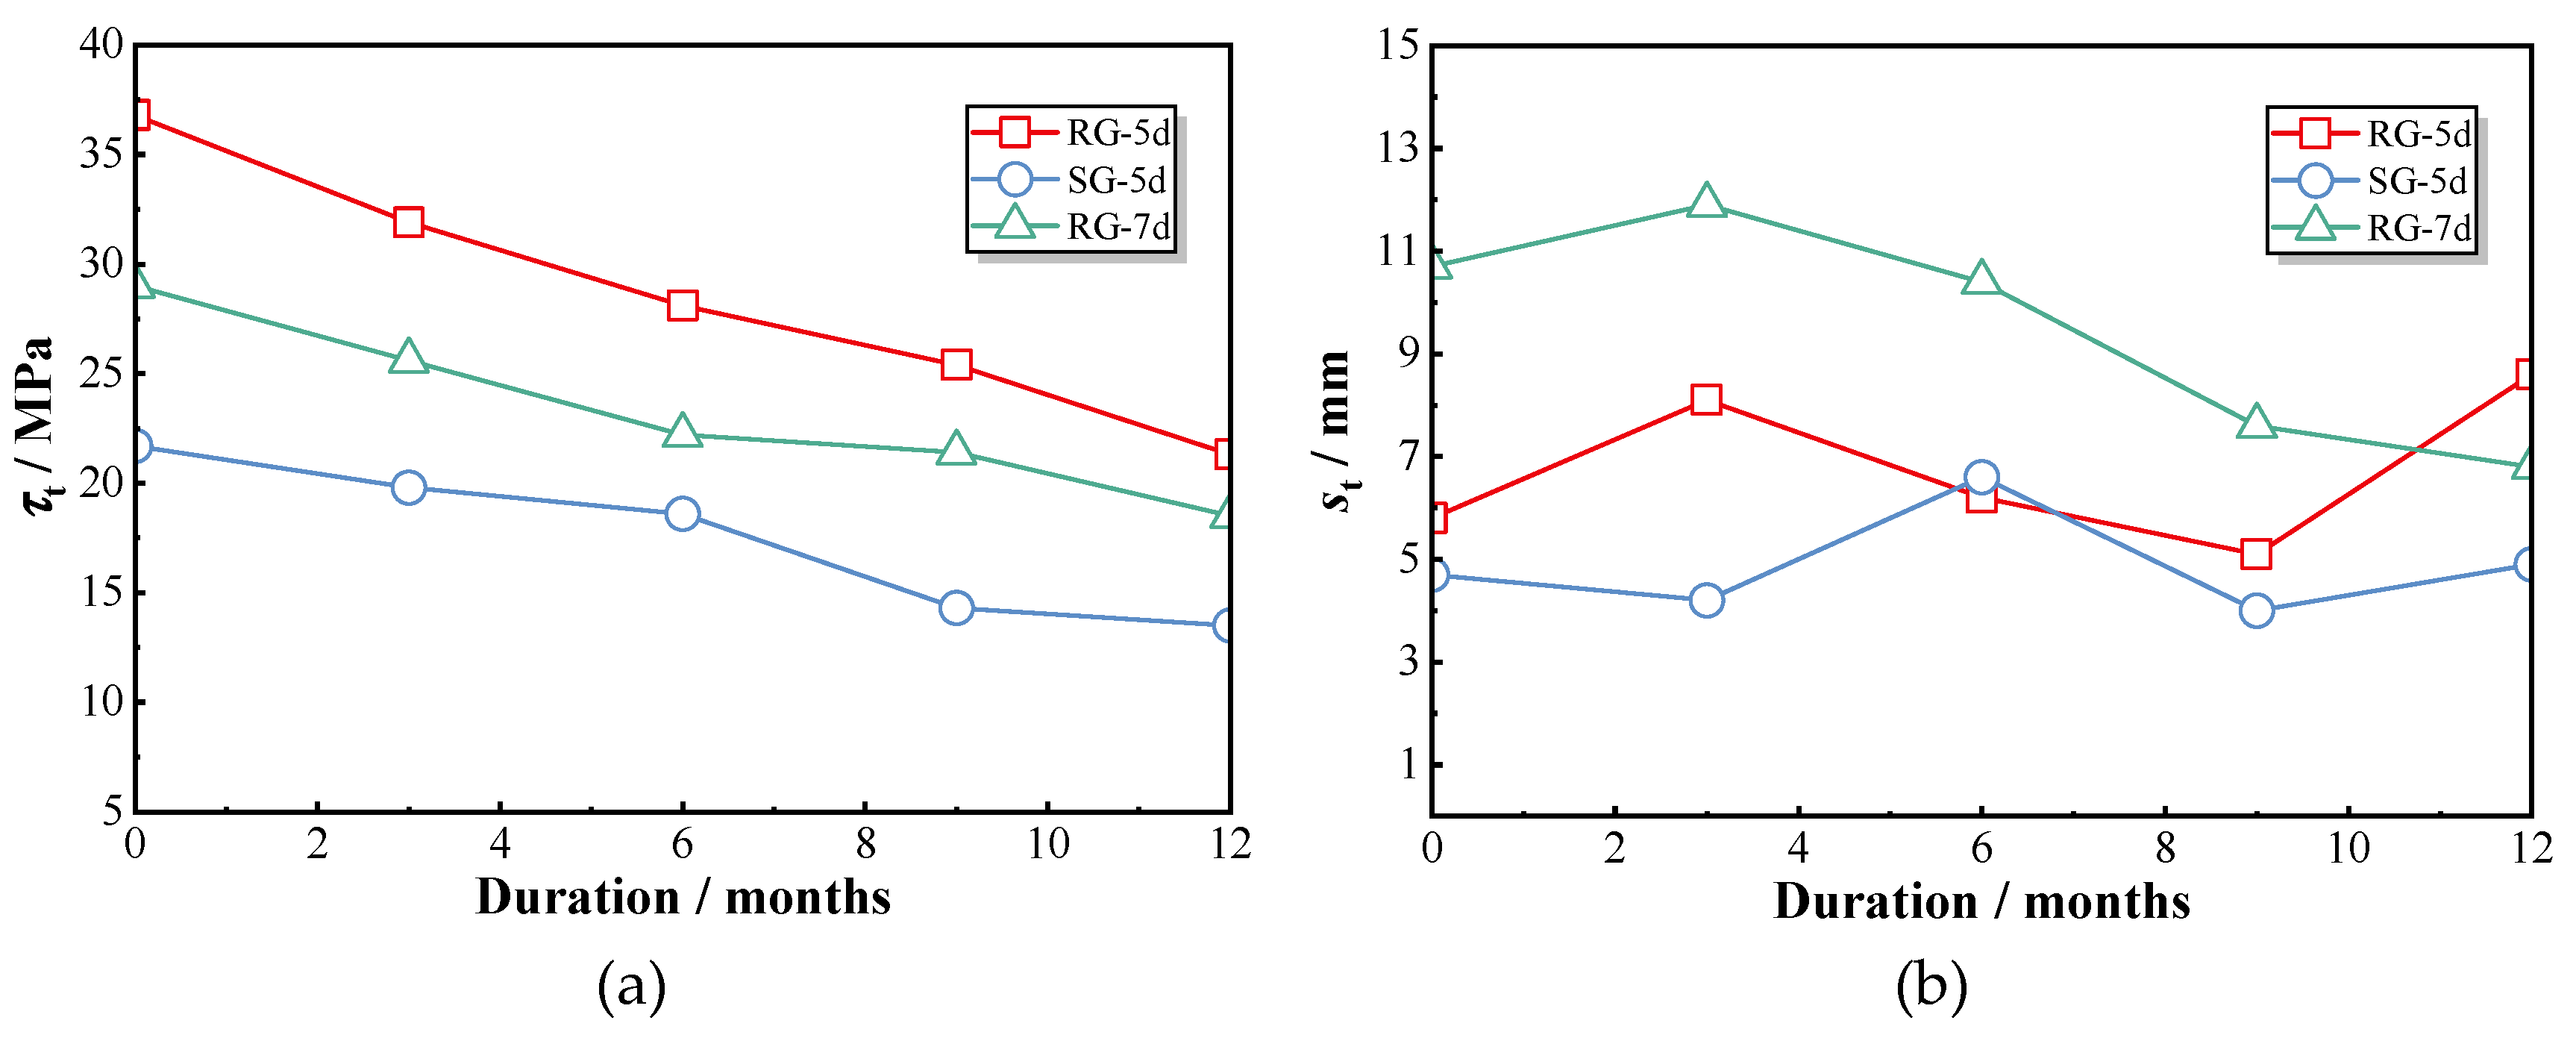
Figure 12.
Comparison of bond strength with concrete compressive strength in retention rate.
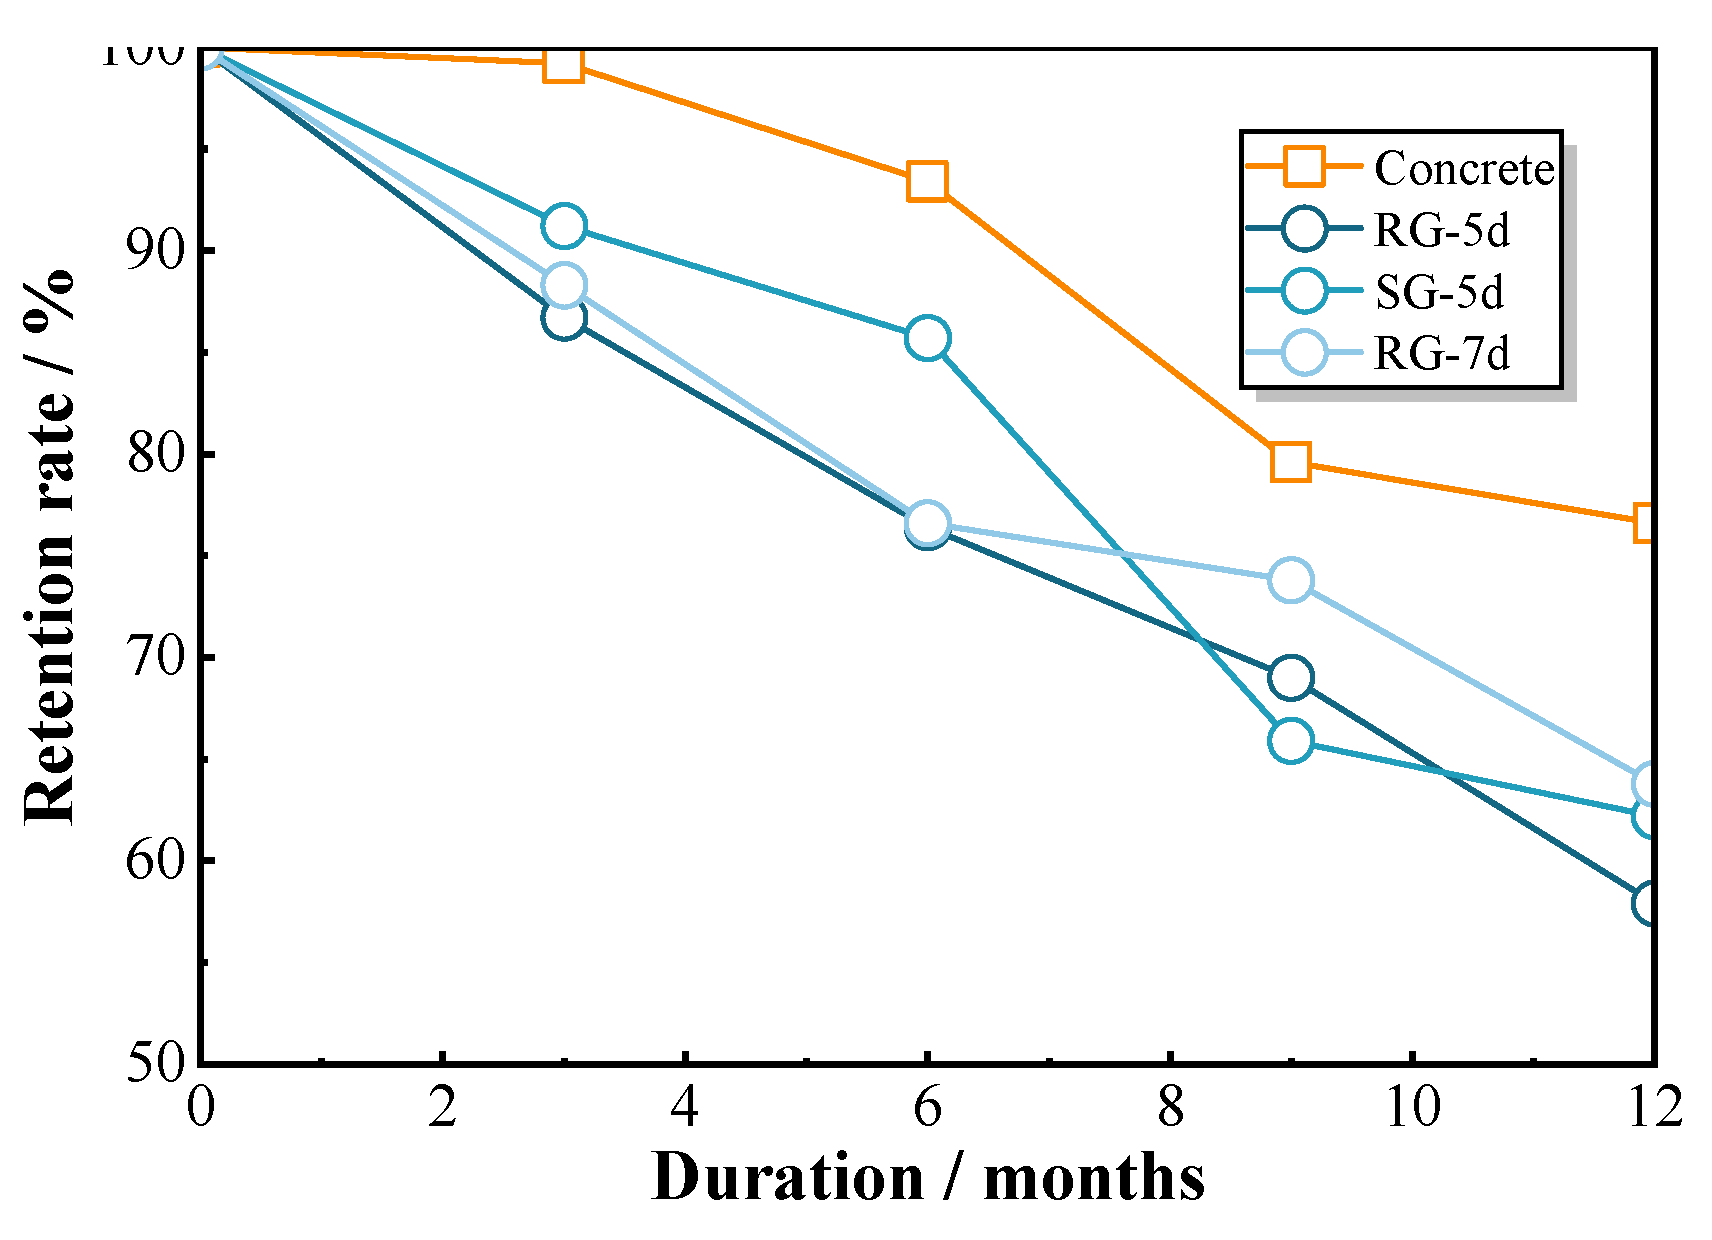
Figure 13.
Three stages for the ascending portion in the bond-slip curve.
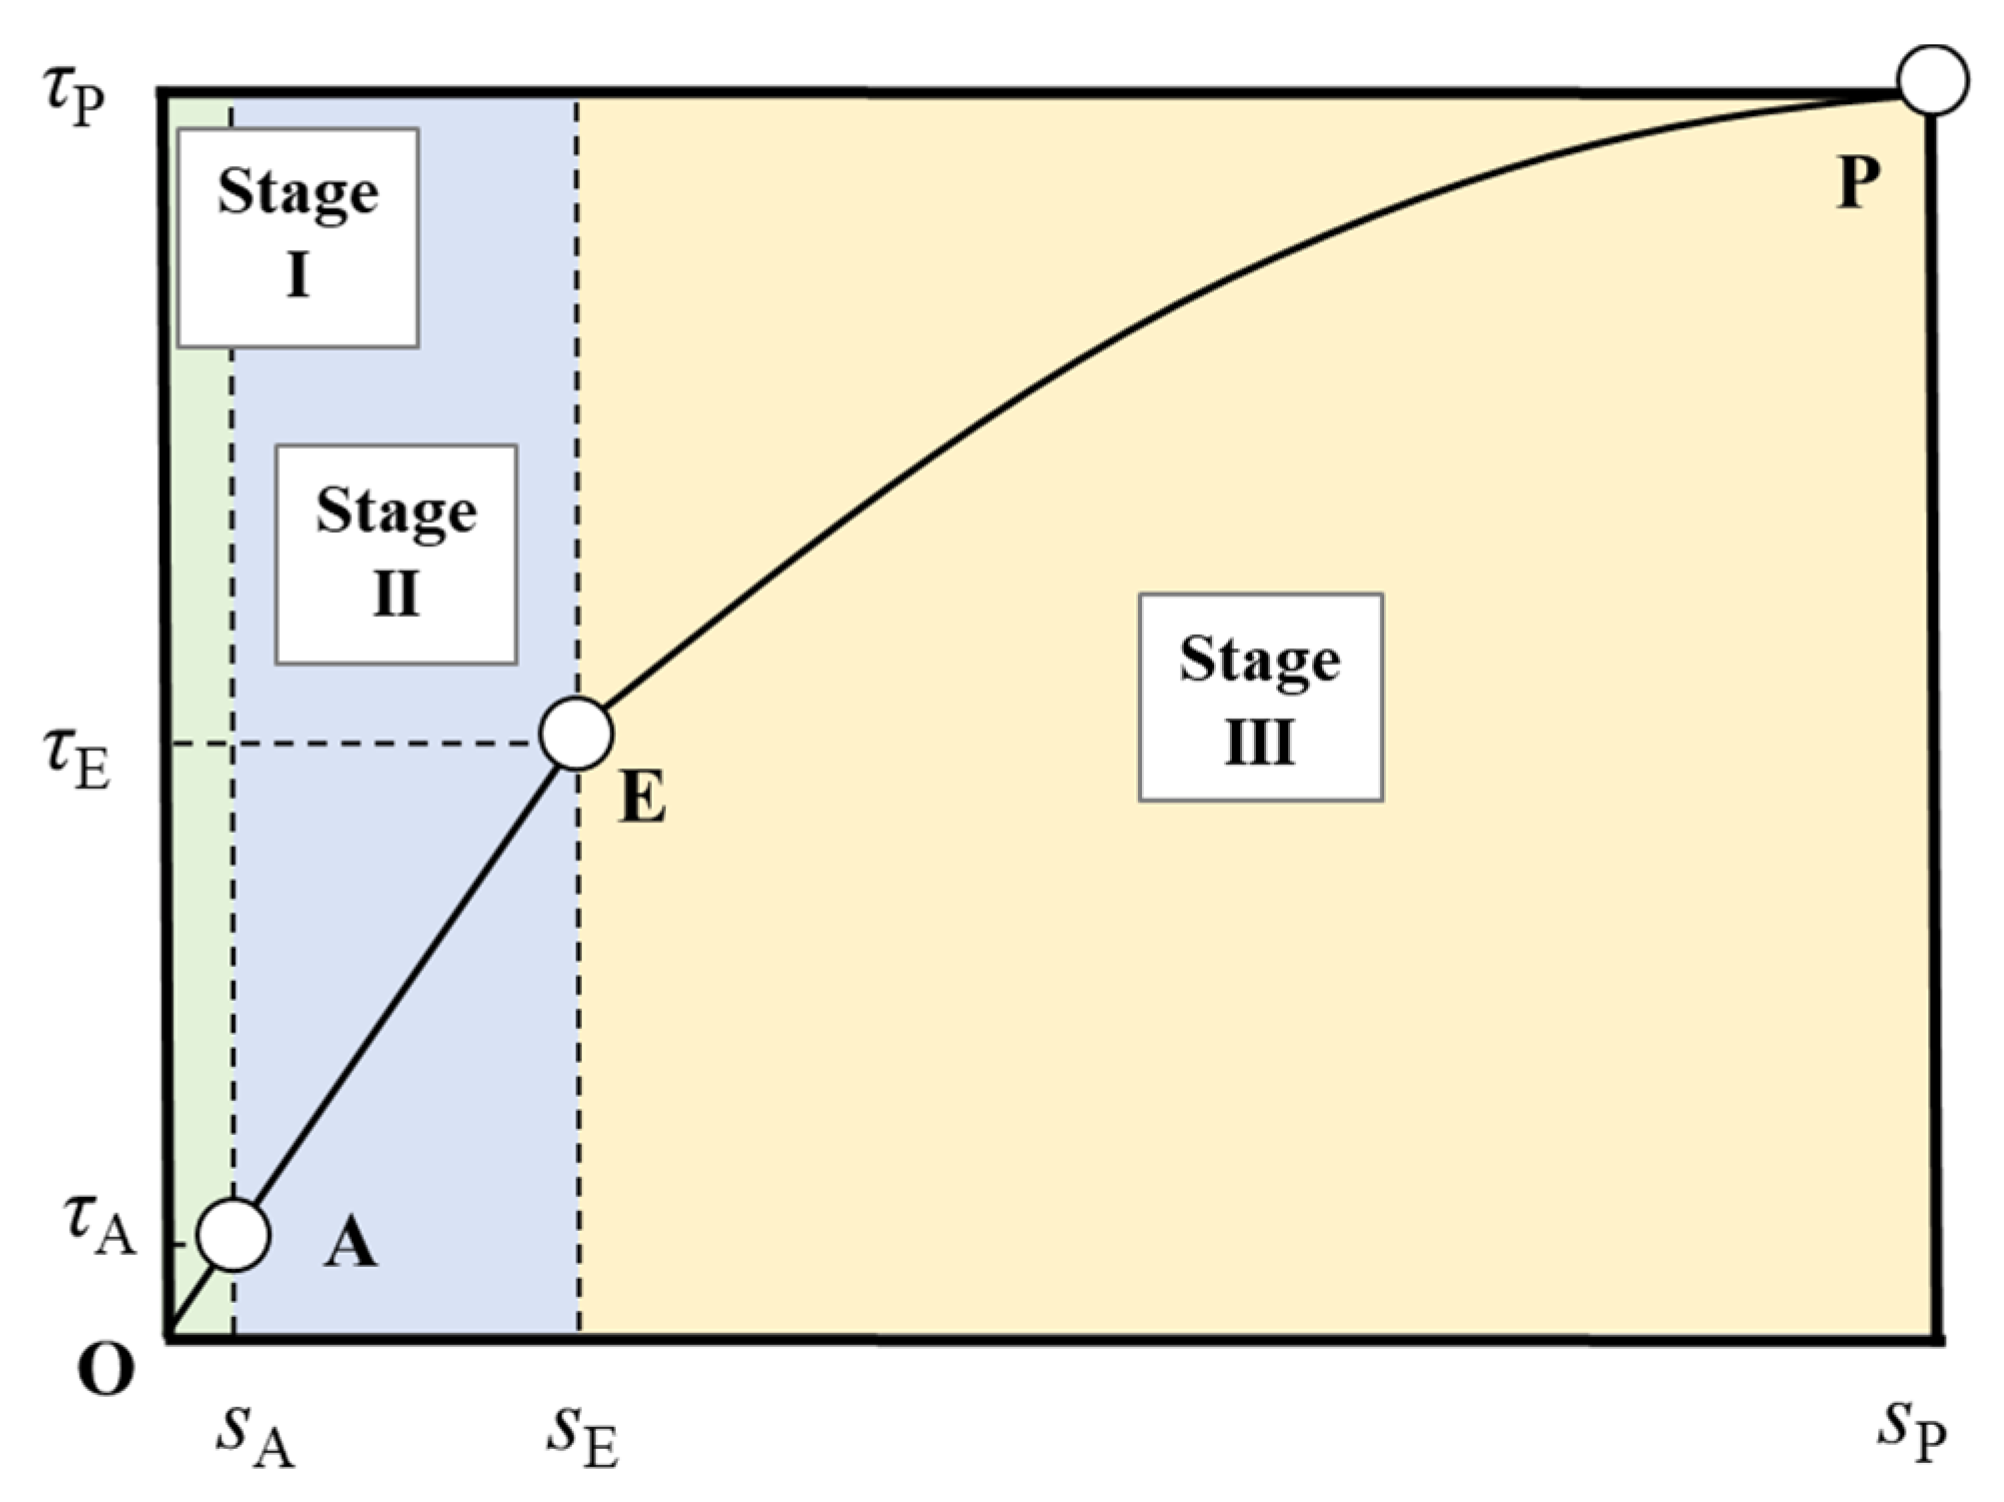
Figure 14.
Schematic diagram illustrating slip generation and force generation on a single rib. (a) slip generation; (b) force generation.
Figure 14.
Schematic diagram illustrating slip generation and force generation on a single rib. (a) slip generation; (b) force generation.
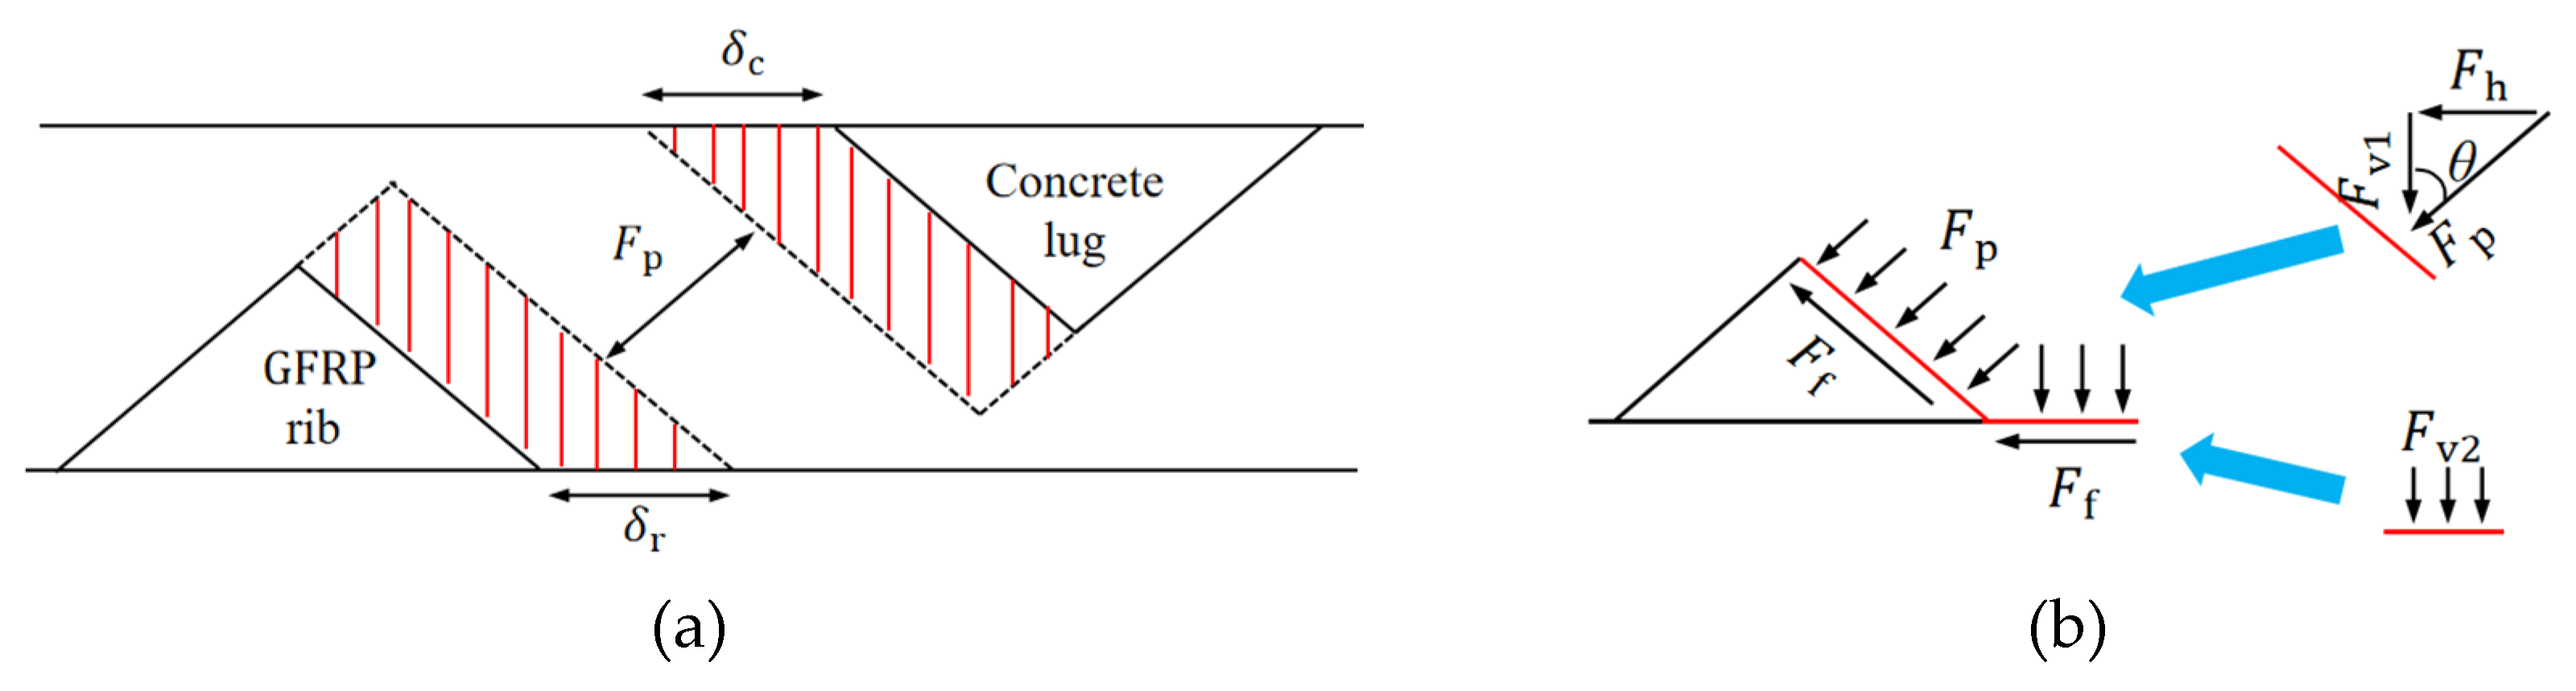
Figure 15.
Force diagram of deformed GFRP bars.
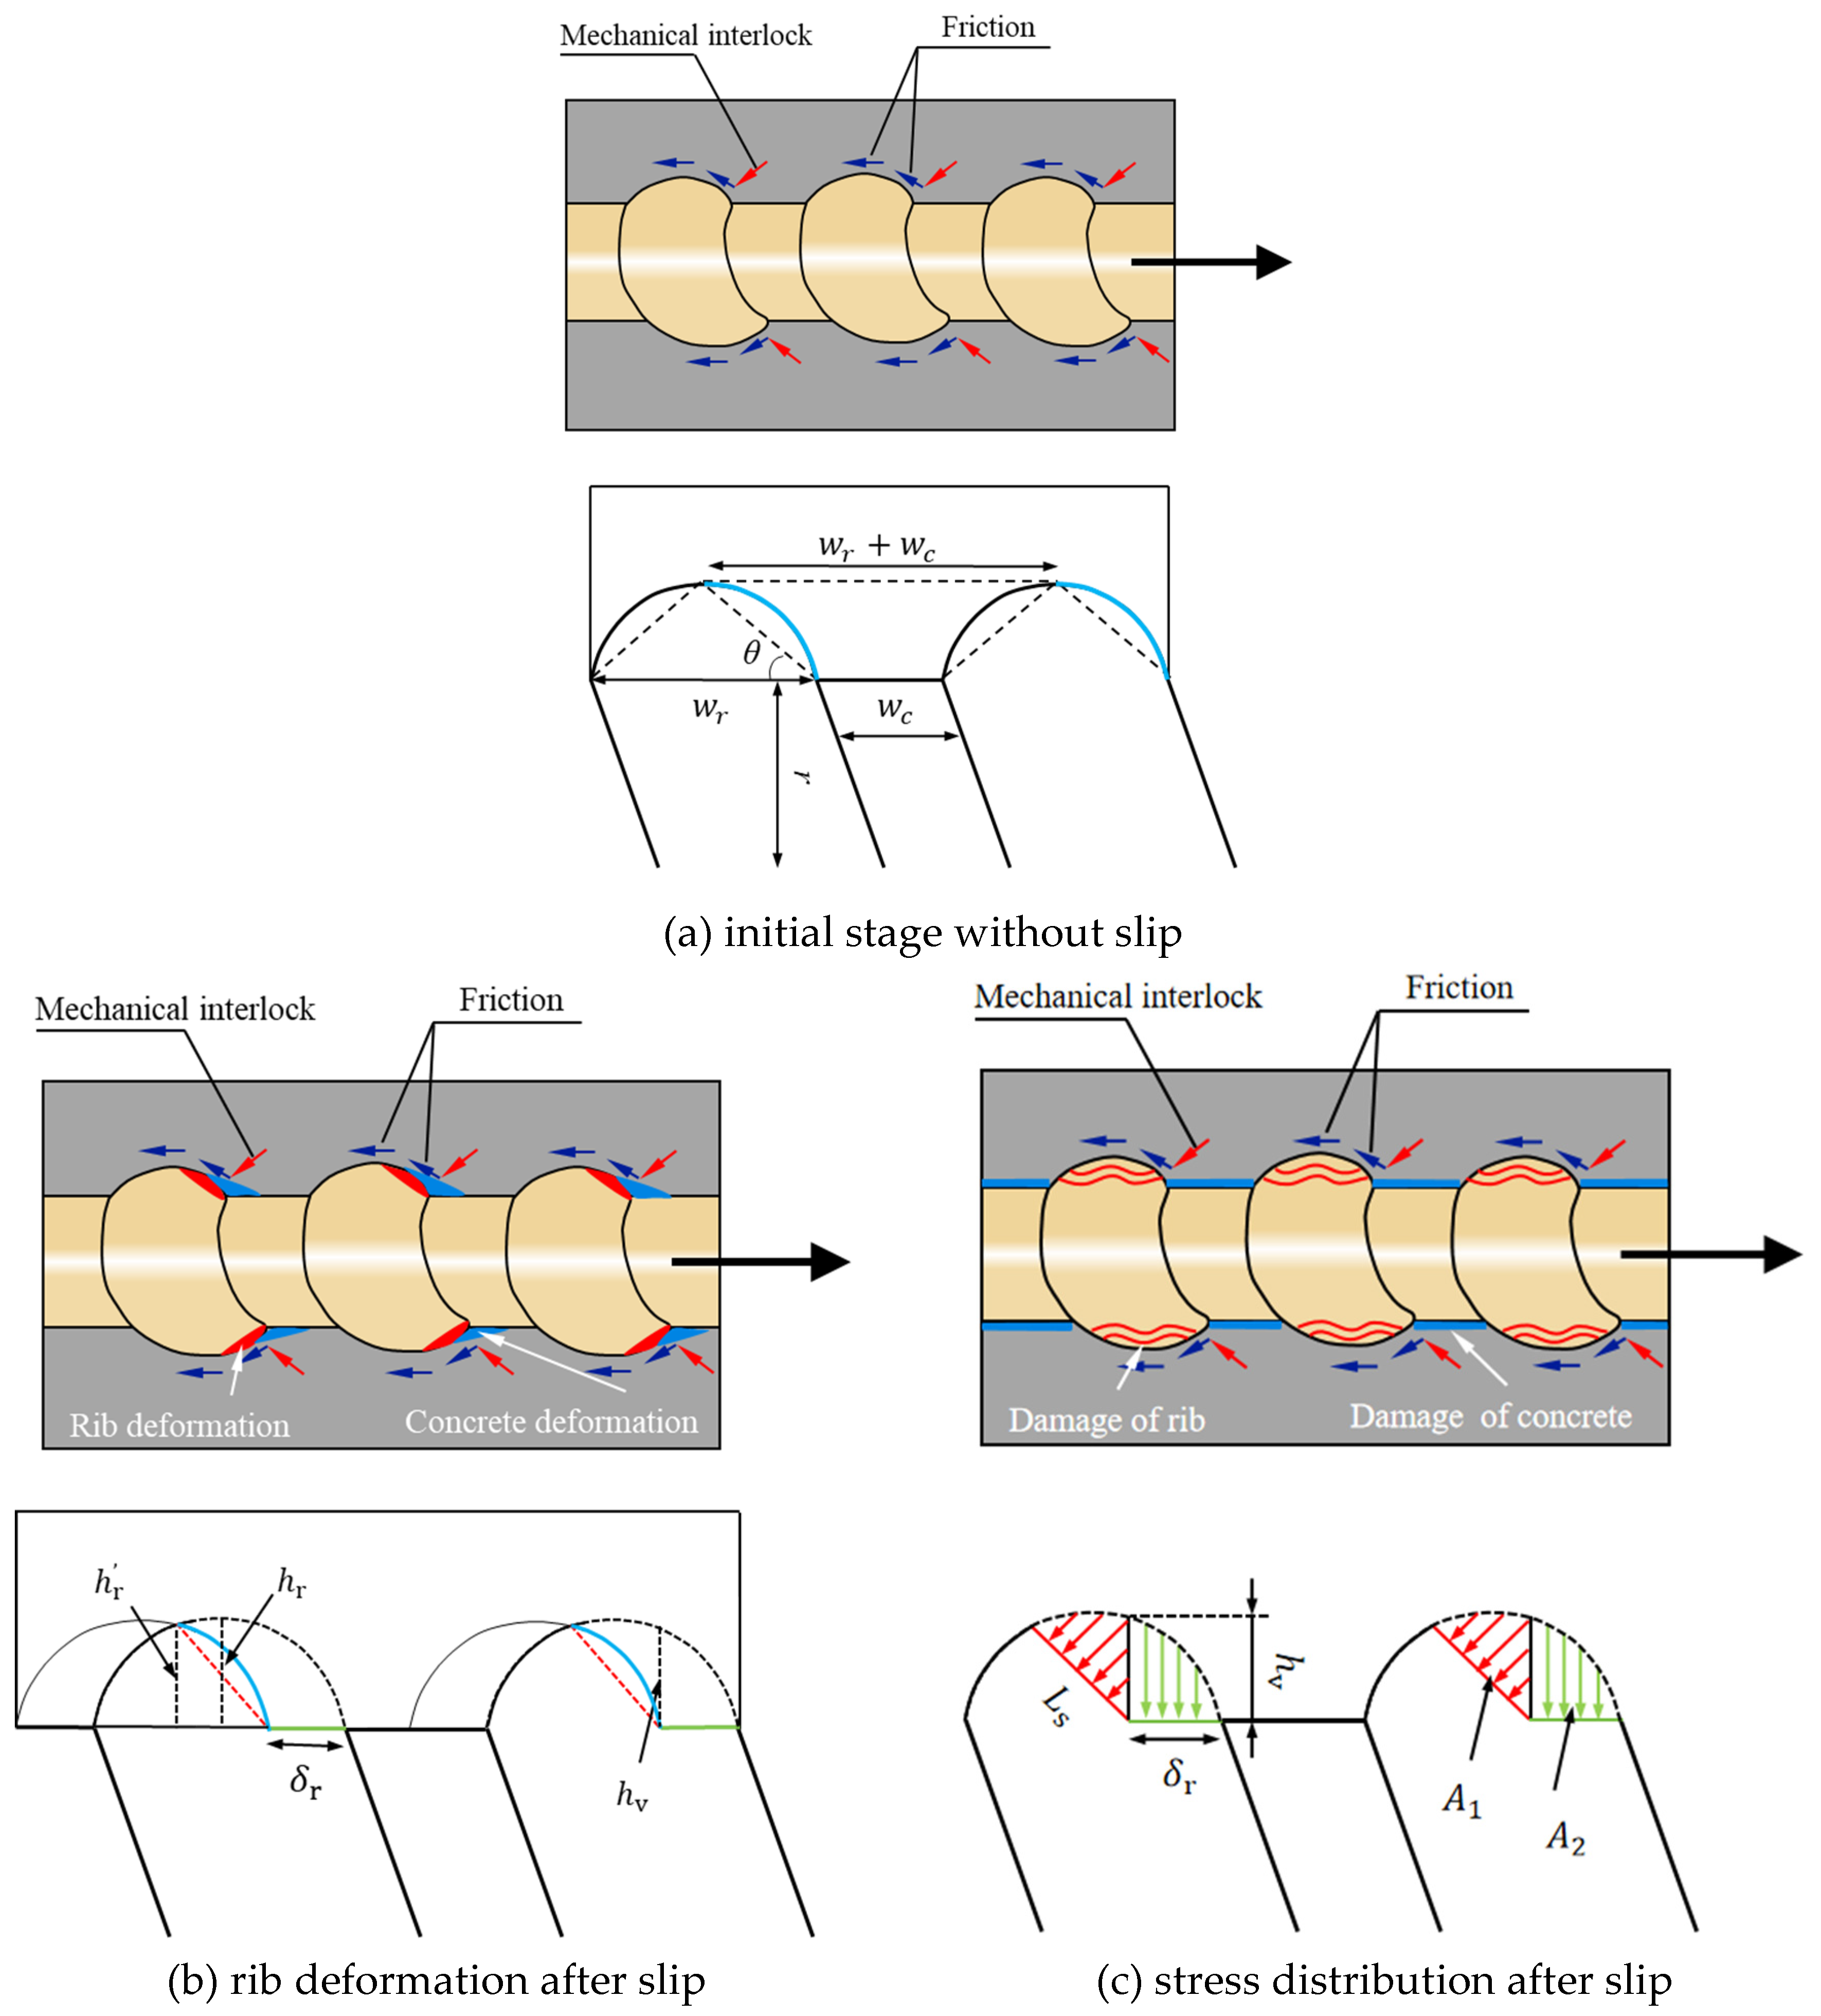
Figure 16.
Damage indicator evolution for GFRP and concrete. (a) Short-term damage evolution; (b) Long-term damage evolution.
Figure 16.
Damage indicator evolution for GFRP and concrete. (a) Short-term damage evolution; (b) Long-term damage evolution.
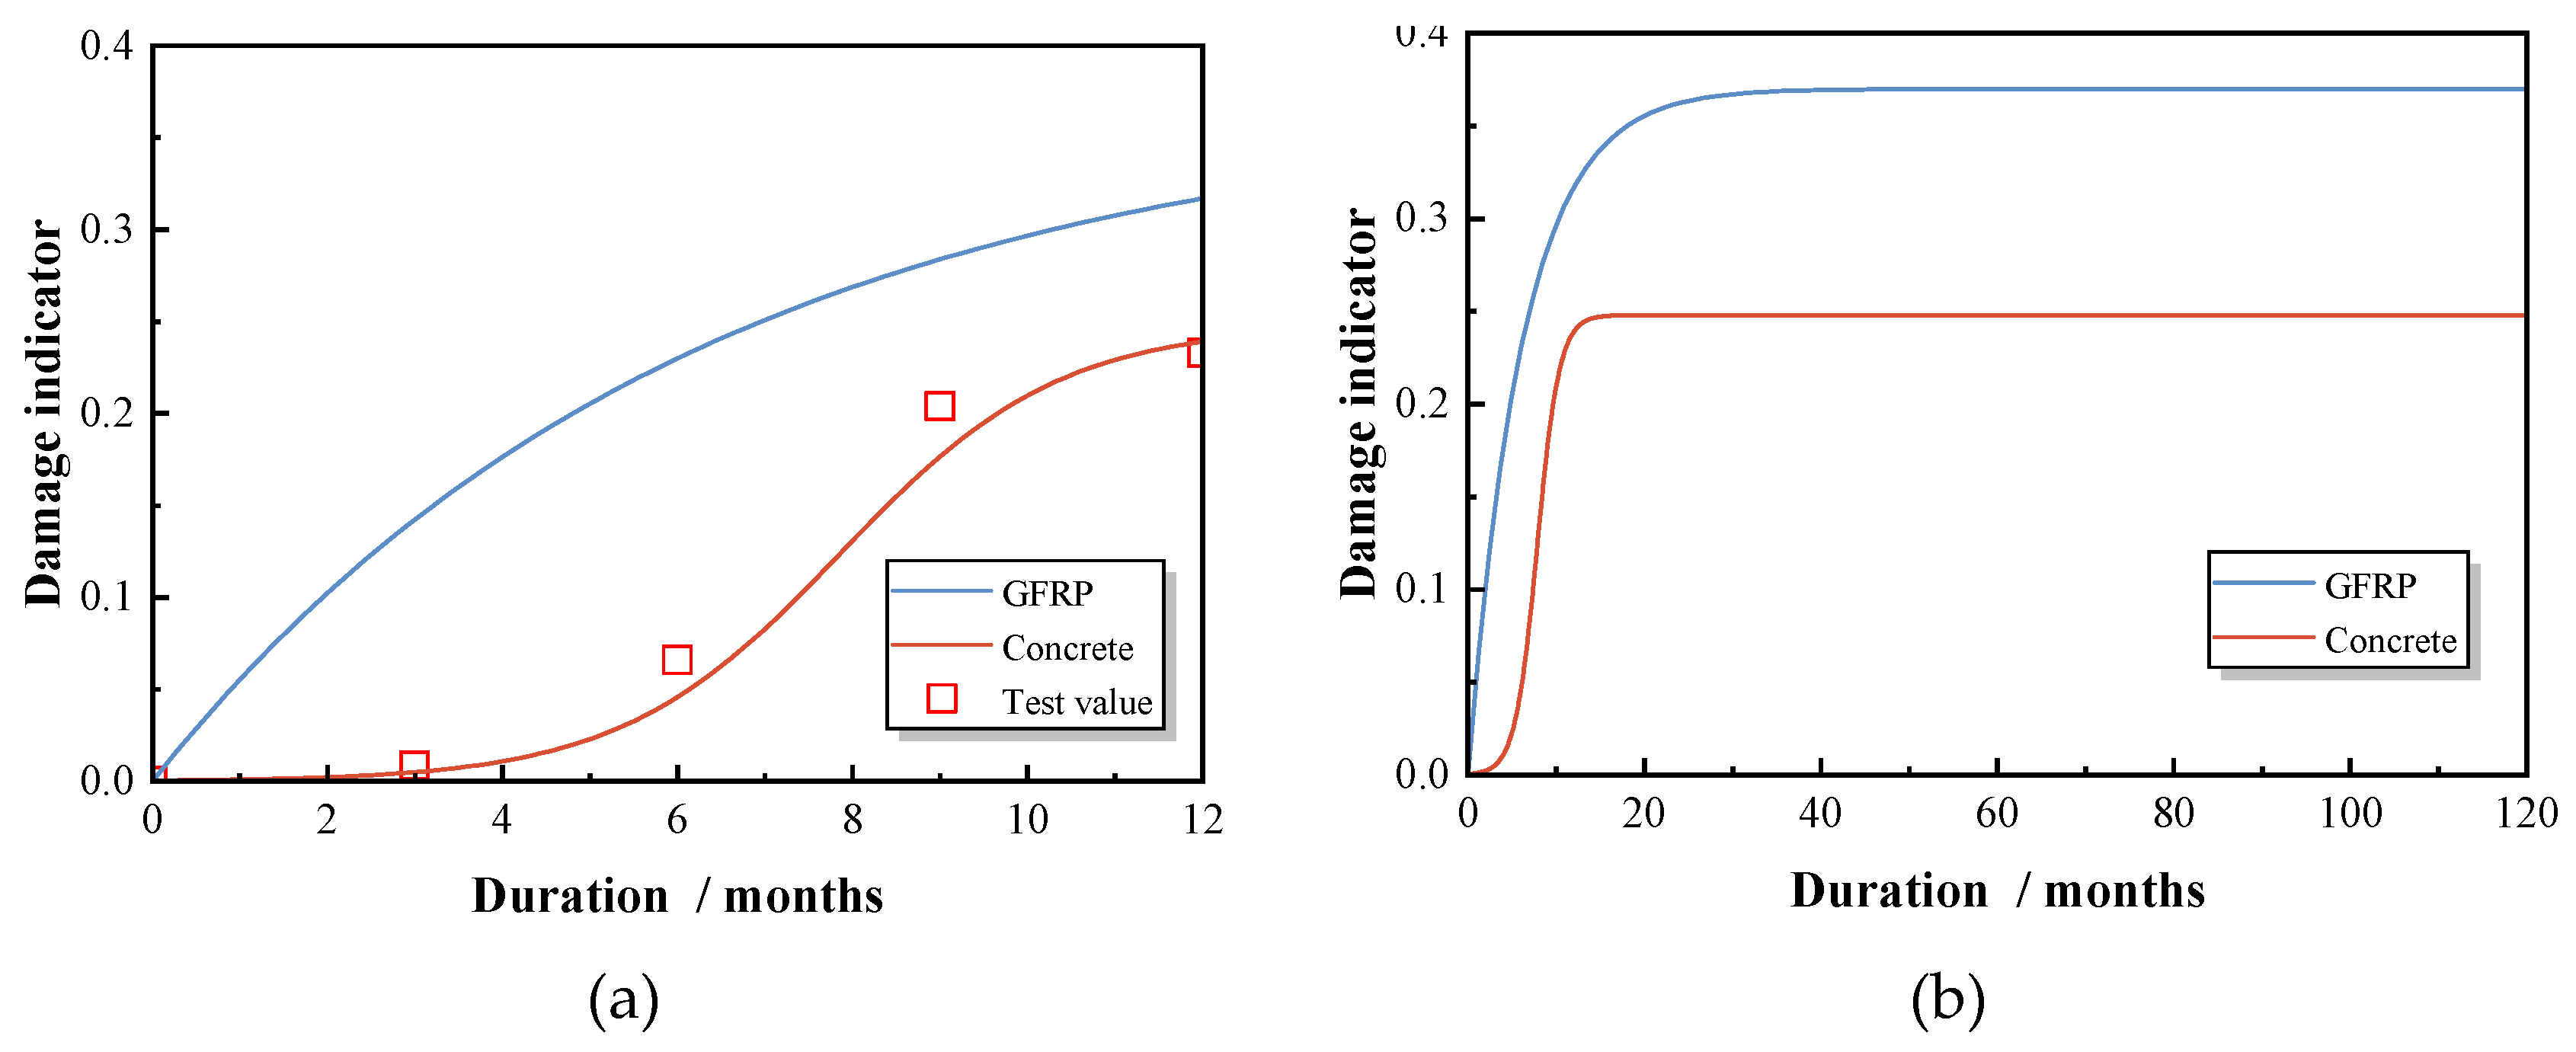
Figure 17.
Relationship between coefficient and test result.
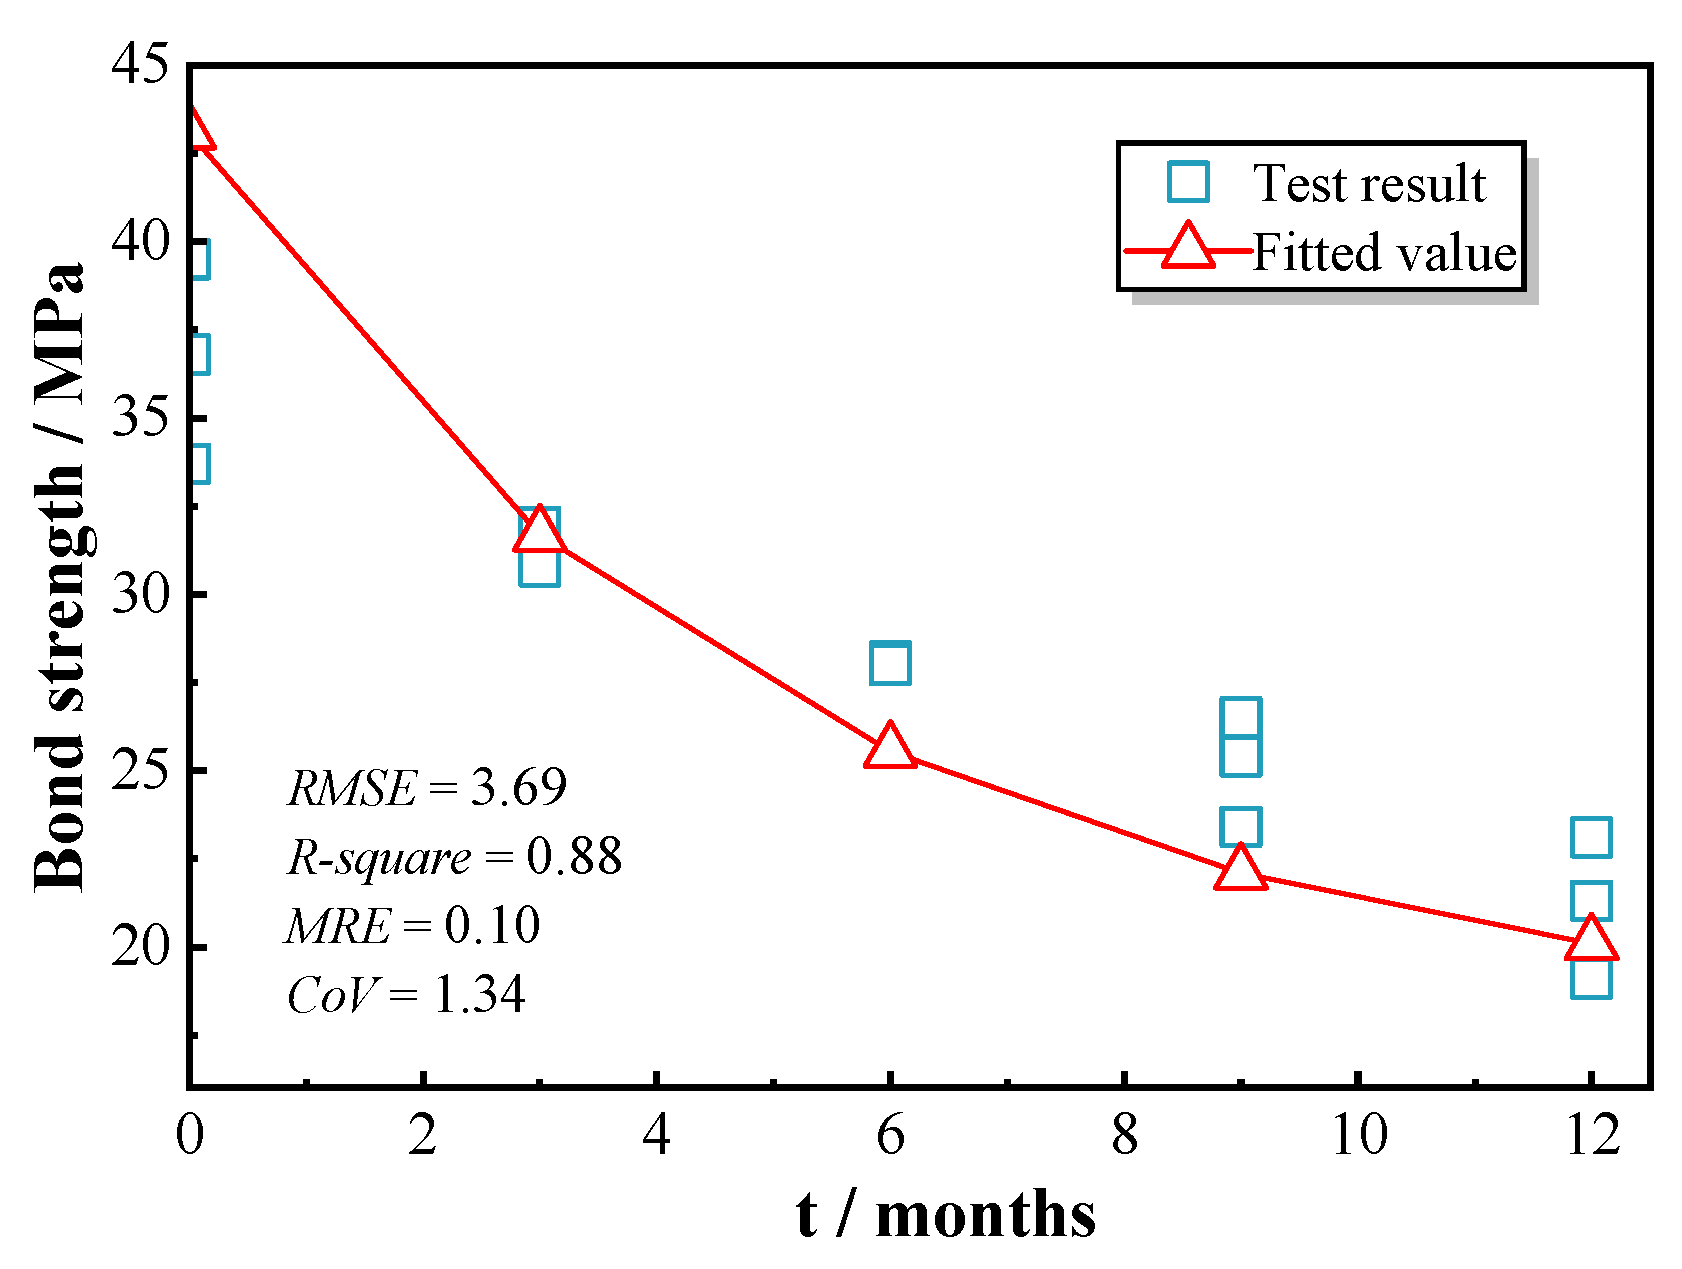
Figure 18.
Prediction accuracy for RG-5d series specimens.
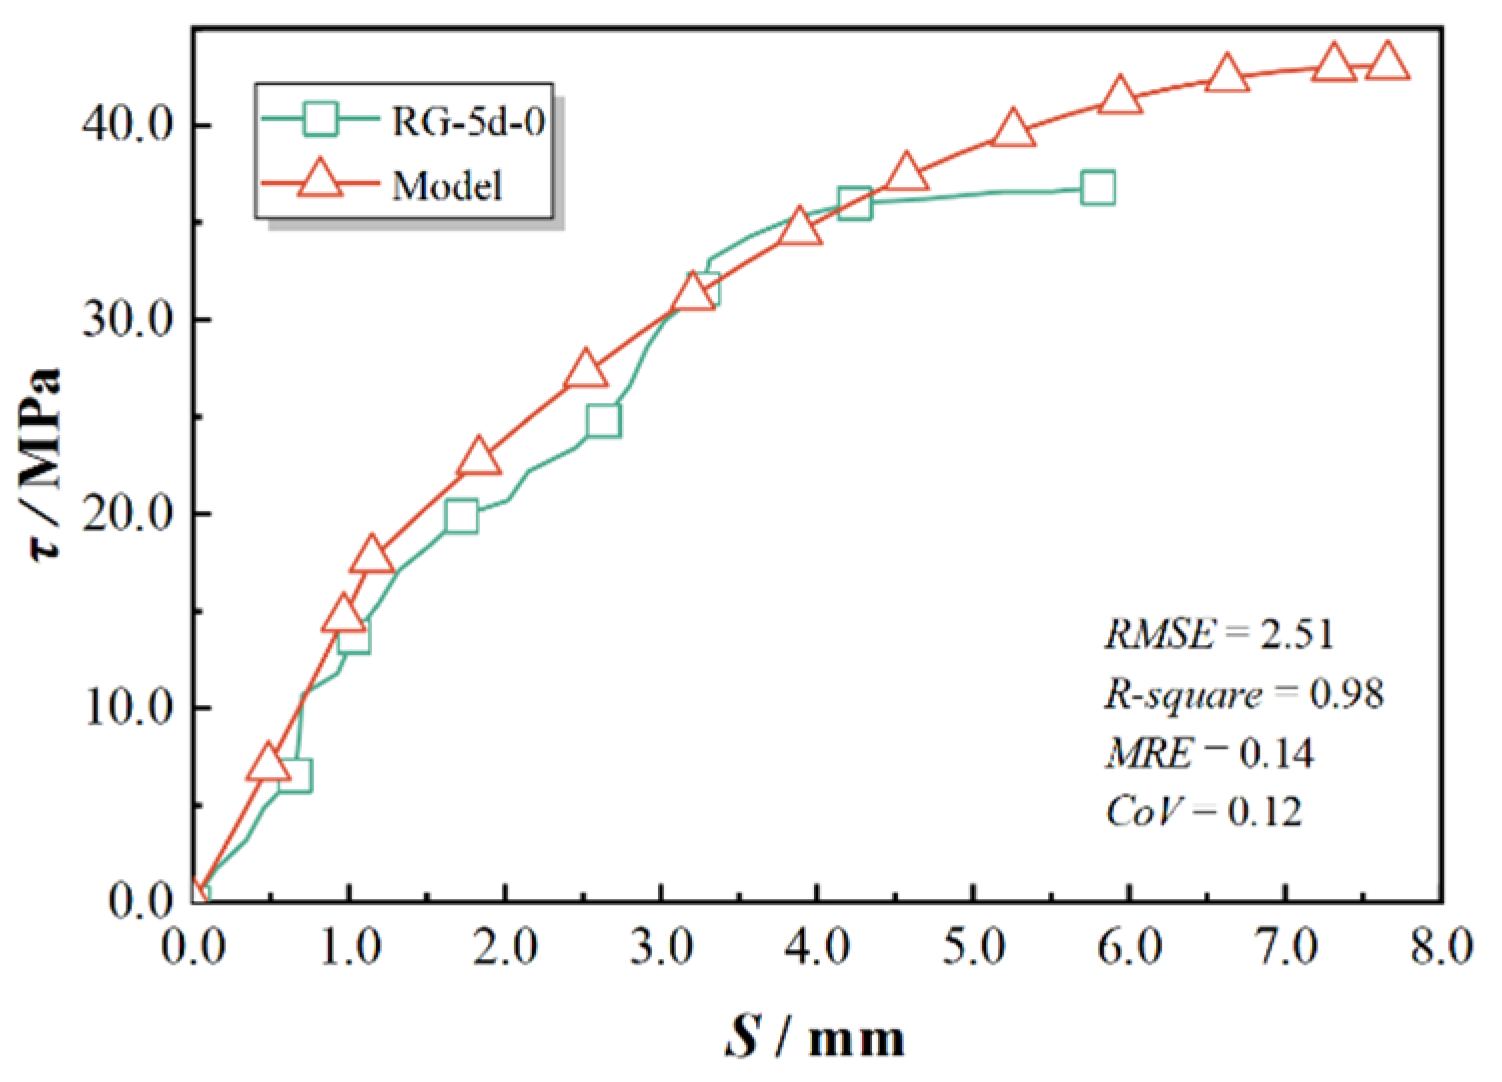
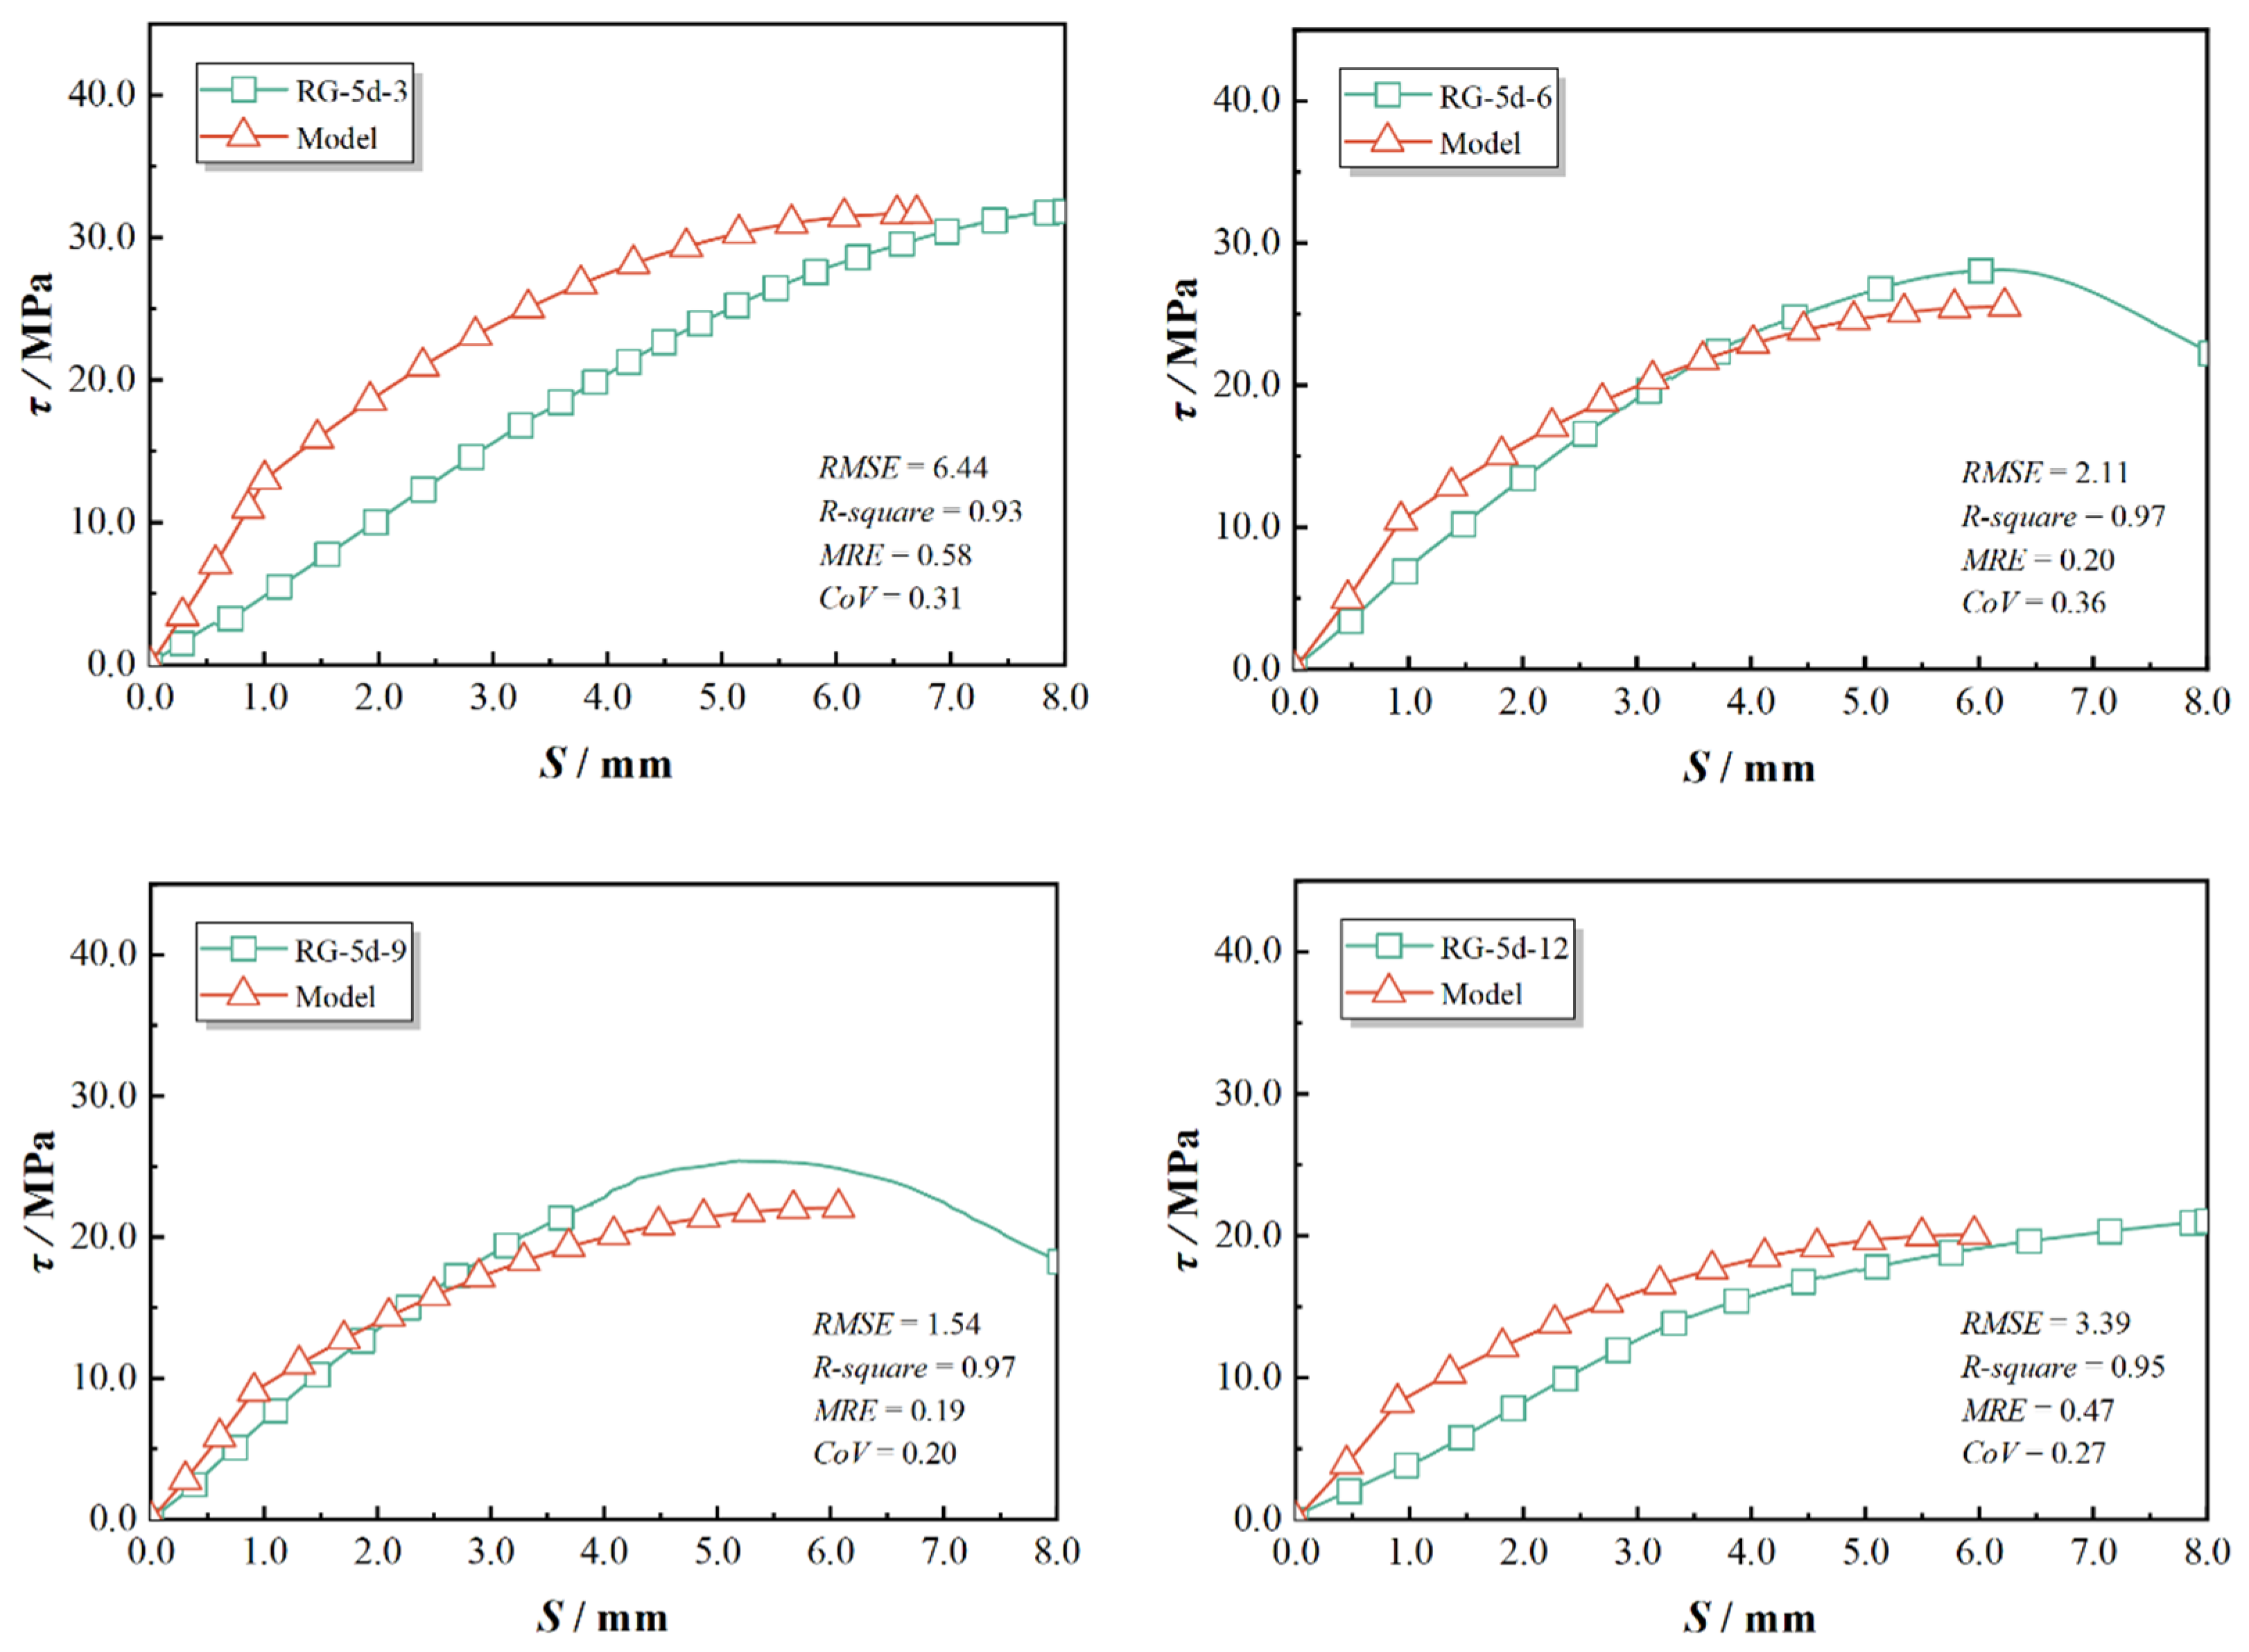
Figure 19.
Prediction accuracy for SG-5d series specimens.
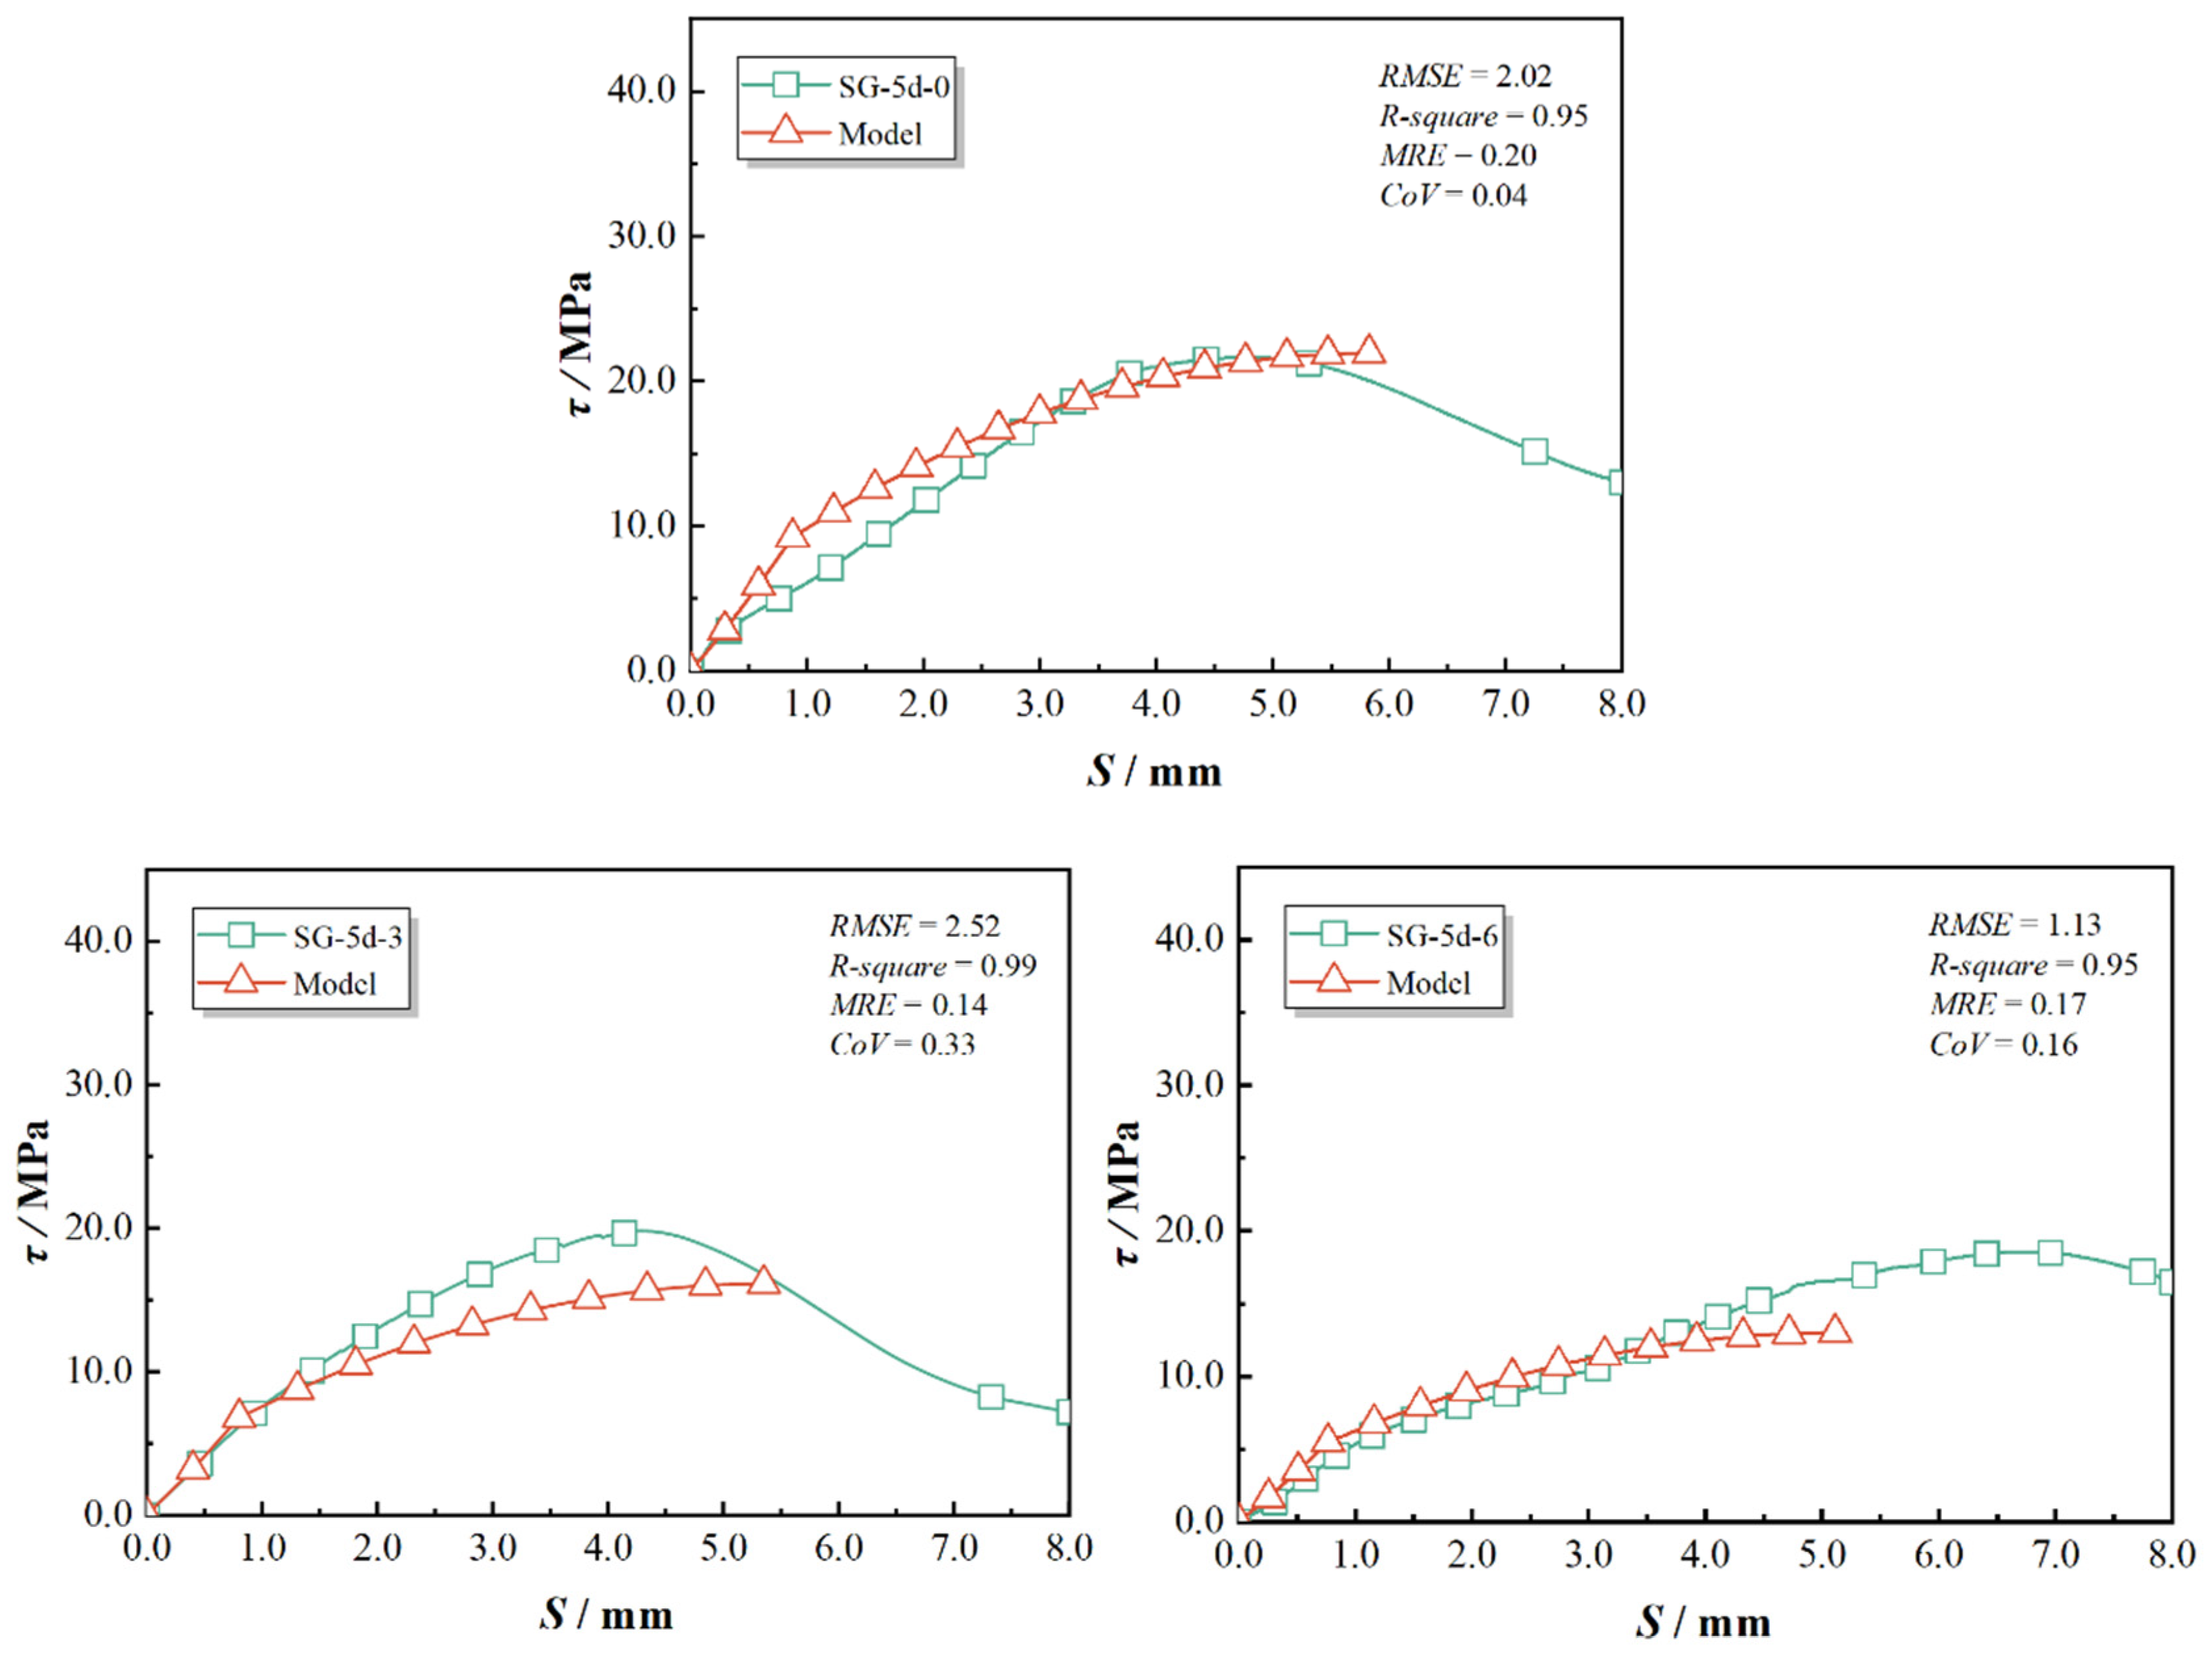
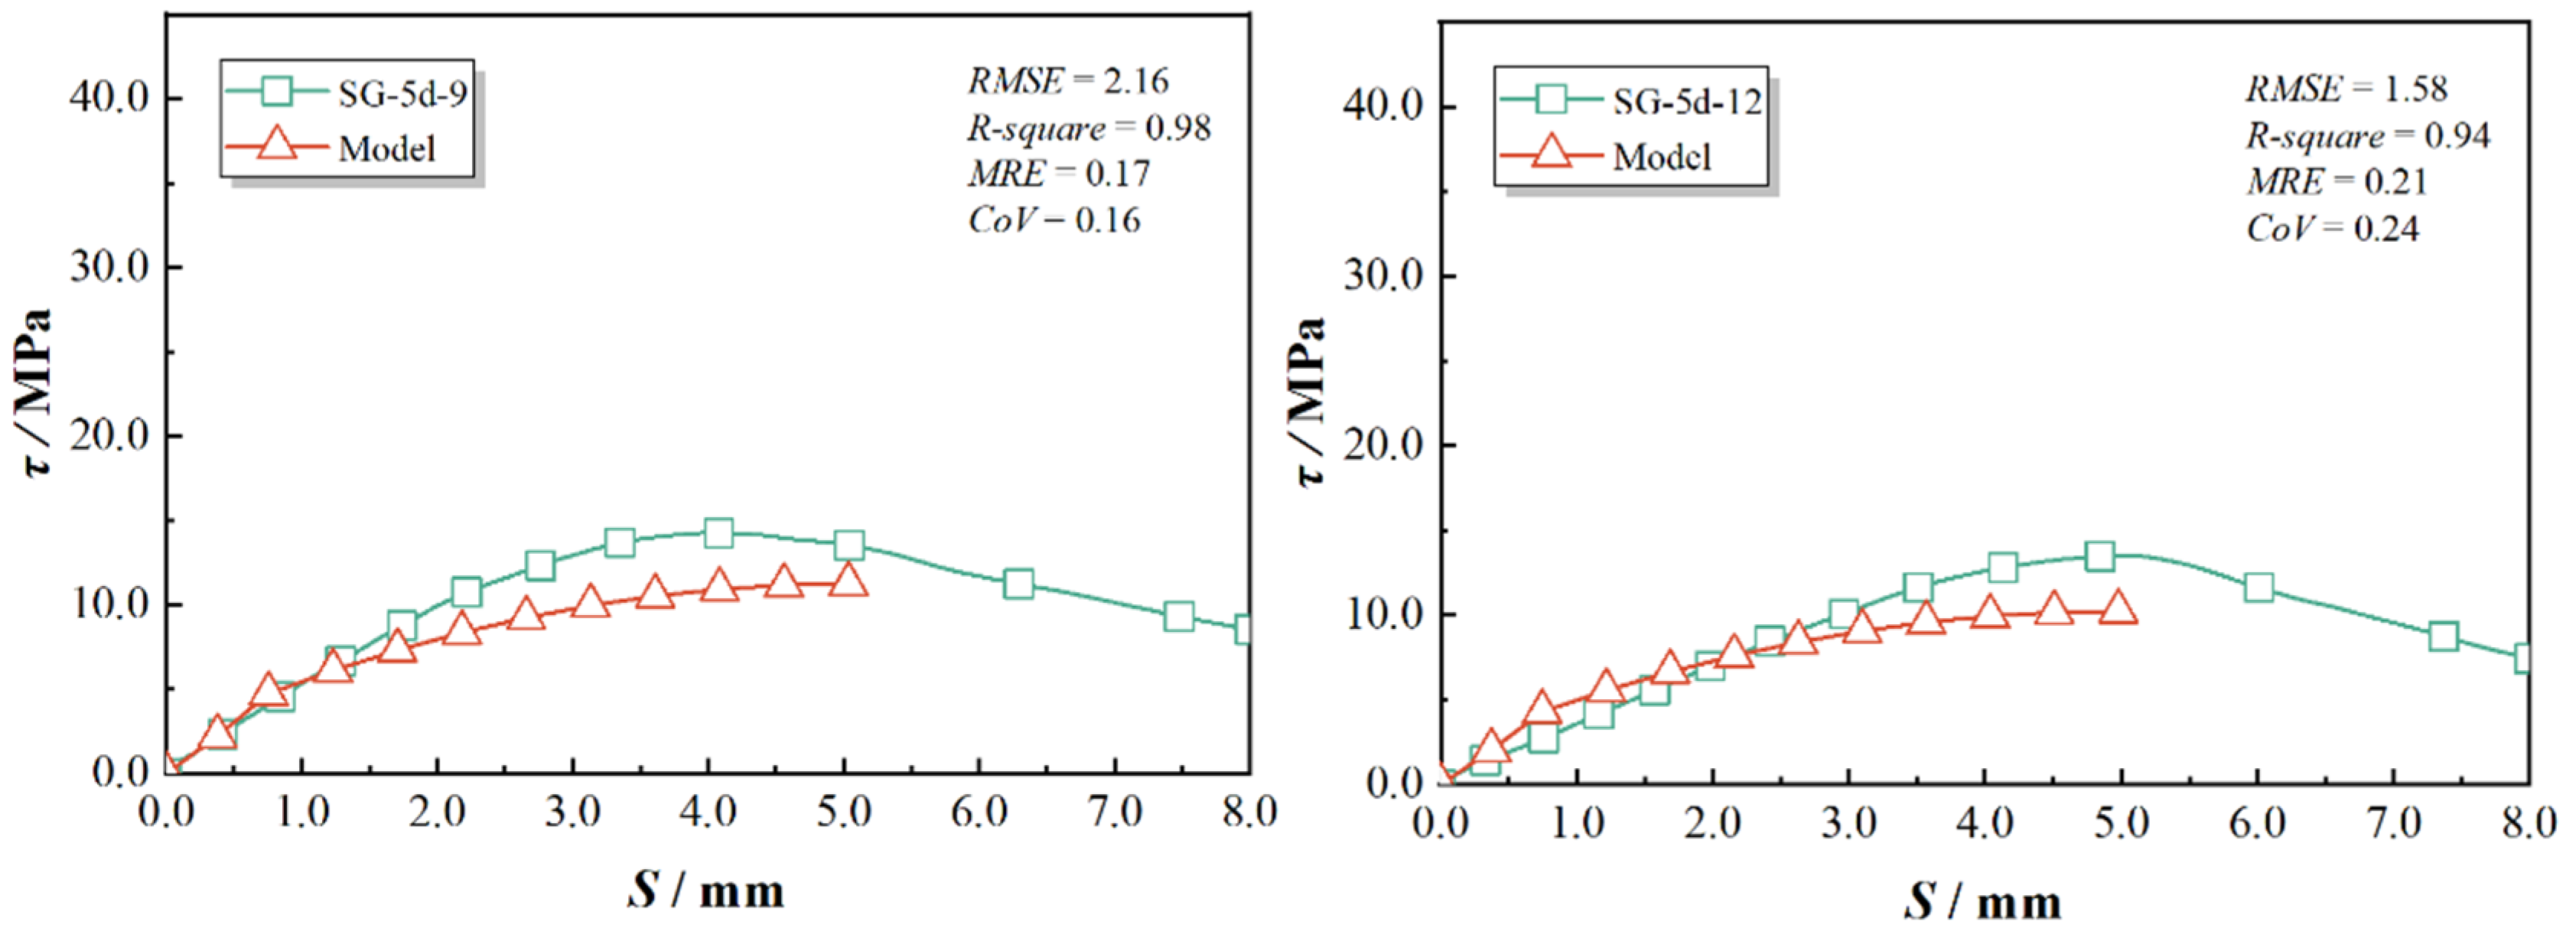
Figure 20.
Prediction accuracy for RG-7d series specimens.
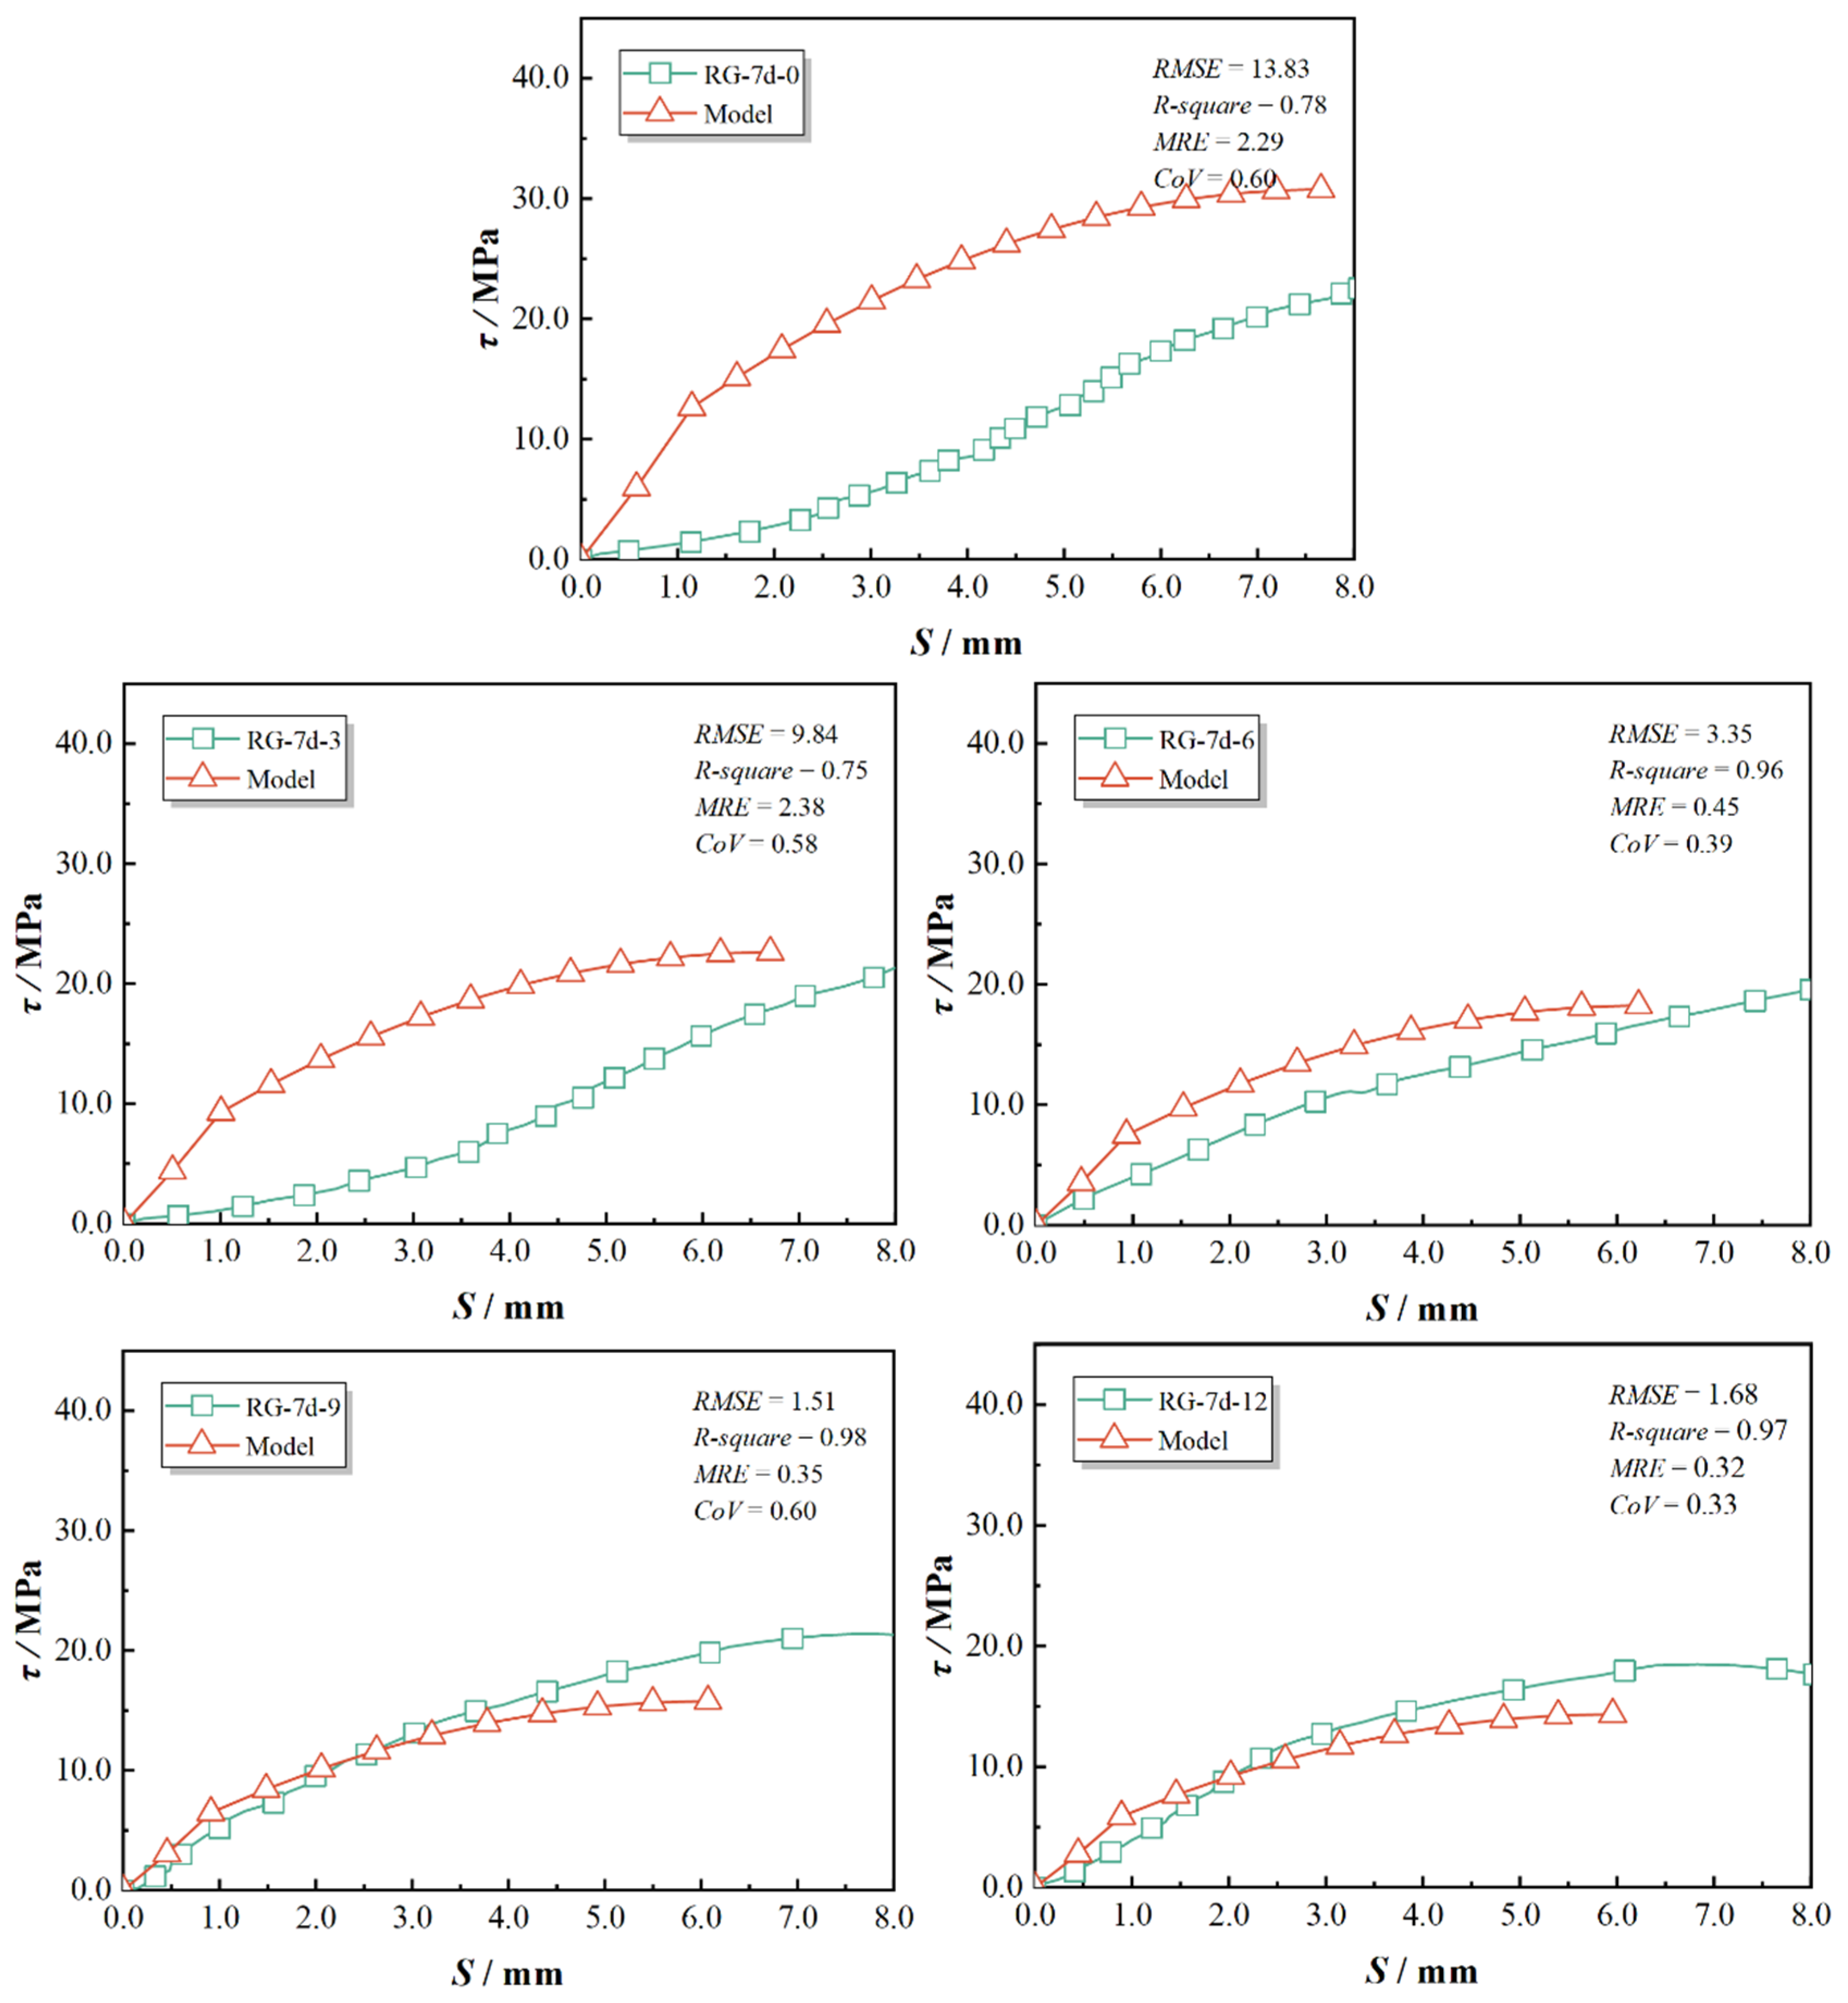
Figure 21.
Parametric sensitivity in the predicted bond slip curve. (a) effect of ; (b) effect of ; (c) effect of .
Figure 21.
Parametric sensitivity in the predicted bond slip curve. (a) effect of ; (b) effect of ; (c) effect of .
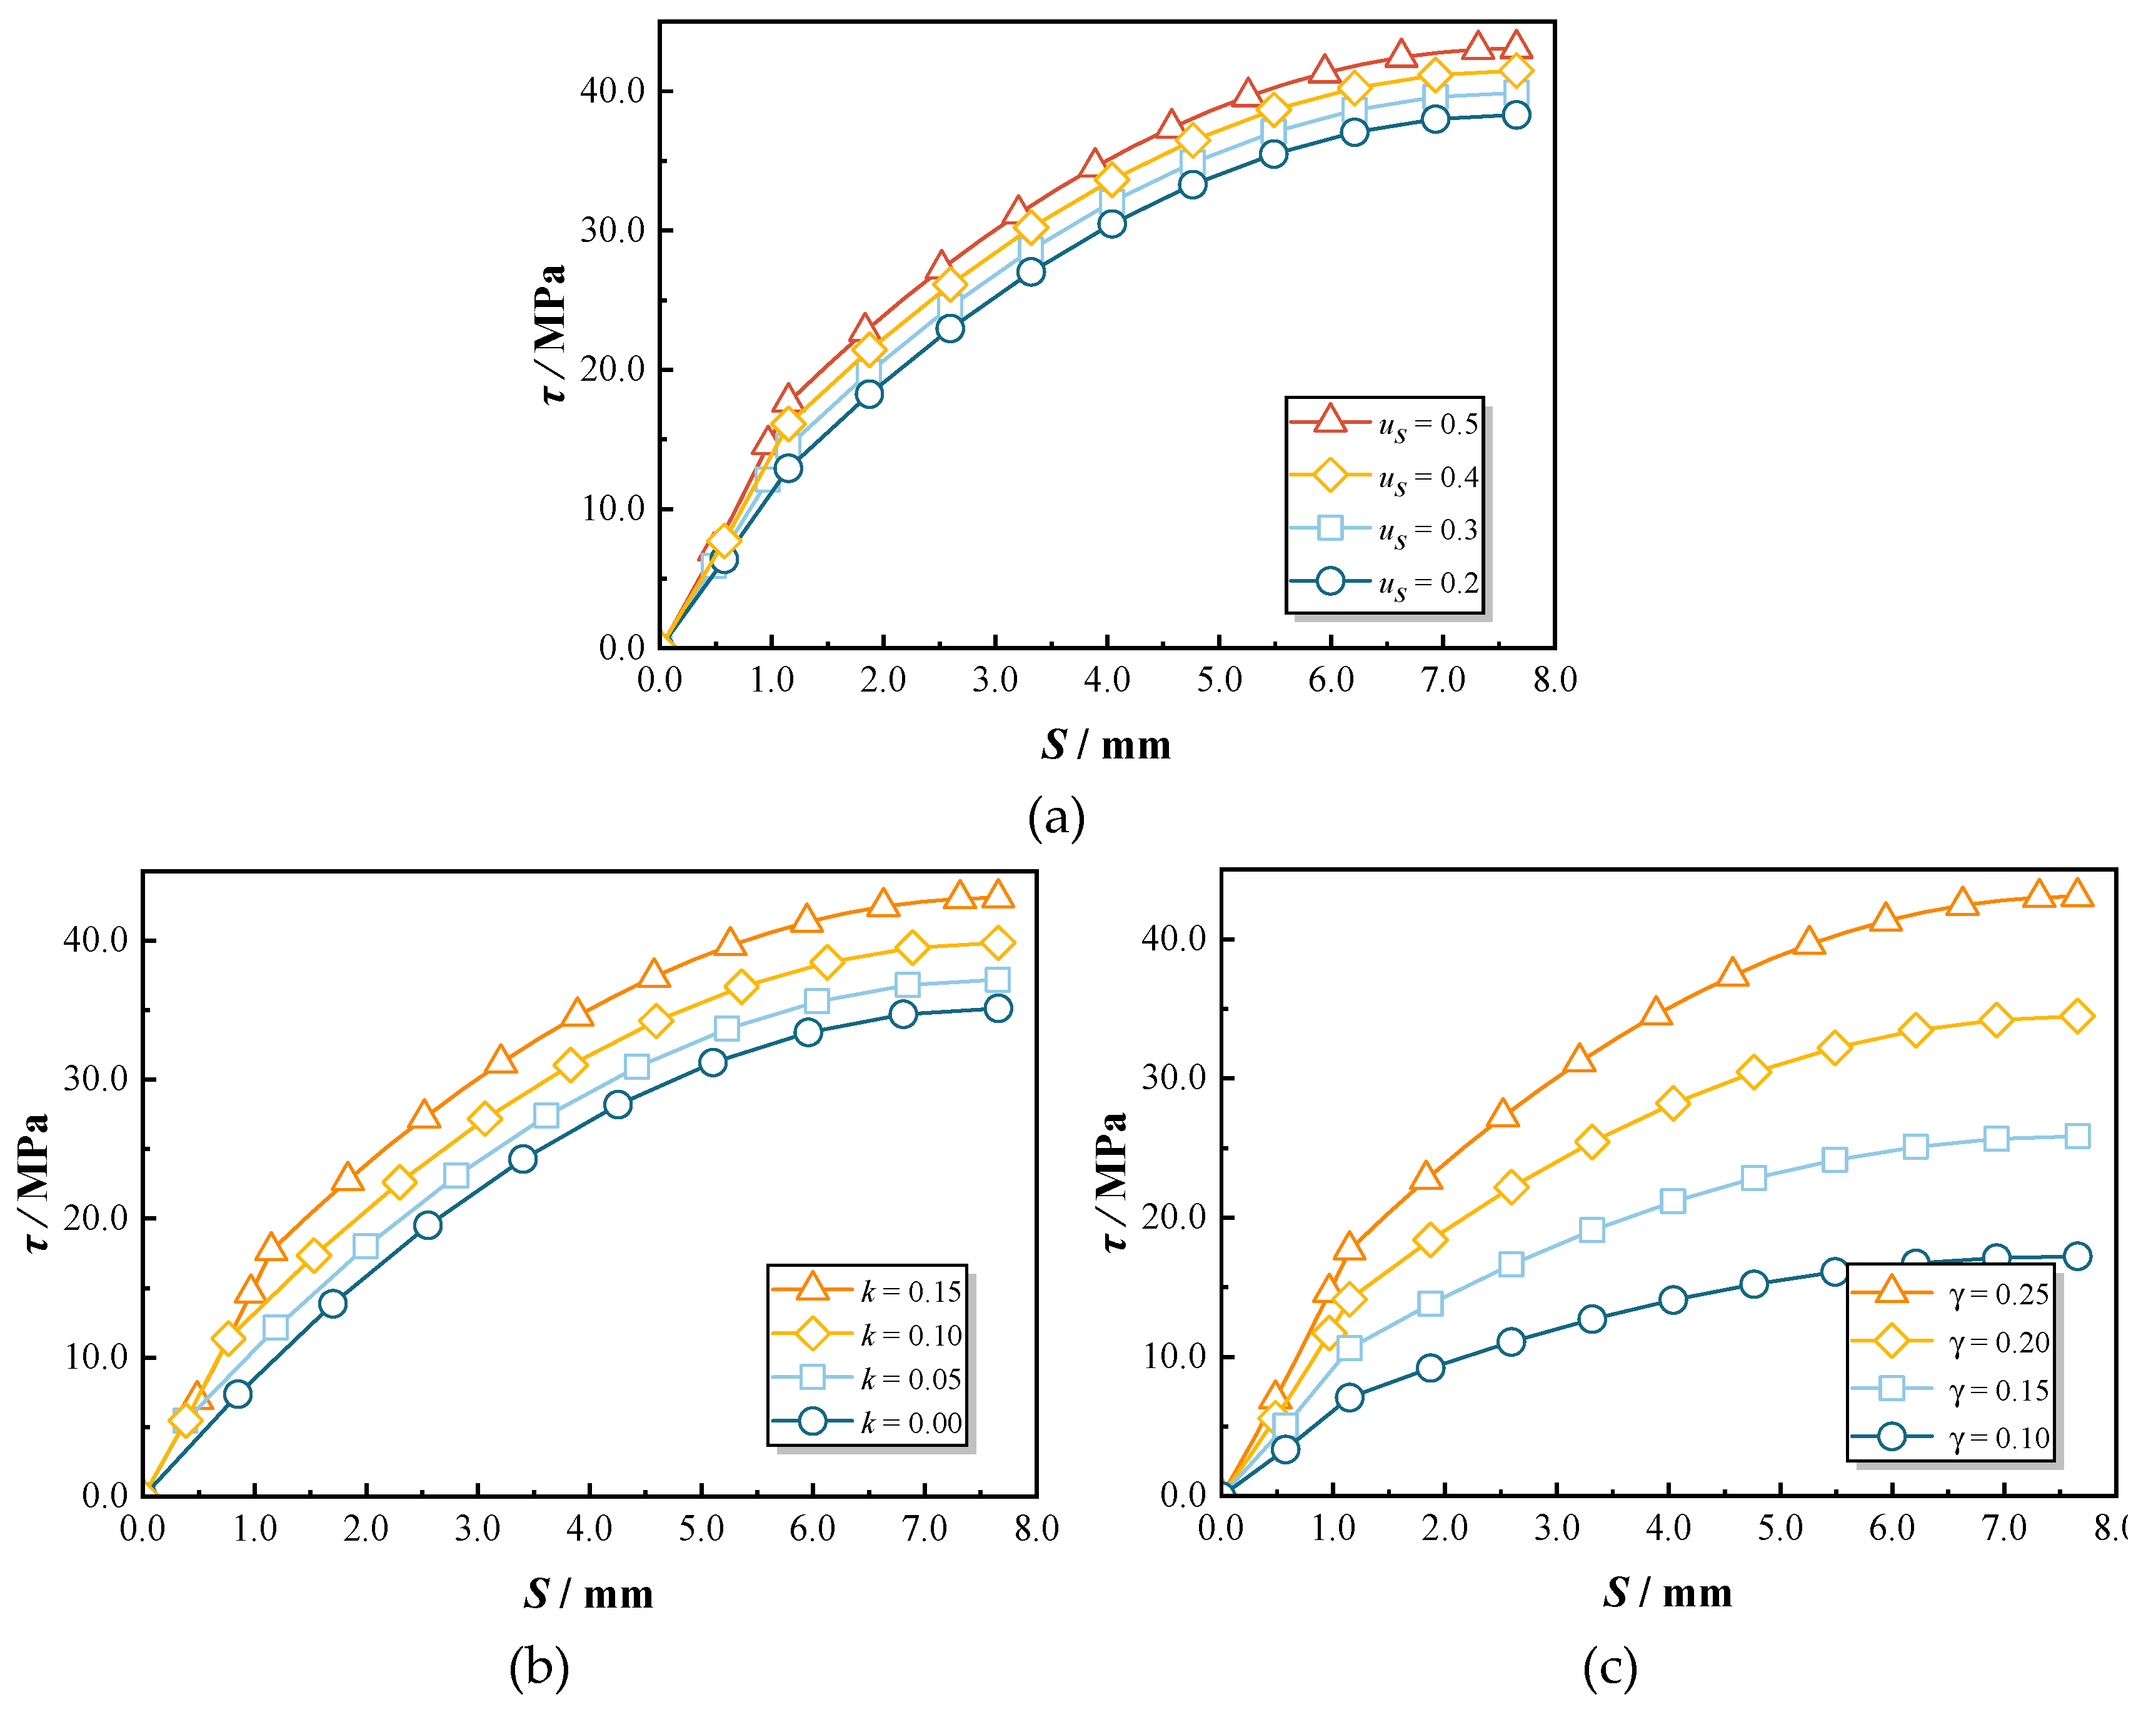
Figure 22.
The predicted bond-slip curves for RG-5d specimens. (a) Short-term predition; (b) Long-term predition.
Figure 22.
The predicted bond-slip curves for RG-5d specimens. (a) Short-term predition; (b) Long-term predition.
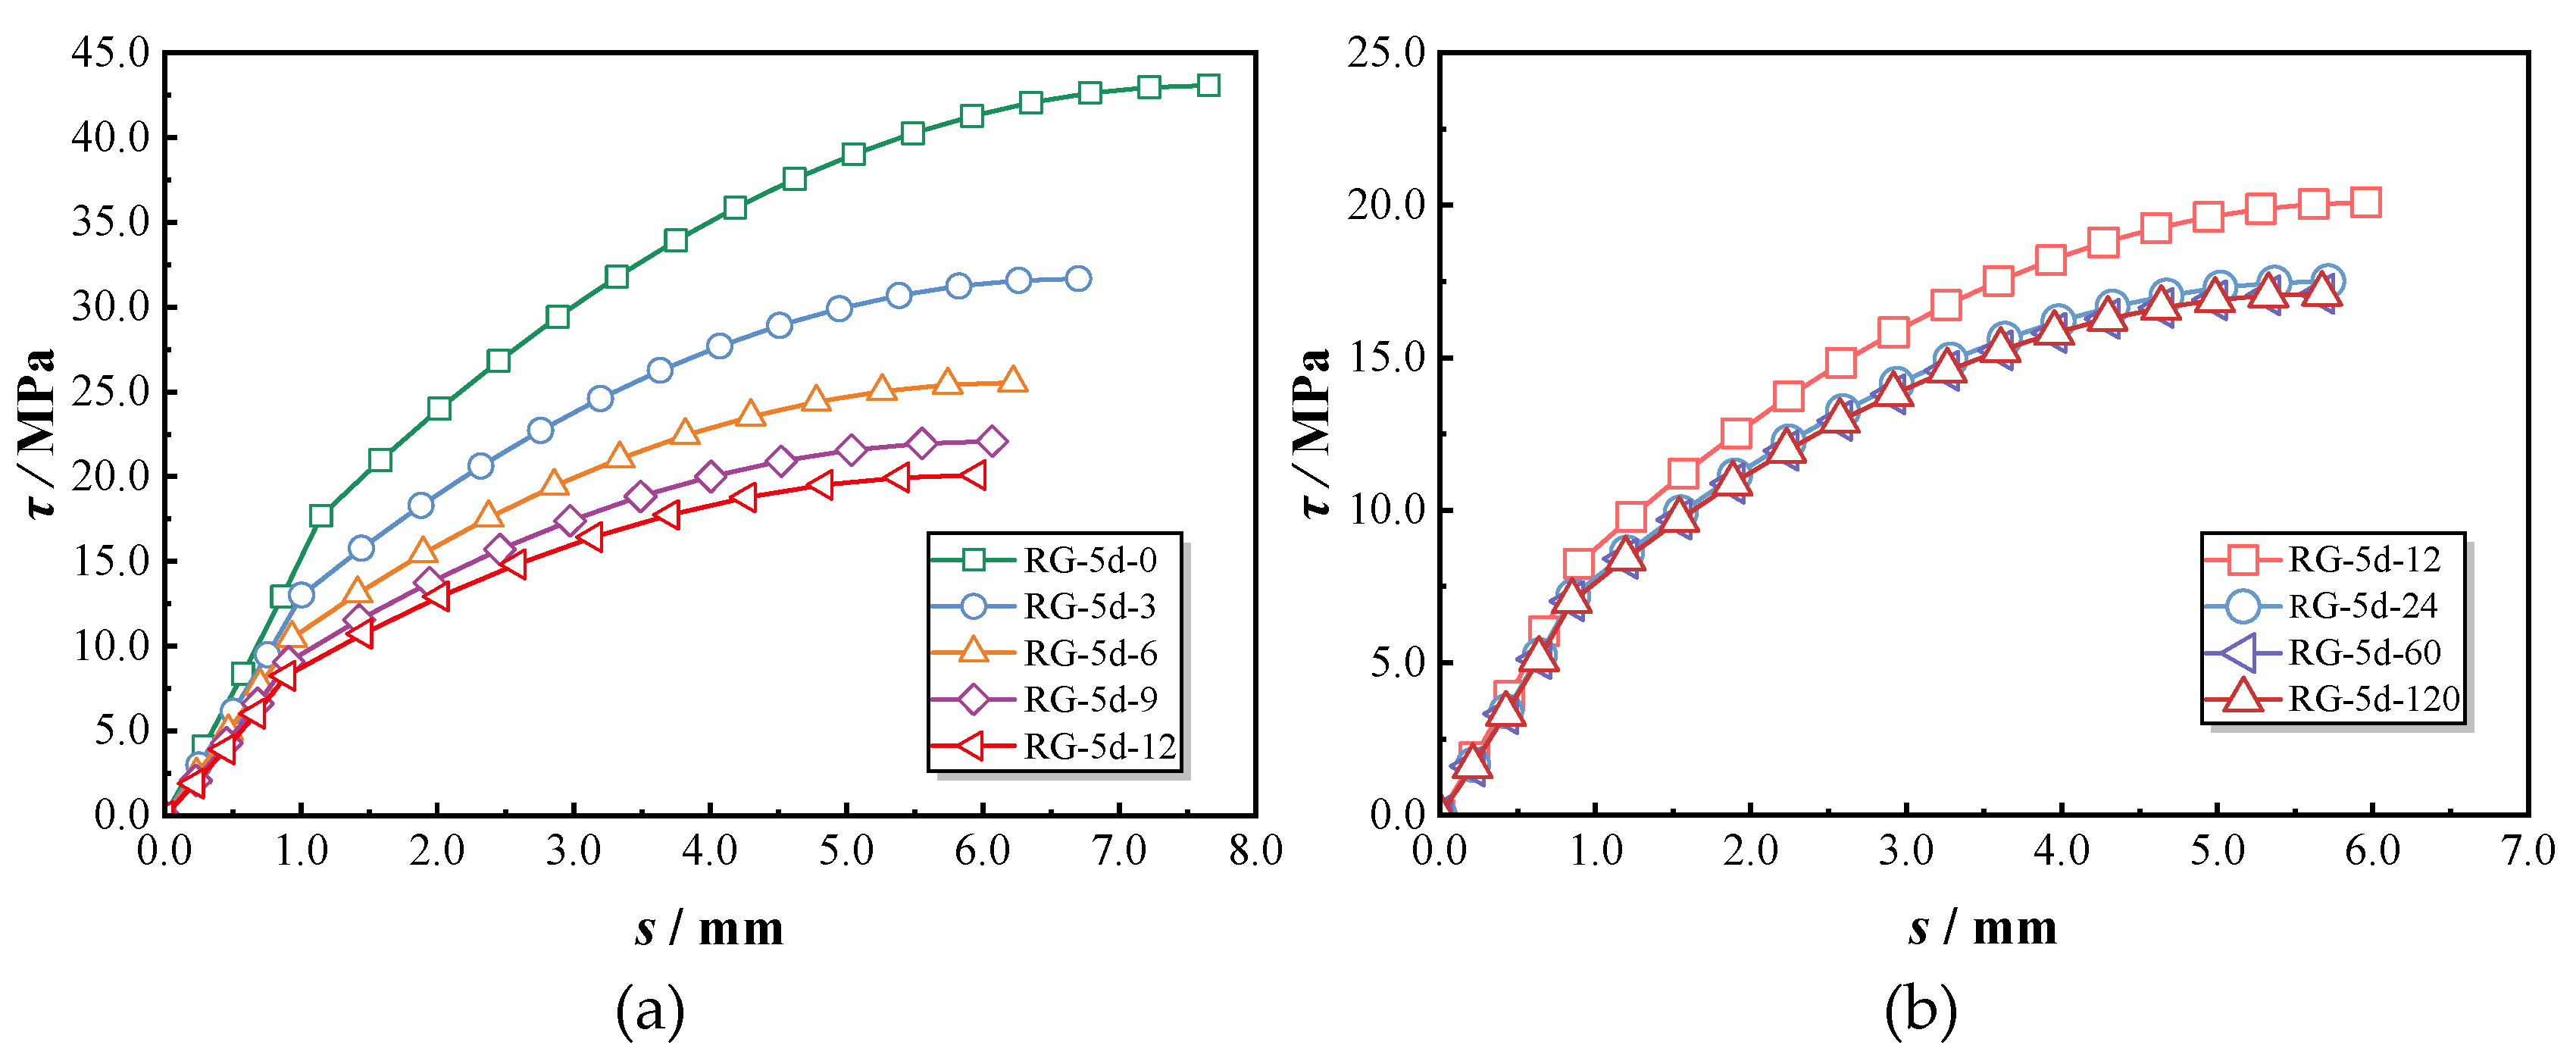

Table 1.
Existing experimental researches on GFRP bond performance.
| Reference | Chloride environment | FRP bar |
Prediction model |
||
| Environment | Duration (day) | Bond length | Surface texture | ||
| Nelson et al. (2024) | / | / | / | / | Mathematical |
| Wang et al. (2024) | / | / | 5d | RB | / |
| Shi et al. (2024) | / | / | 5d /10d/15d | SM | Mathematical |
| Zhou et al. (2024) | / | / | 5d | SC / RB | Mathematical |
| Zhang et al. (2024) | Dry–wet cycles | 360 | 5d | RB | |
| El-Nemr et al. (2023) | / | / | 5d | SC / RB | Mathematical |
| Lu et al. (2023) | Emersion | 180 | 5d | RB | Mathematical |
| Al-Hamrani et al. (2023) | Emersion | 270 | 5d | SC / RB | Mathematical |
| Chen et al. (2023) | / | / | 5d | RB | / |
| Hussain et al. (2022) | Emersion | 90 | 5d /10d/15d | RB | / |
| Yang et al. (2022) | / | / | 3d /5d | RB | Mechanical |
| Huang et al. (2020) | / | / | 5d | SC / RB | Mathematical |
| Taha et al. (2020) | Emersion | 90 | 5d | RB | / |
Note: d denotes the diameter of the tested FRP bars. SM, SC, and RB refer to the surface textures of the FRP bars: smooth, sand-coated, and ribbed, respectively.
Table 2.
Concrete admixture design (unit: kg (for one m3 of concrete)).
| Strength grade | Water-cement ratio | Water | Cement | Sand | Stones |
| C40 | 0.49 | 220 | 449 | 615 | 1116 |
Table 3.
Design parameters for the tested pull-out specimens.
| Group | Specimen | Surface texture | Diameter | Bond length | Chloride duration |
| RG-5d | RG-5d-0 | Threaded ribbed | 12 mm | 5 d | 0 months |
| RG-5d-3 | Threaded ribbed | 12 mm | 5 d | 3 months | |
| RG-5d-6 | Threaded ribbed | 12 mm | 5 d | 6 months | |
| RG-5d-9 | Threaded ribbed | 12 mm | 5 d | 9 months | |
| RG-5d-12 | Threaded ribbed | 12 mm | 5 d | 12 months | |
| SG-5d | SG-5d-0 | Sand-coated | 12 mm | 5 d | 0 months |
| SG -5d-3 | Sand-coated | 12 mm | 5 d | 3 months | |
| SG -5d-6 | Sand-coated | 12 mm | 5 d | 6 months | |
| SG -5d-9 | Sand-coated | 12 mm | 5 d | 9 months | |
| SG -5d-12 | Sand-coated | 12 mm | 5 d | 12 months | |
| RG-7d | RG-7d-0 | Threaded ribbed | 12 mm | 7 d | 0 months |
| RG-7d-3 | Threaded ribbed | 12 mm | 7 d | 3 months | |
| RG-7d -6 | Threaded ribbed | 12 mm | 7 d | 6 months | |
| RG-7d-9 | Threaded ribbed | 12 mm | 7 d | 9 months | |
| RG-7d-12 | Threaded ribbed | 12 mm | 7 d | 12 months |
Table 4.
Failure modes and peak characteristics of tested pull-out specimens.
| Specimen | Failure patterns | ||||
| Value / MPa | Rate / % | Value / mm | Rate / % | ||
| RG-5d-0 | A | 36.8 | 100.0 | 5.8 | 100.0 |
| RG-5d-3 | B | 31.9 | 86.7 | 8.1 | 139.7 |
| RG-5d-6 | B | 28.1 | 76.4 | 6.2 | 106.9 |
| RG-5d-9 | B | 25.4 | 69.0 | 5.1 | 87.9 |
| RG-5d-12 | B | 21.3 | 57.9 | 8.6 | 148.3 |
| SG-5d-0 | B | 21.7 | 100.0 | 4.7 | 100.0 |
| SG -5d-3 | B | 19.8 | 91.2 | 4.2 | 89.4 |
| SG -5d-6 | B | 18.6 | 85.7 | 6.6 | 140.4 |
| SG -5d-9 | B | 14.3 | 65.9 | 4.0 | 85.1 |
| SG -5d-12 | B | 13.5 | 62.2 | 4.9 | 104.3 |
| RG-7d-0 | A | 29.0 | 100.0 | 10.7 | 100.0 |
| RG-7d-3 | A | 25.6 | 88.3 | 11.9 | 111.2 |
| RG-7d -6 | A | 22.2 | 76.6 | 10.4 | 97.2 |
| RG-7d-9 | B | 21.4 | 73.8 | 7.6 | 71.0 |
| RG-7d-12 | B | 18.5 | 63.8 | 6.8 | 63.6 |
Table 5.
Comparison of the predicted and tested peak points.
| Specimen | Failure patterns | ||||||
| Rate | Average | Rate | Average | ||||
| RG-5d-0 | A | 43.08 | 1.17 | 0.98 | 7.66 | 1.32 | 1.01 |
| RG-5d-3 | B | 31.68 | 0.99 | 6.70 | 0.83 | ||
| RG-5d-6 | B | 25.54 | 0.91 | 6.22 | 1.00 | ||
| RG-5d-9 | B | 22.09 | 0.87 | 6.07 | 1.19 | ||
| RG-5d-12 | B | 20.09 | 0.94 | 5.96 | 0.69 | ||
| SG-5d-0 | B | 21.94 | 1.01 | 0.81 | 5.83 | 1.24 | 1.11 |
| SG-5d-3 | B | 16.13 | 0.81 | 5.35 | 1.27 | ||
| SG-5d-6 | B | 13.01 | 0.70 | 5.11 | 0.77 | ||
| SG-5d-9 | B | 11.25 | 0.79 | 5.04 | 1.26 | ||
| SG-5d-12 | B | 10.23 | 0.76 | 4.98 | 1.02 | ||
| RG-7d-0 | A | 30.77 | 1.06 | 0.93 | 7.66 | 0.72 | 0.73 |
| RG-7d-3 | A | 22.63 | 0.88 | 6.70 | 0.56 | ||
| RG-7d-6 | A | 18.24 | 0.82 | 6.22 | 0.60 | ||
| RG-7d-9 | B | 15.78 | 0.74 | 6.07 | 0.80 | ||
| RG-7d-12 | B | 21.2 | 1.15 | 6.43 | 0.95 | ||
Disclaimer/Publisher’s Note: The statements, opinions and data contained in all publications are solely those of the individual author(s) and contributor(s) and not of MDPI and/or the editor(s). MDPI and/or the editor(s) disclaim responsibility for any injury to people or property resulting from any ideas, methods, instructions or products referred to in the content. |
© 2025 by the authors. Licensee MDPI, Basel, Switzerland. This article is an open access article distributed under the terms and conditions of the Creative Commons Attribution (CC BY) license (http://creativecommons.org/licenses/by/4.0/).
Copyright: This open access article is published under a Creative Commons CC BY 4.0 license, which permit the free download, distribution, and reuse, provided that the author and preprint are cited in any reuse.


