
Submitted:
20 June 2025
Posted:
24 June 2025
You are already at the latest version
Abstract
Although 5-20% of global crop production is lost to arthropod damage, current biomonitoring programs are extremely limited. This study evaluates the feasibility of using metabarcoding to assess overall insect diversity and detect pest species in agricultural settings. It introduces a curated DNA barcode reference library for Canadian insects that are agricultural pests and applies it to metabarcoding data from the analysis of Malaise trap samples from two experimental farms in Southern Ontario.
A total of 7,707 arthropod species were collected across the two farms and projections indicate that another 4,000 await detection. These taxa included 231 registered pest species. The composition of the overall arthropod community composition was more heavily influenced by site location than crop type, but pest species composition was influenced by the crop.
This study confirms that metabarcoding enables the evaluation of the species composition of arthropod communities in agroecosystems, allowing pest species to be tracked.
Keywords:
pest species
; biodiversity
; malaise trap
; biosurveillance
1. Introduction
Arthropods are important contributors to agroecosystems as they provide critical services including nutrient recycling, pollination, biological control, and food for other organisms. Although they only considered four services, Losey and Vaughan (2006) estimated an annual value of US$57 billion for the services provided by arthropods in the Unites States. Alarmingly, recent reports suggest large declines in their biomass, with knock-on effects across ecosystems (Hallmann et al. 2017; Vogel 2017; Lister & Garcia 2018; Seibold er al. 2019, Sanchez-Bayo and Wyckhuys 2019). The four primary drivers of these declines are thought to be: i) habitat loss to agriculture and urbanization; ii) chemicals - especially pesticides and fertilizers; iii) pathogens and introduced species; and iv) climate change (Sanchez-Bayo and Wyckhuys 2019). If current trends are sustained, 40% of all insect species may become extinct within the next few decades (Sanchez-Bayo and Wyckhuys 2019).
In addition to declines in abundance, the species composition of arthropod communities is shifting with specialists being replaced by pollution-tolerant dietary generalists (Sanchez-Bayo and Wyckhuys 2019). Although generalists aid stability in local food webs and, by extension, entire ecosystems (Benton et al. 2021), this is offset by the declines in diversity. Many specialists which play important functional roles in ecosystems, are extremely vulnerable to land-use modification and pollution. Their loss increases interaction strengths within more simplified food webs, which are known to be less resilient (Benton et al. 2003). As a result, species are declining in abundance or becoming extirpated, particularly in heavily modified areas such as intensively farmed lands, raising the risk of pest outbreaks (Dainese et al. 2016).
While agroecosystems need arthropods to deliver essential services, farm management practices reduce their abundance. The decline of beneficial arthropod species also leads to an increase in pest species. Currently, about 5-20% of annual global crop production is lost to arthropods and this is likely to increase with climate change (Deutsch et al. 2018). Furthermore, the control of insect pests and crop diseases is increasingly threatened by rising pesticide resistance (Bass et al., 2015; Powles & Yu, 2010; Lucas et al. 2015).
Past efforts to monitor farmland biodiversity have been limited. They have typically relied on indirect broad-scale multispecies assessments of terrestrial vertebrates (e.g., Agriculture and Agri-Food Canada’s “Wildlife Capacity on Farmland Indicator”), or observations of farmland birds and butterfly populations (e.g., European Union). A recent assessment found no coordinated biomonitoring of agricultural lands in North America and Europe (Herzog & Franklin 2016). Conventional biomonitoring utilizing morphological identification is labour intensive and agricultural lands are vast, so it is no surprise that governments and the agricultural sector have hesitated to invest. While some biomonitoring data exists, there is a lack of consistent information even for common species, though they often provide important ecosystem services or provoke crop damage. Large-scale surveillance programs for agricultural pests are also limited to a few species that are responsible for the most economic damage. As a consequence, intensive agriculture usually promotes the blanket use of pesticides at high concentrations without assessing the presence of target pests. Some modern pesticides seek to reduce non-target impacts (Vyas 1988), but this specificity also means that resistance often evolves quickly in the target pests.
DNA metabarcoding provides an alternative to conventional approaches for biodiversity monitoring. As it can rapidly generate georeferenced occurrence data for many species at low cost, it has been increasingly adopted to monitor populations of aquatic and terrestrial arthropods (Ji et al. 2013; Beng et al. 2016; Elbrecht & Steinke 2018, Braukmann et al. 2019, Steinke et al. 2022), vertebrates (Sato et al. 2017), pollen (Bell et al. 2017), diatoms (Vasselon et al. 2017), and fungi (Bellemain et al. 2012; Aas et al. 2017; Tedersoo et al. 2018). However, the accuracy and reliability of these results hinges on the quality and completeness of the DNA barcode reference libraries (Collins et al 2021, deWaard et al. 2019, Weigand et al. 2019). This is also true for pest monitoring using DNA barcodes (e.g., Ashfaq & Hebert 2016, Batovska et al. 2021, Lee et al. 2019, Madden et al 2019). Although major programs are underway to build these comprehensive reference libraries (Hobern 2021), the number of unregistered species is still far larger than those with coverage (1.28M of estimated 10M). The DNA barcode reference libraries for the terrestrial arthropods of Canada (Pentinsaari et al in prep), is particularly comprehensive (Hebert et al. 2016, deWaard et al. 2019, Steinke et al. 2022). However, this is the exception so studies on other regions often focus on specific taxonomic groups with a limited geographic scope (e.g., Moriniere et al. 2019, Delrieu-Trottin et al. 2019, Lin et al 2020). Smaller, targeted libraires, e.g., for arthropods of biosecurity concern, such as agricultural pests, are more attainable and contribute to the overarching goal of building a fully parameterized library of all species (Ashfaq & Hebert, 2016; Piper et al. 2019). But can they deliver reliable pest identification?
This study examines the feasibility of using metabarcoding to assess insect diversity and detect pest species in agricultural settings. It introduces a curated reference library for most registered pests of Canadian agriculture and applies it to metabarcoding datasets obtained from Malaise trap samples collected at two experimental farms in southern Ontario to determine the composition and dynamics of the pest species community throughout a full growing season.
2. Material and Methods
2.1. Sample Collection
Two research farms were sampled in 2017: Arkell Research Station in Guelph, Ontario and Elora Research Station in Elora, Ontario (Figure 1A). At each farm, three fields with different crop were monitored. In Arkell, a 20.2-hectare (ha) soy field (AS), a 35.6 ha corn field (AC), and a 42.1 ha wheat field (AW) were sampled (Figure 1B). In Elora, a 6.1 ha soy field (ES), an 8.1 ha corn field (EC), and a 4.0 ha alfalfa field (EA) were sampled (Figure 1C).
Five 4-headed Sea Land Air Malaise (SLAM) traps were deployed at each field; one at the midpoint of each edge and one mid-field. The SLAM traps were positioned so each collecting wedge faced a cardinal direction (Figure 1D). The exact location of each trap is provided in Table S1. In total, 30 traps were deployed across the six fields from May 3 (pre-planting) until November 1 (post-harvest). Weekly samples (24 weeks) were collected in 250mL plastic bottles filled with 95% ethanol for a total of 2,880 samples (24 weeks x 30 traps x 4 bottles).
Because many traps (21/30) interfered with farm activities (tilling, planting, spraying, harvesting), they had to be removed on several occasions for a 7-day duration. Only weekly samples with a complete 7-day sampling duration for all five SLAM traps on a field with no disturbances or additional issues (including trap damage or evaporation of ethanol) were processed. This resulted in a total of 1540 samples that were selected for analysis from each location and crop type to maximize sampling coverage over the season.
2.2. Reference Library Assembly
The list of Canadian arthropod pests of agricultural crops was compiled from multiple sources starting with the list of pests regulated by the Canadian Food Inspection Agency (CFIA - https://inspection.canada.ca/plant-health/invasive-species/eng/1299168913252/1299168989280) and the Digital library of the Centre for Agriculture and Biosciences International (CABI - https://www.cabidigitallibrary.org/journal/cabicompendium) as well as other sources (Table S2). This approach generated a checklist (http://boldsystems.org/index.php/CheckLists_ Management/view?code=CL-CPPT) with 928 species. BOLD was queried for all BINs associated with each species name and its synonyms. The search returned 111,993 records representing 1,403 BINs mapping to 841 of the 928 species in the checklist (BOLD dataset https://boldsystems.org/index.php/MAS_Management_DataConsole?codes=DS-CAPP)
The dataset was filtered to exclude COI sequences shorter than 450bp, records lacking latitude and longitude, records containing stop codons, contaminated sequences, or records flagged as problematic on BOLD. Only public records were used. The data was subsequently subsampled to retain five records per distinct BIN/taxon combination, with a preference for the longest sequence length between 600bp and 800bp and an associated image. The final reference library contained 5,103 records representing 1,185 BINs, mapping to 783 Linnean species and is available at dx.doi.org/10.5883/DS-PSCA.
2.3. DNA Extraction and PCR
DNA extraction employed a membrane-based protocol (Ivanova et al. 2007) modified for bulk samples (Steinke et al. 2022). Specimens were removed from ethanol by filtration through a sterile Microfunnel 0.45 µM Supor Membrane Filter (Pall Laboratory) using a 6-Funnel Manifold (Pall Laboratory). The wet weight of each sample was then measured in grams to allow standardization of the ratio of lysis buffer to biomass. After the addition of buffer, each sample was incubated overnight at 56°C while gently mixed on a shaker. Two 50 μl aliquots (technical replicates) from each of the 1540 lysates were then transferred into separate wells in 96-well microplates and DNA extracts were generated using Acroprep 3.0 µm glass fiber/0.2 µm Bio-Inert membrane plates (Pall Laboratory). Each plate contained 88 lysate samples (2 technical replicates of 44 samples), 2 technical replicates of a positive control (lysate from a bulk sample whose component specimens were individually Sanger sequenced – public BOLD dataset - dx.doi.org/10.5883/DS-RRNGS) and 6 negative controls. Each lysate was mixed with 100 μl of binding mix, transferred to a column plate, and centrifuged at 5000 g for 5 min. DNA was then purified with three washes; the first employed 180 μl of protein wash buffer centrifuged at 5000 g for 5 min. Each column was then washed twice with 600 μl of wash buffer centrifuged at 5000 g for 5 min. Columns were transferred to clean tubes and spun dry at 5000 g for 5 min to remove residual buffer before their transfer to clean collection tubes followed by incubation for 30 min at 56°C to dry the membrane. DNA was eluted by adding 60 μl of 10 mM Tris-HCl pH 8.0 followed by centrifugation at 5000 g for 5 min.
PCR reactions employed a standard protocol (Braukmann et al. 2019). Briefly, each reaction included 5% trehalose (Fluka Analytical), 1× Platinum Taq reaction buffer (Invitrogen), 2.5 mM MgCl2 (Invitrogen), 0.1 μM of each primer (Integrated DNA Technologies), 50 μM of each dNTP (KAPA Biosystems), 0.3 units of Platinum Taq (Invitrogen), 2 μl of DNA extract, and Hyclone ultra-pure water (Thermo Scientific) for a final volume of 12.5 μl. Two-stage PCR was used to generate amplicon libraries for sequencing on an Ion Torrent S5 platform. The first round of PCR used the primer combination AncientLepF3 (Prosser et al. 2016) and LepR1 (Hebert et al. 2004) to amplify a 463 bp fragment of COI. Prior to the second PCR, first round products were diluted 2x with ddH2O. Fusion primers were then used to attach platform-specific unique molecular identifiers (UMIs) along with the sequencing adaptors required for Ion Torrent S5 libraries. Both rounds of PCR employed the same thermocycling conditions: initial denaturation at 94 °C for 2 min, followed by 20 cycles of denaturation at 94°C for 40 sec, annealing at 51°C for 1 min, and extension at 72 °C for 1 min, with a final extension at 72°C of 5 min.
2.4. HTS Library Construction
For each plate, labelled products were pooled prior to sequencing. In total, 35 libraries were assembled. Each included two technical replicates of 44 samples plus six technical replicates of an extraction negative and two positive controls respectively (i.e., 96 samples). Samples, together with positive and negative controls, were pooled after UMI tagging to create a library that was analyzed on a 530 chip (35 chips in total). Amplicon libraries were prepared on an Ion Chef (Thermo Fisher Scientific) and sequenced on an Ion Torrent S5 platform at the Centre for Biodiversity Genomics following manufacturer's instructions (Thermo Fisher Scientific).
2.5. Data Analysis
Reads were uploaded to mBRAVE (http://mbrave.net/) for quality filtering and subsequent queries using several reference libraries in an open reference approach. Reads were queried against the Canadian Agricultural Pest library (DS-PSCA) and against five additional system libraries: bacteria (SYS-CRLBACTERIA) to screen for endosymbionts such as Wolbachia, chordates (SYS-CRLCHORDATA), insects (SYS-CRLINSECTA), non-insect arthropods (SYS-CRLNONINSECTARTH), non-arthropod invertebrates (SYS-CRLNONARTHINVERT). All non-arthropod reads were discarded from further analysis. Sequences were only retained if they were >350 bp and met three quality criteria: Mean QV >20; <25% positions with a QV<20; <5% positions with QV<10. Reads were trimmed 30 bp from their 5’ terminus with a set trim length filter of 450 bp. Reads were matched to sequences in each reference library with an ID distance threshold of 3% but were only retained for further analysis if at least five reads matched an OTU in the reference database. This number is based on earlier benchmarking of the assignment algorithm on mBRAVE where IonTorrent generated sequences provided the best compromise between removing error and retaining real matches (Steinke et al. 2022). All reads failing to match any sequence in the five reference libraries were clustered at an OTU threshold of 1% with a minimum of five reads per cluster, again a value based on initial benchmarking. All raw data are available in the NCBI Short Read Archive PRJNA892122.
mBRAVE was used to generate BIN (and OTU) tables including all library queries for each individual plate/run (88 samples, plus six negative and two positive controls, so 96 for each run). Read counts for any BINs recovered from the negative control on a plate were subtracted from the counts for the same BIN in the 88 sample wells in the run. When this subtraction reduced the read count for a BIN to zero, its occurrence was removed. This step reduced the effects of rare tag switching (Elbrecht and Steinke, 2018) and background contamination.
Datasets downloaded from mBRAVE were converted into OTU tables and presence/absence matrices for further analysis using an R script (suppl data). To determine the completeness of sampling, accumulation curves and the Chao-1 estimator for total diversity (Magurran, 2003) were calculated using the vegan package (Oksanen et al., 2018). Differences in BIN composition between the two farms and among the four crop types were examined using non-metric multidimensional scaling (NMDS) with the Bray-Curtis index coefficient as implemented in vegan (Oksanen et al., 2018). The adonis function of the vegan package was used to conduct a Permutational Multivariate Analysis of Variance (PERMANOVA) to partition distance matrices among sources of variation (factors such as site and crop type). All these analyses were done for both the entire dataset and for a subset that only contained matches to the Canadian Agricultural Pest library (DS-CAPP). All analyses were performed in R v.4.1.1 (R Core Team, 2020). For each crop type we confirmed whether matching species have been reported to feed on the respective crop.
To estimate the percentage of species that occur infrequently in the sampled fields and could be considered transients, we counted BINs that were not present in all five traps of a field. In addition, we determined surrounding landscape features by mapping site locations on the 2020 Land Cover of Canada dataset (Natural Resources Canada 2025) using QGIS (QGIS.org 2025). A 2 km buffer was created for each farm before QGIS’s zonal histogram tool determined the number of pixels per buffer of each of eight landcover types (three types of forest, wetland, cropland, barren land, urban, water). These were converted into percent cover. Forest cover types were amalgamated into a single forest designation.
3. Results
Sequence analysis of the 1540 samples produced 317,849,360 reads across 35 S5 runs (mean reads per run = 9.08 million, see Table S3). After filtering, 125,384,173 reads were assigned to a BIN (Barcode Index Number; Ratnasingham & Hebert 2013). Only 0.3% of reads did not find a BIN match on the Barcode of Life Datasystems (BOLD, Ratnasingham & Hebert 2007). These unmatched reads were de novo clustered using mBRAVE with a 99% similarity threshold. This analysis recognized an average of six additional OTUs per sample, but >98% were chimeras, sequences with multiple indels, or NUMTs so they were excluded from further analysis.
A total of 7,707 BINs was detected at the two farms (Figure 2A) with 5,911 BINs at Arkell and 5,227 BINs at Elora. The Chao 1 estimate for the total number of BINs at both sites was 11,631 (Figure 2A), with 9,428 and 8,039 BINs estimated for Arkell and Elora, respectively. Both sites showed many transient species (Arkell 88%, Elora 85%). Table 1 shows the percentage of each landcover type in the 2 km buffer zones around each farm. While both farms are embedded in large cropland/urban areas, a third of Arkell’s surroundings is forest versus 7% at Elora.
Mapping reads against the Canadian Agricultural Pest library (DS-PSCA) revealed matches to 231 BINs when both farms were considered (Figure 2B) with 225 BINs at Arkell and 165 at Elora. The Chao 1 estimate for the total number of pest BINs at both sites was 261 (Figure 2B), with 288 and 188 BINs for Arkell and Elora, respectively. The two sites shared 3,341 BINs overall and 165 of the pest BINs. On average, 0.39 million sequences were recovered per trap per week with an average of 78 BINs (range 4 to 354 BINs, Table S3) per sample. Considering crop types, both soy and alfalfa fields had about 50% higher average richness for the total community (144 and 146, respectively) and the pest assemblage (46 and 47, respectively) than corn and wheat (116 and 107 for all arthropods, 32 and 29 for pests). Average richness of pest species ranged from 32 to 47 per sample (mean=38.5).
The BIN richness for samples collected from the four cardinal directions averaged 132 (range = 27-346). Richness was very similar for all directions, ranging from 128 to 135 BINs. BIN overlap among the four bottles on a trap averaged 23%, meaning that 77% of the BINs recovered from each bottle were unique to it.
A NMDS Ordination plot revealed that BIN assemblages for the two farms formed distinct cohesive groupings (Figure 3A), while no divergence was apparent among crop types (Figure 3C). NMDS plots for the observed pest assemblages showed the opposite – the two farms were not separable (Figure 3B), but there was separation for certain crop types (Figure 3D). A PERMANOVA analysis suggested that overall community structure varied between farms (R2 = 0.14, P = 0.0001) and crop type (R2 = 0.17, P = 0.0001). Pest communities varied weakly between sites (R2 = 0.09, P = 0.0001) but more strongly between crop types (R2 = 0.30, P = 0.0001) (Table 2).
Taxonomic composition at an ordinal level was similar among the samples, with over half of the BINs being flies (Diptera), followed by Hymenoptera, Lepidoptera, Coleoptera, and Hemiptera (Figure 4). Composition shifted within the pest assemblages (Figure 4) as most pest BINs were Lepidoptera, followed by Coleoptera, Hemiptera, and Diptera. Only one third of the detected pest species feed on the crops in which they were found (Wheat – 29.7%, Corn – 36.1%, Soy – 28.4%, Alfalfa - 38.2%). About 22% of all detections are pests of trees, so most (96%) were identified as transient species.
4. Discussion
This study used metabarcoding to examine the species composition of 1,540 samples (4 samples per trap and week = 385 trap weeks) derived from 30 SLAM traps deployed at two experimental farms in Southern Ontario. The results not only confirm the feasibility of a DNA-based biomonitoring to measure the species composition of arthropod communities but also demonstrate its capacity to monitor and identify pest species using a curated reference library for all known Canadian plant pests. With a cost of about $150 CDN per trap sample (four collecting bottles due to SLAM design, using 2 replicate samples of each) and a processing time of a week (extraction to sequencing) for sets of 88-132 samples at a time, this approach is fast, cost-effective, and scalable. These advantages are critical for the large-scale rapid detection of registered pest species (Ball & Armstrong 2008) necessary to effectively monitor agroecosystems.
We observed a rather large difference between the number of arthropod species detected (N=7,707) and the Chao estimator of the likely true richness (N=11,631). The low overlap among bottles from individual traps reinforces this conclusion. However, the trade-off is 4x the effort and cost for DNA extraction and sequencing as well as smaller bottle size requiring shorter sampling intervals. Overall, our sampling was insufficient to collect all BINs at each farm. Earlier work suggests that decreasing the distances between individual traps can increase diversity coverage (e.g. Steinke et al 2021) but this would require deploying many more traps which would not be feasible in active farming operations as traps represent an obstacle in daily operations.
Flying insects are highly mobile and our estimate of transient species suggested that most species collected from the farm fields were likely just passing through. This is supported by the fact that 37% of the species were only collected once. By comparison, 12-15% of species were collected by all traps at a farm, suggesting these represent core members of the local community. Transient species likely originated from neighbouring forests, shrubland, and wetlands. Although both sites are mainly surrounded by cropland and urban development, the surrounding 2 km buffer zone also included forests. Arkell had considerably more forest cover than Elora (31% vs 7%) which likely explains its higher BIN richness. Hallmann et al. (2017) hypothesized that such areas, which serve as insect sources, are negatively affected and drained by the neighbouring agricultural fields which serve as ecological traps which expose insects to pesticides.
The current approach to crop protection is Integrated Pest Management (IPM) which seeks to minimize crop damage by the most economical means and the least impact on non-target organisms (Bottrell & Bottrell 1979, Deguine et al 2021). Successful IPM begins with the reliable identification of pest species, and DNA barcoding has been slowly incorporated into some routine workflows of regulatory agencies (Floyd et al. 2010, Jones et al. 2013). However, to facilitate this, there is a need for comprehensive reference libraries on key pest species. Our reference library for registered arthropod pests in Canada covers federal and provincial regulatory requirements and includes 816 species or 1,193 BINs. The higher BIN than species count likely reflects the observation that nearly a third of agricultural pest species appear to be species complexes (Ashfaq & Hebert 2016). By mapping BINs to a species name, we increased the power of this already well parameterized library (88% of all registered species) sourced from earlier large-scale efforts to register all Canadian species (Hebert et al. 2016, de Waard et al 2019).
About 25% (231) of the registered pest species were detected at both sites. A Chao estimator puts this number closer to 261, about 3% of the overall BIN count. The presence of so many BINs poses a challenge to alternative approaches of pest identification such as morphological inspection or even machine learning supported by computer vision (Park et al 2023, Schneider et al 2023, Li et al 2019). Morphological assignments are limited by the lack of taxonomists and by the lack of diagnostic morphological characters (Sweeney et al 2011). The challenge for machine learning systems is the need for training data (hundreds if not thousands of images) for each potential pest species (Schneider et al 2023), which poses a challenge because the list of Canadian Agricultural pests contains >900 nominal species.
It is known that both the rotation and abundance of crops have local impacts on pest infestations, leading to the idea that the manipulation of crop structure could alleviate insect damage, promote biological control, and allow reduced pesticide use (Tscharntke et al 2005, Larsen & Noack 2017, Haan et al 2020). However, it has also been shown that pests vary in their response to crop abundance (Rosenheim et al 2022). The high diversity of pests observed in this study makes crop consolidation for this assemblage a major challenge for impactful management strategies although only one third of the detected pest species actually attack the crop growing where they were collected. In fact, many of the pest species do not feed on any of the crops; 22% are forest pests. For example, the Emerald Ash Borer (Agrilus planipennis) is responsible for approximately $1.2 billion annual damage (Aukema et al 2011). The species was frequently collected at Arkell, but just once at Elora, reflecting its lower forest cover. Again, this and many other observed pest species can be considered transient species originating from nearby forests, shrubland, and wetlands.
While the overall community composition differed significantly between the sites which are about 30 km apart (Figure 3A), we found little compositional differences between pest species (Figure 3B). The opposite was true for associations with crop types. Pest assemblies differed between crop types (Figure 3D), while overall arthropod communities largely overlap across crop types except for communities from wheat fields (Figure 3C). In general, arthropod diversity was about 50% higher in soy and alfalfa fields than in wheat and corn as they represent structurally more complex habitats. As habitat complexity is considered a key driver of biodiversity (MacArthur 1965, Badgley et al. 2017, Loke & Chisholm 2022) both soy and alfalfa provide a more suitable environment for many arthropods with the unintended side-effect that pest species thrive under these conditions. Especially for alfalfa we found that 38% of the observed pest species feed on the crop. Given that soybean and alfalfa production in Canada have increased in recent years (Statistics Canada. Tables 32-10-0359-01, 32-10-0043-01) this could be reason for concern.
5. Conclusions
This study confirms that DNA metabarcoding enables cost-effective biomonitoring which can measure species diversity at multiple levels of arthropod community organization. A very large proportion of detected species likely represents insects from nearby forests. This ongoing transfer of species might add additional harmful species to the farming operation, but these movements also expose forest species to pesticides We continuously monitored and identified pest species and secured results within a week using a curated reference library for all known and registered Canadian plant pests. Our results also showed a diverse community of pest species present in farm fields over the course of a growing season, with preferences for specific crop types. These findings pose some challenges because management practices that must consider an array of species rather than just a few key pests.
Supplementary Materials
The following supporting information can be downloaded at the website of this paper posted on Preprints.org.
Author Contributions
DS, JRDW, JES, EVZ, and PDNH designed the study. DS, JES, KP coordinated the study. SLDW did bench work and contributed to analyses. CH, MA, DS assembled and edited the Canadian Pest Reference Library. DS did the analyses and wrote the original manuscript while PDNH, JES, and SR revised it.
Acknowledgements
We thank the collections, sequencing, and informatics staff at the Centre for Biodiversity Genomics for acquiring and processing the specimens analyzed in this study. We are very grateful to staff at Elora Research Station and Arkell Research station for facilitating collections. This study was enabled by awards to PDNH from the Canada First Research Excellence Fund to the University of Guelph’s “Food From Thought” research program (Project 000054), the New Frontiers in Research Fund (NFRFT-2020-00073), Canada Foundation for Innovation (MSI 42450) as well as the Ontario Ministry of Economic Development, Job Creation and Trade, and the Ontario Ministry of Colleges and Universities.
References
- Aas, A.B.; Davey, M.L.; Kauserud, H. ITS all right mama: investigating the formation of chimeric sequences in the ITS2 region by DNA metabarcoding analyses of fungal mock communities of different complexities. Mol. Ecol. Resour. 2016, 17, 730–741. [Google Scholar] [CrossRef]
- Ashfaq, M.; Hebert, P.D.; Naaum, A. DNA barcodes for bio-surveillance: regulated and economically important arthropod plant pests. Genome 2016, 59, 933–945. [Google Scholar] [CrossRef] [PubMed]
- Aukema, J.E.; Leung, B.; Kovacs, K.; Chivers, C.; Britton, K.O.; Englin, J.; Frankel, S.J.; Haight, R.G.; Holmes, T.P.; Liebhold, A.M.; et al. Economic Impacts of Non-Native Forest Insects in the Continental United States. PLOS ONE 2011, 6, e24587. [Google Scholar] [CrossRef] [PubMed]
- Badgley, C.; Smiley, T.M.; Terry, R.; Davis, E.B.; DeSantis, L.R.; Fox, D.L.; Hopkins, S.S.B.; Jezkova, T.; Matocq, M.D.; Matzke, N.; McGuire, J.L.; Mulch, A.; Riddle, B.R.; Roth, V.L.; Samuels, J.X.; Strömberg, C.A.E.; Yanites, B.J. Biodiversity and topographic complexity: modern and geohistorical perspectives. Trends in Ecology & Evolution 2017, 32, 211–226. [Google Scholar]
- Ball, S.L.; Armstrong, K.F. Rapid, one-step DNA extraction for insect pest identification by using DNA barcodes. Journal of Economical Entomology 2008, 101, 523–532. [Google Scholar] [CrossRef]
- Bass, C.; Denholm, I.; Williamson, M.S.; Nauen, R. The global status of insect resistance to neonicotinoid insecticides. Pestic. Biochem. Physiol. 2015, 121, 78–87. [Google Scholar] [CrossRef]
- Batovska, J.; Piper, A.M.; Valenzula, I.; Cunningham, J.P.; Blacket, M.J. Developing a non-destructive metabarcoding protocol for detection of pest insects in bulk trap catches. Scientific Reports 2021, 11, 7946. [Google Scholar] [CrossRef]
- Beng, K.C.; Tomlinson, K.W.; Shen, X.H.; Surget-Groba, Y.; Hughes, A.C.; Corlett, R.T.; Slik, J.W.F. The utility of DNA metabarcoding for studying the response of arthropod diversity and composition to land-use change in the tropics. Sci. Rep. 2016, 6, 24965–24965. [Google Scholar] [CrossRef]
- Benton, T.G.; Vickery, J.A.; Wilson, J.D. Farmland biodiversity: is habitat heterogeneity the key? Trends in Ecology and Evolution 2003, 18, 182–188. [Google Scholar] [CrossRef]
- Benton, T.G.; Bieg, C.; Harwatt, H.; Pudasaini, R.; Wellesley, L. (2021). Food system impacts on biodiversity loss. Energy, Environment and Resources Programme, Chatham House.
- Bell, K.L.; Fowler, J.; Burgess, K.S.; Dobbs, E.K.; Gruenewald, D.; Lawley, B.; Morozumi, C.; Brosi, B.J. Applying pollen DNA metabarcoding to the study of plant–pollinator interactions. Appl. Plant Sci. 2017, 5. [Google Scholar] [CrossRef]
- Bellemain, E.; Davey, M.L.; Kauserud, H.; Epp, L.S.; Boessenkool, S.; Coissac, E.; Geml, J.; Edwards, M.; Willerslev, E.; Gussarova, G.; et al. Fungal palaeodiversity revealed using high-throughput metabarcoding of ancient DNA from arctic permafrost. Environ. Microbiol. 2012, 15, 1176–1189. [Google Scholar] [CrossRef] [PubMed]
- Bottrell, D.R.; Bottrell, D.G. (1979). Integrated pest management. Council on Environmental Quality. Washington, DC.
- Braukmann, T.W.A.; Prosser, S.J.R.; Ivanova, N.V.; Elbrecht, V.; Steinke, D.; Ratnasingham, R.; deWaard, J.R.; Sones, J.E.; Zakharov, E.V.; Hebert, P.D.N. Metabarcoding a diverse arthropod mock community. Molecular Ecology Resources 2019, 19, 711–727. [Google Scholar] [CrossRef] [PubMed]
- Collins, R.A.; Trauzzi, G.; Maltby, K.M.; Gibson, T.I.; Ratcliffe, F.C.; Hallam, J.; Rainbird, S.; Maclaine, J.; Henderson, P.A.; Sims, D.W.; et al. Meta-Fish-Lib: A generalised, dynamic DNA reference library pipeline for metabarcoding of fishes. J. Fish Biol. 2021, 99, 1446–1454. [Google Scholar] [CrossRef] [PubMed]
- Dainese, M.; Isaac, N.J.B.; Powney, G.D.; Bommarco, R.; Öckinger, E.; Kuussaari, M.; Pöyry, J.; Benton, T.G.; Gabriel, D.; Hodgson, J.A.; et al. Landscape simplification weakens the association between terrestrial producer and consumer diversity in Europe. Glob. Chang. Biol. 2017, 23, 3040–3051. [Google Scholar] [CrossRef]
- Deguine, J.-P.; Aubertot, J.-N.; Flor, R.J.; Lescourret, F.; Wyckhuys, K.A.; Ratnadass, A. Integrated pest management: good intentions, hard realities. A review. Agron. Sustain. Dev. 2021, 41, 1–35. [Google Scholar] [CrossRef]
- Delrieu-Trottin, E.; Williams, J.T.; Pitassy, D.; Driskell, A.; Hubert, N.; Viviani, J.; Cribb, T.H.; Espiau, B.; Galzin, R.; Kulbicki, M.; et al. A DNA barcode reference library of French Polynesian shore fishes. Sci. Data 2019, 6, 1–8. [Google Scholar] [CrossRef]
- Deutsch, C.A.; Tewksbury, J.J.; Tigchelaar, M.; Battisti, D.S.; Merrill, S.C.; Huey, R.B.; Naylor, R.L. Increase in crop losses to insect pests in a warming climate. Science 2018, 361, 916–919. [Google Scholar] [CrossRef] [PubMed]
- deWaard, J.R.; Ratnasingham, S.; Zakharov, E.V.; Borisenko, A.V.; Steinke, D.; Telfer, A.C.; Perez, K.H.J.; Sones, J.E.; Young, M.R.; Levesque-Beaudin, V.; Sobel, C.N.; Abrahamyan, A.; Bessonov, K.; Blagoev, G.; deWaard, S.L.; Ho, C.; Ivanova, N.V.; Layton, K.S.; Lu, L.; Manjunath, R.; McKeown, J.T.A.; Milton, M.M.; Miskie, R.; Monkhouse, N.; Naik, S.; Nikolova, N.; Pentinsaari, M.; Prosser, S.W.J.; Radulovici, A.E.; Steinke, C.; Warne, C.P.; Hebert, P.D.N. A reference library for Canadian invertebrates with 1.5 million barcodes, voucher specimens, and DNA samples. Scientific Data 2019, 6, 308. [Google Scholar] [CrossRef]
- Elbrecht, V.; Steinke, D. Scaling up DNA metabarcoding for freshwater macrozoobenthos monitoring. Freshw. Biol. 2018, 64, 380–387. [Google Scholar] [CrossRef]
- Floyd, R.; Lima, J.; Dewaard, J.; Humble, L.; Hanner, R. Common goals: policy implications of DNA barcoding as a protocol for identification of arthropod pests. Biol. Invasions 2010, 12, 2947–2954. [Google Scholar] [CrossRef]
- Natural Resources Canada, Canada Centre for Remote Sensing. (2025). 2020 Land Cover of Canada. Natural Resources Canada, Federal Geospatial Platform. https://osdp-psdo.canada.ca/dp/en/search/metadata/NRCAN-FGP-1-ee1580ab-a23d-4f86-a09b-79763677eb47.
- Haan, N.L.; Zhang, Y.; Landis, D.A. Predicting Landscape Configuration Effects on Agricultural Pest Suppression. Trends Ecol. Evol. 2020, 35, 175–186. [Google Scholar] [CrossRef]
- Hallmann, C.A.; Sorg, M.; Jongejans, E.; Siepel, H.; Hofland, N.; Schwan, H.; Stenmans, W.; Müller, A.; Sumser, H.; Hörren, T.; et al. More than 75 percent decline over 27 years in total flying insect biomass in protected areas. PLOS ONE 2017, 12, e0185809–e0185809. [Google Scholar] [CrossRef] [PubMed]
- Hebert, P.D.N.; Penton, E.H.; Burns, J.M.; Janzen, D.H.; Hallwachs, W. Ten species in one: DNA barcoding reveals cryptic species in the neotropical skipper butterflyAstraptes fulgerator. Proc. Natl. Acad. Sci. 2004, 101, 14812–14817. [Google Scholar] [CrossRef]
- Hebert, P.D.N.; Ratnasingham, S.; Zakharov, E.V.; Telfer, A.C.; Levesque-Beaudin, V.; Milton, M.M.; Pederson, S.; Janetta, P.; deWaard, J.R. Counting animal species with DNA barcodes: Canadian insects. Philosophical Transactions of the Royal Society B 2016, 371, 20150333. [Google Scholar] [CrossRef] [PubMed]
- Herzog, F.; Franklin, J. State-of-the-art practices in farmland biodiversity monitoring for North America and Europe. AMBIO 2016, 45, 857–871. [Google Scholar] [CrossRef] [PubMed]
- Hobern, D.G.; Adamowicz, S. BIOSCAN: DNA barcoding to accelerate taxonomy and biogeography for conservation and sustainability. Genome 2021, 64, 161–164. [Google Scholar] [CrossRef]
- Ivanova, N.V.; deWaard, J.R.; Hebert, P.D.N. An inexpensive automation-friendly protocol for recovering high-quality, D.N.A. Molecular Ecology Resources 2006, 6, 998–1002. [Google Scholar]
- Li, C.; Chng, K.R.; Boey, E.J.H.; Ng, A.H.Q.; Wilm, A.; Nagarajan, N. INC-Seq: accurate single molecule reads using nanopore sequencing. GigaScience 2016, 5, 34. [Google Scholar] [CrossRef]
- Jones, Y.L.; Peters, S.M.; Weland, C.; Ivanova, N.; Yancy, H.F. Potential Use of DNA Barcodes in Regulatory Science: Identification of the U.S. Food and Drug Administration's ``Dirty 22,'' Contributors to the Spread of Foodborne Pathogens. J. Food Prot. 2013, 76, 144–149. [Google Scholar] [CrossRef]
- Larsen, A.E.; Noack, F. Identifying the landscape drivers of agricultural insecticide use leveraging evidence from 100,000 fields. Proc. Natl. Acad. Sci. 2017, 114, 5473–5478. [Google Scholar] [CrossRef]
- Lee, T.R.C.; Anderson, S.J.; Tran-Nguyen, L.T.T.; Sallam, N.; Le Ru, B.P.; Conlong, D.; Powell, K.; Ward, A.; Mitchell, A. Towards a global DNA barcode reference library for quarantine identifications of lepidoptera stemborers, with an emphasis on sugarcane pests. Scientific Reports 2019, 9, 7039. [Google Scholar]
- Li, R.; Wang, R.; Xie, C.; Liu, L.; Zhang, J.; Wang, F.; Liu, W. A coarse-to-fine network for aphid recognition and detection in the field. Biosyst. Eng. 2019, 187, 39–52. [Google Scholar] [CrossRef]
- Lin, X.; Mo, L.; Bu, W.; Wang, X.; Khim, J.S. The first comprehensive DNA barcode reference library of Chinese Tanytarsus (Diptera: Chironomidae) for environmental DNA metabarcoding. Divers. Distrib. 2020, 27, 1932–1941. [Google Scholar] [CrossRef]
- Lister, B.C.; Garcia, A. Climate-driven declines in arthropod abundance restructure a rainforest food web. Proceedings of the National Academy of Sciences of the United States of America 2018, 115, E10397–E10406. [Google Scholar] [CrossRef] [PubMed]
- Loke, L.H.L.; Chisholm, R.A. Measuring habitat complexity and spatial heterogeneity in ecology. Ecology Letters 2022, 15, 2269–2288. [Google Scholar] [CrossRef]
- Losey, J.E.; Vaughan, M. The Economic Value of Ecological Services Provided by Insects. BioScience 2006, 56, 311–323. [Google Scholar] [CrossRef]
- Lucas, J.A.; Hawkins, N.J.; Fraaije, B.A. The evolution of fungicide resistance. Advances in Applied Microbiology 2015, 90, 29–92. [Google Scholar]
- MacArthur, R.H. Patterns of species diversity. Biological Reviews 1965, 4, 510–533. [Google Scholar] [CrossRef]
- Madden, M.J.L.; Young, R.G.; Brown, J.W.; Miller, S.E.; Frewin, A.J.; Hanner, R.H. Using DNA barcoding to improve invasive pest identification at U.S. ports-of-entry. PLoS ONE 2019, 14, e0222291. [Google Scholar] [CrossRef]
- Magurran, A.E. Measuring Biological Diversity. Wiley-Blackwell, Malden, Massachusetts; 2003.
- Moriniere, J.; Balke, M.; Doczkal, D.; Geiger, M.F.; Hardulak, L.A.; Haszprunar, G.; Hausmann, A.; Hendrich, L.; Regalado, L.; Rulik, B.; Schmidt, S.; Waegele, J.W.; Hebert, P.D.N. A DNA barcode library for 5,200 German flies and midges (Insecta:Diptera) and its implications for metabarcoding-based biomonitoring. Molecular Ecology Resources 2019, 19, 900–928. [Google Scholar] [CrossRef]
- Oksanen, J.; Simpson, G.L.; Blanchet, F.G.; Kindt, R.; Legendre, P.; Minchin, P.R.; O'HAra, R.; Solymos, P.; Stevens, M.H.H.; Szoecs, E.; et al. vegan: Community Ecology Package. R package version 2.5-1. https://CRAN.R-project.org/package=vegan; 2018.
- Park, Y.-H.; Choi, S.H.; Kwon, Y.-J.; Kwon, S.-W.; Kang, Y.J.; Jun, T.-H. Detection of Soybean Insect Pest and a Forecasting Platform Using Deep Learning with Unmanned Ground Vehicles. Agronomy 2023, 13, 477. [Google Scholar] [CrossRef]
- Piper, A.M.; Batovska, J.; Cogan, N.O.I.; Weiss, J.; Cunningham, J.P.; Rodoni, B.C.; Blacket, M.J. Prospects and challenges of implementing DNA metabarcoding for high-throughput insect surveillance. GigaScience 2019, 8, giz092. [Google Scholar] [CrossRef]
- Powles, S.B.; Yu, Q. Evolution in Action: Plants Resistant to Herbicides. Annu. Rev. Plant Biol. 2010, 61, 317–347. [Google Scholar] [CrossRef]
- Prosser SWJ, deWaard JR, Miller SE, Hebert PDN DNA barcodes from century-old type specimens using next-generation sequencing. Molecular Ecology Resources 2016, 16, 487–497. [CrossRef] [PubMed]
- QGIS.org. QGIS Geographic Information System. QGIS Association. Available online: http://www.qgis.org.
- R Core Team. R: A Language and Environment for Statistical Computing; R Foundation for Statistical Computing: Vienna, Austria, 2023; Available online: https://www.R-project.org/.
- Ratnasingham, S.; Hebert, P.D.N. BOLD: The Barcode of Life Data System (www.barcodinglife.org). Molecular Ecology Notes 2007, 7, 355–364. [Google Scholar] [CrossRef]
- Ratnasingham, S.; Hebert, P.D.N. A DNA-based registry for all animal species: The Barcode Index Number (BIN) System. PLoS ONE 2013, 8, e66213. [Google Scholar] [CrossRef] [PubMed]
- Rosenheim, J.A.; Cluff, E.; Lippey, M.K.; Cass, B.N.; Paredes, D.; Parsa, S.; Karp, D.S.; Chaplin-Kramer, R. Increasing crop field size does not consistently exacerbate insect pest problems. Proc. Natl. Acad. Sci. 2022, 119. [Google Scholar] [CrossRef]
- Sánchez-Bayo, F.; Wyckhuys, K.A. Worldwide decline of the entomofauna: A review of its drivers. Biol. Conserv. 2019, 232, 8–27. [Google Scholar] [CrossRef]
- Sato, H.; Sogo, Y.; Doi, H.; Yamanaka, H. Usefulness and limitations of sample pooling for environmental DNA metabarcoding of freshwater fish communities. Sci. Rep. 2017, 7, 1–12. [Google Scholar] [CrossRef]
- Schneider, S.; Taylor, G.W.; Kremer, S.C.; Fryxell, J.M. Getting the bugs out of AI: Advancing ecological research on arthropods through computer vision. Ecol. Lett. 2023, 26, 1247–1258. [Google Scholar] [CrossRef]
- Seibold, S.; Goßner, M.; Simons, N.; Blüthgen, N.; Müller, J.; Ambarli, D.; Ammer, C.; Bauhus, J.; Fischer, M.; Fürstenau, C.; et al. Arthropod decline in grasslands and forests is associated with drivers at landscape level. Nature 2019, 574, 671–674. [Google Scholar] [CrossRef] [PubMed]
- Steinke, D.; Braukmann, T.W.; Manerus, L.; Woodhouse, A.; Elbrecht, V. Effects of Malaise trap spacing on species richness and composition of terrestrial arthropod bulk samples. Metabarcoding Metagenomics 2021, 5, e59201. [Google Scholar] [CrossRef]
- Steinke, D.; deWaard, S.L.; Sones, J.E.; Ivanova, N.V.; Prosser, S.W.J.; Perez, K.; Braukmann, T.W.A.; Milton, M.; Zakharov, E.V.; deWaard, J.R.; Ratnasingham, S.; Hebert, P.D.N. Message in a bottle – metabarcoding enables biodiversity comparisons across ecoregions. GigaScience 2022, 11, giac040. [Google Scholar] [CrossRef]
- Sweeney, B.W.; Battle, J.M.; Jackson, J.K.; Dapkey, T. Can DNA barcodes of stream macroinvertebrates improve descriptions of community structure and water quality? Journal of the North American Benthological Society 2011, 30, 195–216. [Google Scholar] [CrossRef]
- Tedersoo, L.; Tooming-Klunderud, A.; Anslan, S. PacBio metabarcoding of Fungi and other eukaryotes: errors, biases and perspectives. New Phytol. 2017, 217, 1370–1385. [Google Scholar] [CrossRef] [PubMed]
- Tscharntke, T.; Klein, A.M.; Kruess, A.; Steffan-Dewenter, I.; Thies, C. Landscape perspectives on agricultural intensification and biodiversity—ecosystem service management. Ecol. Lett. 2005, 8, 857–874. [Google Scholar] [CrossRef]
- Vasselon, V.; Bouchez, A.; Rimet, F.; Jacquet, S.; Trobajo, R.; Corniquel, M.; Tapolczai, K.; Domaizon, I.; Mahon, A. Avoiding quantification bias in metabarcoding: Application of a cell biovolume correction factor in diatom molecular biomonitoring. Methods Ecol. Evol. 2017, 9, 1060–1069. [Google Scholar] [CrossRef]
- Vogel, G. Where have all the insects gone? Science 2017, 356, 576–579. [Google Scholar] [CrossRef]
- Vyas, S.C. (1988). Nontarget Effects of Agricultural Fungicides. CRC Press, Boca Raton, Florida, USA.
- Weigand, H.; Beermann, A.J.; Čiampor, F.; Costa, F.O.; Csabai, Z.; Duarte, S.; Geigerg, M.F.; Grabowski, M.; Rimet, F.; Rulik, B.; et al. DNA barcode reference libraries for the monitoring of aquatic biota in Europe: Gap-analysis and recommendations for future work. Sci. Total Environ. 2019, 678, 499–524. [Google Scholar] [CrossRef]
Figure 1.
(A) Map of sampling sites within Canada and within southern Ontario (insert). (B) Map of six crop fields sampled at the Elora and (C) Arkell research stations. Trap locations are indicated by red dots and trap number. Diagram insert (D) shows trap placement and orientation at each field; each collecting wedge faces a cardinal direction.
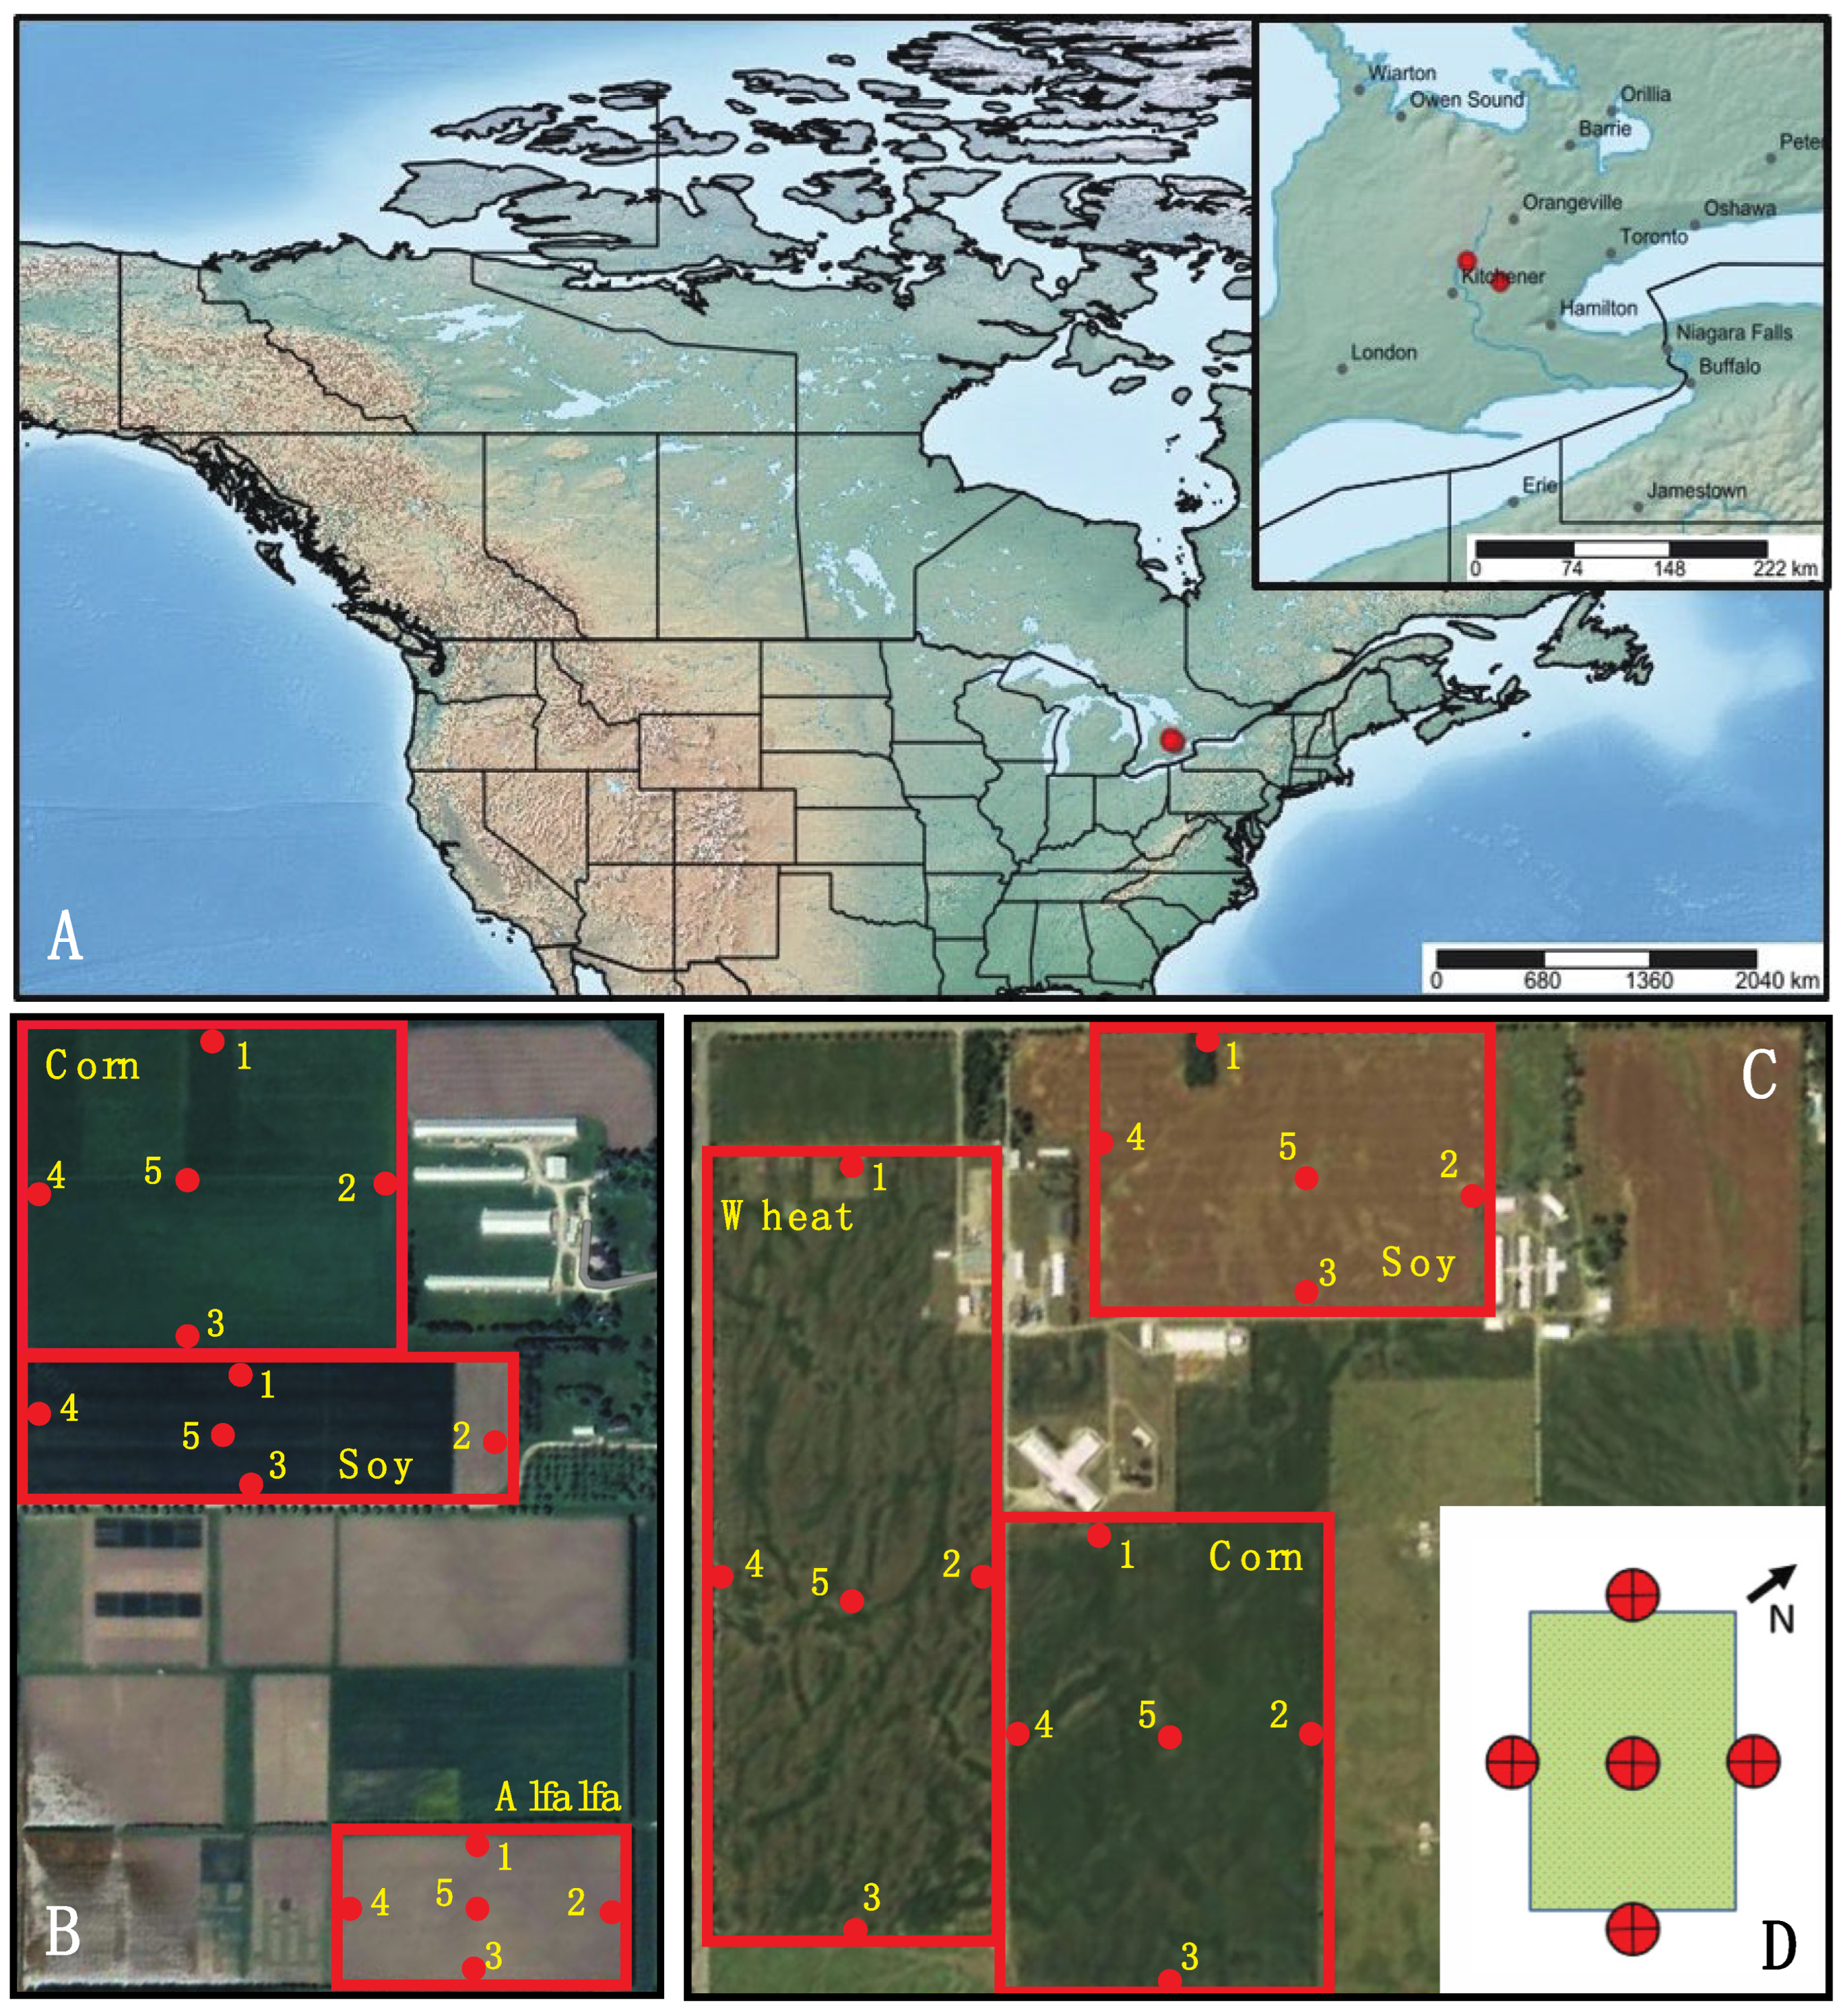
Figure 2.
Accumulation curves per site for A) the 1672 Malaise trap samples collected at two experimental farms in Southern Ontario and B) a subset including only matches to a Canadian Agricultural Pest library.
Figure 2.
Accumulation curves per site for A) the 1672 Malaise trap samples collected at two experimental farms in Southern Ontario and B) a subset including only matches to a Canadian Agricultural Pest library.
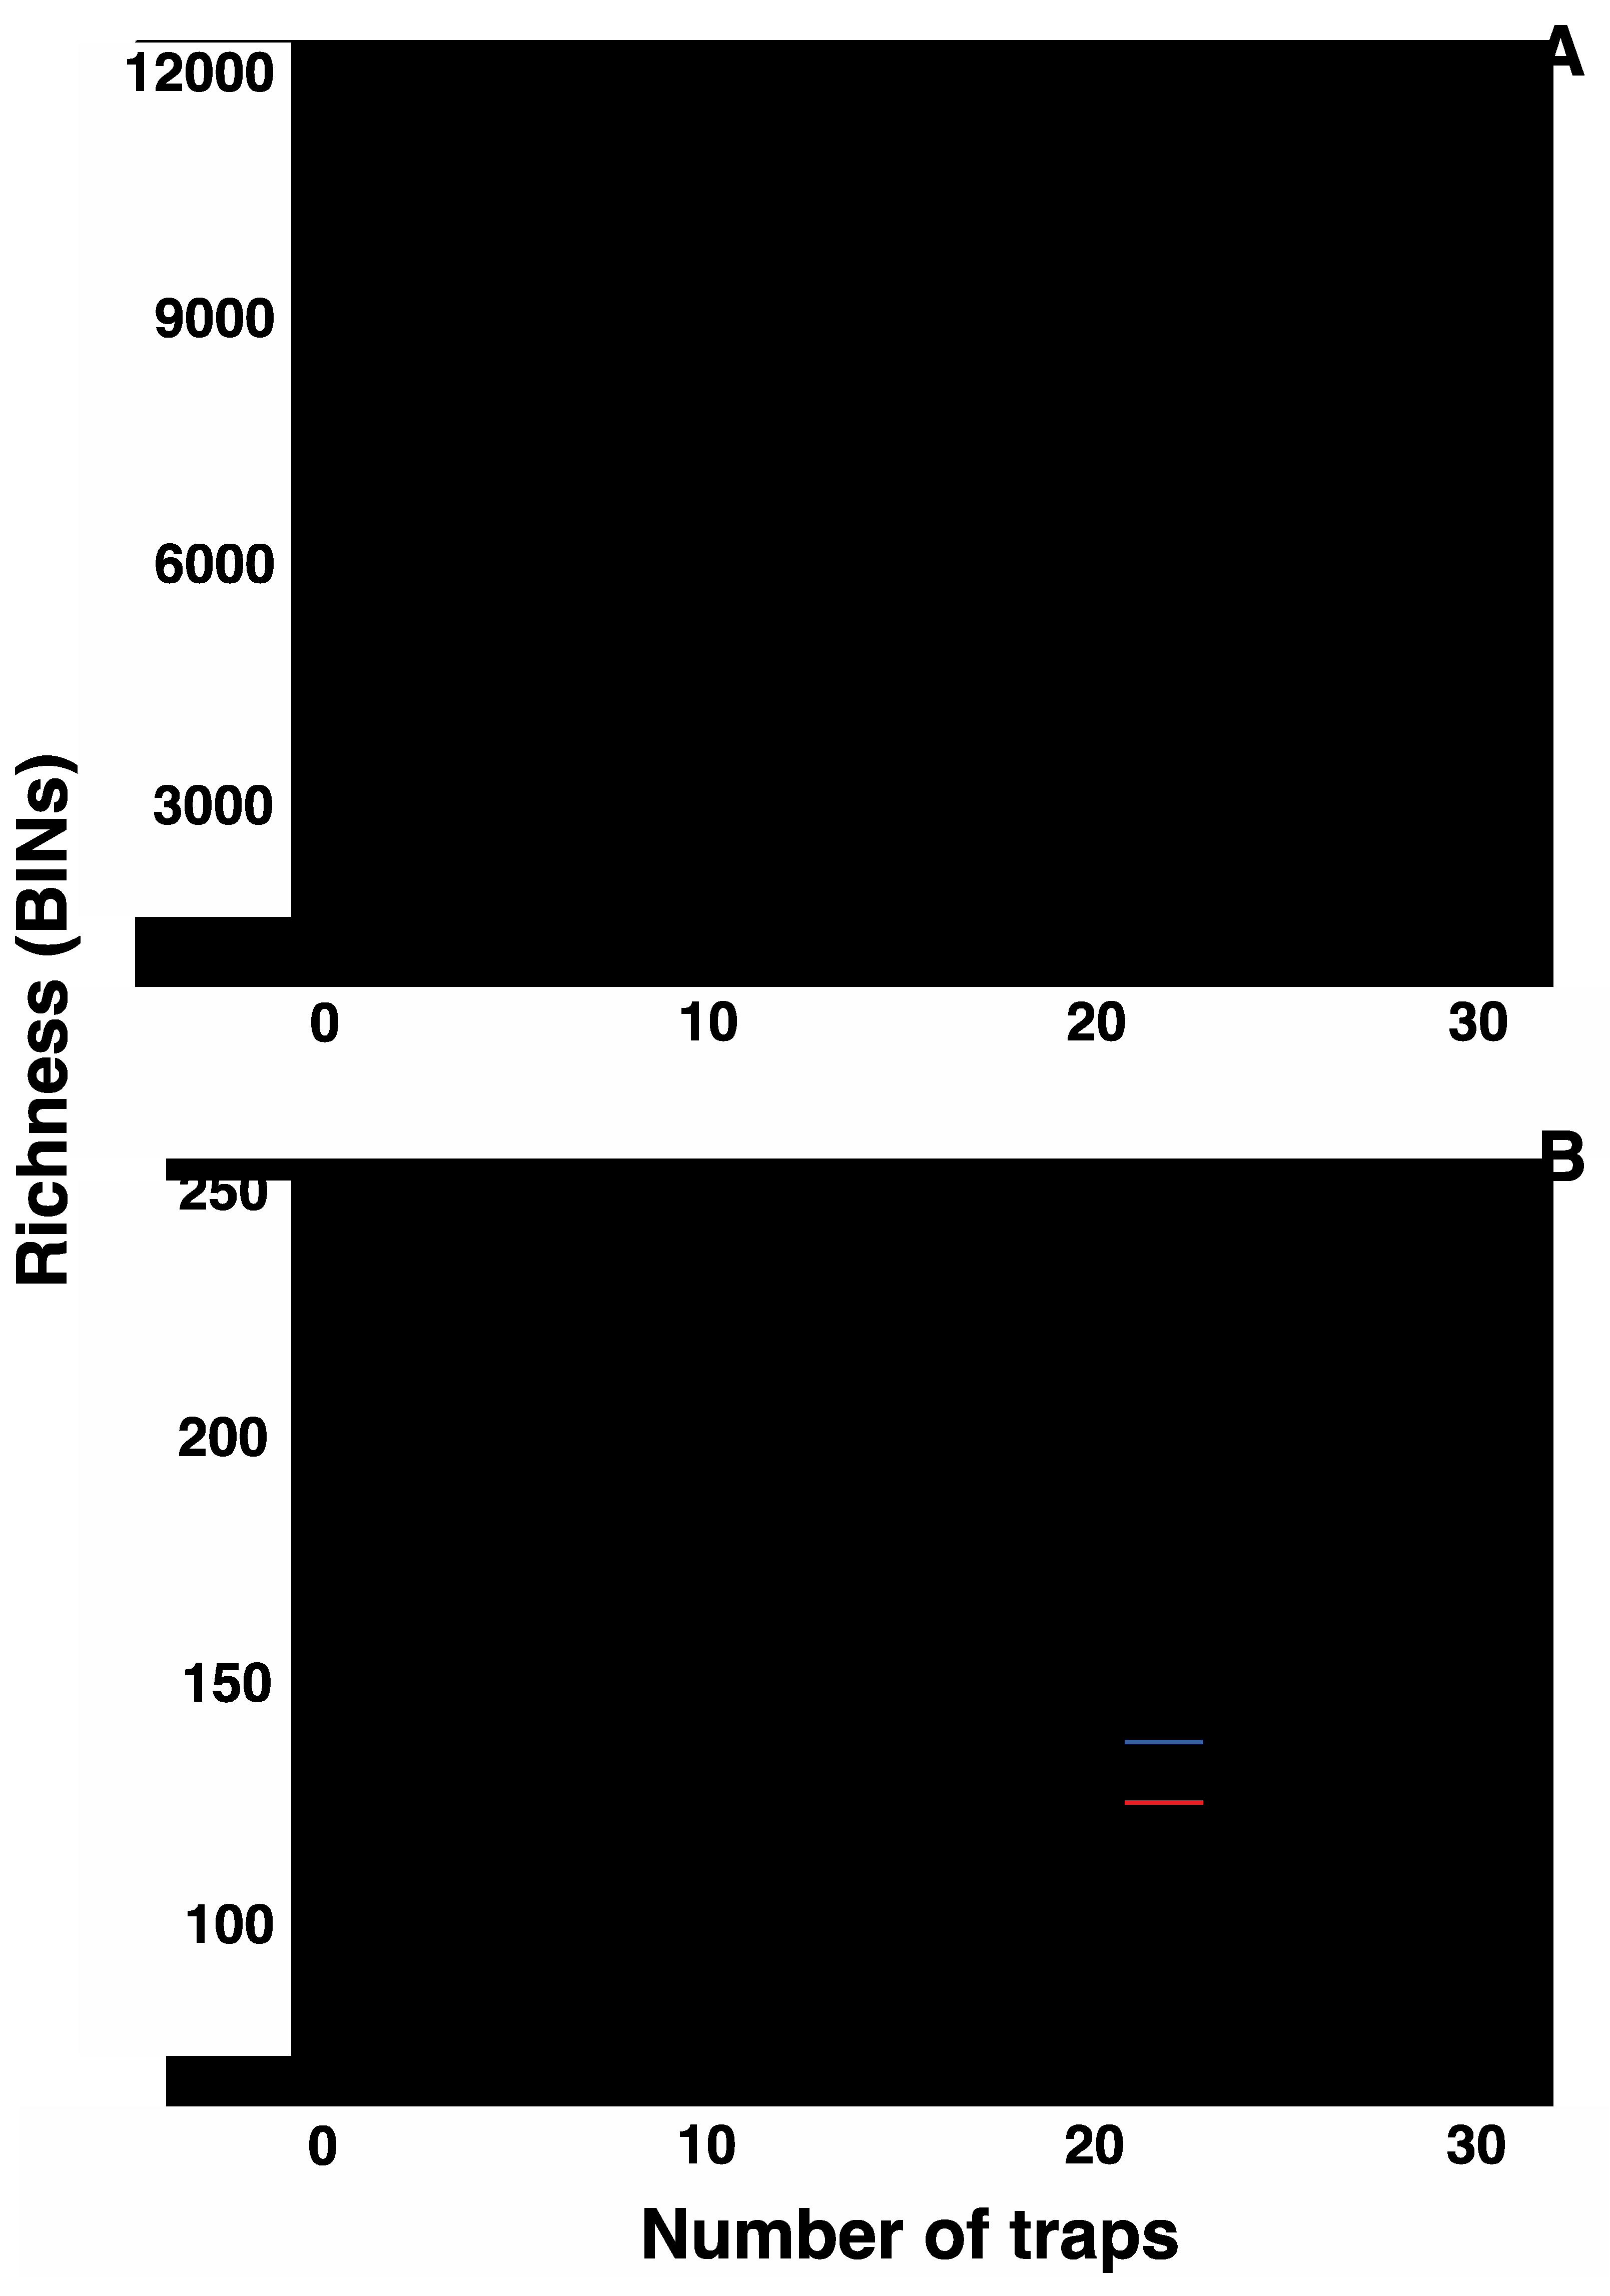
Figure 3.
Non-metric multidimensional scaling (NMDS) plots for all samples (A, C) and the Canadian Agricultural Pest subset (B, D) using the Bray-Curtis index coefficient. Colour coding is based on sites (A, B) or crop type (C, D).
Figure 3.
Non-metric multidimensional scaling (NMDS) plots for all samples (A, C) and the Canadian Agricultural Pest subset (B, D) using the Bray-Curtis index coefficient. Colour coding is based on sites (A, B) or crop type (C, D).
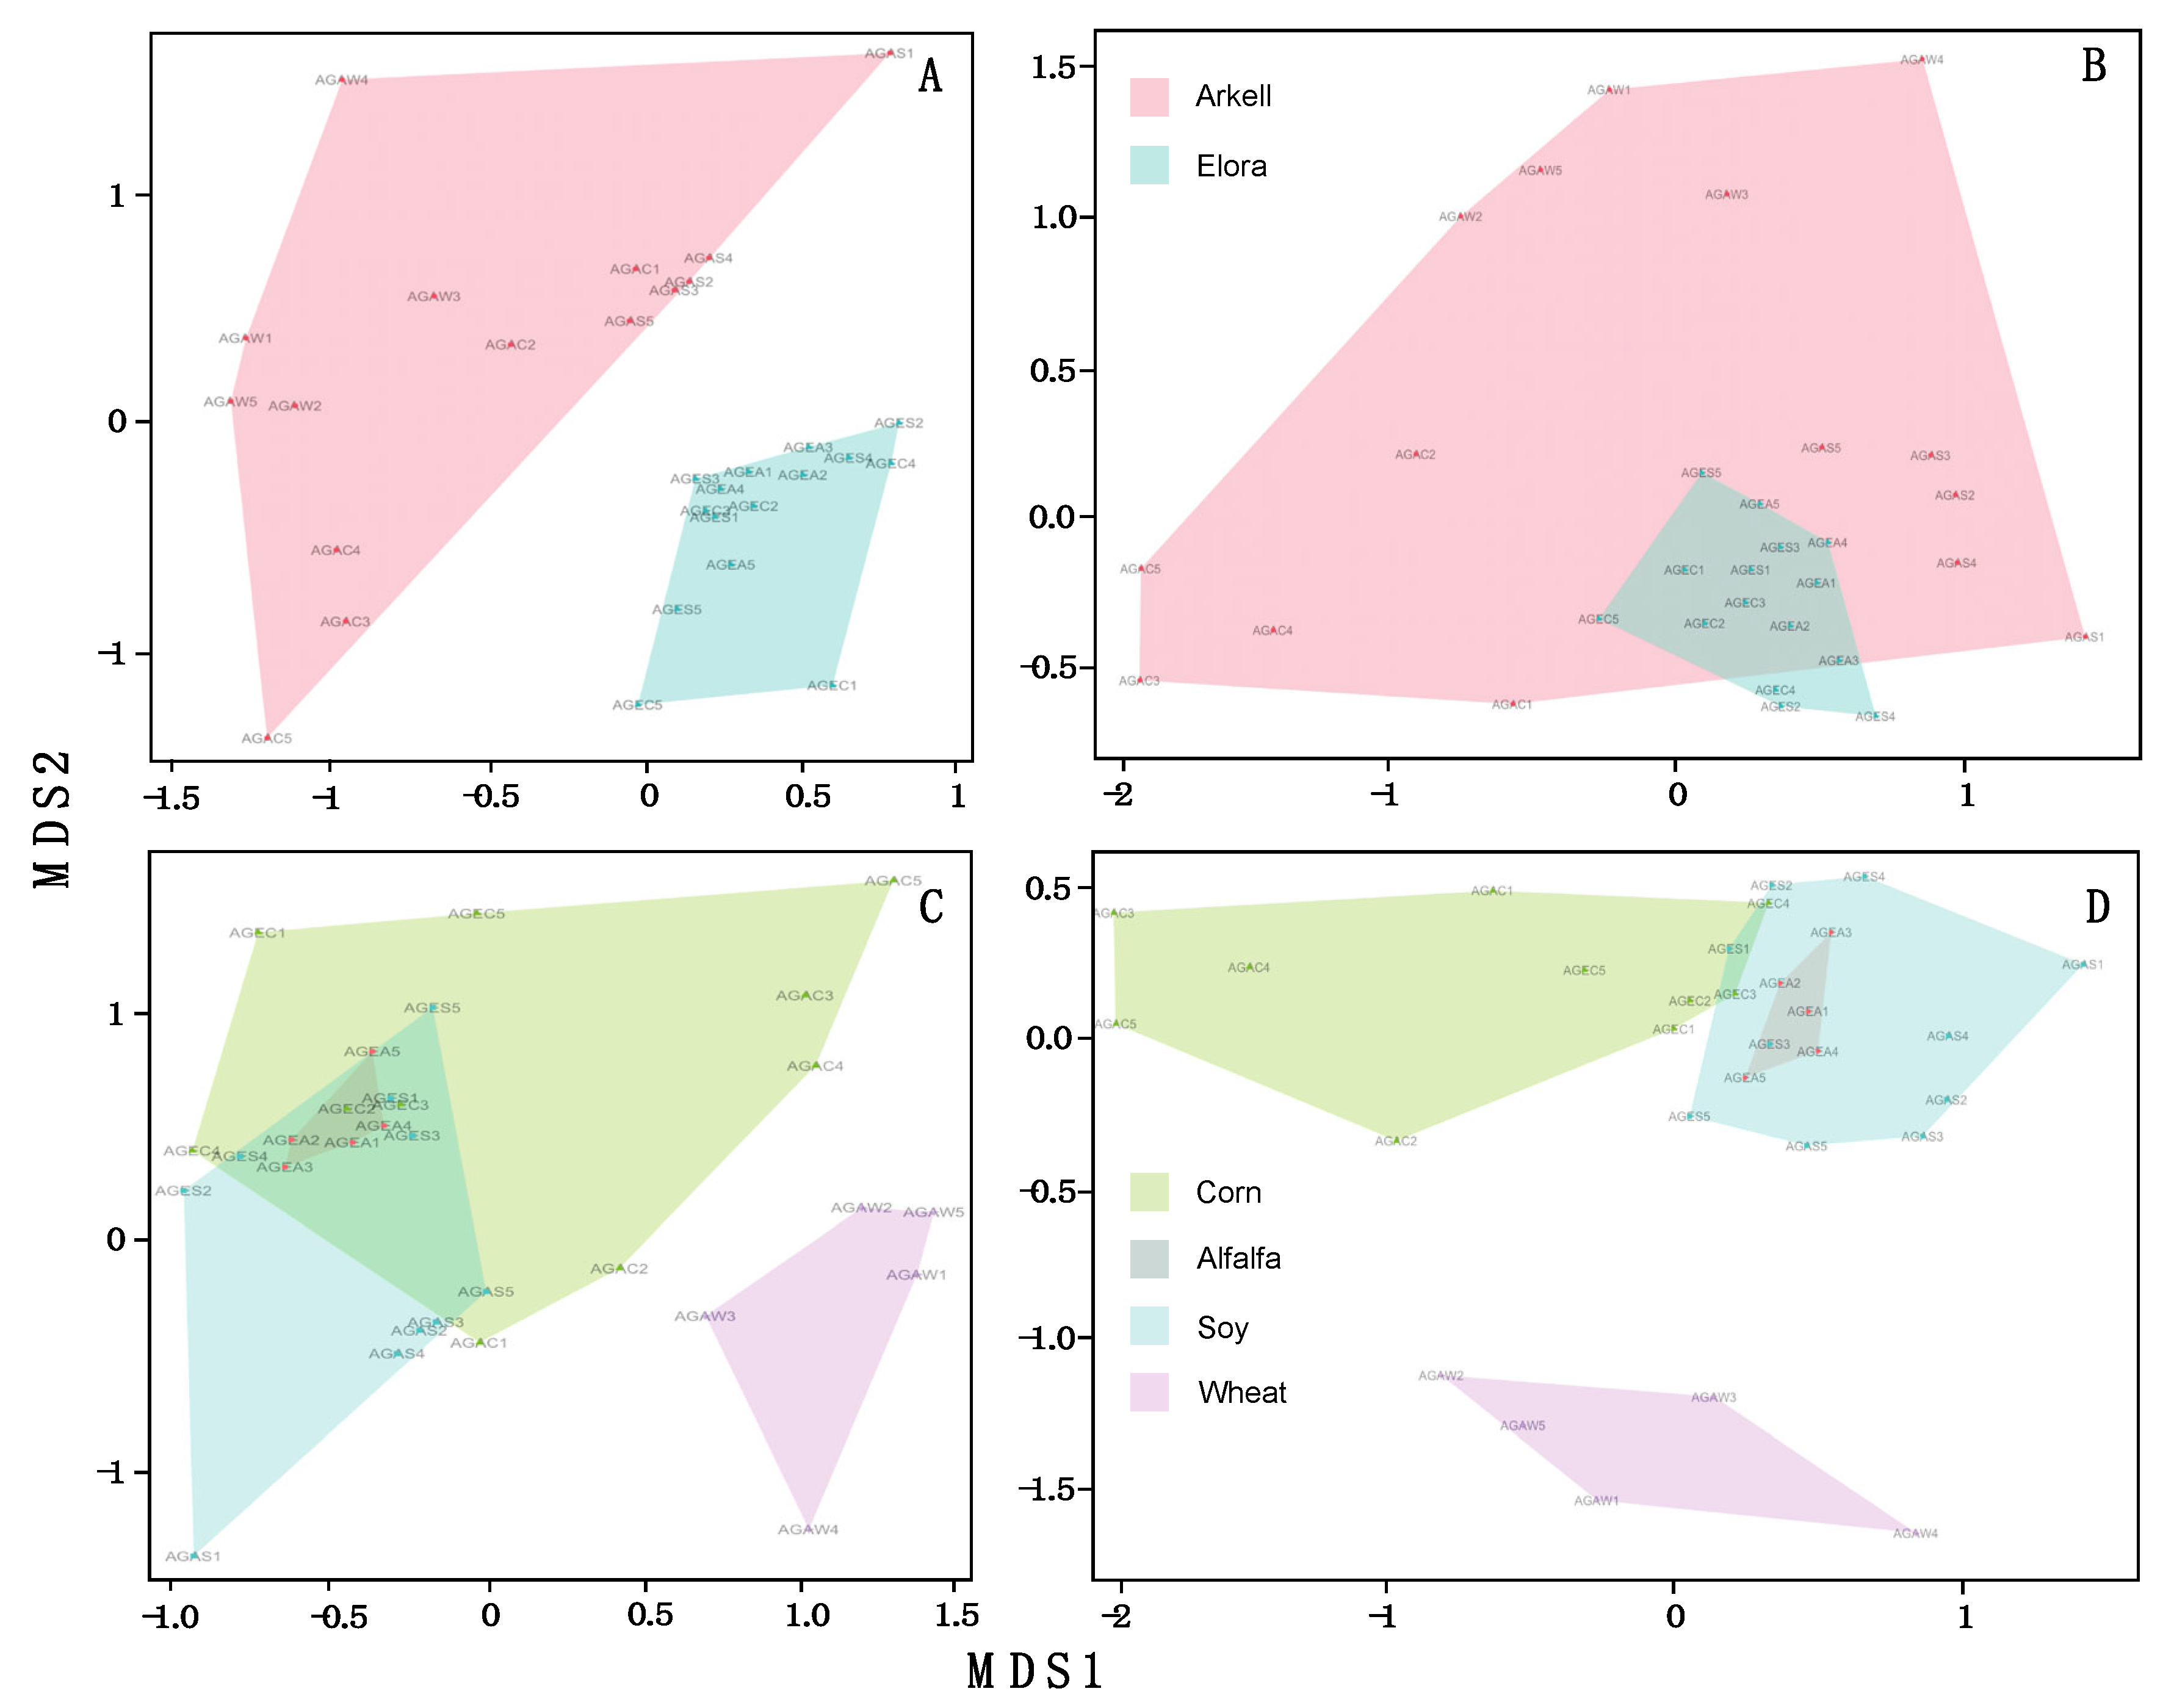
Figure 4.
Taxonomic composition of the full dataset and the Canadian Agricultural Pest subset.
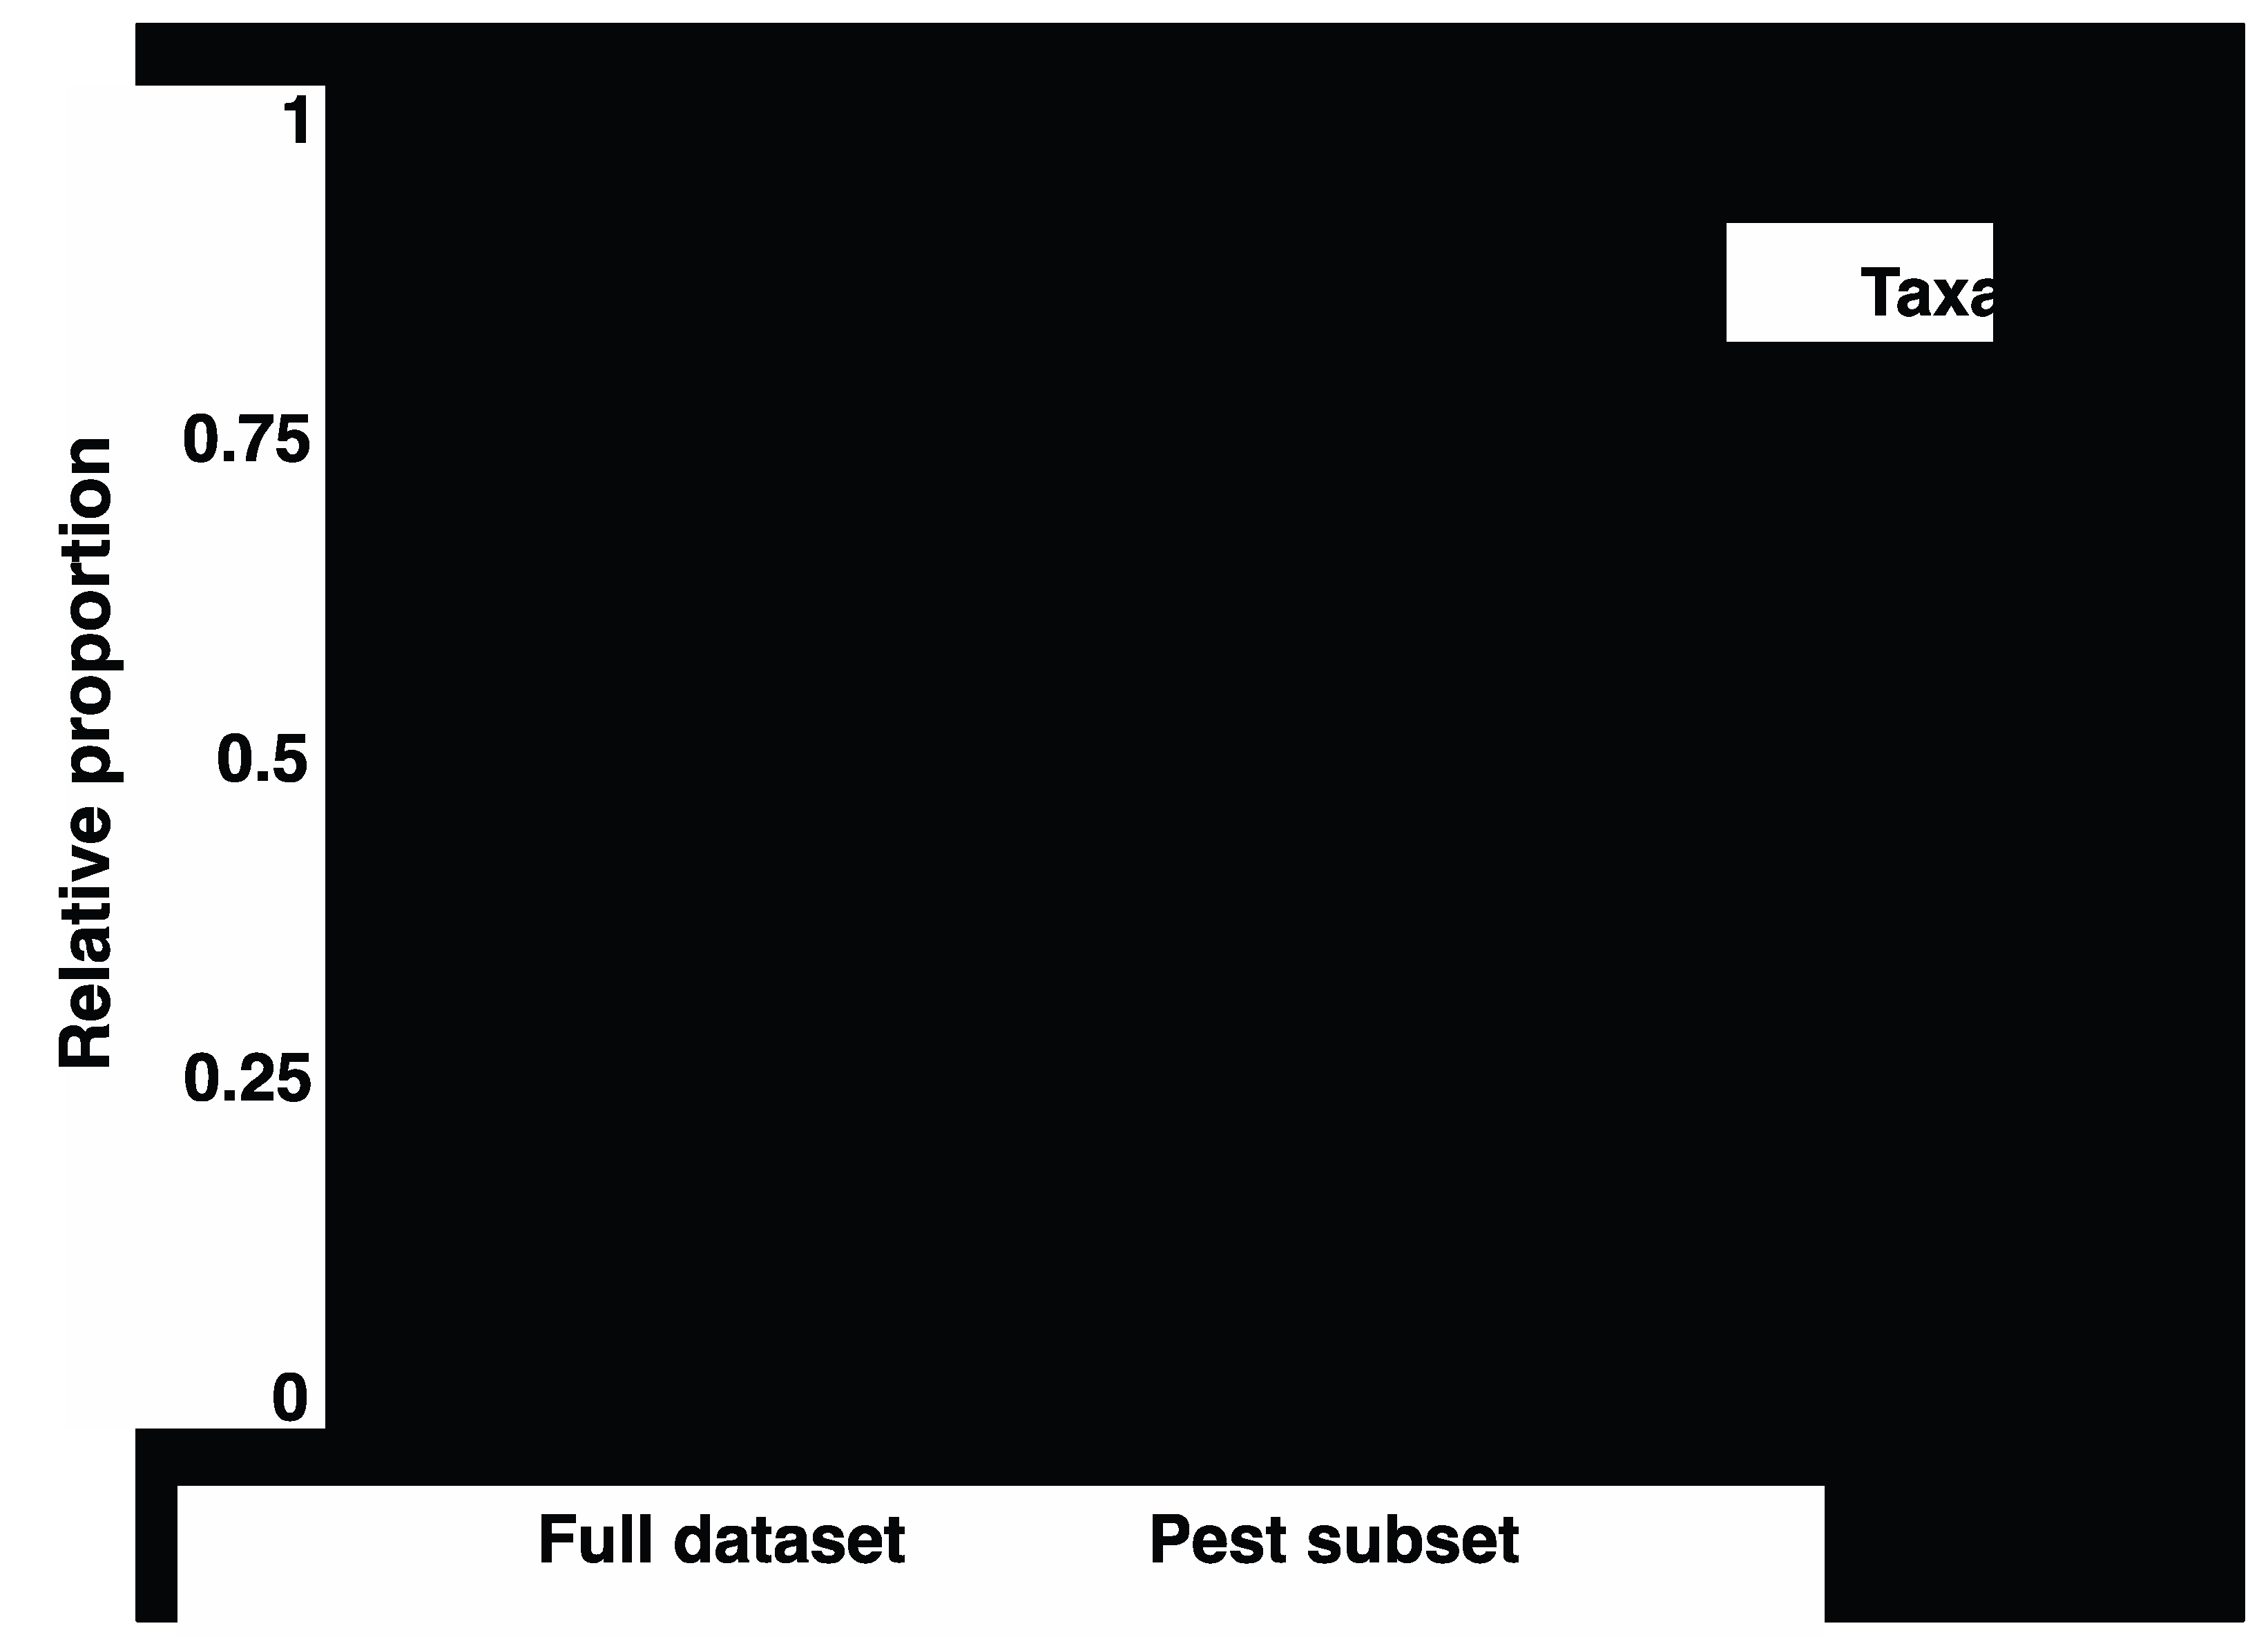

Table 1.
Percentage landcover type according to the 2020 Land Cover of Canada dataset.
| Arkell | Elora | |
|---|---|---|
| Cropland | 35.95% | 85.45% |
| Urban | 27.28% | 7.51% |
| Forest | 31.04% | 6.69% |
| Barren lands | 2.50% | 0.12% |
| Shrubland | 1.26% | 0.10% |
| Grassland | 0.05% | 0% |
| Wetland | 1.04% | 0.10% |
| Water | 0.89% | 0.03% |
Table 2.
PERMANOVA results for both the full dataset and a Canadian Pest subset.
| df | Sum of Squares | R2 | F | Pr(>F) | ||
| Full dataset | ||||||
| Site | 1 | 0.58 | 0.14 | 5.14 | 1.00E-04 | *** |
| Crop type | 3 | 0.70 | 0.17 | 2.08 | 1.00E-04 | *** |
| Residual | 25 | 2.80 | 0.69 | |||
| Total | 29 | 4.07 | 1 | |||
| Pest | ||||||
| Site | 1 | 0.26 | 0.09 | 3.77 | 3.00E-04 | *** |
| Crop type | 3 | 0.85 | 0.30 | 4.15 | 1.00E-04 | *** |
| Residual | 25 | 1.71 | 0.61 | |||
| Total | 29 | 2.83 | 1 |
Disclaimer/Publisher’s Note: The statements, opinions and data contained in all publications are solely those of the individual author(s) and contributor(s) and not of MDPI and/or the editor(s). MDPI and/or the editor(s) disclaim responsibility for any injury to people or property resulting from any ideas, methods, instructions or products referred to in the content. |
© 2025 by the authors. Licensee MDPI, Basel, Switzerland. This article is an open access article distributed under the terms and conditions of the Creative Commons Attribution (CC BY) license (http://creativecommons.org/licenses/by/4.0/).
Copyright: This open access article is published under a Creative Commons CC BY 4.0 license, which permit the free download, distribution, and reuse, provided that the author and preprint are cited in any reuse.


