
Submitted:
19 June 2025
Posted:
19 June 2025
You are already at the latest version
Abstract
Autism Spectrum Disorder (ASD) is characterised by atypical behavioural and cognitive diversity, yet the neural underpinnings linking brain activity and individual presentations remain poorly understood. In this study, we investigated the relationship between resting-state functional magnetic resonance imaging (fMRI) signal complexity and intelligence (full-scale intelligence quotient (FIQ); verbal intelligence quotient (VIQ); and performance intelligence quotient (PIQ); in male adults with ASD (n = 14) and matched neurotypical controls (n = 15), using three complexity-based metrics: Hurst Exponent (H), fuzzy approximate entropy (fApEn), and fuzzy sample entropy (fSampEn). Using a whole-brain measure, ASD participants showed significant negative correlations between PIQ and both fApEn and fSampEn, suggesting that increased neural irregularity may relate to reduced cognitive-perceptual performance in autistic individuals. No significant group association with complexity were found in the control group. These findings provide insight into how cognitive functions in autism may not only reflect deficits but also an alternative neural strategy, suggesting that distinct temporal patterns may influence intelligence in ASD. These preliminary findings could inform clinical practice and influence health and social care policies, particularly in autism diagnosis and personalised support planning.
Keywords:
Autism Spectrum Disorder
; Cognitive Function
; Fuzzy Approximate Entropy
; Fuzzy Sample Entropy
; Hurst Exponent
; Intelligence
; Neural Complexity
; Neurodevelopment
; Resting-State
1. Introduction
Autism Spectrum Disorder (ASD) is a neurodevelopmental condition marked by impairments in social communication and interaction, along with restricted and repetitive behaviours (American Psychiatric Association, 2013). ASD is also highly heterogeneous, manifesting with wide-ranging variability in symptom severity, cognitive abilities, neurodevelopmental trajectories, and adaptive functioning (F. Happé et al., 2006; Lombardo et al., 2019). This heterogeneity poses a significant obstacle in identifying reliable biomarkers and neural signatures that can generalise across the spectrum. As a result, probing the subtle alterations in neural dynamics in ASD that may underlie diverse behavioural and cognitive presentations is a challenge in autism research.
Recent developments in brain signal analysis have introduced complexity science as a promising metric to interrogate neural variability and organisation. Brain signal complexity refers to the degree of irregularity, unpredictability, adaptability, and information richness in neural time series, providing a window into the system’s functional capacity, robustness, and flexibility (Tononi et al., 1994). Measures such as the Hurst exponent (H) and entropy (Fuzzy Approximate Entropy; fApEn), and Fuzzy Sample Entropy; fSampEn) have been applied to resting-state functional magnetic resonance imaging (rs-fMRI) data to quantify long-range temporal correlations and signal irregularity across time (de Vries et al., 2020; Sokunbi et al., 2014, 2015). These metrics, grounded in nonlinear dynamics, offer sensitivity to alterations in brain function that may remain undetected in conventional linear or region-specific fMRI analyses.
Brain signal complexity has been successfully employed in the study of various neuropsychiatric and neurodevelopmental disorders. For instance, decreases in complexity have been observed in individuals with attention-deficit/hyperactivity disorder (ADHD) (Sokunbi et al., 2013), Alzheimer’s disease (Wang et al., 2017) and depression (Xue et al., 2019), suggesting reduced adaptability or neural inflexibility. Conversely, conditions such as schizophrenia have shown increased complexity, potentially reflecting unstable or dysregulated neural dynamics (Sokunbi et al., 2014). These findings collectively suggest that the directionality of complexity changes may vary across clinical populations, indicating that a disease-specific theoretical model is needed to explain these differences.
A key concept that informs our understanding of complexity in biological systems is the attractor model proposed by Vaillancourt and Newell (Vaillancourt & Newell, 2002). The model proposes that the change in output complexity of a physiological system with age or disease depends on whether a fixed-point attractor or an oscillatory attractor governs the system. A fixed-point attractor refers to a state to which the system returns following perturbation, characterised by stability and reduced variability. In such systems, disease or ageing is typically associated with a loss of complexity, as seen in ADHD (Sokunbi et al., 2013). In contrast, oscillatory attractor systems may display increased complexity in pathological states, as fluctuations become more erratic or desynchronised. This principle was demonstrated in schizophrenics (Sokunbi et al., 2014), where entropy measures revealed greater complexity in schizophrenic individuals compared to healthy controls.
This attractor-based model offers a compelling approach for examining complexity in ASD. Autism is not a singular entity but rather a spectrum of developmental trajectories influenced by genetic, neurobiological, and environmental factors (F. Happé et al., 2006). Prior research has reported both increased and decreased brain complexity in autistic individuals, depending on brain region, developmental stage, and methodological approach (Maximo et al., 2021). These mixed findings may reflect the coexistence of multiple attractor dynamics within the autistic brain, possibly shaped by compensatory neural mechanisms or developmental adaptations. Notably, adults with ASD who are cognitively high-functioning may display neurotypical or even enhanced performance on specific cognitive tasks, potentially obscuring underlying differences in brain dynamics (Soulières et al., 2009). Furthermore, while studies have compared group-level differences in brain complexity between ASD and controls, fewer have investigated how these complexity measures relate to intelligence. Intelligence is known to correlate with efficient and flexible brain network dynamics in neurotypical populations, yet its relationship with complexity in autism remains underexplored. Understanding this association is crucial, as intelligence profiles in ASD often diverge from typical patterns, featuring discrepancies between verbal and non-verbal IQ or exceptional performance on tasks involving rule-based reasoning (Soulières et al., 2009).
In this study, we investigate the relationship between brain signal complexity, as measured by the Hurst exponent (H), fuzzy approximate entropy (fApEn), and fuzzy sample entropy (fSampEn), and intelligence scores in adults with ASD compared to matched neurotypical controls. Both whole-brain (global) and regional (voxel-wise) analyses were conducted using resting-state fMRI. Specifically, we aimed to determine whether the direction and strength of the relationships between complexity and intelligence differ between groups, providing an insight into the neurocognitive architecture of autism.
Here, we hypothesise that the ASD brain will demonstrate significant differences from a non-ASD sample in whole-brain complexity metrics. We also hypothesised that any associations between complexity and intelligence would differ between groups, reflecting divergent neural strategies for supporting cognitive function.
By applying the dual-attractor theoretical approach to both whole-brain and regional analyses, our study aims to move beyond simple group comparisons and uncover deeper, functionally indicative patterns of brain signal complexity in ASD. Such insights may advance the development of individualised biomarkers and models that better reflect the heterogeneity of autism.
2. Materials and Methods
2.1. Participants
The present study utilised data from the Autism Brain Imaging Data Exchange (ABIDE I) database, specifically the University of Leuven: Sample 1 cohort. The final dataset comprised 29 participants aged 18 to 32 years, including 14 individuals with autism spectrum disorder (ASD) (mean age, 23.27 ± 2.92 years) and 15 age-matched typical controls (TC) (mean age, 21.86 ± 4.11 years). Participants diagnosed with ASD were drawn from a clinical sample at the Expertise Centrum Autism (ECA), Leuven University Hospital. Diagnosis was established according to DSM-IV-TR criteria by a multidisciplinary team. Inclusion criteria required a formal DSM-IV-TR diagnosis of autistic disorder and a raw score exceeding 60 on the Social Responsiveness Scale (SRS), Adult Version, as reported by a parent or guardian. Control participants were matched to the ASD group based on age, sex, and estimated IQ measures (Full-scale IQ, Verbal IQ, and Performance IQ). They were screened to ensure the absence of neurological or psychiatric disorders, which were confirmed through lab-developed questionnaires and unstructured clinical interviews. ASD participants were recruited from previous studies at KU Leuven, while controls were recruited from the local community. All participants provided written informed consent. The study protocol was approved by the Ethics Committee for Biomedical Research at the Katholieke Universiteit Leuven, adhering to the Declaration of Helsinki.
2.2. Intelligence Measures
Estimates of participants’ cognitive abilities were derived using the Ward 7-subtest short form of the Wechsler Adult Intelligence Scale, Third Edition (WAIS-III), a widely used and validated instrument for assessing intellectual functioning in adults (Ryan & Ward, 1999; Ward, 1990). This short-form version offers a reliable approximation of the full WAIS-III battery and has been validated for clinical and research applications in both neurotypical and clinical populations (Axelrod, 2002; Sattler, 2001). It yields three primary intelligence quotient (IQ) indices: Full-Scale IQ (FIQ), Verbal IQ (VIQ), and Performance IQ (PIQ). These measures are designed to capture both general and domain-specific aspects of cognitive functioning and are particularly relevant in autism spectrum disorder (ASD), where dissociations between verbal and non-verbal abilities are common (Joseph et al., 2002; Minshew et al., 1997).
2.2.1. Full-Scale Intelligence Quotient (FIQ)
The Full-Scale Intelligence Quotient (FIQ) is a global composite score that reflects an individual’s overall level of intellectual functioning. It is derived by combining scores from both verbal and performance subtests, providing a single summary index of cognitive ability. In this study, FIQ served as a general indicator of intelligence and was used to assess broad associations with brain complexity measures. FIQ is a significant predictor of educational and occupational outcomes and is often used as a benchmark for evaluating cognitive function in both typical and clinical populations (Wechsler, 2019).
2.2.2. Verbal Intelligence Quotient (VIQ)
The Verbal Intelligence Quotient (VIQ) represents the individual's verbal comprehension, reasoning, and knowledge acquired from the environment. It is computed from verbal subtests, including Vocabulary, Similarities, Arithmetic, and Information. VIQ is considered a measure of crystallised intelligence and is sensitive to language development and educational exposure. In autism research, VIQ is particularly relevant due to the variability in verbal abilities among individuals on the spectrum, with some demonstrating strong verbal reasoning and others presenting with significant language impairments (Tager-Flusberg & Joseph, 2003).
2.2.3. Performance Intelligence Quotient (PIQ)
The Performance Intelligence Quotient (PIQ) assesses non-verbal reasoning, visual-spatial processing, and fluid intelligence. It is derived from performance-based subtests such as Block Design, Matrix Reasoning, and Picture Completion. These tasks require perceptual organisation, visual-motor coordination, and problem-solving abilities, independent of verbal mediation. PIQ is particularly relevant in ASD populations, who often display relative strengths in non-verbal tasks despite verbal deficits, leading to characteristic discrepancies between VIQ and PIQ (Dawson et al., 2007; F. G. E. Happé, 1995).
The inclusion of these three IQ indices enables a nuanced examination of how different facets of intelligence interact with brain signal complexity in autism and typical development. Furthermore, matching ASD and control participants on FIQ, VIQ, and PIQ helped to control for general cognitive ability as a confounding variable in group comparisons.
2.3. Brain Imaging
Prior to scanning, participants were familiarised with the MRI environment using a mock scanner and received both verbal and written instructions to minimise anxiety and motion during the actual scan. All imaging was conducted on a 3.0 Tesla Philips MRI scanner (Best, The Netherlands) equipped with an 8-channel phased-array head coil. The scanning protocol began with the acquisition of a high-resolution T1-weighted anatomical image, followed by a resting-state functional MRI (rs-fMRI) scan. During the resting-state scan, participants were instructed to lie still with their eyes open, fixate on a centrally presented white crosshair against a black background, and refrain from engaging in any specific thoughts. The rs-fMRI data were acquired using an echo-planar imaging (EPI) sequence with the following parameters: repetition time (TR) = 2000 ms, echo time (TE) = 30 ms, flip angle = 90°, field of view (FOV) = 224 mm, matrix size = 64 × 64, voxel size = 3.5 × 3.5 × 3.5 mm³, and number of slices = 37, covering the whole brain. A total of 250 volumes were collected throughout the resting-state scan. This setup ensured optimal spatial and temporal resolution for subsequent analysis of intrinsic brain activity.
2.4. Image Pre-Processing
Image pre-processing was performed using the FMRIB Software Library (FSL) (Jenkinson et al., 2012), accessed through the Neurodesk platform within a Google Colab environment. Neurodesk provided a containerized, cloud-compatible framework that enabled flexible, portable, and reproducible execution of neuroimaging tools (Renton et al., 2024). The raw functional data, consisting of 250 volumes, underwent several pre-processing steps. First, the initial five volumes were discarded to account for signal instability, resulting in 245 volumes for further analysis. Motion correction was then applied to adjust for head movements during the scan. Following this, the functional data were co-registered to each subject’s high-resolution T1-weighted anatomical scan to ensure spatial alignment. Next, nuisance regression was carried out by removing six motion-related parameters from the data, and the resulting residuals representing cleaned signals, free from those confounding effects. Finally, the data were band-pass filtered to retain frequencies between 0.008 Hz and 0.1 Hz, which are known to capture meaningful resting-state neural activity while minimising noise. The filtered fMRI images were normalised to the standard MNI template space to allow group-level statistics.
2.5. Complexity Metrics
2.5.1. Hurst Exponent
The Hurst exponent (H) is a statistical measure used to assess the long-range temporal dependence and fractal properties of a time series (Hurst, 1951). In the context of fMRI analysis, it quantifies the degree to which BOLD signal fluctuations exhibit persistent, anti-persistent, or random behaviour over time. The Hurst exponent (H) takes values between 0 and 1, and it characterises the temporal correlation structure of a time series. Based on the value of H, a time series can be classified into three categories: (1) H = 0.5 represents a completely random process (white noise); (2) values between 0 and 0.5 indicate an anti-correlated (rough) time series; and (3) values between 0.5 and 1 suggest a positively correlated time series. (Sokunbi et al., 2014). In this study, the Hurst exponent was computed voxel-wise using dispersional analysis (Bassingthwaighte & Raymond, 1995), a robust method that assesses how the variability (standard deviation) of the signal changes with increasing levels of temporal aggregation. This method is especially suitable for analysing biological signals, such as fMRI data, which may contain fractal and periodic components.
The core idea of dispersional analysis is to group the time series into non-overlapping windows of increasing size m, compute the standard deviation (SD) of these aggregated signals, and determine how SD changes as a function of m. Mathematically, this relationship follows a power law:
In Eq. (1), H represents the Hurst exponent, SD denotes the variance or standard deviation, m indicates the element size used to compute SD, and n refers to the arbitrarily selected reference size, corresponding to the length over which the average is calculated (Sokunbi et al., 2014). In this study, N = 245 (the length of the fMRI time series), m = 2, and n = 1. A linear regression was performed on the log–log plot, and the resulting slope provided the best estimate of H. These estimates were used to generate whole-brain H maps, computed in MATLAB. Our approach for estimating both the mean whole-brain H values and the H maps followed the procedure described by Sokunbi et al.(Sokunbi et al., 2014).
2.5.2. Fuzzy Approximate Entropy (fApEn)
Fuzzy Approximate Entropy (fApEn) is a nonlinear measure used to quantify the complexity, irregularity, and unpredictability of time series data. It is a refinement of the Approximate Entropy (ApEn) method proposed originally by Pincus (Pincus, 1991). It was designed to overcome limitations such as sensitivity to short data lengths and poor relative consistency. fApEn integrates fuzzy logic, which allows for a gradual and smooth definition of similarity between vectors rather than a binary classification, enhancing robustness against noise and data length variability. In traditional ApEn, the similarity between vectors is determined using a discontinuous Heaviside function, which can result in a loss of information in cases where data points are nearly, but not exactly, similar. fApEn replaces this with a continuous fuzzy membership function, introducing a smoother evaluation of similarity between embedded vectors in the time series.
The fuzzy membership function, derived from the concept of fuzzy sets introduced by Lotfi Zadeh (Zadeh, 1965) is employed in fApEn to provide a fuzzy measure of similarity between vectors based on their shapes. By replacing the hard thresholding of the Heaviside function with the smoother transition of the fuzzy membership function, the distinction between points becomes less rigid, allowing them to appear closer and more similar (Xie et al., 2010).
The calculation of the fApEn of a time series of length N involves the following steps (Sokunbi et al., 2015):
where
and
In Eq. (2), N represents the number of time points, m denotes the pattern length, and τ is the time delay. In Eq. (3), , the similarity measure is defined using a fuzzy membership function, which employs an automatic mirrored quadratic function. In this function, the fuzzy width is automatically determined based on the parameter r. is given as
where the distance between and (m-dimensional pattern vectors) is defined as
and
The symbol r represents a predetermined tolerance value, which is defined as;
where k is a constant, and represents the standard deviation of the signal. The degree of similarity between the two patterns i and j of m measurements of the signal is determined by the fuzzy membership function, , a function of the distance between any pair of corresponding measurements of and , with respect to the tolerance parameter r.
The fuzzy membership function applied in this study is constructed using a pair of mirrored quadratic curves, forming a sigmoid-like shape (Sokunbi et al., 2014). The basic equation is expressed below as a function of x, where x = distance / r:
An additional (optional) feature was incorporated to enable automatic adjustment of the fuzzy width based on the parameter r, as proposed by Xiong et al. (Xiong et al., 2010).
Whole-brain fApEn maps were computed voxel-wise from the pre-processed resting-state fMRI data using custom MATLAB and C code. A time series length of 245 volumes (after discarding the initial 5) was used. The embedding dimension used was m = 2, the similarity criterion (threshold) was r = 0.25 × SD, and the time delay τ = 1 was also used. Voxels outside the brain were excluded by applying a threshold at 10% of the maximum signal intensity. This method allows for the generation of high-resolution spatial maps of signal complexity, providing insight into the temporal dynamics of brain activity.
2.5.3. Fuzzy Sample Entropy (fSampEn)
Fuzzy Sample Entropy (fSampEn) is a refined metric for quantifying the complexity and irregularity of time series data, especially useful for physiological signals such as fMRI. It is based on Sample Entropy (SampEn), which was introduced as an improvement over Approximate Entropy (ApEn) by eliminating self-matching of template vectors and reducing bias associated with short datasets (Richman et al., 2004).
Unlike SampEn, which uses a binary similarity function (based on a fixed threshold), fSampEn incorporates fuzzy logic to evaluate the degree of similarity between sequences. This continuous similarity measure increases robustness to noise, improves monotonicity, and reduces dependence on data length.
Let be a time series of length N.
Form a set of m-dimensional vectors:
And for
Compute the distance between two vectors and using the Chebyshev distance:
Similarity is defined by a fuzzy function μ(x), where , and r is a similarity criterion (threshold) (r× standard deviation of the signal). We used the same fuzzy membership function used in fApEn above:
For each , calculate:
Then average over all to get:
Similarly, compute using vectors of length .
Finally, Fuzzy Sample Entropy is defined as:
Similar to the procedure used for fApEn, whole-brain fSampEn maps were computed on a voxel-wise basis from the pre-processed resting-state fMRI data. This was accomplished using a custom implementation in MATLAB and C programming environments. The time series length used was 245 volumes of fMRI data. The embedding dimension used was m = 2, the similarity criterion (threshold) was r = 0.25 × SD, and the time delay τ = 1 was also used. Voxels outside the brain were excluded by applying a threshold at 10% of the maximum signal intensity. Additionally, this method allows for the generation of high-resolution spatial maps of signal complexity, providing insight into the temporal dynamics of brain activity.
2.6. Statistical Analysis
Statistical analyses were performed using SPSS 28.0.1.1 (IBM Corp.) Mean group differences in the measured parameters, intelligence and whole brain complexity, were tested using an independent t-test. Correlations between the complexity measures and intelligence scores (FIQ, VIQ, PIQ) were performed using a Pearson approach. Comparison between the correlations between the two groups was explored using a Fisher's r-to-z transformation.
3. Results
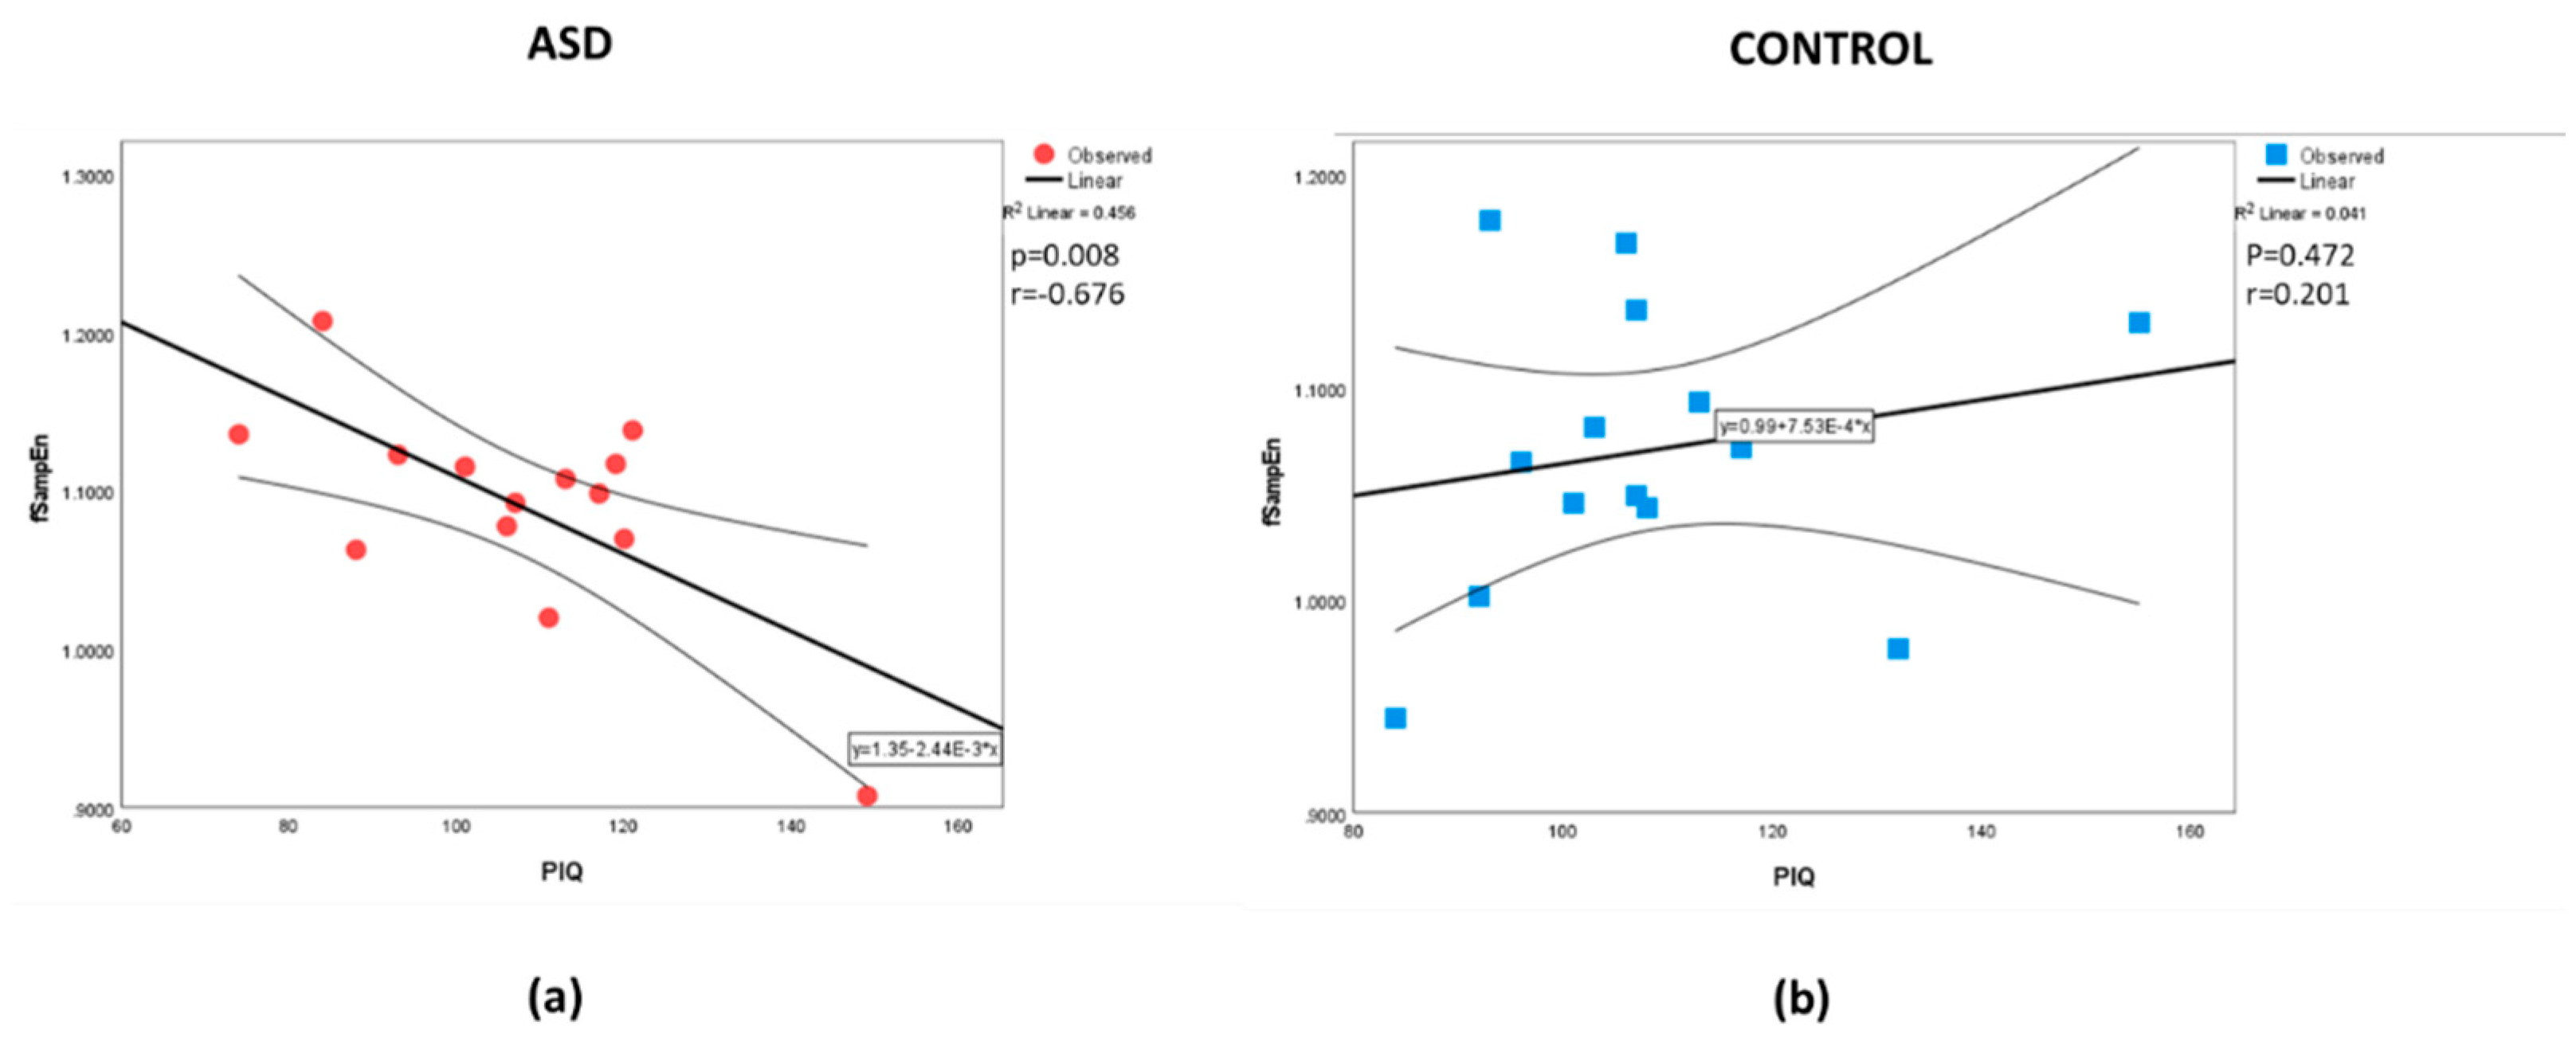
The analysis found no significant differences between the mean values for each parameter (Table 1). Table 2 shows the correlation between the measured parameters. As expected, there are some correlations between the intelligence measures. Similarly, there are some correlations between the whole-brain complexity measures. The results also show a correlation, different from zero, for the PIQ-fApEn association and the PIQ–fSampEn association in the ASD group that is not present in the control group. The r values in the ASD group were negative and moderate in magnitude. Whereas the non-significant (from zero) r’s in the control sample were positive. Comparing the correlation strengths between the groups found differences between the PIQ estimate and all the complexity measures. No correlation was found between the intelligence measures and age, nor between the complexity measures and age. The scatter plot with a straight line fitted to the data is shown for PIQ-fApEn and PIQ–fSampEn in Figure 1 and Figure 2, respectively. Visually, we observe that a higher IQ performance is associated with a less complex (lower entropy values) whole-brain presentation in the ASD group. The scatter plot for the control group appears randomly distributed.

Table 1.
Participants’ characteristics, Mean Intelligence scores and Mean Whole Brain Complexity metrics.
Table 1.
Participants’ characteristics, Mean Intelligence scores and Mean Whole Brain Complexity metrics.
| ASD | Control | |||
| Mean | SD | Mean | SD | |
| Age | 21.86 | 4.11 | 23.27 | 2.91 |
| FIQ | 109.43 | 13.09 | 114.80 | 12.86 |
| VIQ | 110.43 | 12.45 | 117.47 | 9.86 |
| PIQ | 107.36 | 18.88 | 109.13 | 17.68 |
| Hurst Exponent | 0.45 | 0.03 | 0.46 | 0.04 |
| fApEn | 0.87 | 0.03 | 0.86 | 0.03 |
| fSampEn | 1.09 | 0.07 | 1.07 | 0.07 |
Table 2.
Pearson correlations between the intelligence measures (FIQ, VIQ and PIQ) and whole brain complexity indices (H, fApEn and fSampEn) for the ASD sample (upper right, dark grey) and the control sample (lower left, light grey). ** indicates where the correlation differs from zero, p<0.01. † Indicates where the correlation strengths differ between the ASD and the control group, p<0.05.
| FIQ | VIQ | PIQ | Hurst Exponent |
fApEn | fSampEn | |
| FIQ | .695** | .778** | -0.114 | -0.450 | -0.419 | |
| VIQ | .766** | 0.095 | 0.264 | 0.043 | 0.056 | |
| PIQ | .899** | 0.419 | -0.360 | -.702** | -.676** | |
| Hurst Exponent | 0.428 | 0.249 | 0.418† | 0.014 | -0.072 | |
| fApEn | -0.076 | -0.411 | 0.197† | -0.081 | .993** | |
| fSampEn | -0.060 | -0.394 | 0.201† | -0.105 | .991** |
Figure 1.
Correlations between fApEn and PIQ for the (a) ASD and (b) Control groups, respectively.
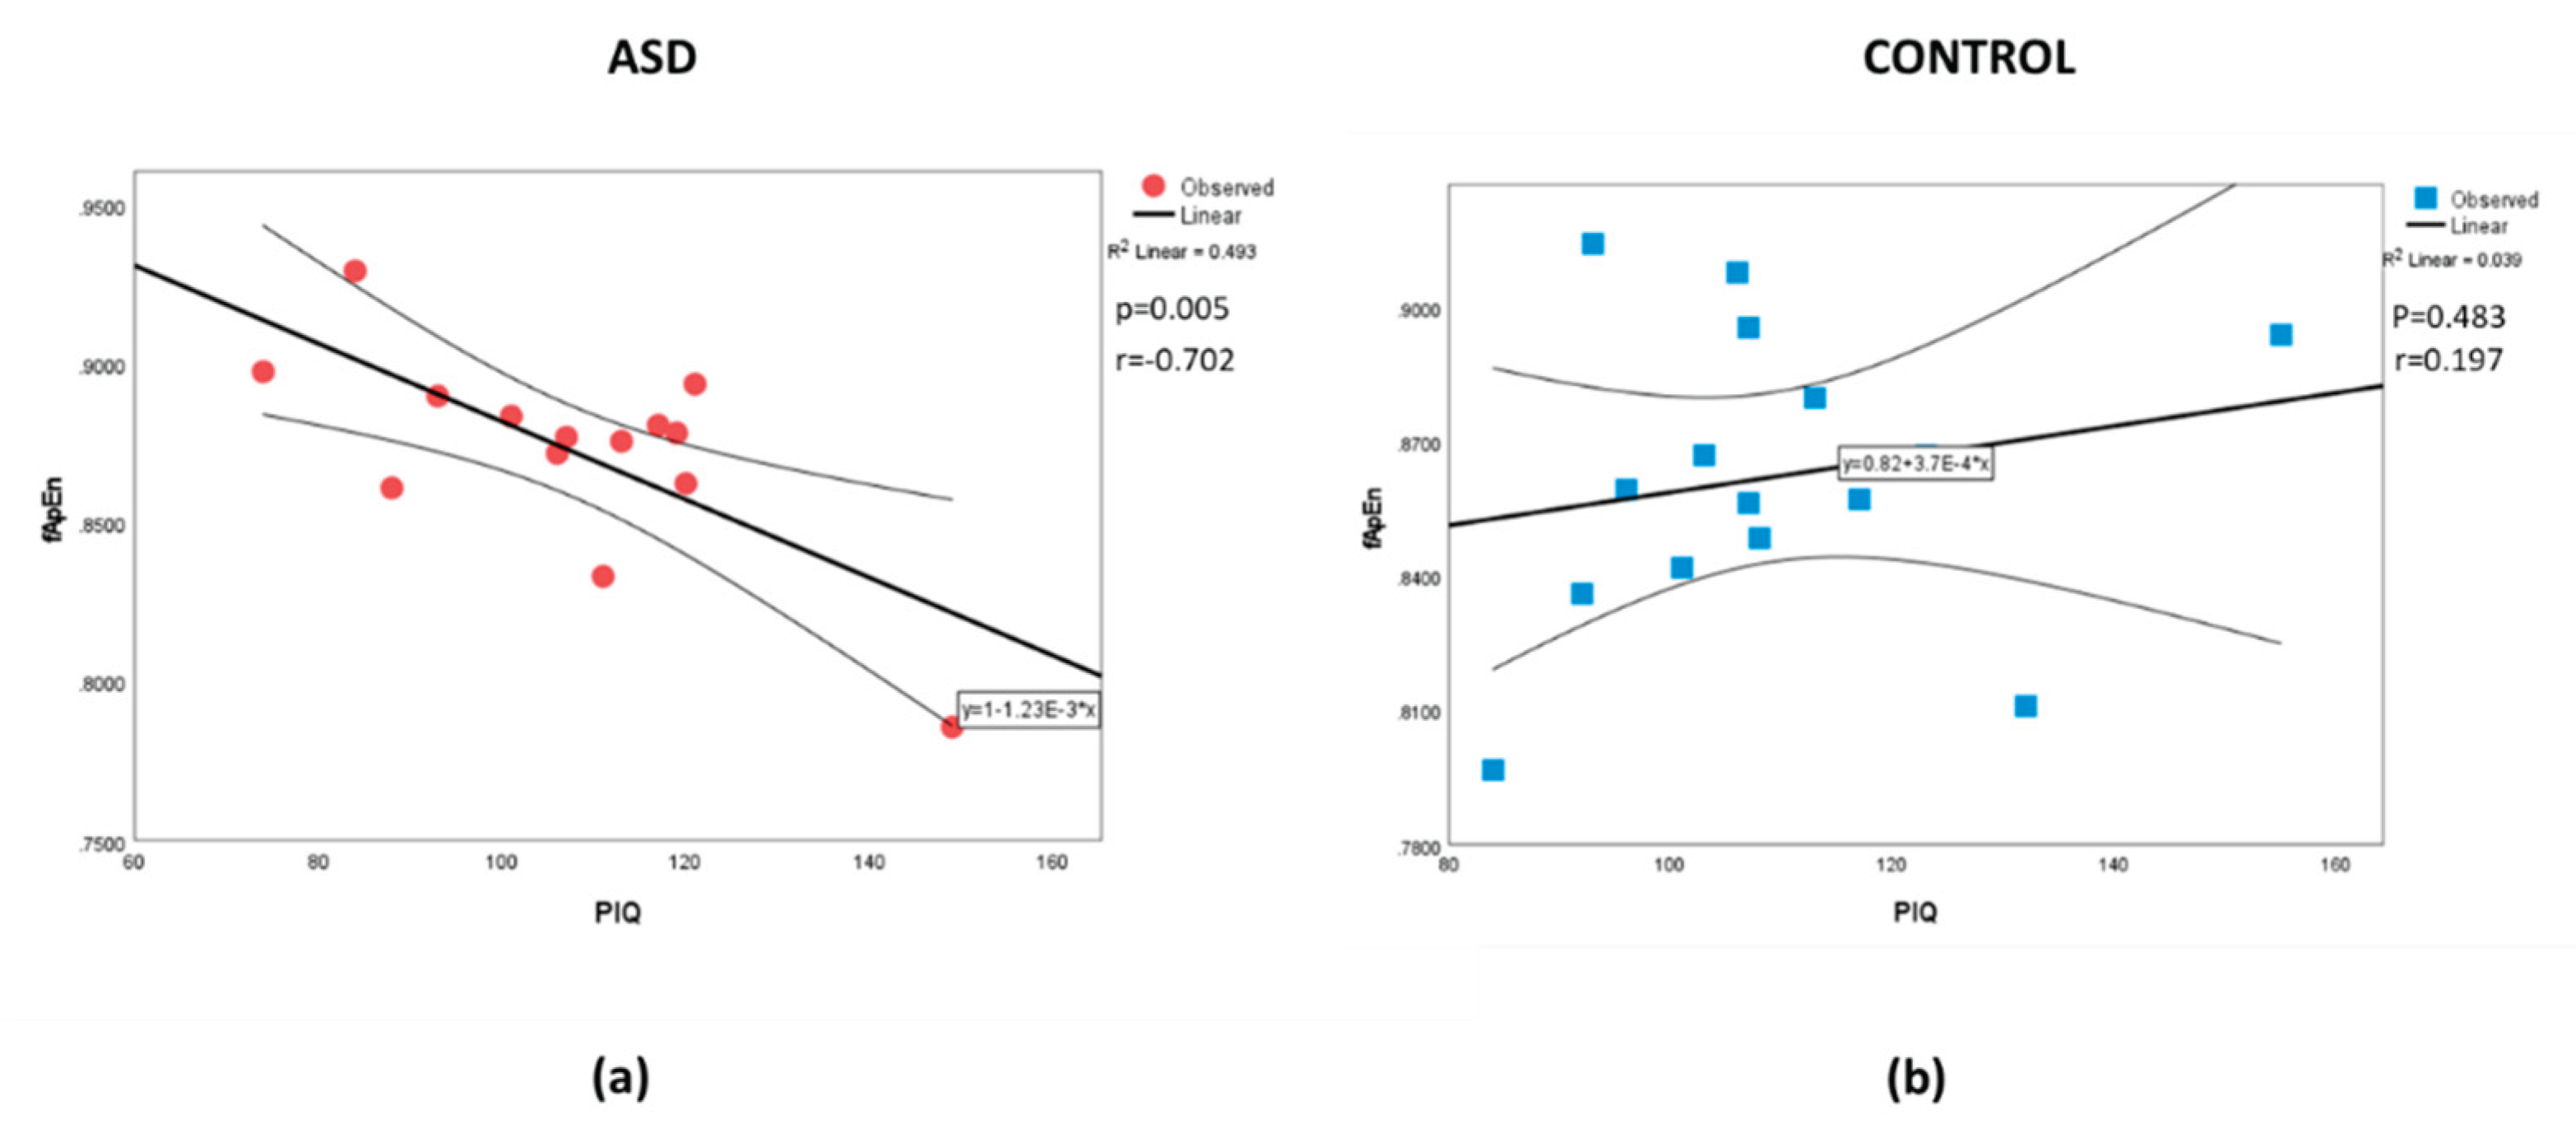
Figure 2.
Correlations between fSampEn and PIQ for the (a) ASD and (b) Control groups, respectively.
Figure 2.
Correlations between fSampEn and PIQ for the (a) ASD and (b) Control groups, respectively.
4. Discussion
In this study, we examined whole-brain complexity metrics, including the Hurst Exponent (H), fuzzy approximate entropy (fApEn), and fuzzy sample entropy (fSampEn), to explore their relationship with intelligence in individuals with ASD compared to age-matched neurotypical controls. While no significant differences were observed between groups in overall brain complexity measures, a notable finding emerged within the ASD group, where higher levels of entropy (as indicated by fApEn and fSampEn) were significantly correlated with lower Performance IQ (PIQ) scores. A comparison of the correlation with the control group found a difference in the correlation between all three complexity measures. This inverse relationship suggests that increased neural complexity may be related to less efficient cognitive-perceptual processing in individuals with ASD.
These findings align with previous research indicating altered brain entropy in children with ASD (Maximo et al., 2021). Here, we report a whole-brain association in young adults. Other studies have reported increased entropy in specific brain regions of children with ASD, suggesting atypical neural dynamics (Fu et al., 2025). Additionally, research has shown a shift toward randomness in ECG signals among adults with ASD, reflecting changes in the temporal structure of neural activity (Catarino et al., 2011).
We hypothesised a whole-brain difference in entropy between the two groups, which we did not find. It is possible that we lacked the statistical power to detect such differences, or that our whole-brain approach is crude, averaging over the brain could be averaging out positive and negative regional differences that drive ASD presentation when compared to controls. Our findings support our second hypothesis, with significant associations with intelligence in individuals with ASD. The negative nature of the correlation indicates that those with ASD individuals with lower IQs have a more complex neuronal mechanism than those with ASD and higher IQs and controls with similar cognitive abilities. The last point must be qualified by the fact that the correlation in the control group was not significantly different from zero. That is, there are substantial parts of the brain, sufficient to affect the whole brain measure, operating under oscillatory attractor conditions that produce more complex signals when cognitive abilities are low. This complexity-intelligence relationship may reflect divergent neural strategies for supporting cognitive function, particularly in individuals with lower cognitive abilities. Higher brain entropy has been associated with greater cognitive flexibility (Feilong et al., 2021) and intelligence in neurotypical populations. The inverse relationship observed in our ASD sample suggests a divergence in how neural complexity relates to cognitive function in this population. These findings provide further insight into how cognitive functions in autism may not only reflect deficits but also an alternative neural strategy for supporting complex tasks, which might differ from typical developmental trajectories (Simmons et al., 2009). These results align with the existing literature on neurodivergence in autism and the role of altered brain complexity and connectivity in shaping intelligence (Pua et al., 2018).
This study employed multiple complexity metrics, including the Hurst exponent (H), fuzzy approximate entropy (fApEn), and fuzzy sample entropy (fSampEn), to investigate the neural correlates of intelligence in ASD, providing a novel perspective on functional brain dynamics. However, the absence of significant group-level differences must be interpreted with caution and understood in the context of autism’s inherent clinical and neurobiological heterogeneity. Autism is not a monolithic condition; rather, it encompasses a wide range of presentations across cognitive ability, symptom severity, developmental history, and neural adaptation (Lombardo et al., 2019). Complexity measures like entropy or fractal dimension often assume homogeneity in brain signal organisation, potentially obscuring group effects in ASD, where such uniformity rarely exists (Dinstein et al., 2015).
The small sample size (14 autistic and 15 control participants) further limits statistical power. To address these limitations, future work should incorporate larger and more diverse samples and extend the analysis to include a regional assessment in addition to global measures. Incorporating multimodal imaging, developmental stratification, and behavioural subtyping will also be critical in future efforts to disentangle the nuanced relationship between brain complexity and cognition in ASD.
Our study highlights the nuanced relationship between brain complexity and intelligence in ASD. The observed association between increased entropy and lower PIQ in individuals with ASD suggests that atypical neural dynamics may impact cognitive-perceptual abilities. Although there are limitations due to the small sample size, these preliminary findings indicate that future research involving a larger group to elucidate the mechanisms underlying these relationships could inform and influence health and social care policies. This could lead to improved outcomes for individuals with ASD, ensuring that health and social care providers are well-equipped to offer effective support and resources for individuals with ASD and their families. Future studies should address current limitations, including small sample size, cross-sectional design, and limited behavioural characterisation by employing larger, developmentally stratified cohorts and incorporating/integrating machine learning or deep learning models capable of capturing non-linear, temporal, and individualised patterns in brain data (Sokunbi, 2024; Sokunbi & Soula, 2025). Ultimately, incorporating complexity-based metrics with advanced computational tools may enhance our understanding of autistic cognition and contribute to more personalised diagnostic and therapeutic strategies.
Acknowledgments
We acknowledge the University of Leuven for making their fMRI data (Sample 1 cohort) available for research through the Autism Brain Imaging Data Exchange (ABIDE I) database. This research was supported by an NIHR Pre-Application Support Fund (NIHR305l781).
References
- American Psychiatric Association. (2013). Diagnostic and Statistical Manual of Mental Disorders (Fifth Edition). American Psychiatric Association. [CrossRef]
- Axelrod, B. N. (2002). Validity of the Wechsler Abbreviated Scale of Intelligence and Other Very Short Forms of Estimating Intellectual Functioning. Assessment, 9(1), 17–23. [CrossRef]
- Bassingthwaighte, J. B., & Raymond, G. M. (1995). Evaluation of the dispersional analysis method for fractal time series. Annals of Biomedical Engineering, 23(4), 491–505. [CrossRef]
- Catarino, A., Churches, O., Baron-Cohen, S., Andrade, A., & Ring, H. (2011). Atypical EEG complexity in autism spectrum conditions: A multiscale entropy analysis. Clinical Neurophysiology, 122(12), 2375–2383. [CrossRef]
- Dawson, M., Soulières, I., Gernsbacher, M. A., & Mottron, L. (2007). The level and nature of autistic intelligence. Psychological Science, 18(8), 657–662. [CrossRef]
- de Vries, C. F., Staff, R. T., Waiter, G. D., Sokunbi, M. O., Sandu, A. L., & Murray, A. D. (2020). Motion During Acquisition is Associated With fMRI Brain Entropy. IEEE Journal of Biomedical and Health Informatics, 24(2), 586–593. [CrossRef]
- Dinstein, I., Heeger, D. J., & Behrmann, M. (2015). Neural variability: Friend or foe? Trends in Cognitive Sciences, 19(6), 322–328. [CrossRef]
- Feilong, M., Guntupalli, J. S., & Haxby, J. V. (2021). The neural basis of intelligence in fine-grained cortical topographies. eLife, 10, e64058. [CrossRef]
- Fu, S., Wang, X., Chen, Z., Huang, Z., Feng, Y., Xie, Y., Li, X., Yang, C., & Xu, S. (2025). Abnormalities in brain complexity in children with autism spectrum disorder: A sleeping state functional MRI study. BMC Psychiatry, 25(1), 257. [CrossRef]
- Happé, F. G. E. (1995). Understanding Minds and Metaphors: Insights from the Study of Figurative Language in Autism. Metaphor and Symbolic Activity, 10(4), 275–295. [CrossRef]
- Happé, F., Ronald, A., & Plomin, R. (2006). Time to give up on a single explanation for autism. Nature Neuroscience, 9(10), 1218–1220. [CrossRef]
- Hurst, H. E. (1951). Long-Term Storage Capacity of Reservoirs. Transactions of the American Society of Civil Engineers, 116(1), 770–799. [CrossRef]
- Jenkinson, M., Beckmann, C. F., Behrens, T. E. J., Woolrich, M. W., & Smith, S. M. (2012). FSL. NeuroImage, 62(2), 782–790. [CrossRef]
- Joseph, R. M., Tager-Flusberg, H., & Lord, C. (2002). Cognitive profiles and social-communicative functioning in children with autism spectrum disorder. Journal of Child Psychology and Psychiatry, and Allied Disciplines, 43(6), 807–821. [CrossRef]
- Lombardo, M. V., Lai, M.-C., & Baron-Cohen, S. (2019). Big data approaches to decomposing heterogeneity across the autism spectrum. Molecular Psychiatry, 24(10), 1435–1450. [CrossRef]
- Maximo, J. O., Nelson, C. M., & Kana, R. K. (2021). “Unrest while Resting”? Brain entropy in autism spectrum disorder. Brain Research, 1762, 147435. [CrossRef]
- Minshew, N. J., Goldstein, G., & Siegel, D. J. (1997). Neuropsychologic functioning in autism: Profile of a complex information processing disorder. Journal of the International Neuropsychological Society: JINS, 3(4), 303–316.
- Pincus, S. M. (1991). Approximate entropy as a measure of system complexity. Proceedings of the National Academy of Sciences of the United States of America, 88(6), 2297–2301. [CrossRef]
- Pua, E. P. K., Malpas, C. B., Bowden, S. C., & Seal, M. L. (2018). Different brain networks underlying intelligence in autism spectrum disorders. Human Brain Mapping, 39(8), 3253–3262. [CrossRef]
- Renton, A. I., Dao, T. T., Johnstone, T., Civier, O., Sullivan, R. P., White, D. J., Lyons, P., Slade, B. M., Abbott, D. F., Amos, T. J., Bollmann, S., Botting, A., Campbell, M. E. J., Chang, J., Close, T. G., Dörig, M., Eckstein, K., Egan, G. F., Evas, S., … Bollmann, S. (2024). Neurodesk: An accessible, flexible and portable data analysis environment for reproducible neuroimaging. Nature Methods, 21(5), 804–808. [CrossRef]
- Richman, J. S., Lake, D. E., & Moorman, J. R. (2004). Sample Entropy. In Methods in Enzymology (Vol. 384, pp. 172–184). Elsevier. [CrossRef]
- Ryan, J. J., & Ward, L. C. (1999). Validity, reliability, and standard errors of measurement for two seven-subtest short forms of the Wechsler Adult Intelligence Scale—III. Psychological Assessment, 11(2), 207–211. [CrossRef]
- Sattler, J. M. (2001). Assessment of children: Cognitive applications, 4th ed (pp. xxvii, 931). Jerome M Sattler Publisher.
- Sokunbi, M. O. (2024, October 23). An AI implementation for forecasting fMRI time series. the 4th International Electronic Conference on Brain Sciences. https://sciforum.net/paper/view/19369.
- Sokunbi, M. O., Cameron, G. G., Ahearn, T. S., Murray, A. D., & Staff, R. T. (2015). Fuzzy approximate entropy analysis of resting state fMRI signal complexity across the adult life span. Medical Engineering & Physics, 37(11), 1082–1090. [CrossRef]
- Sokunbi, M. O., Fung, W., Sawlani, V., Choppin, S., Linden, D. E. J., & Thome, J. (2013). Resting state fMRI entropy probes complexity of brain activity in adults with ADHD. Psychiatry Research: Neuroimaging, 214(3), 341–348. [CrossRef]
- Sokunbi, M. O., Gradin, V. B., Waiter, G. D., Cameron, G. G., Ahearn, T. S., Murray, A. D., Steele, D. J., & Staff, R. T. (2014). Nonlinear Complexity Analysis of Brain fMRI Signals in Schizophrenia. PLoS ONE, 9(5), e95146. [CrossRef]
- Sokunbi, M. O., & Soula, O. (2025, June 24). Deep Learning Models for Predicting fMRI Time Series in Autistic Adults. Annual Meeting of the Organization for Human Brain Mapping, Brisbane, Australia.
- Soulières, I., Dawson, M., Samson, F., Barbeau, E. B., Sahyoun, C. P., Strangman, G. E., Zeffiro, T. A., & Mottron, L. (2009). Enhanced visual processing contributes to matrix reasoning in autism. Human Brain Mapping, 30(12), 4082–4107. [CrossRef]
- Tager-Flusberg, H., & Joseph, R. M. (2003). Identifying neurocognitive phenotypes in autism. Philosophical Transactions of the Royal Society of London. Series B, Biological Sciences, 358(1430), 303–314. [CrossRef]
- Tononi, G., Sporns, O., & Edelman, G. M. (1994). A measure for brain complexity: Relating functional segregation and integration in the nervous system. Proceedings of the National Academy of Sciences of the United States of America, 91(11), 5033–5037. [CrossRef]
- Vaillancourt, D. E., & Newell, K. M. (2002). Changing complexity in human behavior and physiology through aging and disease. Neurobiology of Aging, 23(1), 1–11. [CrossRef]
- Wang, B., Niu, Y., Miao, L., Cao, R., Yan, P., Guo, H., Li, D., Guo, Y., Yan, T., Wu, J., Xiang, J., & Zhang, H. (2017). Decreased Complexity in Alzheimer’s Disease: Resting-State fMRI Evidence of Brain Entropy Mapping. Frontiers in Aging Neuroscience, 9, 378. [CrossRef]
- Ward, L. C. (1990). Prediction of verbal, performance, and full scale IQs from seven subtests of the wais-r. Journal of Clinical Psychology, 46(4), 436–440. [CrossRef]
- Wechsler, D. (2019). Wechsler Adult Intelligence Scale—Third Edition [Dataset]. [CrossRef]
- Xie, H.-B., Guo, J.-Y., & Zheng, Y.-P. (2010). Fuzzy approximate entropy analysis of chaotic and natural complex systems: Detecting muscle fatigue using electromyography signals. Annals of Biomedical Engineering, 38(4), 1483–1496. [CrossRef]
- Xiong, G., Zhang, L., Liu, H., Zou, H., & Guo, W. (2010). A comparative study on ApEn, SampEn and their fuzzy counterparts in a multiscale framework for feature extraction. Journal of Zhejiang University SCIENCE A, 11(4), 270–279. [CrossRef]
- Xue, S.-W., Wang, D., Tan, Z., Wang, Y., Lian, Z., Sun, Y., Hu, X., Wang, X., & Zhou, X. (2019). Disrupted Brain Entropy And Functional Connectivity Patterns Of Thalamic Subregions In Major Depressive Disorder. Neuropsychiatric Disease and Treatment, Volume 15, 2629–2638. [CrossRef]
- Zadeh, L. A. (1965). Fuzzy sets. Information and Control, 8(3), 338–353. [CrossRef]
Disclaimer/Publisher’s Note: The statements, opinions and data contained in all publications are solely those of the individual author(s) and contributor(s) and not of MDPI and/or the editor(s). MDPI and/or the editor(s) disclaim responsibility for any injury to people or property resulting from any ideas, methods, instructions or products referred to in the content. |
© 2025 by the authors. Licensee MDPI, Basel, Switzerland. This article is an open access article distributed under the terms and conditions of the Creative Commons Attribution (CC BY) license (http://creativecommons.org/licenses/by/4.0/).
Copyright: This open access article is published under a Creative Commons CC BY 4.0 license, which permit the free download, distribution, and reuse, provided that the author and preprint are cited in any reuse.


