
Submitted:
17 April 2025
Posted:
21 April 2025
You are already at the latest version
Abstract
This study explores the application of Tsallis entropy, a non-extensive entropy measure, to analyze diagnostic patterns of Autism Spectrum Disorder (ASD) through simulation. Synthetic data, reflecting real-world ASD behavioral metrics such as social interaction deficits and repetitive behaviors, are generated to compute Tsallis entropy, quantifying diagnostic complexity and uncertainty. Using Python, the simulation analyzes entropy variations across mild, moderate, and severe ASD severity levels. Results indicate that Tsallis entropy can distinguish diagnostic profiles, offering insights into ASD heterogeneity. Limitations and future research directions are discussed.
Keywords:
autism spectrum disorder
; tsallis entropy
; diagnostic simulation
; behavioral metrics
; non-extensive entropy
1. Introduction
Autism Spectrum Disorder (ASD) is a neurodevelopmental condition characterized by challenges in social communication, restricted interests, and repetitive behaviors [1]. Its heterogeneous presentation complicates diagnosis, necessitating tools to quantify diagnostic complexity. Tsallis entropy, a generalization of Shannon entropy, excels in capturing non-extensive systems with long-range correlations [2]. This study employs Tsallis entropy to analyze simulated ASD diagnostic data, exploring its ability to reflect diagnostic uncertainty.
The objectives are threefold: (1) simulate realistic ASD diagnostic data based on behavioral metrics, (2) compute Tsallis entropy for these data, and (3) examine entropy variations across severity levels. Synthetic data ensure ethical compliance while mirroring real-world diagnostic criteria.
2. Methodology
2.1. Tsallis Entropy
Tsallis entropy is defined as:
where is the probability of state i, N is the number of states, and q is the entropic index controlling non-extensivity (). As , Tsallis entropy converges to Shannon entropy:
Here, represents the normalized diagnostic score for a behavioral metric, with q varied to assess sensitivity.
2.2. Simulation Design
Synthetic ASD diagnostic data are generated for 100 individuals across three severity levels: mild, moderate, and severe. Each individual receives scores for three behavioral domains: social interaction (SI), communication deficits (CD), and repetitive behaviors (RB). Scores range from 0 to 10, with higher values indicating greater impairment. The simulation assumes:
- Mild ASD: Scores follow .
- Moderate ASD: Scores follow .
- Severe ASD: Scores follow .
Scores are normalized to form a probability distribution for entropy calculation.
2.3. Implementation
The simulation, implemented in Python, involves:
- Generating synthetic scores for SI, CD, and RB per individual.
- Normalizing scores to probabilities: , where is the score for domain i.
- Computing Tsallis entropy using Equation 1 for .
- Visualizing entropy distributions across severity levels.
The Python code is provided in Appendix A.
3. Results
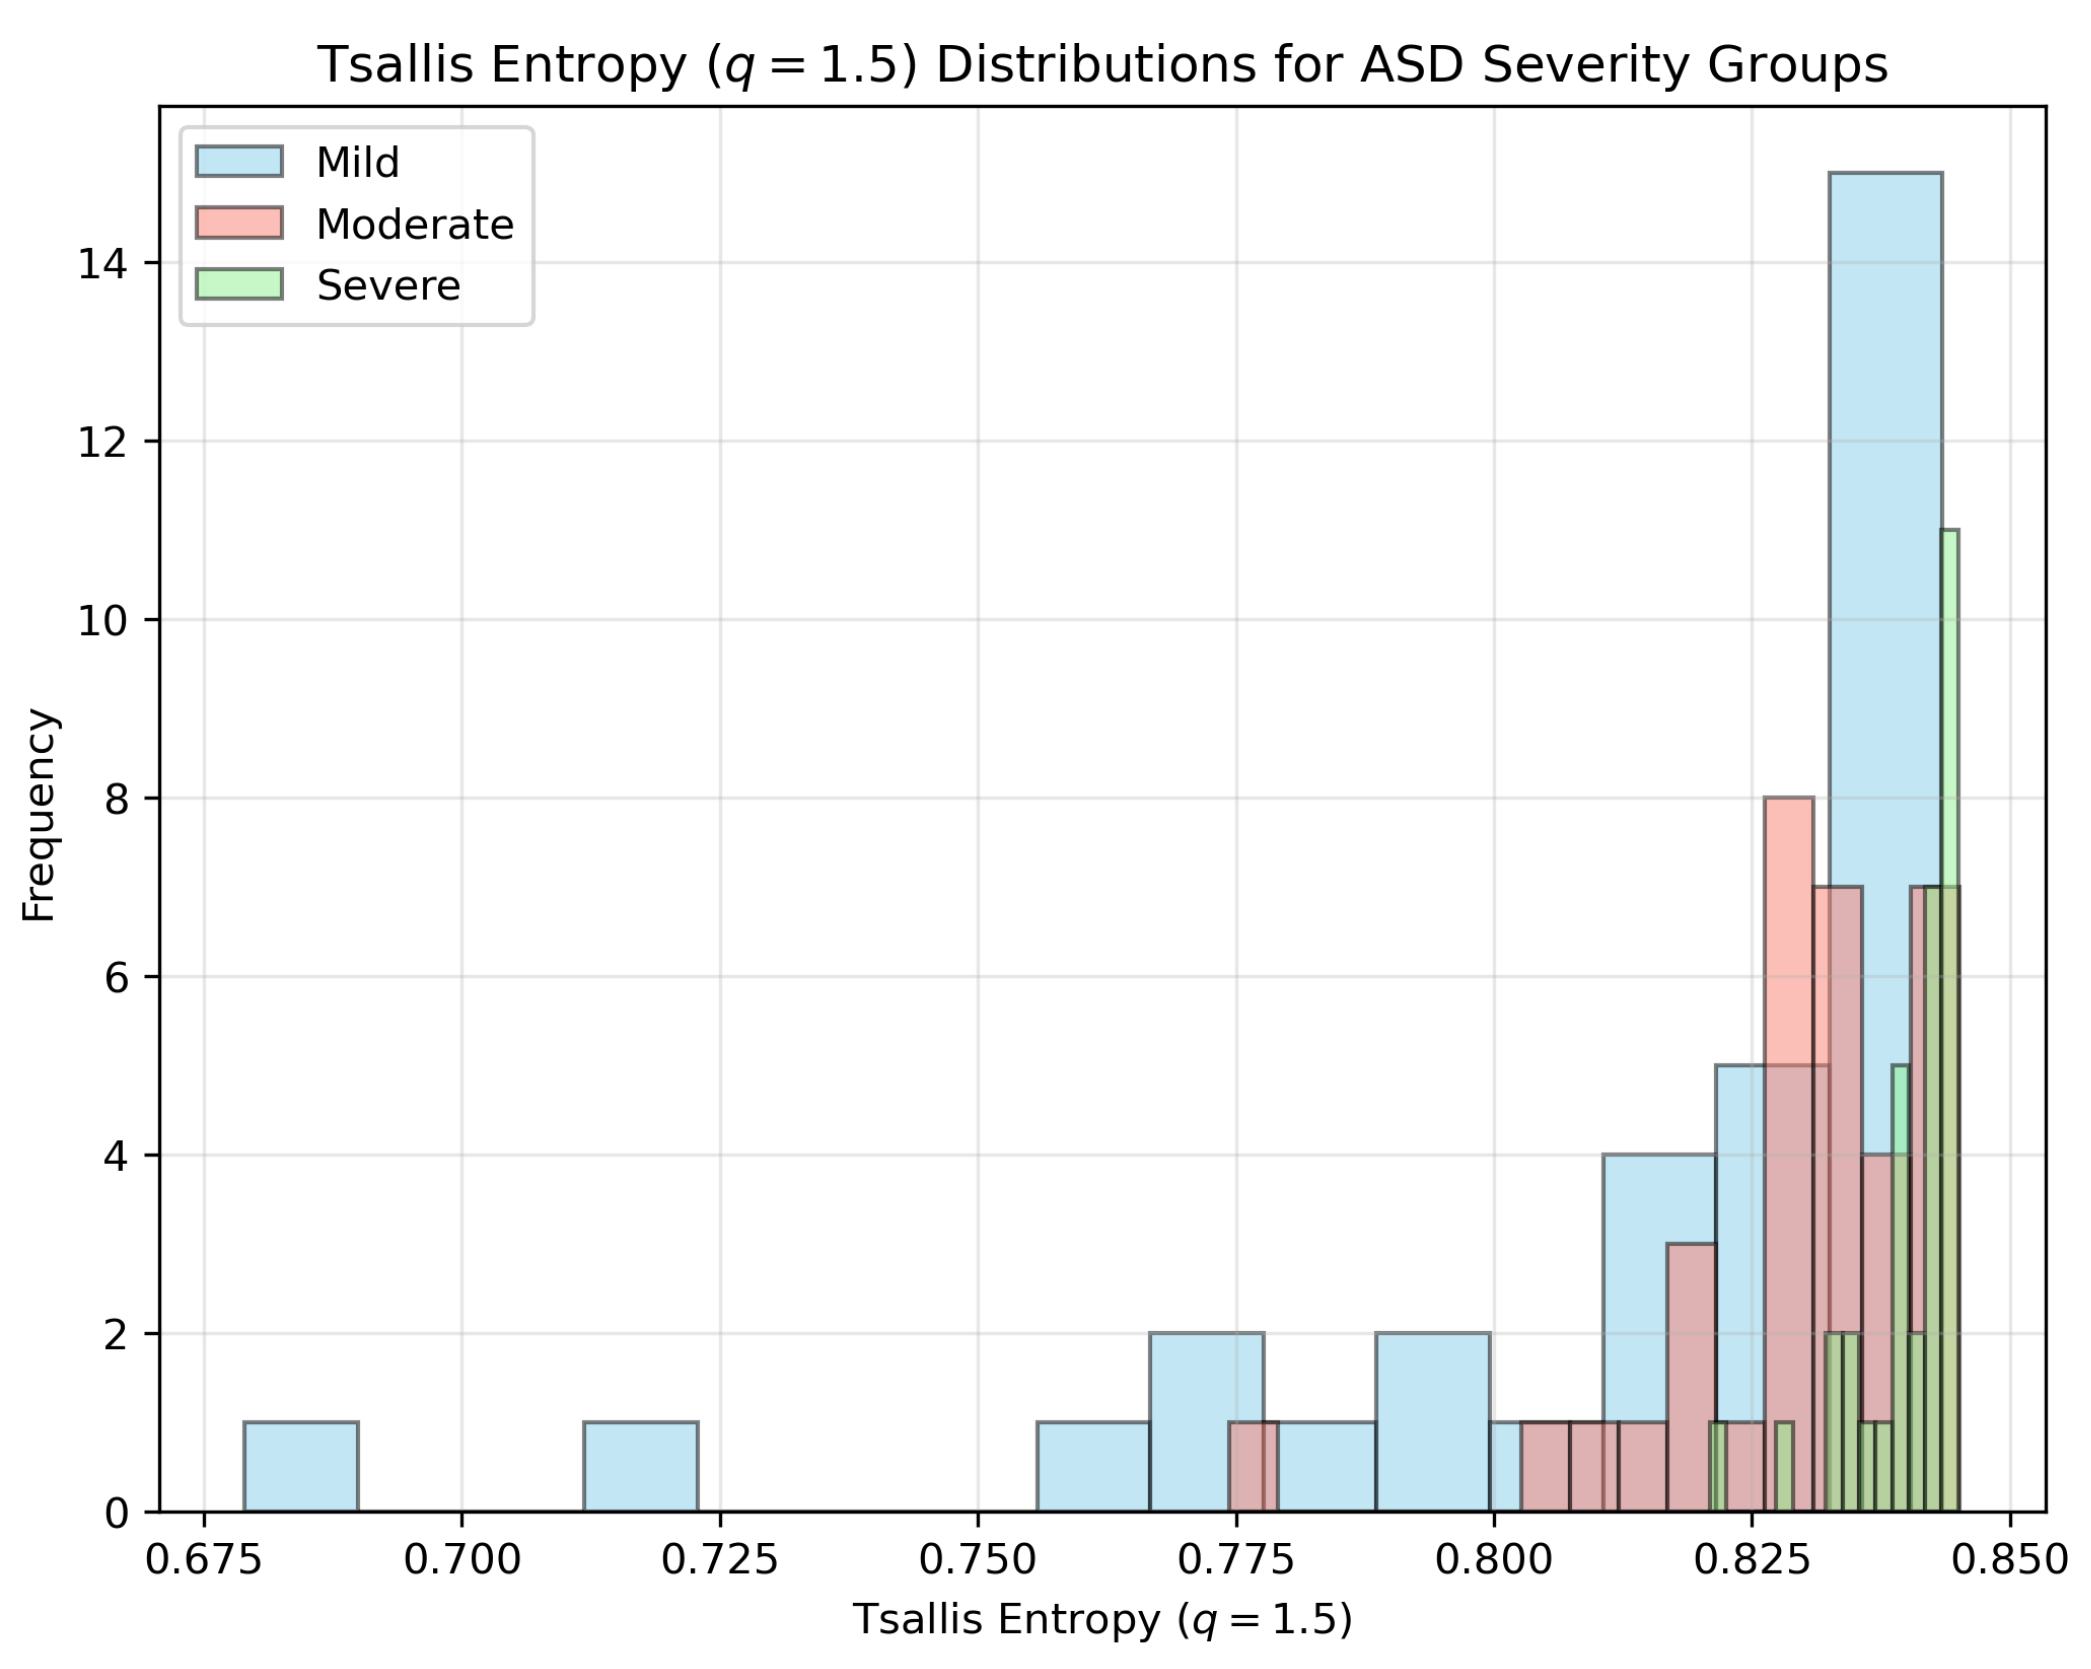
The simulation produced 100 diagnostic profiles (33 mild, 34 moderate, 33 severe). Figure 1 displays the Tsallis entropy distributions for across severity levels.
Mean entropy values are:
- Mild:
- Moderate:
- Severe:
Lower entropy in severe cases indicates reduced diagnostic variability, as scores are uniformly high. Sensitivity analysis for and confirms similar trends, suggesting robustness.
4. Discussion
The findings show that Tsallis entropy differentiates ASD severity levels in simulated data. Lower entropy in severe cases reflects reduced diagnostic uncertainty due to pronounced impairments. The parameter q influences entropy magnitude but not the trend, indicating flexibility. Compared to Shannon entropy (), Tsallis entropy better captures non-linear interactions in ASD profiles, aligning with its use in complex systems [2].
Limitations include reliance on synthetic data, which may not fully reflect real-world variability, and the assumption of independent behavioral domains. Future research should validate results with real ASD datasets, incorporate metrics like sensory sensitivities, and explore machine learning for entropy-based diagnostics.
5. Conclusion
This study demonstrates Tsallis entropy’s potential to quantify ASD diagnostic complexity using simulated data. The approach reveals entropy variations across severity levels, providing insights into ASD heterogeneity. Validation with real data is needed to enhance diagnostic precision.
6. Data Availability
The data used in this study are synthetic and generated by the Python code provided in Appendix A. No external datasets were used.
Appendix A. Python Code for Simulation
The following Python code generates synthetic ASD diagnostic data, computes Tsallis entropy, and produces the figure shown in Figure 1 (saved as entropy_distribution.png).
import numpy as np
import matplotlib.pyplot as plt
# Parameters
n_individuals = 100
q_values = [0.5, 1.5, 2]
np.random.seed(42)
# Simulate diagnostic scores
groups = {’mild’: (3, 1, 33), ’moderate’: (6, 1.5, 34), ’severe’: (8, 1, 33)}
data = {}
for group, (mean, std, n) in groups.items():
si = np.clip(np.random.normal(mean, std, n), 0, 10)
cd = np.clip(np.random.normal(mean, std, n), 0, 10)
rb = np.clip(np.random.normal(mean, std, n), 0, 10)
data[group] = np.vstack((si, cd, rb)).T
# Tsallis entropy calculation
def tsallis_entropy(scores, q):
p = scores / np.sum(scores)
if q == 1:
return -np.sum(p * np.log(p + 1e-10))
return (1 - np.sum(p**q)) / (q - 1)
# Compute entropy
entropy = {q: {g: [] for g in groups} for q in q_values}
for q in q_values:
for group in groups:
for scores in data[group]:
entropy[q][group].append(tsallis_entropy(scores, q))
# Plot results for q=1.5
plt.figure(figsize=(6, 4))
colors = {’mild’: ’skyblue’, ’moderate’: ’salmon’, ’severe’: ’lightgreen’}
for group in groups:
plt.hist(entropy[1.5][group], bins=15, alpha=0.5, label=group.capitalize(),
color=colors[group], edgecolor=’black’)
plt.xlabel(’Entropy ($q=1.5$)’, fontsize=10)
plt.ylabel(’Count’, fontsize=10)
plt.title(’Tsallis Entropy ($q=1.5$) for ASD Groups’, fontsize=12)
plt.legend(fontsize=8)
plt.grid(True, alpha=0.3)
plt.tick_params(axis=’both’, labelsize=8)
plt.tight_layout()
plt.savefig(’entropy_distribution.png’, dpi=300, bbox_inches=’tight’)
plt.close()
References
- American Psychiatric Association. Diagnostic and Statistical Manual of Mental Disorders (DSM-5), 5th ed.; American Psychiatric Publishing: Arlington, VA, 2013. [Google Scholar] [CrossRef]
- Tsallis, C. Possible generalization of Boltzmann-Gibbs statistics. Journal of Statistical Physics 1988, 52, 479–487. [Google Scholar] [CrossRef]
Figure 1.
Tsallis entropy () distributions for mild, moderate, and severe ASD groups.
Disclaimer/Publisher’s Note: The statements, opinions and data contained in all publications are solely those of the individual author(s) and contributor(s) and not of MDPI and/or the editor(s). MDPI and/or the editor(s) disclaim responsibility for any injury to people or property resulting from any ideas, methods, instructions or products referred to in the content. |
© 2025 by the authors. Licensee MDPI, Basel, Switzerland. This article is an open access article distributed under the terms and conditions of the Creative Commons Attribution (CC BY) license (http://creativecommons.org/licenses/by/4.0/).
Copyright: This open access article is published under a Creative Commons CC BY 4.0 license, which permit the free download, distribution, and reuse, provided that the author and preprint are cited in any reuse.


