
Submitted:
28 April 2025
Posted:
29 April 2025
You are already at the latest version
Abstract
Deficits in social interaction and communication characterize Autism Spectrum Disorder (ASD). Although widely recognized by its symptoms, diagnosing ASD remains challenging due to its wide range of clinical presentations. Methods: In this study, we propose a method to assist in the early diagnosis of autism, currently primarily based on clinical assessments. Our approach aims to develop an early differential diagnosis based on electroencephalogram (EEG) signals, seeking to identify patterns associated with ASD. We used EEG data from 56 individuals from the Sheffield dataset, applying techniques to handle missing data. Subsequently, after a detailed analysis of the signals, we applied 3 different starting approaches: one with the original database and the other two with selection of the most significant attributes using the PSO and evolutionary search methods. In each of these approaches, we applied a series of machine learning models, where relatively high performances for classification were observed. Results: We achieved an accuracy of 99.13% ± 0.44 for the dataset with original signals, 99.23% ± 0.38 for the dataset after applying PSO, and an accuracy of 93.91% ± 1.10 for the dataset after the evolutionary search methodology. These results were obtained using classical classifiers, with SVM being the most effective among the first two approaches, while Random Forest with 500 trees proved more efficient in the third approach. Conclusion: Even with all the limitations of the base, the results of the experiments demonstrated promising findings in identifying patterns associated with Autism Spectrum Disorder through the analysis of EEG signals. Finally, we emphasize that this work is the starting point for a larger project, with the objective of supporting and democratizing the diagnosis of ASD, both in children early and later in adults.
Keywords:
Autism Spectrum Disorder (ASD)
; EEG analysis
; Differential diagnosis
; Machine learning
; Neuroengineering
1. Introduction
1.1. Motivation and Problem Characterization
Over the past half-century, our understanding of Autism Spectrum Disorder (ASD) has expanded significantly. ASD poses challenges in communication and social interaction, often accompanied by repetitive behaviors [1]. This increased knowledge has shed light on the complexities of autism.. Now, we see it as a spectrum with many different signs [2]. So, we now know autism is different for everyone. The word ’autism’ is used in different ways to describe different things. It used to be part of a bigger group called ’Pervasive Developmental Disorders’ [3]. The effects of ASD last a long time for individuals and their families. It also affects the kind of help they get in school and therapy. More people are being diagnosed with autism recently [4].
Until 2013, Autism had five categories: Asperger’s, Rett Syndrome, Childhood Disintegrative Disorder, Autistic Disorder, and Pervasive Developmental Disorder (PDD). Today, we use the DSM-5 for diagnosing ASD. We no longer use subtypes. Now, there are three levels based on support needs and abilities of autistic people, that can vary and evolve over time. While some people with autism can live independently, others have severe disabilities and require life-long care and support[5,6,7]. With this revision, diagnostic criteria have also changed. We now focus on just two main areas: social communication and repetitive behavior. To diagnose ASD, we check for at least three social communication symptoms and at least two repetitive behavior symptoms [8]. In 2022, WHO approved the ICD-11 for diagnosing ASD in the health system. (SUS). ICD-11 adopts the term "Autism Spectrum Disorder (ASD)" following DSM-5 standards. In the past, ICD-10 used ’childhood autism’ under Pervasive Developmental Disorders[9].
Signs of ASD usually show up early, sometimes before age two. But, at first, it might look like a general delay in movement and thinking, making diagnosis hard early on[10]. Right now, diagnosing ASD is mainly clinical. Teams of doctors use observations and questionnaires to identify it[11,12]. However, diagnosis is often inaccurate and delayed. ASD doesn’t have specific treatments, but there are therapies to help with symptoms. They aim to improve communication, social skills, and general life for the patient. We need better technologies to help diagnose ASD early, accurately, and easily.
Many studies used EEG signals to diagnose ASD by checking brain activity. These signals come from the small electrical currents in the human brain. These voltage changes happen because of the ions flow between the brain and neurons [13]. EEG signals have different rhythms: delta, theta, alpha, and beta waves [14]. To understand brain activity, we record EEG signals from different parts of the scalp. We cover both sides of the brain. Electrodes in the International System are placed on the head to cover the entire scalp. The most commonly used models are the 10-20 and 10-10 patterns [15]. EEG signals have significant importance in the early diagnosis of diseases. In recent years, EEG signals have been crucial for diagnosing diseases early. In recent years, researchers have linked EEG use with various pattern identification strategies [16]. EEG diagnoses conditions like brain edemas, Parkinson’s, and epilepsy. It also controls brain-machine interfaces and detects and classifies emotions [17].
Furthermore, researchers have investigated machine learning techniques to build diagnostic support tools [11,12]. This branch of artificial intelligence has two parts: supervised and unsupervised machine learning. Some studies suggest that ASD diagnosis can use supervised machine learning techniques. These try to predict a variable, like the diagnosis [18,19]. In supervised learning, the machine learns patterns from a set of examples [20]. This method helps create complex applications and make accurate predictions on different data. Machine learning has three main categories: SVM, ANN, and DL [21]. According to experts, most ASD diagnostic models used ADTree and SVM algorithms. ADTree is a machine learning algorithm for classification. It has decision nodes with conditions and prediction nodes with numbers. The Support Vector Machine (SVM) aims to find a hyperplane in N-dimensional space. This hyperplane should clearly separate data points [22,23].
This study aims to propose a new tool for diagnosing Autism Spectrum Disorder. We analyze EEG signals labeled by clinical diagnosis using machine learning and statistics. We also highlight the potential for EEG utilization not only for diagnosis but also for therapeutic interventions, as an area of interest within the larger project to which this work belongs. In this article, we’ll first cover the ’Related Works’ section. It explores studies using machine learning for diagnosis. In the "Methodology" section, we discuss the database utilized. We also explain key machine learning and statistical concepts. It’s essential to grasp these concepts for the work. Besides, we also describe data preprocessing and experiment execution. The Results and Discussions are presented in sections 3 and 4 respectively, followed by the Conclusion in section 5.
1.2. Related Works
This subsection presents studies that explore EEG and machine learning for ASD diagnosis, highlighting different techniques and classification models.
Kang et al. (2020) [24] combined EEG and eye-tracking data, achieving 85.44% accuracy and an AUC of 0.93, demonstrating the potential of multimodal approaches. Similarly, Mareeswaran and Selvarajan (2023) [25] explored AI tools for early ASD screening in infants, reaching 96% accuracy by categorizing data based on age, gender, and jaundice. Chung et al. (2024) [26] linked EEG patterns to Restricted and Repetitive Behaviors (RRBs) in infants, showing that EEG traits may help detect ASD-related behaviors early.
Deep learning approaches also showed promising results. Ali et al. (2020) [27] trained deep neural networks on EEG data, achieving 80% accuracy. Radhakrishnan et al. (2021) [28] explored deep convolutional networks, with ResNet50 reaching 81% accuracy. Baygin et al. (2021) [29] used 1D LBP and STFT with MobileNetV2 and SqueezeNet, obtaining 96.44% accuracy. Meanwhile, Shu Lih Oh et al. (2021) [30] applied polynomial SVMs, with degree 2 achieving 98.70% accuracy, surpassing other algorithms.
Other studies focused on feature extraction and classification techniques. Jayawardana et al. (2019) [31] used Frequency Band Decomposition and Wavelet Transform with Random Forest and CNN, achieving over 90% accuracy. Alotaibi and Maharatna (2021) [32] analyzed brain connectivity with Phase Locking Value (PLV) methods, reaching 95.8% accuracy. Abdolzadegan et al. (2020) [33] incorporated linear and non-linear EEG features, using KNN and SVM with DBSCAN artifact removal, leading to 94.68% accuracy.
These studies reinforce the effectiveness of EEG-based machine learning for ASD detection, with various models demonstrating high accuracy and potential for clinical applications.
2. Materials and Methods
This section presents the materials and methods used in this study. We begin by detailing the selected database, followed by the preprocessing steps applied to the data. Next, we describe the classifiers used for training and testing, as well as the evaluation metrics chosen to assess model performance.
2.1. Database
This study utilized Dataset 1 from the Sheffield database, containing EEG signals from 56 participants aged 18 to 68. Data was recorded using the Biosemi Active Two EEG system for 150 seconds, with participants at rest and under visual stimulation. A bandpass filter (0.01 to 140 Hz) was applied, with Cz as the reference channel. EEG recordings primarily used a 64-sensor montage, while 128-sensor setups were adjusted for consistency [34,35]. Preprocessing with EEGLAB [36] included filtering, removal of corrupted data, and downsampling to 512 Hz. Several challenges were noted in database analysis, including missing electrodes (Figure 1), which can disrupt data completeness and affect interpretation. Variability in electrode placement due to non-standardized positioning also influenced measurement accuracy. Additionally, high-density electrode systems, while improving resolution, increased data complexity, requiring significant computational resources for processing and analysis.
2.2. Preprocessing
The data preprocessing stage followed the flow depicted in the Figure 2.
The original files in .set and .fdt formats were converted to .edf, a widely used format for storing biomedical signals such as EEG and PSG due to its ability to handle multiple channels of temporal data [37].
To facilitate analysis, the .edf files were converted to .csv using Python 3.11.1 [38], making them compatible with various processing tools. Missing electrode data was addressed using Inverse Distance Weighting (IDW) interpolation, modified with a negative exponential function to reduce computational cost and avoid division by zero. The 128-electrode system was visually compared to the 64-electrode system, and missing channels were identified. Empty columns were added in the correct order, ensuring alignment with the electrode layout shown in Figure 3, based on the ASD 113 file, the only one with complete electrode signals.
The software GIMP (version 2.10.34) [39] was used to obtain the coordinates needed for distance calculations. Using this, the distance between each point was determined using Equation 1, which is based on the Pythagorean theorem [40]. In the formula, "a" and "b" are the points, "x1" and "y1" are the coordinates of point "a", and "x2" and "y2" are the coordinates of point "b". Equation 2 below was used to fill in the missing channels:
The missing channel "Pj" represents the final interpolated signal, while "Pi" corresponds to the existing non-missing channels, ensuring that . Once all missing data was processed, a complete dataset was generated and converted into a CSV file.
For further analysis, GNU Octave (version 8.2.0) [41] was used to segment the EEG signal and extract attributes. A total of 34 features were obtained from each window, as listed in Table 1. Prior studies confirm their effectiveness in EEG analysis [42] and audio analysis [43,44,45]. These features include statistical measures (mean, variance, standard deviation), time-domain metrics (waveform length, zero crossing, Hjorth parameters), and frequency-based attributes (mean power, peak frequency, Shannon entropy). The signal was windowed into 2-second segments with 0.5-second overlap at a sampling rate of 512Hz. Finally, the most relevant attributes were selected using Particle Swarm Optimization (PSO) and evolutionary search methods [46]. Thus, three final files were generated: the original dataset, the optimized dataset using PSO, and the optimized dataset using evolutionary search, all properly processed.
2.3. Classification
We acquired three distinct databases using the methods described before. Then, we trained, validated, and tested various classifiers. This process is shown in the diagram in Figure 4. We used the following algorithms, chosen according to previous methodologies to represent distribution-based and decision tree-base classifiers [43,44,45,47,48,49,50,51,52,53]: Bayes Net [54], Naive Bayes [55], Random Tree [56], and Random Forest [57]. The Random Forest had 10, 100, and 500 trees. We also used the Support Vector Machine [58] with various kernels. These were Linear, Polynomial of Degree 2, and Polynomial of Degree 3. We also tried Rbf with Gamma 0.1, 0.2, and 0.3.
We used the Waikato Environment for Knowledge Analysis (WEKA) software, version 3.9.6 [59,60], to split each dataset into 80% training and 20% testing sets. The selected models and configurations were then applied. To ensure statistical robustness, each experiment was repeated 30 times in addition to performing 10-fold cross-validation.
In this method, the dataset is divided into 10 equal parts, with the model trained on 9 parts and tested on the remaining one. This process repeats until all parts serve as a test set once, averaging the performance metrics across iterations. This technique enhances model reliability, reducing variance and bias while providing a more accurate estimate of generalization ability [61].
3. Results
This section presents and analyzes the research results. We first examined the complete dataset as a baseline, followed by evaluating the Particle Swarm Optimization (PSO) and evolutionary search methods. Tests were conducted on the best models from each dataset to determine the most effective techniques for future studies.
Table 2 displays the results using the full dataset, including all channels and features. The accuracy difference between the best and worst models reached 40.55%, highlighting the variation in performance.
The results of the training and validation stage after feature selection with PSO are presented in Table 3. In this approach, the interval between the average accuracies of the best and worst models was 39.74%.
The results of the evolutionary search-based feature selection are presented in Table 4. In this approach, the accuracy gap between the best and worst models was 38.18%.
Figure 5 and Figure 6 display boxplots illustrating the dispersion of accuracy and kappa index values for the best model in each approach. Some dispersion patterns and outliers were identified, which will be analyzed in the next section.
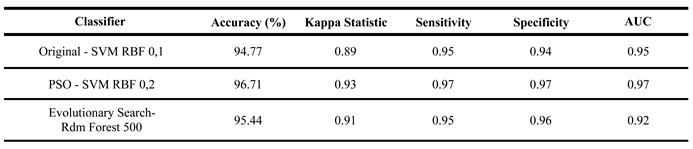
The best models in each approach (Complete, PSO, and Evolutionary Search) were finally tested. They were tested with separate samples from the dataset in a single round. Table 5 shows the results of this test. The same testing stage generated the confusion matrices for each classifier. They are in Figure 7. We can use them to analyze true and false positive and negative rates from each model. This analysis will be done in the results discussion section.
4. Discussion
From Table 2, Naive Bayes had the weakest performance, with an accuracy of 58.58%, a Kappa Index of 0.17, sensitivity of 0.25, and AUC of 0.60. Its specificity (0.92) was an exception but indicated near-random ASD classification. Bayes Net performed slightly better, with 74.2% accuracy and improved sensitivity.
Tree-based models performed significantly better, with Decision Trees and Random Forests achieving over 90% in accuracy, sensitivity, and specificity. The Decision Tree had a lower Kappa Index (80%), suggesting weaker agreement between training and validation. Random Forest with 100 and 500 trees excelled, reaching over 98% accuracy with well-balanced sensitivity and specificity.
Among Support Vector Machines (SVM), polynomial kernels (degrees 1, 2, and 3) reached 96%, 97%, and 98% accuracy, maintaining balanced true positive and true negative rates. The best-performing model was the SVM with an RBF kernel (degree 0.1), achieving 99.13% accuracy with a standard deviation of 0.44, highlighting potential refinements for classifier optimization.
From Table 3, after applying PSO, the dataset’s dimensionality significantly decreased from 2142 features (34 extracted from each of the 63 electrodes) to 686. This reduction improved processing efficiency while maintaining classifier effectiveness, with performance levels similar to the previous approach.
Naive Bayes remained the weakest model in training, though it showed slight improvements across key metrics. Sensitivity for ASD classification remained its main limitation. Bayes Net and Random Tree also continued to rank among the lowest-performing models.
Among the classifiers, the SVM with an RBF kernel and gamma of 0.2 stood out, achieving 99.23% accuracy, a Kappa Index of 0.98, and 99% across sensitivity, specificity, and AUC. Despite the significant reduction in features, these metrics remained close to 100%. Other SVM models, except those with a linear polynomial kernel, delivered results similar to the best-performing classifier.
The configurations of Random Forest, both the simplest one with 10 trees and the one with 500 trees, also achieved metrics above 90%. As models that require less computational processing, they become a viable alternative to the solution.
Finally, an evolutionary search was applied to select the most relevant features, reducing the dataset from 2142 to 20 key features. Unlike previous approaches where SVM with an RBF kernel performed best, this method yielded the best results with Random Forest. As shown in Table 4, both the 100-tree and 500-tree configurations achieved over 93% accuracy, sensitivity, and specificity, along with a kappa index of 0.87 and an AUC of 0.98.
Performance among other classifiers varied significantly. Naive Bayes had the weakest results, with 55.73% accuracy, a kappa index of 0.11, and low sensitivity (0.18), but high specificity (0.92), indicating poor suitability for this dataset. Bayes Net performed similarly to SVM but showed weaker results compared to its performance in previous approaches, with 68.61% accuracy. SVM models displayed inconsistency, with the polynomial kernel (degree 3) performing best at 72.59% accuracy and a kappa index of 0.45, but still below Random Forest. Random Tree showed strong performance, reaching 87.43% accuracy and kappa values above 0.70. In the end, Random Forest with 500 trees was selected as the best classifier, reinforcing its effectiveness for this classification problem.
Figure 5 presents the boxplots of the best models from each approach. The Random Forest with 500 trees showed a wider range of values compared to SVM models, with greater variability in the evolutionary search-based dataset, despite having the lowest median. In contrast, the SVM models in the original and PSO-based datasets had similar distributions, with values closer to their medians, suggesting greater precision.
Figure 6 illustrates the dispersion of Kappa index values. The SVM models exhibited more consistent classification agreement, with a smaller spread between maximum and minimum values. The Random Forest with 500 trees in the evolutionary search approach had more dispersed values, with 75% of observations below 0.9, and even its highest values were lower than the worst SVM results in the other approaches.
The test results in Table 5 show that all three models performed well, with similar outcomes. However, the SVM models for the complete and PSO-reduced datasets had slight decreases across all five metrics. The Random Forest with the evolutionary search dataset performed best in testing, which was expected due to lower statistical rigor at this stage. The top-performing classifier in this single test round was the SVM with RBF kernel (degree 0.2) after PSO, reinforcing the effectiveness of these models when applied to new data.
Figure 7 a) shows that the SVM with the complete dataset correctly classified 562 ASD windows and 561 control windows, maintaining high sensitivity and specificity. In Figure 7 b), the SVM after PSO correctly identified 570 ASD and 576 control windows. Lastly, Figure 7 c) presents the Random Forest with evolutionary search, classifying 569 ASD windows correctly, with 26 false positives, and 562 control windows correctly, with 28 misclassifications.
5. Conclusions
This study proposed a machine learning-based method for diagnosing Autism Spectrum Disorder (ASD) using EEG signals. By applying interpolation to estimate missing signals and using particle swarm optimization for feature selection, the approach demonstrated strong classification performance with Random Forest and Support Vector Machine (SVM) models. These results highlight the effectiveness of combining advanced machine learning techniques with robust data preprocessing to identify EEG patterns associated with ASD.
Despite its strengths, some limitations must be considered, such as variability in EEG recording protocols and the need for validation with independent samples. Using a public dataset may also introduce biases, affecting result generalization. Addressing these challenges is crucial to refining the method and enhancing its clinical applicability.
Future work includes developing a proprietary EEG database with standardized data collection and designing software for automated EEG analysis and diagnostic support. This will optimize healthcare workflows and contribute to broader access to ASD diagnosis. By improving diagnostic methods, this study can help facilitate early interventions, enhance patient outcomes, and reduce healthcare costs, representing a significant step toward more efficient and accessible ASD detection.
Author Contributions
Conceptualization: Flávio S. Fonseca, Giselle M. M. Moreno, Maíra A. de Santana, Juliana C. Gomes, and Wellington P. dos Santos; Methodology: Flávio S. Fonseca, Giselle M. M. Moreno, Maíra A. de Santana, Juliana C. Gomes, and Wellington P. dos Santos; Software: Flávio S. Fonseca, Adrielly S. O. Silva, Maria Vitória S. Muniz, Catarina Victória N. de Oliveira, Arthur M. N. de Melo, Maria Luísa M. S. Passos, Ana Beatriz S. Sampaio, Thailson Caetano V. da Silva, Giselle M. M. Moreno, Maíra A. de Santana, Juliana C. Gomes, and Wellington P. dos Santos; Validation: Flávio S. Fonseca, Adrielly S. O. Silva, Maria Vitória S. Muniz, Catarina Victória N. de Oliveira, Arthur M. N. de Melo, Maria Luísa M. S. Passos, Ana Beatriz S. Sampaio, Thailson Caetano V. da Silva, Giselle M. M. Moreno, Maíra A. de Santana, Juliana C. Gomes, and Wellington P. dos Santos; Formal analysis: Flávio S. Fonseca, Giselle M. M. Moreno, Maíra A. de Santana, Juliana C. Gomes, and Wellington P. dos Santos; Investigation: Flávio S. Fonseca, Adrielly S. O. Silva, Maria Vitória S. Muniz, Catarina Victória N. de Oliveira, Arthur M. N. de Melo, Maria Luísa M. S. Passos, Ana Beatriz S. Sampaio, Thailson Caetano V. da Silva, Cecília C. da Silva, Clarisse L. de Lima, Giselle M. M. Moreno, Maíra A. de Santana, Juliana C. Gomes, and Wellington P. dos Santos; Resources: Flávio S. Fonseca, Giselle M. M. Moreno, Maíra A. de Santana, Juliana C. Gomes, and Wellington P. dos Santos; Data curation: Flávio S. Fonseca, Giselle M. M. Moreno, Maíra A. de Santana, Juliana C. Gomes, and Wellington P. dos Santos; Writing—original draft preparation: Flávio S. Fonseca, Adrielly S. O. Silva, Maria Vitória S. Muniz, Catarina Victória N. de Oliveira, Arthur M. N. de Melo, Maria Luísa M. S. Passos, Ana Beatriz S. Sampaio, Thailson Caetano V. da Silva, Giselle M. M. Moreno, Maíra A. de Santana, Juliana C. Gomes, and Wellington P. dos Santos; Writing—review and editing: Flávio S. Fonseca, Cecília C. da Silva, Clarisse L. de Lima, Giselle M. M. Moreno, Maíra A. de Santana, Juliana C. Gomes, and Wellington P. dos Santos; Visualization: Flávio S. Fonseca, Adrielly S. O. Silva, Maria Vitória S. Muniz, Catarina Victória N. de Oliveira, Arthur M. N. de Melo, Maria Luísa M. S. Passos, Ana Beatriz S. Sampaio, Thailson Caetano V. da Silva, Cecília C. da Silva, Clarisse L. de Lima, Giselle M. M. Moreno, Maíra A. de Santana, Juliana C. Gomes, and Wellington P. dos Santos; Supervision: Giselle M. M. Moreno, Maíra A. de Santana, Juliana C. Gomes, and Wellington P. dos Santos; Data curation: Giselle M. M. Moreno, Maíra A. de Santana, Juliana C. Gomes, and Wellington P. dos Santos; Project administration: Juliana C. Gomes and Wellington P. dos Santos; Funding acquisition: Alana Elza F. da Gama, Ana Cristina A. Montenegro, Bianca A. M. de Queiroga, Marilú G. N. M. da Silva, Rafaella A. S. Campos Lima, Sadi S. Seabra Filho, Shirley S. J. O. Cruz, and Wellington P. dos Santos. All authors have read and agreed to the published version of the manuscript.
Data Availability Statement
This study utilized Dataset 1 from the Sheffield public database, containing EEG signals from 56 participants aged 18 to 68. Data was recorded using the Biosemi Active Two EEG system for 150 seconds, with participants at rest and under visual stimulation. A bandpass filter (0.01 to 140 Hz) was applied, with Cz as the reference channel. EEG recordings primarily used a 64-sensor montage, while 128-sensor setups were adjusted for consistency. The code developed by the authors could be available under demand.
This research was funded by the Brazilian research agencies Conselho Nacional de Desenvolvimento Científico e Tecnológico - CNPq (CNPq 304636/2021-5), Fundação de Amparo à Ciência e Tecnologia do Estado de Pernambuco - FACEPE (IBPG-2267-3.13/22), Coordenação de Aperfeiçoamento de Pessoal de Nível Superior - CAPES, and Financiadora de Estudos e Projetos - FINEP (2170/22).
Acknowledgments
We would like to thank the Brazilian research agencies Conselho Nacional de Desenvolvimento Científico e Tecnológico - CNPq (CNPq 304636/2021-5), Fundação de Amparo à Ciência e Tecnologia do Estado de Pernambuco - FACEPE (IBPG-2267-3.13/22), Coordenação de Aperfeiçoamento de Pessoal de Nível Superior - CAPES, and Financiadora de Estudos e Projetos - FINEP (2170/22), for partially funding this research.
Conflicts of Interest
The authors declare no competing interests.
References
- American Psychiatric Association. Diagnostic and statistical manual of mental disorders: DSM-5, 5th ed.; American Psychiatric Association Publishing: Washington, DC, 2013. [Google Scholar]
- Lord, C.; Elsabbagh, M.; Baird, G.; Veenstra-Vanderweele, J. Autism spectrum disorder. The lancet 2018, 392, 508–520. [Google Scholar] [CrossRef] [PubMed]
- Lord, C.; Brugha, T.S.; Charman, T.; Cusack, J.; Dumas, G.; Frazier, T.; Jones, E.J.; Jones, R.M.; Pickles, A. Autism spectrum disorder. Nature reviews Disease primers 2020, 6. [Google Scholar] [CrossRef] [PubMed]
- Vismara, L.A.; Rogers, S.J. Behavioral treatments in autism spectrum disorder: what do we know? Annual review of clinical psychology 2010, 6, 447–468. [Google Scholar] [CrossRef]
- Kulage, K.M.; Smaldone, A.M.; Cohn, E.G. How will DSM-5 affect autism diagnosis? A systematic literature review and meta-analysis. Journal of autism and developmental disorders 2014, 44, 1918–1932. [Google Scholar] [CrossRef] [PubMed]
- Volkmar, F.R.; Reichow, B. Autism in DSM-5: progress and challenges. Molecular autism 2013, 4, 1–6. [Google Scholar] [CrossRef]
- Kulage, K.M.; Goldberg, J.; Usseglio, J.; Romero, D.; Bain, J.M.; Smaldone, A.M. How has DSM-5 affected autism diagnosis? A 5-year follow-up systematic literature review and meta-analysis. Journal of autism and developmental disorders 2020, 50, 2102–2127. [Google Scholar] [CrossRef]
- Sharma, S.R.; Gonda, X.; Tarazi, F.I. Autism spectrum disorder: classification, diagnosis and therapy. Pharmacology & therapeutics 2018, 190, 91–104. [Google Scholar]
- Dias, C.C.V.; Maciel, S.C.; Silva, J.V.C.d.; Menezes, T.d.S.B.d. Representações sociais sobre o autismo elaboradas por estudantes universitários. Psico-USF 2022, 26, 631–643. [Google Scholar] [CrossRef]
- Oliveira, G. Autismo: diagnóstico e orientação. Parte I-Vigilância, rastreio e orientação nos cuidados primários de saúde. Acta Pediatr Port 2009, 40, 278–287. [Google Scholar]
- Heinsfeld, A.S.; Franco, A.R.; Craddock, R.C.; Buchweitz, A.; Meneguzzi, F. Identification of autism spectrum disorder using deep learning and the ABIDE dataset. NeuroImage: Clinical 2018, 17, 16–23. [Google Scholar] [CrossRef]
- Khodatars, M.; Shoeibi, A.; Sadeghi, D.; Ghaasemi, N.; Jafari, M.; Moridian, P.; Khadem, A.; Alizadehsani, R.; Zare, A.; Kong, Y.; et al. Deep learning for neuroimaging-based diagnosis and rehabilitation of autism spectrum disorder: a review. Computers in Biology and Medicine 2021, 139, 104949. [Google Scholar] [CrossRef]
- Kaur, J.; Kaur, A. A review on analysis of EEG signals. In Proceedings of the 2015 International Conference on Advances in Computer Engineering and Applications. IEEE; 2015; pp. 957–960. [Google Scholar]
- Subha, D.P.; Joseph, P.K.; Acharya U, R.; Lim, C.M. EEG signal analysis: a survey. Journal of medical systems 2010, 34, 195–212. [Google Scholar] [CrossRef]
- Tavares, M.C.; Eng, M.; Biomédica, E. Eeg e potenciais evocados–uma introduçao. Contronic Sistemas Automáticos Ltda 2011, pp. 1–13.
- Cantarelli, T.L.; Júnior, J.; Júnior, S. Fundamentos da medição do eeg: Uma introdução. Semin. ELETRONICA E AUTOMAÇÃO, Ponta Grossa 2016.
- Li, B.; Cheng, T.; Guo, Z. A review of EEG acquisition, processing and application. In Proceedings of the Journal of Physics: Conference Series. IOP Publishing, Vol. 1907; 2021; p. 012045. [Google Scholar]
- Oro, A.B.; Navarro-Calvillo, M.; Esmer, C. Autistic Behavior Checklist (ABC) and its applications. Comprehensive guide to autism 2014, pp. 2787–2798.
- Pagnozzi, A.M.; Conti, E.; Calderoni, S.; Fripp, J.; Rose, S.E. A systematic review of structural MRI biomarkers in autism spectrum disorder: A machine learning perspective. International Journal of Developmental Neuroscience 2018, 71, 68–82. [Google Scholar] [CrossRef] [PubMed]
- De Bruijne, M. Machine learning approaches in medical image analysis: From detection to diagnosis, 2016.
- Tanveer, M.; Richhariya, B.; Khan, R.U.; Rashid, A.H.; Khanna, P.; Prasad, M.; Lin, C. Machine learning techniques for the diagnosis of Alzheimer’s disease: A review. ACM Transactions on Multimedia Computing, Communications, and Applications (TOMM) 2020, 16, 1–35. [Google Scholar] [CrossRef]
- Hyde, K.K.; Novack, M.N.; LaHaye, N.; Parlett-Pelleriti, C.; Anden, R.; Dixon, D.R.; Linstead, E. Applications of supervised machine learning in autism spectrum disorder research: a review. Review Journal of Autism and Developmental Disorders 2019, 6, 128–146. [Google Scholar] [CrossRef]
- Sandin, S.; Lichtenstein, P.; Kuja-Halkola, R.; Hultman, C.; Larsson, H.; Reichenberg, A. The heritability of autism spectrum disorder. Jama 2017, 318, 1182–1184. [Google Scholar] [CrossRef]
- Kang, J.; Han, X.; Song, J.; Niu, Z.; Li, X. The identification of children with autism spectrum disorder by SVM approach on EEG and eye-tracking data. Computers in biology and medicine 2020, 120, 103722. [Google Scholar] [CrossRef] [PubMed]
- Hossain, M.D.; Kabir, M.A.; Anwar, A.; Islam, M.Z. Detecting autism spectrum disorder using machine learning techniques: An experimental analysis on toddler, child, adolescent and adult datasets. Health Information Science and Systems 2021, 9, 1–13. [Google Scholar] [CrossRef]
- Chung, H.; Wilkinson, C.; Said, A.; Nelson, C. Evaluating early EEG correlates of restricted and repetitive behaviors for toddlers with or without autism. Research square 2024. [Google Scholar] [CrossRef]
- Ali, N.A.; Syafeeza, A.; Jaafar, A.; Alif, M.; Ali, N. Autism spectrum disorder classification on electroencephalogram signal using deep learning algorithm. IAES International Journal of Artificial Intelligence 2020, 9, 91–99. [Google Scholar] [CrossRef]
- Radhakrishnan, M.; Ramamurthy, K.; Choudhury, K.K.; Won, D.; Manoharan, T.A. Performance analysis of deep learning models for detection of autism spectrum disorder from EEG signals. Traitement du Signal 2021, 38. [Google Scholar] [CrossRef]
- Baygin, M.; Dogan, S.; Tuncer, T.; Barua, P.D.; Faust, O.; Arunkumar, N.; Abdulhay, E.W.; Palmer, E.E.; Acharya, U.R. Automated ASD detection using hybrid deep lightweight features extracted from EEG signals. Computers in Biology and Medicine 2021, 134, 104548. [Google Scholar] [CrossRef] [PubMed]
- Oh, S.L.; Jahmunah, V.; Arunkumar, N.; Abdulhay, E.W.; Gururajan, R.; Adib, N.; Ciaccio, E.J.; Cheong, K.H.; Acharya, U.R. A novel automated autism spectrum disorder detection system. Complex & Intelligent Systems 2021, 7, 2399–2413. [Google Scholar]
- Jayawardana, Y.; Jaime, M.; Jayarathna, S. Analysis of Temporal Relationships between ASD and Brain Activity through EEG and Machine Learning. In Proceedings of the 2019 IEEE 20th International Conference on Information Reuse and Integration for Data Science (IRI); 2019; pp. 151–158. [Google Scholar] [CrossRef]
- Alotaibi, N.; Maharatna, K. Classification of autism spectrum disorder from EEG-based functional brain connectivity analysis. Neural computation 2021, 33, 1914–1941. [Google Scholar] [CrossRef] [PubMed]
- Abdolzadegan, D.; Moattar, M.H.; Ghoshuni, M. A robust method for early diagnosis of autism spectrum disorder from EEG signals based on feature selection and DBSCAN method. Biocybernetics and Biomedical Engineering 2020, 40, 482–493. [Google Scholar] [CrossRef]
- Dickinson, A.; Jeste, S.; Milne, E. Electrophysiological signatures of brain aging in autism spectrum disorder. Cortex 2022, 148, 139–151. [Google Scholar] [CrossRef]
- Oostenveld, R.; Praamstra, P. The five percent electrode system for high-resolution EEG and ERP measurements. Clinical neurophysiology 2001, 112, 713–719. [Google Scholar] [CrossRef]
- Delorme, A.; Makeig, S. EEGLAB: an open source toolbox for analysis of single-trial EEG dynamics including independent component analysis. Journal of neuroscience methods 2004, 134, 9–21. [Google Scholar] [CrossRef]
- Kemp, B.; Olivan, J. European data format ‘plus’ (EDF+), an EDF alike standard format for the exchange of physiological data. Clinical Neurophysiology 2003, 114, 1755–1761. [Google Scholar] [CrossRef]
- Van Rossum, G.; Drake, F.L. Python 3 Reference Manual; CreateSpace: Scotts Valley, CA, 2009. [Google Scholar]
- Oliver, E.; Ruiz, J.; She, S.; Wang, J. The Software Architecture of the GIMP 2006.
- Maor, E. The Pythagorean Theorem: A 4,000-Year History. Statistics and Computing 2019. [Google Scholar]
- Eaton, J.W.; Bateman, D.; Hauberg, S.; Wehbring, R. GNU Octave version 10.1.0 manual: a high-level interactive language for numerical computations; 2025.
- de Santana, M.A.; Fonseca, F.S.; Torcate, A.S.; dos Santos, W.P. Emotion Recognition from Multimodal Data: a machine learning approach combining classical and hybrid deep architectures. Research on Biomedical Engineering 2023, 39, 613–639. [Google Scholar] [CrossRef]
- Espinola, C.W.; Gomes, J.C.; Pereira, J.M.S.; Dos Santos, W.P. Detection of major depressive disorder using vocal acoustic analysis and machine learning—an exploratory study. Research on Biomedical Engineering 2021, 37, 53–64. [Google Scholar] [CrossRef]
- Wanderley Espinola, C.; Gomes, J.C.; Mônica Silva Pereira, J.; dos Santos, W.P. Detection of major depressive disorder, bipolar disorder, schizophrenia and generalized anxiety disorder using vocal acoustic analysis and machine learning: an exploratory study. Research on Biomedical Engineering 2022, 38, 813–829. [Google Scholar] [CrossRef]
- Espinola, C.W.; Gomes, J.C.; Pereira, J.M.S.; dos Santos, W.P. Vocal acoustic analysis and machine learning for the identification of schizophrenia. Research on Biomedical Engineering 2021, 37, 33–46. [Google Scholar] [CrossRef]
- Jiang, J.J.; Wei, W.X.; Shao, W.L.; Liang, Y.F.; Qu, Y.Y. Research on large-scale bi-level particle swarm optimization algorithm. IEEE Access 2021, 9, 56364–56375. [Google Scholar] [CrossRef]
- Santana, M.A.d.; Pereira, J.M.S.; Silva, F.L.d.; Lima, N.M.d.; Sousa, F.N.d.; Arruda, G.M.S.d.; Lima, R.d.C.F.d.; Silva, W.W.A.d.; Santos, W.P.d. Breast cancer diagnosis based on mammary thermography and extreme learning machines. Research on Biomedical Engineering 2018, 34, 45–53. [Google Scholar] [CrossRef]
- Barbosa, V.A.d.F.; Gomes, J.C.; de Santana, M.A.; Albuquerque, J.E.d.A.; de Souza, R.G.; de Souza, R.E.; dos Santos, W.P. Heg.IA: an intelligent system to support diagnosis of Covid-19 based on blood tests. Research on Biomedical Engineering, 2021; 1–18. [Google Scholar]
- Gomes, J.C.; Barbosa, V.A.d.F.; Santana, M.A.; Bandeira, J.; Valença, M.J.S.; de Souza, R.E.; Ismael, A.M.; dos Santos, W.P. IKONOS: an intelligent tool to support diagnosis of COVID-19 by texture analysis of X-ray images. Research on Biomedical Engineering, 2020; 1–14. [Google Scholar]
- Oliveira, A.P.S.d.; De Santana, M.A.; Andrade, M.K.S.; Gomes, J.C.; Rodrigues, M.C.; dos Santos, W.P. Early diagnosis of Parkinson’s disease using EEG, machine learning and partial directed coherence. Research on Biomedical Engineering 2020, 36, 311–331. [Google Scholar] [CrossRef]
- Gomes, J.C.; Masood, A.I.; Silva, L.H.d.S.; da Cruz Ferreira, J.R.B.; Freire Junior, A.A.; Rocha, A.L.d.S.; de Oliveira, L.C.P.; da Silva, N.R.C.; Fernandes, B.J.T.; Dos Santos, W.P. Covid-19 diagnosis by combining RT-PCR and pseudo-convolutional machines to characterize virus sequences. Scientific Reports 2021, 11, 11545. [Google Scholar] [CrossRef]
- Rodrigues, A.L.; de Santana, M.A.; Azevedo, W.W.; Bezerra, R.S.; Barbosa, V.A.; de Lima, R.C.; dos Santos, W.P. Identification of mammary lesions in thermographic images: feature selection study using genetic algorithms and particle swarm optimization. Research on Biomedical Engineering 2019, 35, 213–222. [Google Scholar] [CrossRef]
- Barbosa, V.A.d.F.; Gomes, J.C.; de Santana, M.A.; de Lima, C.L.; Calado, R.B.; Bertoldo Junior, C.R.; Albuquerque, J.E.d.A.; de Souza, R.G.; de Araújo, R.J.E.; Mattos Junior, L.A.R.; et al. Covid-19 rapid test by combining a random forest-based web system and blood tests. Journal of Biomolecular Structure and Dynamics 2022, 40, 11948–11967. [Google Scholar] [CrossRef]
- Zhao, P.; Zhang, L.; Liu, G.; Si, S. Design and Development of the Bayesian Network Platform Based on B/S Structure. In Proceedings of the 2011 Fourth International Symposium on Knowledge Acquisition and Modeling. IEEE; 2011; pp. 65–68. [Google Scholar]
- Dimitoglou, G.; Adams, J.A.; Jim, C.M. Comparison of the C4. 5 and a Naïve Bayes classifier for the prediction of lung cancer survivability. arXiv preprint arXiv:1206.1121, arXiv:1206.1121 2012.
- Niranjan, A.; Nutan, D.; Nitish, A.; Deepa-Shenoy, P.; Venugopal, K.; ERCR, T. Ensemble of random committee and random tree for efficient anomaly classification using voting. In Proceedings of the Proceedings of the International Conference for Convergence in Technology, Pune, India, 2018, pp.
- Yuan, D.; Huang, J.; Yang, X.; Cui, J. Improved random forest classification approach based on hybrid clustering selection. In Proceedings of the 2020 Chinese Automation Congress (CAC). IEEE; 2020; pp. 1559–1563. [Google Scholar]
- Burbidge, R.; Trotter, M.; Buxton, B.; Holden, S. Drug design by machine learning: support vector machines for pharmaceutical data analysis. Computers & chemistry 2001, 26, 5–14. [Google Scholar]
- Eibe, F.; Hall, M.A.; Witten, I.H.; Pal, J. The WEKA workbench. Online appendix for data mining: practical machine learning tools and techniques 2016, 4. [Google Scholar]
- Hall, M.; Frank, E.; Holmes, G.; Pfahringer, B.; Reutemann, P.; Witten, I.H. The WEKA data mining software: an update. ACM SIGKDD explorations newsletter 2009, 11, 10–18. [Google Scholar] [CrossRef]
- Fushiki, T. Estimation of prediction error by using K-fold cross-validation. Statistics and Computing 2011, 21, 137–146. [Google Scholar] [CrossRef]
Figure 1.
Bar chart depicting the distribution of EEG files according to the quantity of missing data points. Each bar corresponds to the count of EEG files exhibiting specific numbers of absent channels, illustrating the prevalence and extent of incomplete data within the dataset analyzed.
Figure 1.
Bar chart depicting the distribution of EEG files according to the quantity of missing data points. Each bar corresponds to the count of EEG files exhibiting specific numbers of absent channels, illustrating the prevalence and extent of incomplete data within the dataset analyzed.
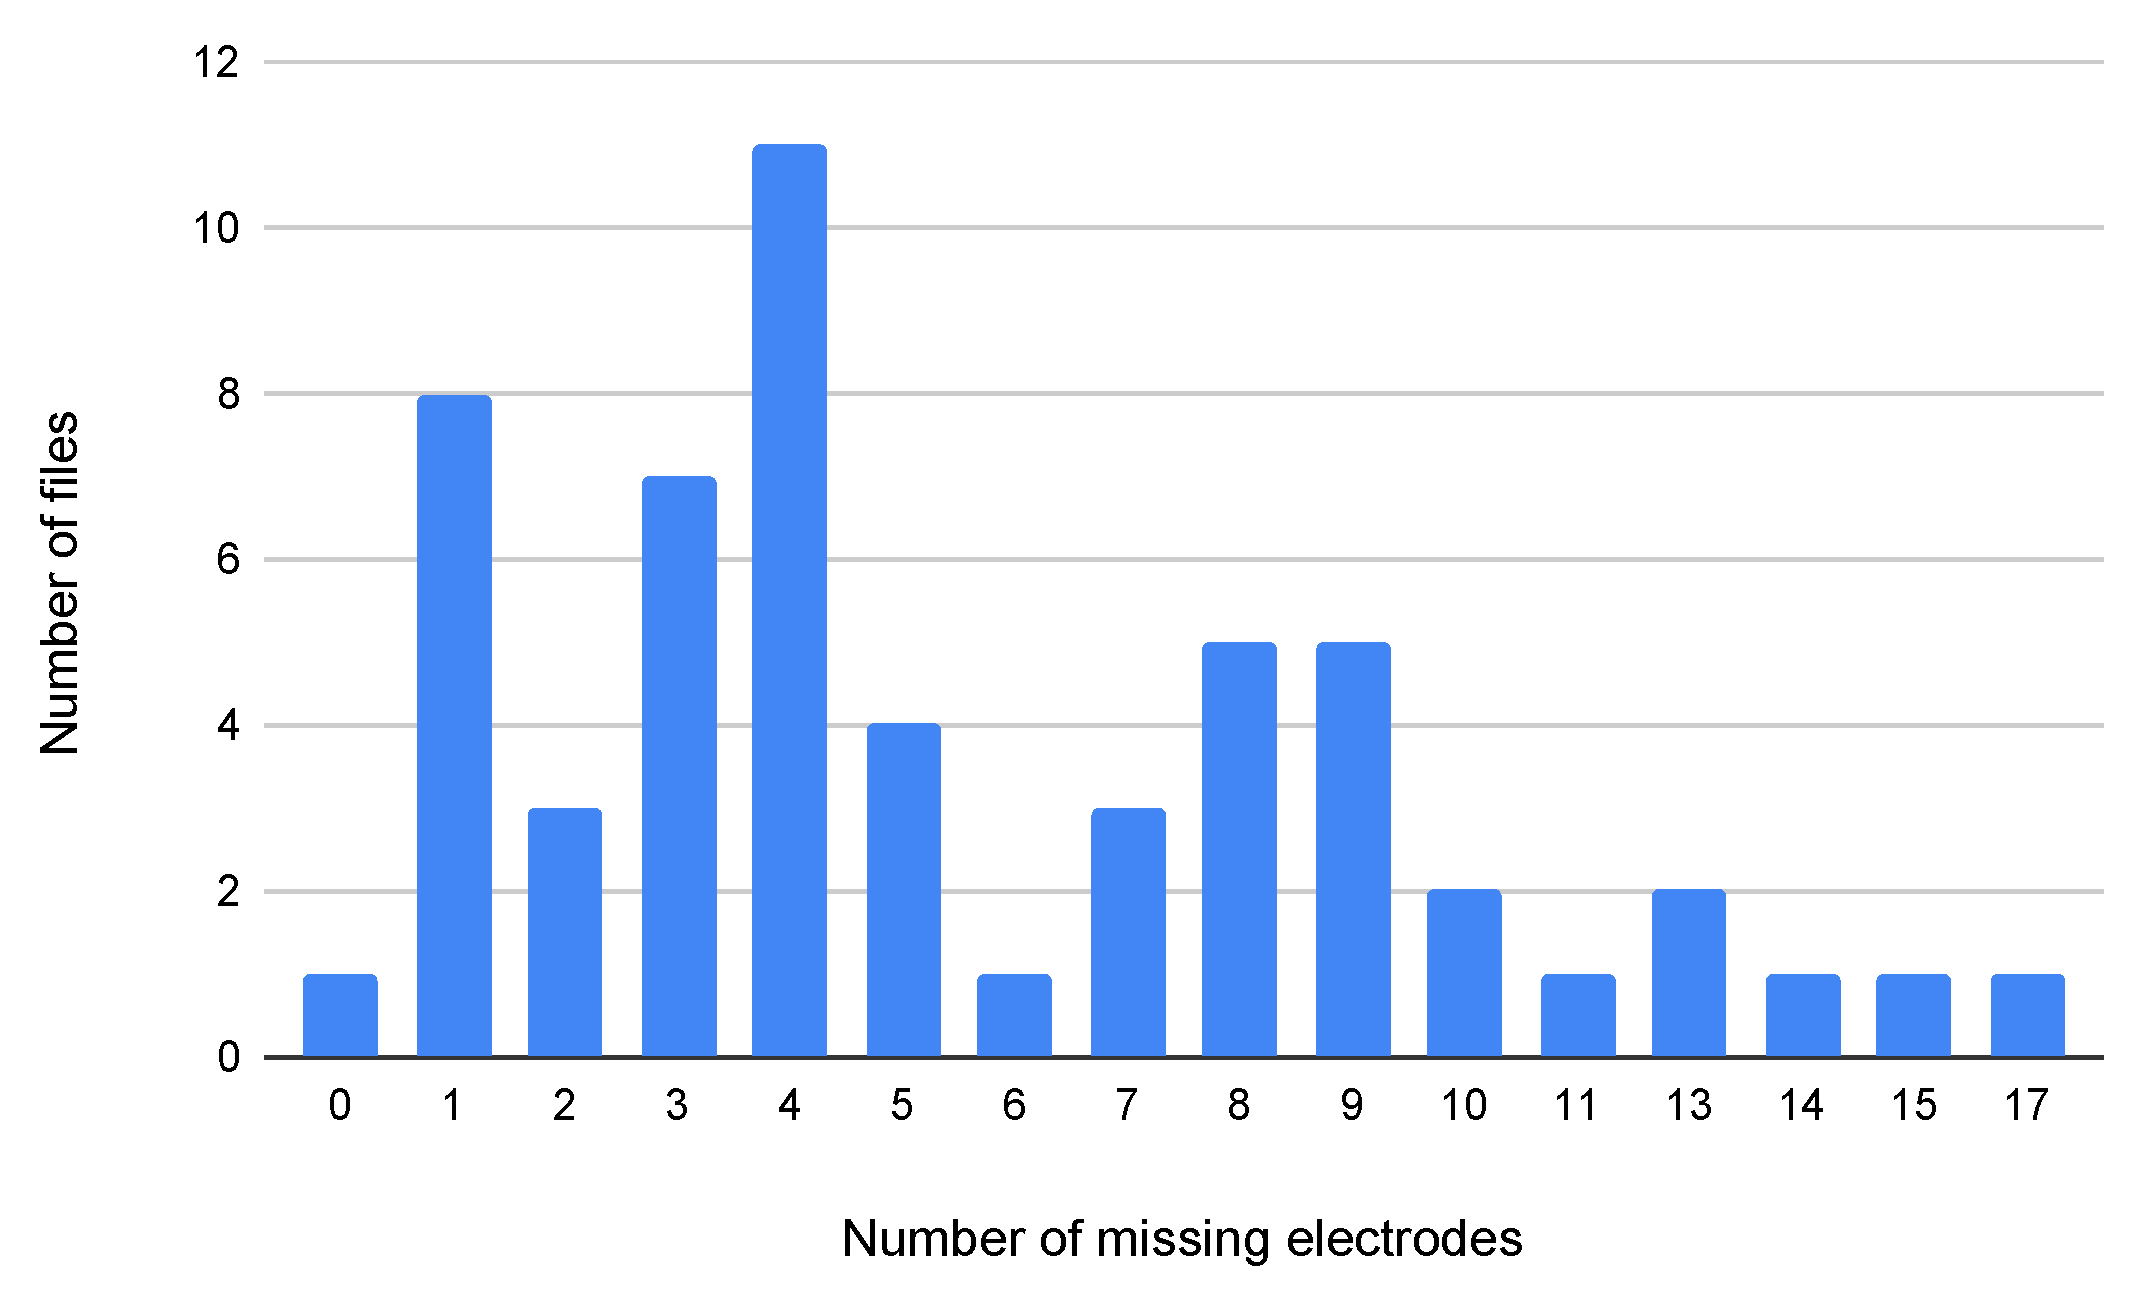
Figure 2.
Pre-processing Pipeline for EEG Signal Analysis from the Sheffield Database. The diagram details the workflow from initial EEG data acquisition at 512Hz through the steps of file conversion, management of missing data via augmentation strategies, and feature extraction and selection of 34 key attributes. The processed data is then partitioned into distinct datasets: original, optimized through Particle Swarm Optimization (PSO), and using evolutionary search techniques. Each dataset is split into training/validation and testing subsets, with an 80:20 ratio, to prepare for the machine learning analysis phase.
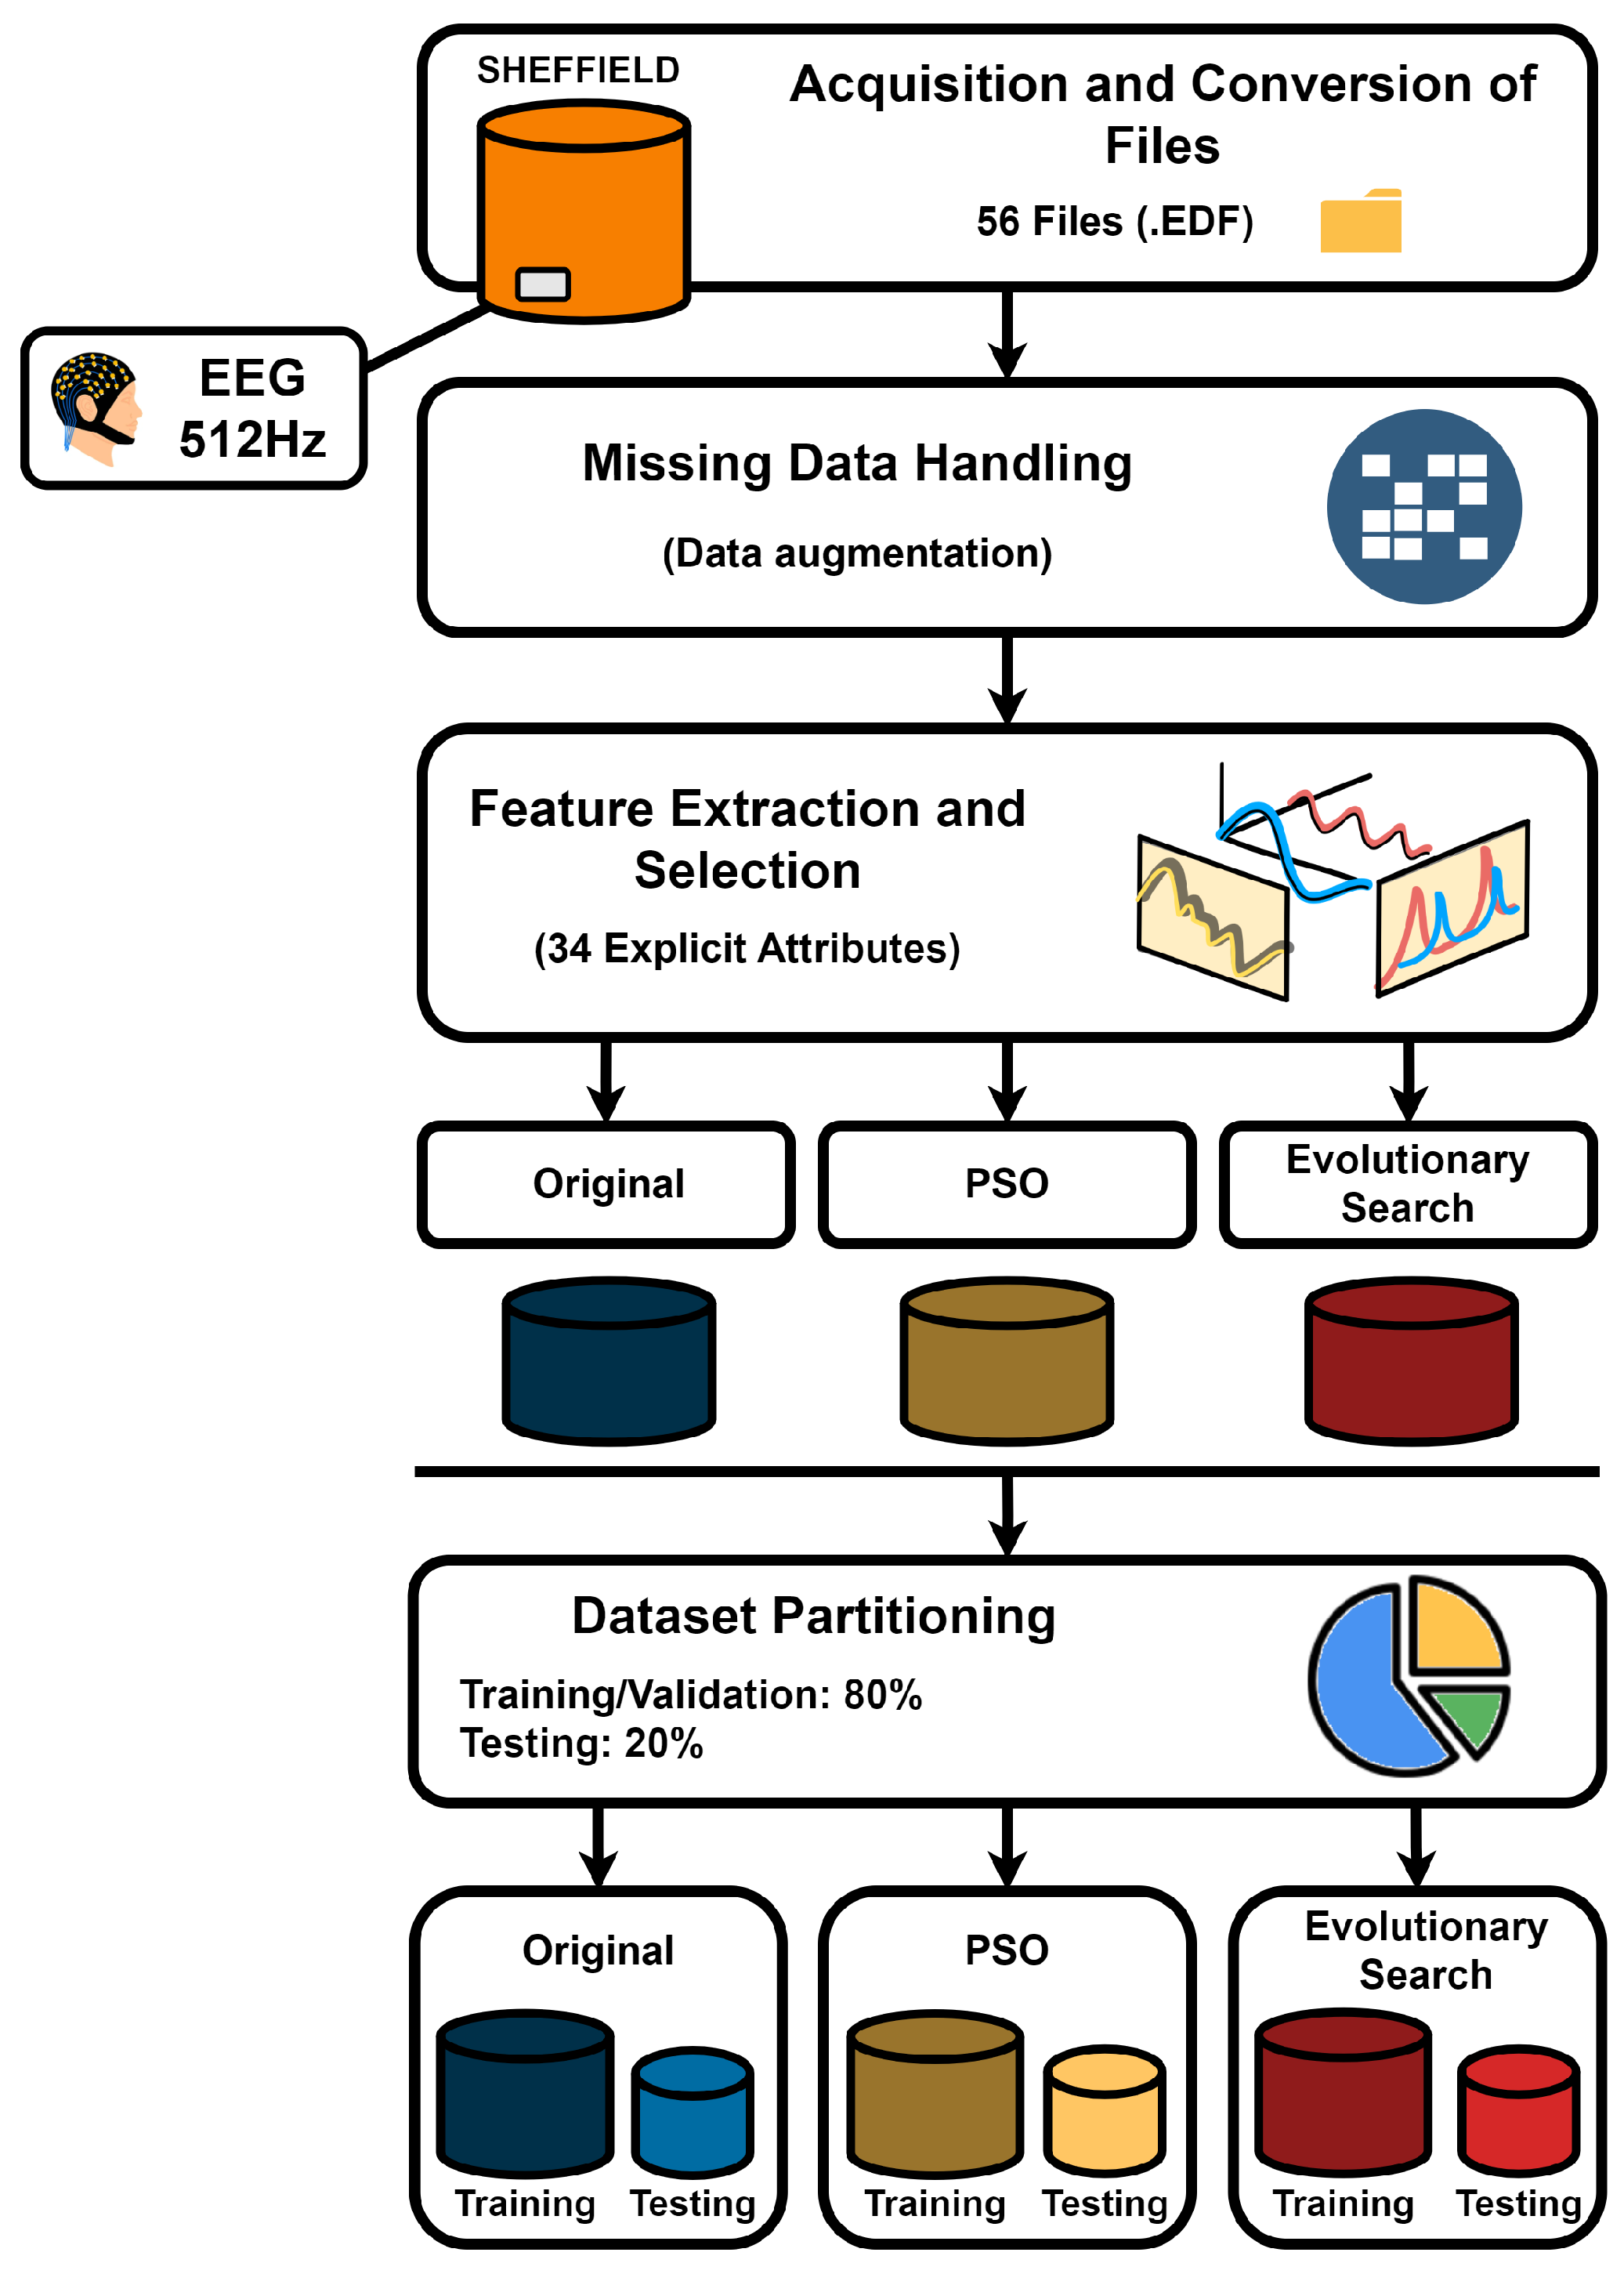
Figure 3.
Standardized Electrode Placement Map for EEG Recording. The image displays the electrode positions used during EEG data collection, as configured in EEGLAB for the ASD 113 dataset. This particular file is unique as it includes complete data from all electrode placements, providing a comprehensive framework for EEG analysis.
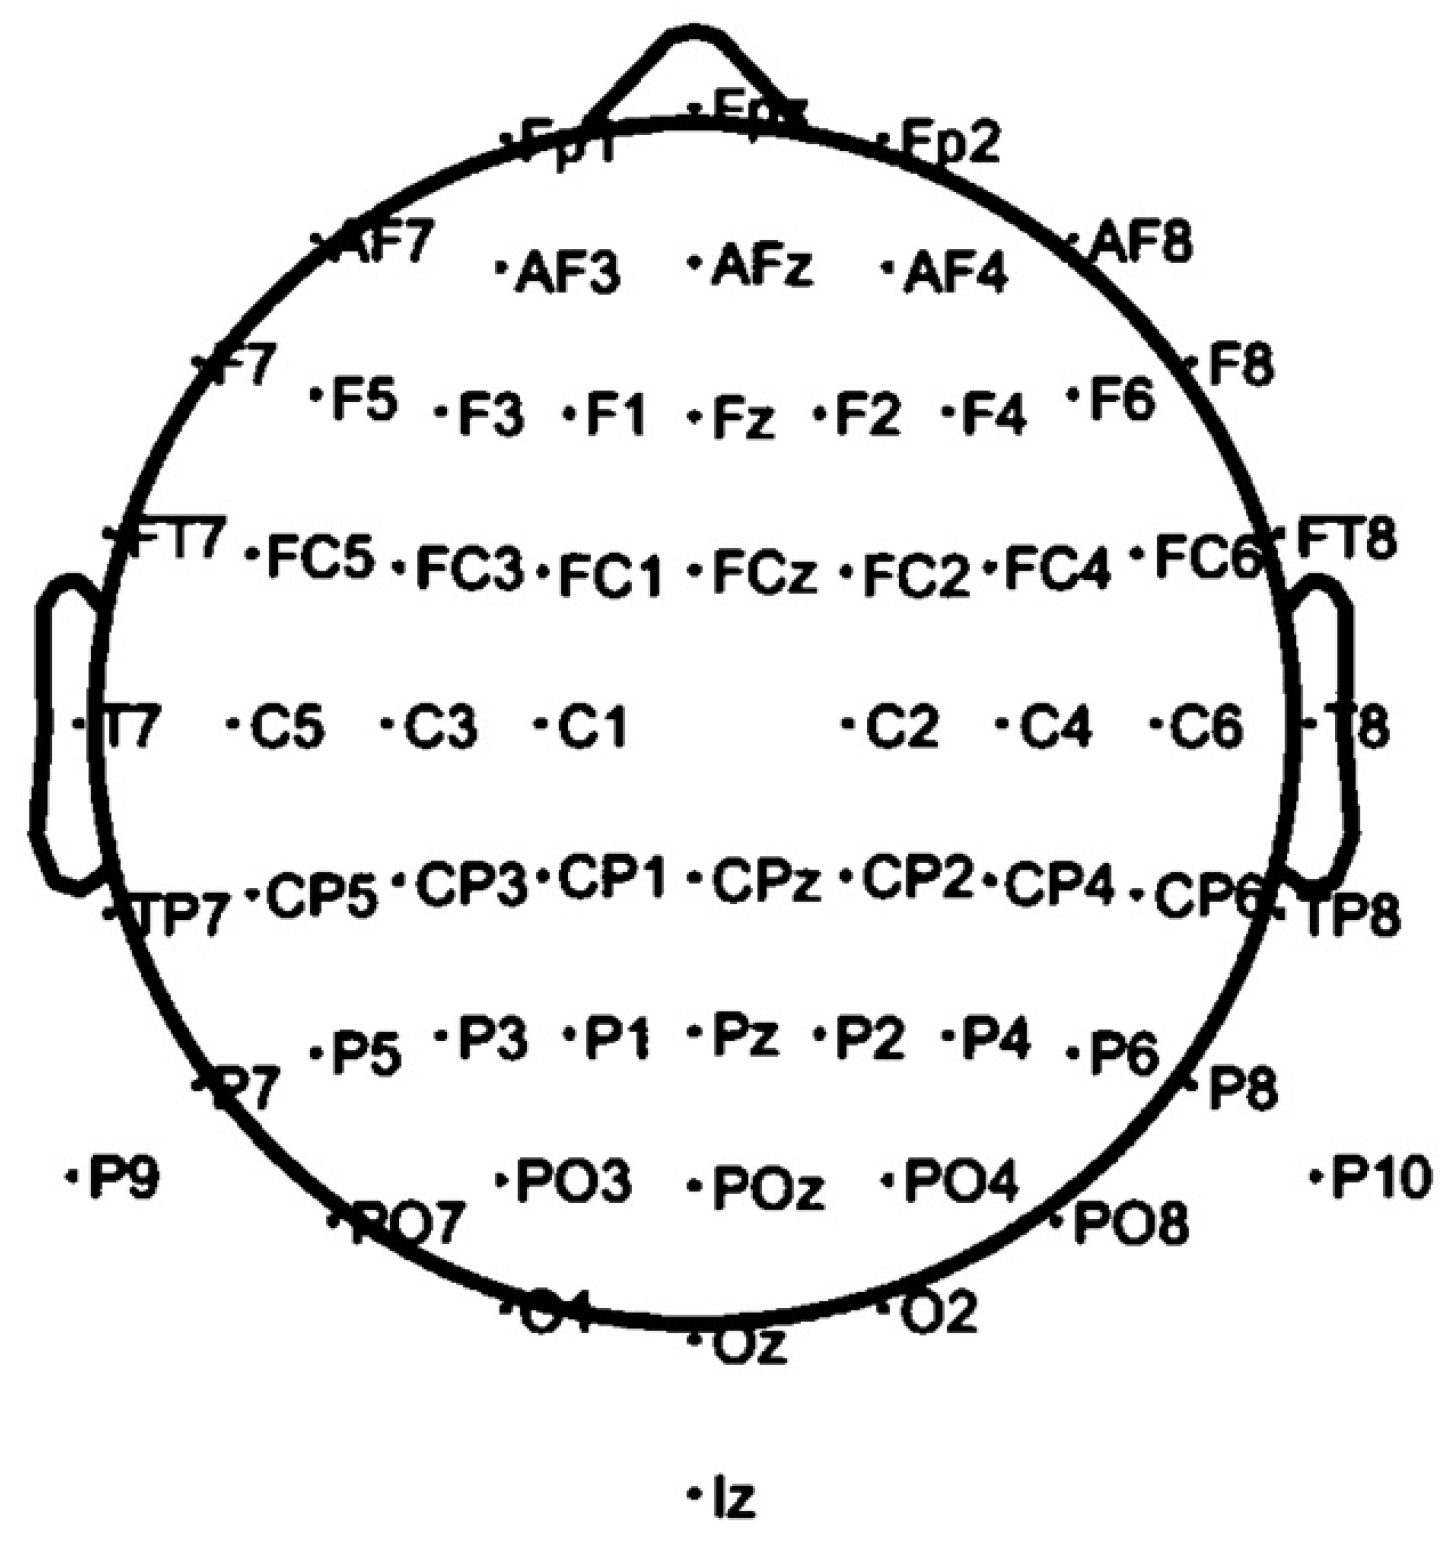
Figure 4.
Workflow of the Classifier Training, Validation, and Testing phases. The diagram illustrates the initial training and validation phase where classifiers are subjected to 30 random initializations using the original, PSO, and evolutionary search datasets. Subsequent to model evaluation, the top-performing models from each dataset category undergo a single round of testing. This final phase includes a comprehensive classification and result analysis, culminating in the identification of the most accurate predictive model for ASD diagnosis based on EEG data.
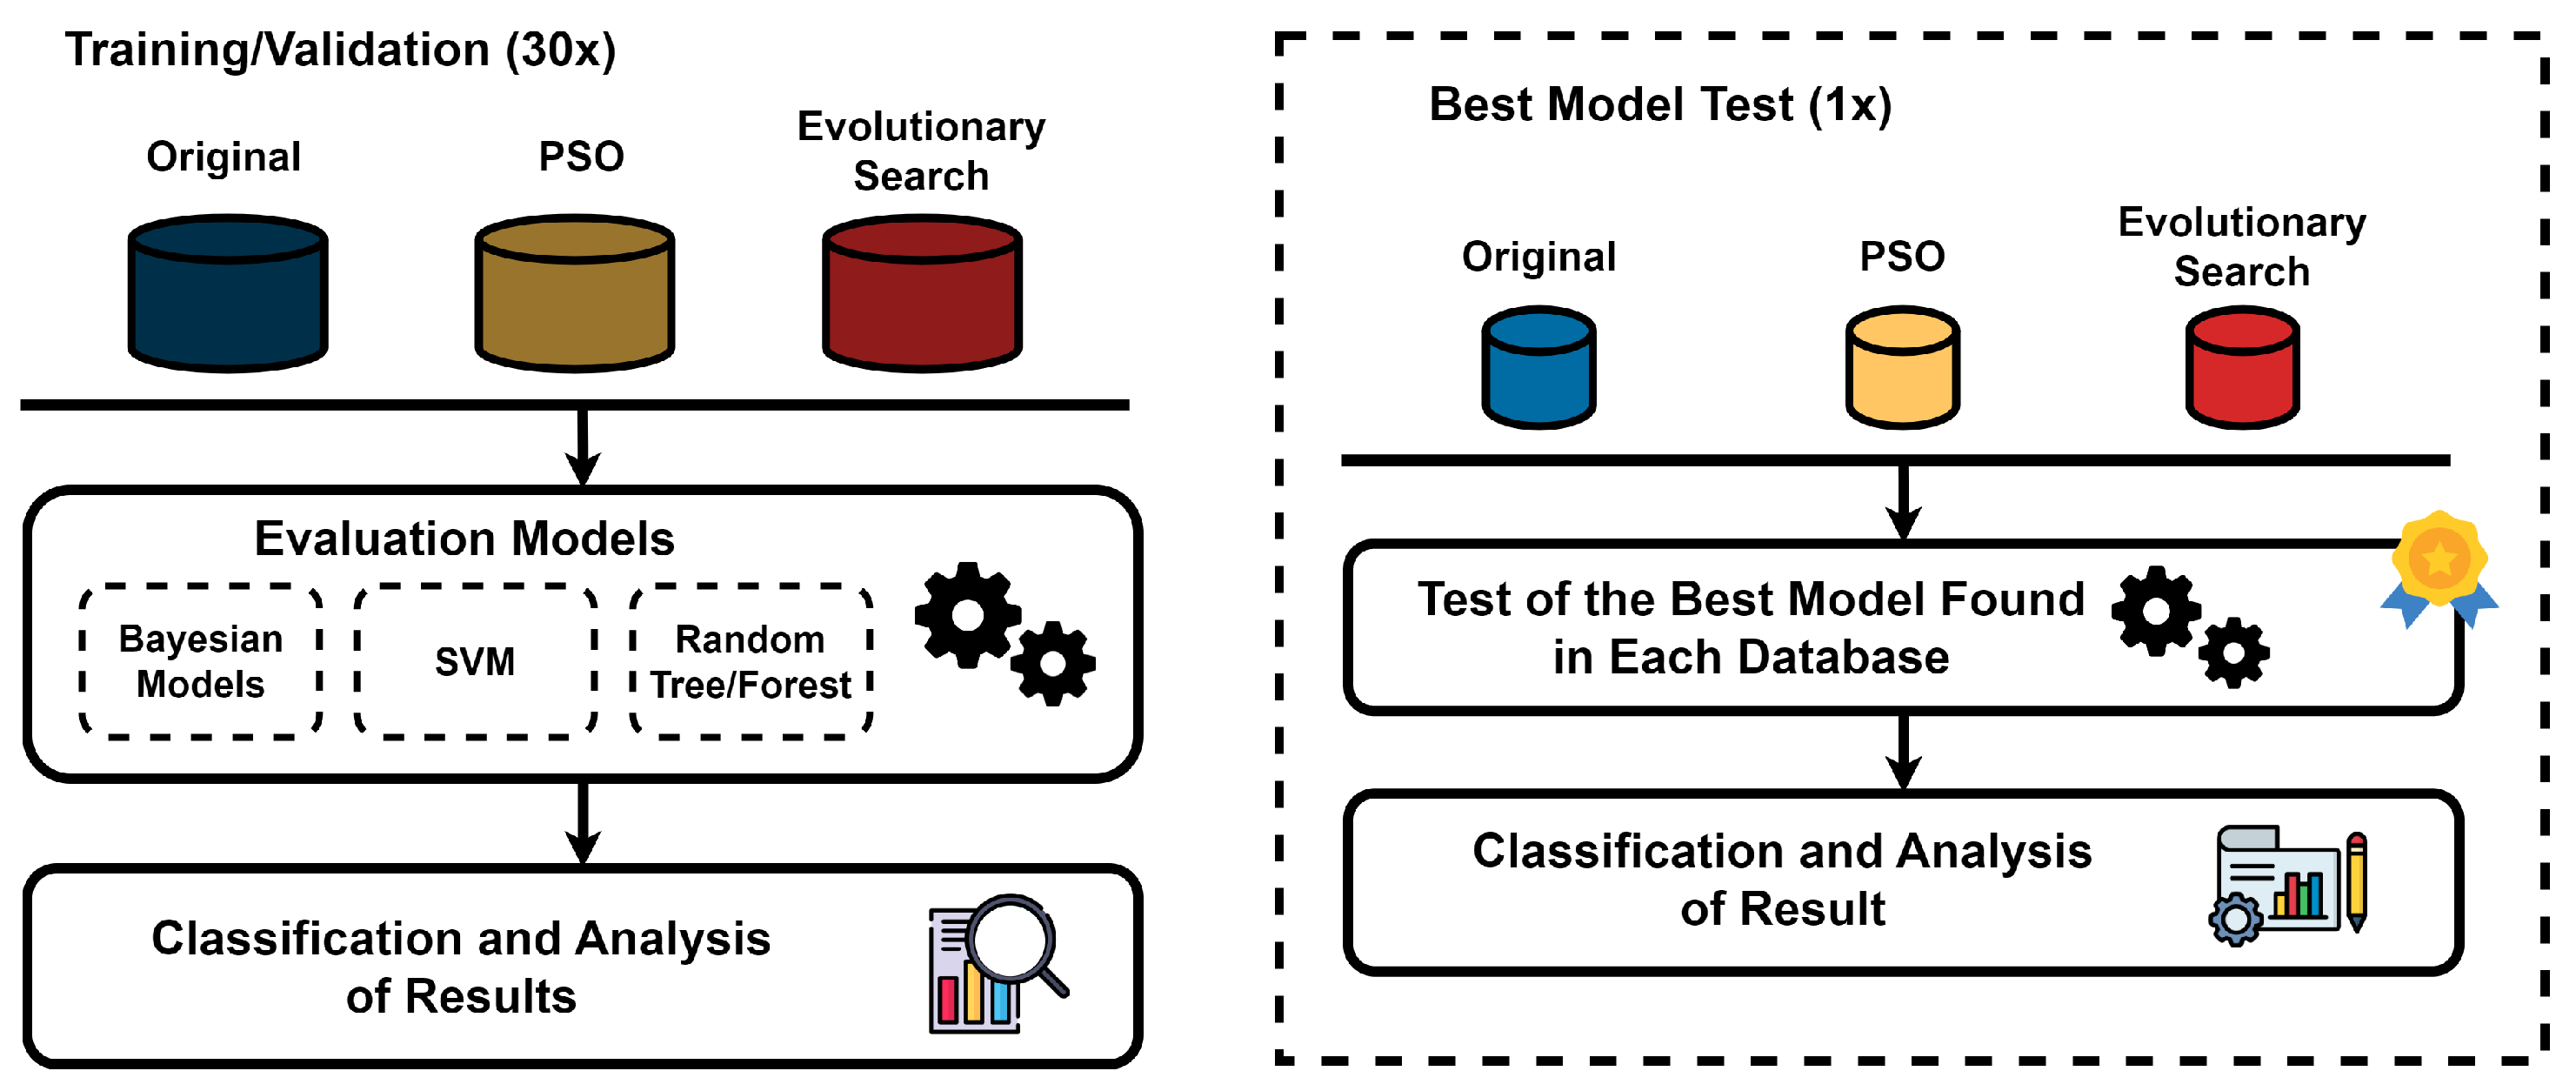
Figure 5.
Boxplot of the accuracy of the best models from each approach in the training stage.
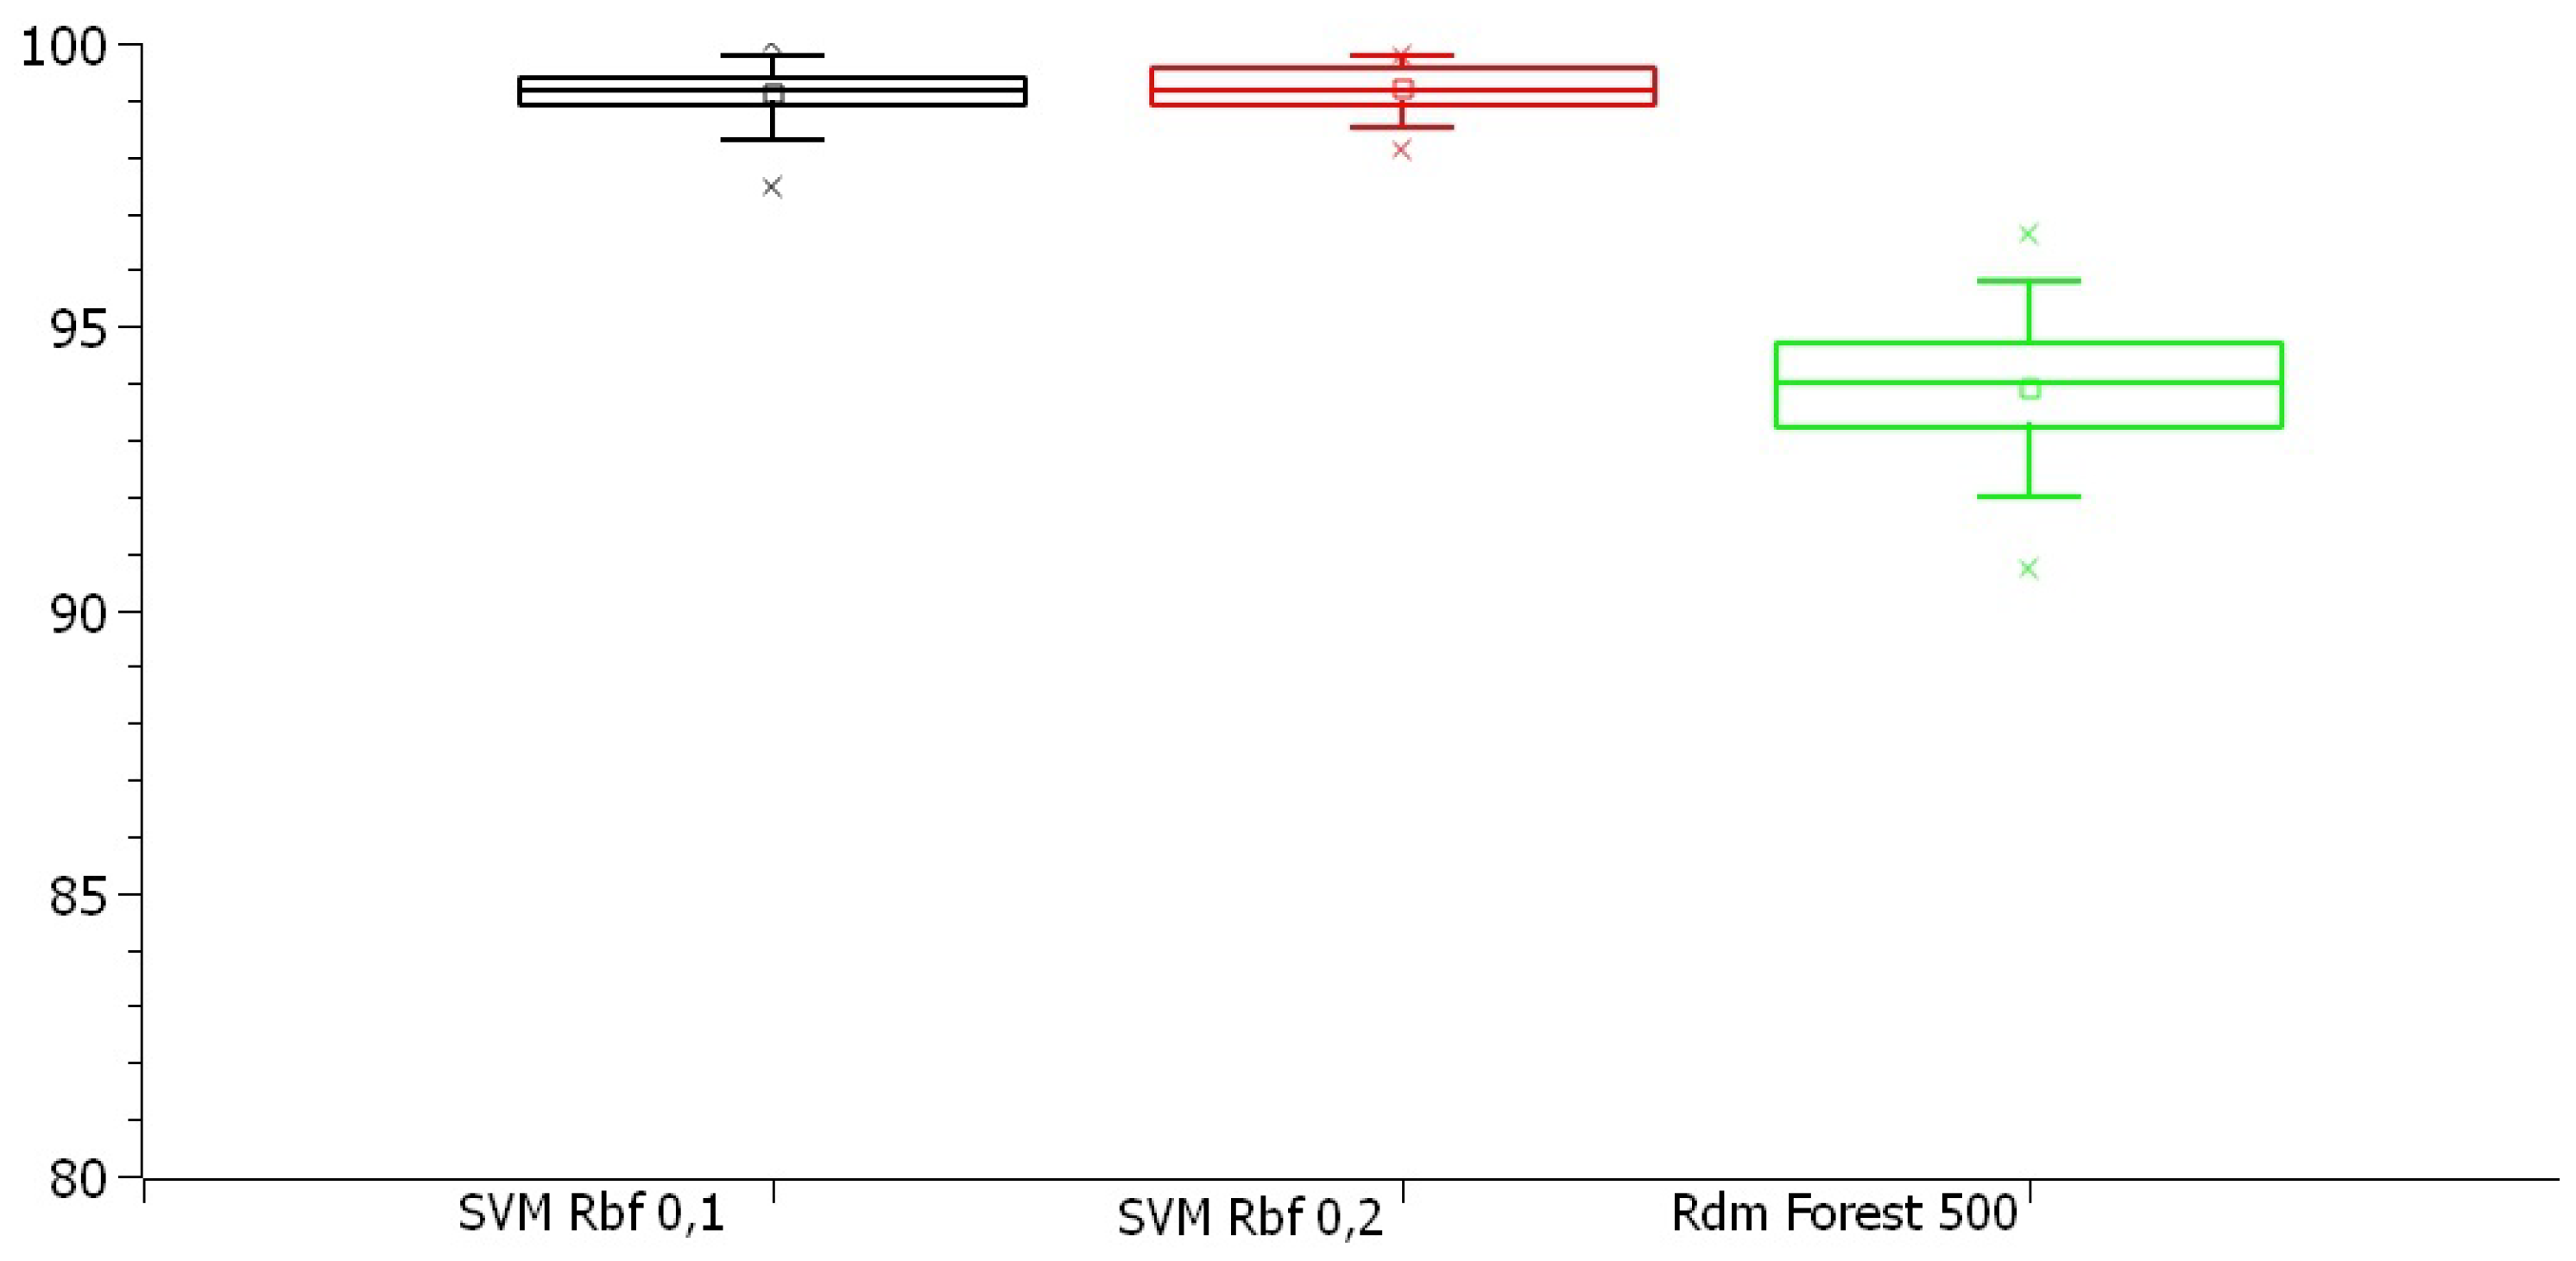
Figure 6.
Boxplot of the Kappa index of the best models from each approach in the training stage.
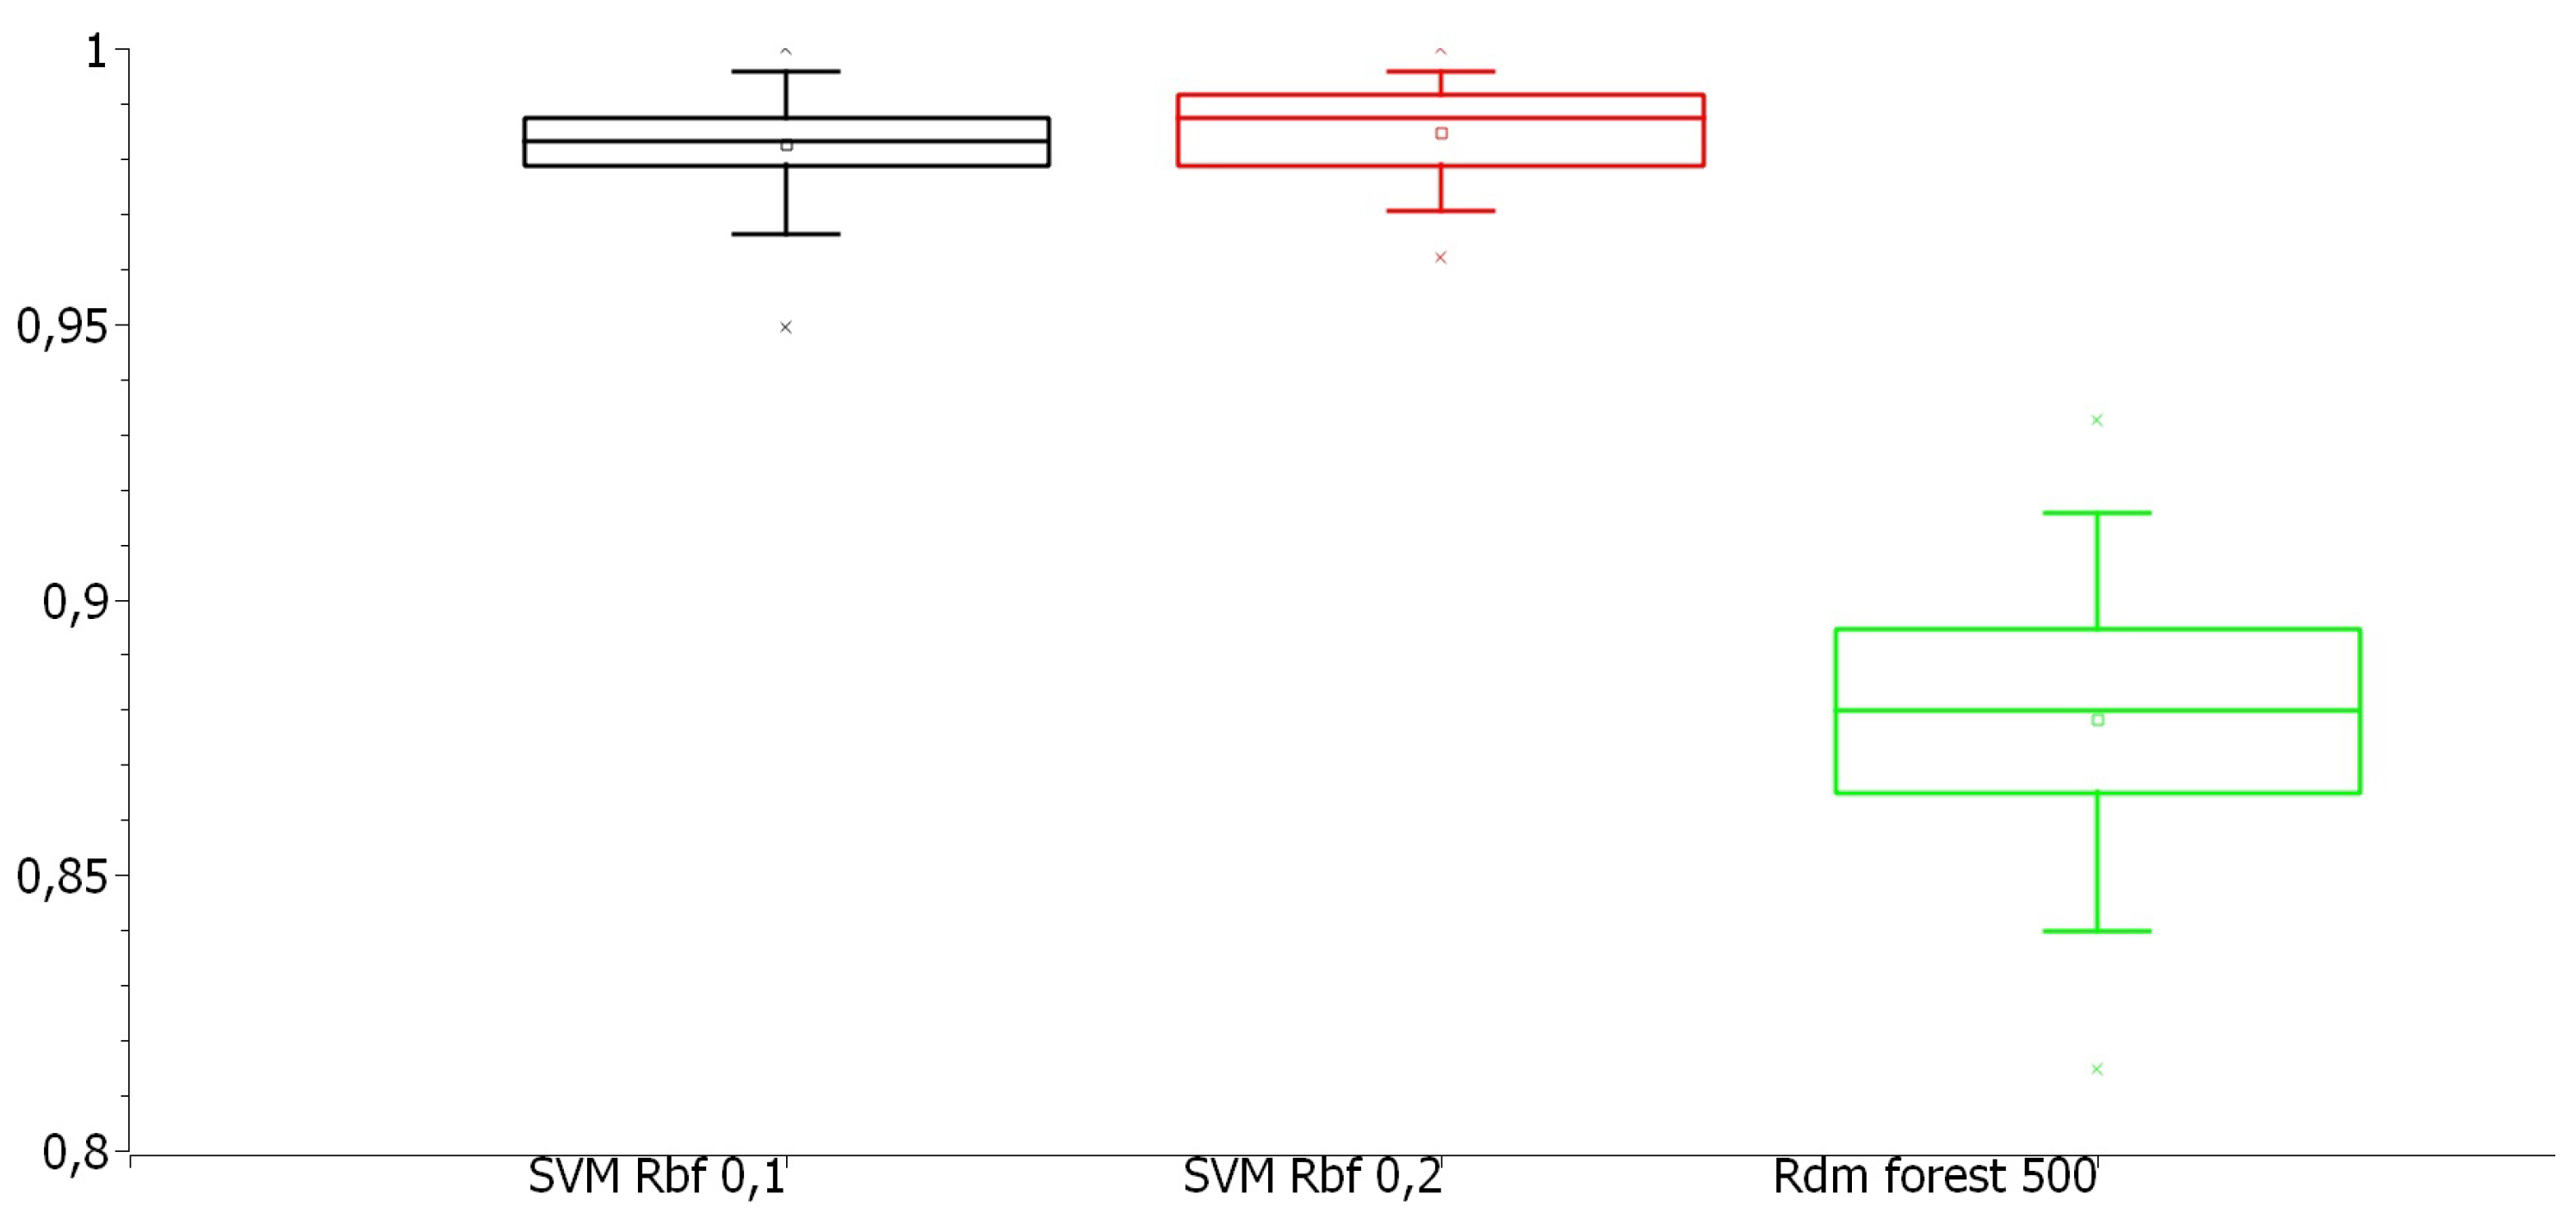
Figure 7.
Confusion matrix of the test performed with a) original dataset and SVM model. b) PSO and SVM model. c) Evolutionary search and Random Forest with 500 trees model.
Figure 7.
Confusion matrix of the test performed with a) original dataset and SVM model. b) PSO and SVM model. c) Evolutionary search and Random Forest with 500 trees model.
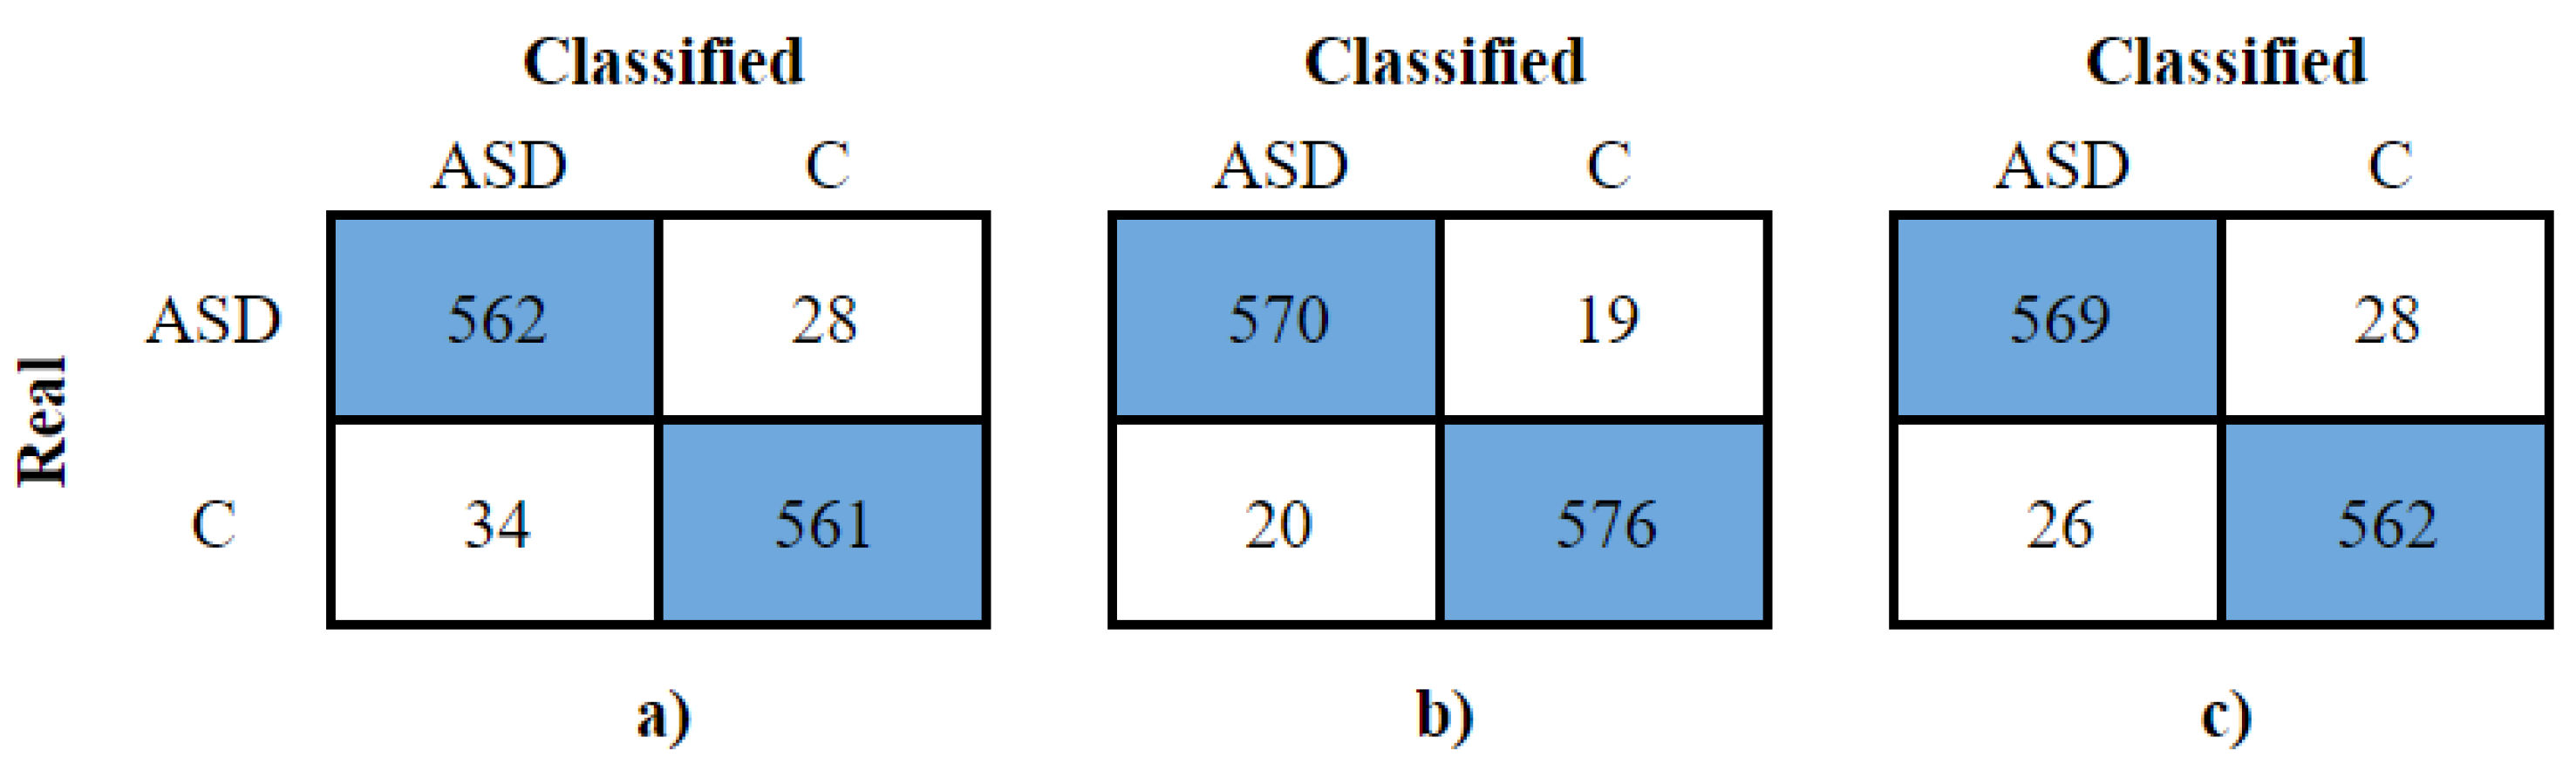

Table 1.
List of the 34 explicit attributes extracted from the signals and their mathematical representations.
Table 1.
List of the 34 explicit attributes extracted from the signals and their mathematical representations.
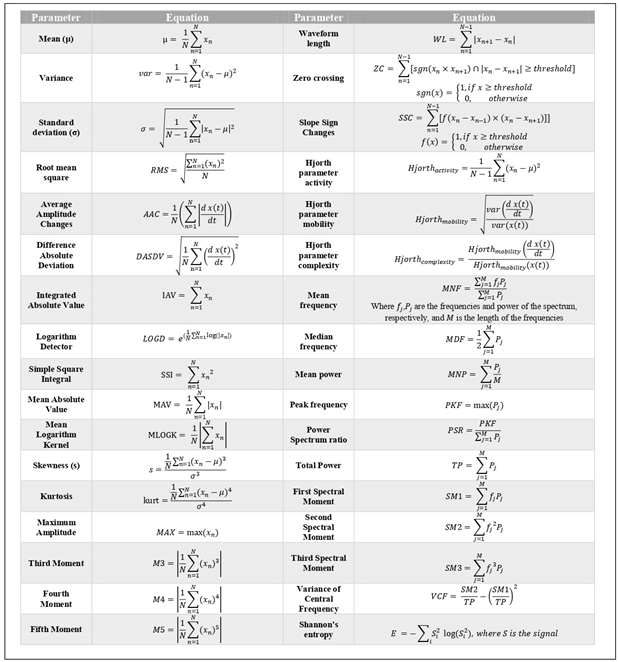 |
Table 2.
Results of the training and validation stage for the dataset from original signals.
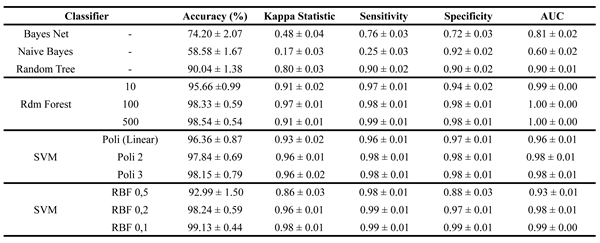 |
Table 3.
Results of the training and validation stage after feature selection by PSO.
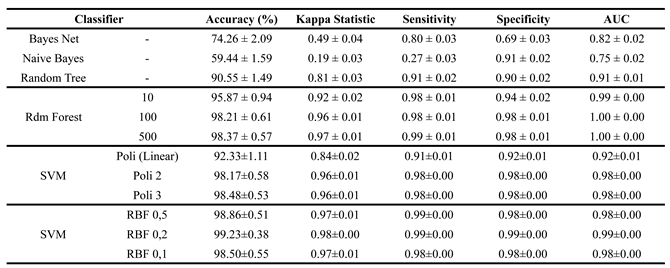 |
Table 4.
Results of the training and validation stage after feature selection by Evolutionary Search.
Table 4.
Results of the training and validation stage after feature selection by Evolutionary Search.
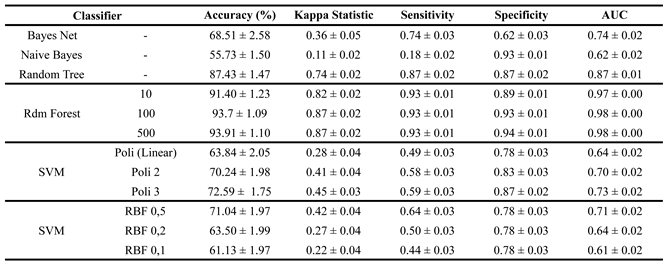 |
Table 5.
Results of the tests with the best models of each approach.
 |
Disclaimer/Publisher’s Note: The statements, opinions and data contained in all publications are solely those of the individual author(s) and contributor(s) and not of MDPI and/or the editor(s). MDPI and/or the editor(s) disclaim responsibility for any injury to people or property resulting from any ideas, methods, instructions or products referred to in the content. |
© 2025 by the authors. Licensee MDPI, Basel, Switzerland. This article is an open access article distributed under the terms and conditions of the Creative Commons Attribution (CC BY) license (http://creativecommons.org/licenses/by/4.0/).
Copyright: This open access article is published under a Creative Commons CC BY 4.0 license, which permit the free download, distribution, and reuse, provided that the author and preprint are cited in any reuse.


