Submitted:
28 June 2024
Posted:
01 July 2024
You are already at the latest version
Abstract
Autism spectrum disorder (ASD) is characterized by diverse patterns of social interaction, communication, and behavior. This study explores the application of clustering and stochastic migration models to visualize and understand the social and neural connectivity patterns associated with autism. The clustering model, with its strong internal connections and limited external connections, mirrors the tight-knit social groups and communication barriers often observed in individuals with autism. In contrast, the stochastic model, characterized by more dispersed connections and greater adaptability, represents the variability and flexibility seen in social interactions across typical individuals. By comparing these models, we can gain deeper insights into the unique challenges and strengths of individuals with autism, highlighting the importance of personalized interventions. Additionally, these models provide a visual framework for understanding the differences in brain connectivity patterns observed in autism, with implications for both behavioral and neural correlates. This study underscores the value of computational models in advancing our understanding of autism and guiding effective support strategies.
Keywords:
Autism
; Neural Connectivity
; Clustering
; Computational Model
By comparing these two models, we aim to highlight the diverse social and neural connectivity patterns present in individuals with autism. The clustering model can be seen as a representation of overconnectivity within certain neural networks, while the stochastic model may reflect a more balanced or varied connectivity pattern (Courchesne et al., 2007). These differences in connectivity have significant implications for understanding the neural basis of autism and for developing tailored interventions (Uddin et al., 2013).
Understanding these patterns is crucial for designing effective interventions and support systems. For individuals exhibiting behaviors similar to those in the clustering model, interventions might focus on gradually increasing exposure to new social situations and strengthening weak connections (Lord et al., 2001), enhancing communication skills and providing support to navigate varied social interactions could be also beneficial (Landa, 2007).
This study underscores the value of computational models in visualizing and understanding the complex patterns of social and neural connectivity in autism. By providing a visual and conceptual framework, these models can guide more effective and personalized strategies for supporting individuals with autism, ultimately contributing to better outcomes and quality of life.
Methodology
This study utilizes computational models to explore the social and neural connectivity patterns associated with autism spectrum disorder (ASD). The methodology involves the implementation of three distinct models, each representing different aspects of connectivity and migration behavior in a simulated neural network. The models include clustering migration, stochastic migration, and detailed simulations of reverberating signals within neural circuits. These models are described by a series of mathematical equations and visualized using Python libraries. Below, we detail the methodological steps and equations used for each model.
Section 3.1 Models
Model 1: Clustering Migration (Graph 1.)
The clustering migration model simulates the formation of tight-knit social groups with strong internal connections and weak connections between clusters.
- 1.
- Initial Positions: Cells are uniformly distributed along the x-axis:
- 1.
- 1. Initial Positions: Cells are uniformly distributed along x-axis:
- 2.
- Migration to Semicircle: Cells migrate to form a semicircle of radius 8, with clustering effects introduced by adding Gaussian noise:
- 3.
- Connectivity: Strong connections are established within clusters and weak connections between clusters:
Model 2: Stochastic Migration
The stochastic migration model represents more variable connectivity patterns, highlighting the diversity within the autism spectrum.
- Initial Positions: Similar to Model 1, cells are uniformly distributed along the -axis.
- Stochastic Migration: Cells migrate to a semicircle of radius 8, with stochastic variations in their angles:
- 3.
- Connectivity Patterns: Various geometric patterns are defined (triangles, squares, hexagons, etc.), with connections established accordingly:
Triangle: for
Square: for even
Hexagon: for
Pentagon: for
Heptagon: for
- 4.
- Medium Strength Random Connections: Additional connections are added with medium strength:
Model 3. Detailed Simulations of Reverberating Signals
The detailed simulations involve modeling reverberating signals within neural circuits, highlighting the differences in connectivity and signal propagation.
- Circle Graph with Exits: A circle graph with 20 nodes is created, with nodes connected in a circular manner and specific exit nodes:
The detailed simulations involve modeling reverberating signals within neural circuits, highlighting the differences in connectivity and signal propagation.
- Circle Graph with Exits: A circle graph with 20 nodes is created, with nodes connected in a circular manner and specific exit nodes:
- 2.
- Reverberating Signals: Signals propagate with added noise, representing the dynamic nature of neural communication:
- 3.
- Escape Probability: The escape probability at exits is defined by a Bernoulli trial:
- 4.
- Number of Reverberations: The number of reverberations is controlled by the number of iterations:
Section 3.2 Visualization
The models are visualized using Python’s Matplotlib library. For each model, the initial and migrated positions of the cells are plotted, with connections indicated by lines. The clustering and stochastic models are shown side-by-side for comparison, highlighting the differences in connectivity patterns.
By applying these models, we aim to capture and analyze the diverse connectivity patterns observed in individuals with autism, providing insights into the social and neural dynamics that characterize the autism spectrum.
Section 4. Results
In this section, we present and interpret the results of the three computational models used to visualize the social and neural connectivity patterns in individuals with autism spectrum disorder (ASD). The models include the clustering migration model, the stochastic migration model, and the detailed simulations of reverberating signals within neural circuits.
Graph 1: Clustering Migration Model
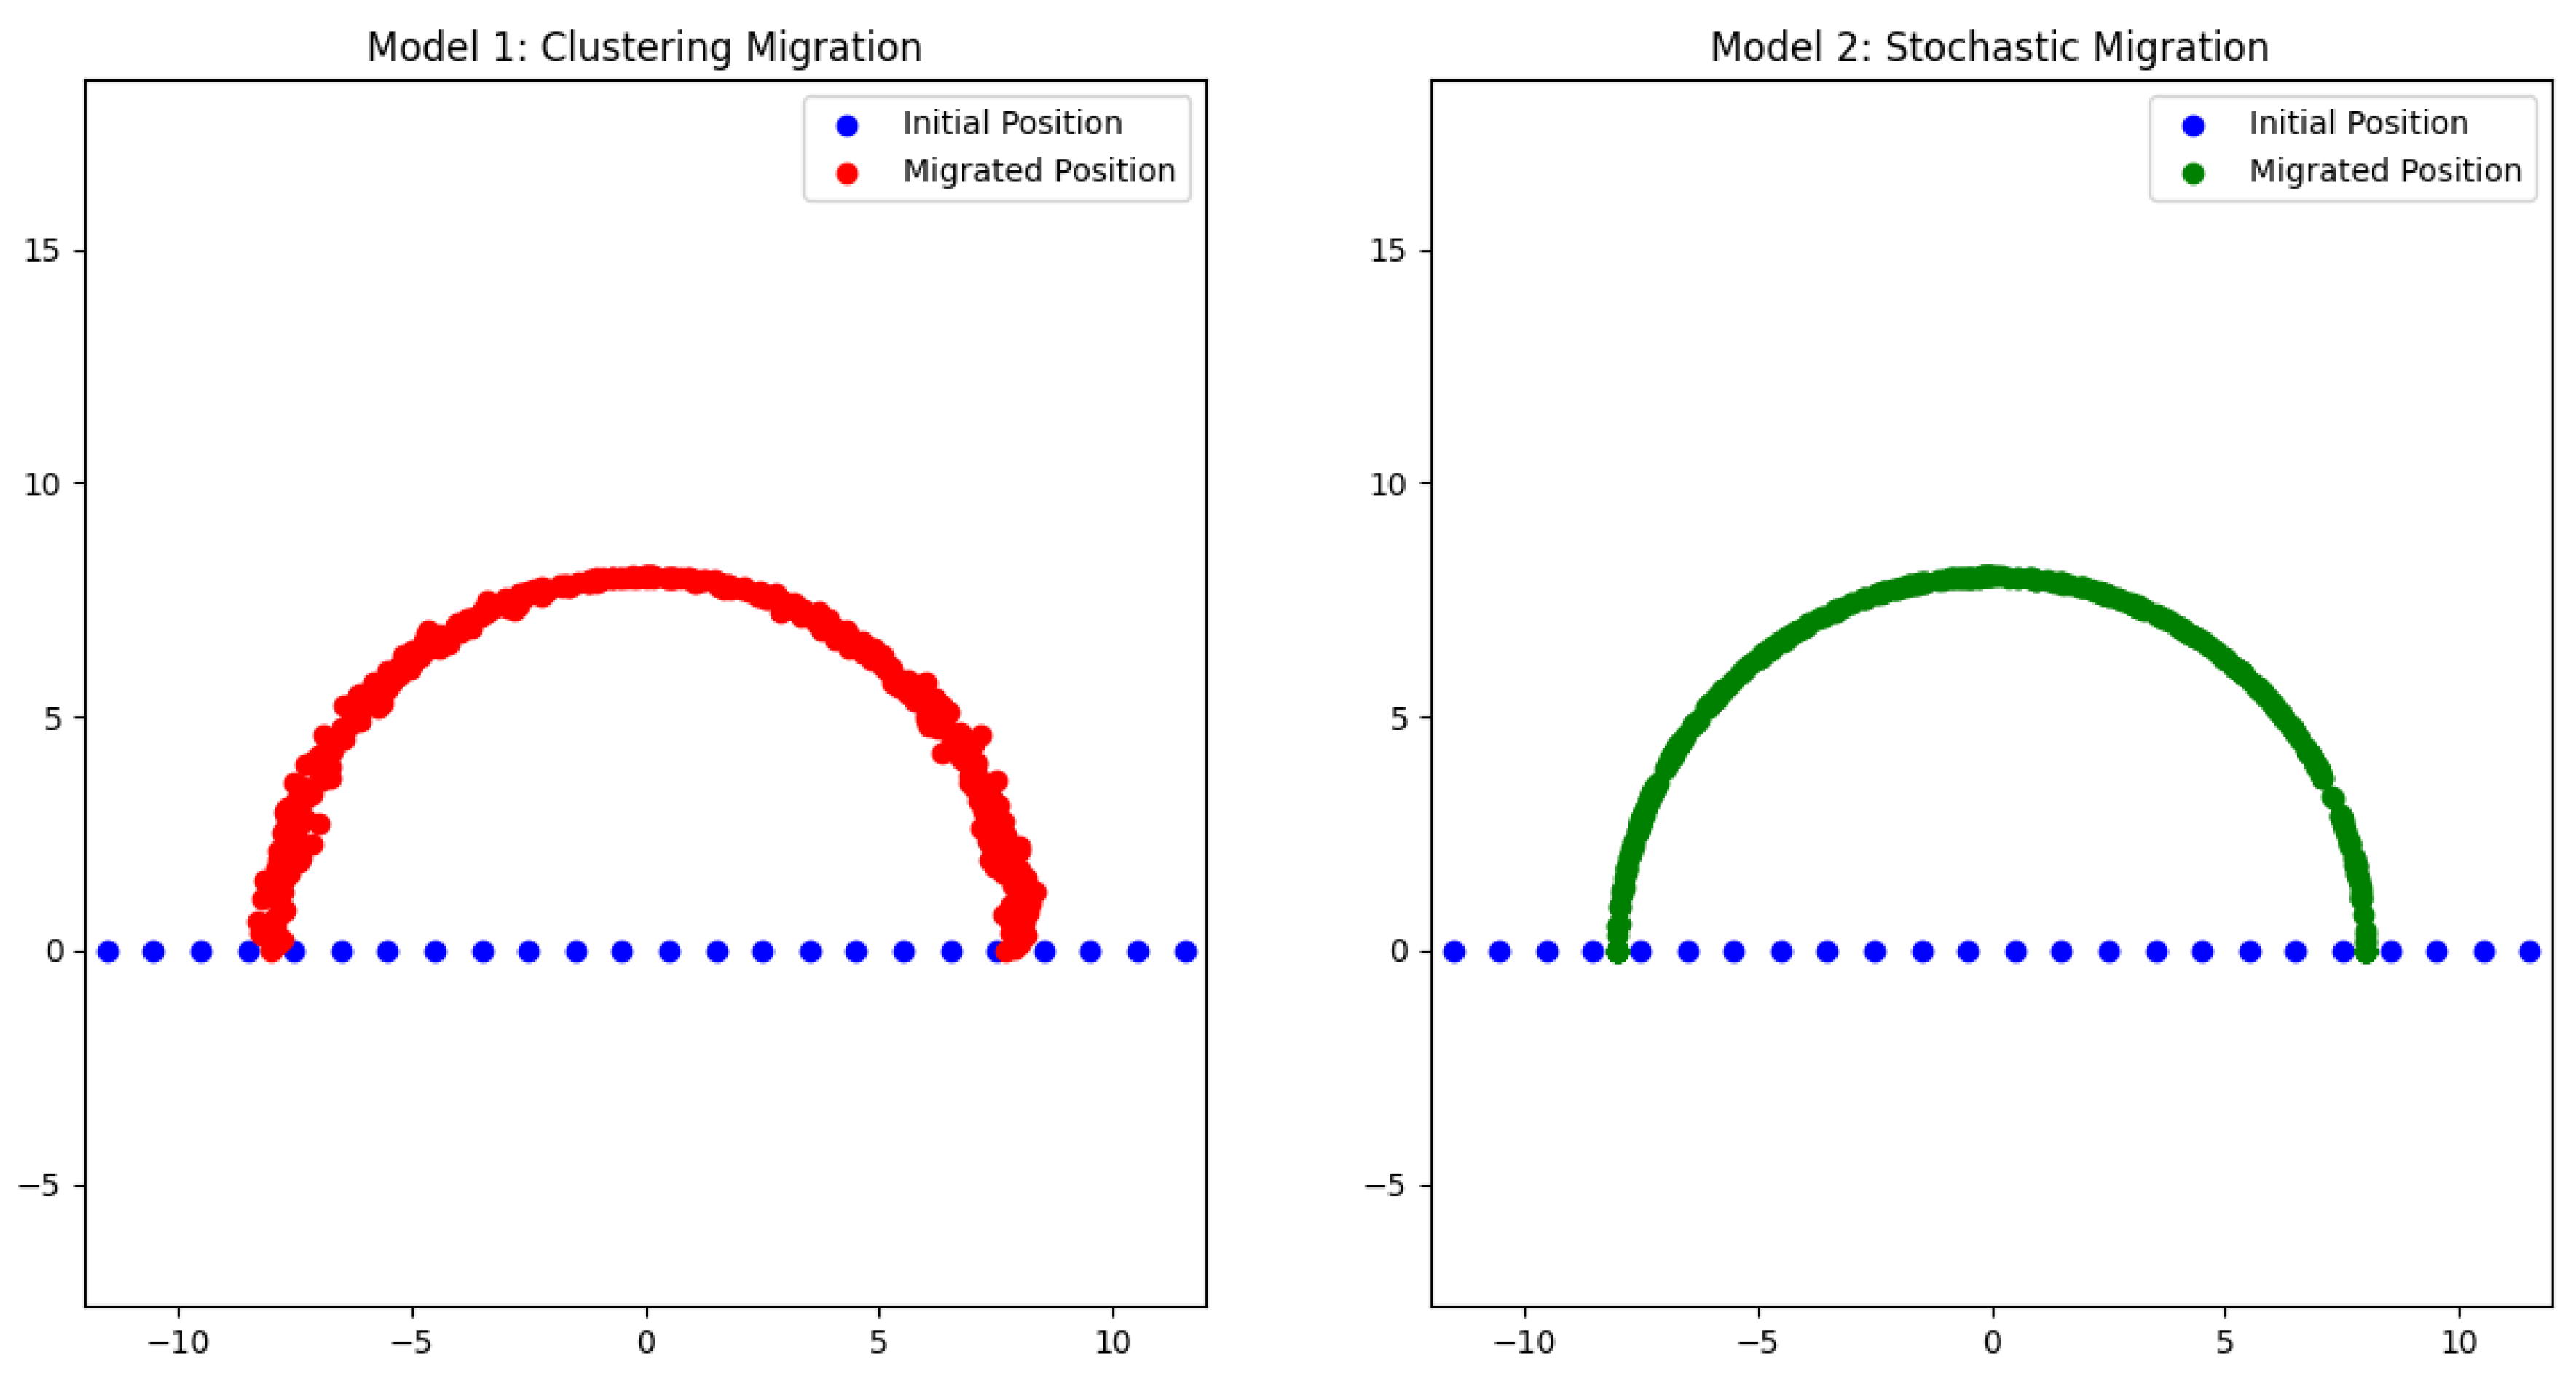
The first graph depicts the clustering migration model, where cells initially distributed along the axis migrate to form a semicircle with a radius of 8. This model incorporates a clustering effect by adding Gaussian noise to the positions of the cells.
Observations:
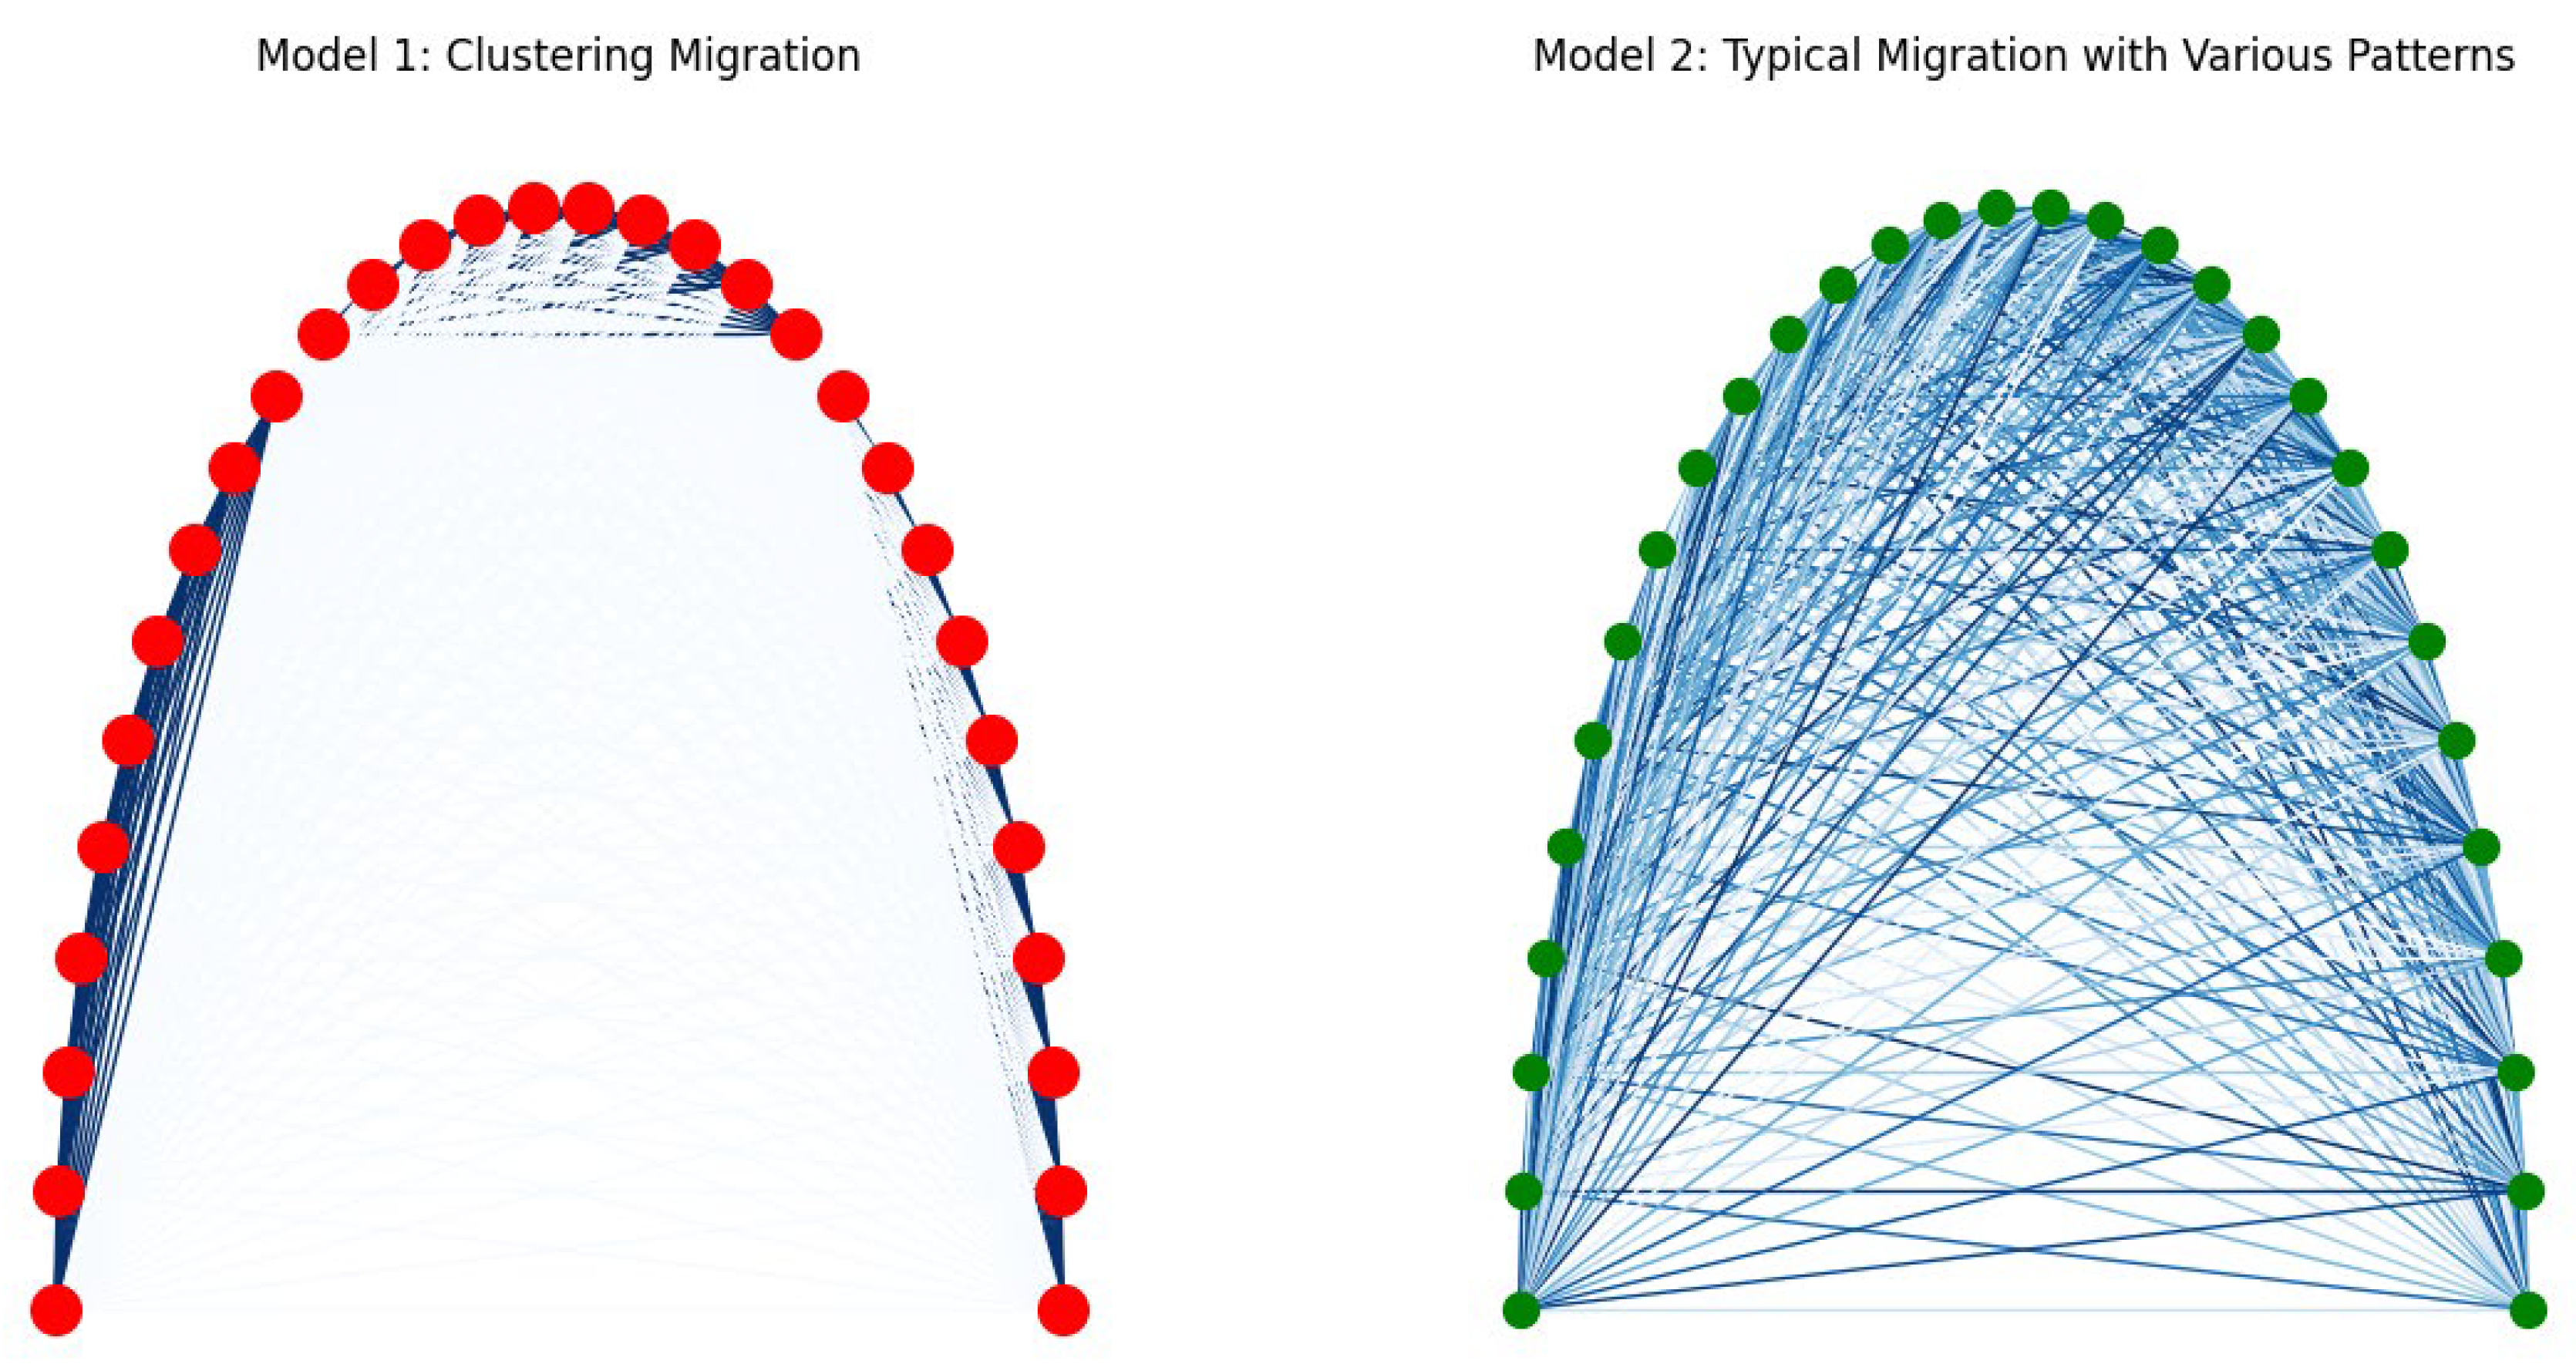
- Cells form distinct clusters with strong internal connections.
- Weak connections are observed between clusters, representing limited interaction outside immediate social groups.
- The clustering effect introduces slight positional perturbations, emphasizing the tendency of individuals with autism to form tight-knit social groups and experience challenges in connecting outside these groups.
This graph effectively models the social dynamics in autism, where strong bonds are formed within specific groups, but communication with external groups is limited (Bauminger & Kasari, 2000; Bölte et al., 2011).
Graph 2: Stochastic Migration Model
The second graph illustrates the stochastic migration model, where cells migrate to form a parabola with height of 8, incorporating stochastic variations in their angles. This model represents more variable and dispersed connectivity patterns.
Observations:
- Cells are more evenly dispersed along the semicircle, reflecting greater variability in social interactions.
- The presence of medium-strength random connections between nodes suggests flexibility and adaptability in communication.
This model captures the diversity within the autism spectrum, highlighting individuals who exhibit a wider range of social connections and greater adaptability (Constantino & Todd, 2003; Geschwind, 2009).
Graph 3: Reverberating Signals in Neural Circuits
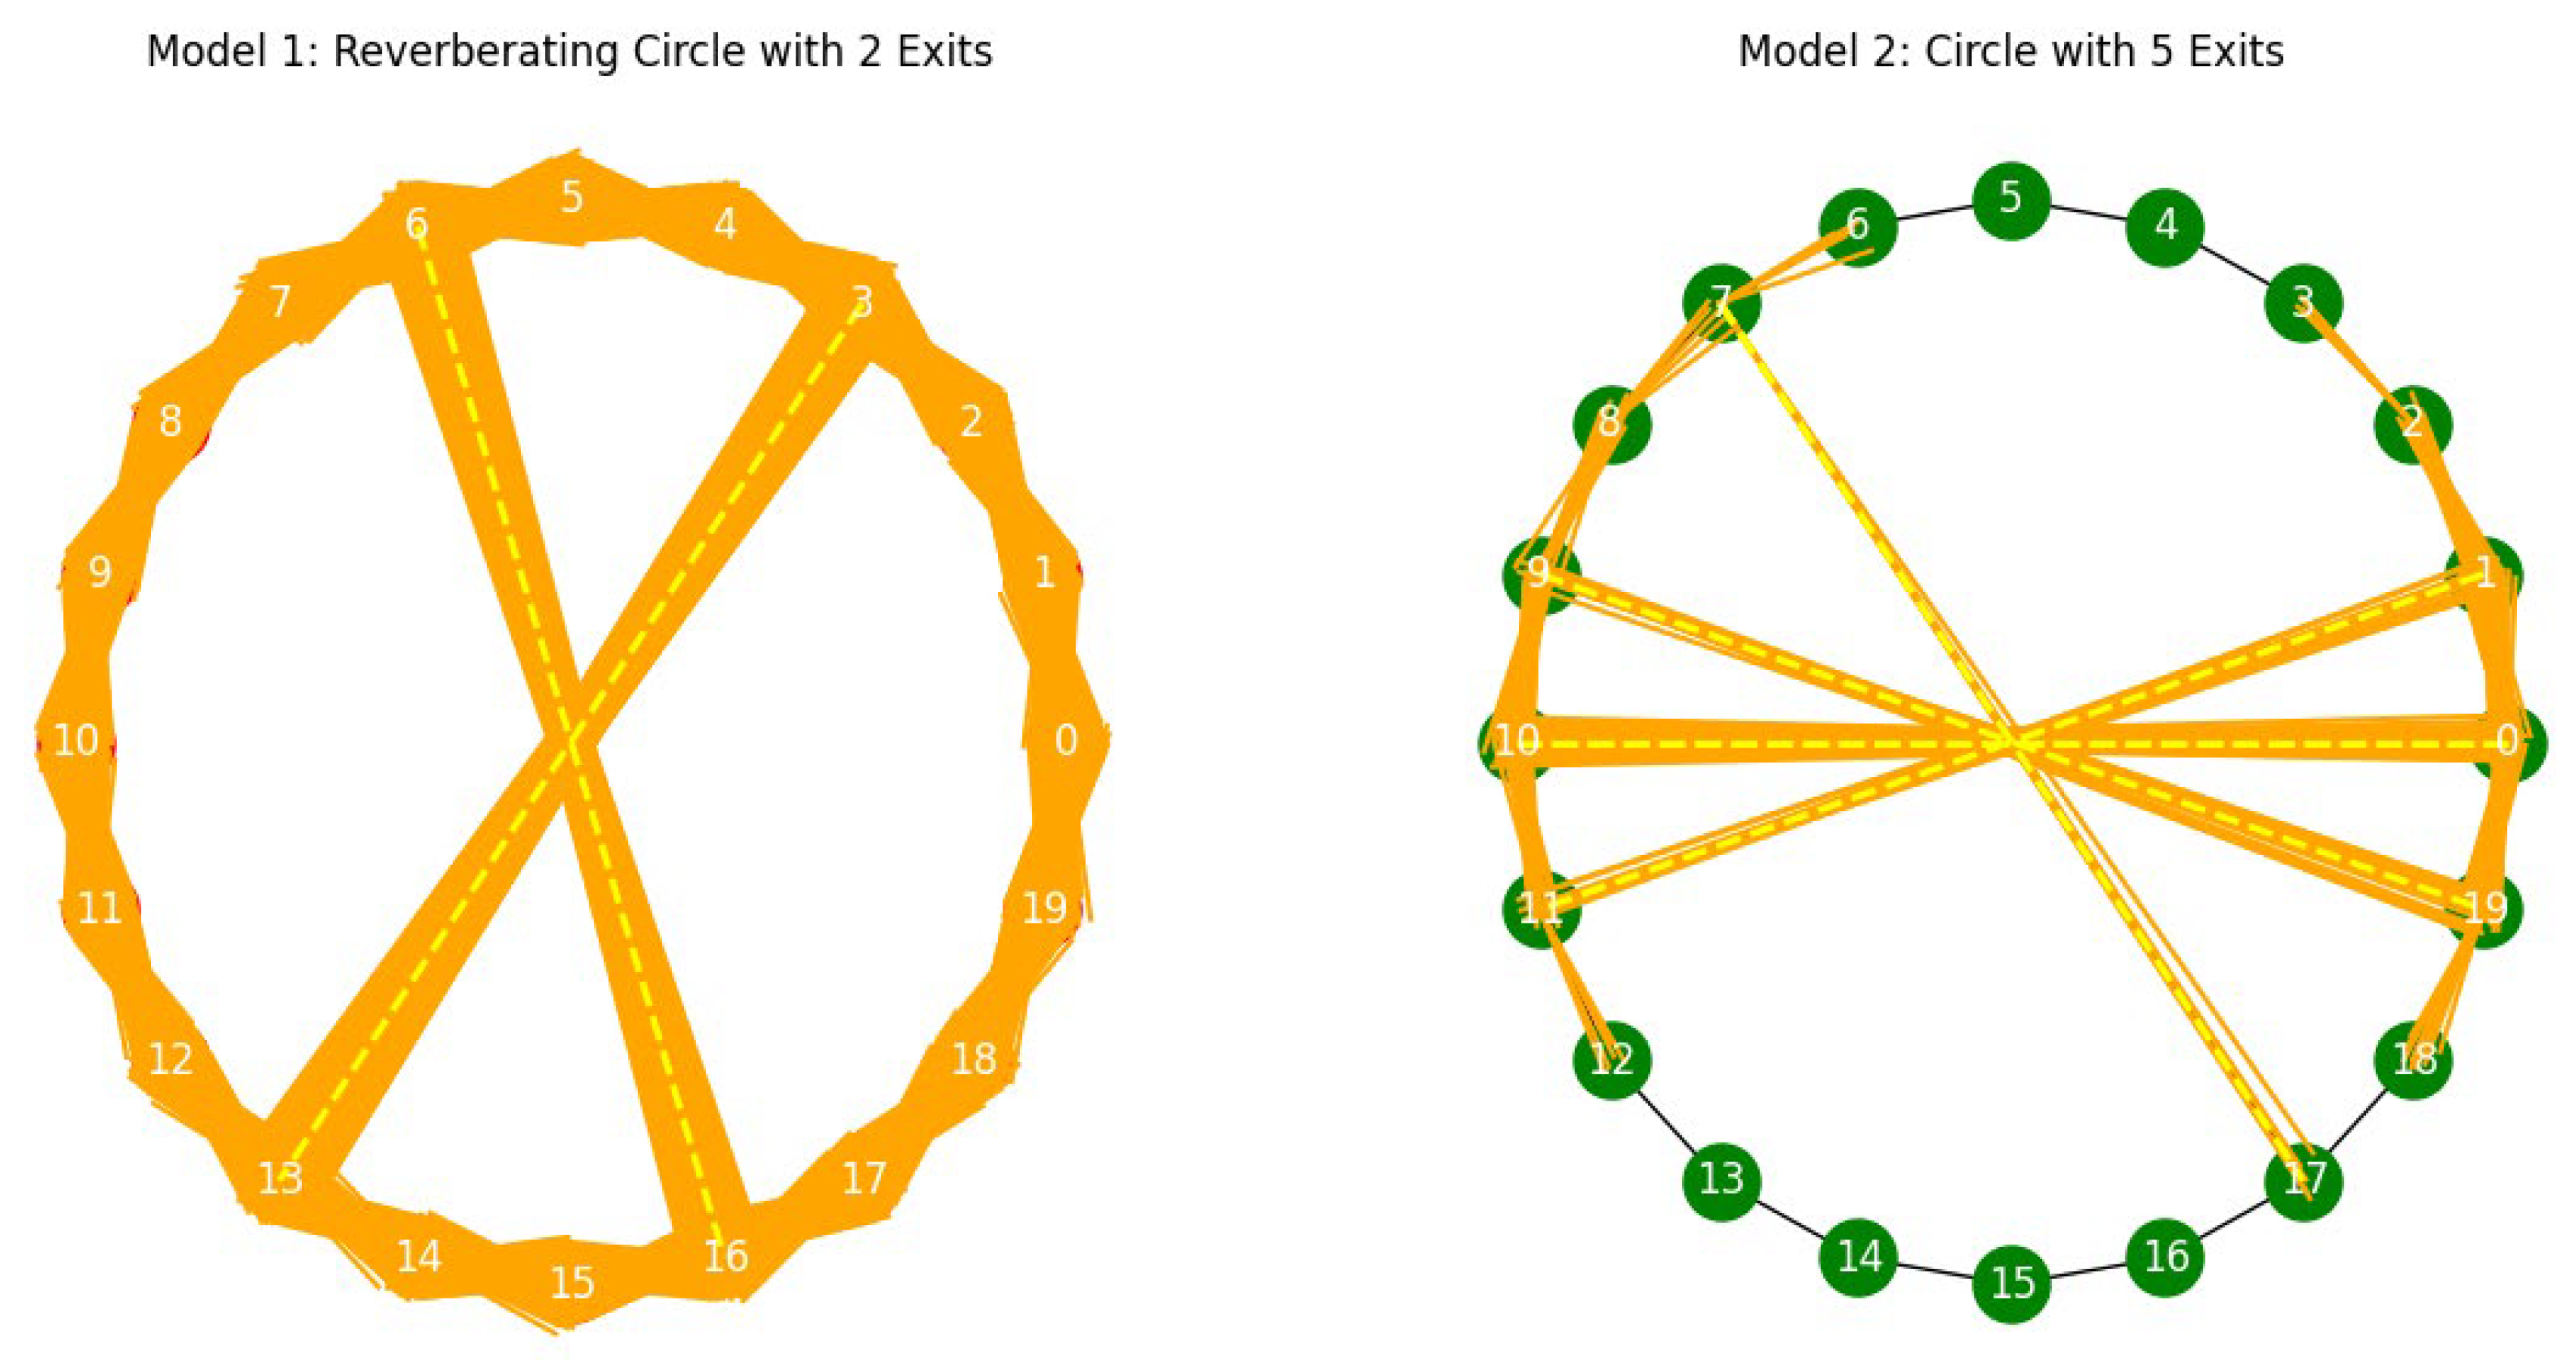
The third graph simulates reverberating signals within neural circuits, highlighting differences in connectivity and signal propagation. Two scenarios are modeled: one with 2 exits and another with 5 exits.
- Scenario 1: Circle graph with 20 nodes and 2 exits.
Observations:
- Signals reverberate 20 times within the circle before exiting, representing difficulty in breaking out of behavior loops.
- Limited exits symbolize challenges in transitioning between tasks or environments, akin to the repetitive behaviors seen in autism.
- 2.
- Scenario 2: Circle graph with 20 nodes and 5 exits.
Observations:
- Signals reverberate 5 times within the circle before exiting, indicating greater ease in transitioning between states.
- Multiple exits represent higher flexibility and adaptability in neural communication, akin to individuals with more fluid social interactions.
Reverberating Signals:
Escape Probability:
These simulations provide insights into the neural dynamics underlying autism. The difficulty in breaking out of behavior loops (as seen in the first scenario) parallels the repetitive behaviors and restricted interests in autism. The preference for continuous movements, such as watching wheels rolling, can be attributed to the brain’s need for predictability and order (Kanner, 1943; Turner, 1999).
Conclusion
The results of these computational models highlight the complex social and neural connectivity patterns in individuals with autism. By visualizing these patterns, we can better understand the unique challenges and strengths of individuals on the autism spectrum, ultimately guiding more effective and personalized intervention strategies.
Figure 1.
The protoneurons migrate from the midline (simulated as the ventricular wall) to the semicircunference line (cortex). Note the formation of clusters in the first graph, representative of autism and the fluid second graph representative of a typical individual.
Figure 1.
The protoneurons migrate from the midline (simulated as the ventricular wall) to the semicircunference line (cortex). Note the formation of clusters in the first graph, representative of autism and the fluid second graph representative of a typical individual.
Graph 2.
Cells are restricted to its clusters and have pooor cominications with other clusters, characteristic of autism. On the right graph Cells are more evenly along the parabola, reflecting greater variability in social interactions. The presence of medium-strength random connections between nodes suggests flexibility and adaptability in communication in the right graph.
Graph 3.
These simulations provide insights into the neural dynamics underlying autism. The difficulty in breaking out of behavior loops (as seen in the first scenario) parallels the repetitive behaviors and restricted interests in autism (left grapf). The preference for continuous movements, such as watching wheels rolling, can be attributed to the brain’s need for predictability and order (Kanner, 1943; Turner, 1999). Right graph represents a typical circuit.
Section 5. Discussion
The computational models employed in this study provide a visual and conceptual framework to understand the diverse social and neural connectivity patterns observed in individuals with autism spectrum disorder (ASD). By comparing the clustering and stochastic migration models, we gain insights into the characteristic behaviors and neural dynamics associated with autism, which have significant implications for intervention and support strategies.
Section 5.1 Clustering Migration Model
The clustering migration model highlights the tendency of individuals with autism to form tight-knit social groups with strong internal connections and weak connections between clusters. This pattern can be interpreted as a reflection of the social dynamics often observed in individuals with autism, who may form strong bonds with specific individuals or groups while experiencing challenges in establishing and maintaining connections outside their immediate social circle (Bauminger & Kasari, 2000; Bölte et al., 2011). The reverberating signals within clusters, with limited exits, symbolize the repetitive behaviors and restricted interests characteristic of autism (Lord et al., 2000).
One of the key challenges faced by individuals with autism is difficulty in breaking out of behavior loops. The clustering model’s limited exits represent the challenges in transitioning between tasks or environments, which is a common characteristic in autism. Repetitive behaviors and restricted interests, often described as “stimming,” provide a sense of predictability and comfort to individuals with autism (Turner, 1999). These behaviors can be seen as a coping mechanism to deal with overwhelming sensory input or to self-regulate emotions (Baron-Cohen, 2008). The model underscores the importance of interventions that gradually introduce new social situations and strengthen weak connections, thereby facilitating greater social flexibility and adaptability (Lord et al., 2001).
Section 5.2 Stochastic Migration Model
Stochastic Migration Model The stochastic migration model, characterized by more variable and dispersed connections, represents the variability in social interactions observed across the autism spectrum (Geschwind, 2009). The model captures the diversity within the autism spectrum, highlighting individuals who exhibit a wider range of social connections and greater adaptability. Interventions for these individuals might focus on enhancing communication skills and providing support to navigate varied social interactions (Landa, 2007).
Recent research on synaptic loss and cognitive deficits in neurological conditions further emphasizes the importance of understanding synaptic variability and its impact on neural connectivity and behavior (Malpetti et al., 2021). Additionally, advancements in quantum biology highlight the potential influence of quantum effects on synaptic function, which could provide new insights into the neural mechanisms underlying ASD (Montgomery, 2022).
The stochastic migration model, characterized by more variable and dispersed connections, represents the variability in social interactions observed across the autism spectrum (Geschwind, 2009) and typical individual. Some individuals with autism exhibit greater adaptability and have a wider range of social connections. The stochastic model’s multiple exits suggest a higher degree of flexibility in communication and social behavior, which contrasts with the more rigid patterns depicted in the clustering model (Constantino & Todd, 2003).
Section 5.3 Neural Connectivity and Behavioral Correlates
The observed differences in connectivity in the models have parallels in neural connectivity patterns in individuals with autism. Research has shown that individuals with autism may exhibit overconnectivity within certain brain regions and underconnectivity between regions, leading to difficulties in integrating information across different neural networks (Courchesne et al., 2007; Uddin et al., 2013). The clustering model can be seen as a representation of overconnectivity within specific neural networks, while the stochastic model may reflect a more balanced or varied connectivity pattern.
These neural connectivity patterns can explain some of the behavioral characteristics of autism. For example, the preference for continuous movements and repetitive actions, such as watching wheels rolling, can be understood as a manifestation of the brain’s need for predictability and order. Continuous and repetitive actions provide a sense of stability and control, which can be comforting for individuals with autism who might otherwise experience sensory overload or difficulty in processing complex stimuli (Kanner, 1943; Turner, 1999).
Section 5.4 Implications for Intervention
Understanding these connectivity patterns is crucial for designing effective interventions and support systems for individuals with autism. For those exhibiting behaviors similar to those in the clustering model, interventions might focus on gradually increasing exposure to new social situations and strengthening weak connections. This approach can help individuals develop the skills needed to navigate more complex social environments and reduce the reliance on repetitive behaviors (Lord et al., 2001).
For individuals resembling the stochastic model, interventions might focus on enhancing communication skills and providing support to navigate varied social interactions. These interventions can leverage the existing flexibility and adaptability observed in these individuals, helping them to build more robust social networks and improve their overall social functioning (Landa, 2007).
Conclusion
The computational models presented in this study provide valuable insights into the diverse social and neural connectivity patterns observed in individuals with autism. By visualizing these patterns, we can better understand the unique challenges and strengths of individuals on the autism spectrum, ultimately guiding more effective and personalized support strategies. These models underscore the importance of a nuanced approach to autism intervention, one that recognizes the variability within the spectrum and addresses the specific needs of each individual.
Section 6. Attachments
Python Code Graph 1.
import numpy as np
import matplotlib.pyplot as plt
# Parameters
num_cells = 400
radius = 8
x_positions = np.linspace(-200, 200, num_cells)
# Model 1: Clustering Migration
theta_1 = np.linspace(0, np.pi, num_cells)
x_migrated_1 = radius * np.cos(theta_1)
y_migrated_1 = radius * np.sin(theta_1)
# Adding some clustering effect by perturbing positions
cluster_effect = np.random.normal(0, 0.2, num_cells)
x_migrated_1 += cluster_effect
# Model 2: Stochastic Migration
np.random.seed(42)
theta_2 = np.linspace(0, np.pi, num_cells) + np.random.normal(0, 0.3, num_cells)
theta_2 = np.clip(theta_2, 0, np.pi) # Ensure theta_2 is within [0, pi] to stay above x-axis
x_migrated_2 = radius * np.cos(theta_2)
y_migrated_2 = radius * np.sin(theta_2)
# Plotting the results
fig, ax = plt.subplots(1, 2, figsize=(14, 7))
# Plot for Model 1
ax[0].scatter(x_positions, np.zeros(num_cells), color=‘blue’, label=‘Initial Position’)
ax[0].scatter(x_migrated_1, y_migrated_1, color=‘red’, label=‘Migrated Position’)
ax[0].set_title(‘Model 1: Clustering Migration’)
ax[0].legend()
ax[0].axis(‘equal’)
ax[0].set_xlim([-radius*1.5, radius*1.5])
ax[0].set_ylim([-1, radius*1.5])
nx.draw(G2, nx.get_node_attributes(G2, ‘pos’), ax=ax[1], with_labels=True, node_color=‘green’, edge_color=‘black’, node_size=500, font_color=‘white’)
draw_reverberation(ax[1], G2, exits2, num_reverberations_model2, escape_ratio_model2, noise_multiplier_model2)
ax[1].set_title(‘Model 2: Circle with 5 Exits’)
Python code Graph 2.
import numpy as np
import matplotlib.pyplot as plt
import networkx as nx
import matplotlib.animation as animation
# Function to create a circle graph with exits
def create_circle_graph(num_nodes, num_exits, strong_weight=2, weak_weight=0.1):
G = nx.Graph()
nodes = range(num_nodes)
for i in nodes:
G.add_node(i, pos=(np.cos(2 * np.pi * i / num_nodes), np.sin(2 * np.pi * i / num_nodes)))
G.add_edge(i, (i + 1) % num_nodes, weight=strong_weight)
exits = np.random.choice(nodes, num_exits, replace=False)
for exit in exits:
G.add_edge(exit, (exit + num_nodes // 2) % num_nodes, weight=weak_weight)
return G, exits
# Parameters
num_nodes = 20
num_exits_model1 = 2
num_exits_model2 = 5
num_reverberations_model1 = 20
num_reverberations_model2 = 5
escape_ratio_model1 = 0.2
escape_ratio_model2 = 0.5
# Create graphs for both models
G1, exits1 = create_circle_graph(num_nodes, num_exits_model1)
G2, exits2 = create_circle_graph(num_nodes, num_exits_model2)
# Function to draw reverberating signals
def draw_reverberation(ax, G, exits, num_reverberations, escape_ratio):
pos = nx.get_node_attributes(G, ‘pos’)
nodes = list(G.nodes)
signals = [0] # Start at node 0
for _ in range(num_reverberations):
new_signals = []
for signal in signals:
neighbors = list(G.neighbors(signal))
for neighbor in neighbors:
if np.random.rand() > escape_ratio or neighbor in exits:
new_signals.append(neighbor)
ax.plot([pos[signal][0], pos[neighbor][0]], [pos[signal][1], pos[neighbor][1]], color=‘yellow’)
signals = new_signals
# Plot settings
fig, ax = plt.subplots(1, 2, figsize=(14, 7))
# Plot for Model 1
nx.draw(G1, nx.get_node_attributes(G1, ‘pos’), ax=ax[0], with_labels=True, node_color=‘red’, edge_color=‘black’, node_size=500, font_color=‘white’)
draw_reverberation(ax[0], G1, exits1, num_reverberations_model1, escape_ratio_model1)
ax[0].set_title(‘Model 1: Reverberating Circle with 2 Exits’)
# Plot for Model 2
nx.draw(G2, nx.get_node_attributes(G2, ‘pos’), ax=ax[1], with_labels=True, node_color=‘green’, edge_color=‘black’, node_size=500, font_color=‘white’)
draw_reverberation(ax[1], G2, exits2, num_reverberations_model2, escape_ratio_model2)
ax[1].set_title(‘Model 2: Circle with 5 Exits’)
plt.show()
plt.show()
# Plot for Model 2
ax[1].scatter(x_positions, np.zeros(num_cells), color=‘blue’, label=‘Initial Position’)
ax[1].scatter(x_migrated_2, y_migrated_2, color=‘green’, label=‘Migrated Position’)
ax[1].set_title(‘Model 2: Stochastic Migration’)
ax[1].legend()
ax[1].axis(‘equal’)
ax[1].set_xlim([-radius*1.5, radius*1.5])
ax[1].set_ylim([-1, radius*1.5])
plt.show()
Python codes
Graph 3.
import numpy as np
import matplotlib.pyplot as plt
import networkx as nx
# Function to create a circle graph with exits
def create_circle_graph(num_nodes, num_exits, strong_weight=2, weak_weight=0.1):
G = nx.Graph()
nodes = range(num_nodes)
for i in nodes:
G.add_node(i, pos=(np.cos(2 * np.pi * i / num_nodes), np.sin(2 * np.pi * i / num_nodes)))
G.add_edge(i, (i + 1) % num_nodes, weight=strong_weight)
exits = np.random.choice(nodes, num_exits, replace=False)
for exit in exits:
G.add_edge(exit, (exit + num_nodes // 2) % num_nodes, weight=weak_weight)
return G, exits
# Parameters
num_nodes = 20
num_exits_model1 = 2
num_exits_model2 = 5
num_reverberations_model1 = 20
num_reverberations_model2 = 5
escape_ratio_model1 = 0.2
escape_ratio_model2 = 0.5
noise_multiplier_model1 = 10
noise_multiplier_model2 = 5
# Create graphs for both models
G1, exits1 = create_circle_graph(num_nodes, num_exits_model1)
G2, exits2 = create_circle_graph(num_nodes, num_exits_model2)
# Function to draw reverberating signals with noise and exits
def draw_reverberation(ax, G, exits, num_reverberations, escape_ratio, noise_multiplier):
pos = nx.get_node_attributes(G, ‘pos’)
nodes = list(G.nodes)
signals = [0] # Start at node 0
for _ in range(num_reverberations):
new_signals = []
for signal in signals:
neighbors = list(G.neighbors(signal))
for neighbor in neighbors:
if np.random.rand() > escape_ratio or neighbor in exits:
new_signals.append(neighbor)
for _ in range(noise_multiplier):
noise_x = np.random.normal(0, 0.02)
noise_y = np.random.normal(0, 0.02)
ax.plot([pos[signal][0], pos[neighbor][0] + noise_x], [pos[signal][1], pos[neighbor][1] + noise_y], color=‘orange’)
signals = new_signals
for exit in exits:
ax.plot([pos[exit][0], pos[(exit + num_nodes // 2) % num_nodes][0]],
[pos[exit][1], pos[(exit + num_nodes // 2) % num_nodes][1]],
color=‘yellow’, linewidth=2, linestyle=‘dashed’)
# Plot settings
fig, ax = plt.subplots(1, 2, figsize=(14, 7))
# Plot for Model 1
nx.draw(G1, nx.get_node_attributes(G1, ‘pos’), ax=ax[0], with_labels=True, node_color=‘red’, edge_color=‘black’, node_size=500, font_color=‘white’)
draw_reverberation(ax[0], G1, exits1, num_reverberations_model1, escape_ratio_model1, noise_multiplier_model1)
ax[0].set_title(‘Model 1: Reverberating Circle with 2 Exits’)
# Plot for Model 2
Python code graph 3.
Conflicts of Interest
The author declares no conflict of interest.
References
- Abbott, L. F. , & Regehr, W. G. (2004). Synaptic computation. Nature, 431(7010), 796-803.
- Baron-Cohen, S. (2008). Autism and Asperger syndrome. Oxford University Press.
- Bauminger, N.; Kasari, C. Loneliness and Friendship in High-Functioning Children with Autism. Child Dev. 2000, 71, 447–456. [Google Scholar] [CrossRef] [PubMed]
- Bliss, T.V.P.; Collingridge, G.L. A synaptic model of memory: long-term potentiation in the hippocampus. Nature 1993, 361, 31–39. [Google Scholar] [CrossRef]
- Bölte, S.; Westerwald, E.; Holtmann, M.; Freitag, C.; Poustka, F. Autistic Traits and Autism Spectrum Disorders: The Clinical Validity of Two Measures Presuming a Continuum of Social Communication Skills. J. Autism Dev. Disord. 2010, 41, 66–72. [Google Scholar] [CrossRef] [PubMed]
- Chua, L. Memristor-The missing circuit element. IEEE Trans. Circuit Theory 1971, 18, 507–519. [Google Scholar] [CrossRef]
- Constantino, J. N. , & Todd, R. D. (2003). Autistic traits in the general population: A twin study. Archives of General Psychiatry, 60(5), 524-530.
- Courchesne, E.; Pierce, K.; Schumann, C.M.; Redcay, E.; Buckwalter, J.A.; Kennedy, D.P.; Morgan, J. Mapping Early Brain Development in Autism. Neuron 2007, 56, 399–413. [Google Scholar] [CrossRef]
- del Campo, M.; Mollenhauer, B.; Bertolotto, A.; Engelborghs, S.; Hampel, H.; Simonsen, A.H.; Kapaki, E.; Kruse, N.; Le Bastard, N.; Lehmann, S.; et al. Recommendations to Standardize Preanalytical Confounding Factors in Alzheimer’s and Parkinson’s Disease Cerebrospinal Fluid Biomarkers: An Update. Biomarkers Med. 2012, 6, 419–430. [Google Scholar] [CrossRef] [PubMed]
- Dubois, B. , Hampel, H., & Feldman, H.H., et al. (2016). Preclinical Alzheimer’s disease: definition, natural history, and diagnostic criteria. Alzheimer’s Dementia, 12, 292-323.
- Fisher, M.P. Quantum cognition: The possibility of processing with nuclear spins in the brain. Ann. Phys. 2015, 362, 593–602. [Google Scholar] [CrossRef]
- Geschwind, D. H. (2009). Advances in autism. Annual Review of Medicine, 60, 367-380.
- Geschwind, D.H.; Levitt, P. Autism spectrum disorders: developmental disconnection syndromes. Curr. Opin. Neurobiol. 2007, 17, 103–111. [Google Scholar] [CrossRef]
- He, X.-Y.; Dan, Q.-Q.; Wang, F.; Li, Y.-K.; Fu, S.-J.; Zhao, N.; Wang, T.-H. Protein Network Analysis of the Serum and Their Functional Implication in Patients Subjected to Traumatic Brain Injury. Front. Neurosci. 2019, 12, 1049. [Google Scholar] [CrossRef]
- Henstridge, C.M.; Hyman, B.T.; Spires-Jones, T.L. Beyond the neuron–cellular interactions early in Alzheimer disease pathogenesis. Nat. Rev. Neurosci. 2019, 20, 94–108. [Google Scholar] [CrossRef] [PubMed]
- Huebschman, N. A. , Prakapenka, L., & Fishman, P. S., et al. (2021). FMRP regulates synaptic development and plasticity in the striatum. Frontiers in Molecular Neuroscience, 14, 629849.
- Jie, S. , Qun, Y., & Tailiang, G. (2022). Perovskite Quantum Dots for Emerging Displays: Recent Progress and Perspectives. Nanomaterials, 12(13), 2243.
- Kanner, L. Autistic disturbances of affective contact. Nerv. Child 1943, 2, 217–250. [Google Scholar]
- Landa, R. Early communication development and intervention for children with autism. Ment. Retard. Dev. Disabil. Res. Rev. 2007, 13, 16–25. [Google Scholar] [CrossRef]
- Lord, C.; Risi, S.; Lambrecht, L.; Cook, J.E.H.; Leventhal, B.L.; DiLavore, P.C.; Pickles, A.; Rutter, M. The Autism Diagnostic Observation Schedule—Generic: A Standard Measure of Social and Communication Deficits Associated with the Spectrum of Autism. J. Autism Dev. Disord. 2000, 30, 205–223. [Google Scholar] [CrossRef]
- Lord, C.; Wagner, A.; Rogers, S.; Szatmari, P.; Aman, M.; Charman, T.; Dawson, G.; Durand, V.M.; Grossman, L.; Guthrie, D.; et al. Challenges in Evaluating Psychosocial Interventions for Autistic Spectrum Disorders. J. Autism Dev. Disord. 2005, 35, 695–708. [Google Scholar] [CrossRef] [PubMed]
- Malpetti, M. , Jones, P. S., & Thomas, D. L., et al. (2021). Synaptic loss in the frontal cortex is associated with cognitive deficits in amyotrophic lateral sclerosis. Brain, 144(11), 3369-3382.
- Montgomery, R. M. (2023). Visualizing Social and Neural Connectivity in Autism: Insights from Clustering and Stochastic Models. Universidade de Aveiro.
- Nanomaterials (2022). Perovskite Quantum Dots for Emerging Displays: Recent Progress and Perspectives. Nanomaterials, 12(13), 2243.
- Pakkenberg, B.; Pelvig, D.; Marner, L.; Bundgaard, M.J.; Gundersen, H.J.G.; Nyengaard, J.R.; Regeur, L. Aging and the human neocortex. Exp. Gerontol. 2003, 38, 95–99. [Google Scholar] [CrossRef]
- Pelphrey, K.A.; Shultz, S.; Hudac, C.M.; Wyk, B.C.V. Research Review: Constraining heterogeneity: the social brain and its development in autism spectrum disorder. J. Child Psychol. Psychiatry 2011, 52, 631–644. [Google Scholar] [CrossRef]
- PLOS Computational Biology (2020). Axonal Noise as a Source of Synaptic Variability. PLOS Computational Biology.
- Proteomic insights into synaptic signaling in the brain: the past, present and future (2021). Molecular Brain, 14, 113.
- Purves, D. , Augustine, G. J., Fitzpatrick, D., Katz, L. C., LaMantia, A. S., McNamara, J. O., & Williams, S. M. (2001). Neuroscience. Sinauer Associates.
- Quantum Dot Optoelectronic Synaptic Devices (2023). IEEE Transactions on Nanotechnology.
- Suzuki, K. , Tsunekawa, Y., & Inoue, K., et al. (2020). Synthetic organizer proteins that restore synaptic function. Nature Neuroscience, 23(3), 294-303.
- Tegmark, M. Importance of quantum decoherence in brain processes. Phys. Rev. E 2000, 61, 4194–4206. [Google Scholar] [CrossRef] [PubMed]
- The Quantum Biology of Consciousness and Visual Perception (2021). Frontiers in Neuroscience.
- Uddin, L.Q.; Supekar, K.; Menon, V. Reconceptualizing functional brain connectivity in autism from a developmental perspective. Front. Hum. Neurosci. 2013, 7, 53721. [Google Scholar] [CrossRef] [PubMed]
Disclaimer/Publisher’s Note: The statements, opinions and data contained in all publications are solely those of the individual author(s) and contributor(s) and not of MDPI and/or the editor(s). MDPI and/or the editor(s) disclaim responsibility for any injury to people or property resulting from any ideas, methods, instructions or products referred to in the content. |
© 2024 by the author. Licensee MDPI, Basel, Switzerland. This article is an open access article distributed under the terms and conditions of the Creative Commons Attribution (CC BY) license (https://creativecommons.org/licenses/by/4.0/).
Copyright: This open access article is published under a Creative Commons CC BY 4.0 license, which permit the free download, distribution, and reuse, provided that the author and preprint are cited in any reuse.


