
Submitted:
02 April 2025
Posted:
03 April 2025
You are already at the latest version
Abstract
This study examines spontaneous activity in children aged 3-11 years with Specific Language Impairment (SLI) using electroencephalogram (EEG). We compared SLI diagnosed children with a normo-development group (ND). Signal complexity Multiscale Entropy (MSE) and parameterized Spectral Power Density (FOOOF) were analyzed, decomposing the PSD into its aperiodic (AP, proportional to 1/fx) and periodic (P) components. The results show increases in complexity across scales in both groups. Although topographic distributions were similar, children with SLI exhibited higher lateralized exponent parameter values in both hemispheres, along with an increased AP component over a broad frequency range (13–45 Hz) in medial regions. The P component shows differences in brain activity according to frequency and region. At 9–12 Hz, ND presents greater central-anterior activity, whereas in SLI, it is posterior-central. At 33–36 Hz, anterior activity is greater in SLI than in ND. At 37–45 Hz, SLI shows greater activity than ND, with a specific increase in the left, medial, and right regions at 41–45 Hz. These findings suggest alterations in the excitatory-inhibitory balance and impaired intra and interhemispheric connectivity, indicating difficulties in neuronal modulation possibly associated with the cognitive and linguistic characteristics of SLI.
Keywords:
multiscale entropy
; parameterized of PSD
; aperiodic component
; periodic component
; specific language impairment
1. Introduction
Specific Language Impairment (SLI) is classified as part of the Communication Disorders in the DSM-V. It incorporates Expressive Language Disorder and Mixed Receptive and Expressive Language Disorder from the DSM-IV edition. Within this classification, SLI would be embedded in the Developmental Language Disorder in the DSM-V [1,2]. It is defined as an impairment in language acquisition and use, arising inappropriate social conditions and in the absence of physical, cognitive, sensory, or social-affective deprivation [3]. Research suggests that these difficulties are influenced by genetic factors [4,5,6,7]. Diagnosis is most common in childhood, with an international prevalence ranging from 1.4% to 16.2% of the school population [3,8]. In Andalusia (Spain), prevalence ranges from 5.26% to 12.58% [3]. SLI often leads to reading difficulties, such as dyslexia [9], and negatively impacts academic performance [10]. Furthermore, it has been associated with emotional, behavioral, and social difficulties during adolescence [11,12,13], as well as a significant reduction in quality of life and well-being in adulthood [14].
Several models have been proposed to understand the underlying mechanisms of SLI. Among these, the speed-of-processing limitation hypothesis [15] suggests that children with SLI have difficulty processing rapid auditory stimuli, which impairs their ability to discriminate phonemes with brief transitions and consequently affects language development. Meanwhile, the statistical learning model [16] proposes that individuals with SLI have difficulty extracting implicit regularities from sequences of stimuli, which may explain their difficulties in acquiring grammatical rules. Finally, the temporal processing hypothesis of language [17] proposes that disruptions in neural synchronization with the rhythmic structures of language may serve as a neurobiological basis for SLI. In other words, difficulties in aligning neural activity with speech rhythms may impair the perception of prosodic and phonological patterns, contributing to deficits in language development. Taken together, these models suggest that SLI possibly is not just a language disorder, but would also involve impairments in learning and auditory processing.
Neurobiological studies in SLI have shown structural, functional, and connectivity changes in key brain regions involved in language processing [18]. At a global level, findings are inconsistent: while some studies report reduced total brain volume in SLI [19], others find increased volume [20]. This discrepancy may be explained by variations in cortical morphology, suggesting that the primary affected variable is surface area rather than cortical thickness, with lower values observed in the SLI group [21]. At a regional level, abnormalities in grey matter volume and patterns of symmetry have been identified in key language and speech regions, such as the planum temporale and inferior frontal gyrus [18,22]. Additionally, increased gray and white matter volume has been reported in specific structural regions, including the perisylvian, occipital, entorhinal, and temporopolar areas, as well as in subcortical structures such as the caudate nucleus [23,24].
At the microstructural level, the dorsal striatum has been shown to have reduced myelin content, which may impair neuronal transmission efficiency [25]. From a functional perspective, atypical patterns of lateralization and activation have been described in the left hemisphere, with reduced or absent activation in the left inferior frontal gyrus and compensatory activation in the right, according to functional magnetic resonance imaging (fMRI) studies [26,27]. In addition, research using single-photon emission computed tomography (SPECT) has shown abnormal lateralization of blood flow patterns and/or hypoperfusion in language-related regions [28], while studies using functional transcranial Doppler (fTCD) have shown a right hemisphere lateralization of language or a bilateral distribution in SLI [29]. In terms of connectivity, findings suggest an abnormal increase in white matter in children with SLI, indicating impaired connectivity across neural networks [18,20,30]. Diffusion tensor imaging (DTI) studies have linked specific language deficits to atypical development of both ventral [31] and dorsal [32,33] language streams. Furthermore, a persistent deficit in the maturation of these pathways has been proposed in SLI [33].
Neurophysiological studies using electroencephalogram (EEG) and computing event-related potentials (ERPs) have identified deficits in children with SLI [34]. These studies highlight limitations in attentional discrimination of auditory stimuli, evidenced by a reduced or absent Mismatch Negativity (MMN) component [35,36,37]. Specific deficits have been observed in lexical access and semantic integration, with a delayed [35] or absent N400 component [38,39]. Impaired speech processing and differences in the allocation of attentional resources to auditory stimuli have been reported, reflected in a delayed P100 component [40]. Difficulties in central auditory processing have also been noted, as indicated by alterations in the T-complex [41], which is a bilateral negative component at temporal sites [42], and the P300 component [43]. Furthermore, deficits in processing and storing visual information in working memory have been evidenced by a decreased P3b amplitude [44].
Resting-state EEG studies have analyzed the signal using both linear (Spectral Power Density [PSD]) and non-linear (Multiscale Entropy [MSE]) measures in ND subjects and with neurodevelopmental disorders. Regarding PSD, during typical brain maturation, absolute spectral power decreases, while relative spectral power fluctuates, reflecting a transition from slow (delta and theta) to fast (alpha, beta, and gamma) frequencies. This shift is associated with synaptic pruning, which optimizes neuronal transmission [45,46,47,48,49,50]. As for MSE, maturation is characterized by increased values at fine scales and decreased values at coarse scales, indicating a strengthening of local connections and a refinement of long-range connections with age [51,52].
In neurodevelopmental disorders such as Attention Deficit Hyperactivity Disorder (ADHD) and Autism Spectrum Disorder (ASD), the typical maturation pattern is altered. In ADHD PSD increases in specific frequency bands, including delta and theta [50,53,54,55] and theta, alpha, and beta in ASD [56,57,58,59,60]. Regarding MSE, studies indicate a less consistent maturation pattern and lower values in both ADHD [61,62,63,64] and ASD [65,66,67,68]. However, the literature remains inconsistent for both PSD [53,69,70] and MSE [71,72]. For SLI, although research is more limited, studies report increased delta and theta band activity (Relative PSD [73]; Absolute PSD [74]; Absolute PSD [75]) and reduced alpha and beta band PSD values (Relative PSD [73]); Absolute PSD [75]); Absolute PSD [76]). However, recent findings suggest higher spectral power in the beta band in children with SLI compared to ND children (Absolute PSD [75]). As far as we know complexity measures have not been described for analyzing EEG resting state in SLI. This lack of evidence, combined with inconsistencies in the PSD literature, underscores the need for further research to clarify the underlying neurophysiological mechanisms of SLI.
Recently, an innovative approach to PSD analysis has been proposed, offering a more detailed and accurate neurophysiological assessment while minimizing information loss in the interpretation of cognitive and behavioral states [77,78]. This method involves decomposing PSD into two components: the aperiodic component (AP), characterized by a 1/f-like distribution, which provides insights into neuronal activation level (offset parameter) and the balance between excitatory and inhibitory synaptic currents (exponent parameter) [79,80]; and the periodic component (P), which reflects genuine rhythmic patterns of brain activity [77]. These components appear to be altered in neurodevelopmental disorders such as ADHD [81,82,83,84] and ASD [85].
The present study aims to apply this new PSD decomposition methodology to a sample of children with SLI compared to ND children, to examine more precisely the patterns of neural activity underlying the disorder. Additionally, given the lack of previous studies on brain signal complexity in SLI, MSE will be explored to assess the stability and adaptability of neural activity. We expect to observe an increase of MSE with the order of scale in both groups, with lower complexity values in the SLI group. Regarding the PSD components, we hypothesize group differences in the AP and P components, primarily in language-related regions and at the most relevant frequencies similar to those observed in canonical PSD analyses [73,75,76].
2. Materials and Methods
2.1. Sample
A total of 66 subjects participated in this study divided into two groups: a normo-development (ND) group and a clinical group diagnosed with Specific Language Impairment (SLI). The SLI group consisted of 30 children aged 3 to 10 years (M = 6.37, SD = 1.75, 19 boys). Participants were recruited from the Unidad de Desarrollo Infantil y Atención Temprana (UDIATE: https://hospitalveugenia.com/udiate-atencion-temprana-desarrollo-infantil/) affiliated with the Hospital Victoria Eugenia, part of the Spanish Red Cross, which specializes in the assessment and intervention of neurodevelopmental disorders. To be included in the study, children required a clinical report confirming language deficits, supported by language experts from the clinical center (see above) based on tests such as the Clinical Evaluation of Language Fundamentals-5 (CELF-5; [86]), the Navarre Oral Language Test-Revised (PLON-R; [87]), The Illinois Test of Psycholinguistic Abilities (ITPA; [88]) and Peabody Picture Vocabulary Test (PPVT-5; [89]), Kaufman Brief Intelligence Test (KBIT; [90]), or structured interview following DSM-V or CIE-10 criteria by language therapists. Previously, otorhinolaryngologists did not find basic auditory problems by audiometry and/or brainstem auditory evoked potentials.
The ND group consisted of a total of 36 participants aged 3 to 11 years (M = 6.69, SD = 2.08, 19 males). This group was recruited from different schools in Seville. Parents did not report any neurological diseases, signs of epileptic discharge, learning difficulties, or developmental delays in the children. No significant statistical differences were found in the sample subject for age (t(64) = .684, p = .49, d = .170 (effect size d’ Cohen)) or gender (t(64) = -0.856, p = .40, d = .212) between the SLI (age (M = 6.38, SD = 1.75); gender ((females (M = 6.09, SD = 1.87), males (M = 6.52, SD = 1.71)) and ND group (age (M = 6.9, SD = 2.08); gender (females (M = 6.29, SD =2.05), males (M = 7.05, SD = 2.09)). Consequently, age and gender are not considered relevant factors for the interpretation of the results.
KBIT [90] was used to assess the non-verbal cognitive skills of all children participating in the study. The KBIT raw scores met the assumptions of normality and homogeneity of variances. Statistical analysis revealed a significant differences between groups ND (M = 26.63, SD = 6.49) and SLI (M = 22.52, SD = 7.49) in cognitive skills (t(55) = 2.22, p = .030, d = .059).
The experimental protocol was approved by the biomedical research ethics committee of the Autonomous Community of Andalusia, following the guidelines of the Declaration of Helsinki (code: 0818-N-21). Written informed consent was obtained from the parents, who were provided with written information and an explanation regarding the objectives and characteristics of the study.
2.2. EEG recording
Spontaneous brain electrical activity was recorded using EEG for three minutes while participants had their eyes open. Participants were asked to sit in a comfortable position and look at an hourglass. The recording was obtained from 19 electrodes mounted on an electrode cap (ELECTROCAP), selected from the international 10-20 system (Fp1, Fp2, F3, F4, C3, C4, P3, P4, O1, O2, F7, F8, T3, T4, T5, T6, Cz, Fz, Pz). For all participants, an average reference was used, and impedance was kept below 10 kΩ. Data were recorded in direct current at 1024 Hz without any filtering. The amplification gain was set to 20,000 using an analog-to-digital acquisition and analysis system (ANT Amplifiers, The Netherlands).
2.3. Data Analysis
2.3.1. EEG pre-processing
EEGLAB software package [91] and Matlab R2021b were used to analyze the raw EEG data. Preprocessing consisted of applying (i) a 47-53 Hz notch filter (EEGLAB function: eegfiltnew), (ii) an average reference, and (iii) an artifact subspace reconstruction (ASR) algorithm (EEGLAB function: clean_raw_data). ASR was used to correct segments of the data with a standard deviation greater than 20 times that of the calibration data [92]. The epochs had a duration of 4 seconds (4000 ms). Eyeblink, muscle, and other movement artifacts were removed using independent component analysis (ICA; function: pop_runica) with the natural gradient function [93,94] and the ICLabel extension classification [95] in EEGLAB. The EEG signal was reconstructed, and all epochs with amplitudes exceeding ±120 μV were rejected using the eegthresh function.
Subject’s recording in the range of 20-45 epochs (M = 30.44, SD = 6.22), and 11-13 components (M = 12.73, SD = .542) were accepted for analysis. The Mann-Whitney U-test revealed significant differences in epochs (U = 315, Z = -2.99, p = .003) and components (U = 702, Z = 2.86, p = .004) between groups SLI (epochs (M = 27.87, SD = 2.45), components (M = 12.93, SD = .254)) and ND (epochs (M = 32.58, SD = 7.51), components (M = 12.56, SD = .652)).
2.3.2. Multiscale Entropy
Multiscale entropy (MSE) was calculated for all EEG participants and electrodes using the MultiscaleSampleEntropy function in MATLAB [96], based on the MSE method proposed by Costa et al. [97]. This method measures signal complexity by calculating the sample entropy (SE; [98]) on multiple time scales using a coarse-graining procedure. MSE provides an estimate of complexity by dividing the EEG signal into non-overlapping windows of different sample sizes and evaluating the repetition frequency of patterns of length ’m’ compared to patterns of length ’m + 1’. To calculate MSE, each time scale is defined by averaging neighboring points (p) in the original time series (length τ). A similarity limit (r) is set to define the tolerance range within which neighboring points are considered similar (k), and this limit is normalized to the standard deviation (SD) of the EEG, according to the relationship k < r × SD [96]. Sample entropy is calculated for each time scale according to the formula (1):
Following previous recommendations in studies on EEG signal complexity [98,99,100,101,102], parameters were set to m = 2 and r = 0.5. The MSE was calculated for 136-time scales, corresponding to 30-point windows obtained by collapsing 136 consecutive points sampled in each 4-second trial (0.97656 ms × 136 scales = 132.81 ms). A detailed description of the number of points, sample periods, and frequencies covered in each MSE scale is provided in Supplementary Table S1. High MSE values are associated with high complexity, indicating less repetition and greater diversity of patterns at different time scales, suggesting an information-rich signal [103]. In contrast, low MSE values reflect greater regularity or predictability in the signal patterns, which may indicate a reduction in information richness [99,104].
In the MSE calculation, the coarse-graining procedure acts as a filter for higher frequencies as the time scales increase. This implies that, at lower scales, all frequencies present in the EEG signal are included, while at higher scales, only low frequencies are retained. Recently, this approach has been linked to power spectrum analysis using methods such as Haar wavelets, which also separate frequencies into different levels [105].
2.3.3. Parameterization of Fitting Oscillations and One-Over-f (FOOOF)
A MATLAB-adapted version of the Fitting Oscillations and One-Over-f (FOOOF) function (version 3.8), originally implemented in Python, was used to analyze the Spectral Power Density (PSD) data. The FOOOF specparam tool (https://fooof-tools.github.io/fooof/reference.html) [77] allowed us to decompose the spectrum (canonical PSD) into the full model fit (adjusted PSD), the aperiodic component (AP), and the periodic component (P). Given the high similarity between the canonical PSD and the fitted PSD observed in a previous study [106] and confirmed in the present data (Supplementary Figure 1), the present study focused exclusively on the adjusted PSD and the AP and P components analyses. The PSD is provided directly from specparam which implements Welch’s method, incorporated in the EEGLAB spectopo function, to calculate power spectral density in the range of 1 to 45 Hz.
The FOOOF algorithm was configured using the following recommended parameters: peak_width_limits = [1,8], min_peak_height = 0.05, peak_threshold = 0.5, max_n_peaks = 6, and aperiodic_mode = ‘fixed’ [77,78]. In this approach, the AP component computed from the offset and exponent parameters models the background activity in log-log space, while the P component represents the oscillations that stand out from that activity, modeled by Gaussian functions with peak power, central frequency, and bandwidth parameters (see [77] for details). As FOOOF does not directly provide a fitted spectrum for the P component, it was obtained by subtracting the AP component (ap_fit in specparam) from the adjusted PSD (2):
To assess the goodness-of-fit of the model across all subjects, explained variance (R²) and mean absolute error (MAE) metrics were calculated, comparing the fitted model with the original power spectrum. The results showed a good fit of the algorithm in each data set, as shown in Supplementary Figure S1, following the fit criteria reported by Ostlund et al. [107] (MAE underfit > 0.1, MAE overfit < 0.020).
2.4. Statistical analysis
2.4.1. Multiscale Entropy
Repeated Measures Analysis of Variance (RM-ANOVA)
For the multiscale entropy (MSE) analysis we divided the MSE into three different types of scales [52]: (i) fine scales, ranging from scale 1 (0.976 ms, 4095-time points) to scale 25 (24.41 ms, 163-time points); (ii) medium scales, ranging from scale 26 (25.39 ms, 157-time points) to scale 46 (44.92 ms, 89-time points); and (iii) coarse scales, ranging from scale 47 (45.89 ms, 87-time points) to scale 136 (132.81 ms, 30-time points) in each group (ND and SLI). To see the corresponding frequencies, see Supplementary Table S1. Data from each participant were analyzed in the Statistical Package for Social Sciences 25 (SPSS). A repeated measures analysis of variance (RM-ANOVA) was performed with the collapse of electrodes defined in nine areas (Supplementary Table S2). The effect size was calculated directly using partial eta squared (ηp2) as statistical power.
The within-subjects factors were: (i) scales (fine, medium, and coarse); (ii) Laterality (left, medial, right), and (iii) antero-posterior (anterior, central, posterior). The between-subjects factor was group (ND and SLI), with age in days and gender as covariates. Post-hoc analyses were conducted using Student’s t-test for pairwise comparisons, with Cohen’s d as the effect size metric [108], and multiple comparison correction using the FDR method [109]. Only significant results, including the group factor, in which FDR-corrected post-hocs were significant would be discussed. Some laterality effects are reported for its possible relationship to language lateralization. All the analytical approaches included in this paragraph will be applied to MSE and PSD (FOOOF) statistical analysis.
2.4.2. Parametrization of Fitting Oscillations and One-Over-f (FOOOF)
Topographical Analysis
A topographical analysis of the ‘exponent’ and ‘offset’ parameters of the AP component and P component was conducted for each experimental group (ND and SLI), as well as for the differences between the two groups (ND - SLI). The aim was to examine the distribution of both P component and AP parameters across the scalp. The P component was analyzed in 4 Hz frequency windows across all electrodes, yielding a total of 11 topographic maps per group. These maps corresponded to the following frequency ranges: 1-4 Hz, 5-8 Hz, 9-12 Hz, 13-16 Hz, 17-20 Hz, 21-24 Hz, 25-28 Hz, 29-32 Hz, 33-36 Hz, 37-40 Hz, and 41-45 Hz. It is highlighted the last frequency range included frequencies up to 45 Hz.
Repeated Measures Analysis of Variance (RM-ANOVA)
The analysis of PSD components (AP and P) was performed independently for each component. For the AP component, two analyses were conducted: (i) A repeated-measures ANOVA (RM-ANOVA) was performed separately for the offset and exponent parameters. Data were organized by collapsing neighboring electrodes into nine specific areas (Supplementary Table S2). The within-subject factors included laterality (left, medial, and right) and antero-posterior distribution (anterior, central, and posterior), while the between-subject factor was the group (ND and SLI). Age in days and gender were included as covariates. (ii) The AP component was also analyzed in 4 Hz frequency windows, resulting in a total of 11 frequency bands (detailed in the Topographical Analysis section). For each frequency band, an independent RM-ANOVA was conducted with the same within-subject factors: laterality (left, medial, right) and antero-posterior distribution (anterior, central, posterior), while the between-subject factor was the group (ND and SLI). Age and gender were included as covariates. Finally, the P component was analyzed using the same approach, employing a repeated-measures ANOVA (RM-ANOVA). The analysis used the same within-subject factors (laterality and antero-posterior distribution), the between-subject factor (ND vs. SLI group), and the covariates (age and gender).
3. Results
Figure 1 presents the results of Multiscale Entropy (MSE) across the nine evaluated areas, comparing participants from the ND and SLI groups. In both groups, we observed a consistent increase in MSE with the order of the scales across all considered areas. RM-ANOVA analysis did not reveal significant effects between groups. Some laterality effects are reported in the description of Supplementary Table S3 for its possible relationship to language lateralization.
Figure 2 shows the topographies of the offset and exponent parameters of the AP component and the differences between the groups (ND - SLI). The offset parameter displays a predominant distribution in the frontocentral and posterior areas, while the exponent is mainly distributed in the frontocentral and parietal areas.
The results of the RM-ANOVA analysis for the offset and exponent parameters of the AP component show a laterality x group interaction for the exponent parameter (F(1.81,108.498) = 3.48, p = .039, np2 = .055, power = .610). Post-hoc analysis reveals significant differences between the medial vs left area (medial area - left area); t(64) = 2.03, p = .047, d = .050), with higher values in the SLI group (M = .289, SD = .098) compared to ND group (M = .239, SD = .099). Additionally, a significant difference was observed between the medial vs right area (medial area - right area; t(64) = 2.02, p = .047, d = .50), with higher values in the SLI group (M = .273, SD = .080) compared to ND group (M = .231, SD = .087); however, both significant results did not survive multiple comparison correction (FDR). Some laterality effects are reported in the description of Supplementary Table S4 for its possible relationship to language lateralization.
Figure 3 shows the AP component of the PSD in each considered area. The RM-ANOVA with group effect for each frequency band of the AP component is shown in Table 1. Observe the significant interaction between the effects of the laterality and group factors in a broad frequency band. Table 3 shows a summary of the post-hoc analysis of the significant effects of the interactions: laterality × group interactions, as reported in the following. The 13-16 Hz range showed, after FDR correction, left - medial area difference (t(64) = 2.44, p = .047, d = .60) higher for the SLI group (M = .114, SD = .099) compared to the ND group (M = .059, SD = .084). In addition, the right - medial area difference (t(64) = 2.19, p = .047, d = .054), shows higher values in SLI group (M = .124, SD = .098) than the ND group (M = .069, SD = .105). For the 17-20 Hz range, interactions between group and laterality were also found. The left - medial area difference (t(64) = 2.53, p = .037, d = .62), is higher in the SLI group (M = .145, SD = .105) compared to the ND group (M = .085, SD = .088). And right - medial area difference (t(64) = 2.30, p = .037, d = .06) is greater in SLI group (M = .153, SD = .103) compared to ND group (M = .094, SD = .107). Similar patterns were observed at higher frequencies. For 21-24 Hz, left - medial area difference (t(64) = 2.58, p = .031, d = .63) is higher in SLI group (M = .169, SD = .111) vs. ND group (M = .105, SD = .093). As well as in the right - medial area difference (t(64) = 2.37, p = .031, d = .058; SLI: M = .177, SD = .107; ND: M = .113, SD = .109). For 25-28 Hz, left - medial area difference (t(64) = 2.61, p = .031, d = .638) is higher in the SLI group (M = .190, SD = .115) compared to the ND group (M = .122, SD = .097). As well as in the right - medial area difference (t(64) = 2.41, p = .031, d = .060; SLI: M = .196, SD = .111; ND: M = .130, SD = .112). For 29-32 Hz, significant laterality × group interactions were observed. The difference between left - medial area (t(64) = 2.62, p = .026, d = .643) shows higher values in the SLI group (M = .207, SD = .119) compared ND group (M = .137, SD = .100). Similarly, to the difference between right - medial area (t(64) = 2.45, p = .026, d = .061; SLI: M = .213, SD = .114; ND: M = .144, SD = .114). For 33-36 Hz, laterality × group interactions were found with the left - medial area difference (t(64) = 2.63, p = .024, d = .646) and right - medial area difference; (t(64) = 2.48, p = .024, d = .061). To both, the SLI group had consistently higher scores (left vs. medial: M = .223, SD = .124; right vs. medial: M = .227, SD = .117) compared to the ND group (left vs. medial: M = .149, SD = .104; right vs. medial: M = .156, SD = .116). For 37-40 Hz interactions were also observed in the left-medial area difference (t(64) = 2.64, p = .023, d = .648) and the right-medial area difference (t(64) = 2.50, p = .023, d = .062), being higher in SLI group (left - medial: M = .237, SD = .127; right - medial: SLI: M = .240, SD = .119) compared to ND group (left - medial: M = .161, SD = .107; right vs. medial: M = .167, SD = .118). Finally, significant interactions between the laterality x group were found for 41-45 Hz. The left - medial area difference (t(64) = 2.65, p = .022, d = .649) is higher in SLI group (M = .251, SD = .131) compared to ND group (M = .172, SD = .110). And right - medial area difference (t(64) = 2.51, p = .022, d = .062), is higher in the SLI group (M = .255, SD = .122) compared to the ND group (M = .178, SD = .120). Supplementary Table S5 shown the significant interactions without group effect.
Figure 4 shows the topographies of the periodic component in both groups (ND and SLI) and their differences (ND - SLI). A well-defined regional distribution is observed for the different frequencies, with higher intensity in the SLI group in high frequencies.
Figure 5 shows the periodic component power values (P) in each defined area. The RM-ANOVA results for the P component of the PSD revealed significant group differences across specific frequency ranges (Table 2). Post-hoc analyses (summary in Table 3) indicated that in the 37-40 Hz range (t(64) = 3.27, p = .003, d = .787), the SLI group (M = .047, SD = .039) had significantly higher values compared to the ND group (M = .022, SD = .020). Similarly, in the 41-45 Hz range (t(64) = 3.23, p = .004, d = .774) the SLI group (M = .048, SD = .040) had higher values than the ND group (M = .023, SD = .019). Interactions of the effect of the group with laterality were also found. In the 1-4 Hz range, a significant laterality × group interaction was observed in the difference between right - medial area (t(64) = 2.11, p = .038, d = .52), with the ND group showing higher values (M = .025, SD = .031) compared to the SLI group (M = .009, SD = .034). However, this difference did not remain significant after multiple comparisons correction (FDR). For the 9-12Hz range, a significant laterality × group interaction was found. The difference between medial - left area (t(64) = 2.44, p = .018, d = .059) is higher in SLI group (M = .091, SD = .074) than the ND group (M = .050, SD = .063). And the difference between medial - right area (t(64) = 2.06, p = .043, d = .51), with the SLI group (M = .085, SD = .073) exceeding the ND group (M = .050, SD = .062). However, this difference did not remain significant after multiple comparisons correction (FDR). Additionally, for the same frequency range (9-12 Hz) a significant antero-posterior x group interaction was found. In this case, the difference between the central-anterior area (t(64) = 2.29, p = .038, d = .057) is higher in the ND group (M = .194, SD = .101) compared SLI group (M = .142, SD = .076). And the difference between posterior - central area (t(64) = 2.37, p = .038, d = .058) shows higher values in the SLI group (M = .066, SD = .078) than in the ND group (M = .017, SD = .086). The 13-16 Hz range shows an interaction antero-posterior x group (t(64) = 2.23, p = .030, d = .549) with the posterior area of the ND group (M = .176 SD = .112) being higher than the SLI group (M = .113, SD = .117). However, the difference disappeared after correction for multiple comparisons (FDR). In the 33-36Hz range, an antero-posterior × group interaction was found. Post-hoc analysis revealed that the anterior area (t(64) = 2.97, p=.013, d=.72) had significantly higher values in the SLI group (M = .069, SD = .058) compared to the ND group (M = .035, SD = .034). For the 41-45Hz range, a significant laterality x group interaction was observed with differences across all three areas. In the left area (t(64) = 2.46, p = .035, d = .591), the SLI group (M = .054, SD = .048) showed significantly higher values compared to the ND group (M = .031, SD = .026). A similar pattern was found in the medial area (t(64) = 2.29, p = .035, d = .551), where the SLI group (M = .029, SD = .038) had higher values than the ND group (M = .013, SD = .020). Finally, the right area (t(64) = 3.86, p = .002, d = .927) exhibited the most pronounced difference, with the SLI group (M = .060, SD = .047) showing significantly higher values than the ND group (M = .026, SD = .024). In supplementary Table S6 we show significant interactions without group effect.
4. Discussion
This study analyzes brain activity at rest in a group of children diagnosed with SLI compared to the ND group. The objective was, on one hand, to assess the stability and adaptability of neuronal activity measured through MSE. And, on the other hand, the study aimed to examine more precisely the patterns of neuronal activity underlying the disorder, measured with an innovative approach that decomposes the PSD into its AP and P components.
Our findings show an increase in MSE values across the scales in both groups, but with a non-significant tendency to lower values in the SLI group. These findings are consistent with previous studies on complexity in neurodevelopmental disorders, such as ADHD [61,62,63,64] and ASD [65,66,67,68], which have reported lower variability in neural network dynamics. However, the absence of significant differences between the groups suggests that the variability in the neural dynamics of children with SLI would be more similar to that of typically developing children, indicating that their adaptability, although slightly reduced, is not as compromised as in other neurodevelopmental disorders.
The topographies of the AP component parameters (offset and exponent) show independence in the regional distributions for each parameter, consistent with previous studies [110,111]. The offset parameter presents a predominant distribution in the frontocentral and posterior regions, with higher values in posterior areas, and the exponent parameter primarily distributes in frontocentral and parietal areas, being consistent with previous results [106]. These findings suggest that the offset and exponent reflect distinct neurophysiological mechanisms. While the offset is related to overall cortical excitability and global electroencephalogram amplitude [112,113,114], its distribution suggests it may be influenced by the default mode network [115,116]. On the other hand, the exponent is linked to the spectral organization of neuronal activity and the balance between excitatory and inhibitory processes [79,80], and seems to focus on regions crucial for cognitive control and sensory integration. The lower value of the exponent in the SLI group could indicate alterations in cortical dynamics, with an impaired maturation of the balance of excitatory and inhibitory synaptic currents (E/I, balance), as observed in other neurodevelopmental disorders [81,83,84,85], suggesting alterations in neuronal communication efficiency and sensory and cognitive processing in children with SLI. This change in the E/I balance indexed by the decrease of exponent in the SLI group, would be due to a reduced inhibitory or some increased excitatory synaptic currents in the SLI group during development.
Since the exponent is linked to the spectral structure of the EEG and the balance between excitatory and inhibitory processes, the higher values observed in the SLI group in lateralized regions when compared with medial areas may reflect an alteration in the distribution of neuronal activity compared to the ND group, suggesting potential differences in cortical modulation in these areas. Furthermore, the analysis of the aperiodic component (AP), shows significant interactions between laterality and group, with higher aperiodic values in the SLI group in the 13-45Hz frequency range. These alterations in the AP component suggest atypical modulation of the background activity and increased cortical excitability, in the lateral areas in the SLI. The reduced exponent values in lateral areas, combined with the elevated aperiodic component values in this same region for the SLI group, would suggest alterations in the modulation of background brain activity, as well as atypical or compensatory interhemispheric connectivity in children with SLI. These dysfunctions in neuronal connectivity would impact language development, given the crucial role of lateral area connectivity in the linguistic process [117,118].
Moreover, the topographies of the P component exhibit a well-defined regional distribution across the different frequency ranges analyzed. This regional organization aligns with the canonical frequency bands described in the literature, including delta (1-4 Hz), theta (4-8 Hz), alpha (8-12 Hz), beta (12-30 Hz), and gamma (>30 Hz) [49,50,77,119,120,121]. Low P beta topography (13-20Hz) is a bit different from canonical PSD beta topography given that posterior frequency in P beta prolongs to higher frequencies than in the canonical beta. The distribution patterns observed in this study are consistent with those reported in a previous parametrization analysis conducted on a sample of 240 neurotypical participants [106]. The increased intensity at higher frequencies (33-45Hz) in the SLI group suggests that, while the spectral organization of low-frequency (1-8Hz) oscillations remains preserved in these children, differences emerge in the magnitude of this organization at higher frequencies. This finding may indicate that, although the fundamental architecture of rhythmic neural activity is not disrupted in SLI, the deficits observed in language processing and other cognitive functions, such as attention [40,122], memory [123], and executive functions [124,125], could be associated with reduced neuronal synchronization efficiency, impairing the modulation of high-frequency oscillatory activity in these children.
The results of the group comparison for the P component show an increase in power at high frequencies (37-45Hz) in the SLI group compared to the ND group. Previous studies have reported an increase in activity in slower bands (delta and theta) and a decrease in faster bands (alpha and beta) in children with SLI [73,74,75,76]. However, our results indicate a different pattern in the high frequencies gamma band (33-45Hz) which has been linked to processes of sensory integration, neuronal synchronization, and cognitive modulation [126]. An increase in the gamma P band in SLI could reflect an imbalance, once again, in the regulation of cortical excitability, possibly related to reduced efficiency of inhibitory mechanisms as suggested by the AP PSD component, increasing the neuronal capacity for generating synchronization for high frequencies [126] in children diagnosed with SLI.
These results are not homogeneous across all regions or high frequencies but instead vary based on laterality (41-45Hz) and antero-posterior distribution (33-36Hz). Thus, we found (i) greater high-frequency power (41-45Hz) in the SLI group in the left, medial, and right areas, suggesting a disruption in the synchronization of interhemispheric networks, and (ii) greater power in the anterior area for the SLI group (33-36Hz), suggesting an impairment in intrahemispheric synchronization. This would be related to alterations in executive control and attentional modulation, functions strongly associated with activity in the prefrontal cortex [127]. These findings, on the one hand, reinforce previous evidence of structural alterations in lateralized regions (left and right) in children with SLI [22,27]. Additionally, they suggest that these differences are not solely explained by an increase or decrease in certain frequency bands, but by an atypical pattern of oscillatory modulation between regions, which could impact the intra- and inter-hemispheric functional dynamics of the SLI brain.
On the other hand, the results for the 9-12 Hz range, corresponding to the canonical alpha band [128], show that the difference between the central area and the anterior area is greater in ND children, similar to results of Stanojević et al. [76], while the difference between the posterior area and the central area is greater in children with SLI diagnosis. This suggests an antero-posterior alteration of these frequencies and the modulation of oscillatory activity. Previous studies have indicated that alpha rhythm modulation is key for corticocortical and intracortical coordination [129], as well as for the integration of sensory and linguistic information [130,131]. The differences found in this study, regarding the distribution of alpha oscillatory activity, could be related to difficulties in neuronal synchronization between regions associated with processes such as cortical inhibition, attention regulation, and language [130], as well as with the modulation of sensory perception [131] in children with SLI.
While these findings highlight the importance of research on how brain activity in neurodevelopmental disorders such as SLI would reflect alterations in underlying neuronal dynamics, this study presents some limitations that must be considered. Firstly, the small sample size could influence the lack of significance in some of our results, such as MSE, although the observed trend suggests similarities with other disorders such as ADHD [64] and ASD [68]. Also, the different tests used for delimitation of the diagnostic threshold do not permit computing correlations between behavioral tests and EEG-derived parameters. Despite these limitations, the findings of this study provide a better understanding of differences in connectivity, measured indirectly, and the modulation of brain activity, which could have implications for diagnosis and the development of interventions to improve cognitive and linguistic performance in these children.
5. Conclusions
This study reveals significant differences in the brain activity of children with Specific Language Impairment (SLI) compared to children with normo-development (ND). Through the analysis of neuronal complexity and decomposition of spectral power density (PSD), it was observed that, although children with SLI show no notable differences in the adaptability of neural networks (measured by MSE) or in the spectral organization of brain activity (according to the topographies of the AP and P components), there are possible alterations in the balance between cortical excitation and inhibition and the inter and intrahemispheric connectivity of the brain’s AP and P activity. Moreover, the intensity and modulation of oscillatory rhythms, particularly in high frequencies and alpha, suggest dysfunctions in neuronal synchronization, which could be related to the sensory and cognitive processing deficits observed in children with SLI. The present results also highlight the importance of considering the decomposition of PSD in AP and P components for a better insight into understanding EEG impairments in SLI.
Supplementary Materials
The following supporting information can be downloaded at the website of this paper posted on Preprints.org.
Author Contributions
Conceptualización, Brenda Angulo-Ruiz, Elena Rodríguez-Martínez, Ana Gómez-Treviño and Carlos M. Gómez; Curación de datos, Brenda Angulo-Ruiz; Análisis formal, Brenda Angulo-Ruiz and Carlos M. Gómez; Adquisición de financiación, Elena Rodríguez-Martínez and Carlos M. Gómez; Investigación, Brenda Angulo-Ruiz and Carlos M. Gómez; Metodología, Brenda Angulo-Ruiz, Elena Rodríguez-Martínez, Vanesa Muñoz and Carlos M. Gómez; Administración de proyectos, Francisco Ruiz-Martínez and Carlos M. Gómez; Recursos, Elena Rodríguez-Martínez, Francisco Ruiz-Martínez, Ana Gómez-Treviño and Sheyla Andalia Crespo; Software, Brenda Angulo-Ruiz; Supervisión, Elena Rodríguez-Martínez, Francisco Ruiz-Martínez and Carlos M. Gómez; Validación, Vanesa Muñoz and Carlos M. Gómez; Visualización, Brenda Angulo-Ruiz and Ana Gómez-Treviño; Escritura – borrador original, Brenda Angulo-Ruiz, Vanesa Muñoz and Carlos M. Gómez; Redacción, revisión y edición, Brenda Angulo-Ruiz, Elena Rodríguez-Martínez, Francisco Ruiz-Martínez, Vanesa Muñoz, Sheyla Andalia Crespo and Carlos M. Gómez. All authors will be updated at each stage of manuscript processing, including submission, revision, and revision reminder, via emails from our system or the assigned Assistant Editor.
Funding
This research was funded by Agencia Estatal de Investigación, grant number PID2022-139151OB-I00.
Data Availability Statement
Data and code related with the present study is available under reasonable request to the corresponding author (bangulo@us.es)
Acknowledgments
We are grateful to the children, adolescents, and young adults who participated in the present study. We also want to express our gratitude to the Unidad de Desarrollo Infantil y Atención Temprana (UDIATE), affiliated with the Victoria Eugenia Hospital of the Spanish Red Cross, for their valuable assistance in referring children for registration. The authors have reviewed and edited the output and take full responsibility for the content of this publication.
Conflicts of Interest
The authors declare no conflicts of interest.
Abbreviations
The following abbreviations are used in this manuscript:
| ADHD | Attention Deficit Hyperactivity Disorder |
| AP | Aperiodic |
| ASD | Autism Spectrum Disorder |
| ASR | Artifact Subsapace Reconstruction |
| CELF | Clinical Evaluation of Langage Fundamentals |
| DTI | Diffusion Tensor Imaging |
| EEG | Electroencephalogram |
| ERPs | Event-related Potentials |
| FDR | False Discovery Rate |
| fMRI | functional Magnetic Resonance Imaging |
| FOOOF | Fitting Oscillations and One-Over-f |
| fTCD | functional Transcranial Doppler |
| ICA | Independent Component Analysis |
| ITPA | Illinios Test of Psycholinguistic Abilities |
| KBIT | Kaufman Brief Intelligence Test |
| M | Mean |
| MAE | Mean Absolute Error |
| MMN | Mismatch Negativity |
| MSE | Multiscale Entropy |
| ND | Normo-development |
| P | Periodic |
| PLON-R | Navarre Oral Language Test-Revised |
| PSD | Power Spectral Density |
| PPVT-5 | Peabody Picture Vocabulary Test |
| RM-ANOVA | Repeated Measures Analysis of Variance |
| SD | Standard Deviation |
| SE | Sample Entropy |
| SLI | Specific Language Impairment |
| SPECT | Single-Photon Emission Computed Tomography |
| UDIATE | Unidad de Desarrollo Infantil y Atención Temprana |
References
- American Psychiatric Association (2000). Diagnostics and Statistical Manual of Mental Disorders, IV text revision.
- American Psychiatric Association (2012): DSM-V Development. Disponible en: http://www.dsm5.org/ProposedRevision/Pages/proposedrevision.aspx?rid=488.
- Villegas, L.F. (2022). Specific language impairment in Andalusia, Spain: Prevelance by subtype and gender. Revista de Logopedia, Foniatría y Audiología. 42(3), 147-157. [CrossRef]
- Bishop D. V. (2002). The role of genes in the etiology of specific language impairment. Journal of communication disorders, 35(4), 311–328. [CrossRef]
- Bishop D. V. (2009). Genes, cognition, and communication: insights from neurodevelopmental disorders. Annals of the New York Academy of Sciences, 1156(1), 1–18. [CrossRef]
- Bishop D. V. (2013). Cerebral asymmetry and language development: cause, correlate, or consequence?. Science (New York, N.Y.), 340(6138), 1230531. [CrossRef]
- Li, N., & Bartlett, C. W. (2012). Defining the genetic architecture of human developmental language impairment. Life sciences, 90(13-14), 469–475. [CrossRef]
- Tomblin, J. B., Records, N. L., Buckwalter, P., Zhang, X., Smith, E., & O’Brien, M. (1997). Prevalence of specific language impairment in kindergarten children. Journal of speech, language, and hearing research: JSLHR, 40(6), 1245–1260. [CrossRef]
- Pennington, B. F., & Bishop, D. V. (2009). Relations among speech, language, and reading disorders. Annual review of psychology, 60, 283–306. [CrossRef]
- Young, A. R., Beitchman, J. H., Johnson, C., Douglas, L., Atkinson, L., Escobar, M., & Wilson, B. (2002). Young adult academic outcomes in a longitudinal sample of early identified language impaired and control children. Journal of child psychology and psychiatry, and allied disciplines, 43(5), 635–645. [CrossRef]
- Wadman, R., Botting, N., Durkin, K., & Conti-Ramsden, G. (2011a). Changes in emotional health symptoms in adolescents with specific language impairment. International journal of language & communication disorders, 46(6), 641–656. [CrossRef]
- Wadman, R., Durkin, K., & Conti-Ramsden, G. (2011b). Close relationships in adolescents with and without a history of specific language impairment. Language, speech, and hearing services in schools, 42(1), 41–51. [CrossRef]
- Wadman, R., Durkin, K., & Conti-Ramsden, G. (2011c). Social stress in young people with specific language impairment. Journal of adolescence, 34(3), 421–431. [CrossRef]
- Arkkila, E., Rasanen, P., Roine, R. P., & Vilkman, E. (2008). Specific language impairment in childhood is associated with impaired mental and social well-being in adulthood. Logopedics, phoniatrics, vocology, 33(4), 179–189. [CrossRef]
- Tallal, P. (2004). Improving language and literacy is a matter of time. Nature reviews. Neuroscience, 5(9), 721–728. [CrossRef]
- Hsu, H. J., Tomblin, J. B., & Christiansen, M. H. (2014). Impaired statistical learning of non-adjacent dependencies in adolescents with specific language impairment. Frontiers in psychology, 5, 175. [CrossRef]
- Goswami, U. (2019). Speech rhythm and language acquisition: an amplitude modulation phase hierarchy perspective. Annals of the New York Academy of Sciences, 1453(1), 67–78. [CrossRef]
- Abbott, N., & Love, T. (2023). Bridging the Divide: Brain and Behavior in Developmental Language Disorder. Brain sciences, 13(11), 1606. [CrossRef]
- Gauger, L. M., Lombardino, L. J., & Leonard, C. M. (1997). Brain morphology in children with specific language impairment. Journal of speech, language, and hearing research : JSLHR, 40(6), 1272–1284. [CrossRef]
- Herbert, M. R., Ziegler, D. A., Makris, N., Filipek, P. A., Kemper, T. L., Normandin, J. J., Sanders, H. A., Kennedy, D. N., & Caviness, V. S., Jr (2004). Localization of white matter volume increase in autism and developmental language disorder. Annals of neurology, 55(4), 530–540. [CrossRef]
- Bahar, N., Cler, G. J., Krishnan, S., Asaridou, S. S., Smith, H. J., Willis, H. E., Healy, M. P., & Watkins, K. E. (2024). Differences in Cortical Surface Area in Developmental Language Disorder. Neurobiology of language (Cambridge, Mass.), 5(2), 288–314. [CrossRef]
- Badcock, N. A., Bishop, D. V., Hardiman, M. J., Barry, J. G., & Watkins, K. E. (2012). Co-localisation of abnormal brain structure and function in specific language impairment. Brain and language, 120(3), 310–320. [CrossRef]
- Soriano-Mas, C., Pujol, J., Ortiz, H., Deus, J., López-Sala, A., & Sans, A. (2009). Age-related brain structural alterations in children with specific language impairment. Human brain mapping, 30(5), 1626–1636. [CrossRef]
- Lee, J. C., Nopoulos, P. C., & Bruce Tomblin, J. (2013). Abnormal subcortical components of the corticostriatal system in young adults with DLI: a combined structural MRI and DTI study. Neuropsychologia, 51(11), 2154–2161. [CrossRef]
- Krishnan, S., Cler, G. J., Smith, H. J., Willis, H. E., Asaridou, S. S., Healy, M. P., Papp, D., & Watkins, K. E. (2022). Quantitative MRI reveals differences in striatal myelin in children with DLD. eLife, 11, e74242. [CrossRef]
- Hugdahl, K., Gundersen, H., Brekke, C., Thomsen, T., Rimol, L. M., Ersland, L., & Niemi, J. (2004). FMRI brain activation in a finnish family with specific language impairment compared with a normal control group. Journal of speech, language, and hearing research: JSLHR, 47(1), 162–172. [CrossRef]
- de Guibert, C., Maumet, C., Jannin, P., Ferré, J.C., Tréguier, C., Barillot, C., Le Rumeur, E., Allaire, C., Biraben, A. (2011). Abnormal functional lateralization and activity of language brain areas in typical specific language impairment (developmental dysphasia). Brain. Oct;134(Pt 10):3044-58. [CrossRef]
- Ors, M., Ryding, E., Lindgren, M., Gustafsson, P., Blennow, G., & Rosén, I. (2005). SPECT findings in children with specific language impairment. Cortex; a journal devoted to the study of the nervous system and behavior, 41(3), 316–326. [CrossRef]
- Whitehouse, A. J., & Bishop, D. V. (2008). Cerebral dominance for language function in adults with specific language impairment or autism. Brain: a journal of neurology, 131(Pt 12), 3193–3200. [CrossRef]
- Herbert, M.R., Ziegler, D.A., Makris, N., Bakardjiev, A., Hodgson, J., Adrien, K.T., Kennedy, D.N., Filipek, P.A. & Caviness, V.S., Jr. (2003). Largerbrain and white matter volumes in children with developmental language disorder. Developmental Science, 6(4), F11-F22. [CrossRef]
- Vydrova, R., Komarek, V., Sanda, J., Sterbova, K., Jahodova, A., Maulisova, A., Zackova, J., Reissigova, J., Krsek, P., & Kyncl, M. (2015). Structural alterations of the language connectome in children with specific language impairment. Brain and language, 151, 35–41. [CrossRef]
- Roberts, T. P., Heiken, K., Zarnow, D., Dell, J., Nagae, L., Blaskey, L., Solot, C., Levy, S. E., Berman, J. I., & Edgar, J. C. (2014). Left hemisphere diffusivity of the arcuate fasciculus: influences of autism spectrum disorder and language impairment. AJNR. American journal of neuroradiology, 35(3), 587–592. [CrossRef]
- Lee, J. C., Dick, A. S., & Tomblin, J. B. (2020). Altered brain structures in the dorsal and ventral language pathways in individuals with and without developmental language disorder (DLD). Brain imaging and behavior, 14(6), 2569–2586. [CrossRef]
- Bishop, D. V., & McArthur, G. M. (2005). Individual differences in auditory processing in specific language impairment: a follow-up study using event-related potentials and behavioural thresholds. Cortex; a journal devoted to the study of the nervous system and behavior, 41(3), 327–341. [CrossRef]
- Shafer, V. L., Morr, M. L., Datta, H., Kurtzberg, D., & Schwartz, R. G. (2005). Neurophysiological indexes of speech processing deficits in children with specific language impairment. Journal of cognitive neuroscience, 17(7), 1168–1180. [CrossRef]
- Datta, H., Shafer, V. L., Morr, M. L., Kurtzberg, D., & Schwartz, R. G. (2010). Electrophysiological indices of discrimination of long-duration, phonetically similar vowels in children with typical and atypical language development. Journal of speech, language, and hearing research: JSLHR, 53(3), 757–777. [CrossRef]
- Kujala, T., & Leminen, M. (2017). Low-level neural auditory discrimination dysfunctions in specific language impairment-A review on mismatch negativity findings. Developmental cognitive neuroscience, 28, 65–75. [CrossRef]
- Sabisch, B., Hahne, A., Glass, E., von Suchodoletz, W., Friederici, A.D. (2006). Lexical–semantic processes in children with specific language impairment. NeuroReport 17(14), 1511-1514. [CrossRef]
- Haebig, E., Leonard, L., Usler, E., Deevy, P., & Weber, C. (2018). An Initial Investigation of the Neural Correlates of Word Processing in Preschoolers With Specific Language Impairment. Journal of speech, language, and hearing research: JSLHR, 61(3), 729–739. [CrossRef]
- Shafer, V. L., Ponton, C., Datta, H., Morr, M. L., & Schwartz, R. G. (2007). Neurophysiological indices of attention to speech in children with specific language impairment. Clinical neurophysiology: official journal of the International Federation of Clinical Neurophysiology, 118(6), 1230–1243. [CrossRef]
- Shafer, V. L., Schwartz, R. G., & Martin, B. (2011). Evidence of deficient central speech processing in children with specific language impairment: the T-complex. Clinical neurophysiology: official journal of the International Federation of Clinical Neurophysiology, 122(6), 1137–1155. [CrossRef]
- Albrecht, R., Suchodoletz, W., & Uwer, R. (2000). The development of auditory evoked dipole source activity from childhood to adulthood. Clinical neurophysiology: official journal of the International Federation of Clinical Neurophysiology, 111(12), 2268–2276. [CrossRef]
- Shaheen, E. A., Shohdy, S. S., Abd Al Raouf, M., Mohamed El Abd, S., & Abd Elhamid, A. (2011). Relation between language, audio-vocal psycholinguistic abilities and P300 in children having specific language impairment. International journal of pediatric otorhinolaryngology, 75(9), 1117–1122. [CrossRef]
- Evans, J. L., Selinger, C., & Pollak, S. D. (2011). P300 as a measure of processing capacity in auditory and visual domains in specific language impairment. Brain research, 1389, 93–102. [CrossRef]
- Gasser, T., Verleger, R., Bächer, P. and Sroka, L. (1988). Development of the EEG of school-age children and adolescents. I. Analysis of band power. Electroencephalography and clinical neurophysiology, 69(2), 91–99. [CrossRef]
- Whitford, T. J., Rennie, C. J., Grieve, S. M., Clark, C. R., Gordon, E., and Williams, L. M. (2007). Brain maturation in adolescence: concurrent changes in neuroanatomy and neurophysiology. Human brain mapping, 28(3), 228–237. [CrossRef]
- Segalowitz, S. J., Santesso, D. L., & Jetha, M. K. (2010). Electrophysiological changes during adolescence: a review. Brain and cognition, 72(1), 86–100. [CrossRef]
- Miskovic, V., Ma, X., Chou, C. A., Fan, M., Owens, M., Sayama, H., & Gibb, B. E. (2015). Developmental changes in spontaneous electrocortical activity and network organization from early to late childhood. NeuroImage, 118, 237–247. [CrossRef]
- Rodríguez-Martínez, E. I., Ruiz-Martínez, F. J., Barriga Paulino, C. I., & Gómez, C. M. (2017). Frequency shift in topography of spontaneous brain rhythms from childhood to adulthood. Cognitive neurodynamics, 11(1), 23–33. [CrossRef]
- Rodríguez-Martínez, E. I., Angulo-Ruiz, B. Y., Arjona-Valladares, A., Rufo, M., Gómez-González, J., & Gómez, C. M. (2020). Frequency coupling of low and high frequencies in the EEG of ADHD children and adolescents in closed and open eyes conditions. Research in developmental disabilities, 96, 103520. [CrossRef]
- Lea-Carnall, C. A., Montemurro, M. A., Trujillo-Barreto, N. J., Parkes, L. M., & El-Deredy, W. (2016). Cortical Resonance Frequencies Emerge from Network Size and Connectivity. PLoS computational biology, 12(2), e1004740. [CrossRef]
- Szostakiwskyj, J. M. H., Willatt, S. E., Cortese, F., & Protzner, A. B. (2017). The modulation of EEG variability between internally- and externally-driven cognitive states varies with maturation and task performance. PloS one, 12(7), e0181894. [CrossRef]
- Barry, R. J., Clarke, A. R., Johnstone, S. J., McCarthy, R., & Selikowitz, M. (2009). Electroencephalogram theta/beta ratio and arousal in attention-deficit/hyperactivity disorder: evidence of independent processes. Biological psychiatry, 66(4), 398–401. [CrossRef]
- Newson, J. J., & Thiagarajan, T. C. (2019). EEG Frequency Bands in Psychiatric Disorders: A Review of Resting State Studies. Frontiers in human neuroscience, 12, 521. [CrossRef]
- Clarke, A. R., Barry, R. J., & Johnstone, S. (2020). Resting state EEG power research in Attention-Deficit/Hyperactivity Disorder: A review update. Clinical neurophysiology: official journal of the International Federation of Clinical Neurophysiology, 131(7), 1463–1479. [CrossRef]
- Dawson, G., Klinger, L. G., Panagiotides, H., Lewy, A., & Castelloe, P. (1995). Subgroups of autistic children based on social behavior display distinct patterns of brain activity. Journal of abnormal child psychology, 23(5), 569–583. [CrossRef]
- Daoust, A. M., Limoges, E., Bolduc, C., Mottron, L., & Godbout, R. (2004). EEG spectral analysis of wakefulness and REM sleep in high functioning autistic spectrum disorders. Clinical neurophysiology: official journal of the International Federation of Clinical Neurophysiology, 115(6), 1368–1373. [CrossRef]
- Chan, A. S., Sze, S. L., & Cheung, M. C. (2007). Quantitative electroencephalographic profiles for children with autistic spectrum disorder. Neuropsychology, 21(1), 74–81. [CrossRef]
- Pop-Jordanova, N., Zorcec, T., Demerdzieva, A., & Gucev, Z. (2010). QEEG characteristics and spectrum weighted frequency for children diagnosed as autistic spectrum disorder. Nonlinear biomedical physics, 4(1), 4. [CrossRef]
- Wang, J., Barstein, J., Ethridge, L. E., Mosconi, M. W., Takarae, Y., & Sweeney, J. A. (2013). Resting state EEG abnormalities in autism spectrum disorders. Journal of neurodevelopmental disorders, 5(1), 24. [CrossRef]
- Sohn, H., Kim, I., Lee, W., Peterson, B. S., Hong, H., Chae, J. H., Hong, S., & Jeong, J. (2010). Linear and non-linear EEG analysis of adolescents with attention-deficit/hyperactivity disorder during a cognitive task. Clinical neurophysiology: official journal of the International Federation of Clinical Neurophysiology, 121(11), 1863–1870. [CrossRef]
- Sokunbi, M. O., Fung, W., Sawlani, V., Choppin, S., Linden, D. E., & Thome, J. (2013). Resting state fMRI entropy probes complexity of brain activity in adults with ADHD. Psychiatry research, 214(3), 341–348. [CrossRef]
- Rezaeezadeh, M., Shamekhi, S., & Shamsi, M. (2020). Attention Deficit Hyperactivity Disorder Diagnosis using non-linear univariate and multivariate EEG measurements: a preliminary study. Physical and engineering sciences in medicine, 43(2), 577–592. [CrossRef]
- Angulo-Ruiz, B. Y., Muñoz, V., Rodríguez-Martínez, E. I., Cabello-Navarro, C., & Gómez, C. M. (2022). Multiscale entropy of ADHD children during resting state condition. Cognitive neurodynamics, 17(4), 869–891. [CrossRef]
- Chu, Y. J., Chang, C. F., Shieh, J. S., & Lee, W. T. (2017). The Potential Application of Multiscale Entropy Analysis of Electroencephalography in Children with Neurological and Neuropsychiatric Disorders. Entropy (Basel, Switzerland), 19(8), 428. [CrossRef]
- Liu, T., Chen, Y., Chen, D., Li, C., Qiu, Y., & Wang, J. (2017). Altered electroencephalogram complexity in autistic children shown by the multiscale entropy approach. Neuroreport, 28(3), 169–173. [CrossRef]
- Milne, E., Gomez, R., Giannadou, A., & Jones, M. (2019). Atypical EEG in autism spectrum disorder: Comparing a dimensional and a categorical approach. Journal of abnormal psychology, 128(5), 442–452. [CrossRef]
- Angulo-Ruiz, B.Y., Ruiz-Martínez, F.J., Rodríguez-Martínez, E.I. et al. (2023) Linear and Non-linear Analyses of EEG in a Group of ASD Children During Resting State Condition. Brain Topogr 36, 736–749. [CrossRef]
- DiStefano, C., Dickinson, A., Baker, E., & Jeste, S. S. (2019). EEG Data Collection in Children with ASD: The Role of State in Data Quality and Spectral Power. Research in autism spectrum disorders, 57, 132–144. [CrossRef]
- Pierce, S., Kadlaskar, G., Edmondson, D. A., McNally Keehn, R., Dydak, U., & Keehn, B. (2021). Associations between sensory processing and electrophysiological and neurochemical measures in children with ASD: an EEG-MRS study. Journal of neurodevelopmental disorders, 13(1), 5. [CrossRef]
- Takahashi, T., Yoshimura, Y., Hiraishi, H., Hasegawa, C., Munesue, T., Higashida, H., Minabe, Y., & Kikuchi, M. (2016). Enhanced brain signal variability in children with autism spectrum disorder during early childhood. Human brain mapping, 37(3), 1038–1050. [CrossRef]
- Bosl, W.J., Loddenkemper, T., Nelson, C.A. (2017) Nonlinear EEG biomarker profiles for autism and absence epilepsy. Neuropsychiatr Electrophysiol 3:1. [CrossRef]
- Nenadović, V., Stokić, M., Vuković, M., Đoković, S., & Subotić, M. (2014). Cognitive and electrophysiological characteristics of children with specific language impairment and subclinical epileptiform electroencephalogram. Journal of Clinical and Experimental Neuropsychology, 36(9), 981–991. [CrossRef]
- Chutko, L.S., Surushkina, S.Y., Yakovenko, E.A., Sergeev, A.V., Rozhkova, A.V., Anosova, L.V., Chistyakova, N.P. (2015). Clinical and electroencephalographic characteristics of specific language impairment in children and an evaluation of the efficacy of cerebrolysin. Zh Nevrol Psikhiatr Im S S Korsakova 115(7): 98-102. [CrossRef]
- Fatić, S., Stanojević, N., Stokić, M., Nenadović, V., Jeličić, L., Bilibajkić, R., Gavrilović, A., Maksimović, S., Adamović, T., & Subotić, M. (2022). Electroencephalography correlates of word and non-word listening in children with specific language impairment: An observational study20F0. Medicine, 101(46), e31840. [CrossRef]
- Stanojevic, N., Fatic, S., Jelicic, L., Nenadovic, V., Stokic, M., Bilibajkic, R., Subotic, M., Boskovic Matic, T., Konstantinovic, L., & Cirovic, D. (2023). Resting-state EEG alpha rhythm spectral power in children with specific language impairment: a cross-sectional study. Journal of applied biomedicine, 21(3), 113–120. [CrossRef]
- Donoghue, T., Haller, M., Peterson, E. J., Varma, P., Sebastian, P., Gao, R., Noto, T., Lara, A. H., Wallis, J. D., Knight, R. T., Shestyuk, A., & Voytek, B. (2020). Parameterizing neural power spectra into periodic and aperiodic components. Nature neuroscience, 23(12), 1655–1665. [CrossRef]
- McSweeney, M., Morales, S., Valadez, E. A., Buzzell, G. A., Yoder, L., Fifer, W. P., Pini, N., Shuffrey, L. C., Elliott, A. J., Isler, J. R., & Fox, N. A. (2023). Age-related trends in aperiodic EEG activity and alpha oscillations during early- to middle-childhood. NeuroImage, 269, 119925. [CrossRef]
- Buzsáki, G., Anastassiou, C. A., & Koch, C. (2012). The origin of extracellular fields and currents--EEG, ECoG, LFP and spikes. Nature reviews. Neuroscience, 13(6), 407–420. [CrossRef]
- Gao, R., Peterson, E. J., and Voytek, B. (2017). Inferring synaptic excitation/inhibition balance from field potentials. NeuroImage, 158, 70–78. [CrossRef]
- Robertson, M. M., Furlong, S., Voytek, B., Donoghue, T., Boettiger, C. A., & Sheridan, M. A. (2019). EEG power spectral slope differs by ADHD status and stimulant medication exposure in early childhood. Journal of neurophysiology, 122(6), 2427–2437. 6. [CrossRef]
- Pertermann, M., Bluschke, A., Roessner, V., & Beste, C. (2019). The Modulation of Neural Noise Underlies the Effectiveness of Methylphenidate Treatment in Attention-Deficit/Hyperactivity Disorder. Biological psychiatry. Cognitive neuroscience and neuroimaging, 4(8), 743–750. [CrossRef]
- Mamiya, P. C., Arnett, A. B., & Stein, M. A. (2021). Precision Medicine Care in ADHD: The Case for Neural Excitation and Inhibition. Brain sciences, 11(1), 91. [CrossRef]
- Ostlund, B. D., Alperin, B. R., Drew, T., & Karalunas, S. L. (2021). Behavioral and cognitive correlates of the aperiodic (1/f-like) exponent of the EEG power spectrum in adolescents with and without ADHD. Developmental cognitive neuroscience, 48, 100931. [CrossRef]
- Levin, A. R., Naples, A. J., Scheffler, A. W., Webb, S. J., Shic, F., Sugar, C. A., Murias, M., Bernier, R. A., Chawarska, K., Dawson, G., Faja, S., Jeste, S., Nelson, C. A., McPartland, J. C., & Şentürk, D. (2020). Day-to-Day Test-Retest Reliability of EEG Profiles in Children With Autism Spectrum Disorder and Typical Development. Frontiers in integrative neuroscience, 14, 21. [CrossRef]
- Wiig E. H., Semel E., Secord W. A. (2013). Clinical Evaluation of Language Fundamentals–Fifth Edition (CELF-5). Bloomington, MN: NCS Pearson.
- Aguinaga Ayerra, G. (2005). PLON-R:prueba de lenguaje oral navarra revisada (2a ed.). TEA.
- Kirk, S. A., & McCarthy, J. J. (1961). The Illinois test of psycholinguistic abilities--an approach to differential diagnosis. American journal of mental deficiency, 66, 399–412.
- Dunn, L. M. (1959). Peabody Picture Vocabulary Test. American Guidance Service.
- Kaufman, A.S. & Kaufman, N.L. (2004) KBIT: Kaufman Brief Intelligence Test (KBIT Spanish Version). ASD Editions, Madrid.
- Delorme, A. & Makeig, S. (2004). EEGLAB: an open source toolbox for analysis of single-trial EEG dynamics including independent component analysis. Journal of neuroscience methods, 134(1), 9–21. [CrossRef]
- Mullen, T. R., Kothe, C. A., Chi, Y. M., Ojeda, A., Kerth, T., Makeig, S., Jung, T. P., & Cauwenberghs, G. (2015). Real-Time Neuroimaging and Cognitive Monitoring Using Wearable Dry EEG. IEEE transactions on bio-medical engineering, 62(11), 2553–2567. [CrossRef]
- Bell, A. J. & Sejnowski, T. J. (1995). An information-maximization approach to blind separation and blind deconvolution. Neural computation, 7(6), 1129–1159. [CrossRef]
- Amari, S., Cichocki, A., and Yang, H.H. (1995). A New Learning Algorithm for Blind Signal Separation. NIPS.
- Pion-Tonachini, L., Kreutz-Delgado, K., & Makeig, S. (2019). ICLabel: An automated electroencephalographic independent component classifier, dataset, and website. NeuroImage, 198, 181–197. [CrossRef]
- Malik, J. (2022). Multiscale sample entropy. https://www.mathworks.com/matlabcentral/fileexchange/62706-multiscale-sample-entropy, MATLAB Central File Exchange.
- Costa, M., Goldberger, A.L. & Peng, C.K. (2005) Multiscale entropy analysis of biological signals. Phys Rev Lett 71(021906):753. [CrossRef]
- Richman, J. S., & Moorman, J. R. (2000). Physiological time-series analysis using approximate entropy and sample entropy. American journal of physiology. Heart and circulatory physiology, 278(6), H2039–H2049. [CrossRef]
- McIntosh, A. R., Kovacevic, N., & Itier, R. J. (2008). Increased brain signal variability accompanies lower behavioral variability in development. PLoS computational biology, 4(7), e1000106. [CrossRef]
- Miskovic, V., Owens, M., Kuntzelman, K., & Gibb, B. E. (2016). Charting moment-to-moment brain signal variability from early to late childhood. Cortex; a journal devoted to the study of the nervous system and behavior, 83, 51–61. [CrossRef]
- Kloosterman, N.A., Kosciessa, J.Q., Lindenberger, U., Fahrenfort, J.J., Garrett, D.D. (2019). Boosting brain signal variability underlies liberal shifts in decision bias. Biorxiv. [CrossRef]
- Kosciessa, J. Q., Kloosterman, N. A., & Garrett, D. D. (2020). Standard multiscale entropy reflects neural dynamics at mismatched temporal scales: What’s signal irregularity got to do with it?. PLoS computational biology, 16(5), e1007885. [CrossRef]
- Papaioannou, A. G., Kalantzi, E., Papageorgiou, C. C., Korombili, K., Βokou, A., Pehlivanidis, A., Papageorgiou, C. C., & Papaioannou, G. (2021). Complexity analysis of the brain activity in Autism Spectrum Disorder (ASD) and Attention Deficit Hyperactivity Disorder (ADHD) due to cognitive loads/demands induced by Aristotle’s type of syllogism/reasoning. A Power Spectral Density and multiscale entropy (MSE) analysis. Heliyon, 7(9), e07984. [CrossRef]
- Garrett, D. D., Samanez-Larkin, G. R., MacDonald, S. W., Lindenberger, U., McIntosh, A. R., & Grady, C. L. (2013). Moment-to-moment brain signal variability: a next frontier in human brain mapping?. Neuroscience and biobehavioral reviews, 37(4), 610–624. [CrossRef]
- Bosl, W.J., Loddenkemper, T., Vieluf, S. (2022). Coarse-graining and the Haar wavelet transform for multiscale analysis. Biolectronic Medicine. [CrossRef]
- Angulo-Ruiz, B. Y., Rodríguez-Martínez, E. I., Muñoz, V., & Gómez, C. M. (2024). Unveiling the hidden electroencephalographical rhythms during development: Aperiodic and Periodic activity in healthy subjects. Clinical neurophysiology: official journal of the International Federation of Clinical Neurophysiology, 169, 53–64. [CrossRef]
- Ostlund, B., Donoghue, T., Anaya, B., Gunther, K. E., Karalunas, S. L., Voytek, B., and Pérez-Edgar, K. E. (2022). Spectral parameterization for studying neurodevelopment: How and why. Developmental cognitive neuroscience, 54, 101073. [CrossRef]
- Cohen, J. (1988). Statistical power analysis for the behavioral sciences, 2nd edn.
- Benjamini, Y. & Hochberg, Y. (1995). Controlling the false discovery rate: a practical and powerful approach to multiple testing. J R Stat Soc 57(1):289–300. [CrossRef]
- Jacob, M.S., Roach, B.J., Sargent, K., Mathalon, D.H., & Ford, J.M. (2021), Aperiodic measures of neural excitability are associated with anticorrelated hemodynamic networks at rest: a combined EEG-fMRI study. [CrossRef]
- Hill, A. T., Clark, G. M., Bigelow, F. J., Lum, J. A. G., & Enticott, P. G. (2022). Periodic and aperiodic neural activity displays age-dependent changes across early-to-middle childhood. Developmental cognitive neuroscience, 54, 101076. [CrossRef]
- Manning, J. R., Jacobs, J., Fried, I., & Kahana, M. J. (2009). Broadband shifts in local field potential power spectra are correlated with single-neuron spiking in humans. The Journal of neuroscience: the official journal of the Society for Neuroscience, 29(43), 13613–13620. [CrossRef]
- Miller, K. J., Honey, C. J., Hermes, D., Rao, R. P., denNijs, M., & Ojemann, J. G. (2014). Broadband changes in the cortical surface potential track activation of functionally diverse neuronal populations. NeuroImage, 85 Pt 2(0 2), 711–720. [CrossRef]
- Voytek, B. & Knight, R. T. (2015). Dynamic network communication as a unifying neural basis for cognition, development, aging, and disease. Biological psychiatry, 77(12), 1089–1097. [CrossRef]
- Buckner, R. L., Andrews-Hanna, J. R., & Schacter, D. L. (2008). The brain’s default network: anatomy, function, and relevance to disease. Annals of the New York Academy of Sciences, 1124, 1–38. [CrossRef]
- Proal, E., Alvarez-Segura, M., de la Iglesia-Vayá, M., Martí-Bonmatí, L., Castellanos, F. X., & Spanish Resting State Network (2011). Actividad funcional cerebral en estado de reposo: redes en conexion [Functional cerebral activity in a state of rest: connectivity networks]. Revista de neurologia, 52 Suppl 1(0 1), S3–S10.
- Wilke, M., Hauser, T. K., Krägeloh-Mann, I., & Lidzba, K. (2014). Specific impairment of functional connectivity between language regions in former early preterms. Human brain mapping, 35(7), 3372–3384. [CrossRef]
- Barnes-Davis, M. E., Williamson, B. J., Merhar, S. L., Holland, S. K., & Kadis, D. S. (2020). Rewiring the extremely preterm brain: Altered structural connectivity relates to language function. NeuroImage. Clinical, 25, 102194. [CrossRef]
- Chen, A. C., Feng, W., Zhao, H., Yin, Y., & Wang, P. (2008). EEG default mode network in the human brain: spectral regional field powers. NeuroImage, 41(2), 561–574. [CrossRef]
- Gómez, C. M., Marco-Pallarés, J., & Grau, C. (2006). Location of brain rhythms and their modulation by preparatory attention estimated by current density. Brain research, 1107(1), 151–160. [CrossRef]
- Rodríguez-Martinez, E. I., Barriga-Paulino, C. I., Zapata, M. I., Chinchilla, C., López-Jiménez, A. M., & Gómez, C. M. (2012). Narrow band quantitative and multivariate electroencephalogram analysis of peri-adolescent period. BMC neuroscience, 13, 104. [CrossRef]
- Finneran, D. A., Francis, A. L., & Leonard, L. B. (2009). Sustained attention in children with specific language impairment (SLI). Journal of speech, language, and hearing research: JSLHR, 52(4), 915–929. [CrossRef]
- Verche, B. E., Hernández, E.S., Quintero, F.I. & Acosta, R.V.M. (2013). Alteraciones en la memoria en el Trastorno Específico del Lenguaje. Una perspectiva neuropsicológica. Revista de Logopedia, foniatría y audiología. 33, 4, 179-185. [CrossRef]
- Quintero, I., Hernández, S., Verche, E., Acosta, V. & Hernández, A. (2013). Disfunción ejecutiva en el Trastorno Específico del Lenguaje. Revista de Logopedia, Foniatría y Audiología. 33, 4, 172-178. [CrossRef]
- Rodríguez, A., Ramírez, S.G.M. & Expósito, H. (2017). Funciones ejecutivas y lenguaje en subtipos de niños con trastorno específico del lenguaje. Neurología. 32(6), 355-362. [CrossRef]
- Bosman, C. A., Lansink, C. S., & Pennartz, C. M. (2014). Functions of gamma-band synchronization in cognition: from single circuits to functional diversity across cortical and subcortical systems. The European journal of neuroscience, 39(11), 1982–1999. [CrossRef]
- Friedman, N. P., & Robbins, T. W. (2022). The role of prefrontal cortex in cognitive control and executive function. Neuropsychopharmacology : official publication of the American College of Neuropsychopharmacology, 47(1), 72–89. [CrossRef]
- Mazza, A., Dal Monte, O., Schintu, S., Colombo, S., Michielli, N., Sarasso, P., Törlind, P., Cantamessa, M., Montagna, F., & Ricci, R. (2023). Beyond alpha-band: The neural correlate of creative thinking. Neuropsychologia, 179, 108446. [CrossRef]
- Hindriks, R., van Putten, M. J. A. M., & Deco, G. (2014). Intra-cortical propagation of EEG alpha oscillations. NeuroImage, 103, 444–453. [CrossRef]
- Klimesch, W. (2012). α-band oscillations, attention, and controlled access to stored information. Trends in cognitive sciences, 16(12), 606–617. [CrossRef]
- London, R. E., Benwell, C. S. Y., Cecere, R., Quak, M., Thut, G., & Talsma, D. (2022). EEG alpha power predicts the temporal sensitivity of multisensory perception. The European journal of neuroscience, 55(11-12), 3241–3255. [CrossRef]
Figure 1.
A) Multiscale Entropy (MSE) for nine considered areas in each group (Normo-development (ND) and Specific Language Impairment (SLI)). B) Marginal Means of MSE collapsing the electrodes across the antero-posterior dimension to observe the laterality effects reported in the RM-ANOVA. (Supplementary Table S3).
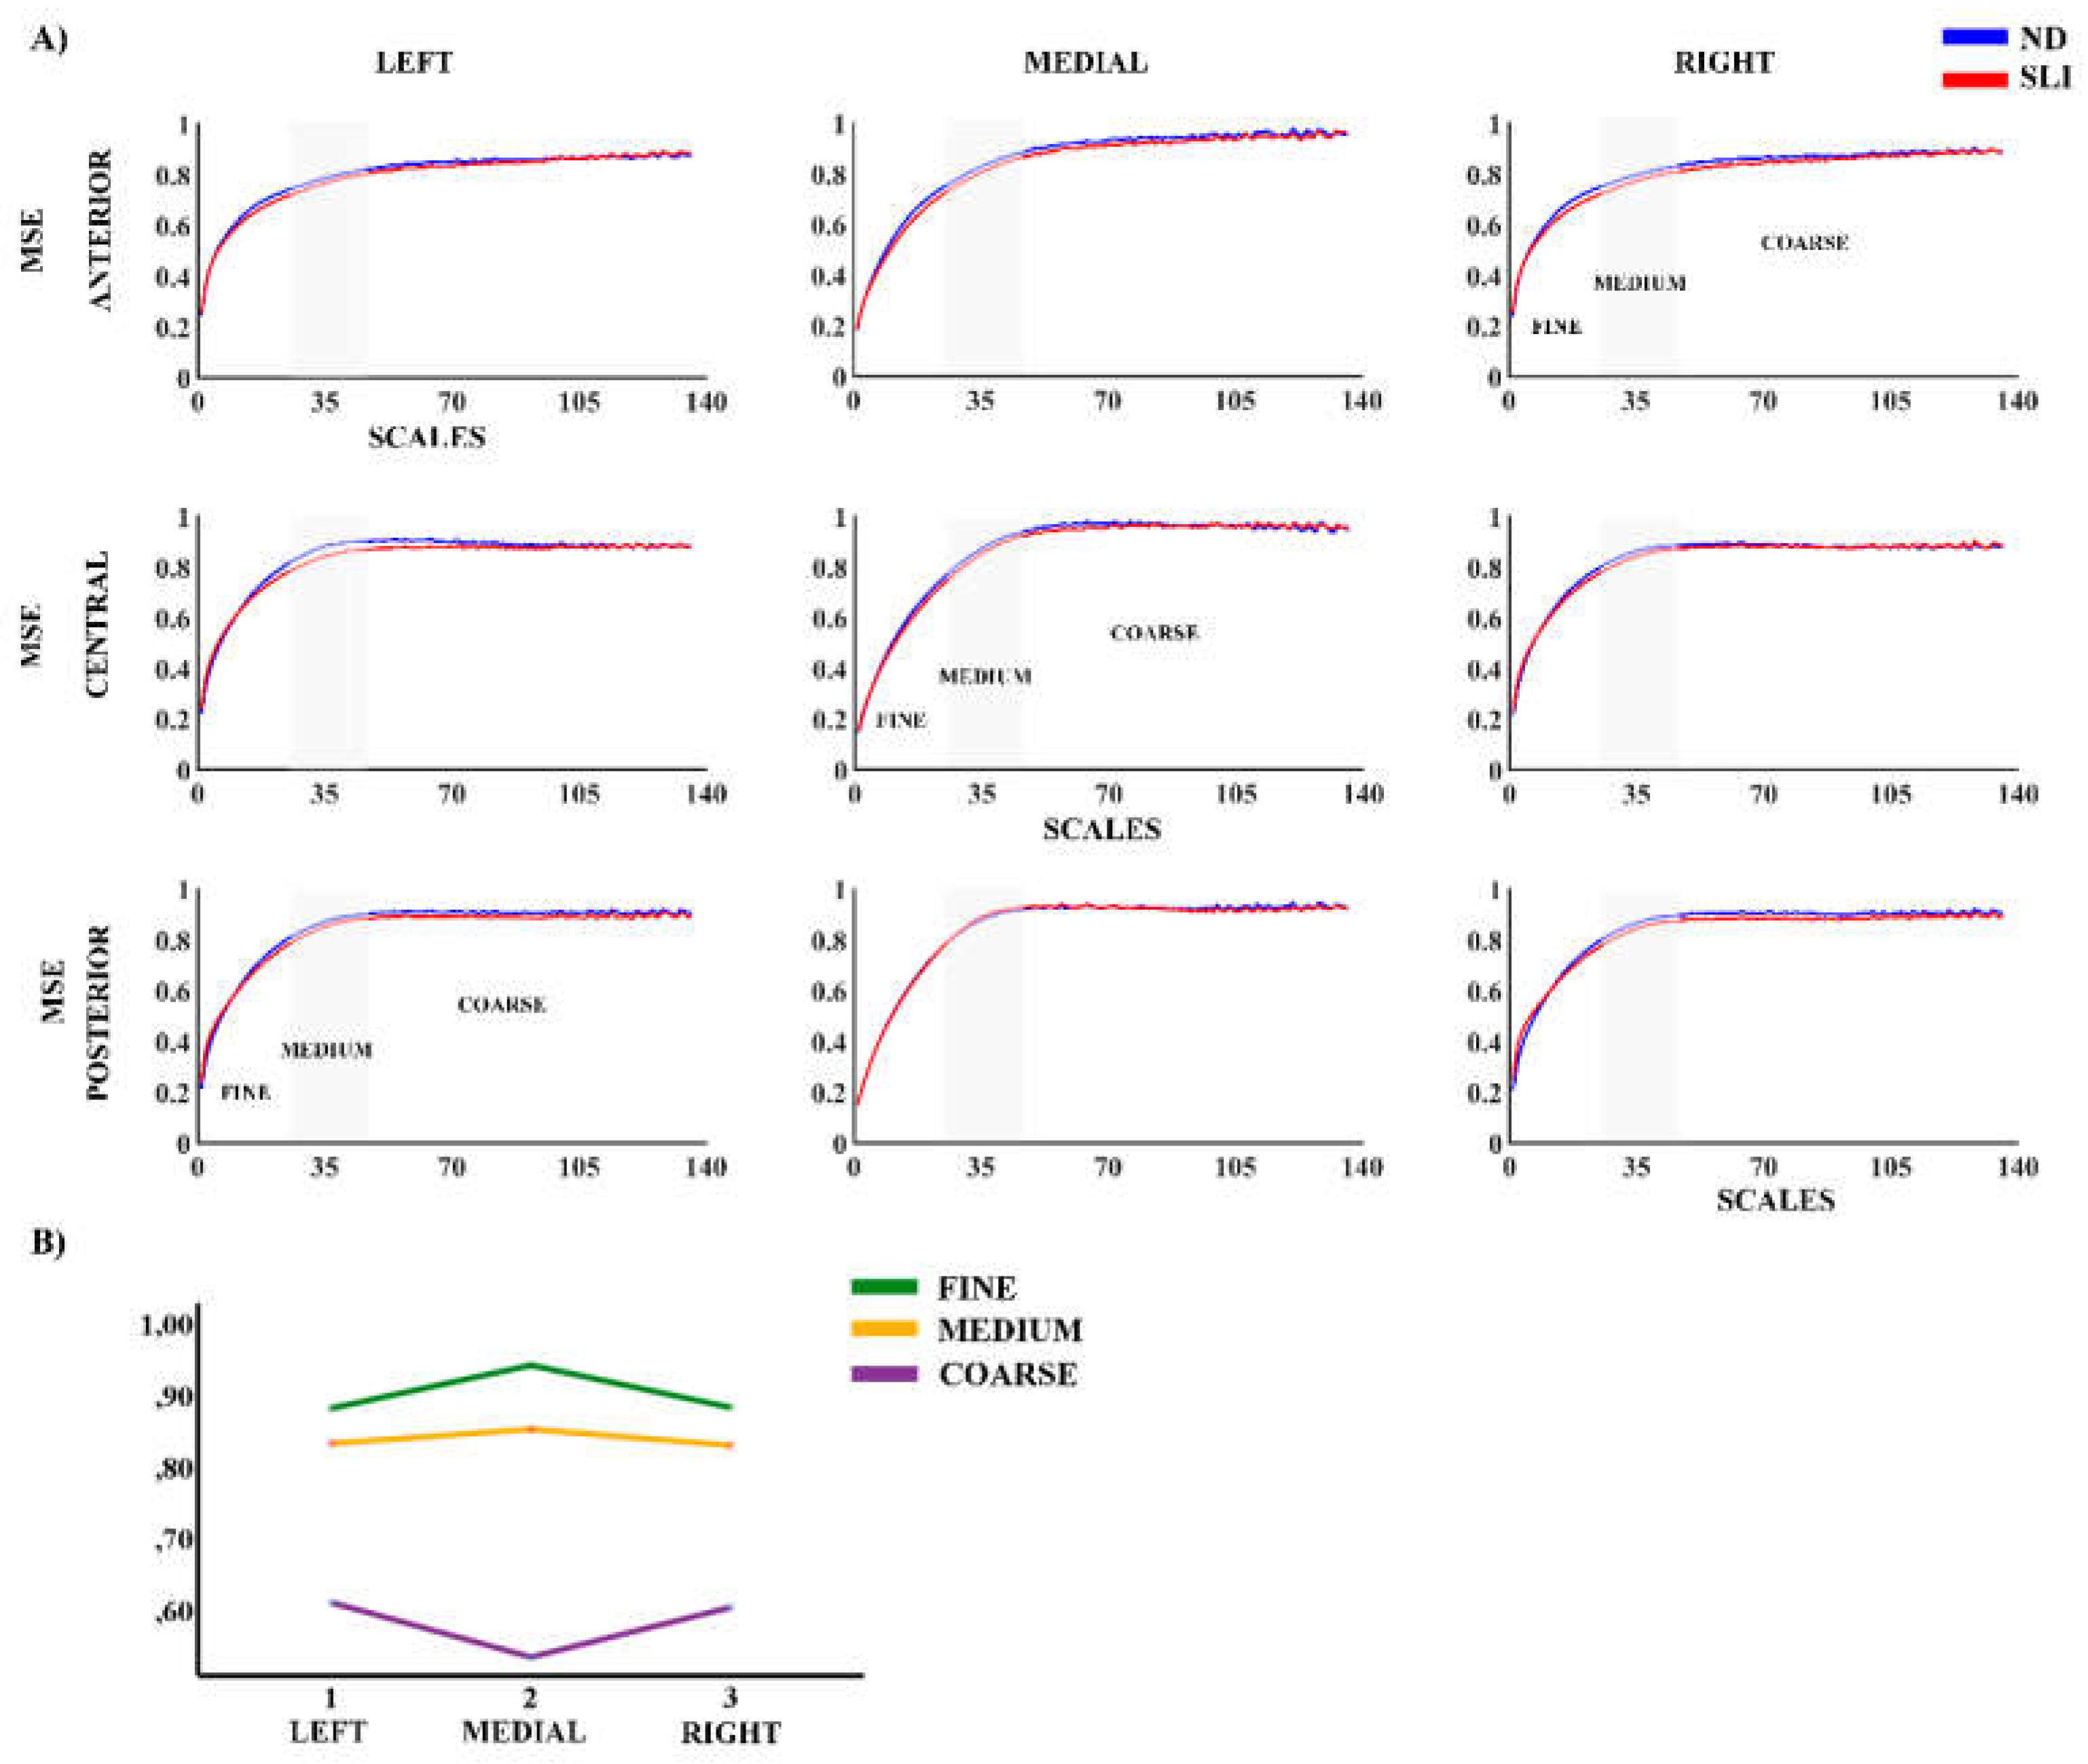
Figure 2.
Topographies of the offset and exponent parameters for each group (Normo-development (ND) and Specific Language Impairment (SLI)) and the differences between the groups (ND-SLI). The asterisk indicates the interaction of the effects of laterality × group in the RM-ANOVA (Marginal means are represented in the inset of the inferior right corner for this significant interaction). .
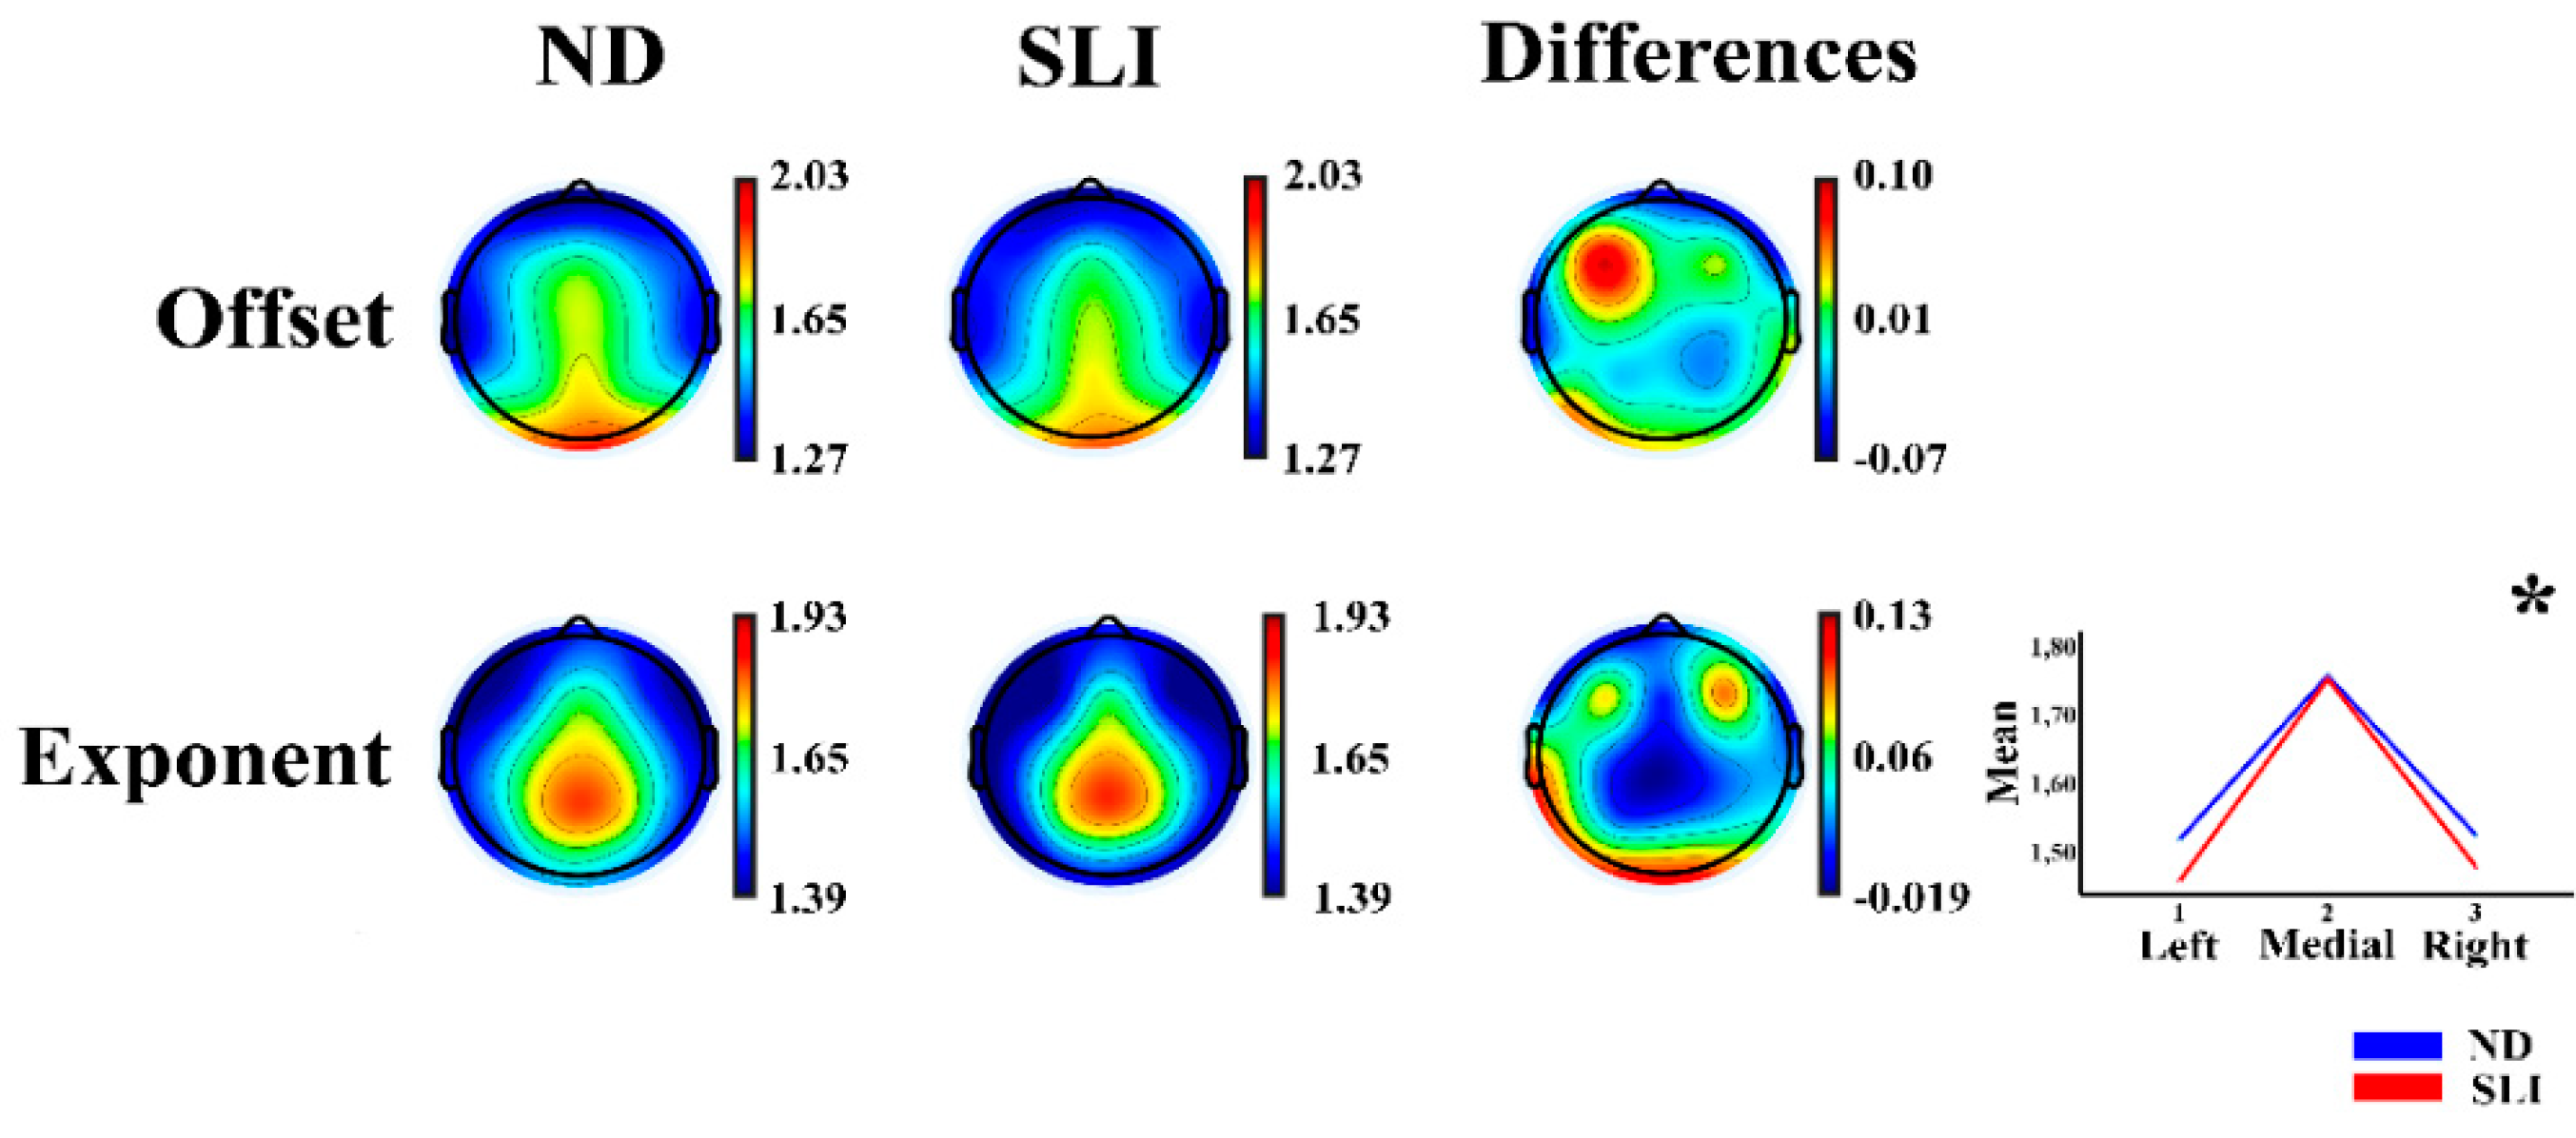
Figure 3.
A) Aperiodic Component (AP) of the PSD across all frequencies and in each considered area for the ND group (blue line) and the SLI group (red line). B) The marginal means of the AP PSD of the frequencies that showed significant effects of the interaction laterality × group in the RM-ANOVA.
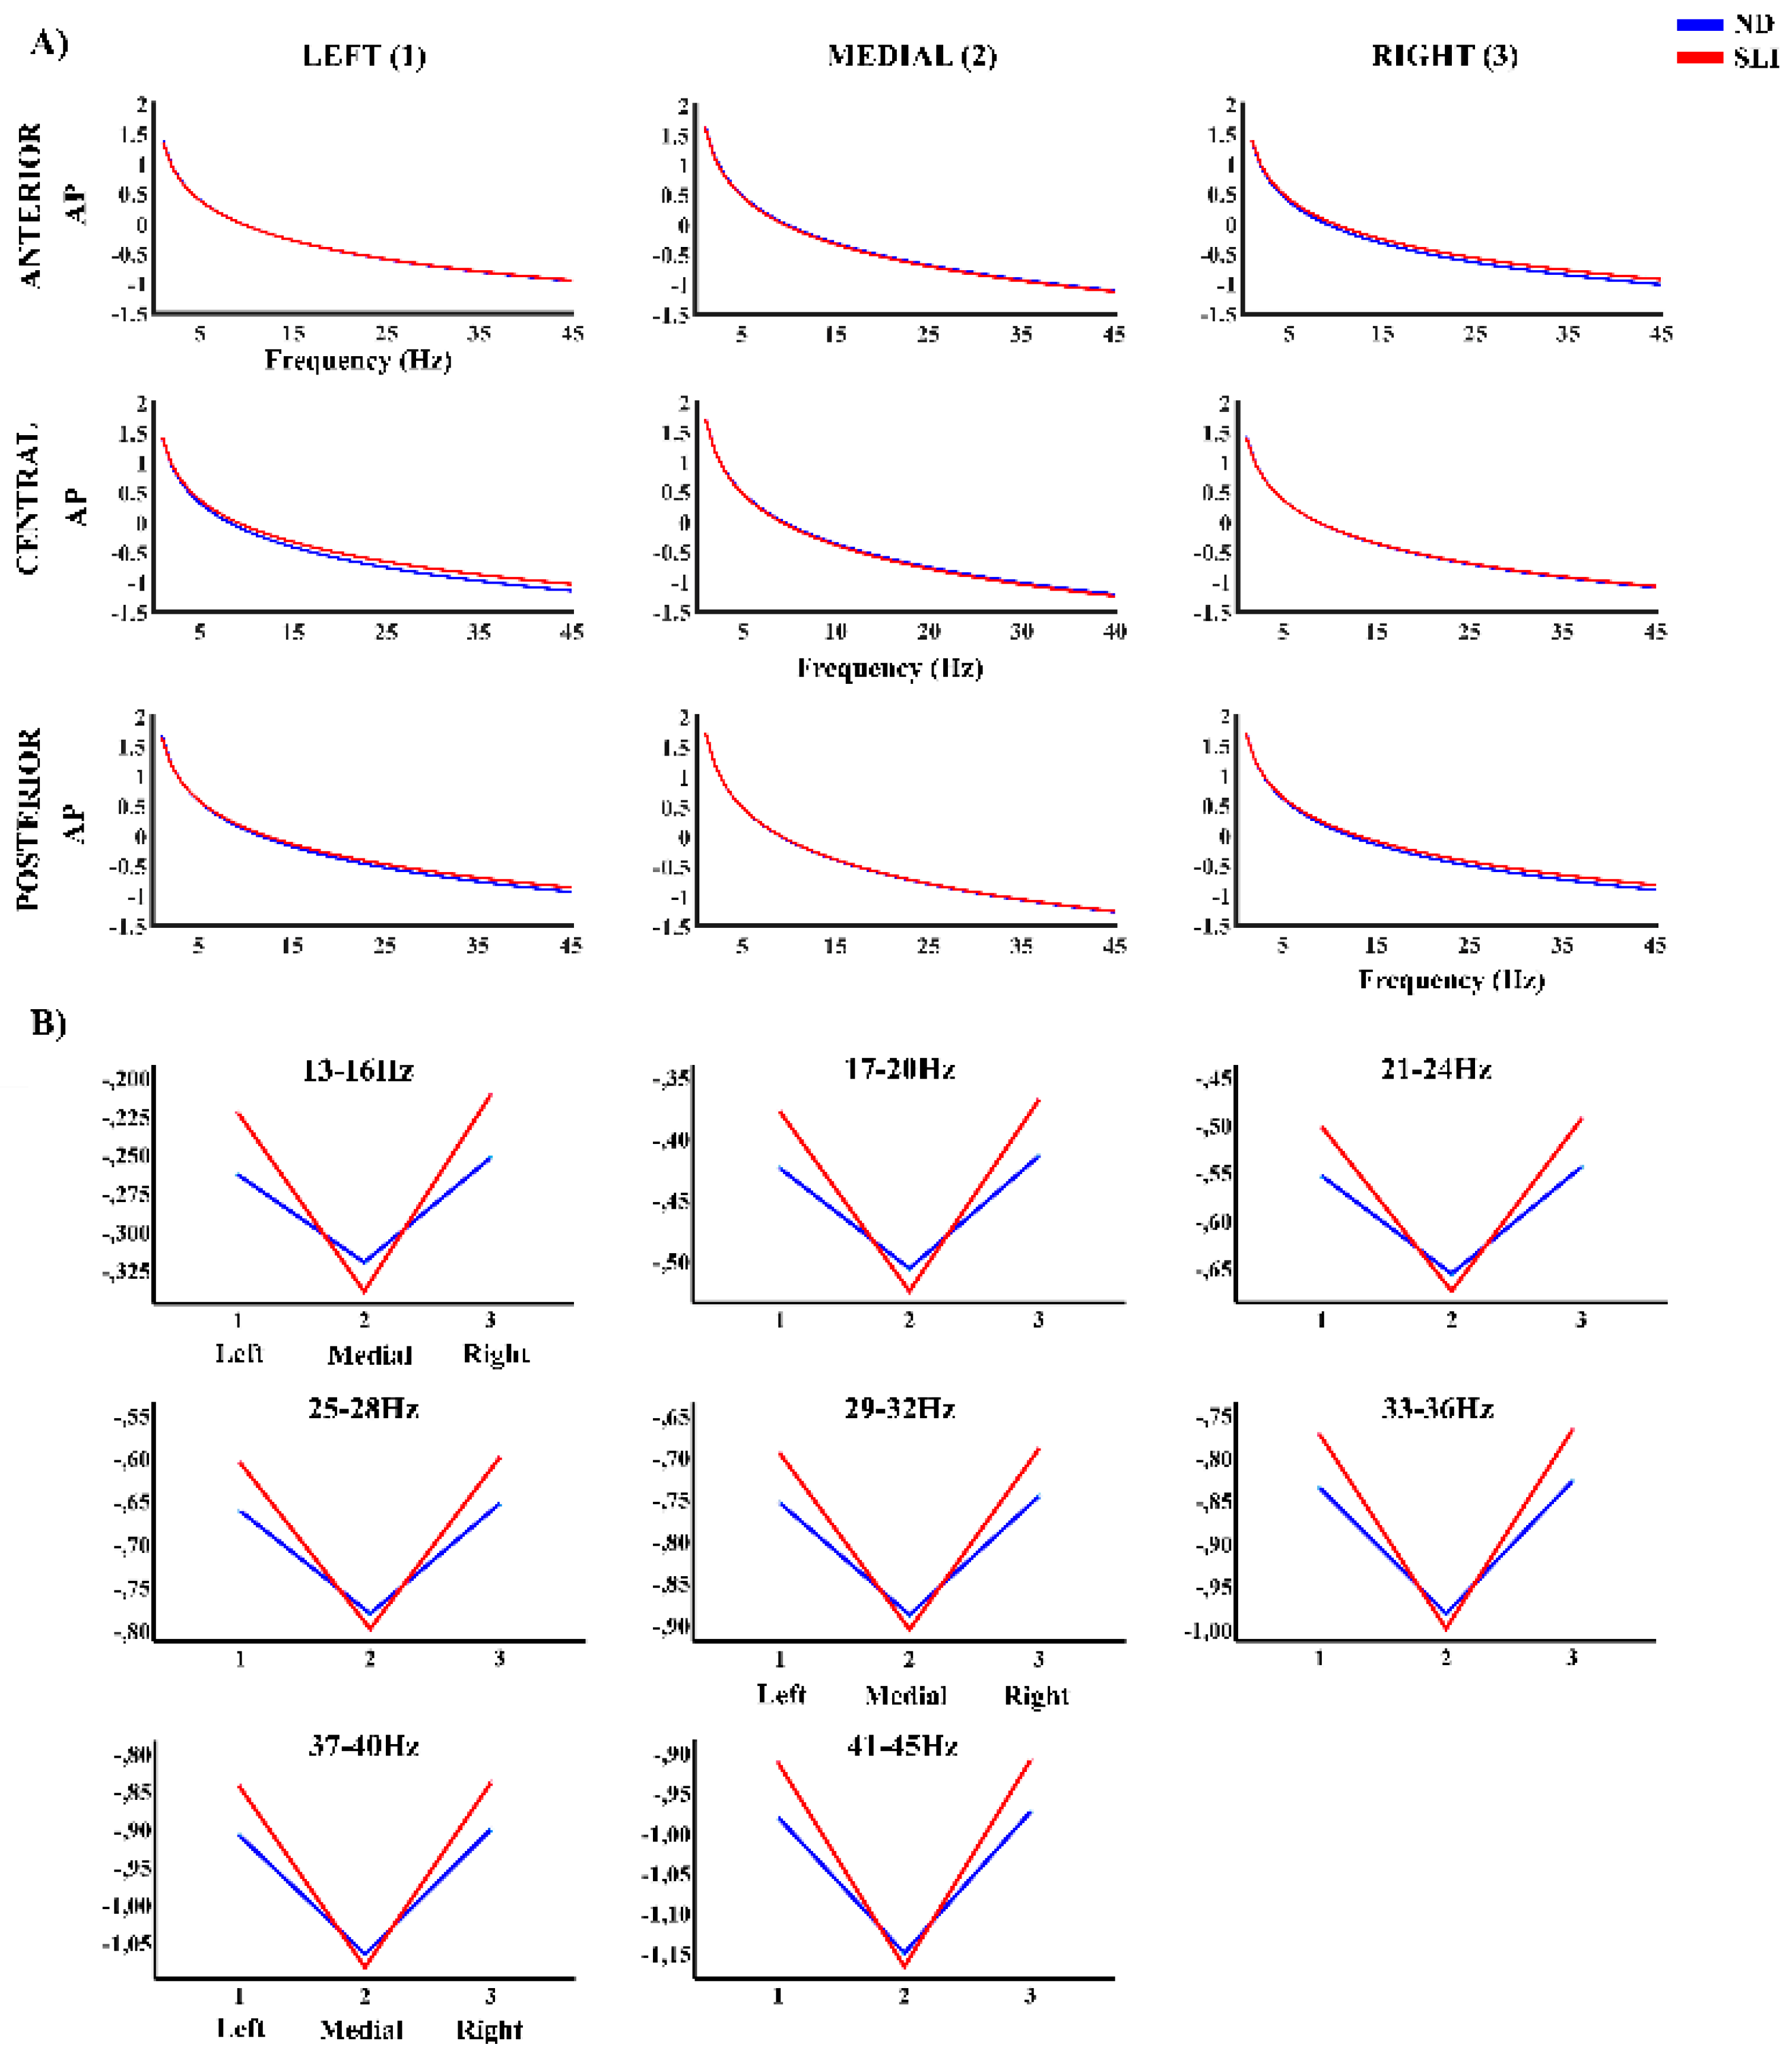
Figure 4.
Topographies of the periodic component in the 11 collapsed frequency bands (4Hz) for each group (ND and SLI) and the differences between them. The asterisk indicates significant differences between groups in the RM-ANOVA.
Figure 4.
Topographies of the periodic component in the 11 collapsed frequency bands (4Hz) for each group (ND and SLI) and the differences between them. The asterisk indicates significant differences between groups in the RM-ANOVA.
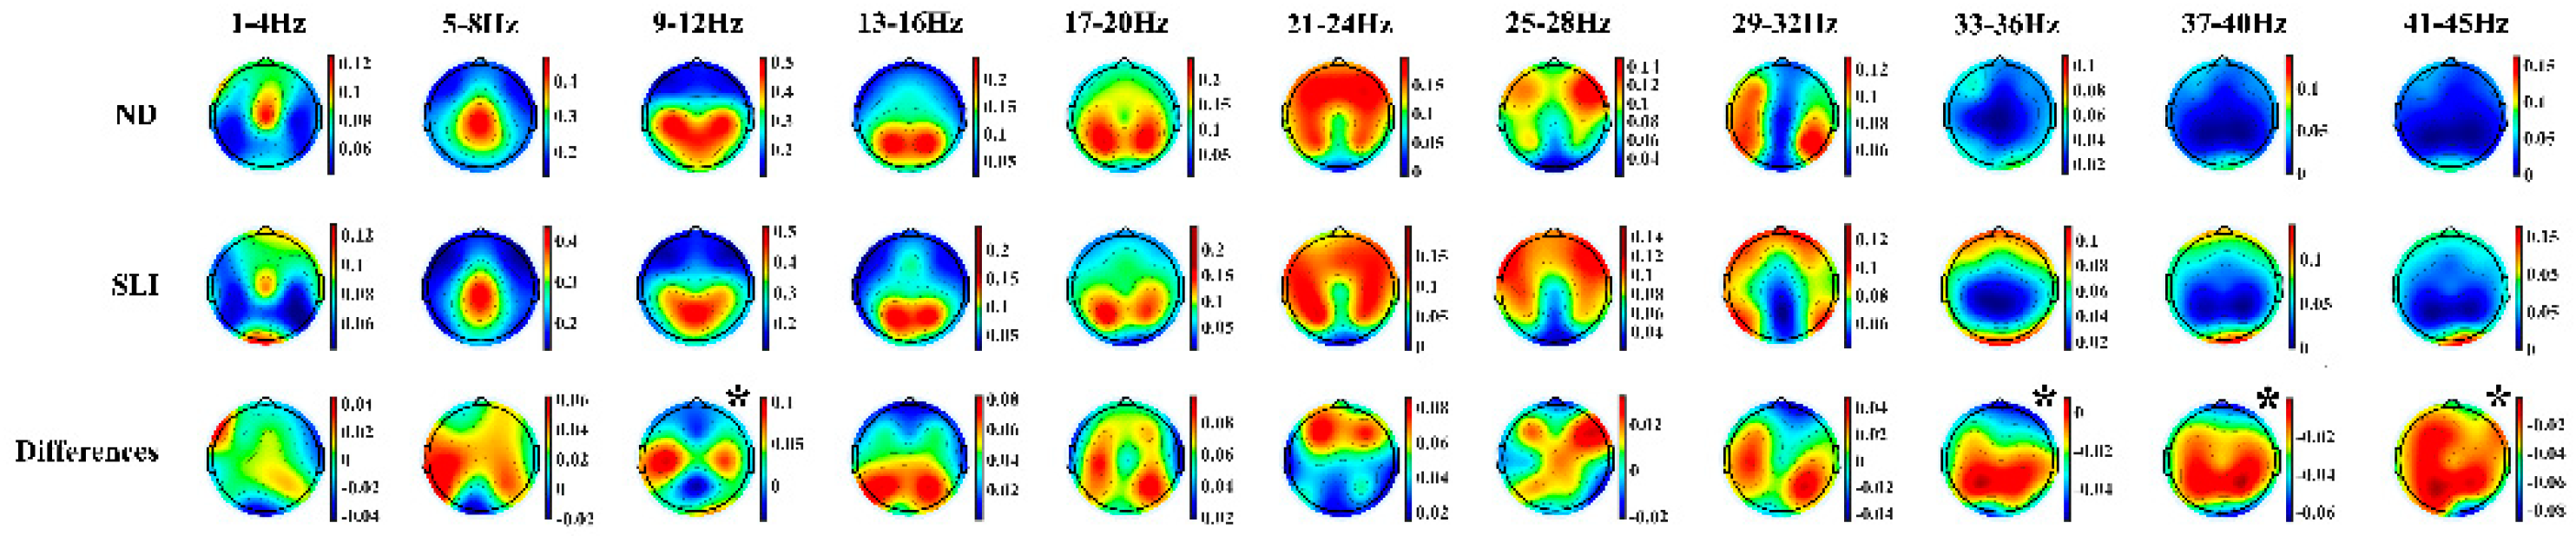
Figure 5.
A) Periodic component of the PSD across all frequencies and in each considered area for the ND group (blue line) and SLI group (red line). B) Marginal means of the significant interaction effects of the factor laterality x group and antero-posterior x group in the RM-ANOVA.
Figure 5.
A) Periodic component of the PSD across all frequencies and in each considered area for the ND group (blue line) and SLI group (red line). B) Marginal means of the significant interaction effects of the factor laterality x group and antero-posterior x group in the RM-ANOVA.
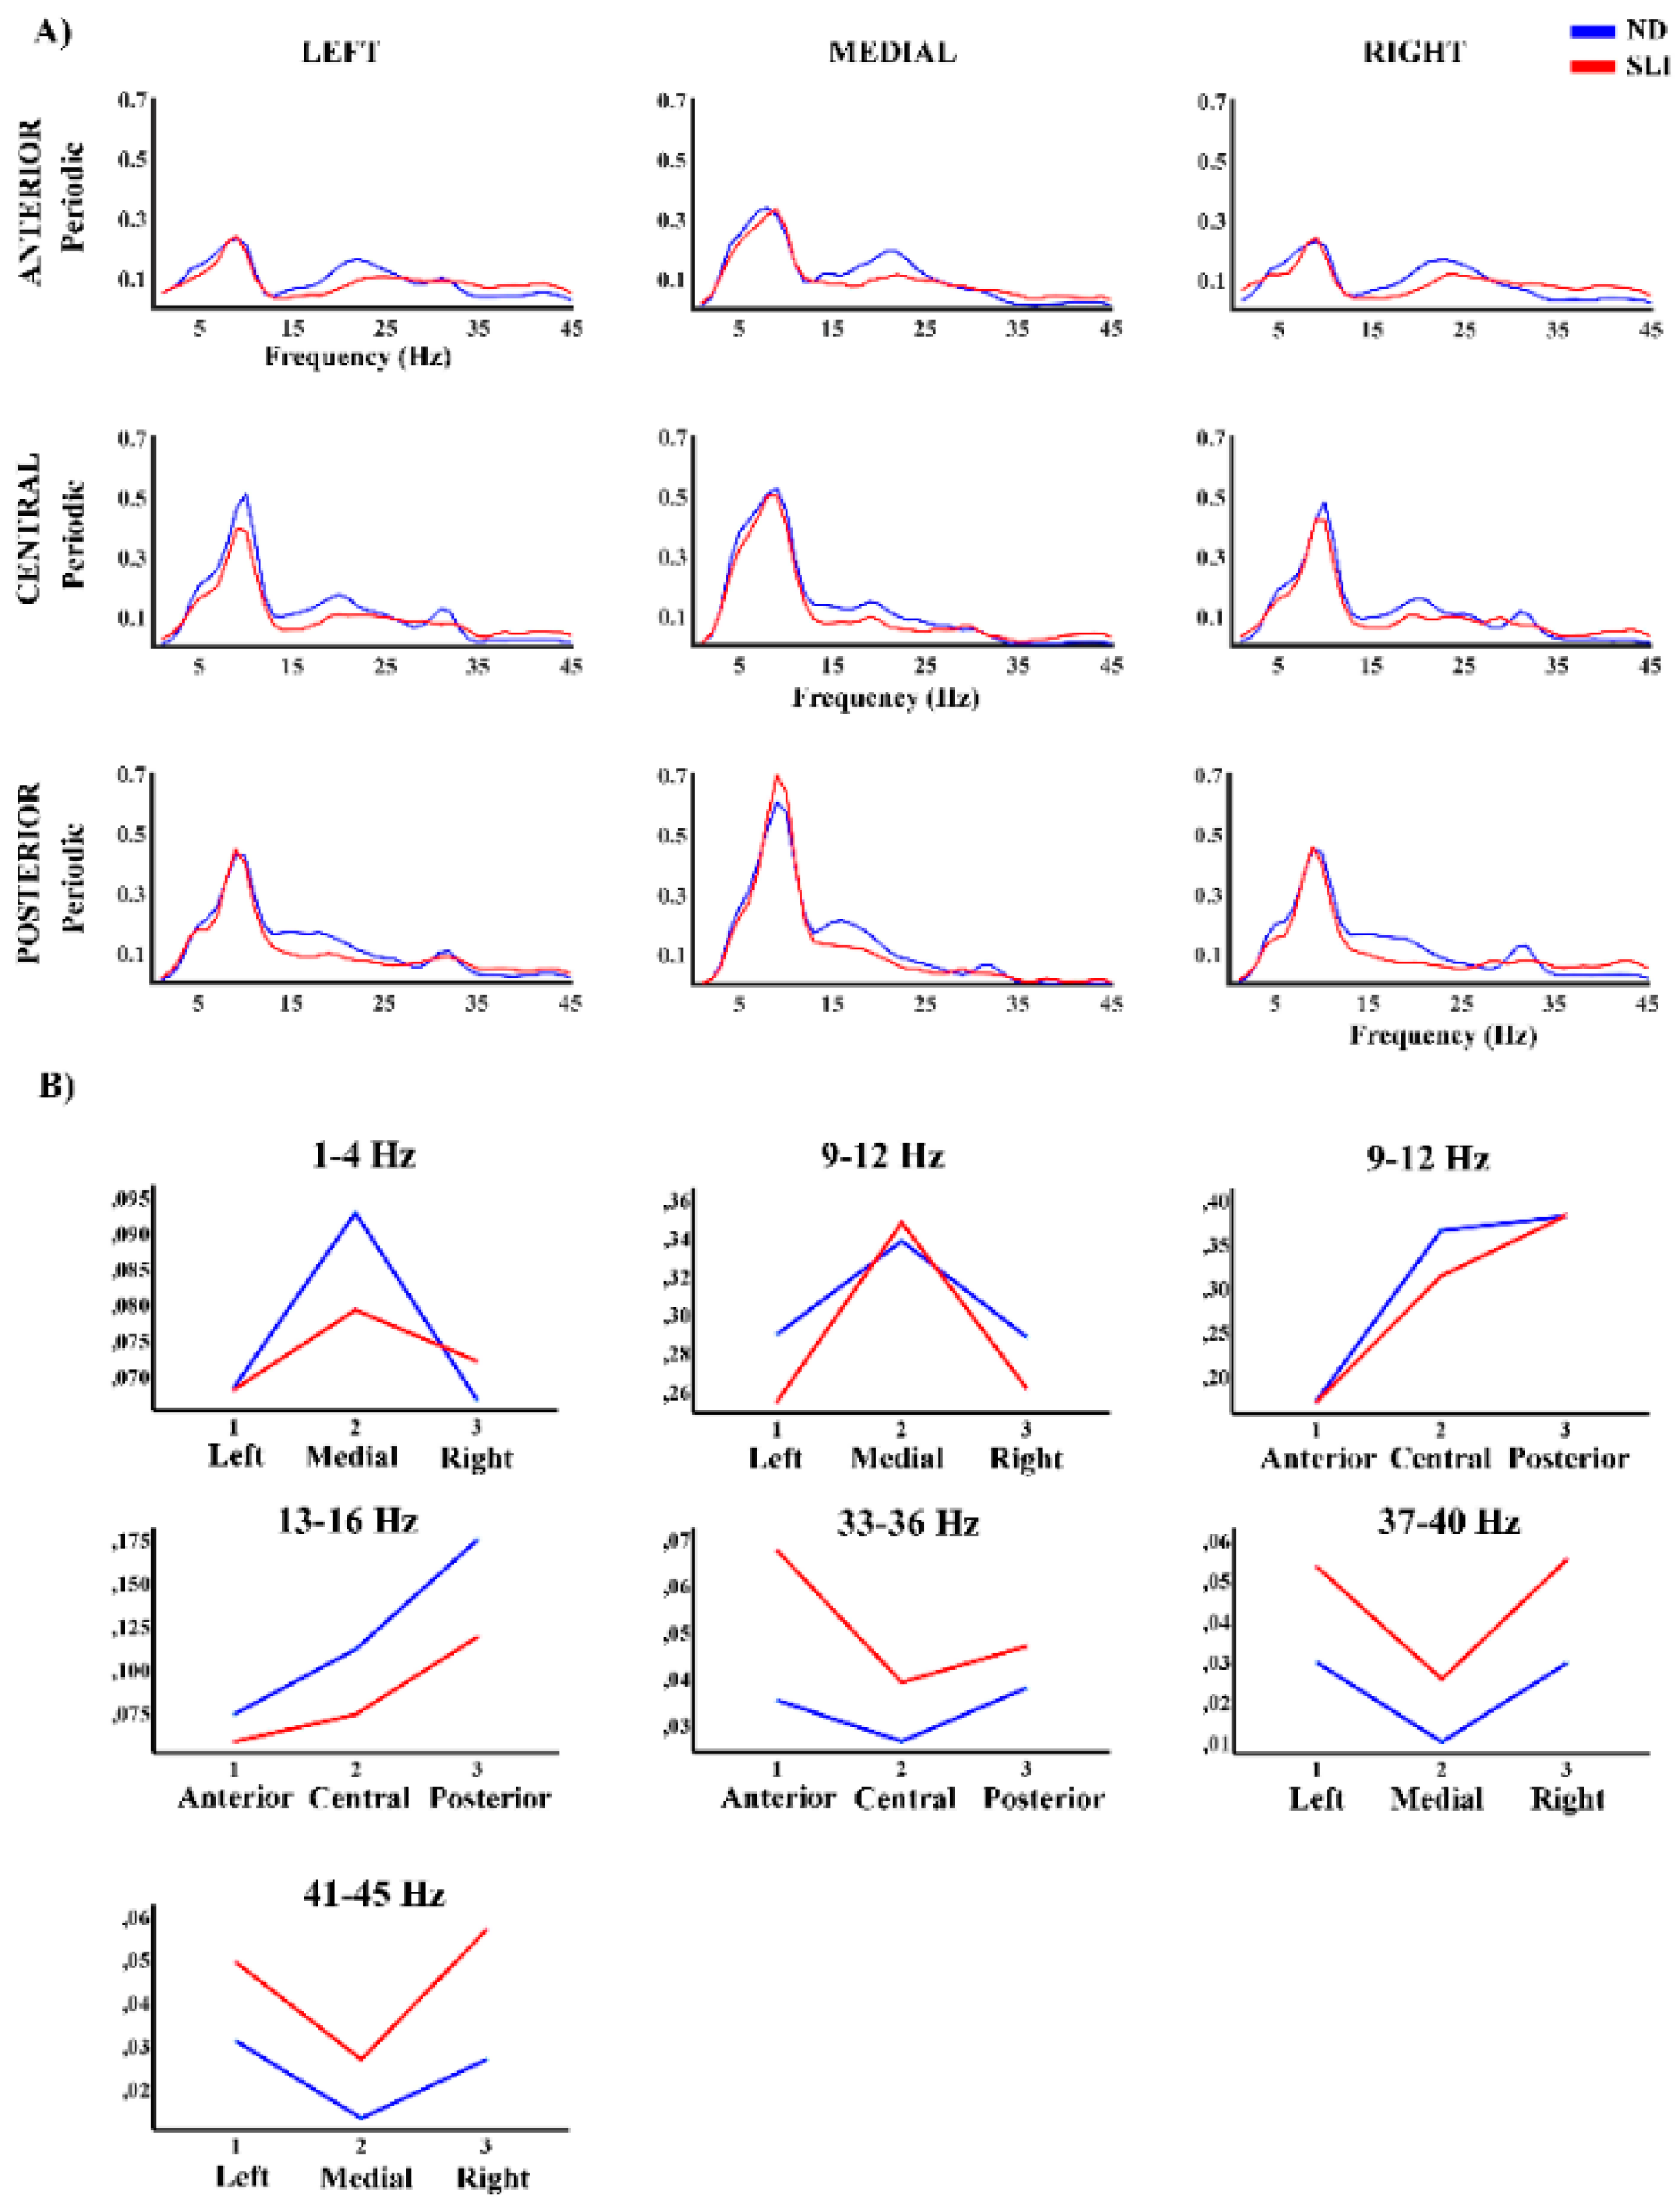

Table 1.
Significant group interactions were obtained in the RM-ANOVA of the aperiodic components (AP) of the power spectral density (PSD) with the factors: subject group (ND and SLI), antero-posterior (anterior, central, posterior) and laterality (left, medial, right). Each RM-ANOVA was performed for each frequency collapse (4Hz, total 11 frequency ranges). Age in days and gender were used as covariates.
| Frequency | Within-subjects |
|---|---|
| 13-16Hz | Laterality x group p=.034 F(1.89,114.96)=3.58, np2=.055, power=.636 |
| 17-20Hz | Laterality x group p=.025 F(1.88,114.93)=4.52, np2=.060, power=.676 |
| 21-24Hz | Laterality x group p=.021 F(1.89,115.11)=4.12, np2=.063, power=.701 |
| 25-28Hz | Laterality x group p=.018 F(1.89,115.36)=4.27, np2=.065, power=.719 |
| 29-32Hz | Laterality x group p=.016 F(1.89,115.63)=4.38, np2=.067, power=.731 |
| 33-36Hz | Laterality x group p=.015 F(1.90,115.90)=4.47, np2=.068, power=.741 |
| 37-40Hz | Laterality x group p=.014 F(1.90,116.16)=4.54, np2=.069, power=.748 |
| 41-45Hz | Laterality x group p=.013 F(1.91,116.43)=4.60, np2=.070, power=.755 |
Table 2.
Significant group interactions obtained in the RM-ANOVA of periodic components (P) of the power spectral density (PSD) with the factors: subject group (ND and SLI), antero-posterior (anterior, central, posterior), and laterality (left, medial, right). Each RM-ANOVA was performed for each frequency collapse (4Hz, total 11 frequency ranges). Age in days and gender were used as covariates.
| RM_ANOVA | ||
|---|---|---|
| Frequency | Within-subjects | Between-subjects |
| 1-4Hz | Laterality x group p=.050 F(1.98,120.93)=3.07, np2=.048, power=.581 |
- |
| 9-12Hz | Laterality x group p=.017 F(1.57,95.48)=4.78, np2=.073, power=.710 Antero-posterior x group p=.031 F(1.97,120.13)=3.59, np2=.056, power=.650 |
- |
| 13-16Hz | Antero-posterior x group p=.030 F(1.89,115.23)=3.69, np2=.057, power=.650 |
- |
| 33-36Hz | Antero-posterior x group p=.036 F(1.53,93.23)=3.84, np2=.059, power=.603 |
|
| 37-40Hz | - | Group p=.005 F(1,61)=8.61, np2=.124, power=.823 |
| 41-45Hz | Laterality x group p=.037 F(1.97,120.09)=3.40, np2=.053, power=.626 |
Group p=.006 F(1,61)=8.03, np2=.116, power=.796 |
Table 3.
Summary of post-hoc analysis for aperiodic and periodic components across selected frequency ranges (4Hz). Only significant group effect after False Discovery Rate (FDR) correction.
Table 3.
Summary of post-hoc analysis for aperiodic and periodic components across selected frequency ranges (4Hz). Only significant group effect after False Discovery Rate (FDR) correction.
| Aperiodic | ||
|---|---|---|
| Frequency Range | Between-subjects | Within-subjects |
| 13-16Hz | Left-Medial (SLI>ND) Right-Medial (SLI>ND) |
|
| 17-20Hz | Left-Medial (SLI>ND) Right-Medial (SLI>ND) |
|
| 21-24Hz | Left-Medial (SLI>ND) Right-Medial (SLI>ND) |
|
| 25-28Hz | Left-Medial (SLI>ND) Right-Medial (SLI>ND) |
|
| 29-32Hz | Left-Medial (SLI>ND) Right-Medial (SLI>ND) |
|
| 33-36Hz | Left-Medial (SLI>ND) Right-Medial (SLI>ND)) |
|
| 37-40Hz | Left-Medial (SLI>ND) Right-Medial (SLI>ND) |
|
| 41-45Hz | Left-Medial (SLI>ND) Right-Medial (SLI>ND) |
|
| Periodic | ||
| 9-12Hz | Central-Anterior (ND>SLI) Posterior-Central (SLI>ND) |
|
| 33-36Hz | Anterior (SLI>ND) | |
| 37-40Hz | SLI>ND | |
| 41-45Hz | SLI>ND | Left (SLI>ND) Medial (SLI>ND) Right (SLI>ND) |
Disclaimer/Publisher’s Note: The statements, opinions and data contained in all publications are solely those of the individual author(s) and contributor(s) and not of MDPI and/or the editor(s). MDPI and/or the editor(s) disclaim responsibility for any injury to people or property resulting from any ideas, methods, instructions or products referred to in the content. |
© 2025 by the authors. Licensee MDPI, Basel, Switzerland. This article is an open access article distributed under the terms and conditions of the Creative Commons Attribution (CC BY) license (http://creativecommons.org/licenses/by/4.0/).
Copyright: This open access article is published under a Creative Commons CC BY 4.0 license, which permit the free download, distribution, and reuse, provided that the author and preprint are cited in any reuse.


