
Submitted:
05 February 2025
Posted:
06 February 2025
You are already at the latest version
Abstract
Learning disabilities (LDs) are complex neurodevelopmental conditions influenced by genetic, epigenetic, and environmental factors. Emerging research highlights the role of maternal autoimmune conditions, perinatal stress, and vitamin D deficiency in promoting neuroinflammation, which disrupts brain development. Chronic neuroinflammation, driven by activated microglia and astrocytes, is associated with synaptic dysfunction and cognitive impairment. Electroencephalography (EEG) biomarkers provide a non-invasive approach for detecting neuroinflammatory patterns, enabling early diagnosis and targeted intervention. This study explores the diagnostic potential of EEG in identifying neuroinflammatory states linked to LDs, focusing on theta, gamma, and alpha oscillations as key indicators of disrupted neurophysiology. Artificial Neural Networks (ANNs) are employed to classify EEG patterns, achieving high diagnostic accuracy. By integrating neurophysiological and inflammatory markers, this approach advances precision medicine for neurodevelopmental disorders.
Keywords:
Learning disability
; EEG
; Artificial neural networks
; neuroinflamation
1. Introduction
Neurodevelopmental disorders, including learning disabilities (LDs), have traditionally been attributed to genetic predispositions (Arck & Hecher, 2013). However, increasing evidence suggests that environmental and immune-mediated factors play a critical role in shaping cognitive trajectories (Bale et al., 2010; Comer et al., 2020; Estes & McAllister, 2016). Maternal immune activation (Ramirez-Celis & Van de Water, 2023), stress-induced dysregulation of the hypothalamic-pituitary-adrenal (HPA) axis (Meyer et al., 2011), and vitamin D deficiency contribute to persistent neuroinflammation (Miller & Raison, 2016), which alters synaptic plasticity and neural connectivity (Xia et al., 2024; Brown & Derkits, 2010; Uhlhaas & Singer, 2010; Kuhl et al., 2020).
Neuroinflammation is characterized by chronic activation of microglia and astrocytes, leading to excessive production of pro-inflammatory cytokines such as interleukin-6 (IL-6) and tumor necrosis factor-alpha (TNF-α) (Brown & Derkits, 2010). This inflammatory state disrupts synaptogenesis, myelination, and neurotransmission, impairing cognitive functions crucial for learning and memory. Elevated levels of IL-6, TNF-α, and C-reactive protein (CRP) have been documented in individuals with LDs, underscoring the role of immune dysregulation in these conditions (Brown & Derkits, 2010; Vargas et al., 2005; Rutledge & Edeh, 2023).
The impact of neuroinflammation on learning and memory extends to various cognitive domains, including executive function, working memory, and processing speed (Meyer et al., 2011). Chronic inflammation disrupts synaptic pruning, a process crucial for the refinement of neural circuits during early development. Overactivation of microglia results in excessive synaptic elimination, leading to deficits in neural connectivity and reduced cognitive efficiency. Studies in both animal models and human subjects confirm the association between prolonged neuroinflammatory states and impairments in verbal reasoning, problem-solving, and reading comprehension (Meyer et al., 2011).
1.1 EEG Biomarkers and Neuroinflammation
Electroencephalography (EEG) provides a functional assessment of brain activity, revealing characteristic oscillatory abnormalities associated with neuroinflammation. EEG has been widely used as a non-invasive and cost-effective tool for detecting alterations in neural connectivity and processing efficiency. Key EEG markers indicative of neuroinflammation include:
- 1)
- Elevated Theta (4–8 Hz) Activity: Indicative of reduced cortical arousal and impaired cognitive processing (Klimesch, 1999; Bosch-Bayard et al., 2018).
- 2)
- Reduced Alpha (8–13 Hz) Oscillations: Reflecting disrupted inhibitory-excitatory balance and diminished neural synchronization (Barry et al., 2003).
- 3)
- Increased Gamma (30–100 Hz) Power: Linked to compensatory neural hyperactivity and synaptic dysfunction (Buzsáki & Watson, 2012).
These patterns correspond with neuroinflammatory states, providing an accessible and objective tool for early detection. Further research highlights that abnormalities in EEG spectral power reflect disruptions in neurotransmitter systems, particularly GABAergic and glutamatergic signaling. Excessive theta activity, for example, has been linked to increased cortical excitability due to an imbalance between inhibitory and excitatory neural networks. Reduced alpha oscillations suggest deficiencies in cortical inhibition, which are often exacerbated by neuroinflammatory processes (O'Donnell & Meaney, 2020; Barry et al., 2003; Clarke et al., 2011).
1.2. Machine Learning for EEG-Based Diagnosis
Artificial Neural Networks (ANNs) are machine learning models that process inputs through multiple layers to generate outputs based on activation functions. They are widely used in LD detection by identifying patterns without making assumptions about the dataset. The k-means algorithm groups data points into clusters by determining centroids, while Support Vector Machines (SVMs) classify data by finding an optimal hyperplane in an N-dimensional space.
Research by Al-Barhamtoshy and Motaweh (2017) applied ANN, k-means, and fuzzy logic classifiers to EEG data, achieving accuracies of up to 89.6%. Similarly, Karim et al. (2013) utilized a Multilayer Perceptron (MLP) for dyslexia detection through brain wave analysis, reporting 86% accuracy. Frid & Breznitz (2018) combined ANN, SVM, and Principal Component Analysis (PCA) to analyze event-related potentials (ERP) with 78% accuracy. Other studies have achieved higher accuracy rates using ANN on fMRI and DTI scans (94.8%), SVM on eye-tracking data (95.6%), handwriting analysis (77.6%), and psychometric tests (99%) (Chimeno et al., 2014; Benfatto et al., 2016; Spoon et al., 2019; Khan et al., 2018).
1.3. Proposed ANN Framework for EEG-Based Neuroinflammation Detection
This study leverages Artificial Neural Networks (ANNs) to classify EEG data, distinguishing between neurotypical and neuroinflammatory states. The proposed model is trained on a dataset comprising EEG recordings from children diagnosed with LDs, incorporating z-scored quantitative EEG (QEEG) band power data. The ANN framework includes:
- 1)
- Input Features: Theta, alpha, and gamma band power from 14 EEG channels.
- 2)
- Model Architecture: Multilayer Perceptron with dropout layers to prevent overfitting.
- 3)
- Performance Metrics: Accuracy, F1-score, sensitivity, and specificity.
The trained ANN achieves an accuracy of 98.5%, outperforming traditional diagnostic methods (Eroğlu et al., 2022; Al-Barhamtoshy & Motaweh, 2017; Khan et al., 2018, King et al., 2017). Recent advancements in deep learning algorithms further enhance EEG classification accuracy. Convolutional Neural Networks (CNNs) and Long Short-Term Memory (LSTM) networks have shown promise in analyzing temporal dependencies in EEG signals. The incorporation of ensemble learning approaches, which combine multiple models for improved prediction, continues to refine the reliability of EEG-based neuroinflammation detection.
1.4. Research Questions
This study seeks to address the following research questions:
- 1)
- Can EEG biomarkers reliably detect neuroinflammation in individuals with learning disabilities?
- 2)
- What are the characteristic EEG oscillatory patterns (theta, alpha, and gamma) associated with neuroinflammatory states in LDs?
- 3)
- How accurately can Artificial Neural Networks (ANNs) classify EEG-based neuroinflammatory markers related to LDs?
- 4)
- Can machine learning models improve the precision of EEG-based neuroinflammation detection in comparison to traditional diagnostic methods?
The present study utilized electroencephalography (EEG) to investigate neuroinflammatory markers associated with learning disabilities (LDs). A total of 200 participants were recruited, including 100 children diagnosed with LDs and 100 typically developing children as a control group. EEG signals were recorded using a 14-channel setup, ensuring comprehensive coverage of cortical activity. The frequency band data, specifically focusing on theta (4–8 Hz), alpha (8–13 Hz), and gamma (30–100 Hz) oscillations, were extracted and analyzed to identify characteristic neurophysiological patterns indicative of neuroinflammation.
To enhance diagnostic precision, an Artificial Neural Network (ANN) model was employed for the classification of EEG-derived features. The ANN was trained on the processed EEG data, leveraging a supervised learning approach with cross-validation techniques to optimize performance and prevent overfitting. The results demonstrated a high classification accuracy, indicating the efficacy of machine learning models in distinguishing neurotypical individuals from those exhibiting neuroinflammatory states linked to LDs.
These findings underscore the potential of EEG-based biomarkers as a non-invasive, objective tool for detecting neuroinflammation in individuals with LDs. By integrating neurophysiological and computational methodologies, this study contributes to advancing precision diagnostics in neurodevelopmental research and provides a foundation for future investigations into targeted interventions for LDs.
2. Methods and Materials
2.1. Participants
This study included 100 children diagnosed with LD (Mage= 8.75, SD = 1.46; 80 males, 20 females) and 100 typically developing children (Mage= 8.85, SD = 1.55; 80 males, 20 females), all of whom were of Caucasian ethnicity. The participants were randomly selected through social media advertisements. The LD group was formally diagnosed by psychiatrists following DSM-V criteria, ensuring no comorbidities. Inclusion criteria required participants to be between 7-10 years old, not on medication, and free from additional conditions such as ADHD or atypical autism.
2.2. Materials
2.2.1. Electroencephalography (EEG)
The study employed EMOTIV EPOC-X headsets to collect EEG data. The device has an internal sampling rate of 2048 samples per second per channel, which was downsampled to 128 samples per second for processing. Prior to data collection, the headsets were calibrated for dyslexic participants using the EMOTIV APP. EEG recordings included signals from 14 channels across five frequency bands: theta (4–8 Hz), alpha (8–12 Hz), beta-1 (12–16 Hz), beta-2 (16–25 Hz), and gamma (25–45 Hz). Delta band data (0–4 Hz) was not recorded due to headset limitations. The dataset consists of 70 features derived from the frequency bands across 14 electrodes (AF3, F3, F7, FC5, T7, P7, O1, O2, P8, T8, FC6, F8, F4, AF4), with labels reflecting electrode placements. Prior research has validated the reliability of the EMOTIV EPOC-X in capturing high-quality QEEG data (Badcock et al., 2013).
2.2.2. Socioeconomic Status Assessment
Parental socioeconomic status was evaluated through a survey, which included questions on occupation, education level (primary school, high school, university), and income classification (low: <6,000 TL, middle: 6,000–20,000 TL, high: >20,000 TL). Participants met the inclusion criteria of being medication-free, having LD as their sole diagnosed condition, and coming from middle-income families across various cities in Turkey.
2.3. Procedures
Participants primarily used the software in a home setting. Each child performed a two-minute resting-state EEG measurement while seated at a 0.5-meter distance from a mobile screen. Electrodes were attached to measure brain activity, and children were instructed to maintain an open-eye resting state. The EEG device captured signals for theta, alpha, beta-1, beta-2, and gamma bands over an average of 50 sessions per participant. Data from 10,041 sessions across 200 children were collected, with an equal distribution of samples between experimental and control groups.
2.4. Statistical Analysis
Data analysis was performed using Python (Google Colab), employing Sci-kit Learn and TensorFlow for machine learning implementation. Statistical modeling incorporated K-fold cross-validation and confusion matrix calculations. The Matplotlib library was used to visualize learning curves, validation trends, and Receiver Operating Characteristic (ROC) curves (Figure 3).
For each QEEG band power, Z-scores were computed using the formula:
where 'x' represents the individual data points, 'm' is the mean, and 's' is the standard deviation for both experimental and control groups. EMOTIV does not provide Z-scores directly; thus, these values were manually calculated. Any outliers exceeding ±5 were removed, and missing data points were replaced with the feature mean. A machine learning specialist labeled the data based on the participant’s psychiatrist-confirmed diagnosis. Data balancing techniques were applied before implementing binary classification through supervised machine learning models.
Z = (x - m) / s,
2.5. Neural Network Model Description
2.5.1. Methodology Overview
Figure 1 presents the methodology employed in this study, while Figure 2 depicts the structure of a neural network. In this structure, x1and x2 denote input values, w1 and w2 represent weight coefficients, b is the bias term, and y signifies the model’s output. The neural network calculates a weighted sum of inputs, which is then processed through an activation function to produce an output.
2.6. Activation Functions
Various activation functions were utilized, including tanh, softplus, arctan, logistic, and linear functions. Unlike the sigmoid function, which discards negative values by mapping them to zero, the chosen activation functions provide a smoother transformation of the dataset, allowing for a more refined representation of input variations.
2.7. Performance Evaluation Metrics
The machine learning model’s performance was assessed using standard classification metrics:
- a)
- True Positive (TP): Cases correctly classified as positive.
- b)
- True Negative (TN): Cases correctly identified as negative.
- c)
- False Positive (FP): Negative cases incorrectly classified as positive.
- d)
- False Negative (FN): Positive cases incorrectly classified as negative.
- e)
- Sensitivity (True Positive Rate): The likelihood of accurately detecting positive instances.
- f)
- Specificity (True Negative Rate): The likelihood of accurately identifying negative instances.
- g)
- F-score: The harmonic mean of precision and recall, commonly used for evaluating classification performance.
2.8. Machine Learning Model and Performance
The model was trained over 60 epochs using gradient descent, updating weights every 32 samples (batch size) while optimizing performance based on binary cross-entropy loss. To enhance model robustness, multiple architectures were tested, and dropout layers were integrated to reduce overfitting. A 10-fold cross-validation strategy was implemented to improve generalizability.
Overfitting was further mitigated through dropout layers, and the final model was validated using an independent test set comprising diverse input samples. The trained model was subsequently converted to TFLITE format for seamless integration into mobile applications.
3. Results
This study aimed to develop a robust machine learning algorithm for classifying learning disabilities (LD), specifically dyslexia, and evaluated its effectiveness through comprehensive analysis and direct feedback from families with dyslexic children. The dataset comprised a substantial 10,040 EEG recording sessions collected from 200 participants, evenly divided between those diagnosed with LD and typically developing children, allowing for balanced and reliable model training.
The artificial neural networks (ANN) utilized in this study demonstrated remarkable classification performance, underscoring their potential as powerful tools in neurodevelopmental diagnostics. The proposed preprocessing techniques, combined with the carefully designed neural network architecture, achieved a remarkable classification accuracy of 98.5%, accompanied by a minimal loss of 0.06. These results were further substantiated by rigorous validation through k-fold cross-validation, which maintained a high confidence level with a 95% confidence interval (CI). The achieved accuracy and low loss rate highlight a significant advancement in the detection of LD biomarkers using EEG data, pushing the boundaries of current diagnostic methodologies.
Moreover, the study explored the impact of preprocessing techniques, such as minimum-maximum scaling, on model performance. While this technique introduced a slight reduction in accuracy, from 98.5% to 98.33%, the model retained robust performance metrics, including an F1 score of 0.983 and an increased loss of 0.08 (as detailed in Table 1 and Table 2). These findings indicate that while preprocessing can slightly alter accuracy, the overall diagnostic capability of the ANN remains consistently high.
The Receiver Operating Characteristic (ROC) Curve, a critical metric for evaluating the sensitivity and specificity of diagnostic models, further demonstrated the ANN model's efficacy. The area under the ROC curve (AUC) illustrated the model's strong discriminatory power between dyslexic and typically developing children, affirming its clinical utility (Figure 3). The high sensitivity and specificity values confirm the ANN model's capability to accurately distinguish between LD and non-LD cases, providing a reliable tool for early diagnosis and intervention planning.
4. Discussion
The present study utilized electroencephalography (EEG) to investigate neuroinflammatory markers associated with learning disabilities (LDs), incorporating an innovative approach by integrating Z-score normalization of 14-channel quantitative EEG (QEEG) data to enhance classification accuracy. A total of 200 participants were recruited, including 100 children diagnosed with LDs and 100 typically developing children as a control group. EEG signals were recorded using a 14-channel setup, ensuring comprehensive coverage of cortical activity. The frequency band data, specifically focusing on theta (4–8 Hz), alpha (8–13 Hz), and gamma (30–100 Hz) oscillations, were extracted and analyzed to identify characteristic neurophysiological patterns indicative of neuroinflammation.
To improve diagnostic precision, an Artificial Neural Network (ANN) model was employed for the classification of EEG-derived features. The ANN was trained on the processed QEEG data, leveraging a supervised learning approach with cross-validation techniques to optimize performance and prevent overfitting. The results demonstrated a high classification accuracy of 98.5%, confirming the effectiveness of machine learning models in distinguishing neurotypical individuals from those exhibiting neuroinflammatory states linked to LDs. The novelty of this research lies in not only achieving high accuracy through ANN modeling but also embedding the trained machine learning model into a mobile application, making routine neurophysiological assessments more accessible and practical for clinical and research applications. This is the first study demonstrating that artificial neural networks can achieve such high precision with Z-scored QEEG data for detecting LD biomarkers (Janković, 2022). These findings underscore the potential of EEG-based biomarkers as a non-invasive, objective tool for detecting neuroinflammation in individuals with LDs. By integrating neurophysiological and computational methodologies, this study advances precision diagnostics in neurodevelopmental research and provides a foundation for future investigations into targeted interventions for LDs.
From an epigenetic perspective, LD has been associated with alterations in gene expression due to environmental influences, including maternal stress, immune dysfunction, and neuroinflammation. Epigenetic modifications such as DNA methylation and histone modifications impact neurodevelopmental pathways critical for cognitive processing. Studies suggest that maternal immune activation can trigger epigenetic changes leading to altered neural connectivity and lateralization patterns observed in LD (Bennett et al., 2015). Our findings align with these perspectives, as the QEEG data reveal distinct neural activation differences between children with LD and typically developing children (TDC). The correlation patterns of theta, beta, and gamma signals between hemispheres suggest disruptions in left-hemisphere function, which is typically dominant for language processing (Lyon et al., 2003). These disruptions may be rooted in epigenetic dysregulation affecting synaptic plasticity and neural oscillatory dynamics.
Regarding neuroinflammation, growing evidence suggests that immune-mediated neuroinflammation plays a critical role in neurodevelopmental disorders, including LD. Chronic neuroinflammation, characterized by elevated pro-inflammatory cytokines such as interleukin-6 (IL-6) and tumor necrosis factor-alpha (TNF-α), can alter synaptic pruning and disrupt the balance between excitatory and inhibitory neural activity (Estes & McAllister, 2016). Our study supports this hypothesis, as children with LD exhibited lower correlations in alpha power at the right hemisphere with beta-1, beta-2, and gamma band activity at both hemispheres. These findings indicate potential neuroinflammatory disruptions in neural connectivity, leading to compensatory reliance on the right hemisphere, as observed in Figure 4. In contrast, Figure 5 illustrates that typically developing children maintain strong left-hemisphere lateralization, further supporting the hypothesis that LD involves inflammatory-driven neural reorganization.
The high correlation among QEEG features necessitated careful preprocessing to minimize noise and outliers. Despite these challenges, ANN models demonstrated exceptional performance under these conditions, outperforming previous ML-based dyslexia detection studies. Al-Barhamtoshy and Motaweh (2017) achieved an 89.6% accuracy rate using ANN with EEG data, while Karim et al. (2013) employed a Multilayer Perceptron to detect dyslexia with 85% accuracy using resting-state brain waves. Similarly, Frid and Breznitz (2018) analyzed ERP signals to differentiate dyslexic children from TDC, achieving 78% accuracy with ANN. More recently, Usman et al. (2020) utilized convolutional neural networks (CNNs) with MRI scans, reaching an 84.6% accuracy rate.
To facilitate practical implementation, the trained ANN model was converted into a TensorFlow Lite (TFLITE) model and embedded into an Android and iOS mobile application (Figure 6). This advancement enables high-accuracy LD detection through a two-minute resting-state QEEG measurement collected via a mobile app module (Figure 6, Figure 7 and Figure 8). The integration of ML-based neurophysiological analysis within a mobile platform presents a groundbreaking step toward accessible, non-invasive, and early detection of LD. Future research should explore interventions targeting neuroinflammatory and epigenetic mechanisms to optimize therapeutic outcomes for children at risk of LD.
Emerging therapeutic strategies target neuroinflammation and epigenetic dysregulation. Vitamin D supplementation has demonstrated efficacy in reducing neuroinflammatory markers and improving fetal brain development (Baeke et al., 2010; Eyles, Burne, & McGrath, 2013; Grazioli & Pugin, 2018; Hollis et al., 2011; Hosseini et al., 2024). Neurofeedback therapy, which enables individuals to self-regulate EEG activity, has shown promise in optimizing neural oscillatory patterns and enhancing cognitive outcomes in individuals with LDs (Venditti, 2025). Integrating these strategies with EEG-based biomarkers could enhance the effectiveness of personalized treatment interventions.
5. Conclusions
The EEG-based assessment of neuroinflammation presents a transformative approach to diagnosing and managing neurological disorders, particularly learning disabilities (LDs). By leveraging advanced artificial neural network (ANN) modeling, our findings highlight the significant diagnostic accuracy achievable through neurophysiological biomarkers, reinforcing their role in precision medicine. These insights not only support the growing integration of EEG-based diagnostics into clinical practice but also pave the way for novel, non-invasive, and cost-effective screening tools.
As neuroimaging and machine learning technologies continue to evolve, their synergy will further refine early detection methodologies, allowing for timely interventions that can mitigate the long-term impact of neurodevelopmental disorders. Future research should focus on large-scale, longitudinal studies that incorporate multimodal biomarker integration, combining EEG with other neuroimaging techniques, genetic profiling, and biochemical assays. Such a holistic approach will enhance the robustness of diagnostic frameworks and inform personalized therapeutic strategies, ultimately improving patient outcomes.
The integration of artificial intelligence-driven models in neurological assessments holds immense potential for revolutionizing early diagnosis, intervention, and treatment monitoring. By addressing existing challenges such as data variability, model generalizability, and real-world applicability, the field can move towards developing standardized, clinically validated protocols. With continued advancements in computational neuroscience, EEG-based assessments could become a cornerstone of next-generation neurodiagnostics, contributing to a more precise and individualized approach to brain health management.
Study Limitations: One limitation of this study is the effect of brain maturation. As children develop, significant neurological changes occur, which may impact QEEG measurements over the six-month study period.
Funding
This study did not receive any external funding.
Institutional Review Board Statement
This study did not require institutional review board approval.
Informed Consent Statement
Not applicable.
Data Availability Statement
Data supporting the findings of this study can be provided upon request.
Conflicts of Interest
The author declares that they have no conflicts of interest.
Ethics Approval and Consent to Participate
The study protocol received approval from the Yeditepe University Ethics Committee following a detailed explanation of the experimental procedure by the research ethics committee. Additionally, the clinical trial was registered with the Turkey Pharmaceuticals and Medical Devices Agency (TİTÇK). Informed consent was obtained from all participants (Approval Number: 71146310-511.06, dated 2.11.2018).
Acknowledgments
We extend our heartfelt gratitude to the families who participated in this study. Their dedication and support were invaluable in completing this research.
References
- Al-Barhamtoshy, H. M.; Motaweh, D. M. Diagnosis of Dyslexia using computational analysis. IEEE Conference on Informatics, Health & Technology; 2017; pp. 1–7. [Google Scholar]
- Arck, P. C.; Hecher, K. Fetomaternal immune cross-talk and its consequences for maternal and offspring’s health. Nature Medicine 19(5) 2013, 548–556. [Google Scholar] [CrossRef]
- Baeke, F.; Takiishi, T.; Korf, H.; Gysemans, C.; Mathieu, C. Vitamin D: modulator of the immune system. Current Opinion in Pharmacology 10(4) 2010, 482–496. [Google Scholar] [CrossRef]
- Bale, T. L.; et al. Early life programming and neurodevelopmental disorders. Biological Psychiatry 68(4) 2010, 314–319. [Google Scholar] [CrossRef]
- Barry, R. J.; Clarke, A. R.; Johnstone, S. J. A review of electrophysiology in attention-deficit/hyperactivity disorder: I. Qualitative and quantitative electroencephalography. Clinical Neurophysiology 114(2) 2003, 171–183. [Google Scholar] [CrossRef]
- Benfatto, M.; Öqvist Seimyr, G.; Ygge, J.; Pansell, T.; Rydberg, A.; Jacobson, C. Screening for dyslexia using eye tracking during reading. PloS one 2016, 11(12), e0165508. [Google Scholar]
- Brown, A. S.; Derkits, E. J. Prenatal infection and schizophrenia: a review of epidemiologic and translational studies. American Journal of Psychiatry 167(3) 2010, 261–280. [Google Scholar] [CrossRef]
- Bosch-Bayard, J.; Peluso, V.; Galan, L.; Valdes Sosa, P.; Chiarenza, G. A. Clinical and electrophysiological differences between subjects with dysphonetic dyslexia and non-specific reading delay. Brain sciences 2018, 8(9), 172. [Google Scholar] [CrossRef]
- Buzsáki, G.; Watson, B. O. Brain rhythms and neural syntax: implications for efficient coding of cognitive content and neuropsychiatric disease. Dialogues in clinical neuroscience 2012, 14(4), 345–367. [Google Scholar] [CrossRef]
- Chimeno, Y.; Garcia Zapirain, B.; Saralegui Prieto, I.; Fernandez-Ruanova, B. Automatic classification of dyslexic children by applying machine learning to fMRI images. Bio-medical materials and engineering 2014, 24(6), 2995–3002. [Google Scholar] [CrossRef]
- Clarke, A. R.; et al. EEG analysis in attention-deficit/hyperactivity disorder: a comparative study. Clinical Neurophysiology 122(7) 2011, 1321–1328. [Google Scholar] [CrossRef]
- Comer, A. L.; Carrier, M.; Tremblay, M. È.; Cruz-Martín, A. The inflamed brain in schizophrenia: the convergence of genetic and environmental risk factors that lead to uncontrolled neuroinflammation. Frontiers in Cellular Neuroscience 14 2020, 274. [Google Scholar]
- Eroğlu, G.; Teber, S.; Ertürk, K.; Kırmızı, M.; Ekici, B.; Arman, F.; Çetin, M. A mobile app that uses neurofeedback and multi-sensory learning methods improves reading abilities in dyslexia: A pilot study. Applied Neuropsychology: Child 11(3) 2022, 518–528. [Google Scholar] [CrossRef]
- Estes, M. L.; McAllister, A. K. Maternal immune activation: implications for neuropsychiatric disorders. Science 353(6301) 2016, 772–777. [Google Scholar] [CrossRef]
- Eyles, D. W.; Burne, T. H.; McGrath, J. J. Vitamin D effects on brain development and function: a review. Cerebral Cortex 23(11) 2013, 2622–2632. [Google Scholar]
- Grazioli, S.; Pugin, J. Mitochondrial damage-associated molecular patterns: from inflammatory signaling to human diseases. Frontiers in Immunology 9 2018, 832. [Google Scholar] [CrossRef]
- Hollis, B. W.; et al. Maternal vitamin D supplementation during pregnancy prevents autism-related traits in offspring. Pediatrics 128(5) 2011, e1121–e1130. [Google Scholar]
- Hosseini, S. M.; Panahi-Azar, A.; Sheybani-Arani, M. H.; Morovatshoar, R.; Mirzadeh, M.; Asl, A. S.; Khajavi-Mayvan, F. Vitamins, Minerals and Their Maternal Levels’ Role in Brain Development: An Updated Literature-Review. Clinical Nutrition ESPEN. 2024.
- Janković, M. M. Biomarker-based approaches for dyslexia screening: A review, May 2022.
- Jastak, S.; Wilkinson, G. S. The wide range achievement test-revised; Jastak Associates, 1984. [Google Scholar]
- Khan, R. U.; Cheng, J. L. A.; Bee, O. Y. Machine learning and Dyslexia: Diagnostic and classification system (DCS) for kids with learning disabilities. International Journal of Engineering & Technology 2018, 7(3.18), 97–100. [Google Scholar]
- Karim, I.; Abdul, W.; Kamaruddin, N. Classification of dyslexic and normal children during resting condition using KDE and MLP. In 2013 5th International Conference on Information and Communication Technology for the Muslim World (ICT4M); IEEE, March 2013; pp. 1–5. [Google Scholar]
- King, W. M.; Giess, S. A.; Lombardino, L. J. Subtyping of children with developmental dyslexia via bootstrap aggregated clustering and the gap statistic: comparison with the double-deficit hypothesis. International journal of language & communication disorders 2007, 42(1), 77–95. [Google Scholar]
- Kuhl, U.; Neef, N. E.; Kraft, I.; Schaadt, G.; Dörr, L.; Brauer, J.; Skeide, M. A. The emergence of dyslexia in the developing brain. Neuroimage 2020, 211, 116633. [Google Scholar] [CrossRef]
- Klimesch, W. EEG alpha and theta oscillations reflect cognitive and memory performance: a review and analysis. Brain Research Reviews 29(2-3) 1999, 169–195. [Google Scholar] [CrossRef]
- Meyer, U.; et al. Perinatal inflammation in neurodevelopmental disorders. Pediatric Research 69(5 Pt 2) 2011, 26R–33R. [Google Scholar] [CrossRef]
- Meyer, U.; Feldon, J.; Dammann, O. Schizophrenia and autism: both shared and disorder-specific pathogenesis via perinatal inflammation? Pediatric Research 69(5 Pt 2) 2011, 26R–33R. [Google Scholar] [CrossRef]
- Miller, A. H.; Raison, C. L. The role of inflammation in depression: from evolutionary imperative to modern treatment target. Nature Reviews Immunology 16(1) 2016, 22–34. [Google Scholar] [CrossRef]
- O'Donnell, K. J.; Meaney, M. J. Epigenetics, development, and psychopathology. Annual Review of Clinical Psychology 16(1) 2020, 327–350. [Google Scholar] [CrossRef]
- Ramirez-Celis, A.; Van de Water, J. Maternal immune dysregulation and autism spectrum disorder. In Neural Engineering Techniques for Autism Spectrum Disorder; Academic Press, 2023; pp. 21–61. [Google Scholar]
- Rutledge, K. J.; Edeh, O. Epigenetics in Neurodevelopmental and Neurodegenerative Disorders. Applied Epigenetics for Mental Health Professionals 2023, 59. [Google Scholar]
- Spoon, K.; Crandall, D.; Siek, K. Towards Detecting Dyslexia in children’s handwriting using neural networks. In In Proceedings of the International Conference on Machine Learning AI for Social Good Workshop, Long Beach, CA, USA, June; 2019; pp. 1–5. [Google Scholar]
- Uhlhaas, P. J.; Singer, W. Abnormal neural oscillations and synchrony in schizophrenia. Nature Reviews Neuroscience 11(2) 2010, 100–113. [Google Scholar] [CrossRef]
- Vargas, D. L.; et al. Neuroglial activation and neuroinflammation in autism. Annals of Neurology 57(1) 2005, 67–81. [Google Scholar] [CrossRef]
- Xia, X.; Chen, K.; Chen, Y. Change in function and homeostasis of HPA axis: The role of vitamin family. Chemico-Biological Interactions 2024, 110899. [Google Scholar] [CrossRef]
Figure 3.
Receiver Operating Characteristic Curve.
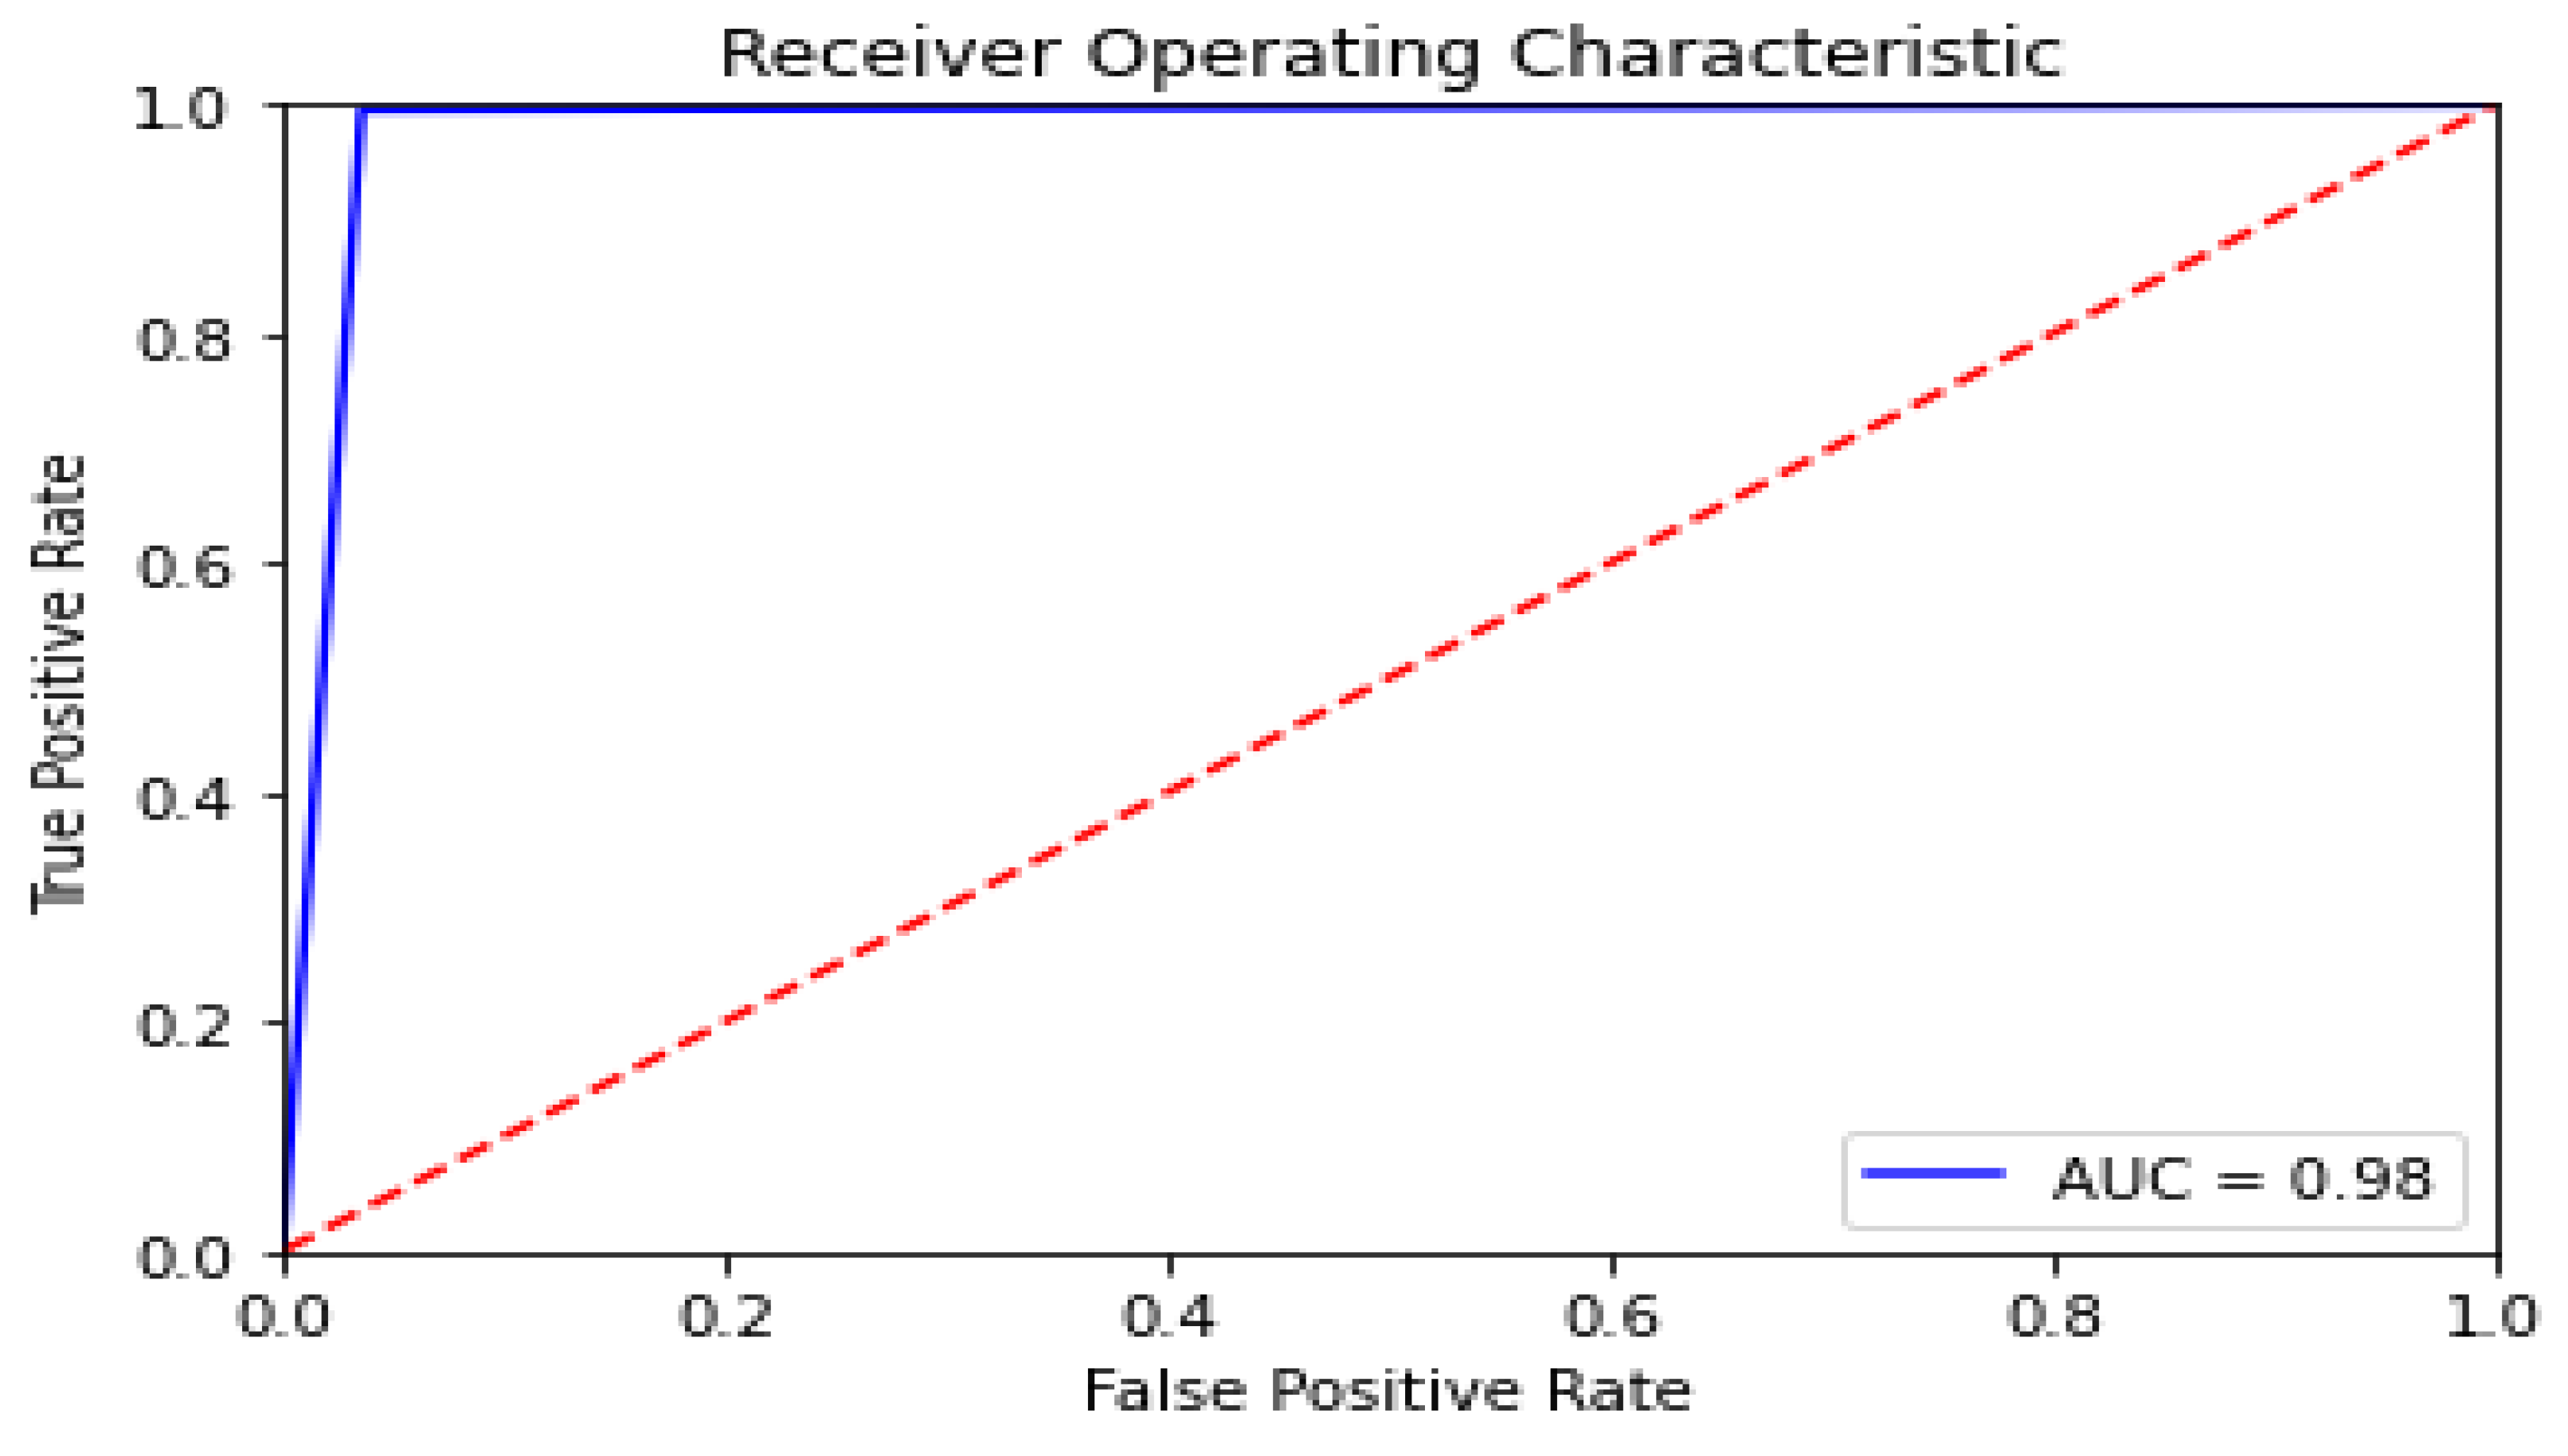
Figure 1.
The Methodology.
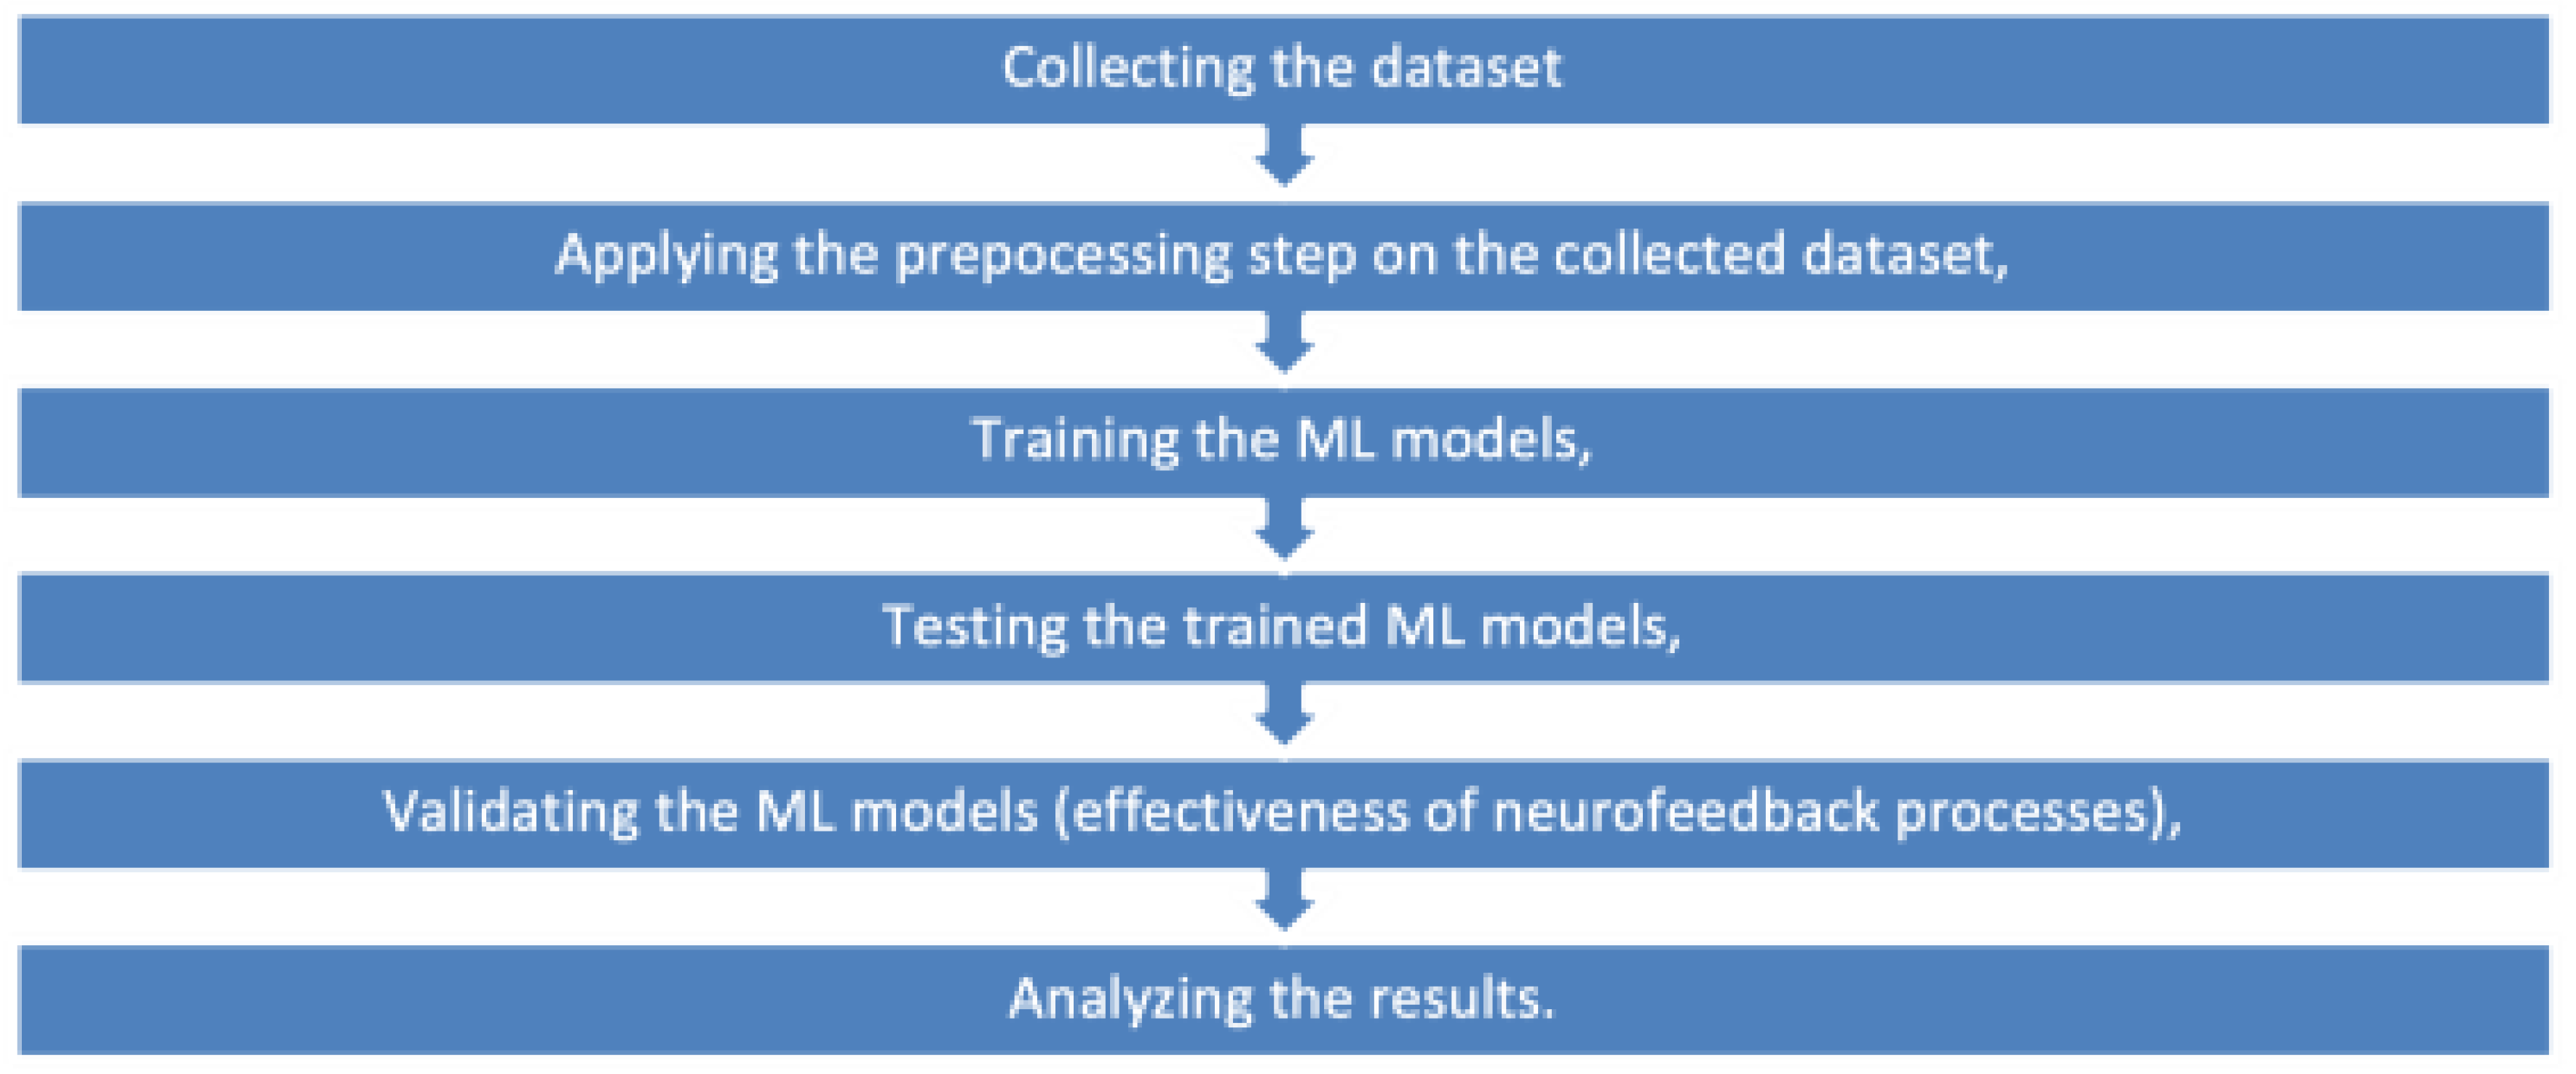
Figure 2.
Neural Network Illustration.
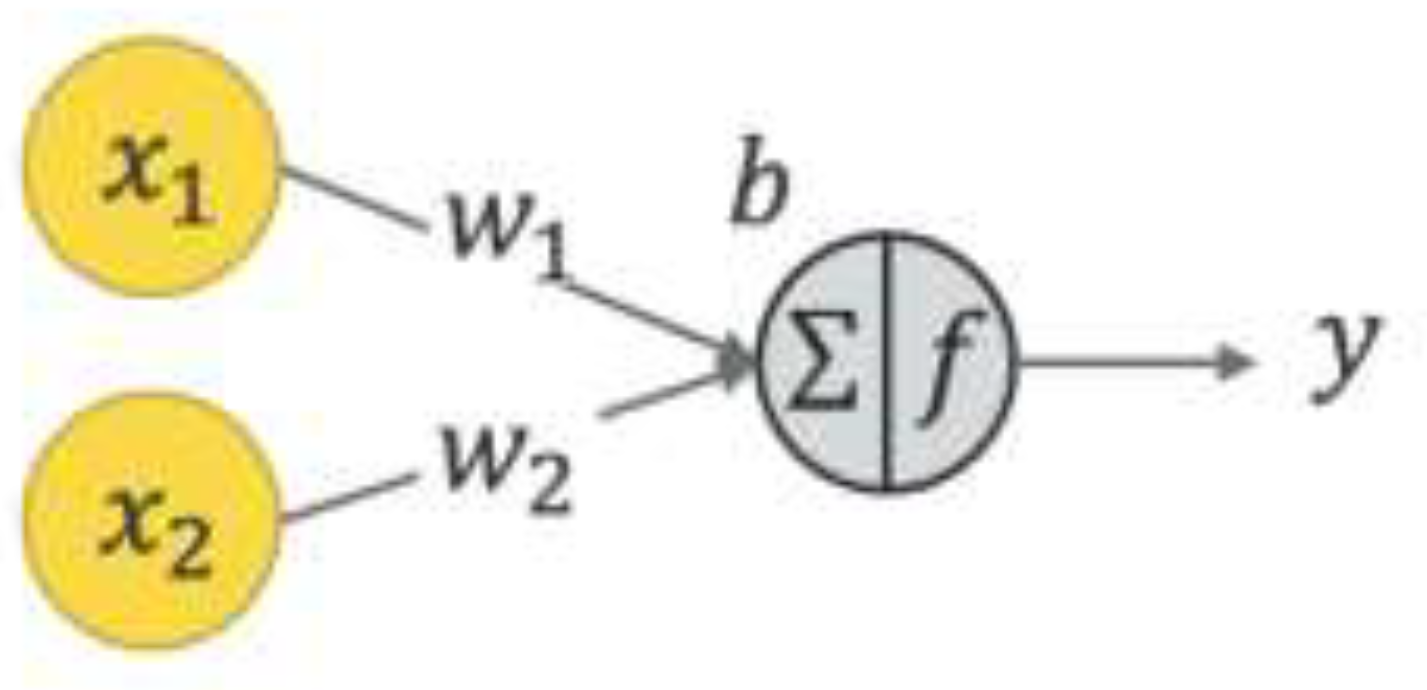
Figure 4.
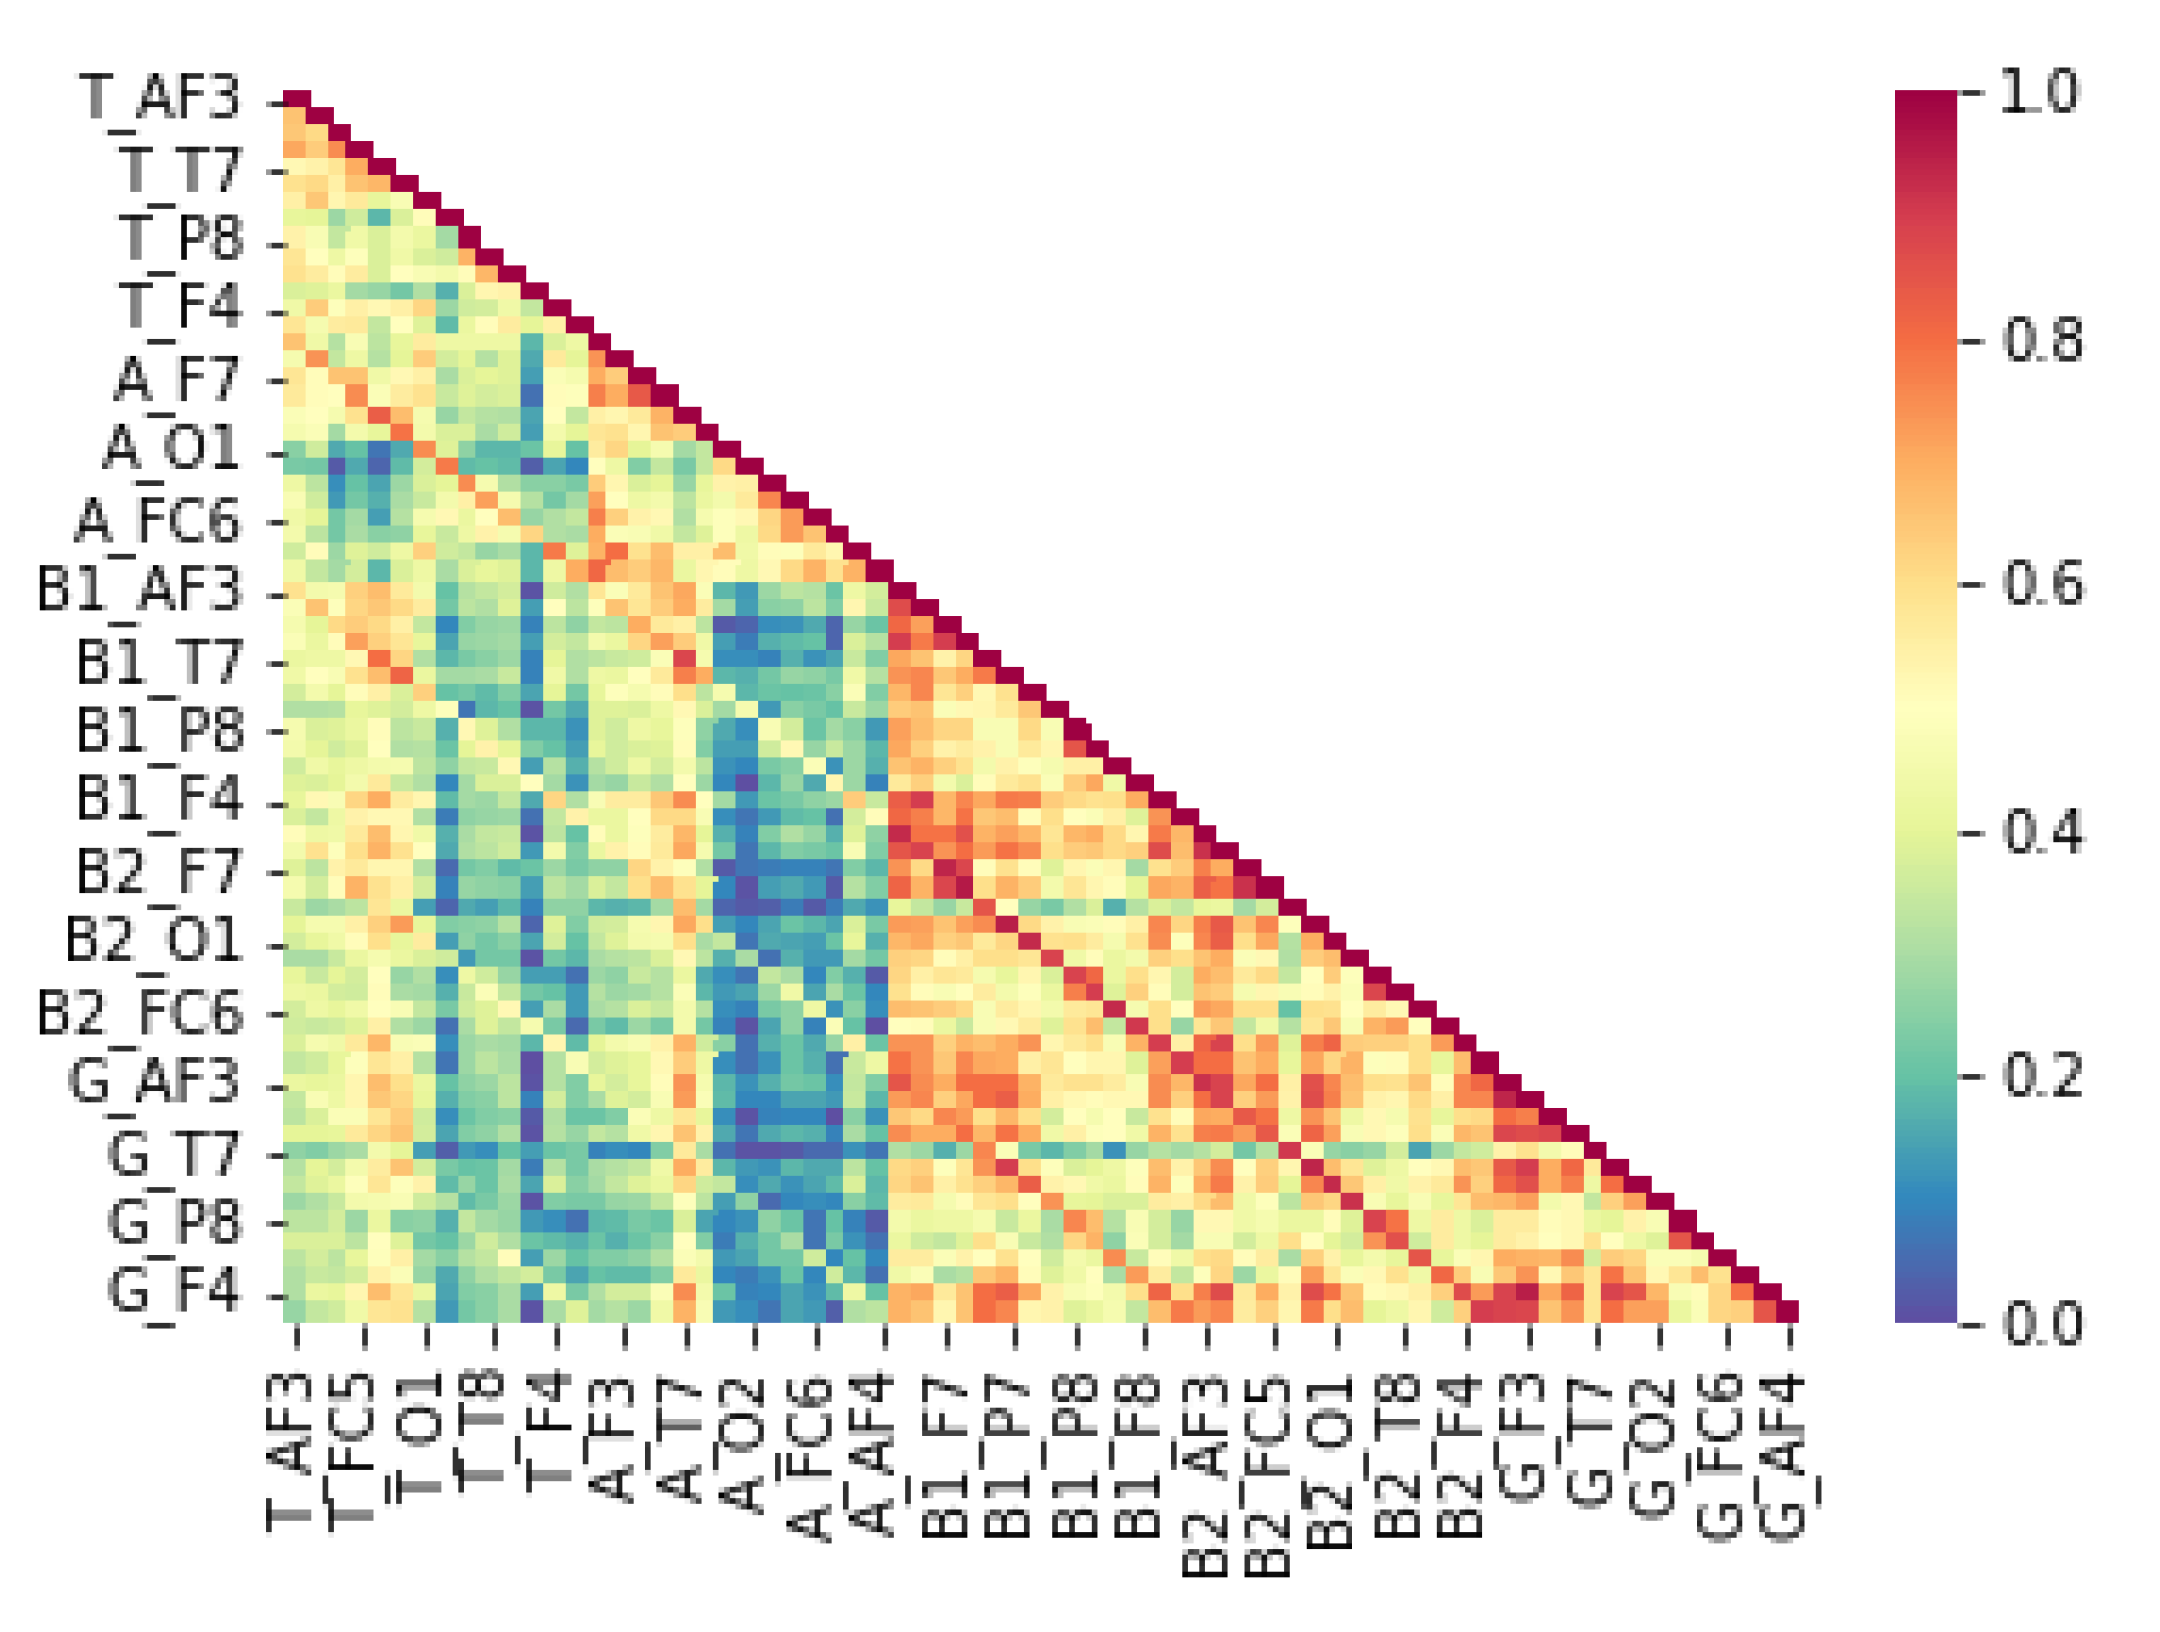
Figure 5.
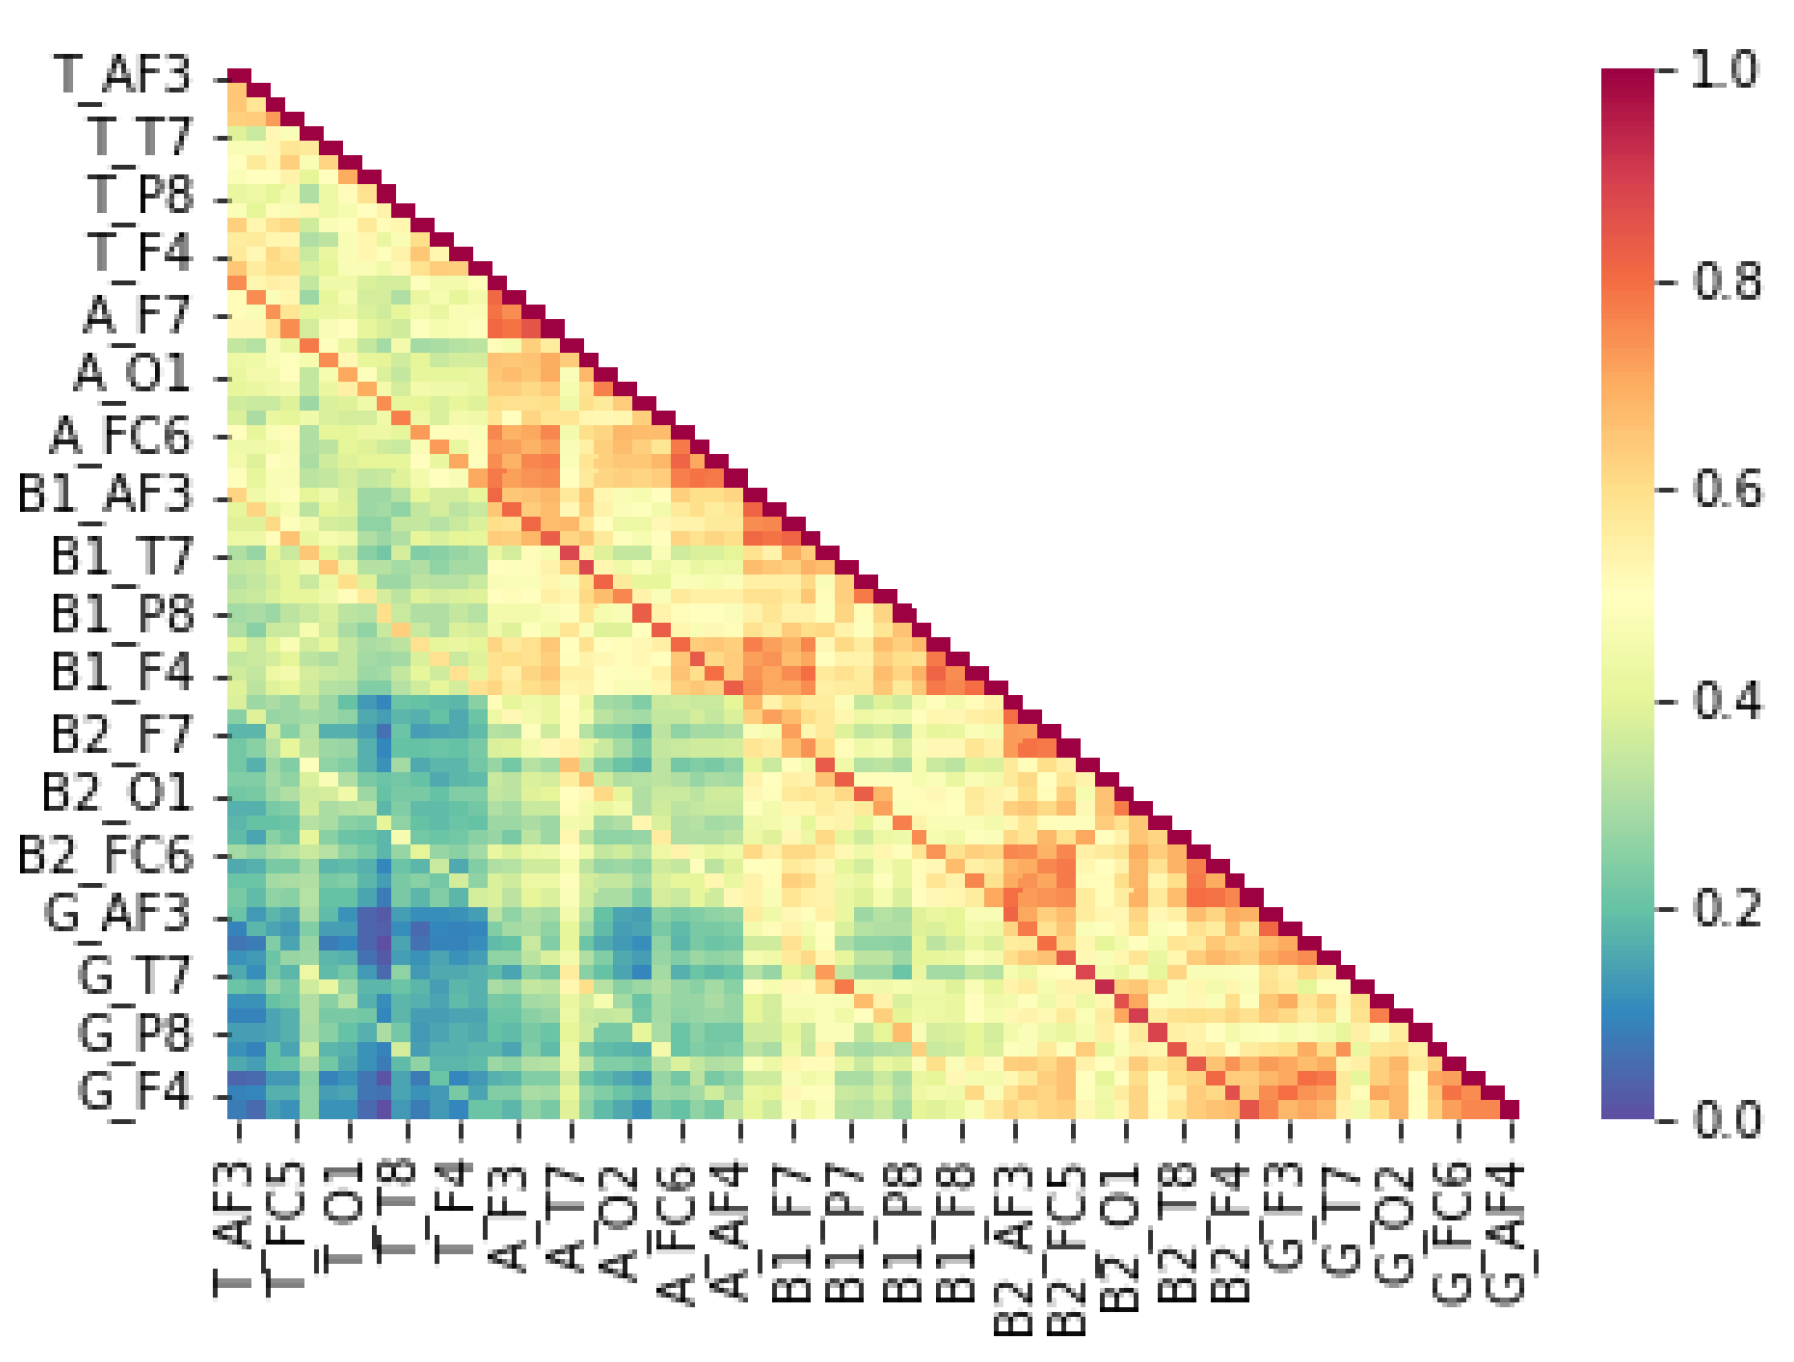
Figure 6.
Auto Train Brain.
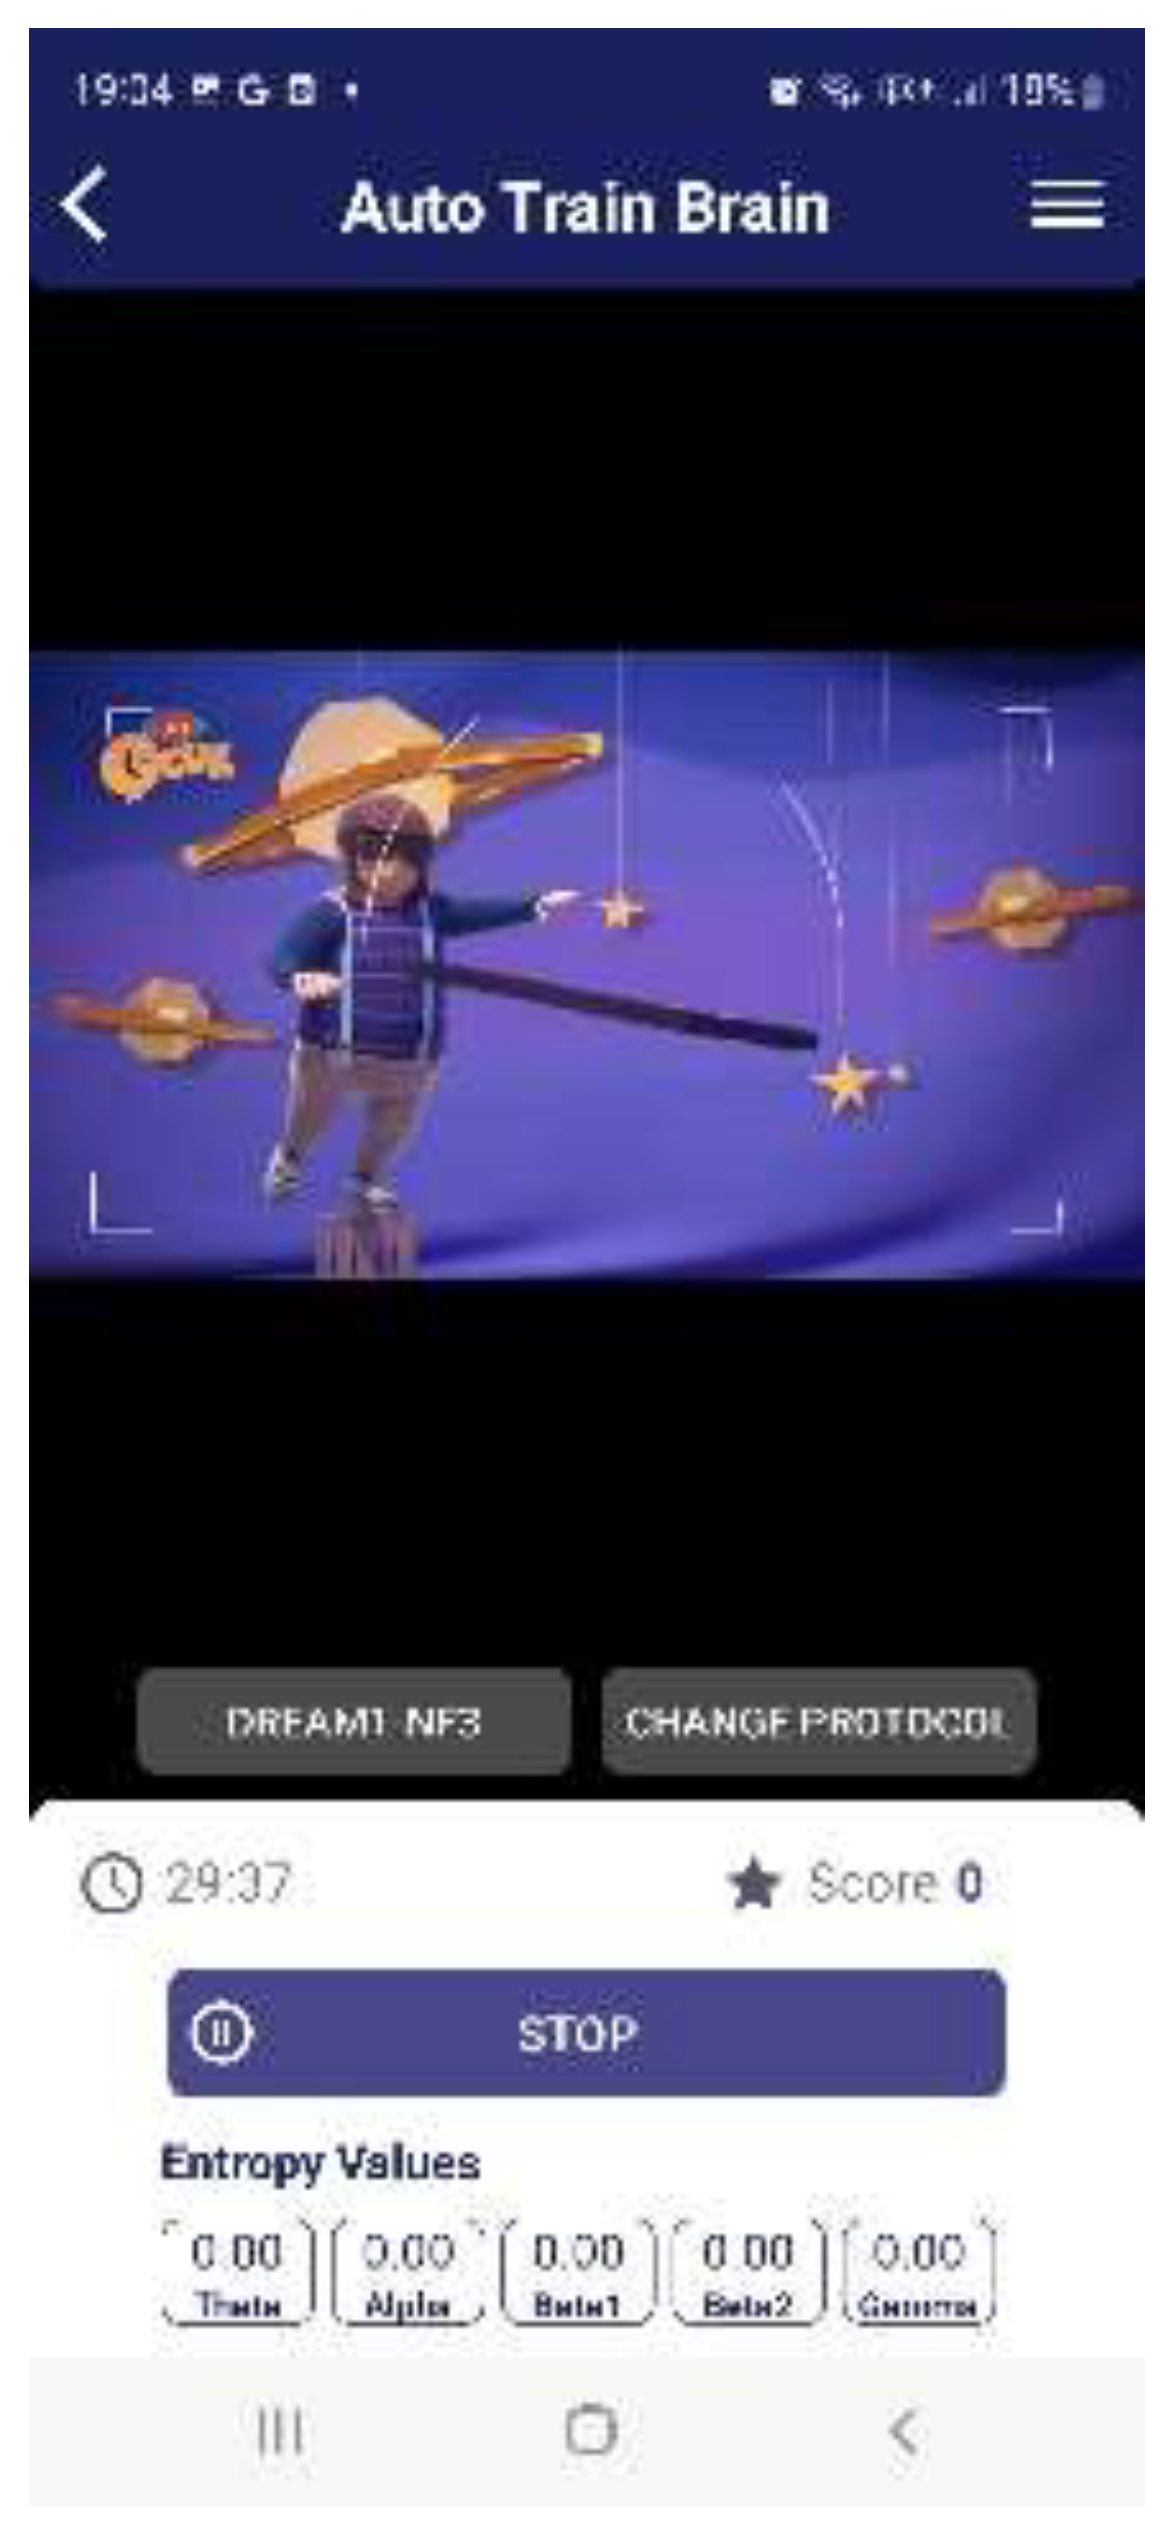
Figure 7.
Increased theta band power in the whole scalp in learning disabilities compared with typically growing children.
Figure 7.
Increased theta band power in the whole scalp in learning disabilities compared with typically growing children.
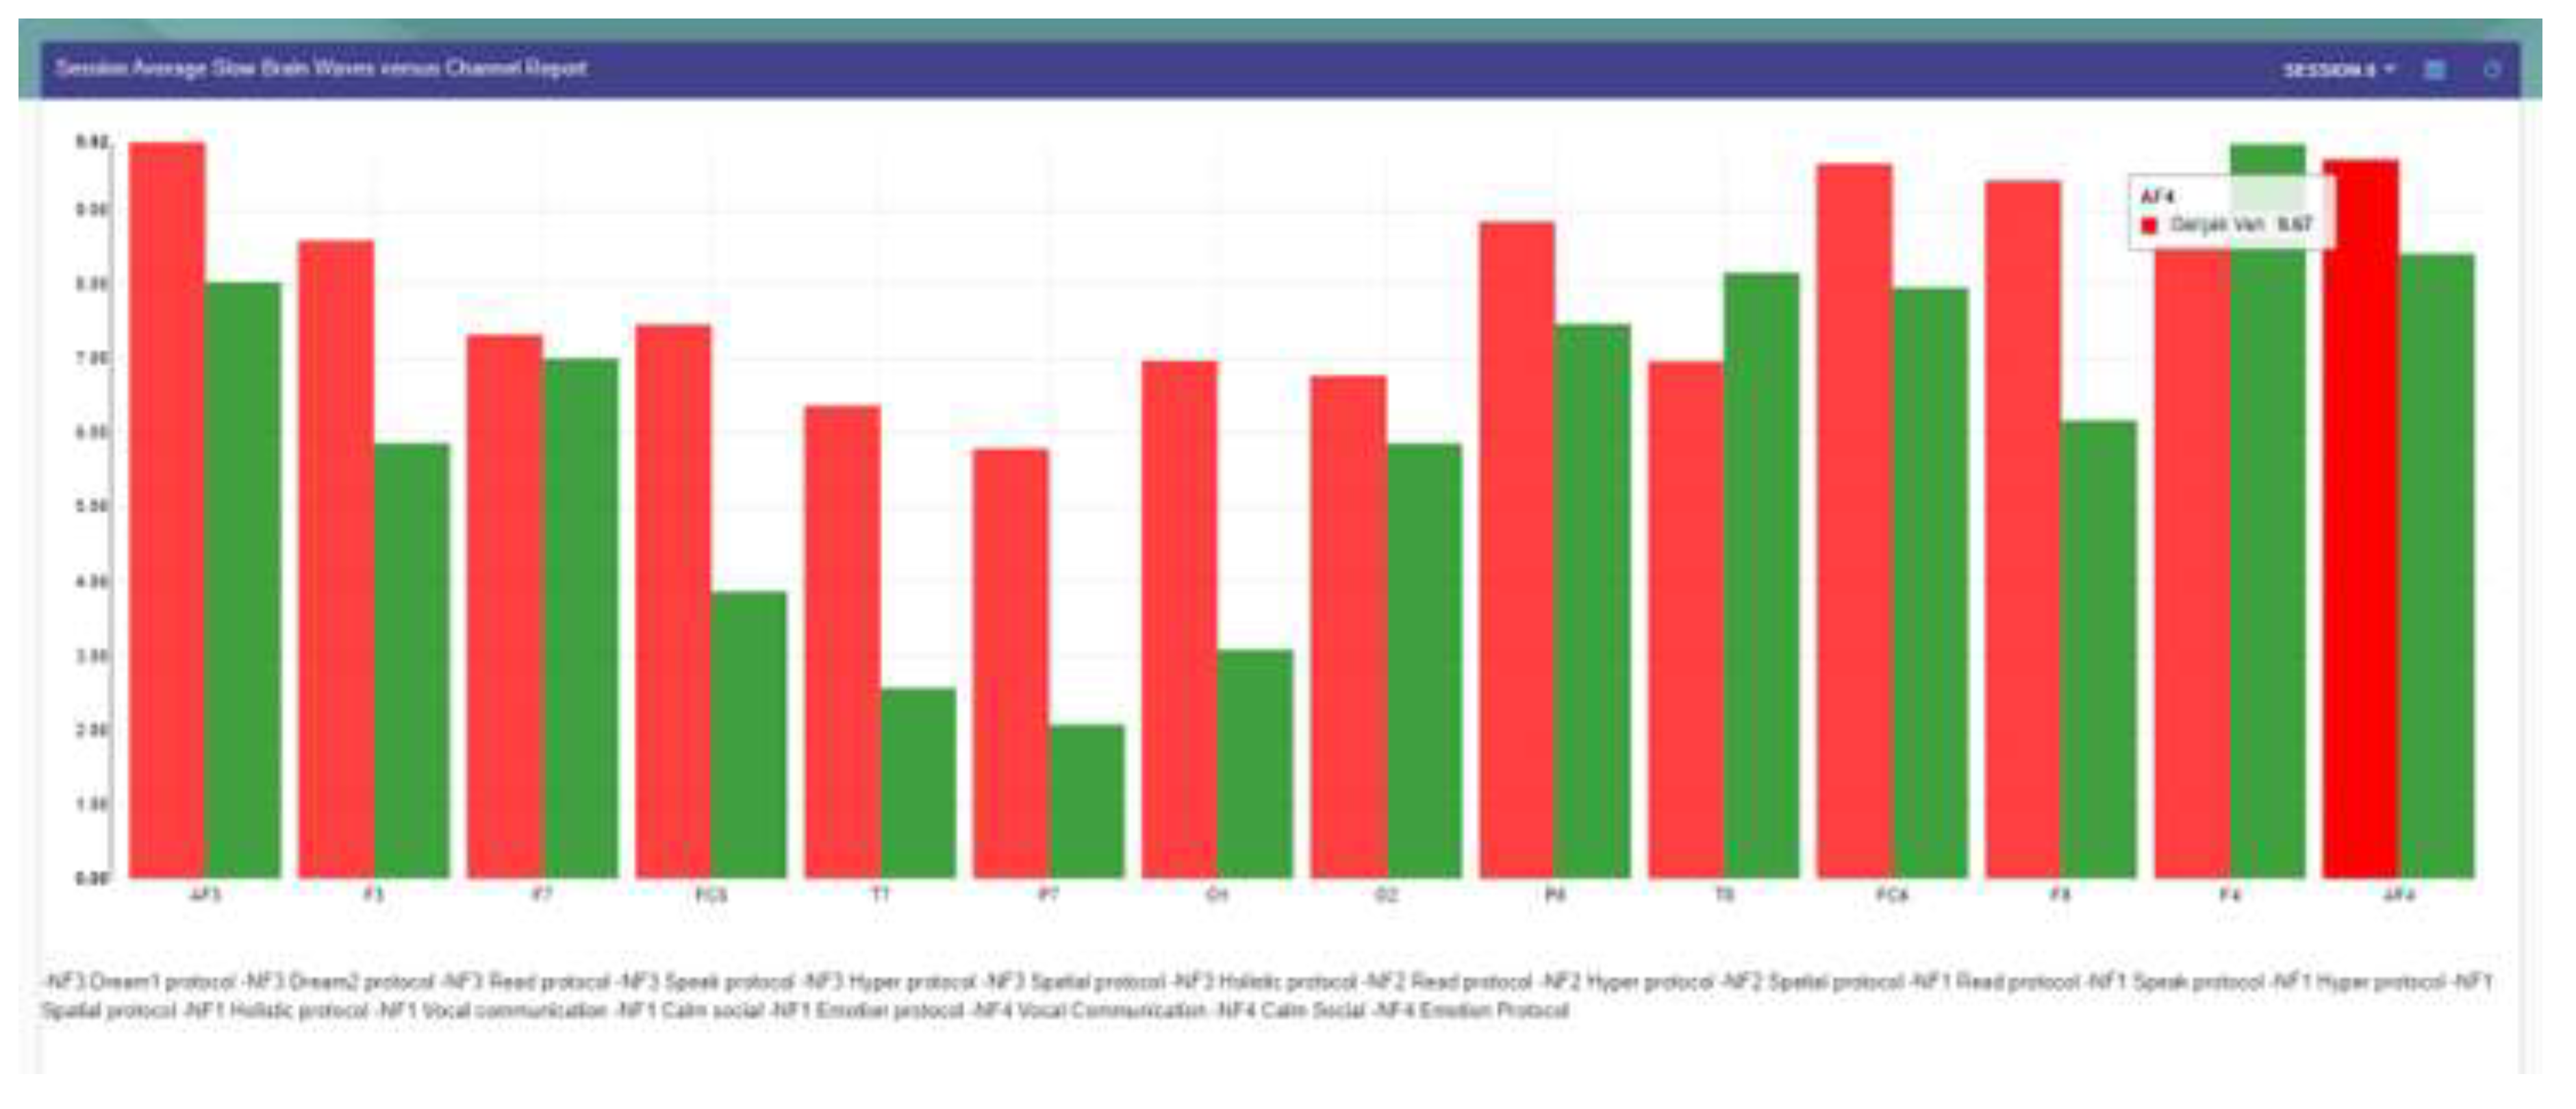
Figure 8.
Increased theta band power in the left hemisphere in learning disabilities compared with typically growing children.
Figure 8.
Increased theta band power in the left hemisphere in learning disabilities compared with typically growing children.
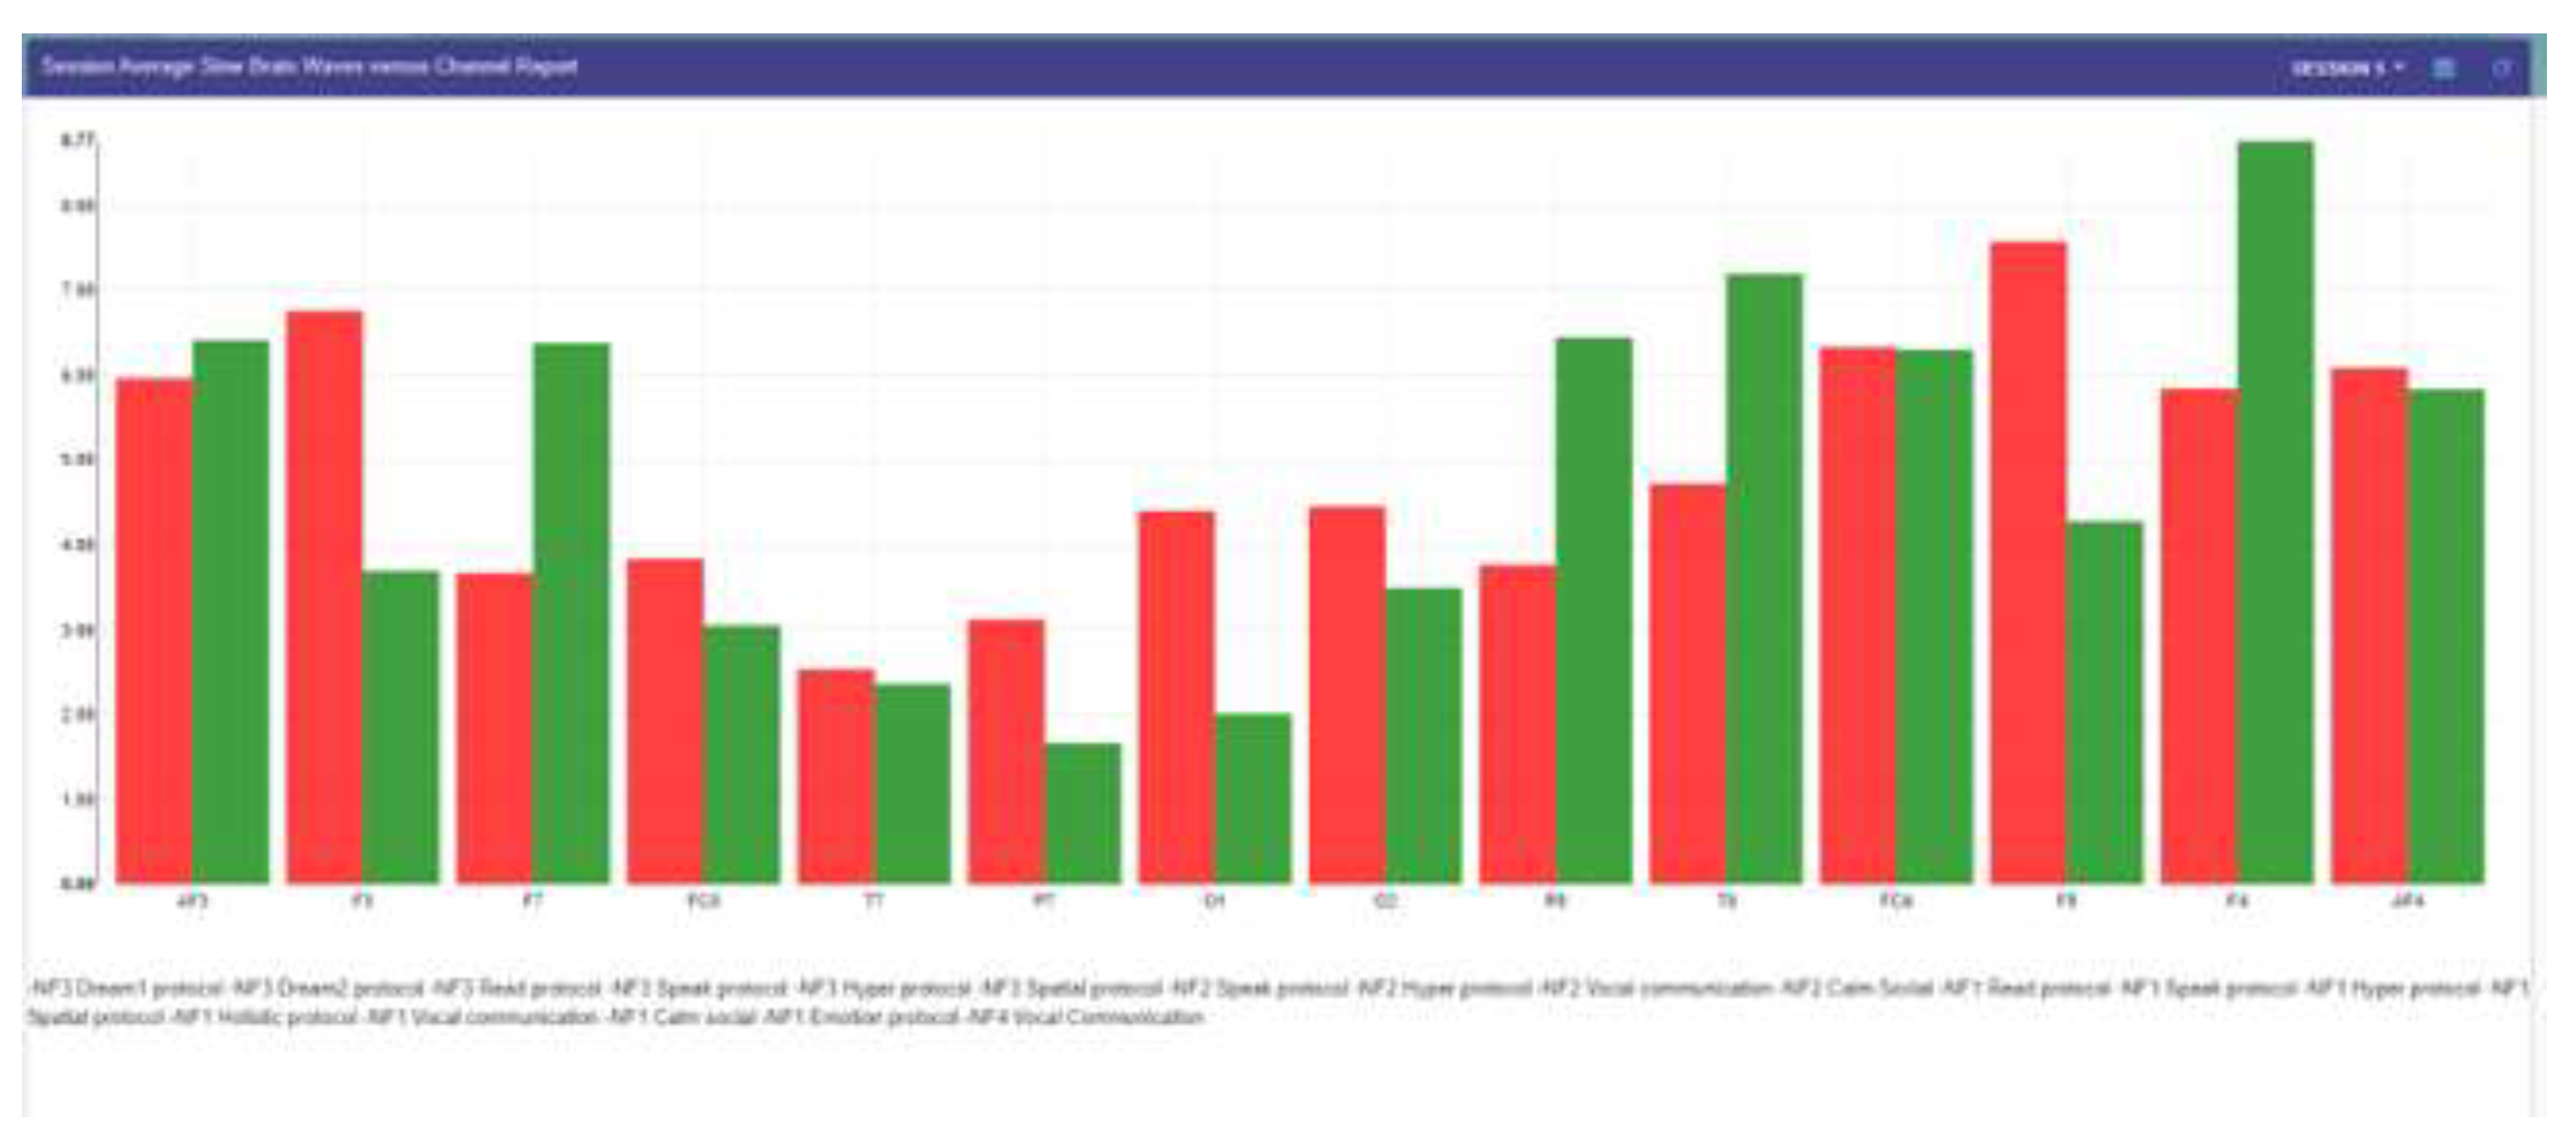

Table 1.
Top 3 ANN Models for Dyslexia Biomarker Detection.
| Model Architecture | Accuracy | F1 Score | Loss | (AUC) |
| Layer 1: Tanh, Layer 2: Softsign, Layer 3: Tanh, Layer 4: Sigmoid | 98.50% | 98.30% | 0.06 | 0.97 |
| Min-Max Scaler + Layer 1: Tanh, Layer 2: Softsign, Layer 3: Tanh, Layer 4: Sigmoid | 98.30% | 98.30% | 0.08 | 0.96 |
Table 2.
Performance Metrics of the ANN Model.
| Metric | Measured Value |
| Accuracy | 98.50% |
| F1 Score | 98.33% |
| Sensitivity | 99.18% |
| Specificity | 97.30% |
Disclaimer/Publisher’s Note: The statements, opinions and data contained in all publications are solely those of the individual author(s) and contributor(s) and not of MDPI and/or the editor(s). MDPI and/or the editor(s) disclaim responsibility for any injury to people or property resulting from any ideas, methods, instructions or products referred to in the content. |
© 2025 by the authors. Licensee MDPI, Basel, Switzerland. This article is an open access article distributed under the terms and conditions of the Creative Commons Attribution (CC BY) license (http://creativecommons.org/licenses/by/4.0/).
Copyright: This open access article is published under a Creative Commons CC BY 4.0 license, which permit the free download, distribution, and reuse, provided that the author and preprint are cited in any reuse.


