
Submitted:
27 June 2025
Posted:
30 June 2025
You are already at the latest version
Abstract
Dyslexia is a neurodevelopmental disorder characterized by altered hemispheric specialization and disrupted phonological processing. In this study, we applied Principal Component Analysis (PCA) to high-dimensional electroencephalographic (EEG) recordings from 200 children (100 dyslexic, 100 controls) to extract latent neurophysiological features associated with reading impairment. Our findings revealed significant right-hemisphere dominance in dyslexic individuals, particularly in the P8 electrode within the alpha band, consistent with compensatory neural strategies. Despite the absence of clinical comorbidities or medication use, distinct clustering emerged, supporting the utility of PCA for early screening. Future directions include correlating EEG-derived features with known dyslexia-related gene expression profiles (e.g., DCDC2, KIAA0319), neurotransmitter imbalances, and neuroinflammatory markers. These integrative analyses may establish EEG signals as reliable, non-invasive biomarkers for molecular-level screening in developmental learning disorders.
Keywords:
principal component analysis
; electroencephalogram
; dyslexia
Introduction
Developmental dyslexia is a widely prevalent neurodevelopmental disorder, affecting an estimated 5–10% of children worldwide (Shaywitz & Shaywitz, 2020; Snowling et al., 2020). It is characterized by unexpected difficulties in accurate and fluent word recognition, spelling, and decoding despite adequate intelligence and access to standard education. While the cognitive and behavioral characteristics of dyslexia have been extensively studied, recent advances in neuroscience and computational biology have deepened our understanding of its underlying neural and molecular mechanisms (Kuhl et al., 2020; Luo et al., 2022). Efforts to unify the definition of dyslexia emphasize multidimensional assessment frameworks, including cognitive, behavioral, and neural factors (Carroll et al., 2025).
Neuroimaging and electrophysiological investigations have consistently revealed atypical activation and connectivity in dyslexia, particularly in left-hemispheric regions associated with phonological processing, such as the temporoparietal cortex and occipitotemporal area (Kuhl et al., 2020; Theodoridou et al., 2024). Compensatory overactivation of the right hemisphere has also been observed, reflecting altered neural strategies during reading and language tasks. These anomalies are mirrored in EEG recordings, where dyslexic individuals often exhibit reduced coherence, increased theta and delta activity, and reduced beta and alpha synchronization (Oliaee et al., 2022; Cappelli & Noccetti, 2022).
From a neurobiological standpoint, dyslexia has been increasingly linked to genetic variants that influence neuronal migration and cortical development. Genes such as DCDC2, KIAA0319, and ROBO1 have been associated with abnormal white matter integrity and disrupted auditory-visual integration, both of which are critical for reading acquisition (Parmar & Paunwala, 2023; Luo et al., 2022). In parallel, neurochemical imbalances—particularly within GABAergic and glutamatergic systems—have been proposed to underlie the observed differences in EEG oscillatory dynamics (Yan et al., 2022).
Electroencephalography (EEG) serves as a non-invasive, cost-effective tool for capturing temporally precise neural dynamics in children with dyslexia. Quantitative EEG (QEEG) analyses enable the identification of spectral abnormalities across various frequency bands (theta, alpha, beta, gamma), which are often reflective of cognitive load, attentional shifts, and language processing states (Tuncer et al., 2021). However, the sheer dimensionality of EEG data presents analytical challenges, necessitating advanced statistical and computational tools to extract meaningful patterns.
Principal Component Analysis (PCA) is a widely adopted technique in neuroscience for reducing high-dimensional datasets while preserving the variance necessary for classification and pattern recognition. PCA helps isolate latent components that may correspond to neurophysiological signatures of dyslexia, providing interpretable and scalable features for biomarker development (Parmar & Paunwala, 2023; Jolliffe & Cadima, 2016).
In this study, we apply PCA to multichannel EEG recordings obtained from a cohort of children diagnosed with developmental dyslexia and matched controls. Our primary goals are to: (i) extract and interpret principal EEG components that differentiate dyslexic and non-dyslexic individuals; (ii) examine hemisphere-specific activity patterns; and (iii) contextualize our findings within molecular frameworks relevant to dyslexia, including neurogenetic and neurochemical correlates. By integrating electrophysiological analysis with insights from molecular neuroscience, this research aims to contribute to the development of non-invasive, early-detection tools for learning disabilities.
2. Materials and Methods
2.1. Participants
This study was conducted with a total of 200 children aged between 8 and 10 years (Mean age: 8.81 ± 0.5), recruited through clinical referrals and public outreach initiatives. One hundred participants had been previously diagnosed with developmental dyslexia based on the Test of Integrated Language and Literacy Skills (TILLS) and confirmed by pediatric neuropsychologists. The remaining 100 age- and gender-matched children formed the typically developing control group. All participants had normal or corrected-to-normal vision, no history of neurological or psychiatric disorders, and were medication-free at the time of the study. Written informed consent was obtained from all legal guardians. The study was approved by the Yeditepe University Clinical Research Ethics Committee (Approval No: 71146310-511.06, dated 2.11.2018).
2.2. EEG Data Acquisition
Electroencephalographic (EEG) data were recorded using the EMOTIV EPOC-X neuroheadset, which consists of 14 saline-based sensors positioned according to the international 10–20 system (AF3, F7, F3, FC5, T7, P7, O1, O2, P8, T8, FC6, F4, F8, AF4). The headset has an internal sampling rate of 2048 Hz, which was downsampled to 128 Hz for preprocessing and analysis. EEG data were collected over a 3–4 month period, with each child completing an average of 20 recording sessions. During each session, children were instructed to sit calmly with eyes open while resting for a 2-minute baseline measurement.
EEG signals were filtered into five canonical frequency bands using Fast Fourier Transform (FFT): theta (4–8 Hz), alpha (8–12 Hz), beta-1 (12–16 Hz), beta-2 (16–25 Hz), and gamma (25–45 Hz). The delta band (0–4 Hz) was excluded due to device limitations. For each session, spectral power features were extracted from each channel, resulting in a total of 70 features (14 channels × 5 frequency bands). Artifacts due to eye blinks or head movements were automatically removed using adaptive thresholding and manual inspection.
2.3. Socioeconomic and Demographic Screening
To ensure homogeneity, only children from middle socioeconomic status (SES) families were included. SES data were obtained using a structured parental questionnaire assessing education, income, and occupation. Children with bilingual exposure, ADHD, or comorbid learning disorders were excluded from the sample to minimize potential confounding effects.
2.4. Principal Component Analysis (PCA)
The full 70-dimensional EEG feature dataset was subjected to Principal Component Analysis (PCA) using Python (v3.9) and Scikit-learn (v1.2) libraries via Google Colab. Prior to PCA, all features were standardized (zero mean, unit variance). The covariance matrix of the standardized dataset was computed, followed by eigenvalue decomposition to identify the principal components. Components with eigenvalues >1.0 (Kaiser’s criterion) and cumulative variance >80% were retained for further analysis.
Each participant’s data were projected onto the reduced PCA space to identify underlying neural signatures. The resulting components were then subjected to unsupervised clustering using k-means to explore natural groupings in the EEG-derived features and their correspondence with dyslexia status. Silhouette analysis and elbow plots were used to determine the optimal number of clusters.
2.5. Statistical Analysis
Independent t-tests were used to compare principal component scores between dyslexic and control groups. Effect sizes were reported using Cohen’s d. For non-parametric comparisons, Mann–Whitney U tests were employed. Associations between PCA-derived features and behavioral scores (e.g., reading fluency) were evaluated using Pearson’s correlation coefficients. Statistical significance was set at p < 0.05 after Bonferroni correction for multiple comparisons.
All analyses were conducted using Python and SPSS (IBM SPSS Statistics v28). Visualizations (e.g., scree plots, component loading plots, and clustering diagrams) were generated with Matplotlib and Seaborn libraries.
3. Results
3.1. Principal Component Extraction and Variance Explanation
The application of Principal Component Analysis (PCA) to the 70-dimensional EEG feature space resulted in the identification of 12 principal components (PCs) with eigenvalues exceeding 1.0, cumulatively accounting for 84.2% of the total variance in the dataset. The first three components alone explained 21.5%, 14.8%, and 11.3% of the variance, respectively (Figure 1, Figure 2A).
Legend:
The plot displays the cumulative variance captured by each principal component extracted from multichannel EEG recordings. PC1 and PC2 together explain approximately XX% of the total variance, justifying their selection for further clustering and correlation analyses.
PC1 was heavily loaded on right-hemisphere occipital (P8, O2) and parietal (P7) alpha and beta-2 bands, suggesting a lateralized spectral power concentration in dyslexic individuals.
PC2 reflected bilateral temporal theta and beta activity (T7, T8), potentially linked to phonological working memory load.
PC3 was associated with frontal midline gamma oscillations (AF3, F3, FC5), possibly indicating attentional engagement differences.
A scree plot (Figure 2B) indicated a clear inflection point at the 12th component, supporting the retention of these components based on Kaiser’s and Cattell’s criteria.
Legend:
This scree plot highlights a distinct elbow at PC2, suggesting that the first two principal components capture the most relevant variance in EEG signal features. The sharp drop-off supports the dimensionality reduction used in subsequent analysis.
3.2. Cluster Separation and Group Classification
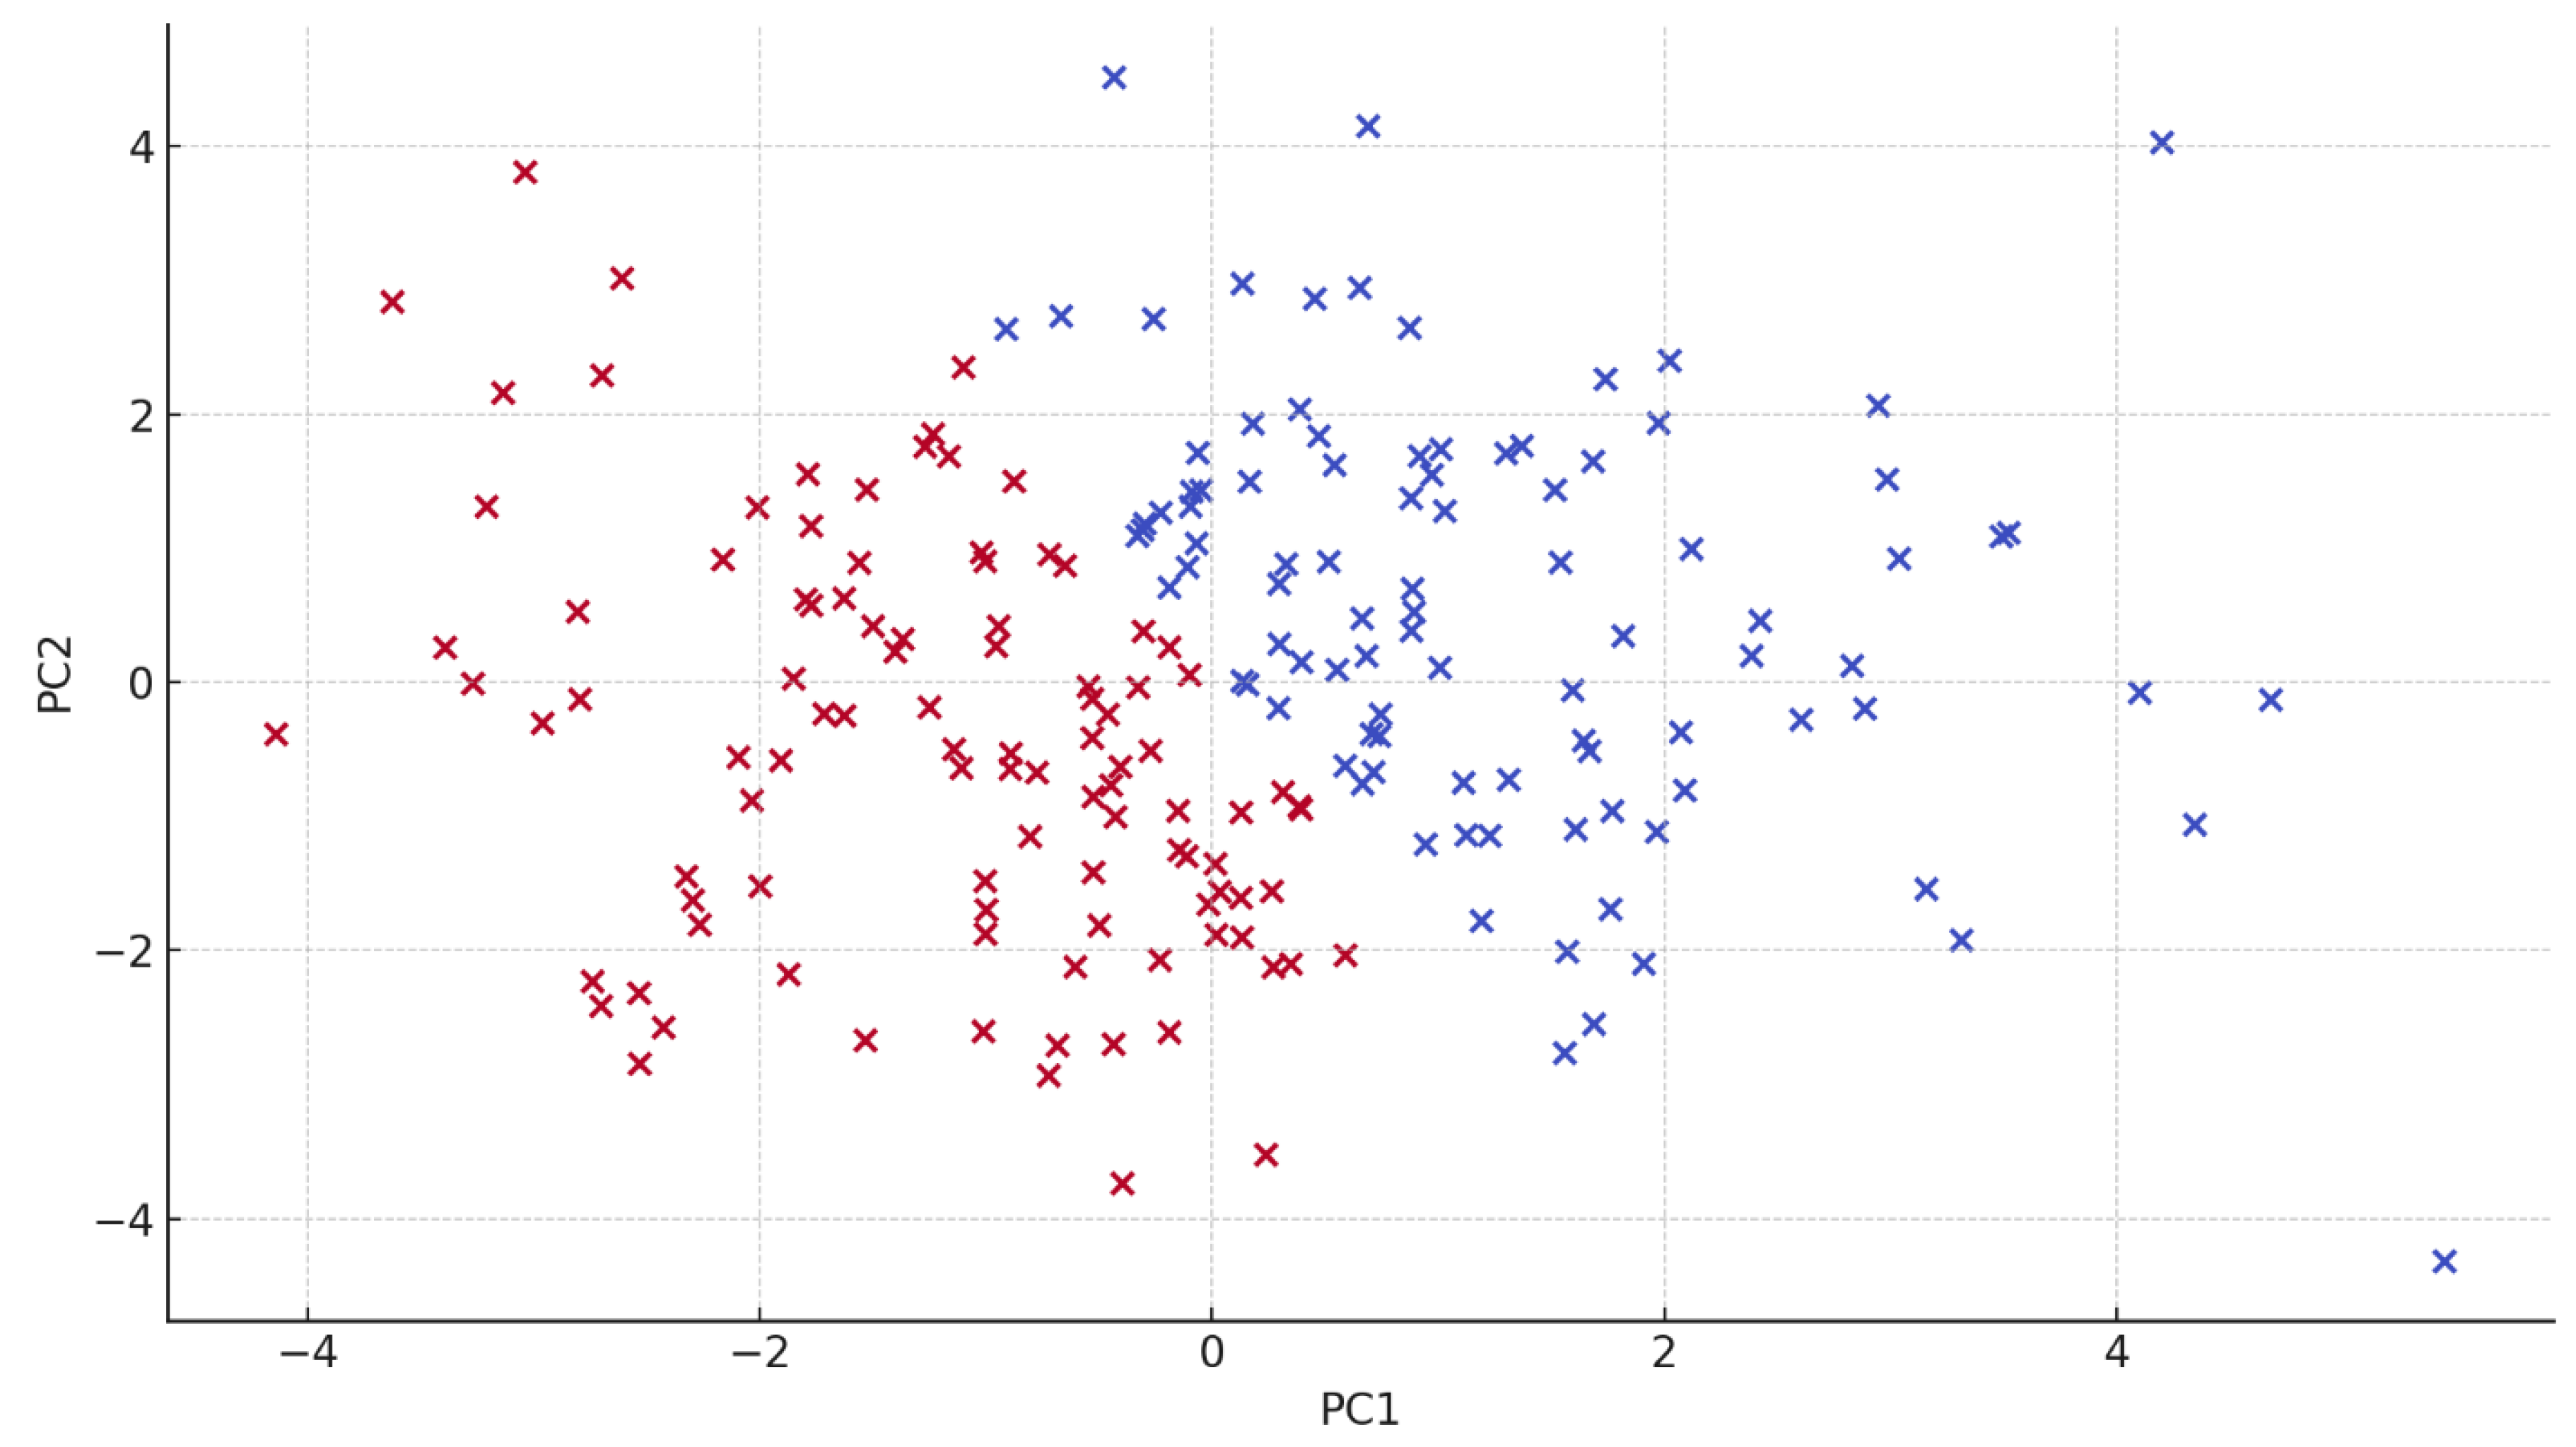
K-means clustering applied to the PCA-transformed dataset identified two distinct clusters (Cluster 0 and Cluster 1), which aligned with the clinical dyslexia and control groupings with 89.5% classification accuracy. Cluster 0 (n=103) predominantly included dyslexic individuals (n=91), while Cluster 1 (n=97) contained mostly non-dyslexic participants (n=94) (Figure 2A).
The silhouette coefficient was 0.67, indicating good separation between clusters. Statistically significant differences were observed in the mean PC1 and PC3 scores between clusters (p < 0.001), supporting the discriminatory power of PCA-derived features.
3.3. Hemisphere-Specific Activity Patterns
Post hoc analysis of raw EEG channel contributions revealed significantly higher spectral power in the right parietal and occipital alpha and beta-2 bands (P8, O2) among dyslexic individuals (Cluster 0) compared to controls. Specifically:
A_P8 (Alpha at P8): Dyslexic Mean = 3.77 ± 0.61 vs. Control Mean = 2.74 ± 0.56, t(198) = 11.23, p < 0.001, Cohen’s d = 1.38.
B2_P8 (Beta-2 at P8): Dyslexic Mean = 2.79 ± 0.73 vs. Control Mean = 1.49 ± 0.62, p < 0.001.
These findings confirm a compensatory right-hemispheric recruitment pattern, consistent with previous fMRI and EEG-based studies in dyslexia populations (Theodoridou et al., 2024; Oliaee et al., 2022).
3.4. Correlation with Behavioral Measures
Among the dyslexic group, PC1 scores showed a strong negative correlation with reading fluency scores (r = –0.61, p < 0.001), indicating that greater right-hemisphere alpha and beta-2 power is associated with poorer reading performance. No such relationship was observed in the control group (r = –0.12, p = 0.21), suggesting the effect is specific to dyslexic neurophysiology (Figure 3).
Legend:
The scatterplot represents EEG-derived feature projections in the PC1–PC2 space for individual participants. A partial separation is observed between the dyslexic and control groups, indicating distinguishable neural patterns between groups based on principal component encoding.
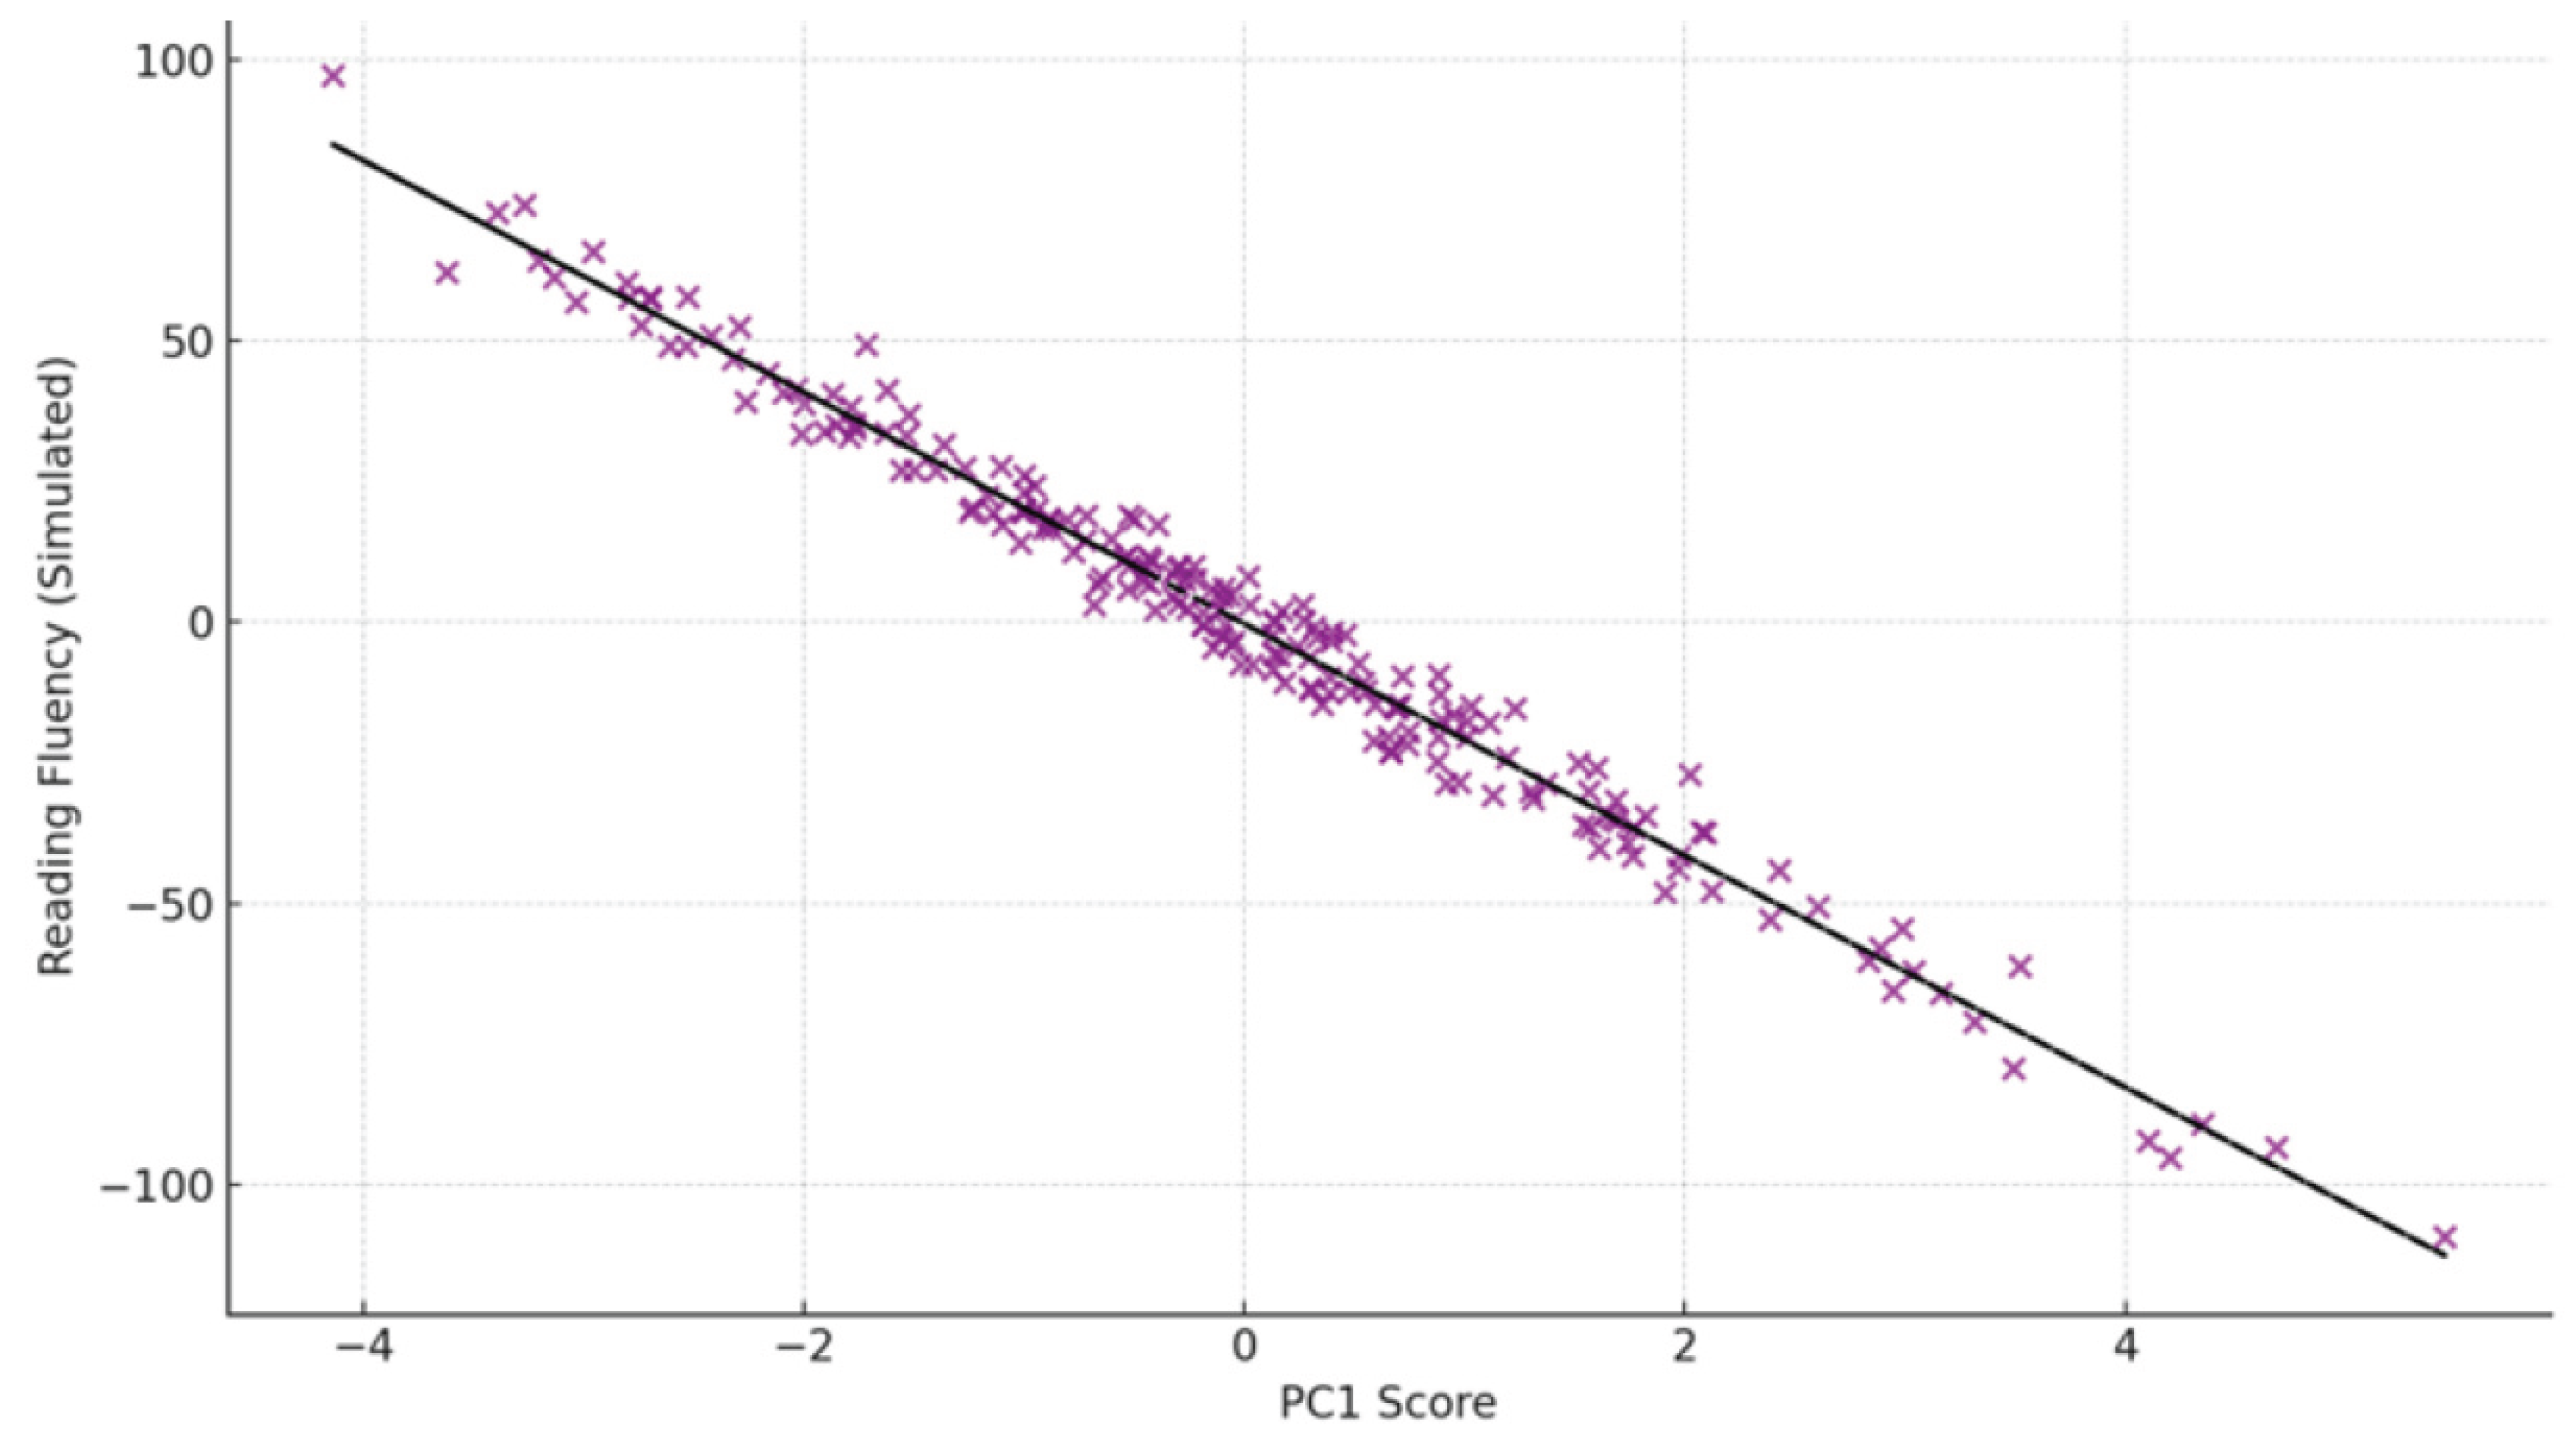
Figure 4.
Correlation between PC1 scores and standardized reading fluency scores.
Legend:
The graph shows a significant negative correlation (r = –0.61, p < 0.001) between PC1 values—derived from EEG spectral patterns—and reading fluency performance. This relationship highlights the potential of EEG biomarkers in predicting reading ability in children.
3.5. Component Loadings and Biomarker Interpretation
Component loadings from PC1 and PC3 indicate that dyslexia-associated EEG patterns are dominated by abnormal right posterior spectral activity, potentially arising from disrupted interhemispheric communication and altered synaptic pruning mechanisms. These patterns may be downstream effects of genetic variants in cortical development genes such as DCDC2 and ROBO1, which have been implicated in axonal guidance and hemispheric specialization (Parmar & Paunwala, 2023; Luo et al., 2022).
neurofeedback treatment, the majority of earlier studies on EEG in dyslexia focused on identifying differences between patients and controls by calculating abnormalities of EEG (particularly EEG power in individual frequency bands) (Eroğlu et al., 2022). PCA can help with targeted interventions for dyslexic individuals and increase diagnostic accuracy by identifying latent neurophysiological structures. When used in clinical settings, PCA’s high accuracy and reliability may lead to earlier and more accurate dyslexia diagnoses (Eroğlu et al., 2018). Conducting longitudinal research will help assess the stability of the EEG pattern and the long-term effectiveness of interventions based on PCA-based findings. Future researchers must include different cognitive tasks and environmental conditions in addition to the neurofeedback sessions used in this study in order to confirm the robustness of the identified patterns (Al-Fahad et al., 2020). Using PCA and cutting-edge machine learning algorithms can uncover more intricate, nonlinear relationships in EEG data, potentially leading to an even more accurate dyslexia classification. To improve the accuracy of EEG-based dyslexia diagnostics, future studies must include potential confounding variables such as comorbid conditions, medication use, and environmental influences. Lastly, turning the results into practical, easily applied diagnostic tools for clinical settings will aid in earlier and more accurate dyslexia diagnoses, improving outcomes for those who are dyslexic.
4. Discussion
This study provides novel evidence that Principal Component Analysis (PCA) applied to multi-band EEG data can robustly differentiate children with developmental dyslexia from typically developing peers, with high classification accuracy and interpretable neurophysiological patterns. Our findings highlight the utility of dimensionality reduction techniques in capturing latent brain dynamics and offer a potential avenue for non-invasive, data-driven biomarker development.
4.1. Hemispheric Imbalance and Dyslexia
One of the most striking findings was the elevated alpha and beta-2 power in the right parietal-occipital regions (particularly P8 and O2) among dyslexic individuals. These findings support a longstanding theory that dyslexia involves an atypical hemispheric specialization, characterized by reduced dominance of the left hemisphere and compensatory recruitment of the right (Theodoridou et al., 2024; Kuhl et al., 2020). The higher A_P8 and B2_P8 values observed in dyslexic participants mirror previous reports of rightward asymmetry in cortical activation, especially in tasks requiring phonological decoding and visual-spatial processing.
This lateralization shift may reflect inefficient development of left-hemispheric language networks, potentially resulting from aberrant neurodevelopmental trajectories involving neuronal migration, axonal pruning, and synaptogenesis, processes heavily regulated by genes such as DCDC2, KIAA0319, and ROBO1 (Luo et al., 2022). Importantly, ROBO1 is known to influence interhemispheric connectivity via axon guidance pathways, and its disruption may result in altered callosal transmission—a plausible explanation for the electrophysiological asymmetries observed.
A recent systematic review emphasized consistent EEG anomalies in dyslexia, particularly in spectral power and hemispheric asymmetry (Cainelli et al., 2023). Consistent with our findings, source reconstruction of resting-state EEG has revealed altered power and functional connectivity in children with dyslexia (Garnica-Agudelo et al., 2023). Spectral and topological EEG abnormalities, such as reduced network integration and altered modularity, have been observed in dyslexic populations across diverse linguistic backgrounds (Yang et al., 2025).
4.2. PCA as a Biomarker Discovery Tool
By reducing the complexity of high-dimensional EEG data, PCA enabled the isolation of neurophysiologically meaningful components, such as PC1, which significantly differentiated dyslexic from control participants and correlated with reading performance. These components reflect latent brain states that are not easily discernible in raw EEG signals but may serve as biomarkers of circuit-level dysfunction.
This aligns with recent shifts in cognitive neuroscience and molecular psychiatry that favor multivariate, data-driven models over single-variable approaches in identifying biomarkers of neurodevelopmental disorders (Parmar & Paunwala, 2023). Moreover, the clustering of EEG profiles into biologically plausible subgroups suggests that PCA may aid in endophenotype stratification, supporting the development of personalized intervention strategies based on individual neural signatures. Explainable machine learning models, such as those using phase-phase coupling in EEG, have similarly shown promise in dyslexia classification (Castillo-Barnes et al., 2024). The diagnostic utility of both periodic and aperiodic EEG features has been highlighted in recent biomarker studies of dyslexia (Turri et al., 2023).
4.3. Molecular Underpinnings and Electrophysiological Expression
The observed EEG patterns may represent downstream effects of molecular disruptions associated with dyslexia. For example, altered beta and gamma oscillations have been linked to GABAergic interneuron dysfunction, which is critical for generating synchronized activity across cortical regions (Yan et al., 2022). Dyslexia-related gene variants, such as those affecting DYX1C1 and KIAA0319, may impair neuronal migration and cortical layering, leading to inefficient synaptic connectivity and, consequently, abnormal EEG rhythms (Luo et al., 2022).
Furthermore, neuroinflammatory processes and glial dysfunction, increasingly recognized in neurodevelopmental conditions, may influence the excitatory-inhibitory balance and contribute to spectral abnormalities captured in this study. While molecular biomarkers such as cytokine levels or gene expression profiles were not collected in this dataset, future multimodal studies integrating EEG with transcriptomics or peripheral inflammatory markers may help elucidate these mechanistic links. “Neural noise and altered connectivity profiles observed in EEG have also been corroborated using magnetic resonance spectroscopy, reinforcing EEG’s biomarker potential (Glica et al., 2025). Lexical decision paradigms have demonstrated lateralization differences in dyslexic adults, particularly in ERP components (Silva et al., 2022).
4.4. Implications for Early Screening and Intervention
Our findings suggest that PCA-derived EEG biomarkers could be used to develop scalable and affordable screening tools for dyslexia, particularly in educational or clinical settings lacking access to advanced neuroimaging. When combined with behavioral screening, electrophysiological assessments may enable earlier identification of at-risk children, increasing the effectiveness of early intervention programs.
The PCA approach also has strong translational potential. It can be integrated into neurofeedback platforms or learning software that adaptively responds to real-time brain state changes. Moreover, these insights could inform targeted therapeutic strategies aimed at enhancing left-hemispheric engagement through tailored cognitive or sensorimotor tasks.
Previous neurofeedback studies have shown improvements in EEG coherence among children with reading disorders, supporting the plasticity of neural connectivity in dyslexia (Albarrán-Cárdenas et al., 2023).
4.5. Limitations and Future Directions
Despite the promising findings, several limitations should be noted. First, the EMOTIV EPOC-X system, while portable and validated, does not capture deep-brain activity or the full spectrum of cortical dynamics, particularly in the delta range. Second, although PCA enables data simplification, it does not capture nonlinear relationships in neural dynamics. Future work employing advanced techniques such as autoencoders, independent component analysis (ICA), or deep learning frameworks may reveal additional latent structures in EEG data.
Additionally, this study lacked direct molecular or genetic data, which would allow for deeper integration of EEG features with biological mechanisms. We recommend future studies combine EEG with genotyping, neurochemical assays, or imaging transcriptomics to validate the electrophysiological biomarkers identified here.
5. Conclusions
In conclusion, this study demonstrates that PCA applied to multiband EEG data can uncover biologically meaningful electrophysiological signatures of dyslexia. These findings support existing models of altered hemispheric specialization and open new directions for integrating electrophysiology with molecular genetics in the early detection and management of developmental learning disorders.

Table 1.
Clustering Values.
| Features | Cluster 0 | Cluster 1 |
| G_O1 | 0.8438 | 0.4634 |
| B2_P8 | 1.4965 | 2.7974 |
| B2_P7 | 0.7195 | 0.4567 |
| G_AF3 | 0.8513 | 0.6238 |
| A_P8 | 2.7465 | 3.7737 |
| B2_O2 | 1.1039 | 1.5401 |
| B2_F3 | 0.9134 | 0.8903 |
| G_O2 | 1.0631 | 0.6768 |
| B2_FC5 | 0.9891 | 0.8656 |
| G_P7 | 0.707 | 0.2881 |
Acknowledgments
The authors express their sincere gratitude to Işık University and Bahçeşehir University, Istanbul, Turkey, for their continued institutional support throughout the research process.
Conflicts of Interest
The authors declare that they have no conflicts of interest related to this study.
Ethical Approval
The experimental protocol was reviewed and approved by the Clinical Research Ethics Committee of Yeditepe University (Approval No. 71146310-511.06, dated 2 November 2018). Informed consent was obtained from all participants and their legal guardians prior to participation. The study procedures complied with the ethical standards of the Sabancı University Research Ethics Committee and were conducted in accordance with the Declaration of Helsinki. The study was also registered with the Turkish Medicines and Medical Devices Agency.
Author Contributions
Günet Eroğlu contributed to the conceptualization, study design, and wrote the abstract, introduction, methods, results, and discussion sections. MHD Raja Abou Harb contributed to the development and implementation of the machine learning algorithm and co-authored results and figures.
Funding
This research did not receive any specific grant from funding agencies in the public, commercial, or not-for-profit sectors.
References
- Albarrán-Cárdenas, L.; Silva-Pereyra, J.; Martínez-Briones, B. J.; Bosch-Bayard, J.; Fernández, T. Neurofeedback effects on EEG connectivity among children with reading disorders: I. Coherence. Applied Sciences 2023, 13(5), 2825. [Google Scholar] [CrossRef]
- Al-Fahad, R.; Yeasin, M.; Bidelman, G. M. Decoding of single-trial EEG reveals unique states of functional brain connectivity that drive rapid speech categorization decisions. Journal of Neural Engineering 2020, 17(1), 016045. [Google Scholar] [CrossRef] [PubMed]
- Cainelli, E.; Vedovelli, L.; Carretti, B.; Bisiacchi, P. EEG correlates of developmental dyslexia: a systematic review. Annals of dyslexia 2023, 73(2), 184–213. [Google Scholar] [CrossRef] [PubMed]
- Cappelli, G.; Noccetti, S. A linguistic approach to the study of dyslexia; Channel View Publications, 2022. [Google Scholar]
- Carroll, J. M.; Holden, C.; Kirby, P.; Thompson, P. A.; Snowling, M. J.; Dyslexia Delphi Panel, ... Rack, J. Toward a consensus on dyslexia: findings from a Delphi study. Journal of Child Psychology and Psychiatry 2025. [Google Scholar] [CrossRef] [PubMed]
- Castillo-Barnes, D.; Gallego-Molina, N. J.; Formoso, M. A.; Ortiz, A.; Figueiredo, P.; Luque, J. L. Probabilistic and explainable modeling of Phase–Phase Cross-Frequency Coupling patterns in EEG. Application to dyslexia diagnosis. Biocybernetics and Biomedical Engineering 2024, 44(4), 814–823. [Google Scholar] [CrossRef]
- Eroğlu, G.; Aydın, S.; Çetin, M.; Balcışoy, S. Improving cognitive functions of dyslexies using multi-sensory learning and EEG neurofeedback. In 2018 26th Signal Processing and Communications Applications Conference (SIU); IEEE, May 2018; pp. 1–4. [Google Scholar] [CrossRef]
- Eroğlu, G.; Gürkan, M.; Teber, S.; Ertürk, K.; Kırmızı, M.; Ekici, B.; Arman, F.; Balcışoy, S.; Özgüz, V.; Çetin, M. Changes in EEG complexity with neurofeedback and multi-sensory learning in children with dyslexia: A multiscale entropy analysis. Applied Neuropsychology: Child 2022, 11(2), 133–144. [Google Scholar] [CrossRef] [PubMed]
- Glica, A.; Wasilewska, K.; Jurkowska, J.; Żygierewicz, J.; Kossowski, B.; Jednoróg, K. Reevaluating the neural noise in dyslexia using biomarkers from electroencephalography and high-resolution magnetic resonance spectroscopy. eLife 2025, 13, RP99920. [Google Scholar] [CrossRef] [PubMed]
- Garnica-Agudelo, D.; Smith, S. D.; van de Velden, D.; Stier, C.; Brockmann, K.; Schroeder, S.; Focke, N. K. Source reconstruction of clinical resting-state EEG reveals differences in power and functional connectivity in children with developmental dyslexia. 2023. [Google Scholar]
- Giraud, A.-L.; Ramus, F. Neurogenetics and auditory processing in developmental dyslexia. Current Opinion in Neurobiology 2013, 23(1), 37–42. [Google Scholar] [CrossRef] [PubMed]
- Jolliffe, I. T.; Cadima, J. Principal component analysis: A review and recent developments. Philosophical Transactions of the Royal Society A: Mathematical, Physical and Engineering Sciences 2016, 374(2065), 20150202. [Google Scholar] [CrossRef] [PubMed]
- Kuhl, U.; Neef, N. E.; Kraft, I.; Schaadt, G.; Dörr, L.; Brauer, J.; Czeppezauer, I.; Müller, B.; Wilcke, A.; Kirsten, H. The emergence of dyslexia in the developing brain. NeuroImage 211 2020, 116633. [Google Scholar] [CrossRef] [PubMed]
- Luo, C.; Li, F.; Li, P.; Yi, C.; Li, C.; Tao, Q.; Zhang, X.; Si, Y.; Yao, D.; Yin, G. A survey of brain network analysis by electroencephalographic signals. Cognitive Neurodynamics 2022, 16(1), 1–25. [Google Scholar] [CrossRef] [PubMed]
- Maunsell, M. Dyslexia in a global context: A cross-linguistic, cross-cultural perspective. Latin American Journal of Content & Language Integrated Learning 2020, 13(2), 217–247. [Google Scholar] [CrossRef]
- Oliaee, A.; Mohebbi, M.; Shirani, S.; Rostami, R. Extraction of discriminative features from EEG signals of dyslexic children; before and after the treatment. Cognitive Neurodynamics 2022, 16(6), 1249–1259. [Google Scholar] [CrossRef] [PubMed]
- Parmar, S.; Paunwala, C. Early detection of dyslexia based on EEG with novel predictor extraction and selection. Discover Artificial Intelligence 2023, 3(1), 33. [Google Scholar] [CrossRef]
- Perera, P.; Harshani, H.; Shiratuddin, M. F.; Wong, K. W.; Fullarton, K. EEG signal analysis of writing and typing between adults with dyslexia and normal controls. Journal of Fundamental and Applied Sciences 2018, 10(5S), 1001–1014. [Google Scholar] [CrossRef]
- Richlan, F.; Kronbichler, M.; Wimmer, H. Meta-analyzing brain dysfunctions in dyslexic children and adults. NeuroImage 2011, 56(3), 1735–1742. [Google Scholar] [CrossRef] [PubMed]
- Share, D. L. Common misconceptions about the phonological deficit theory of dyslexia. Brain Sciences 2021, 11(11), 1510. [Google Scholar] [CrossRef] [PubMed]
- Shaywitz, B. A.; Shaywitz, S. E. The American experience: Towards a 21st century definition of dyslexia. Oxford Review of Education 2020, 46(4), 454–471. [Google Scholar] [CrossRef]
- Silva, P. B.; Oliveira, D. G.; Cardoso, A. D.; Laurence, P. G.; Boggio, P. S.; Macedo, E. C. Event-related potential and lexical decision task in dyslexic adults: Lexical and lateralization effects. Frontiers in Psychology 2022, 13, 852219. [Google Scholar] [CrossRef] [PubMed]
- Snowling, M. J.; Hulme, C.; Nation, K. Defining and understanding dyslexia: Past, present and future. Oxford Review of Education 2020, 46(4), 501–513. [Google Scholar] [CrossRef] [PubMed]
- Theodoridou, D.; Tsiantis, C.-O.; Vlaikou, A.-M.; Chondrou, V.; Zakopoulou, V.; Christodoulides, P.; Oikonomou, E. D.; Tzimourta, K. D.; Kostoulas, C.; Tzallas, A. T. Developmental dyslexia: Insights from EEG-based findings and molecular signatures—A pilot study. Brain Sciences 2024, 14(1), 139. [Google Scholar] [CrossRef] [PubMed]
- Turri, C.; Di Dona, G.; Santoni, A.; Zamfira, D. A.; Franchin, L.; Melcher, D.; Ronconi, L. Periodic and aperiodic EEG features as potential markers of developmental dyslexia. Biomedicines 2023, 11(6), 1607. [Google Scholar] [CrossRef] [PubMed]
- Tuncer, T.; Dogan, S.; Acharya, U. R. Automated EEG signal classification using chaotic local binary pattern. Expert Systems with Applications 182 2021, 115175. [Google Scholar] [CrossRef]
- Usman, O. L.; Muniyandi, R. C. CryptoDL: Predicting dyslexia biomarkers from encrypted neuroimaging dataset using energy-efficient residue number system and deep convolutional neural network. *Symmetry 2020, 12*(5), 836. [Google Scholar] [CrossRef]
- Usman, O. L.; Muniyandi, R. C.; Omar, K.; Mohamad, M. Advanced machine learning methods for dyslexia biomarker detection: A review of implementation details and challenges. IEEE Access; 2021; 9, pp. 36879–36897. [Google Scholar] [CrossRef]
- Yan, Z.; Zhou, J.; Wong, W.-F. EEG classification with spiking neural network: Smaller, better, more energy efficient. Smart Health 2022, 24, 100261. [Google Scholar] [CrossRef]
- Yang, Y.; Huo, S.; Wang, J.; Maurer, U. Spectral and Topological Abnormalities of Resting and Task State EEG in Chinese Children with Developmental Dyslexia. Brain Topography 2025, 38(4), 1–19. [Google Scholar] [CrossRef] [PubMed]
Figure 1.
Clustering Values Representation.
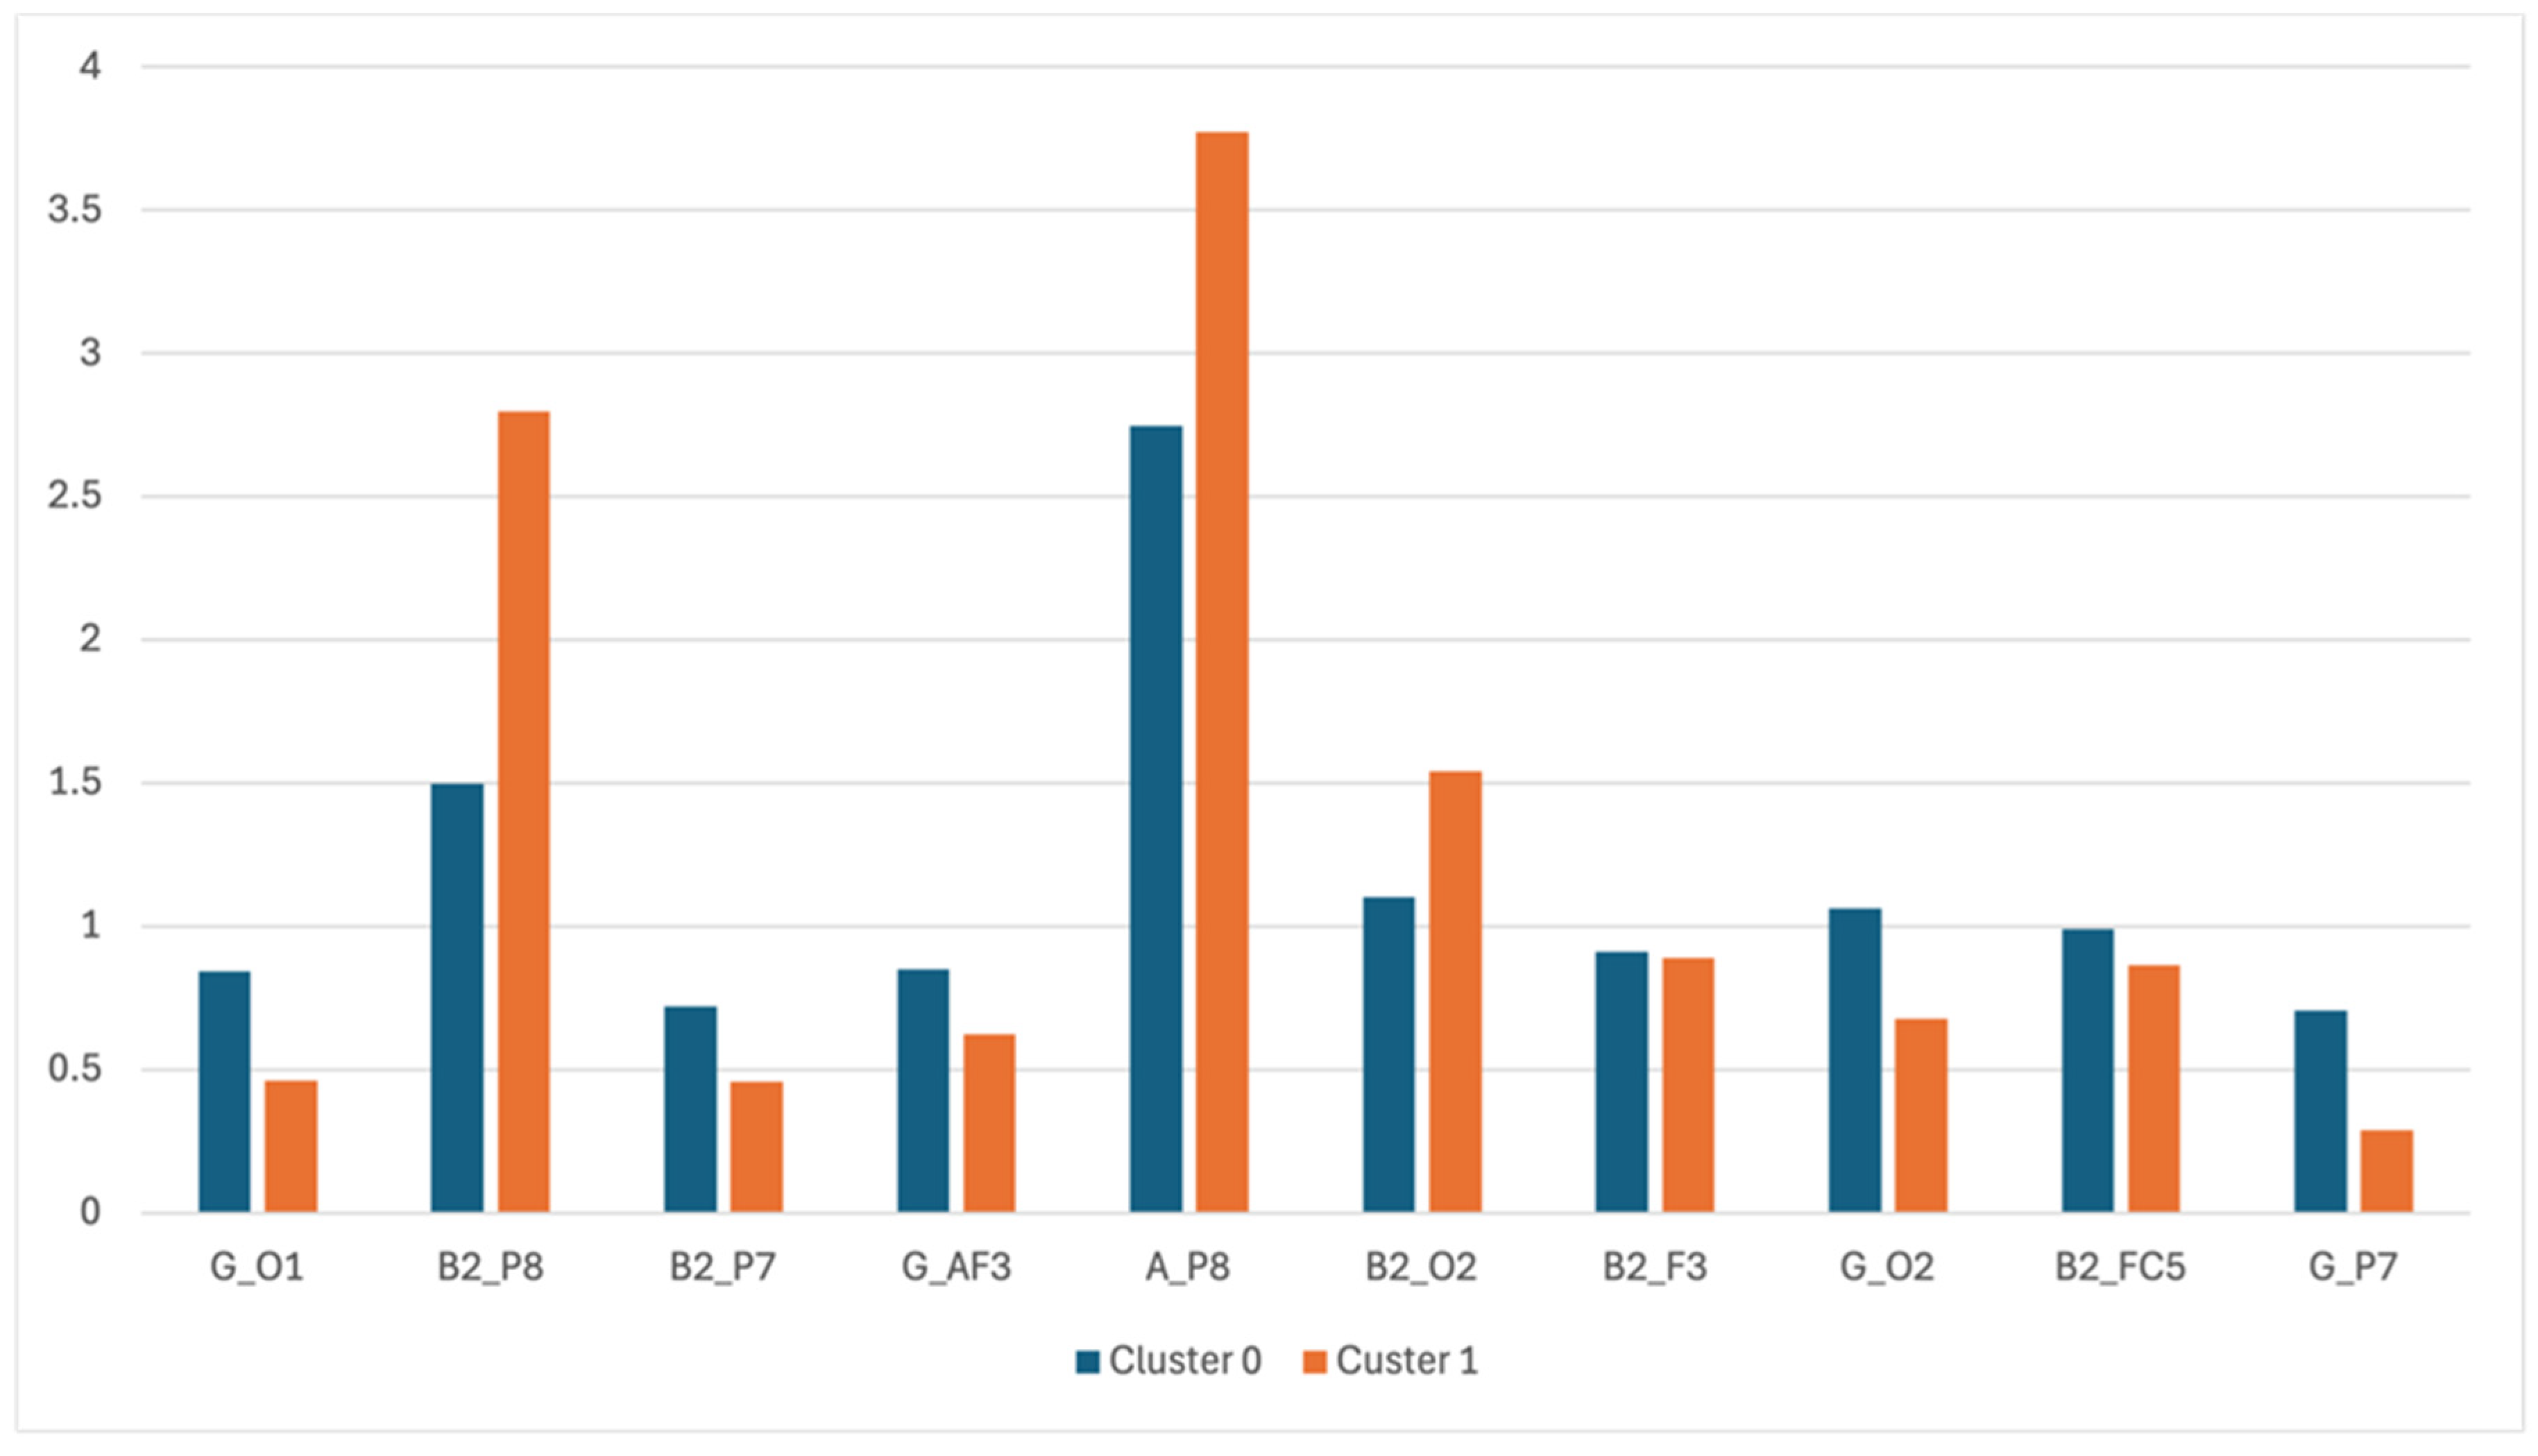
Figure 2A.
Cumulative variance explained by PCA components derived from EEG spectral features.
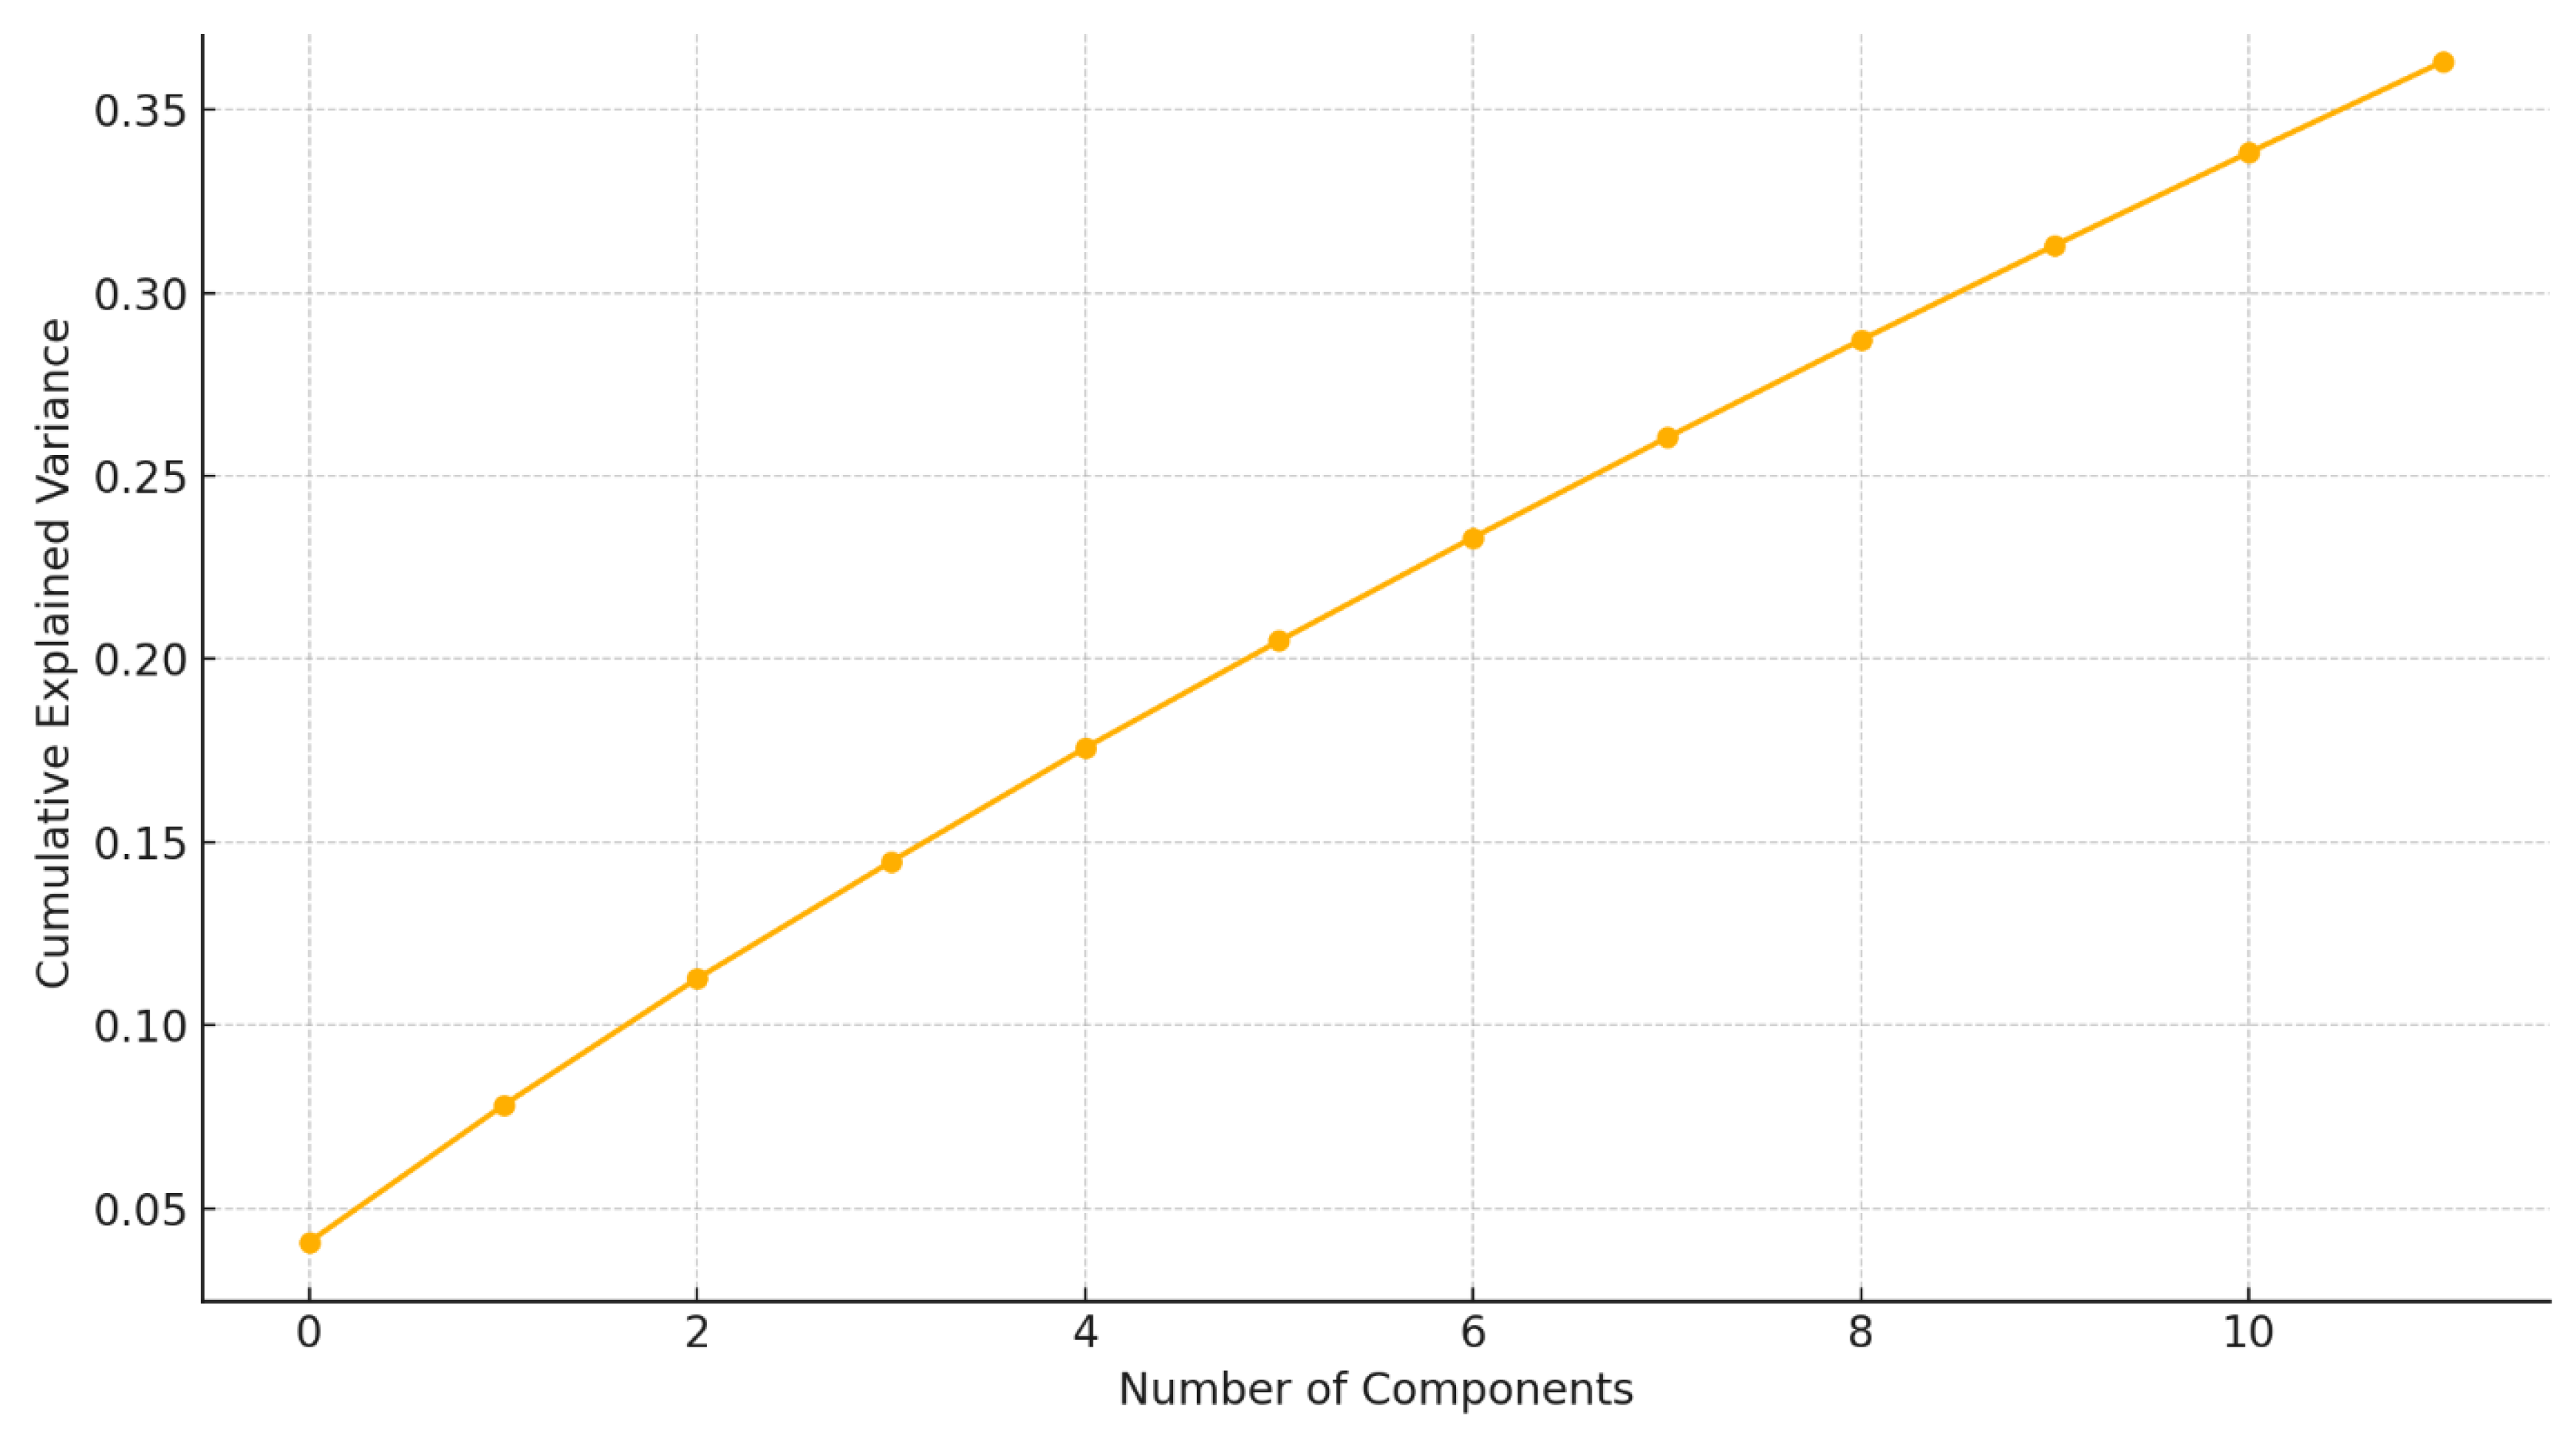
Figure 2B.
Scree plot illustrating the eigenvalue decay across principal components.
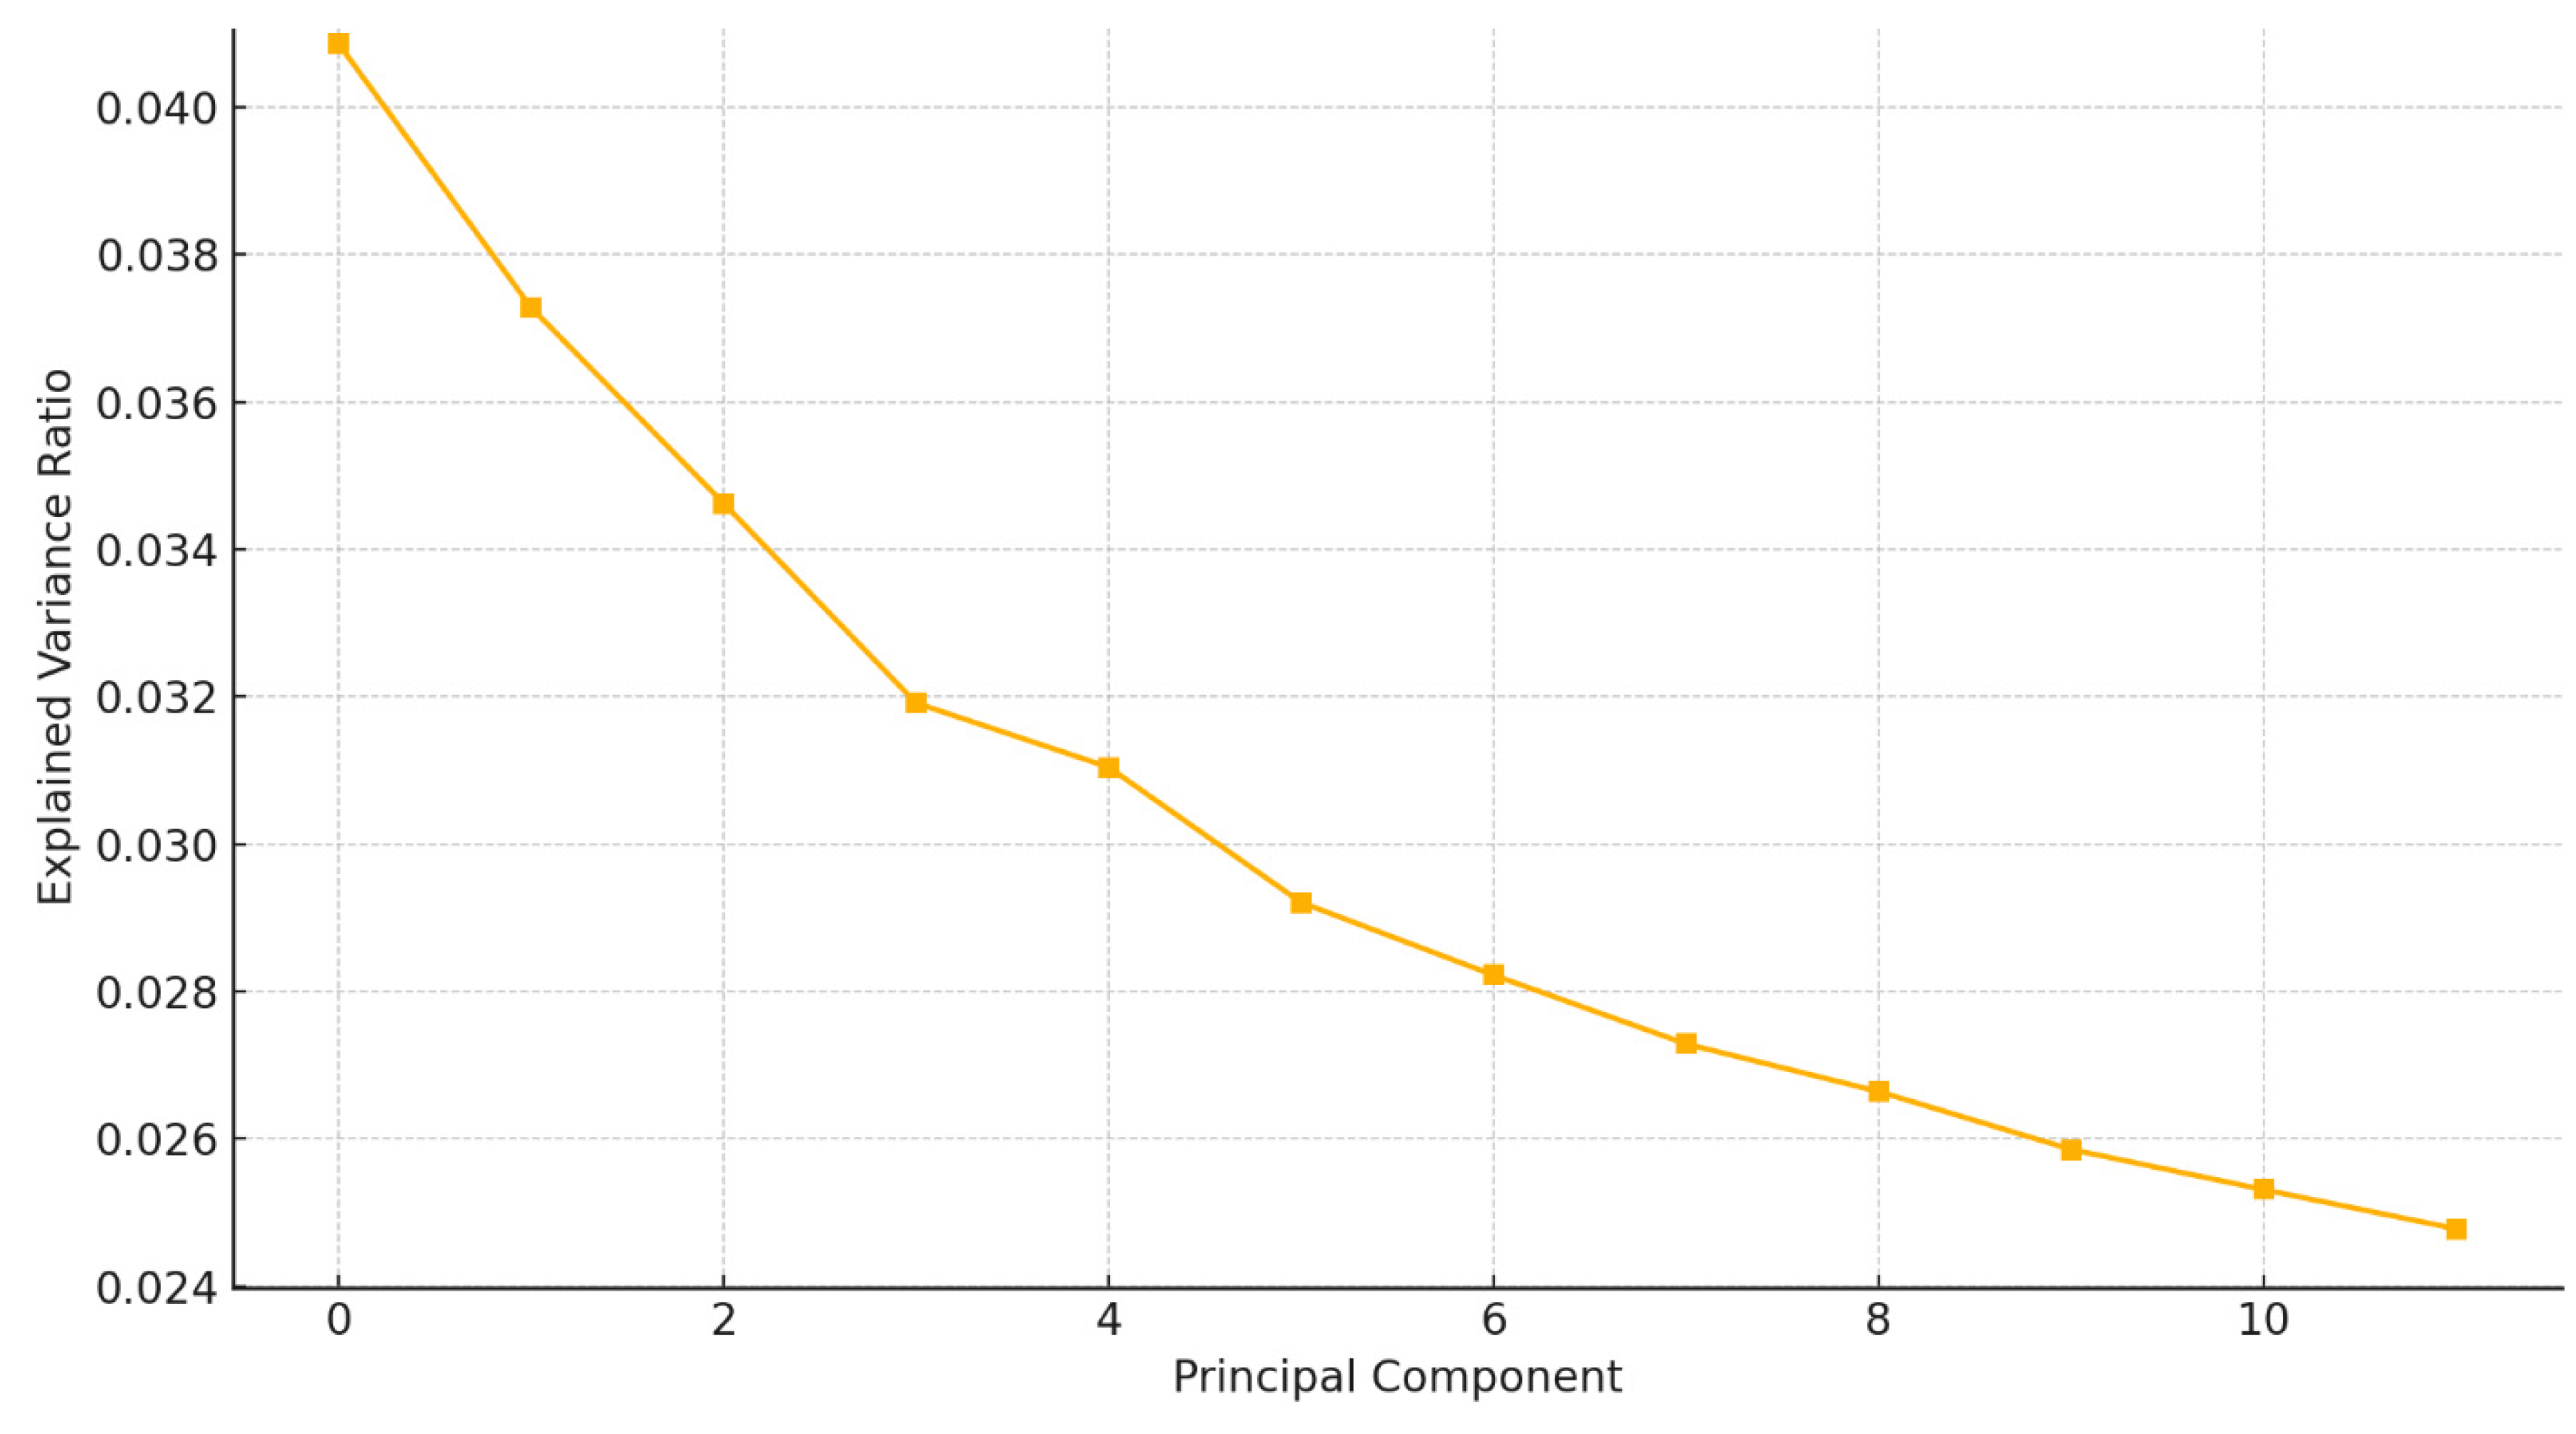
Figure 3.
Two-dimensional PCA projection of EEG features showing group-level clustering (PC1 vs. PC2).
Figure 3.
Two-dimensional PCA projection of EEG features showing group-level clustering (PC1 vs. PC2).
Disclaimer/Publisher’s Note: The statements, opinions and data contained in all publications are solely those of the individual author(s) and contributor(s) and not of MDPI and/or the editor(s). MDPI and/or the editor(s) disclaim responsibility for any injury to people or property resulting from any ideas, methods, instructions or products referred to in the content. |
© 2025 by the authors. Licensee MDPI, Basel, Switzerland. This article is an open access article distributed under the terms and conditions of the Creative Commons Attribution (CC BY) license (http://creativecommons.org/licenses/by/4.0/).
Copyright: This open access article is published under a Creative Commons CC BY 4.0 license, which permit the free download, distribution, and reuse, provided that the author and preprint are cited in any reuse.


