Submitted:
12 June 2025
Posted:
16 June 2025
You are already at the latest version
Abstract
Idesia polycarpa is a valuable woody oil plant with potential for horticultural and industrial applications. However, limited information is available regarding its drought tolerance during the seedling stage. In this study, one-year-old seedlings were subjected to five treatments based on soil relative water content (RWC): moderate drought (T1, 40 ± 5%), severe drought (T2, 20 ± 5%), control (CK, 70 ± 5%), and rewatering following moderate (T3) and severe drought stress (T4), with RWC restored to 70 ± 5%. Under drought stress, seedlings exhibited adaptive responses including reduced growth, enhanced antioxidant enzyme activity, osmotic regulation, and changes in endogenous hormone levels. Seedlings showed good tolerance and recovery under moderate drought, but severe drought caused substantial damage and limited post-rewatering recovery. Pearson correlation and principal component analyses revealed that betaine, APX, SA, IAA, ABA, total chlorophyll content, and crown width increment were strongly associated with drought response and could serve as key indicators for drought resistance assessment in I. polycarpa. These findings provide insights into the physiological mechanisms of drought adaptation and support the development of a reliable evaluation system for drought tolerance in this promising species.
Keywords:
drought stress
; Idesia polycarpa Maxim.
; rewatering
; physiological characteristics
1. Introduction
Drought is regarded as one of the most destructive natural disasters worldwide, exerting a significant impact on agricultural systems, ecological balance, and human society. As the greenhouse effect intensifies and global temperatures continue to rise, the frequency and severity of droughts are predicted to increase, resulting in a broader range of regions being affected. Drought stress has been shown to cause plant growth inhibition, which can be promoted by timely rewatering to restore plant growth [1,2]. The ability of a plant to swiftly revert to its pre-drought state following rehydration is a crucial factor in determining its drought resilience [3]. Therefore, the assessment of a plant’s capacity to withstand drought stress should encompass its recovery potential. Drought tolerance in plants is defined as a comprehensive response to drought stress, which is manifested by numerous changes in external morphology, internal structure, growth, physiological characteristics, and the accumulation of bioactive components [4]. Regarding external morphology, drought stress severely inhibited the growth and development of Rhododendron ovatum, with obvious wilting and drying of the leaves [5]. In terms of physiological characteristics, drought stress resulted in the accumulation of osmotic substances such as soluble sugars and soluble proteins in the leaves of Lycium ruthenicum [6]. At the same time, antioxidant enzyme activities in plants change to adapt to the water-deficit environment due to the surge of reactive oxygen species content inside the plant under drought stress [7]. In addition, drought stress caused changes in hormone levels in plants, including growth hormones such as indole acetic acid (IAA) and gibberellin (GA) and the increased adversity-responsive hormone abscisic acid (ABA) [8]. In terms of leaf anatomical characteristics, due to the sudden decrease in water content in plants, the leaf morphology and structure made changes to adapt to the environmental changes, which caused a significant reduction in the thickness of the leaf tissues [9].
Idesia polycarpa Maxim. (I. polycarpa), which belongs to the genus Idesia within the family Salicaceae, is a deciduous tree species. Its fruits and seeds are high in unsaturated fatty acids and thus receive the designation of the “oil reservoir in the air” [10]. I. polycarpa is notable for its height, adaptability, rapid growth rate, and robust vitality. Its natural distribution encompasses Sichuan, Guizhou, and Hubei provinces of China, with a recent focus on its introduction to regions such as Chongqing and Shaanxi provinces, to mitigate the effects of rocky desertification. As a new woody oilseed tree species, I. polycarpa is widely used in many fields such as landscaping, bioenergy, healthcare, beauty care, etc. It was listed as a national strategic reserve forest species in April 2020, which is of strategic importance to ensure national energy security, food and oil supply, ecological protection, and rural revitalization [11,12]. At present, domestic and international research on I. polycarpa mainly focuses on seedling breeding and fruit oil analysis, while little research has been reported on the drought tolerance of I. polycarpa seedlings. I. polycarpa is widely distributed, and there are many varieties, the known species are ‘Exuan 1’, ‘Yuji’, ‘Chuantong’, and so on. However, due to the lack of a comprehensive drought evaluation system, it is difficult to evaluate the drought tolerance of various varieties of I. polycarpa, which seriously restricts the promotion of I. polycarpa to the Northwest arid areas for afforestation. In this study, the one-year-old seedlings of I. polycarpa were taken as the test material, through the systematic study of the growth and physiological response of I. polycarpa seedlings to drought stress, to provide a scientific basis for I. polycarpa seedlings’ water management. It is proposed to establish a I. polycarpa drought tolerance evaluation system, to provide a reference for the screening of I. polycarpa drought-tolerant varieties, and to lay a practical basis for the popularization of I. polycarpa to the Northwest arid region.
2. Materials and Methods
2.1. Test Materials
Mature I. polycarpa fruits were collected from wild superior individual mother trees in Qishe Town, Xingyi, Guizhou Province (24°56′N, 104°47′E). After collecting the wild I. polycarpa fruits in November 2022, the pulp of the mature fruits was crushed and continuously kneaded to obtain the seeds. The floating impurities and poor-quality seeds were eliminated through clean water. Then, the plump seeds were air-dried in a cool, well-ventilated place for storage. In January 2023, a large number of high-quality tissue culture seedlings were obtained through the aseptic germination of the collected and stored I. polycarpa seeds. In March, the seedlings were transplanted into transparent plastic cups for hardening (Figure 1A). In early April, I. polycarpa seedlings were transplanted into 20 × 23 cm (height × diameter) polypropylene containers with a soil substrate composed of peat soil, perlite, and vermiculite (2:1:1) for continued growth (Figure 1B). In July, healthy one-year-old I. polycarpa seedlings with uniform height were selected and moved under a rain shelter that did not affect light or ventilation for acclimatization (Figure 1C). During this recovery phase, normal watering and maintenance practices were maintained.
2.2. Design of the Experiment
Three different water treatments were established based on soil relative water content (RWC) to simulate drought stress: control (CK, RWC = 70 ± 5%), moderate drought (T1, RWC = 40 ± 5%), and severe drought (T2, RWC = 20 ± 5%). The drought stress treatments lasted for 21 days. After the drought stress period, all drought-treated groups were rewatered to the control RWC level (70 ± 5%), forming the moderate drought rewatering group (T3) and the severe drought rewatering group (T4). Each treatment group, including the control, contained 20 plants, totaling 60 potted I. polycarpa seedlings.
Drought stress was simulated using a pot-based water control method. Irrigation was stopped on August 10, allowing soil moisture to decrease through natural evaporation until it reached the target RWC for each treatment group. This point was designated as day 0 of drought stress. The drought stress period lasted for 21 days. During this period, water lost through transpiration was replenished every 4 hours between 8:00 and 19:00. A soil moisture meter (SANKU SK-100, Japan) was used to measure soil water content before and after each watering. Following the principle of frequent and small water additions, the probe of the moisture meter was inserted to a depth of 10 cm to ensure that the soil RWC remained within the specified range for each treatment.
On day 21 of the drought stress treatment, plants in all drought treatment groups were rewatered to the control RWC level (70 ± 5%), and the rewatering treatment lasted for 14 days. Throughout the experiment, seedlings were kept in a rainproof net house to prevent any external water input. To reduce water loss from soil surface evaporation, plastic film was used to cover the soil surface and maintain soil moisture.
2.3. Sample Collection
Measurements of growth, biomass, and photosynthetic physiological parameters were conducted on day 21 of drought stress and day 14 after rewatering. Sample leaves were also collected during each of these times, between 08:00 and 10:00 a.m. For each treatment, 8–10 healthy leaves were collected, and labeled with the treatment name and sampling time. A portion of the samples was placed in resealable bags for the determination of leaf relative water content, relative electrical conductivity, and chlorophyll content. Another portion was wrapped in aluminum foil, immediately frozen in liquid nitrogen, and brought back to the laboratory for storage in an ultra-low temperature freezer (–80 °C). These samples were used for measuring the contents of osmotic adjustment substances, antioxidant enzyme activities, and endogenous hormone levels. Each treatment included three biological replicates for sampling.
2.4. Measurement of Growth Indexes
Before the initiation of the stress treatment, after the stress treatment, and following rewatering, plant height, ground diameter, and crown were measured to evaluate the changes in plant height growth (ΔH), diameter growth (ΔD), and crown growth under each treatment condition.
Biomass was determined using the whole-plant harvesting method, which was conducted at the end of the stress treatment and after the rewatering process. Upon completion of the treatments, the potting soil was loosened by rinsing with running water. The seedlings were then extracted, and any adhering soil was washed away. After removing residual moisture, the fresh weights of the aboveground parts (including stems, branches, and leaves) and the belowground parts (roots) of the seedlings were measured separately. The fresh weight per plant and the root-crown ratio (the ratio of belowground fresh weight to aboveground fresh weight) were subsequently calculated.
2.5. Photosynthetic Characteristics and Photosynthetic Pigment Indexes
Photosynthetic parameters including net photosynthetic rate (Pn), stomatal conductance (Gs), intercellular CO₂ concentration (Ci), and transpiration rate (Tr) were recorded employing a portable photosynthesis measurement system (LI-6400, LI-COR, Lincoln, NE, USA) according to a set light level of 1,200 μmol m⁻² s⁻¹. The level of chlorophyll was obtained utilizing the 95% ethanol-acetone extraction technique [13].
2.6. Physiological and Biochemical Indexes
The leaf relative water content (LRWC) was determined using the drying method [14]. Fresh leaves were collected and their fresh weight was measured. The leaves were then immersed in distilled water for 24 hours to achieve saturated fresh weight. Subsequently, the leaves were placed in an oven and dried at 80°C for 8 hours to obtain the dry weight. The relative water content of the leaves was calculated as (fresh weight − dry weight) / (saturated fresh weight−dry weight) × 100%.
The leaves were cut into strips of appropriate length (avoiding the midrib), and three fresh samples, each weighing 0.1g, were quickly weighed and placed into graduated test tubes containing 10 ml of deionized water. The tubes were then stopped with glass caps and left to soak at room temperature for 12 hours. The conductivity of the leachate (R1) was measured using a conductivity meter. Subsequently, the samples were heated in a boiling water bath for 30 minutes, cooled to room temperature, and thoroughly mixed before the conductivity of the leachate (R2) was measured again. Leaf relative electrical conductivity (REC) was calculated as R1/R2 × 100% [14].
Malondialdehyde (MDA) content was assessed using the thiobarbituric acid (TBA) method. Proline content was quantified using the acidic ninhydrin method. Betaine content was determined via the Reinecke salt method. The anthrone-sulfuric acid method was used to determine soluble sugar (SS) content. Soluble protein (SP) content was assessed via the Coomassie Brilliant Blue G-250 method (Bradford assay). Peroxidase (POD) activity was determined using the guaiacol method. Superoxide dismutase (SOD) activity was measured using the nitroblue tetrazolium (NBT) photoreduction method. Ascorbate peroxidase (APX) activity was assayed using the ascorbate oxidation method. Catalase (CAT) activity was determined using the ultraviolet absorption method [14].
ELISA was used to quantify endogenous GA, IAA, ABA, and SA levels [15]. Fresh I. polycarpa leaves were homogenized in an extraction buffer and centrifuged to obtain the supernatant. Samples were added to antibody-coated ELISA plates, followed by incubation with specific antibodies and enzyme-labeled secondary antibodies. Absorbance was measured at 450 nm, and hormone concentrations were determined using a standard curve. The ELISA kits used were purchased from Ruixin Biotech Co., Ltd.
2.7. Root System Indexes and Leaf Anatomy
After the drought stress test was finished and the plants were rewatered, the entire plant was gently uprooted and the root systems were cleaned with flowing water to remove any dirt. The roots were then dried, and a root scanner was utilized for calculating distinctive root structure metrics including total root length, root surface area, root volume, and the number of root tips.
Leaf anatomy: Samples were collected to prepare paraffin sections, and the epidermal structure of the leaf was observed under a microscope to measure leaf thickness, epidermal thickness, thickness of fenestrated tissue, thickness of water-storage tissue, and vascular bundle area.
2.8. Statistical Analysis
Data collection and preliminary processing were all carried out utilizing Microsoft Excel 2019 (Microsoft Corporation, Redmond, WA, USA). The experimental data were analyzed using one-way ANOVA in SPSS 23.0 (IBM, New York, NY, USA), followed by Duncan’s test to assess the significance of observed differences. Graphs were generated according to Origin 2021 (OriginLab, Northampton, MA, USA), whereas plates were created with Adobe Photoshop 2021 (Adobe, San Jose, CA, USA).
3. Results
3.1. Effects of Drought Stress on Leaf Phenotypic Characteristics of I. polycarpa Seedlings
As shown in Figure 2, the leaf phenotypes of I. polycarpa seedlings varied under different treatments. Under drought stress, leaves exhibited varying degrees of damage. After 21 days of moderate drought stress (T1), the leaves turned yellow, developed yellow spots, showed raised veins, and some displayed surface wrinkling. After 21 days of severe drought stress (T2), more pronounced drought-induced damage was observed, including more extensive yellowing, increased wrinkling, and the appearance of brown spots in the mesophyll and along the leaf margins.
Following rewatering, leaf damage was alleviated to some extent in both treatment groups, but leaf morphology did not fully return to the state observed under normal water conditions. Fourteen days after rewatering in the T1 group, the leaves appeared greener than those at the end of the drought period, with fewer yellow edges and yellow spots. In the T2 group, although the leaves turned visibly greener 14 days after rewatering, yellow spots and yellowing along the edges were still present.
3.2. Effects of Drought Stress on Photosynthetic Pigment Content in Leaves of I. polycarpa Seedlings
Drought stress obviously reduced the chlorophyll content of I. polycarpa seedlings. T1 resulted in a reduction of chlorophyll a, chlorophyll b, and total chlorophyll contents by 49.62%, 51.67%, and 50.71%, respectively, in comparison to CK. Following rewatering (T3), however, chlorophyll a exhibited a reduction of only 7.49% compared to CK, while chlorophyll b and total chlorophyll demonstrated significantly lower levels, at 55.77% and 33.29%, respectively. In response to T2, there was a notable decline in chlorophyll a, chlorophyll b, and total chlorophyll, with reductions of 51.82%, 75.64%, and 64.56%, accordingly, in comparison to CK. Following rewatering (T4), these indexes remained substantially below the control level, with decreases of 20.32%, 68.16%, and 45.88%, respectively, in comparison to CK. (Table 1)
3.3. Effects of Drought Stress on Plant Growth of I. polycarpa Seedlings
Growth and biomass accumulation of I. polycarpa seedlings were impeded by drought stress. Table 2 indicates that under T1, ΔH, ΔG, crown growth, above-ground biomass, and below-ground biomass were substantially less than CK by 78.63%, 55.69%, 113.45%, 35.32%, and 24.52%, each. After rehydration(T3), though, none of these indexes recovered to the untreated level, which was 62.39%, 71.09%, 86.5%, 33.55%, and 21.96%, respectively, lower in contrast to CK. I. polycarpa seedlings were particularly damaged by the severe drought treatment(T2); the ΔH, ΔG, crown growth, aboveground biomass, and belowground biomass much lower—by 81.2%, 46.68%, 62.4%, 232.27%, and 59.00%, respectively—than those of CK. In contrast, the root-crown ratio increased by 39.72% and was significantly higher than that of CK. After rehydration, only the below-ground biomass recovered to the level of the control group, while all other indicators remained significantly different from CK.
3.4. Effects of Drought Stress on Root Growth of I. polycarpa Seedlings
To enable them to adapt to the environment of water deprivation, I. polycarpa seedlings also experienced certain alterations in their root structure. In T1, as illustrated in Table 3 and Figure 3, root length and root tips increased greatly with CK, rising by 49.40% and 44.21%, respectively; on the other hand, root surf area and root volume decreased relative to CK, falling by 0.88% and 42.34%, respectively. Following watering again(T3), the root tips increased by 67.80% and the root surf area dropped by 13.36% in comparison to CK, but the root length and volume were still below the control level. During T2 treatment, root length increased by only 12.59% over CK, yet it did not vary considerably. Root surf area and volume were dramatically reduced, by 32.40% and 61.85%, each. After watering continued, all indexes were restored to control level, except root volume, which was 18.49% below CK.
3.5. Effects of Drought Stress on Photosynthetic Characteristics of I. polycarpa Seedlings
acking in photosynthetic characteristics. While intercellular CO2 concentration (Ci) and transpiration rate (Tr) were not substantially different from CK, only 6.65% and 26.91% below CK, respectively, photosynthetic rate (Pn) and stomatal conductance (Gs) were notably lower than CK at moderate drought (42.22% and 63.22%, respectively). Gs fully recovered and exhibited minimal change from CK after rewatering, staying at 15.91%. When compared to CK, Pn, Gs, Ci, and Tr all showed notable declines in response to T2, reaching 63.22%, 81.32%, 21.47%, and 68.21%, respectively. I. polycarpa recovered well after the water supply was restored, with Gs, Ci, and Tr reaching levels similar to those at CK. Pn was still 18.76% less than CK, though. (Figure 4)
3.6. Effects of Drought Stress on LRWC, REC and MDA Content of I. polycarpa Seedlings Leaves
Drought stress had a negative effect on the leaf relative water content (LRWC) of I. polycarpa seedlings; at T1 and after water intake, values declined to those similar to CK. In particular, compared to CK, LRWC was 8.19% and 7.26% down, respectively. Under T2, the level was much lower, showing a loss of 18.62% compared to CK and a reduction of 14.04% even after rehydration. Leaf relative electrical conductivity (REC) and MDA content of leaves increased during dry circumstances, but when the stress level increased, they showed a considerable rise in comparison to CK. The observed increases were 75.92% and 27.98% under T2 and 59.03% and 10.11% under T1, respectively. Additionally, the MDA content demonstrated a notable recovery following rewatering. (Figure 5)
3.7. Effects of Drought Stress on Activities of Antioxidant Enzymes of I. polycarpa Seedlings Leaves
The antioxidant enzyme activities in the leaves of I. polycarpa seedlings upped throughout stress caused by drought. POD, SOD, and CAT tended of rising and then minimize, whereas APX showed an effect of steadily increasing, as the drought stress intensified. POD, SOD, CAT, and APX were considerably above CK under T1, at 81.78%, 63.47%, 44.19%, and 37.96%, each. POD and APX recovered substantially after rewatering (T3), although SOD and CAT remained much higher—by 23.6% and 11.18%—than CK. At T2, POD, SOD, CAT, and APX were much higher than CK, at 71.75%, 31.2%, 33.15%, and 74.76%, each. After water retention (T4), all antioxidant enzyme activities started to fall, particularly POD, CAT, and APX, which stayed above CK by 19.33%, 13.82%, and 25.51% respectively. (Figure 6)
3.8. Effects of Drought Stress on Osmoregulatory Substance of I. polycarpa Seedlings Leaves
Drought additionally harmed osmoregulatory substances in the leaves of I. polycarpa seedlings. Proline, betaine, and SS exhibited a propensity to steadily rise as drought stress intensified, while SP showed a tendency to rise and subsequently drop. Proline, betaine, SP, and SS, were much lower than CK under T1 (14.27%, 39.58%, 34.2%, and 36.34%, respectively). Pro, betaine, and SS all recovered effectively after rewatering (T3), while SP was 22.71% above CK. While SP concentration stayed at the control level, the accumulation of osmoregulatory substances was considerably higher during periods of T2, with proline, betaine, and SS considerably higher than CK by 27.87%, 58.85%, and 55.52%, respectively. Rewatering(T4) allowed proline and SS to recover effectively, but betaine was still 21.02% over CK. (Figure 7)
3.9. Effects of Drought Stress on Endogenous Hormone of I. polycarpa Seedlings Leaves
I. polycarpa seedlings’ leaves respond to environmental changes, such as drought, by controlling endogenous hormone levels. In the leaves of I. polycarpa seedlings, drought caused a buildup of ABA and SA contents. As the stress level grew, the ABA content progressively rose while the SA content first climbed and subsequently declined. At T1, the concentrations of ABA and SA were 16.12% and 28.49%, respectively, extra than the level of CK. After rewatering (T3), ABA started to decline but was still 10.61% above CK; in contrast, SA grew and was 93.32% above CK after rewatering. At T2, ABA and SA were above CK by 29.01% and 8.79%, as well, and following rewatering (T4), by 13.04%. On the other hand, as the drought got worse, IAA and GA steadily dropped. IAA in T1 stayed at the control level, but GA was 12.61% less than CK. IAA and GA content increased with rewatering (T3), however, GA returned to the control level, at 29.19% and 8.13% higher than CK. IAA and GA in T2 were 27.25% and 13.98% higher than in CK, respectively, but both returned to control levels when the soil was rewatered (T4). (Figure 8)
3.10. Effects of Drought Stress on Leaf Anatomy of I. polycarpa Seedlings Leaves
The drought had an adverse effect on the leaf anatomy of I. polycarpa seedlings, causing all leaf tissues to become thinner. As demonstrated in Table 4 and Figure 9, the thickness of the upper epidermal (TU) and lower epidermal (TL) decreased and then increased with the deepening of stress, while the thickness of palisade tissue (TP), spongy tissue (TS), and the leaf thickness (LT) gradually decreased. At T1, upper epidermal thickness and leaf thickness altered dramatically; they were 39.51% and 5.46% below CK. Both went back to the control level after being rewatered (T3). Under T2, there was a significant and negative impact on upper epidermal thickness, palisade tissue thickness, spongy tissue thickness, and leaf thickness. These parameters were all reduced relative to CK by 34.97%, 14.10%, 12.78%, and 10.62%, respectively. Rewatering did not completely reverse the effects on the thickness of the palisade tissue, spongy tissue, or leaf; rather, the thickness of each was decreased by 14.54%, 11.78%, and 11.01% in comparison to CK, while the thickness of the upper epidermis was brought back to the control level.
3.11. Correlation Analysis
A Pearson correlation analysis of 18 growth and physiological indices in I. polycarpa seedlings revealed significant correlations among most parameters. As shown in the Figure 10, chlorophyll a and chlorophyll (a+b) exhibited a statistically significant negative correlation with betaine, proline, APX, CAT, POD, MDA, and relative conductivity. In contrast, ABA and soluble sugars showed a statistically significant positive correlation with relative conductivity, MDA, POD, CAT, APX, proline, and betaine.
3.12. Principal Component Analysis
As shown in Figure 11A,B, the sample dispersion among treatments was well-distributed, with principal component 1 (PC1) accounting for 55.3% of the variance and principal component 2 (PC2) accounting for 20.3%, resulting in a cumulative contribution of 75.6% for the first two principal components. This indicates strong representativeness of the overall data. In principal component analysis (PCA), the cos² value (cosine squared) is a key indicator that measures the projection strength of each variable (or observation) onto the principal components, reflecting its contribution. Figure 11C illustrates the cos² values of different variables in the first two principal components, with higher contributions observed for betaine, APX, SA, IAA, ABA, Chl(a+b), Chla, and crown growth.
4. Discussion
Drought stress has widespread and profound effects on plant growth and development, particularly under water-deficient conditions, where cell differentiation and expansion are inhibited, ultimately affecting overall plant growth and development [16]. The most visible effects of drought stress are changes in leaf morphology, such as wilting, yellowing, and necrosis at the leaf tips and margins. In this study, I. polycarpa seedlings exhibited leaf yellowing and necrosis under drought conditions, indicating significant growth impairment. Similar responses have been observed in Camellia oleifera [17] and Delphinium grandiflorum [18]. After rewatering, these stress symptoms were alleviated, but the leaf phenotype remained distinct from non-stressed plants.
Changes in leaf anatomical structure further reflected the impact of drought stress. The palisade tissue, which plays a central role in photosynthesis, directly affects photosynthetic efficiency and light tolerance [19]. Our results showed that drought stress significantly reduced the thickness of leaf tissues in I. polycarpa, indicating a restriction in growth due to water deficiency. Notably, the upper epidermal thickness of I. polycarpa leaves significantly decreased by 39.51% and 34.97% under moderate and severe drought conditions, respectively, compared to the control, demonstrating a remarkable reduction. After rewatering, leaf structure partially recovered under moderate drought conditions, whereas recovery was notably limited under severe drought, suggesting that rewatering has a constrained restorative effect on leaf structure.
Stomata serve as the primary channels for gas exchange in plants [20]. Under drought stress, Gs and Ci declined, directly limiting Pn. In this study, the decrease in Gs and Ci suggested that Pn limitation was mainly driven by stomatal factors. Additionally, Tr decreased, indicating that I. polycarpa adapted to drought by reducing water loss. After rewatering, gas exchange parameters partially recovered, consistent with findings in palm species following drought stress relief [21]. Drought stress also significantly inhibited chlorophyll synthesis and accelerated its degradation [22]. In this study, chlorophyll a and chlorophyll b contents in I. polycarpa seedlings declined significantly under drought conditions but increased after rewatering, suggesting that resuming normal water supply mitigates drought-induced damage to the photosynthetic system.
The root system, which directly interacts with the soil, is highly sensitive to water availability [23]. Under drought stress, I. polycarpa exhibited an increase in total root length and root tips number, indicating an adaptive strategy to access deeper soil water and enhance drought tolerance. After rewatering, compensatory root growth occurred, suggesting that I. polycarpa possesses a certain degree of post-drought recovery capability.
Relative water content (RWC) is a key indicator of plant drought tolerance [24]. In this study, RWC decreased progressively with increasing drought severity, while relative conductivity and MDA content increased significantly, indicating severe cellular membrane damage. After rewatering, RWC recovered well under moderate drought conditions, demonstrating the resilience of I. polycarpa to mild drought stress.
Under drought stress, the contents of proline, betaine, and SP in I. polycarpa leaves significantly increased, while SP content peaked under moderate drought and then declined. After rewatering, these osmotic regulators partially recovered, indicating a certain degree of post-drought recovery ability. This response may be attributed to the plant’s regulation of intracellular solute concentrations to maintain cell turgor and water balance. Proline and betaine not only reduce cellular osmotic potential but also stabilize proteins and membrane structures, thereby mitigating drought-induced damage. Meanwhile, soluble sugars provide energy and carbon skeletons while undergoing osmotic adjustment [25].
Additionally, drought stress significantly enhanced the activity of antioxidant enzymes (POD, SOD, CAT, and APX) to mitigate oxidative damage caused by reactive oxygen species (ROS) [26,27]. After rewatering, enzyme activity declined, indicating a reduction in oxidative stress. SOD converts superoxide radicals into H₂O₂, which is further decomposed by POD, CAT, and APX, thereby limiting ROS accumulation [28]. This mechanism plays a crucial role in protecting cell membranes and biomolecules such as proteins and DNA, ultimately improving drought tolerance.
Endogenous hormones are vital in plant drought responses [29]. This study found that drought reduced GA and IAA levels, inhibiting growth to conserve water. Upon rehydration, both hormones recovered and exceeded control levels, indicating compensatory growth, likely through hormone balance regulation. ABA and SA increased significantly under drought stress. ABA induced stomatal closure to reduce transpiration, while SA likely enhanced stress tolerance and damage repair [30]. Rehydration led to ABA decline and stomatal reopening. Elevated SA levels suggest that I. polycarpa enhances drought resistance and recovery via SA-mediated signaling.
Plants respond to drought stress through various growth and physiological changes. Therefore, assessing drought tolerance requires a comprehensive evaluation of multiple growth and physiological parameters. In this study, correlation analysis revealed significant relationships (p < 0.05) among 18 growth and physiological indices. However, the high correlation between variables may lead to redundant information extraction. To address this issue, principal component analysis (PCA) was employed to reduce data dimensionality while retaining essential information, effectively mitigating redundancy [31]. In PCA, the cos² value serves as a key metric for assessing a variable’s contribution to the principal components. By analyzing cos² values, variables with high explanatory power can be identified, aiding in data interpretation, key variable selection, and subsequent analysis. In drought tolerance studies, cos² values help determine which growth and physiological indices are most representative of drought resistance. This study found that betaine, ascorbate peroxidase (APX), salicylic acid (SA), indole-3-acetic acid (IAA), abscisic acid (ABA), total chlorophyll (Chl(a+b)), chlorophyll a (Chla), and crown growth exhibited high cos² values in the first two principal components. These results suggest that these indices have strong explanatory power and can serve as key indicators for evaluating the drought tolerance of I. polycarpa.
5. Conclusions
Drought stress negatively impacts I. polycarpa seedlings by altering leaf morphology and anatomy, inhibiting photosynthesis, modifying root structure, disrupting membrane stability, and regulating endogenous hormones and antioxidant defenses. After rewatering, I. polycarpa exhibited partial recovery, though resilience declined significantly under severe drought conditions. Therefore, monitoring changes in leaf morphology and physiological indicators and implementing appropriate irrigation strategies are crucial for mitigating drought stress and promoting healthy seedling growth. This study identified betaine, APX, SA, IAA, ABA, chlorophyll a, total chlorophyll, and crown growth as key indicators for evaluating drought tolerance in I. polycarpa. These findings provide a scientific basis for assessing drought tolerance in I. polycarpa and lay the foundation for further exploration of its drought resistance mechanisms.
Author Contributions
Conceptualization, Xiaoyu Lu and Lingli Wu; methodology, Xiaoyu Lu; software, Xiaoyu Lu; validation, Xiaoyu Lu, Yian Yin and Zhangtai Niu; formal analysis, Xiaoyu Lu; investigation, Lingli Wu; resources, Xiaoyu Lu; data curation, X.X.; writing—original draft preparation, Xiaoyu Lu; writing—review and editing, Xiaoyu Lu; visualization, Shucheng Zhang; supervision, Lingli Wu; project administration, Chan Chen; funding acquisition, Maolin Yang. All authors have read and agreed to the published version of the manuscript.
Funding
This work was supported by Special Funds for Student Innovation and Entrepreneurship Programs in Hunan Province (Grant numbers [S202410538003])
Data Availability Statement
Requests to access the datasets should be sent via email to luxy0115@163.com.
Acknowledgments
This study gratefully acknowledges the provision of laboratory facilities by Central South University of Forestry and Technology and financial support from the Hunan Provincial College Students’ Innovation and Entrepreneurship Fund.
Conflicts of Interest
The authors declare no conflicts of interest.
Abbreviations
The following abbreviations are used in this manuscript:
| RWC | Soil relative water content |
| LRWC | Leaf relative water content |
| REC | Leaf relative electrical conductivity |
References
- Liu, X.; Zhang, Q.; Song, M.; et al. Physiological Responses of Robinia pseudoacacia and Quercus acutissima Seedlings to Repeated Drought-Rewatering under Different Planting Methods. Front. Plant Sci. 2021, 12, 760510. [Google Scholar] [CrossRef] [PubMed]
- Liu, Z. J.; Qin, Z. J.; Shi, Q. L.; et al. Response of Chinese Cabbage Seedlings to Drought Stress and Rehydration. Plant Physiol. J. 2023, 59(7), 1311–1320. [Google Scholar] [CrossRef]
- Patanè, C.; Siah, S.; Cafaro, V.; et al. Potential Impact of Drought and Rewatering on Plant Physiology and Fruit Quality in Long-Shelf-Life Tomatoes. Agronomy 2024, 14(9), 2045. [Google Scholar] [CrossRef]
- Hura, T.; Hura, K.; Ostrowska, A. Drought-Stress Induced Physiological and Molecular Changes in Plants. Int. J. Mol. Sci. 2022, 23(9), 4698. [Google Scholar] [CrossRef]
- Ni, C.; Wang, Z. Y.; Zheng, W.; et al. The Influence of Drought Stress on Rhododendron ovatum on Morphology and Physiological Indexes. J. Fujian For. Sci. Technol. 2021, 48(2), 19–24. [Google Scholar] [CrossRef]
- Guo, Y. Y.; Yu, H. Y.; Yang, M. M.; et al. Effect of Drought Stress on Lipid Peroxidation, Osmotic Adjustment and Antioxidant Enzyme Activity of Leaves and Roots of Lycium ruthenicum Murr. Seedling. Russ. J. Plant Physiol. 2018, 65, 244–250. [Google Scholar] [CrossRef]
- Shah, W.; Ullah, S.; Ali, S.; et al. Effect of Exogenous Alpha-Tocopherol on Physio-Biochemical Attributes and Agronomic Performance of Lentil (Lens culinaris Medik.) under Drought Stress. PLoS One 2021, 16 (8), e0248200. [CrossRef]
- Zhang, S. Y.; Liu, Y. C.; Li, Y. T.; et al. Effects of Drought Stress on Endogenous Hormones in Potted Seedlings of Ulmus pumila ‘Jinye’. J. West China For. Sci. 2021, 50(6), 40–45. [Google Scholar] [CrossRef]
- Wang, J. Y.; Xu, W. N.; Su, Y.; et al. Changes in Leaf Morphology and Anatomical Structure of Seedlings of Alfalfa and Medicago falcata L. under Drought Stress. Acta Agric. Boreali-Sin. 2023, 38 (S1), 228–236. [CrossRef]
- Hu, Y. M.; Shen, Y. B.; Ma, Y.; et al. Research Progress on Idesia polycarpa. J. Jiangsu For. Sci. Technol. 2023, 50(6), 45–52. [Google Scholar] [CrossRef]
- Wu, L. L.; Deng, W. F.; Lu, X. Y.; et al. Research Progress in the Development and Utilization of Idesia polycarpa. Non-wood For. Res. 2023, 41 (2), 242–252. [CrossRef]
- Wang, G.; Wang, S.; Zhou, L. S.; et al. Development and Utilization of the Woody Oilseed Tree Species Idesia polycarpa. Hubei For. Sci. Technol. 2017, 46(2), 29–31. [Google Scholar] [CrossRef]
- Qiu, N. W.; Wang, X. S.; Yang, F. B.; et al. Fast Extraction and Precise Determination of Chlorophyll. Chin. Bull. Bot. 2016, 51(5), 667–678. [Google Scholar] [CrossRef]
- Cai, Y. P. Plant Physiology Lab Guide; China Agricultural University Press: Beijing, 2014. [Google Scholar]
- Yang, D.; Chen, Y.; Wang, R.; et al. Effects of Exogenous Abscisic Acid on the Physiological and Biochemical Responses of Camellia oleifera Seedlings under Drought Stress. Plants 2024, 13(2), 225. [Google Scholar] [CrossRef] [PubMed]
- Seleiman, M. F.; Al-Suhaibani, N.; Ali, N.; et al. Drought Stress Impacts on Plants and Different Approaches to Alleviate Its Adverse Effects. Plants 2021, 10(2), 259. [Google Scholar] [CrossRef] [PubMed]
- Zhang, T.; Liu, C.; Chen, Y.; et al. Physiological and Biochemical Effects of Exogenous Calcium on Camellia oleifera Abel under Drought Stress. Forests 2023, 14(10), 2082. [Google Scholar] [CrossRef]
- Zhang, Y. N.; Liu, Y. J.; Li, B. Effect of Drought Stress and Rewatering on Physiological Characteristics of Delphinium grandiflorum Seedling. North. Hortic. 2015, (9), 58–62. [Google Scholar] [CrossRef]
- Deng, P.; Wu, M.; Ling, D.; et al. Effects of Drought-Rehydration on Photosynthetic Capacity, Chlorophyll Fluorescence, and Microstructure of Cyclobalanopsis glauca Seedling Leaves in Karst Area of Northwest Guangxi. Acta Bot. Boreali-Occident. Sin. 2024, 44 (1), 63–76. [CrossRef]
- Gao, G. L.; Feng, Q.; Zhang, X. Y.; et al. An Overview of Stomatal and Non-Stomatal Limitations to Photosynthesis of Plants. Arid Zone Res. 2018, 35(4), 929–937. [Google Scholar] [CrossRef]
- Sun, Y. N.; Zhao, Y.; Zhao, Y. X.; et al. Effects of Drought and Rewatering on Photosynthetic Characteristics and Chlorophyll Fluorescence of Trachycarpus fortunei Seedlings. J. Cent. South Univ. For. Technol. 2021, 41(9), 45–52. [Google Scholar] [CrossRef]
- Zheng, S. J.; Zhang, M.; Dong, Q.; et al. Mechanism of Exogenous Calcium Alleviating Drought Stress Damage to Fraxinus malacophylla Seedlings. Plant Physiol. J. 2024, 60(6), 1035–1045. [Google Scholar] [CrossRef]
- Kim, Y.; Chung, Y. S.; Lee, E.; et al. Root Response to Drought Stress in Rice (Oryza sativa L.). Int. J. Mol. Sci. 2020, 21 (4), 1513. [CrossRef]
- Babaei, K.; Moghaddam, M.; Farhadi, N.; et al. Morphological, Physiological and Phytochemical Responses of Mexican Marigold (Tagetes minuta L.) to Drought Stress. Sci. Hortic. 2021, 284, 110116. [Google Scholar] [CrossRef]
- Yang, X.; Lu, M.; Wang, Y.; et al. Response Mechanism of Plants to Drought Stress. Horticulturae 2021, 7(3), 50. [Google Scholar] [CrossRef]
- He, F.; Liu, P. F.; Wang, L.; et al. Effect of Drought Stress and Rewatering on Physiological Characteristics of Eucommia ulmoides Seedling. Plant Physiol. J. 2021, 57(3), 661–671. [Google Scholar] [CrossRef]
- Liu, J.; Wang, W.; Wang, L.; et al. Exogenous Melatonin Improves Seedling Health Index and Drought Tolerance in Tomato. Plant Growth Regul. 2015, 77(3), 317–326. [Google Scholar] [CrossRef]
- Denaxa, N. K.; Damvakaris, T.; Roussos, P. A. Antioxidant Defense System in Young Olive Plants against Drought Stress and Mitigation of Adverse Effects through External Application of Alleviating Products. Sci. Hortic. 2022, 259, 108812. [Google Scholar] [CrossRef]
- Ali, F.; Bano, A.; Fazal, A. Recent Methods of Drought Stress Tolerance in Plants. Plant Growth Regul. 2017, 82, 363–375. [Google Scholar] [CrossRef]
- Zhou, Q.; Li, Y.; Wang, X.; et al. Effects of Different Drought Degrees on Physiological Characteristics and Endogenous Hormones of Soybean. Plants 2022, 11(17), 2282. [Google Scholar] [CrossRef]
- Zhang, L. X.; Meng, P. P.; Lyu, Q. H.; et al. Comprehensive Evaluation of Drought Resistance and Screening of Drought Resistance Identification Indicators in Chrysanthemum morifolium Seedling Stage. Jiangsu J. Agric. Sci. 2024, (10), 1942–1951. [Google Scholar] [CrossRef]
Figure 1.
The experimental materials used in this study. (A) Transplant the tissue-cultured seedlings of I. polycarpa into transparent plastic cups for acclimatization. (B) Transplant I. polycarpa seedlings into pots for continued growth. (C) Healthy one-year-old I. polycarpa seedlings with uniform height were selected and moved under a rain shelter that did not affect light or ventilation for acclimatization.
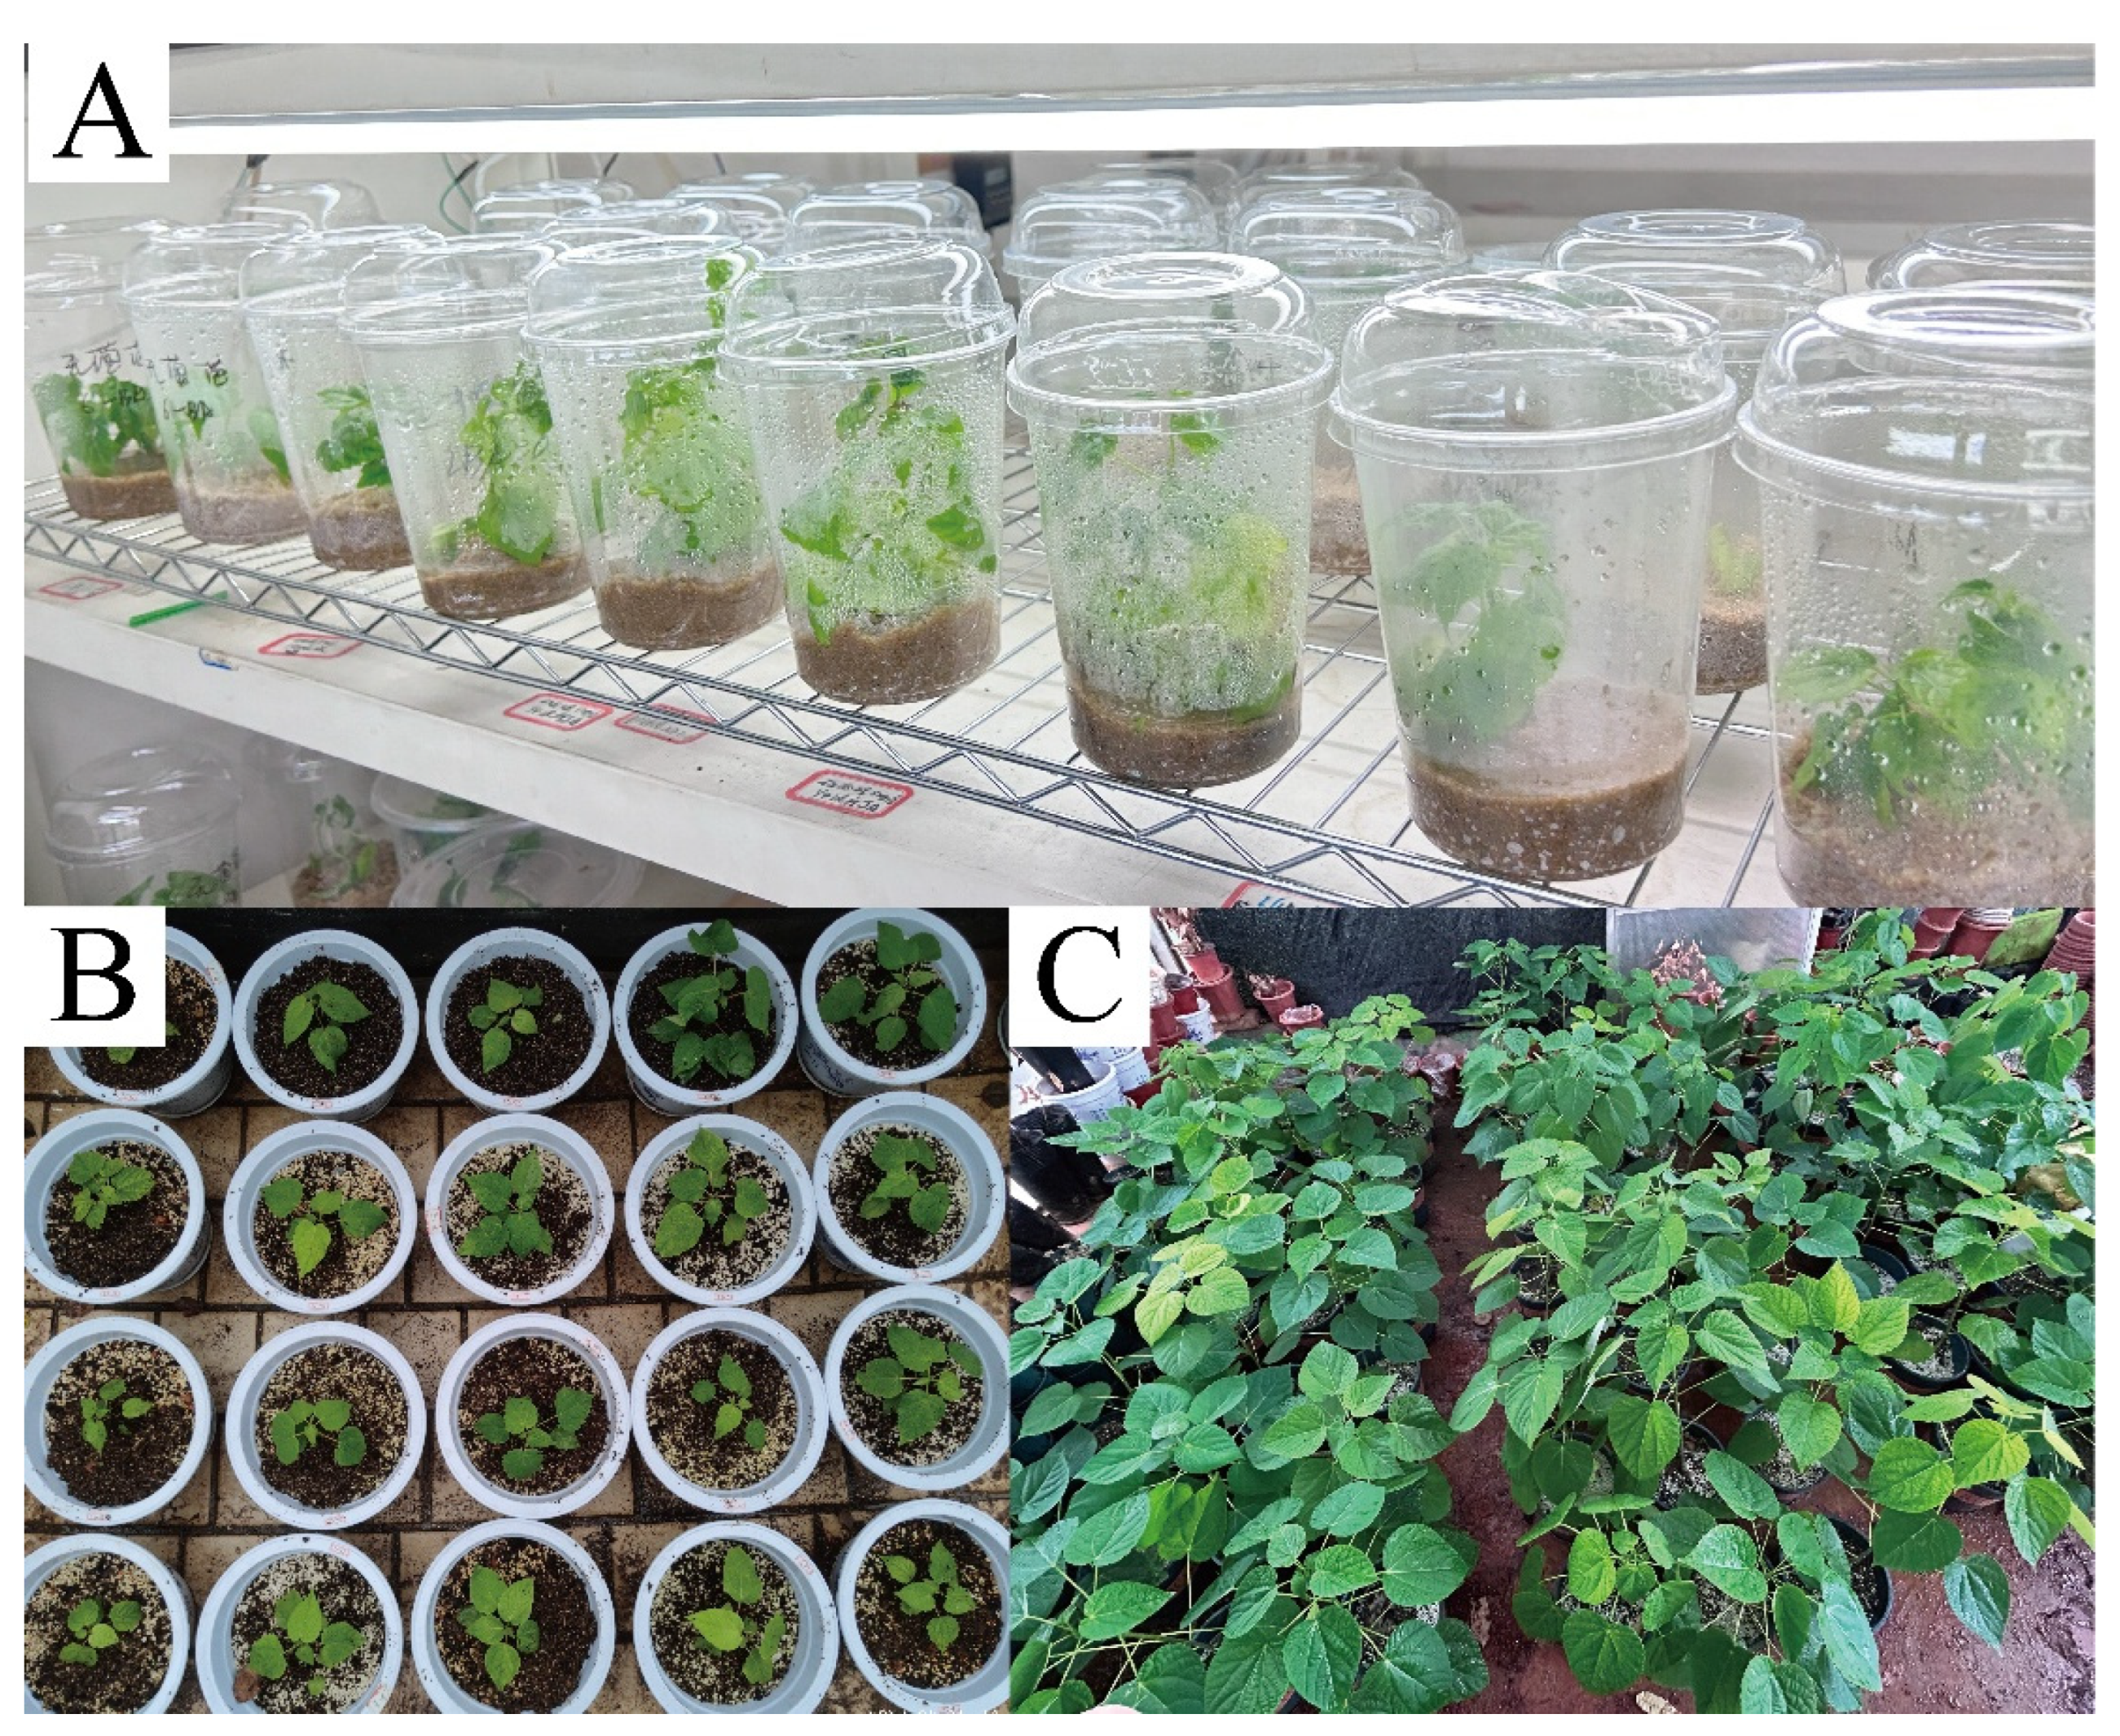
Figure 2.
Effects of drought stress on leaf phenotypic characteristics of I. polycarpa seedlings. CK: Control; T1: Moderate drought; T2: Severe drought.
Figure 2.
Effects of drought stress on leaf phenotypic characteristics of I. polycarpa seedlings. CK: Control; T1: Moderate drought; T2: Severe drought.
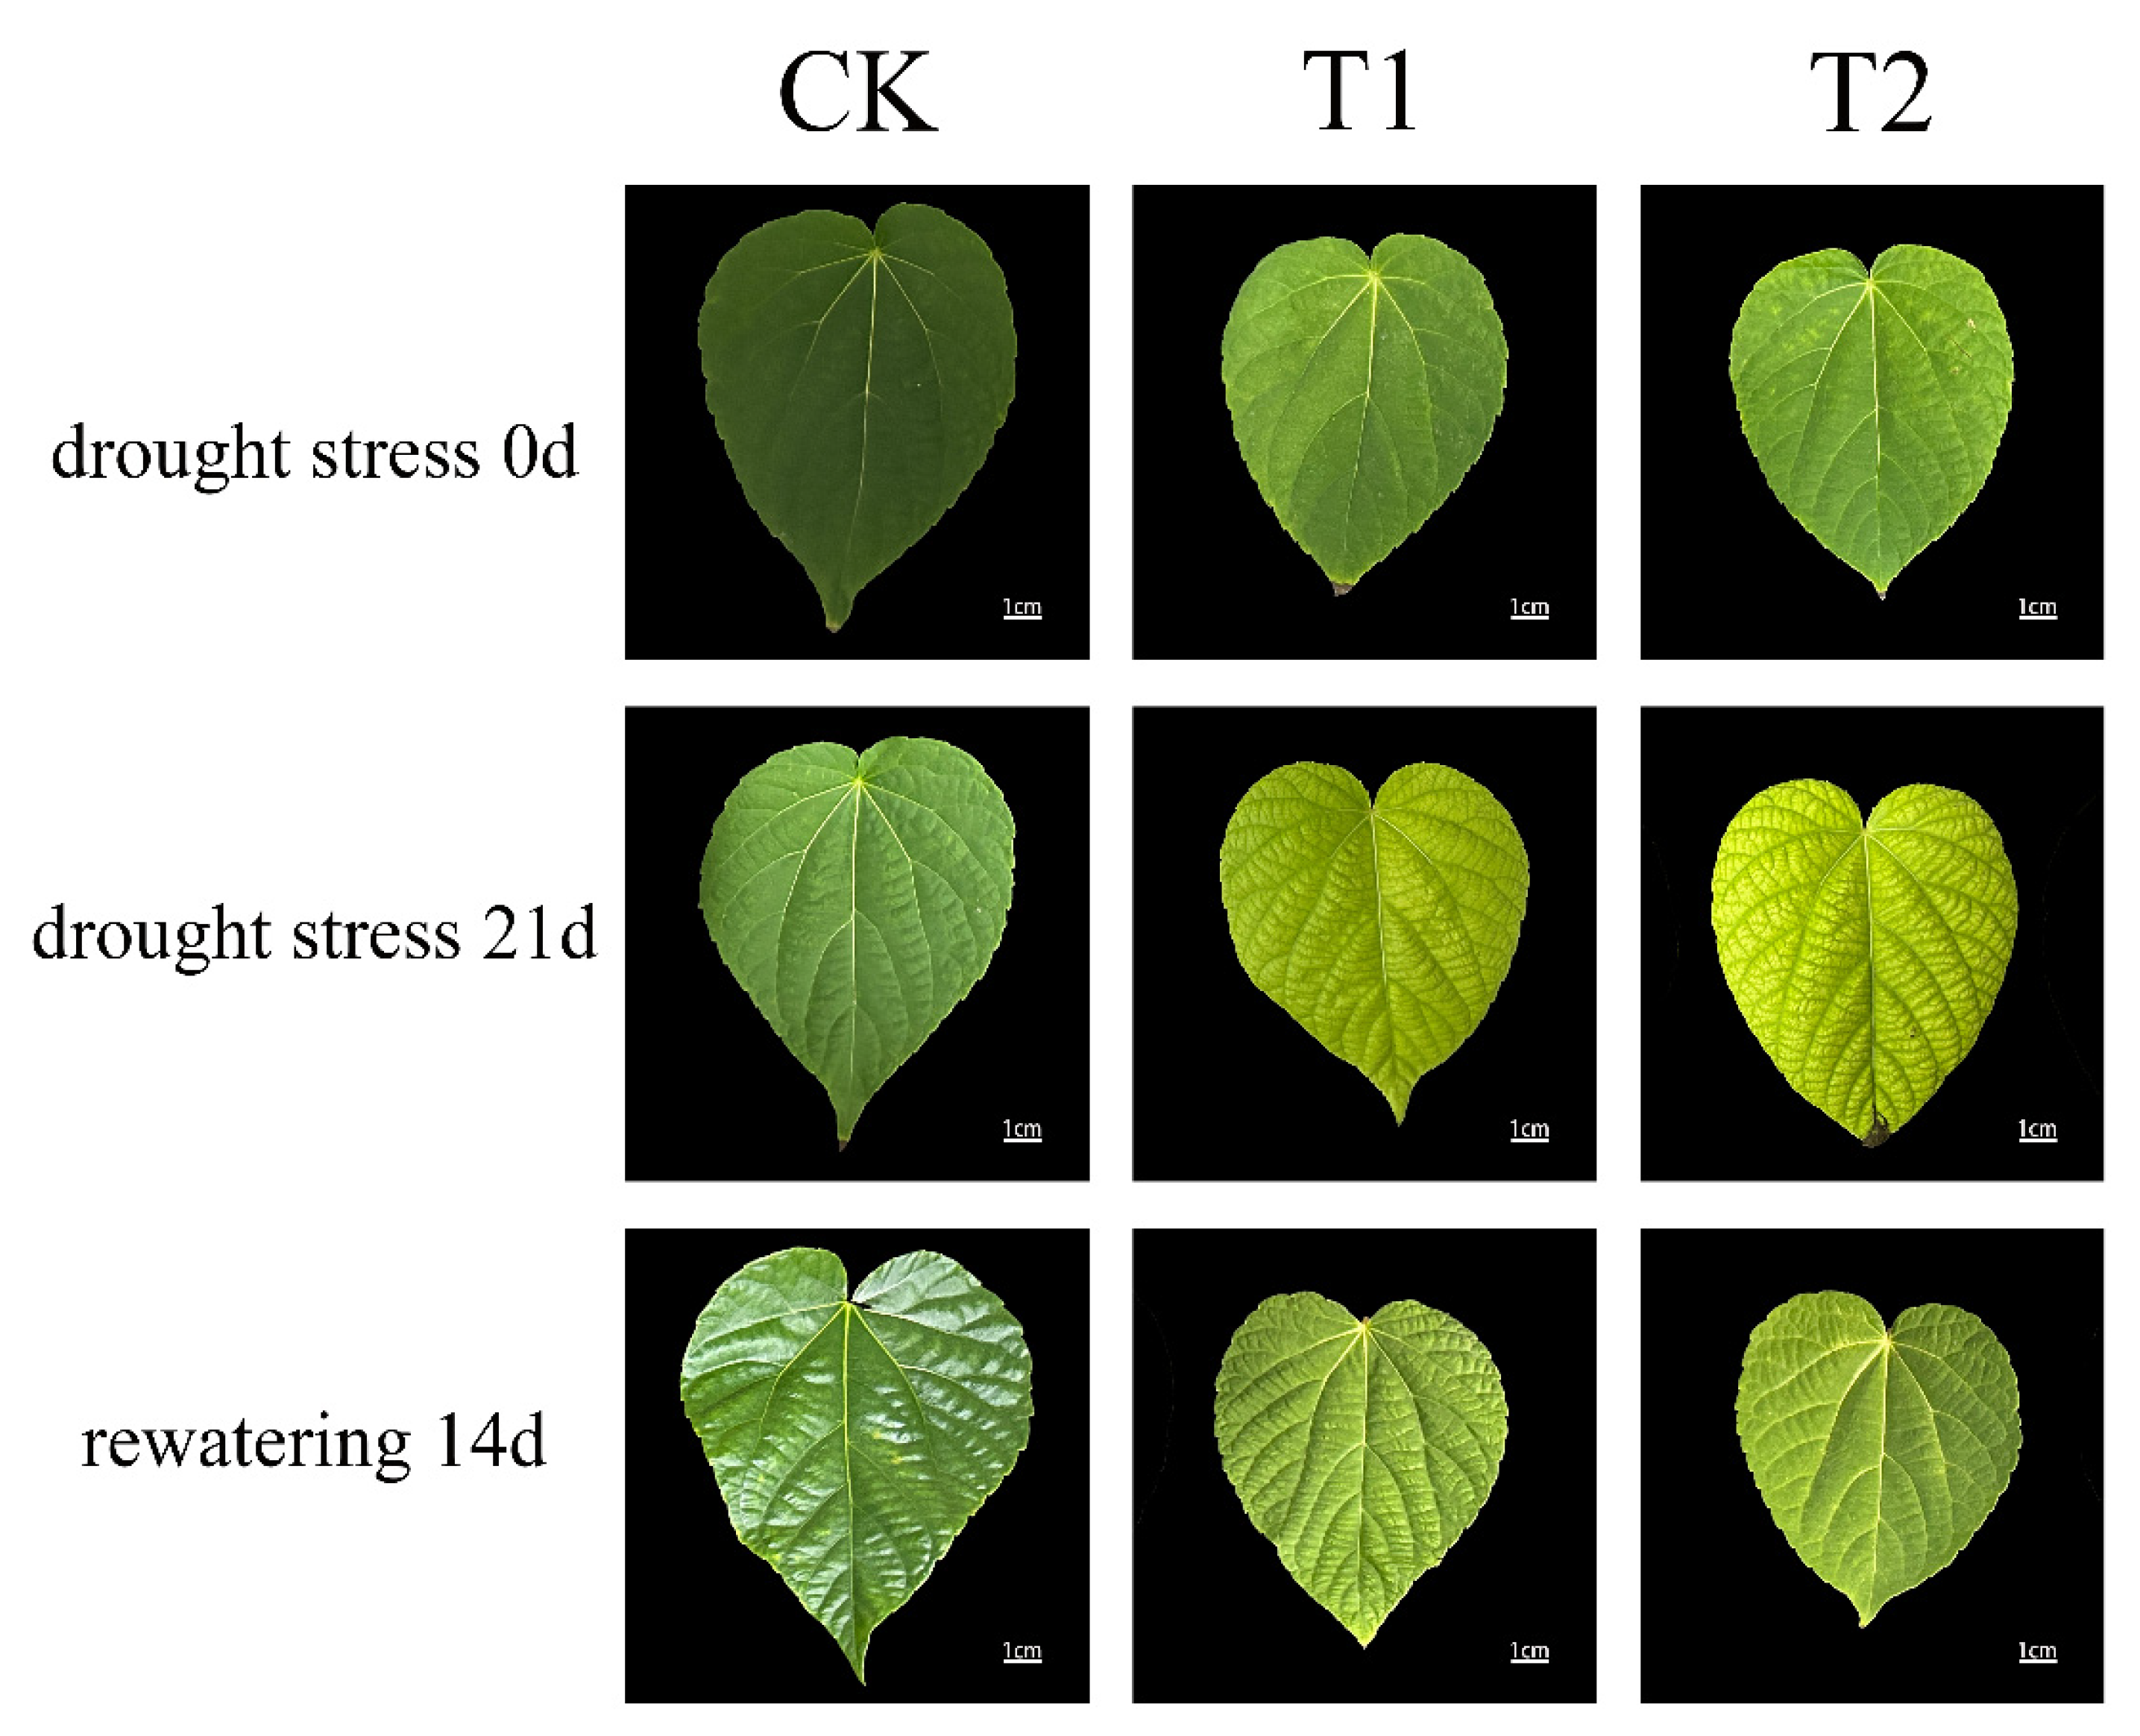
Figure 3.
Scan of I. polycarpa seedlings root system.
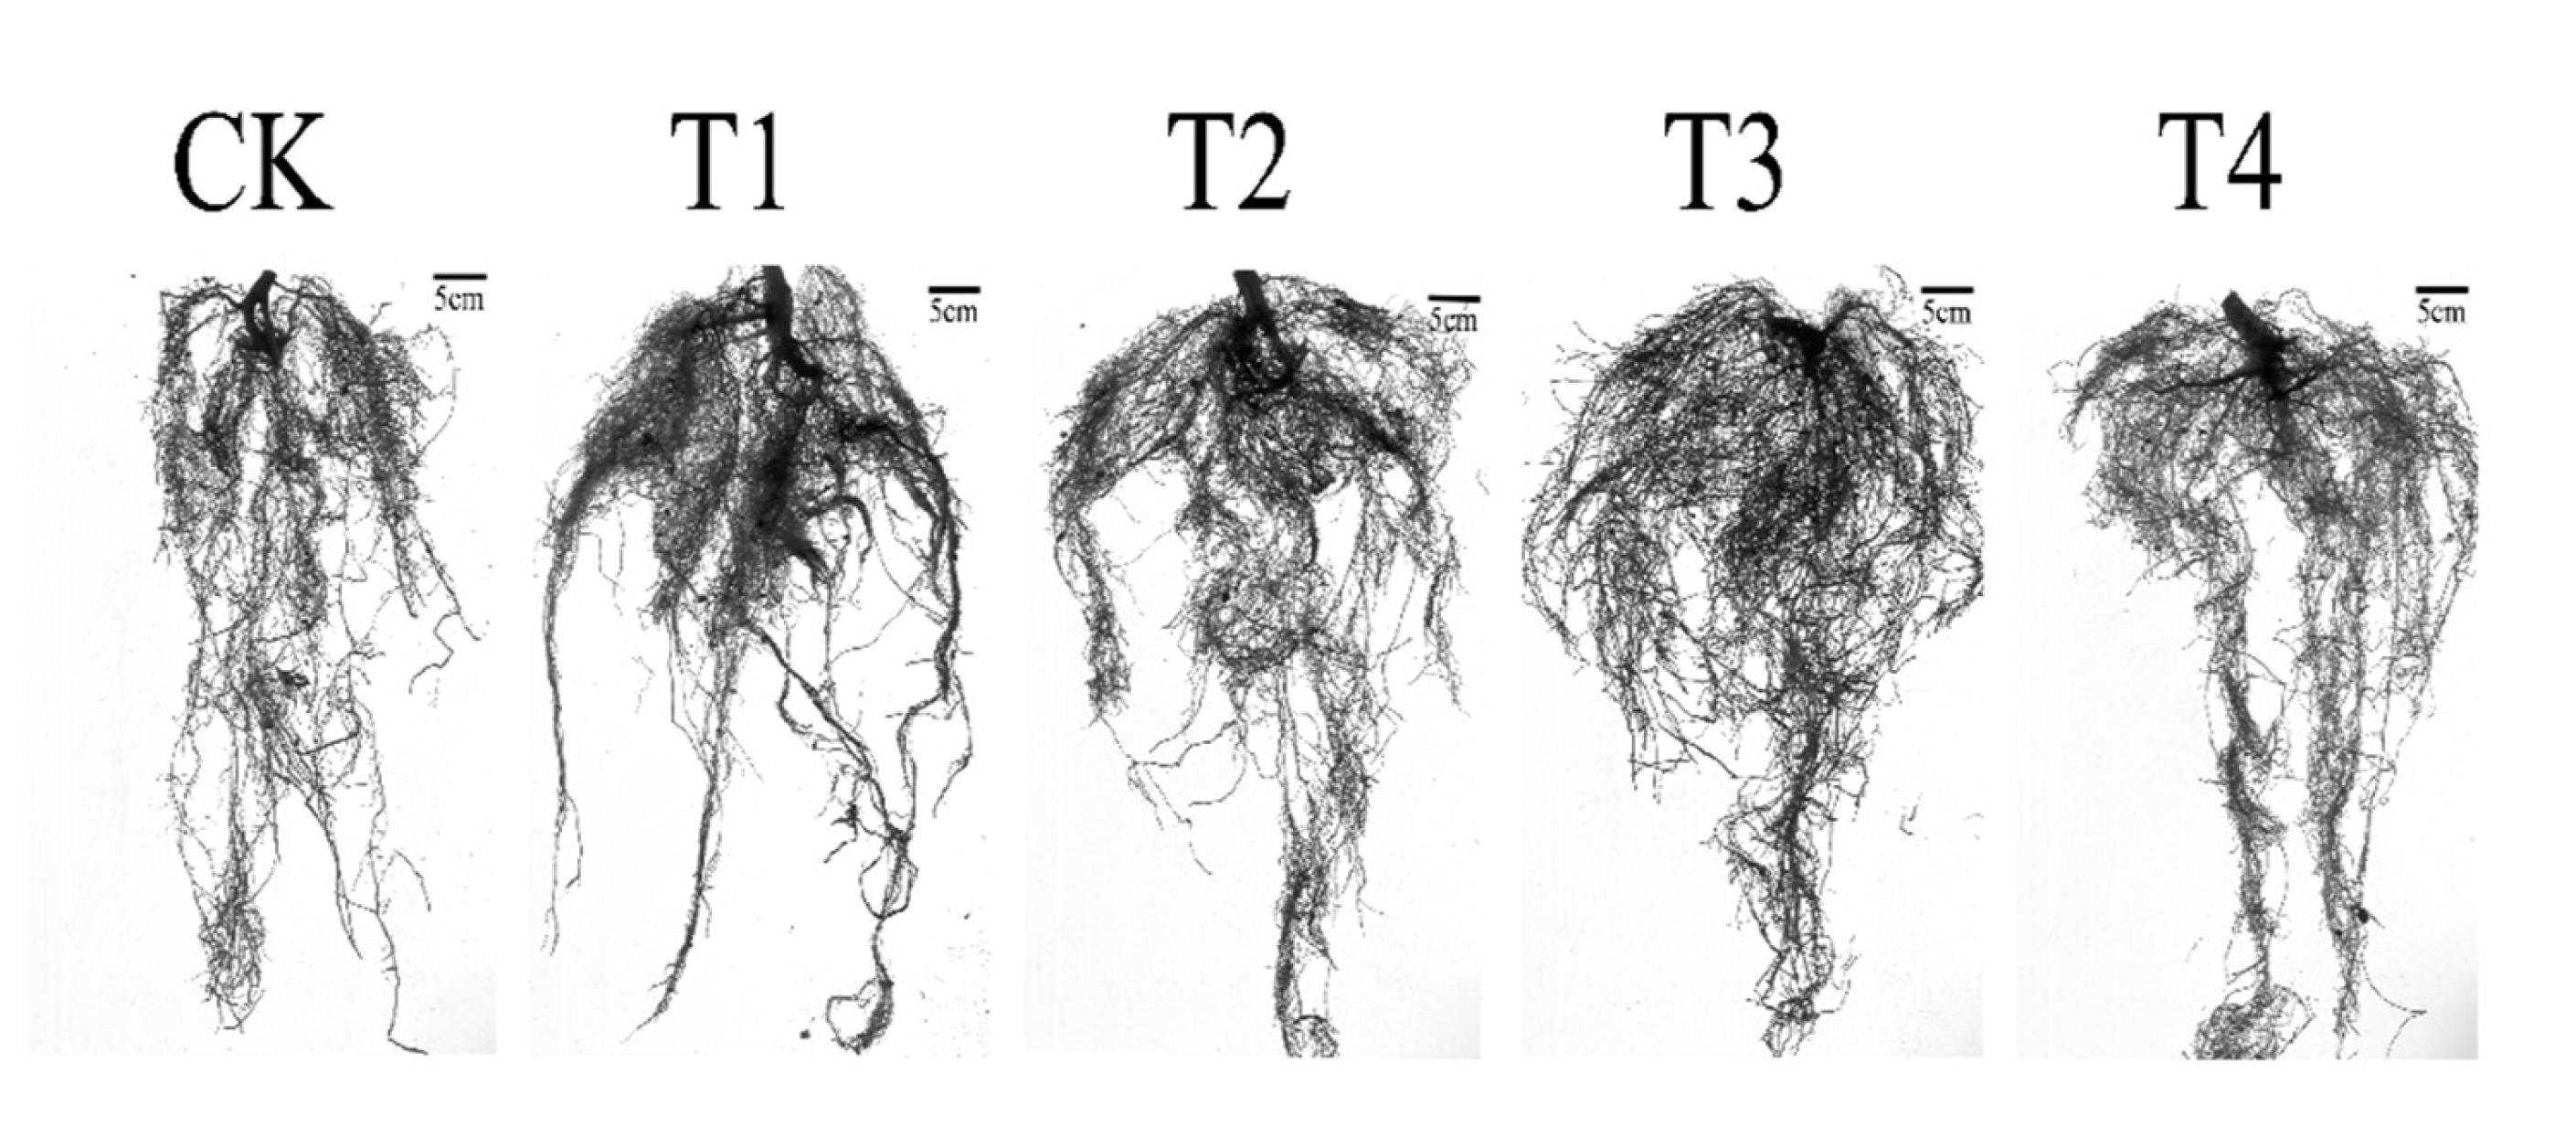
Figure 4.
Effects of drought stress on the net photosynthetic rate(A), stomatal conductance(B), intercellular CO2 concentration(C), and transpiration rate(D) of I. polycarpa. Different lowercase letters indicate significant differences between each treatment (p < 0.05).
Figure 4.
Effects of drought stress on the net photosynthetic rate(A), stomatal conductance(B), intercellular CO2 concentration(C), and transpiration rate(D) of I. polycarpa. Different lowercase letters indicate significant differences between each treatment (p < 0.05).
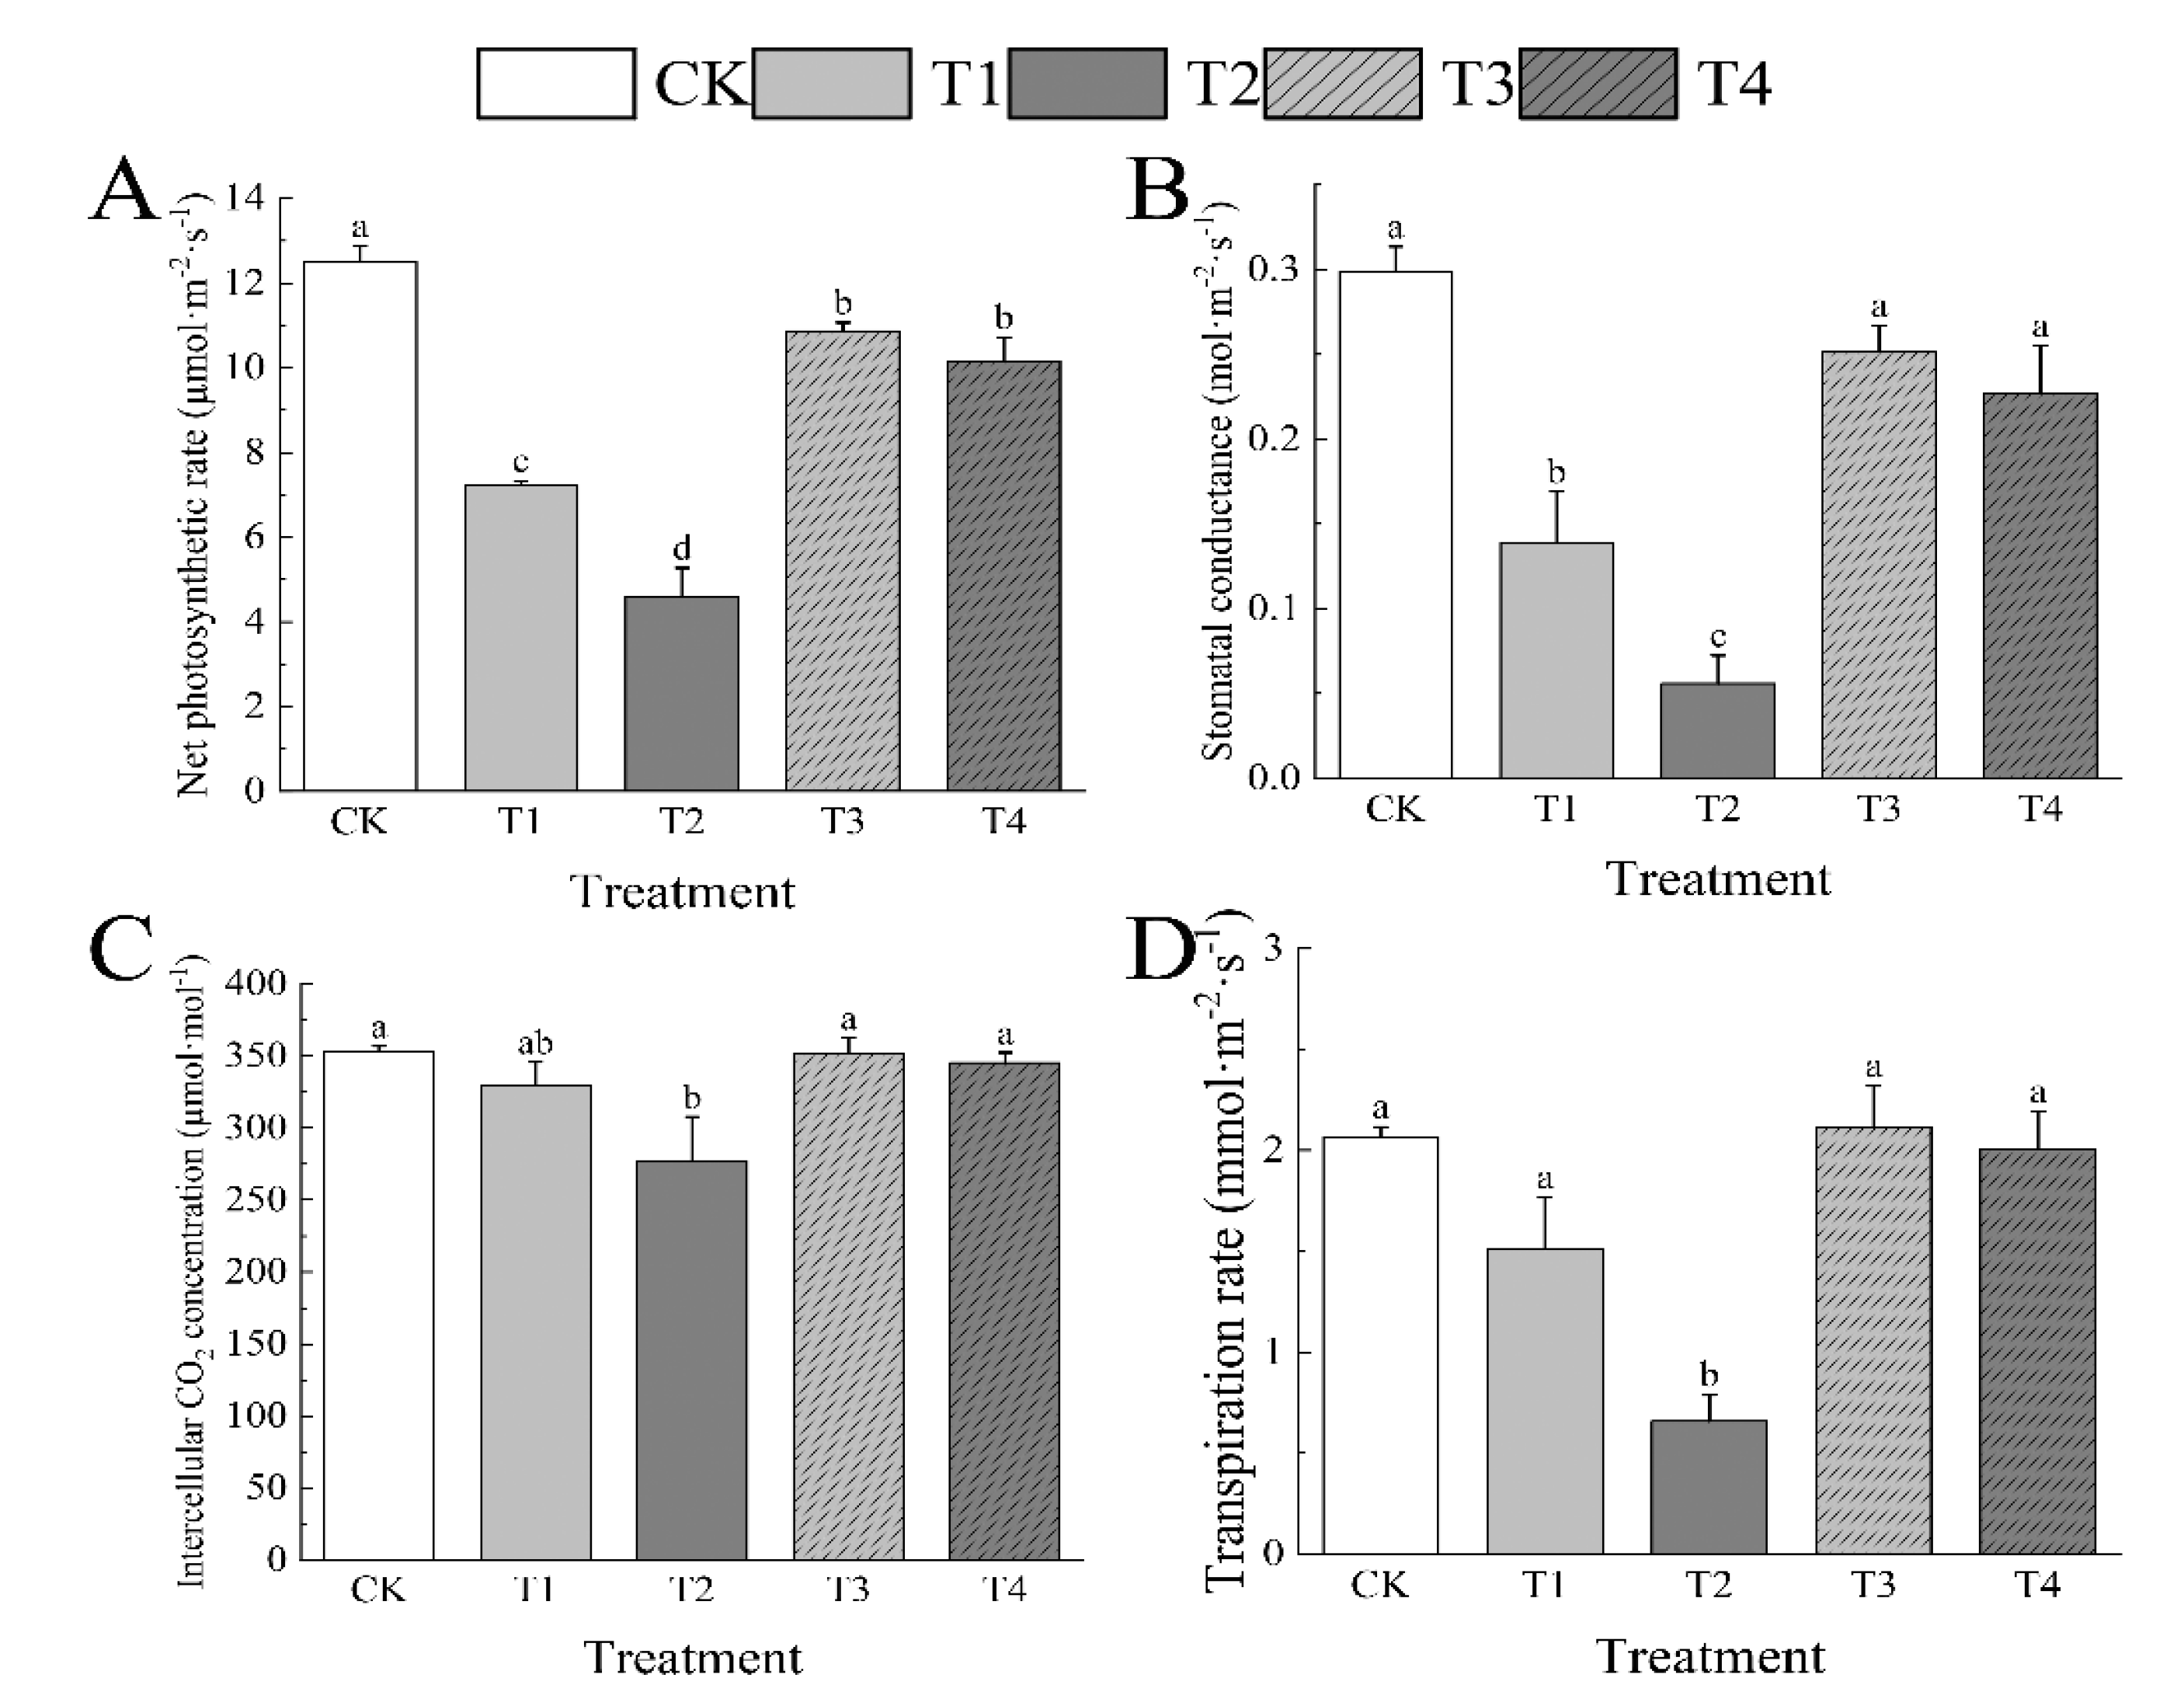
Figure 5.
Effects of drought stress on leaf relative water content (A), leaf relative electrical conductivity (B), and MDA content(C) of leaves of I. polycarpa. Different lowercase letters indicate significant differences between each treatment (p < 0.05).
Figure 5.
Effects of drought stress on leaf relative water content (A), leaf relative electrical conductivity (B), and MDA content(C) of leaves of I. polycarpa. Different lowercase letters indicate significant differences between each treatment (p < 0.05).
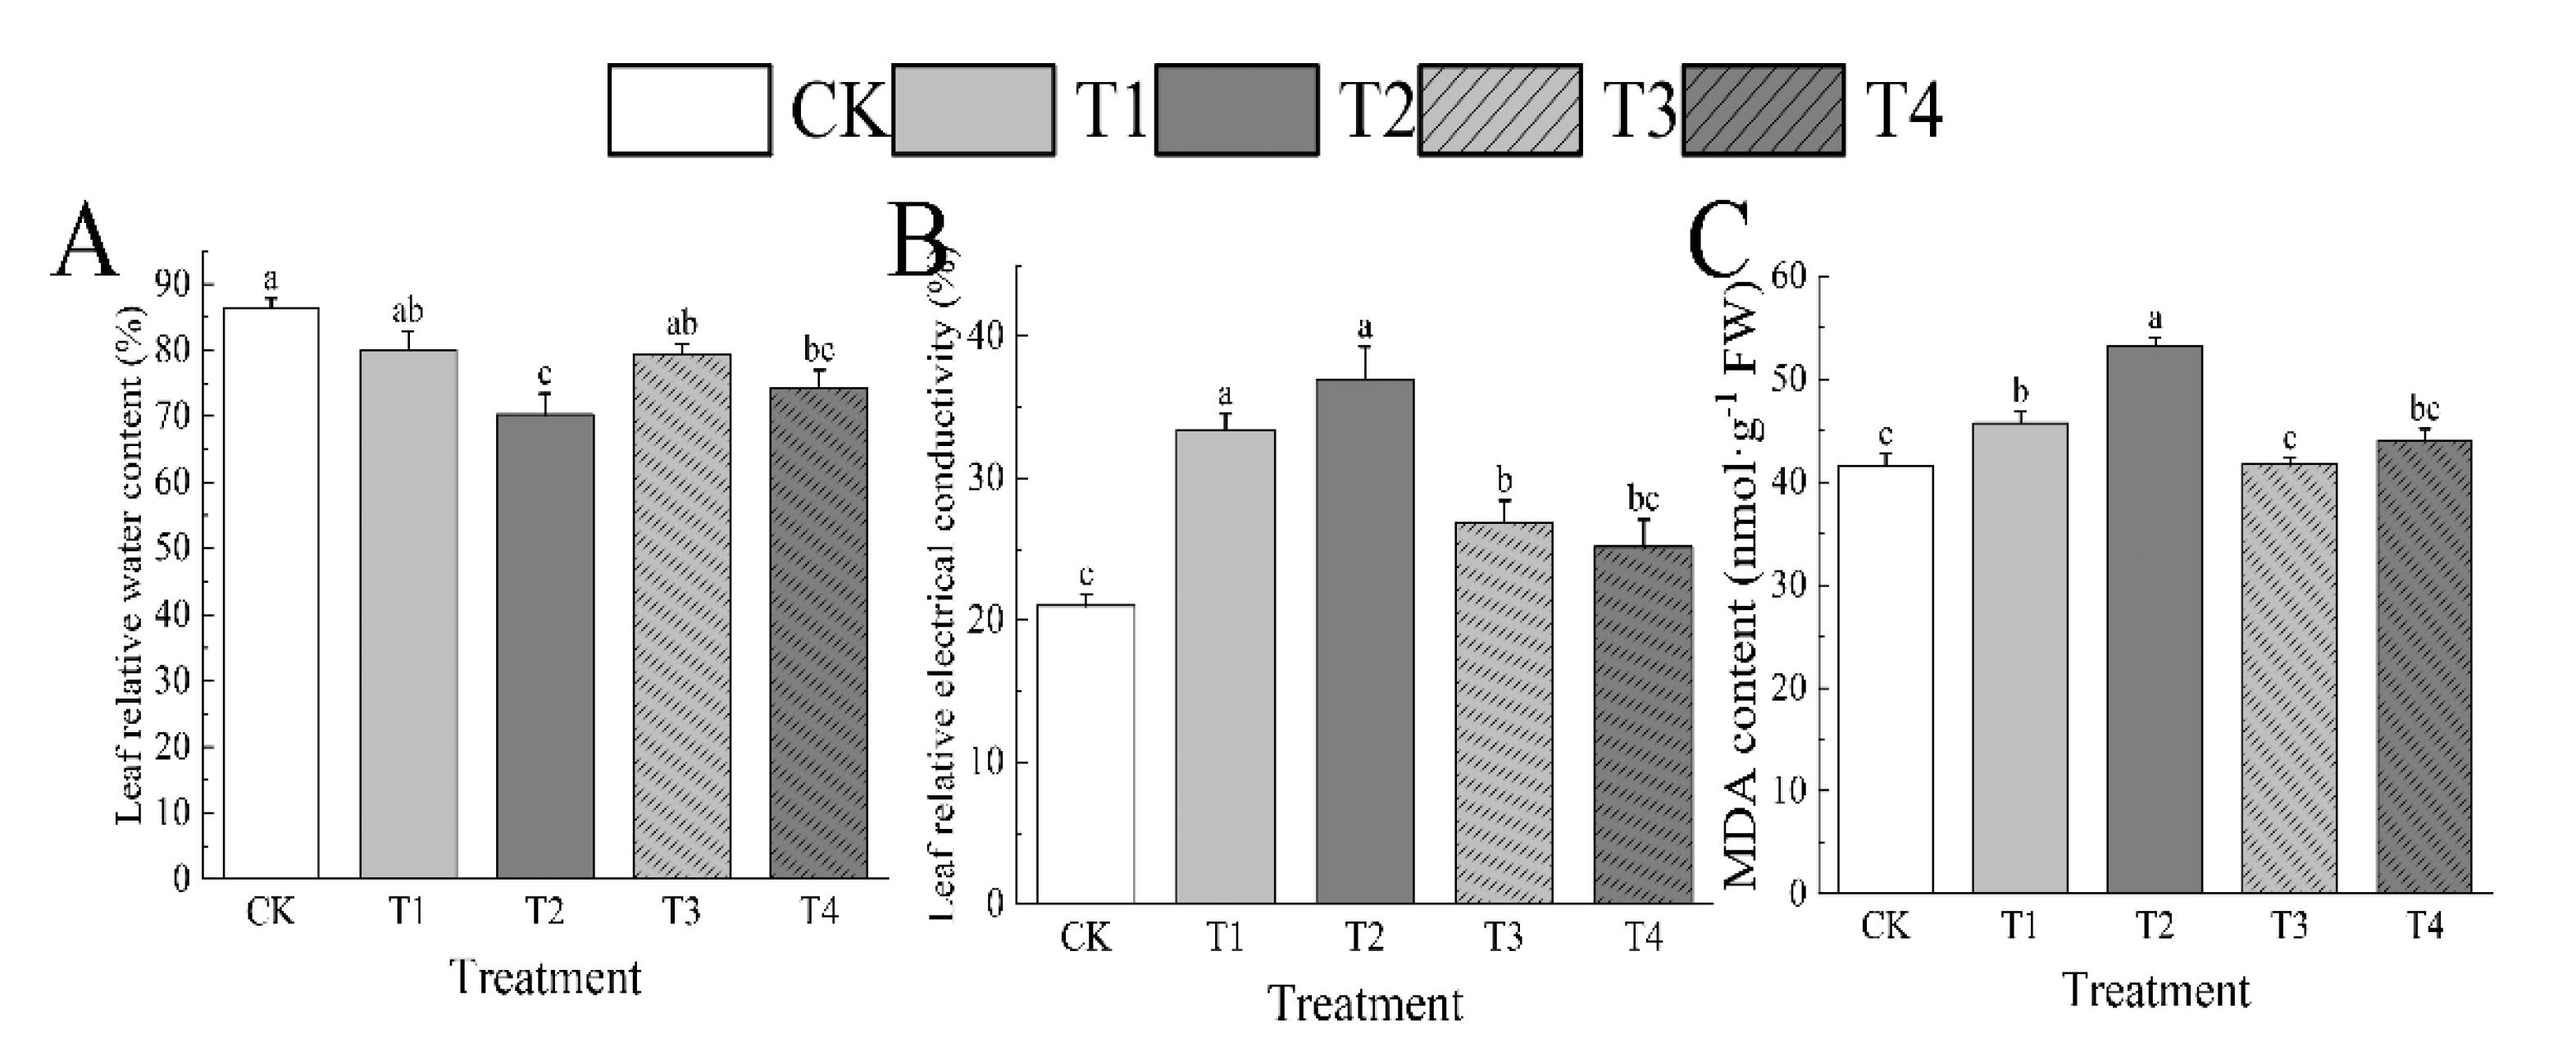
Figure 6.
Effects of drought stress on POD activity (A), SOD activity (B), APX activity (C), and CAT activity (D) of leaves of I. polycarpa. Different lowercase letters indicate significant differences between each treatment (p < 0.05).
Figure 6.
Effects of drought stress on POD activity (A), SOD activity (B), APX activity (C), and CAT activity (D) of leaves of I. polycarpa. Different lowercase letters indicate significant differences between each treatment (p < 0.05).
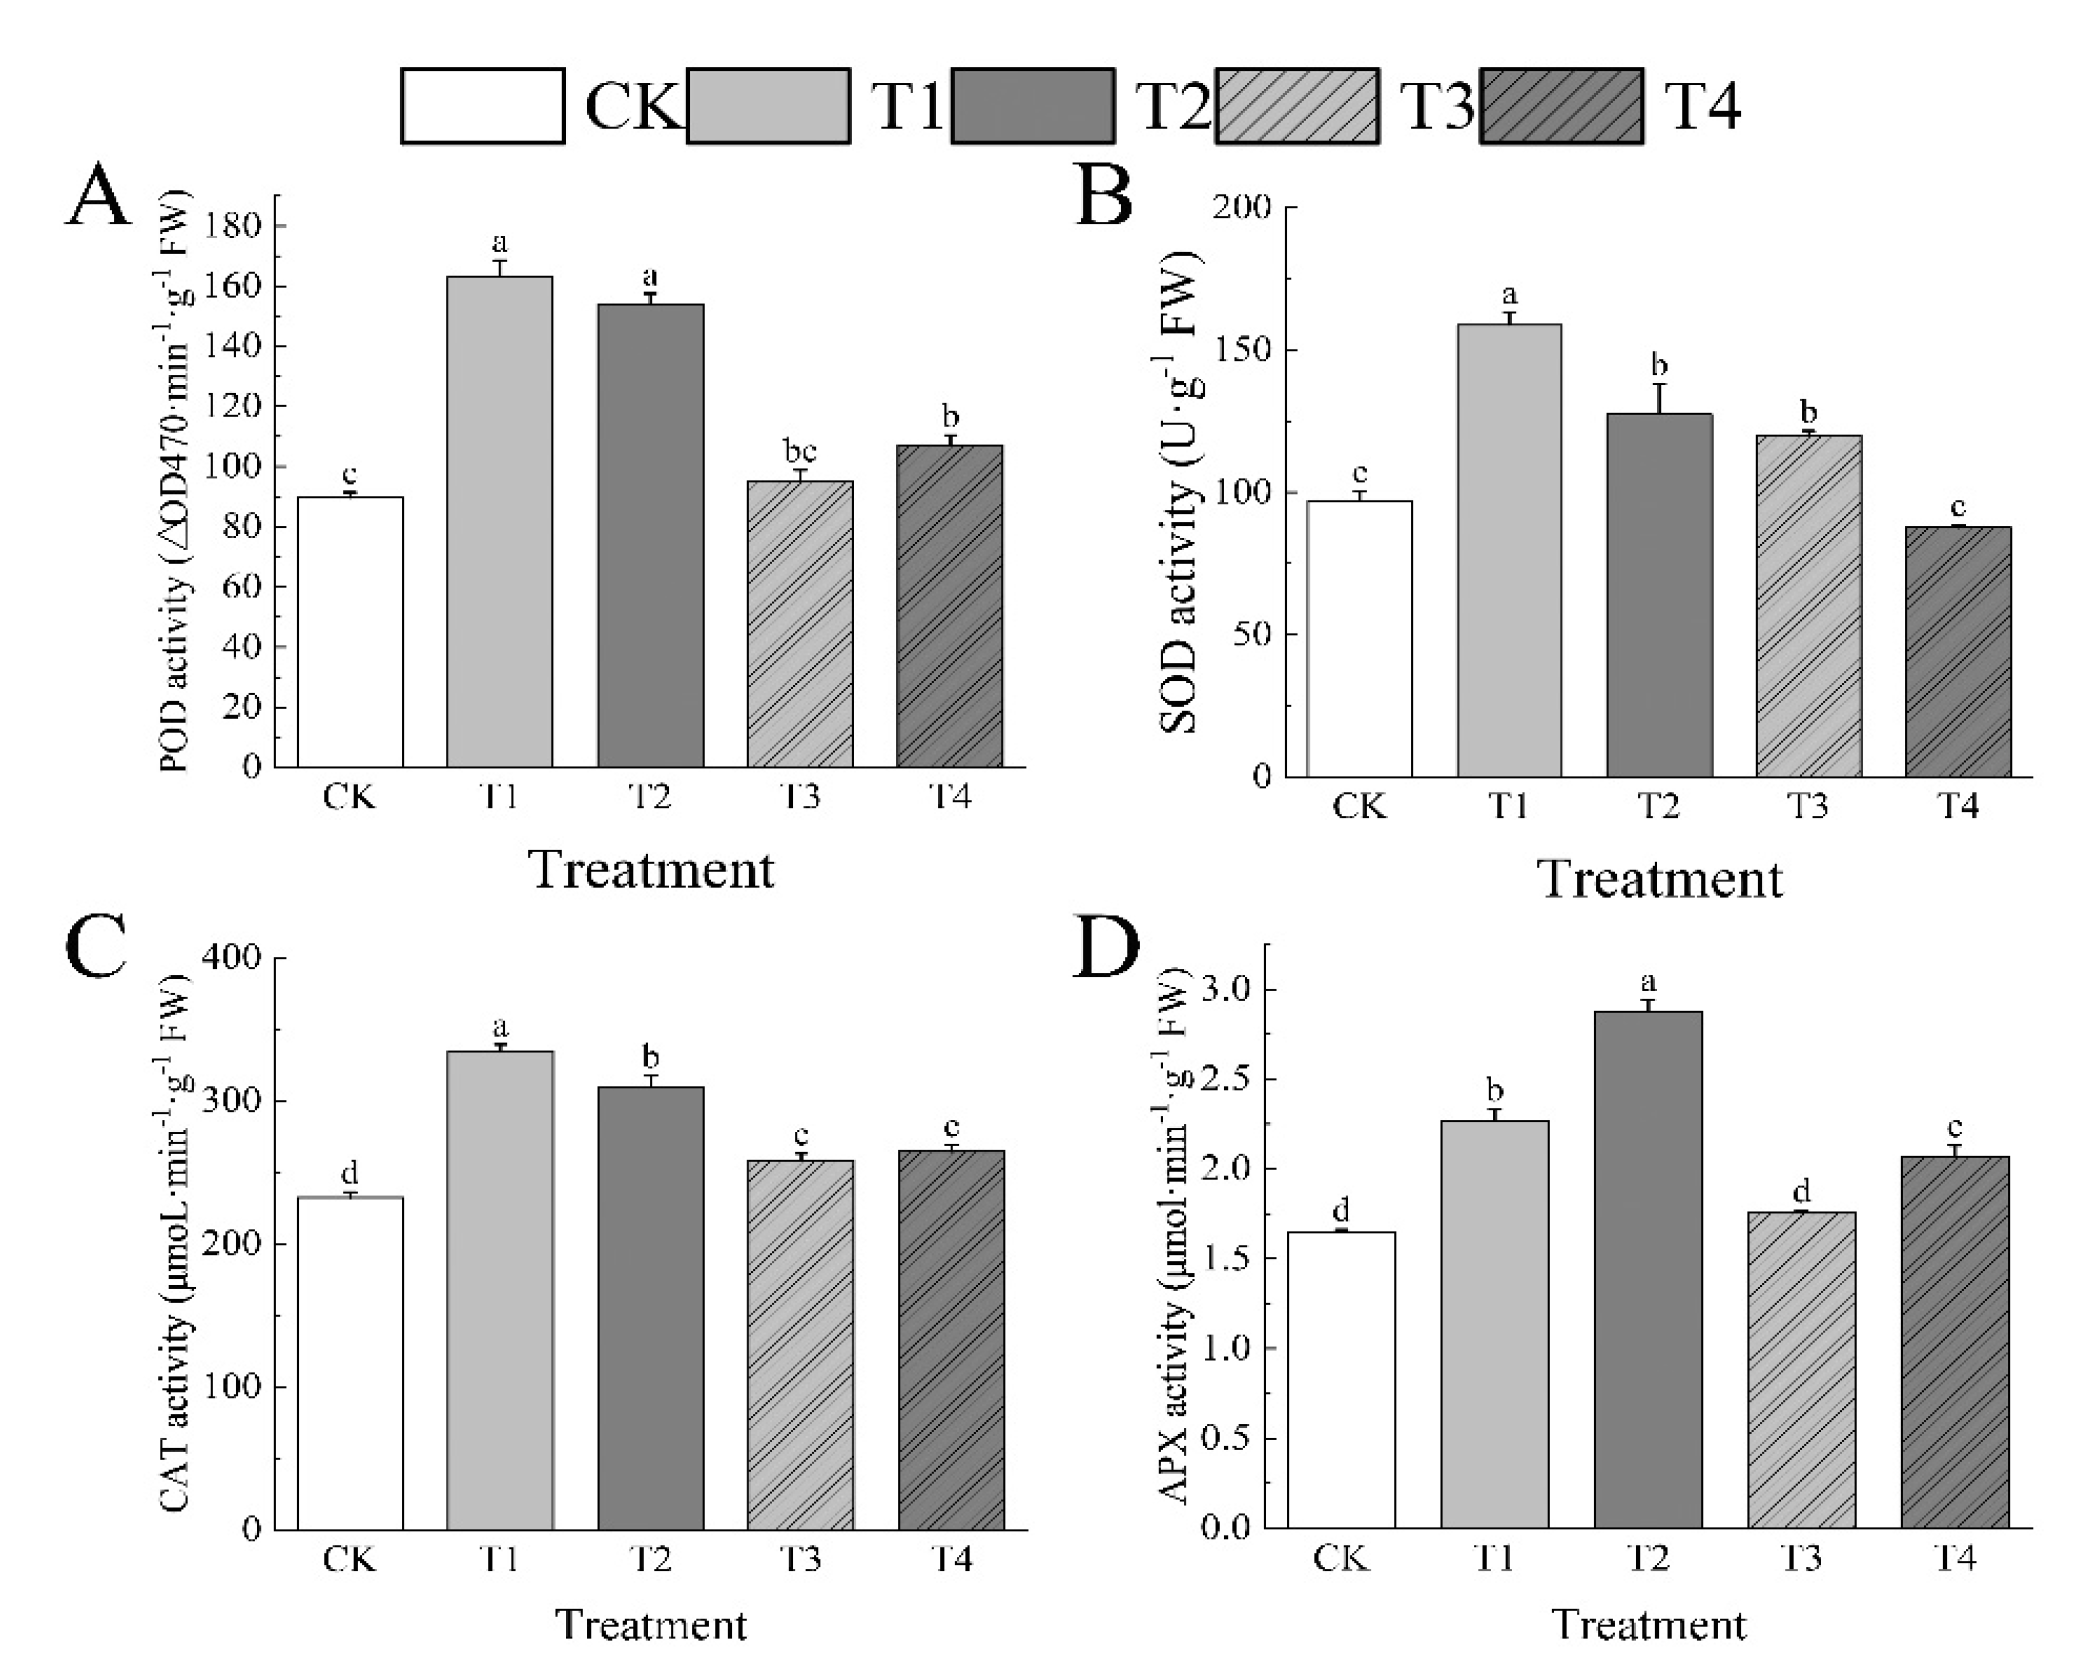
Figure 7.
Effects of drought stress on proline content (A), betaine content (B), SP content (C), and SS content (D) of leaves of I. polycarpa. Different lowercase letters indicate significant differences between each treatment (p < 0.05).
Figure 7.
Effects of drought stress on proline content (A), betaine content (B), SP content (C), and SS content (D) of leaves of I. polycarpa. Different lowercase letters indicate significant differences between each treatment (p < 0.05).
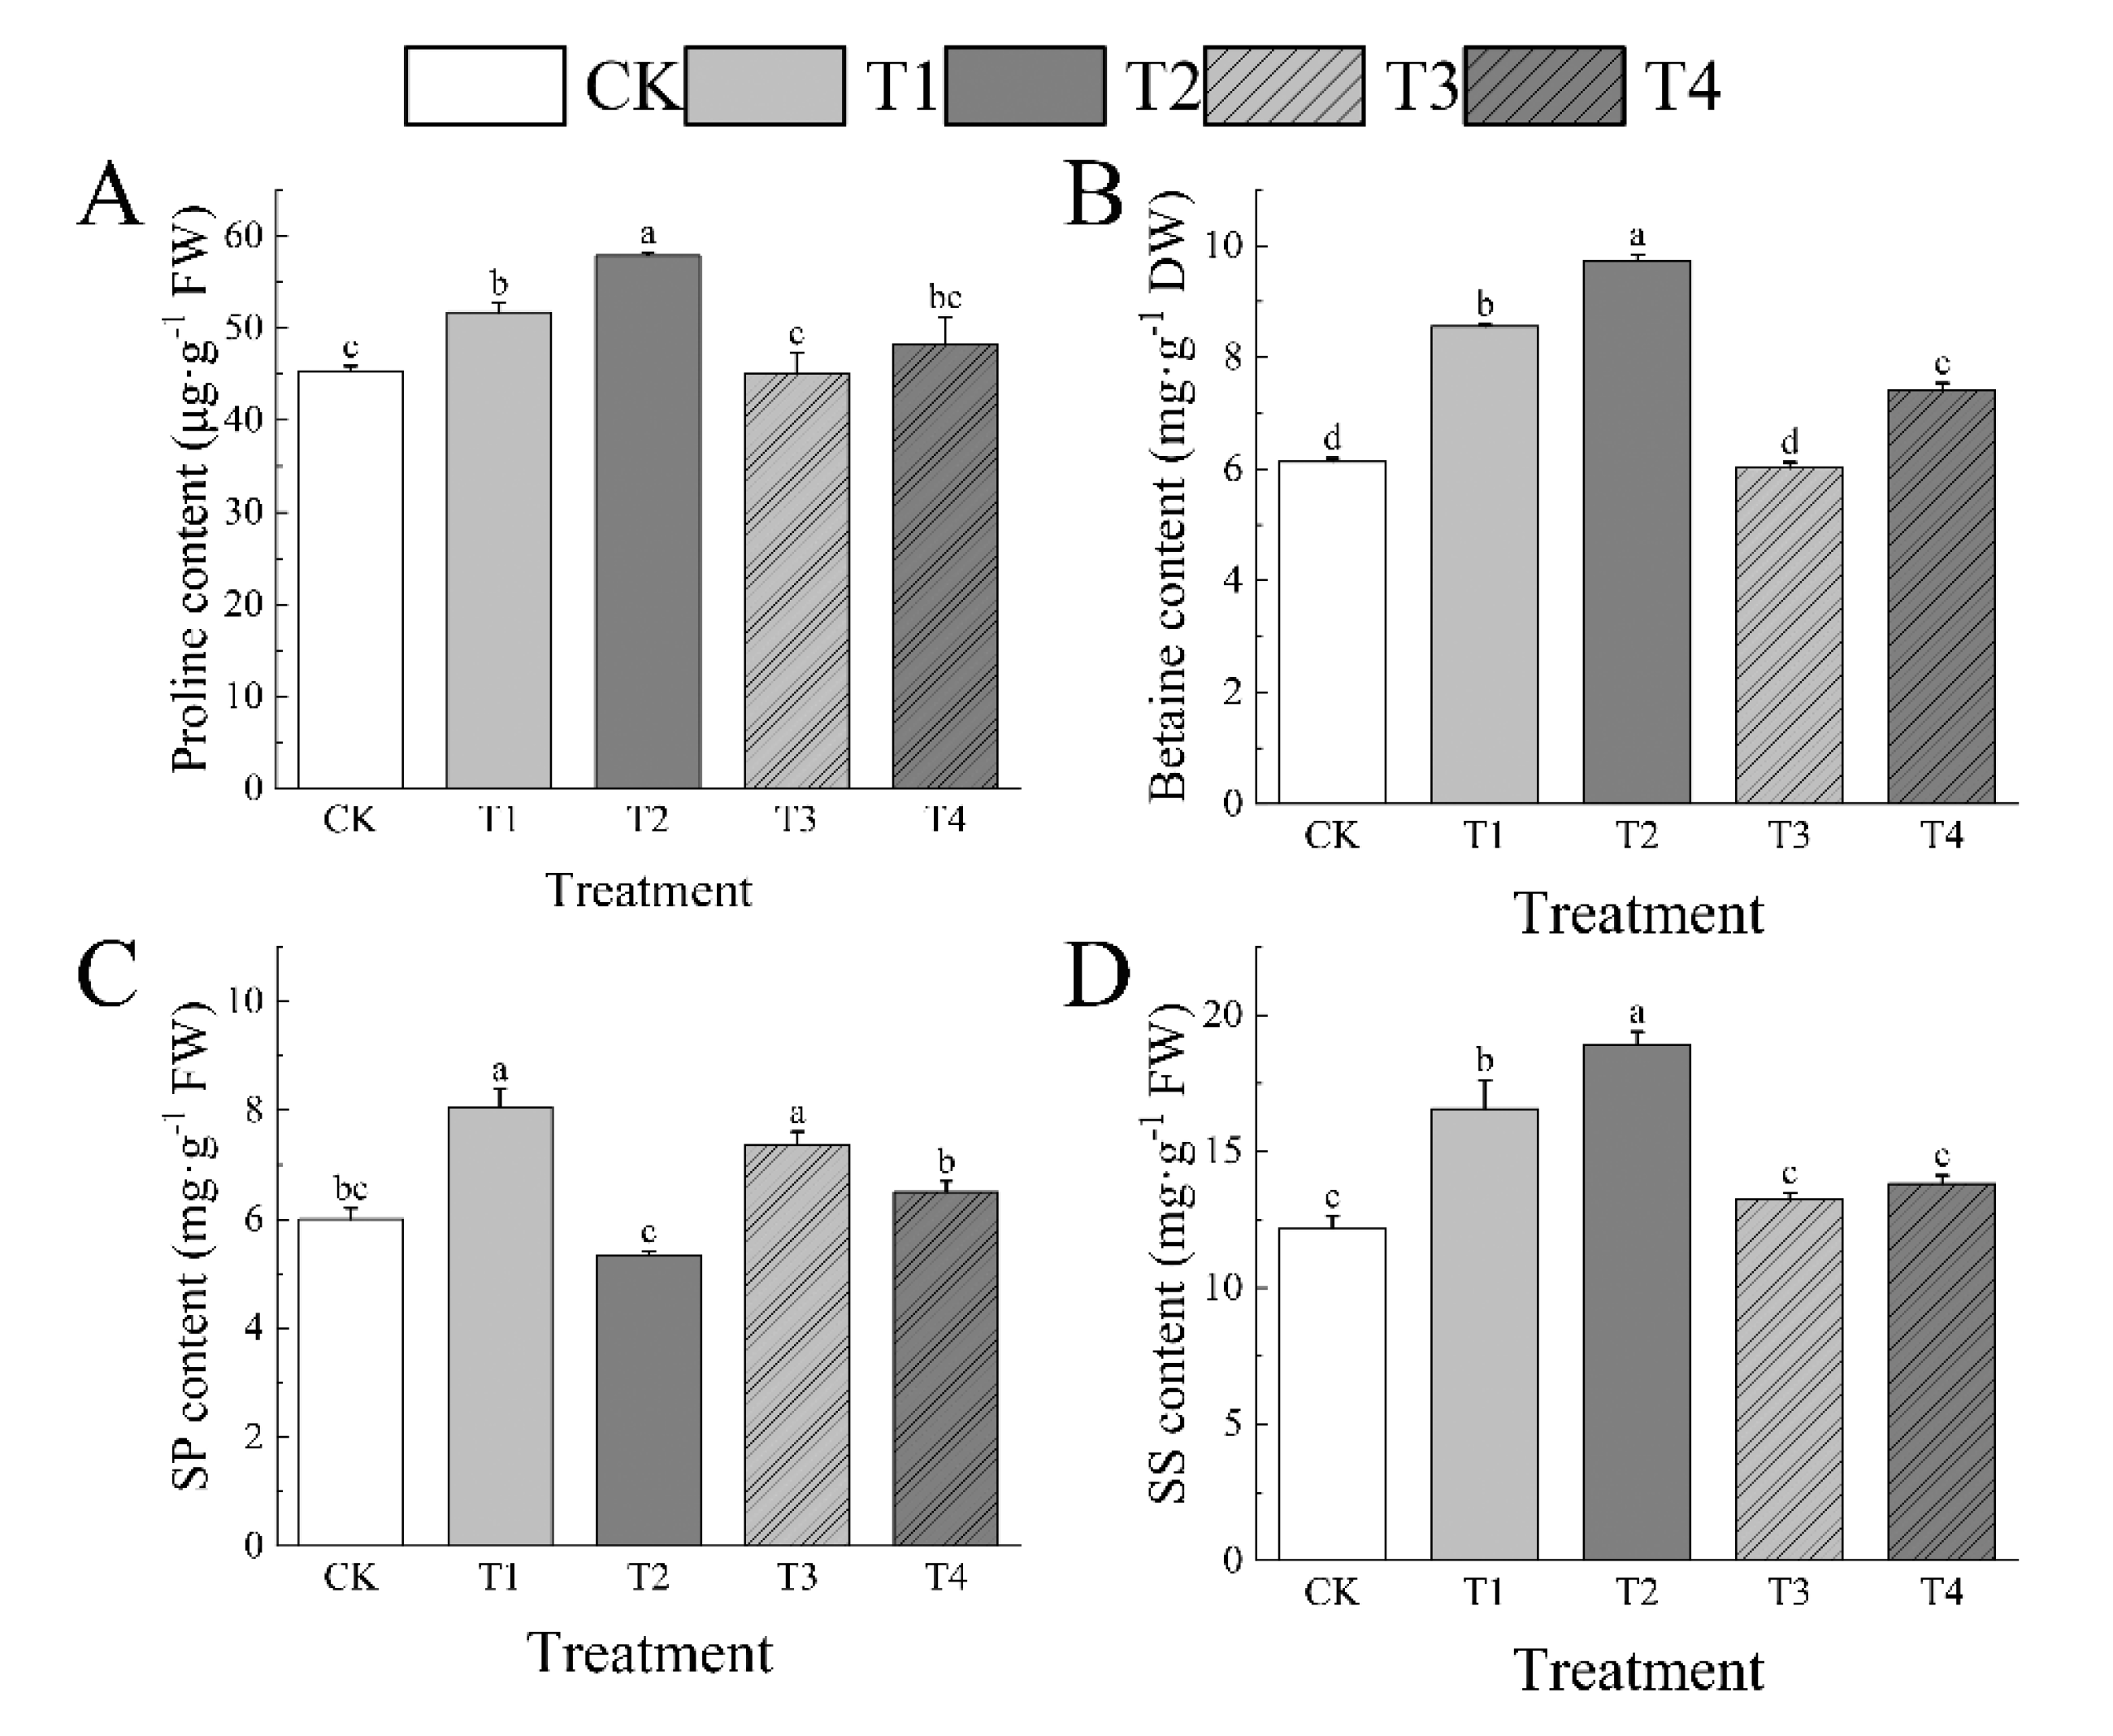
Figure 8.
Effects of drought stress on ABA content (A), SA content (B), IAA content (C), and GA content (D) of leaves of I. polycarpa. Different lowercase letters indicate significant differences between each treatment (p < 0.05).
Figure 8.
Effects of drought stress on ABA content (A), SA content (B), IAA content (C), and GA content (D) of leaves of I. polycarpa. Different lowercase letters indicate significant differences between each treatment (p < 0.05).
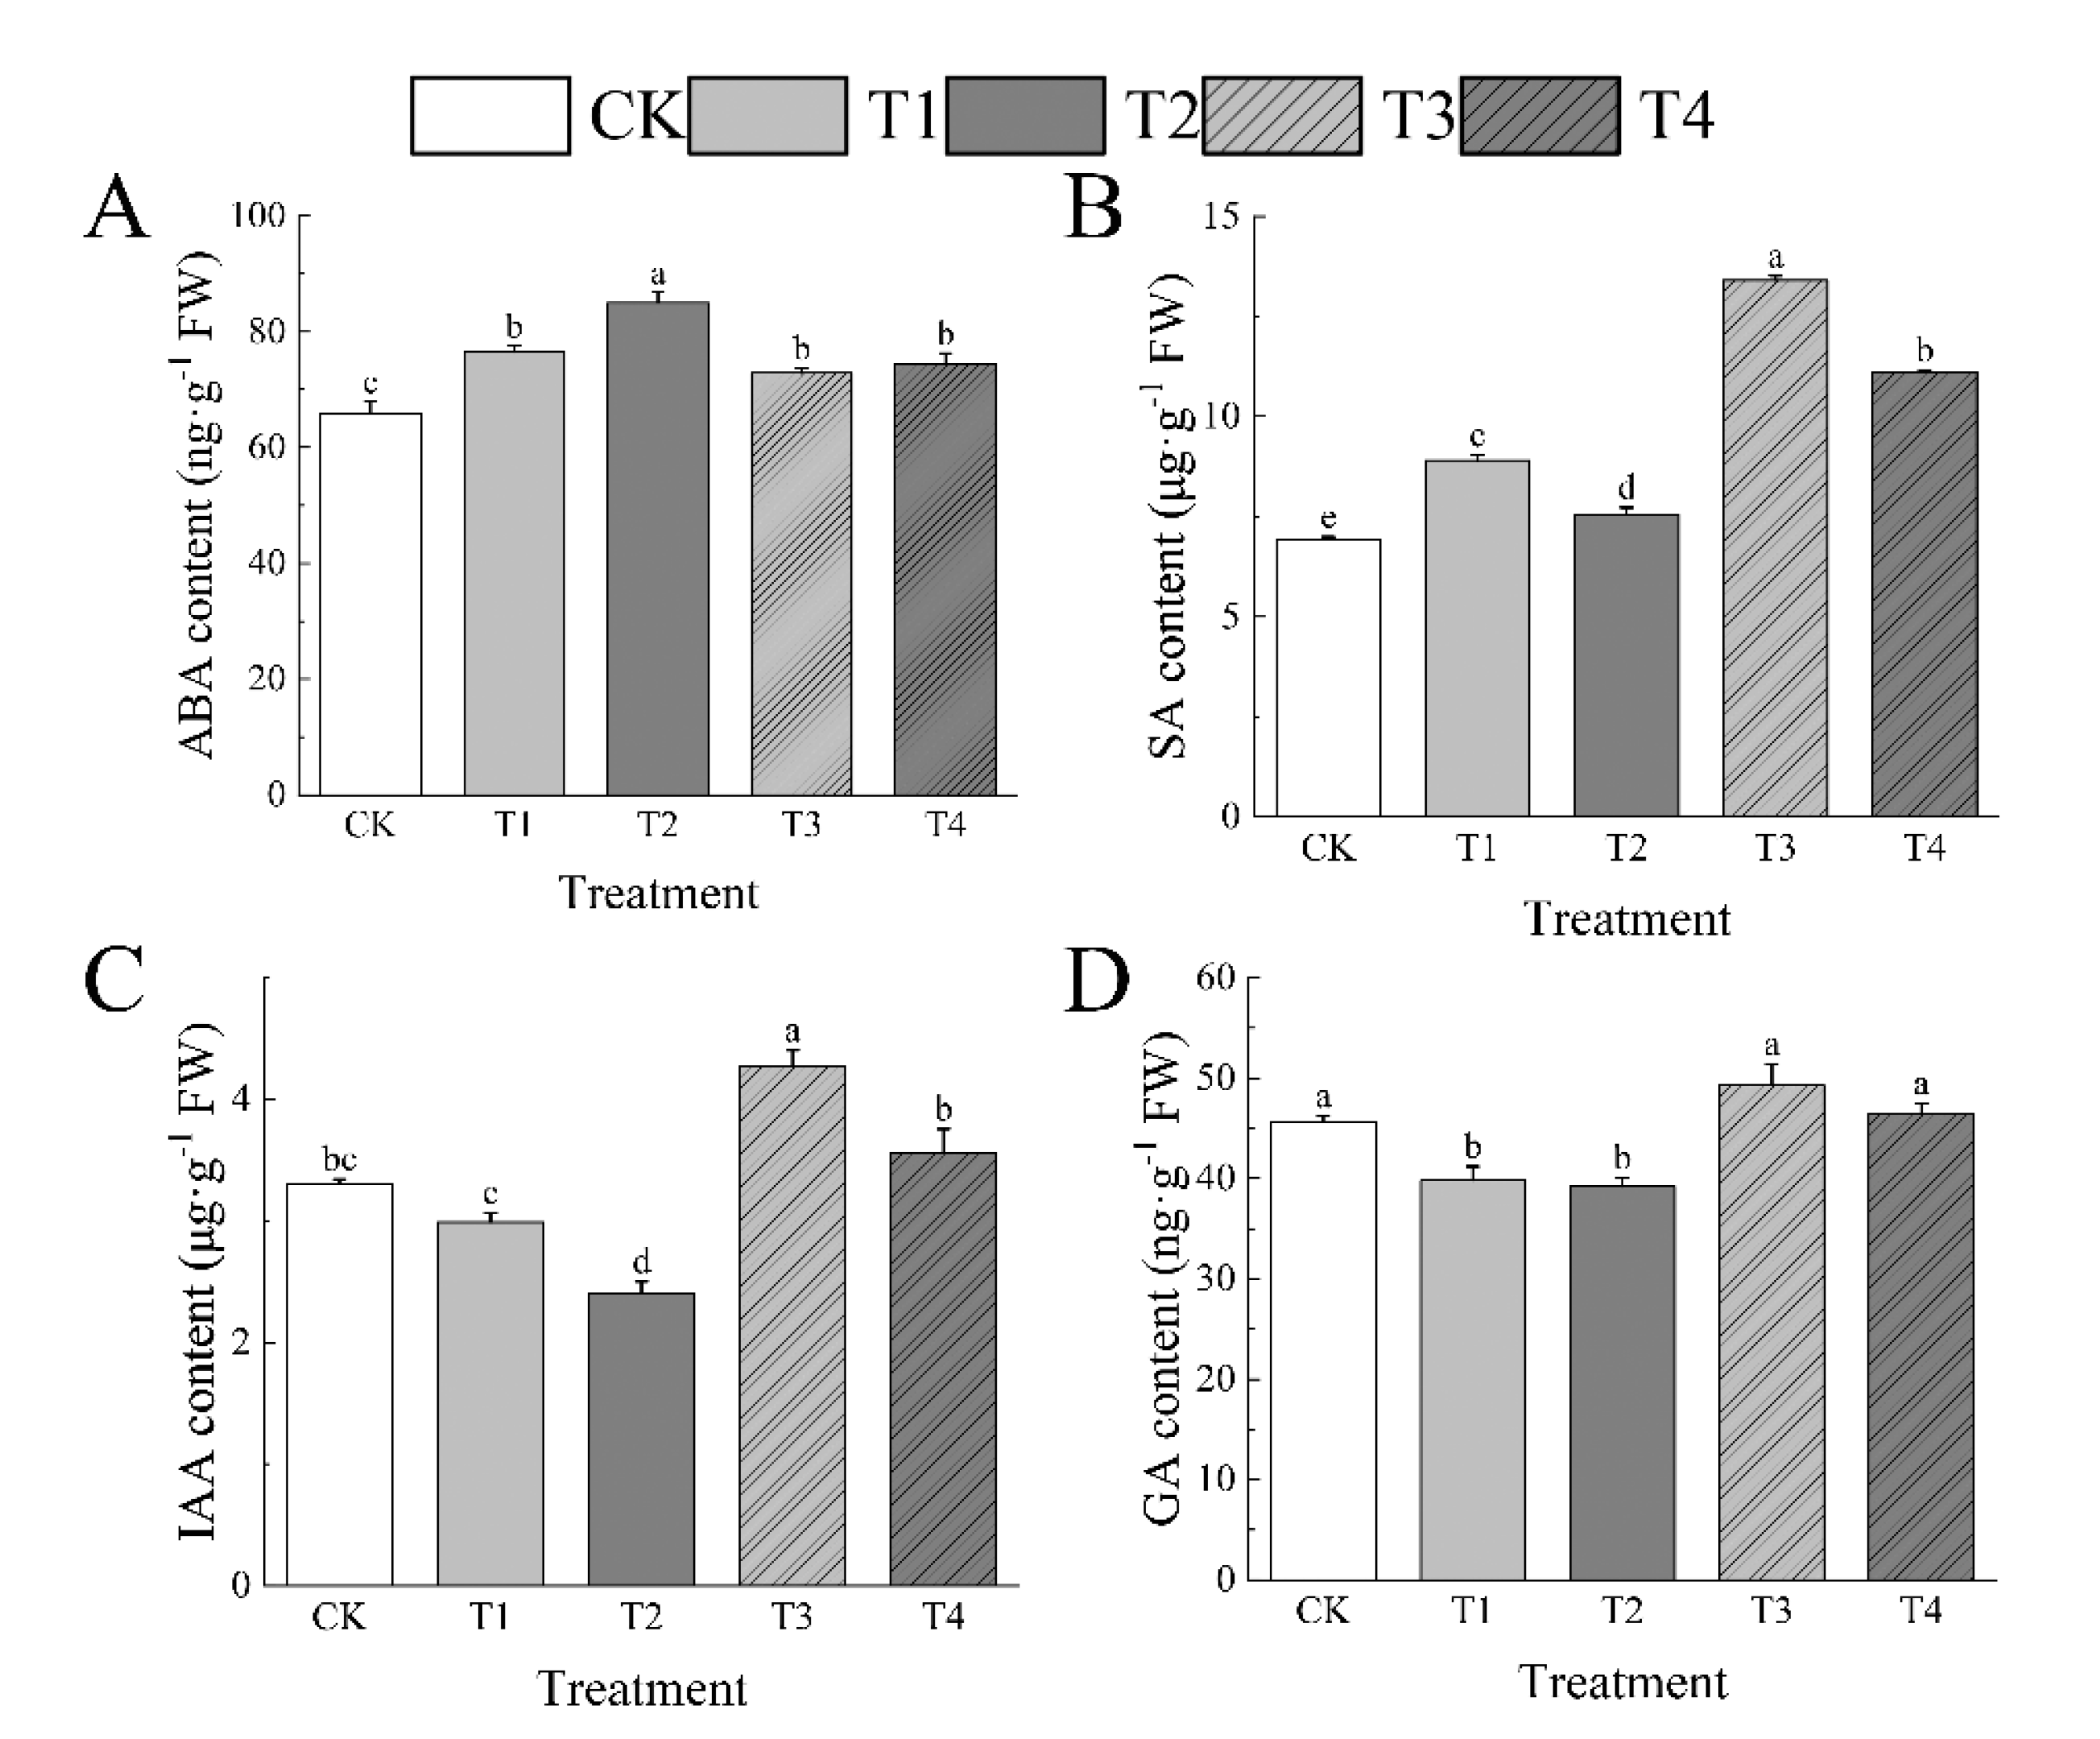
Figure 9.
Leaf anatomy of I. polycarpa seedlings leaves.
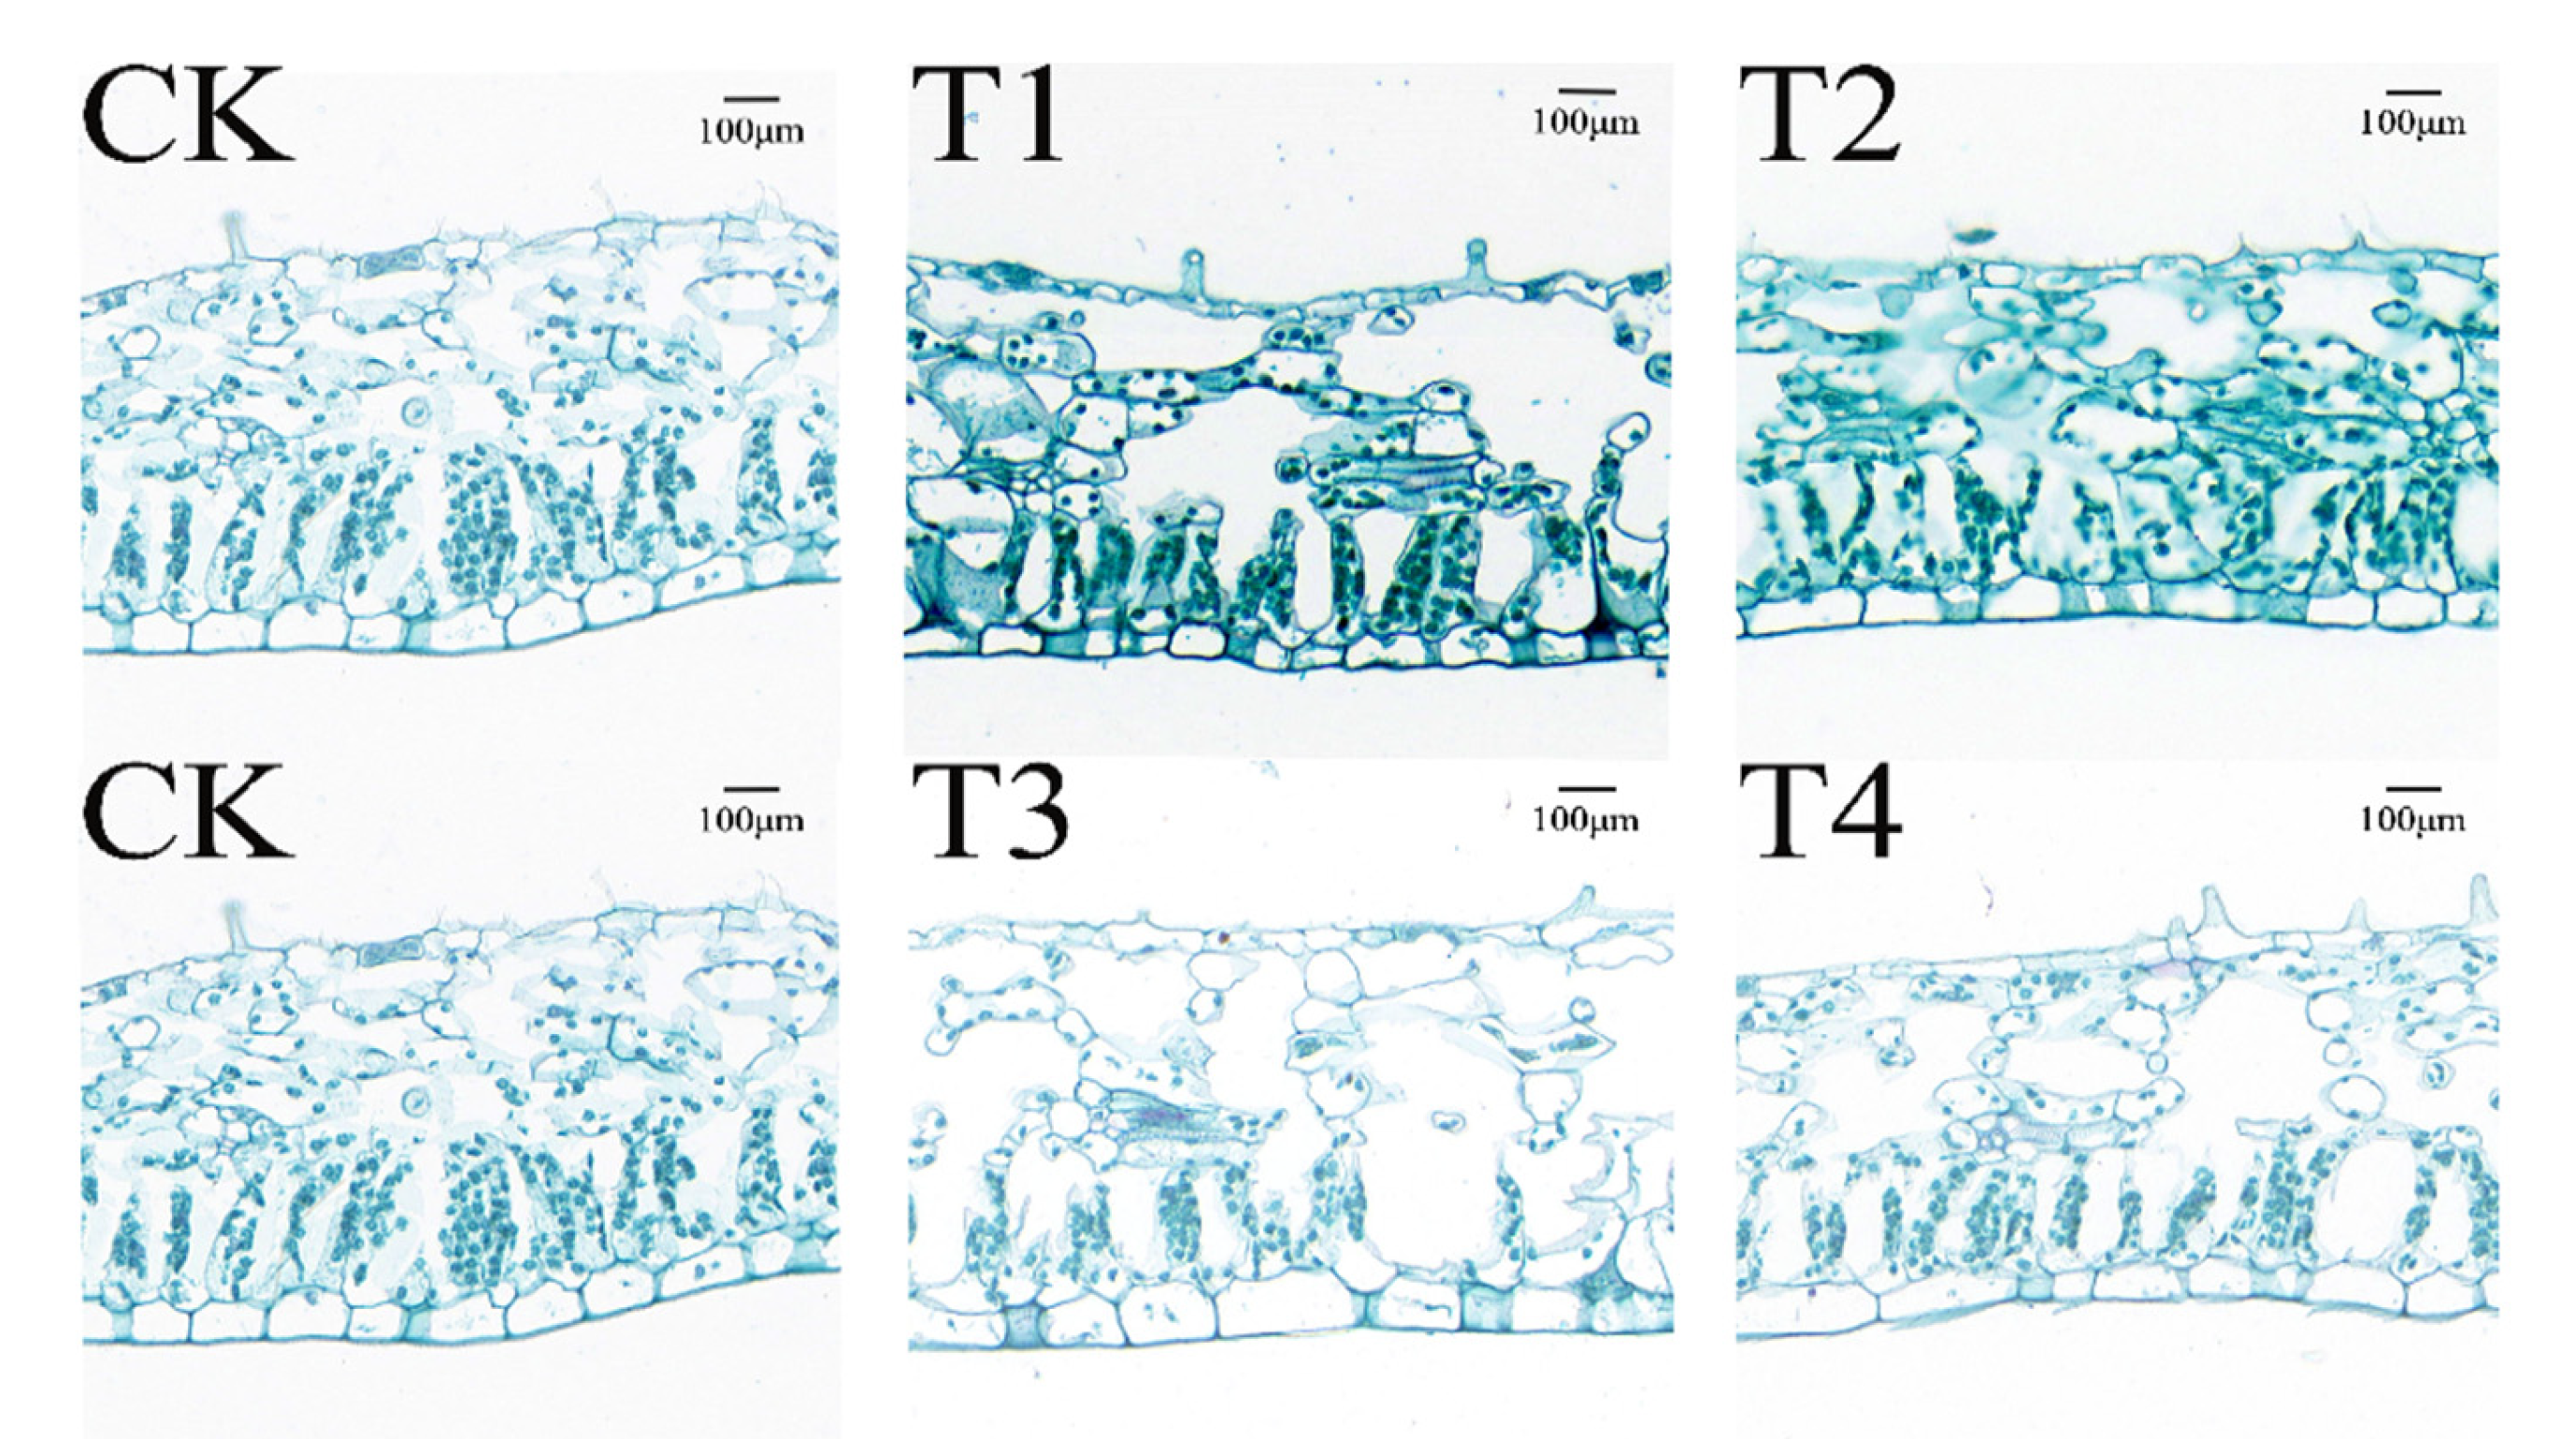
Figure 10.
Pearson’s correlation matrix analysis of key growth and physiological indices of I. polycarpa seedings; * indicates significant correlation(p≤0.05); ** indicates extremely significant correlation(p≤0.01).
Figure 10.
Pearson’s correlation matrix analysis of key growth and physiological indices of I. polycarpa seedings; * indicates significant correlation(p≤0.05); ** indicates extremely significant correlation(p≤0.01).
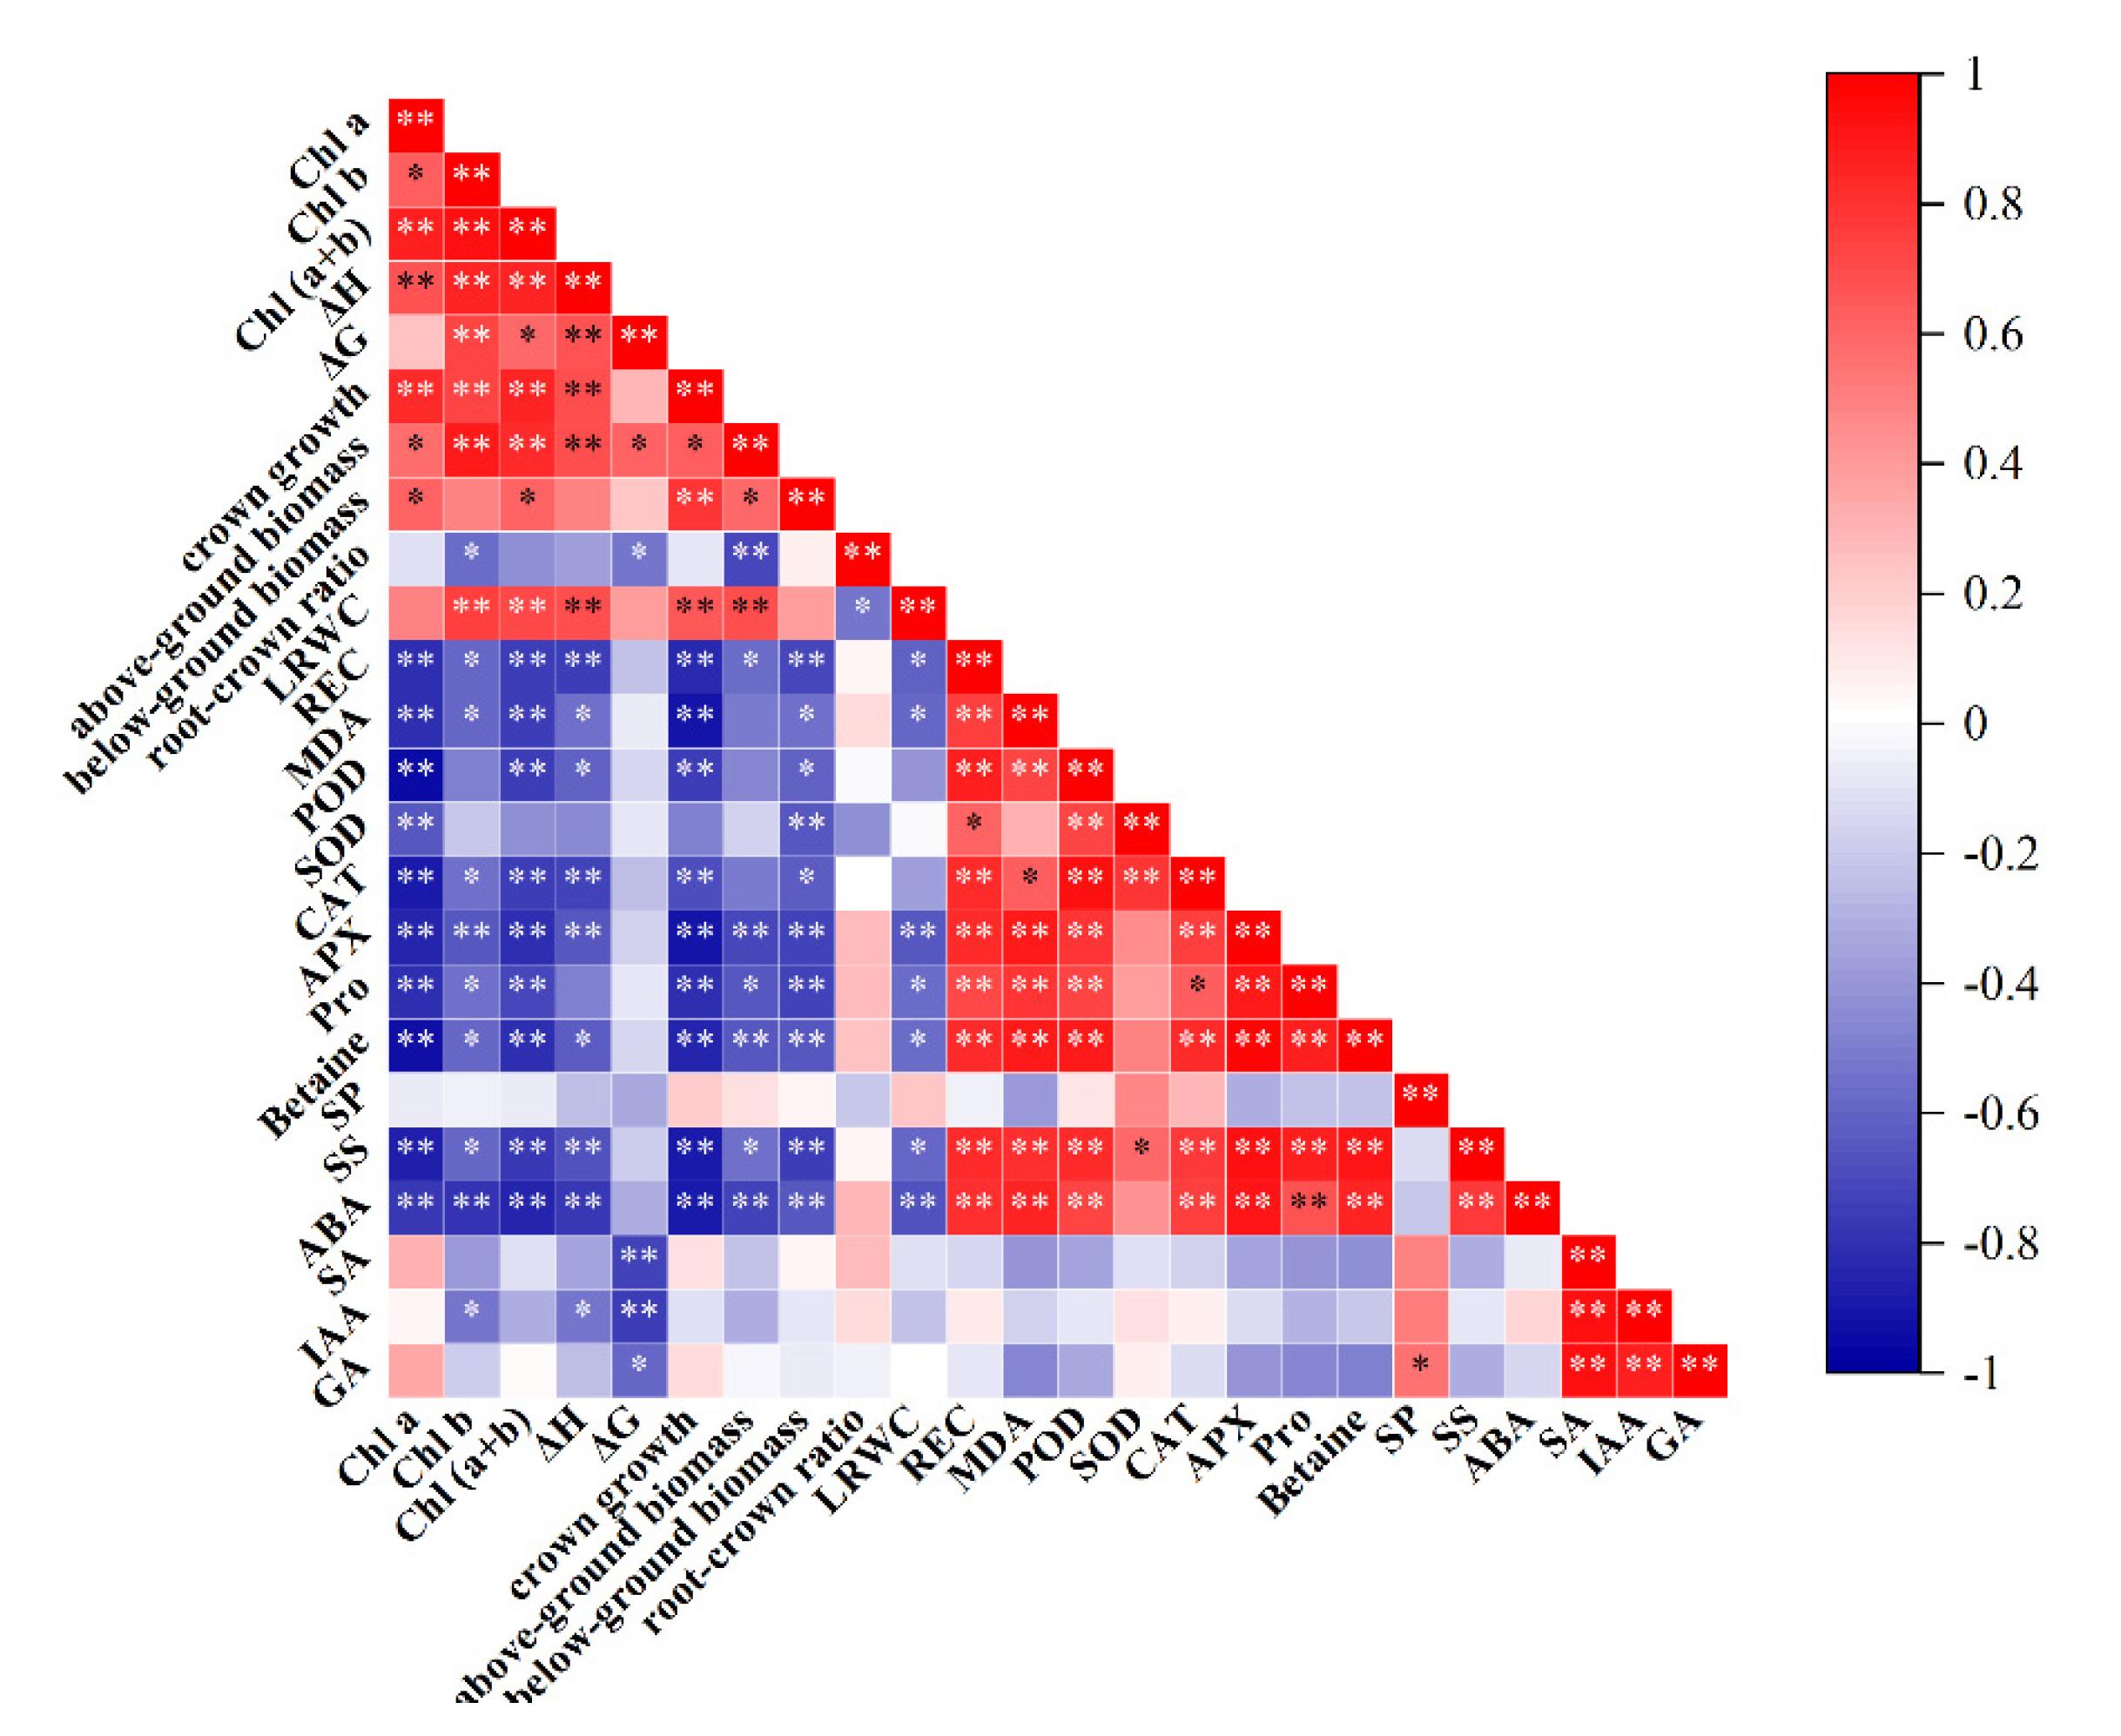
Figure 11.
Principal component analysis of key indicators of growth and physiology of I. polycarpa seedlings. A: PCA 2D Biplot; B: Scree Plot; C: Biplot with cos2 Values; high cos² values are represented by red arrows, intermediate cos² values are represented by yellow arrows, low cos² values are represented by blue arrows.
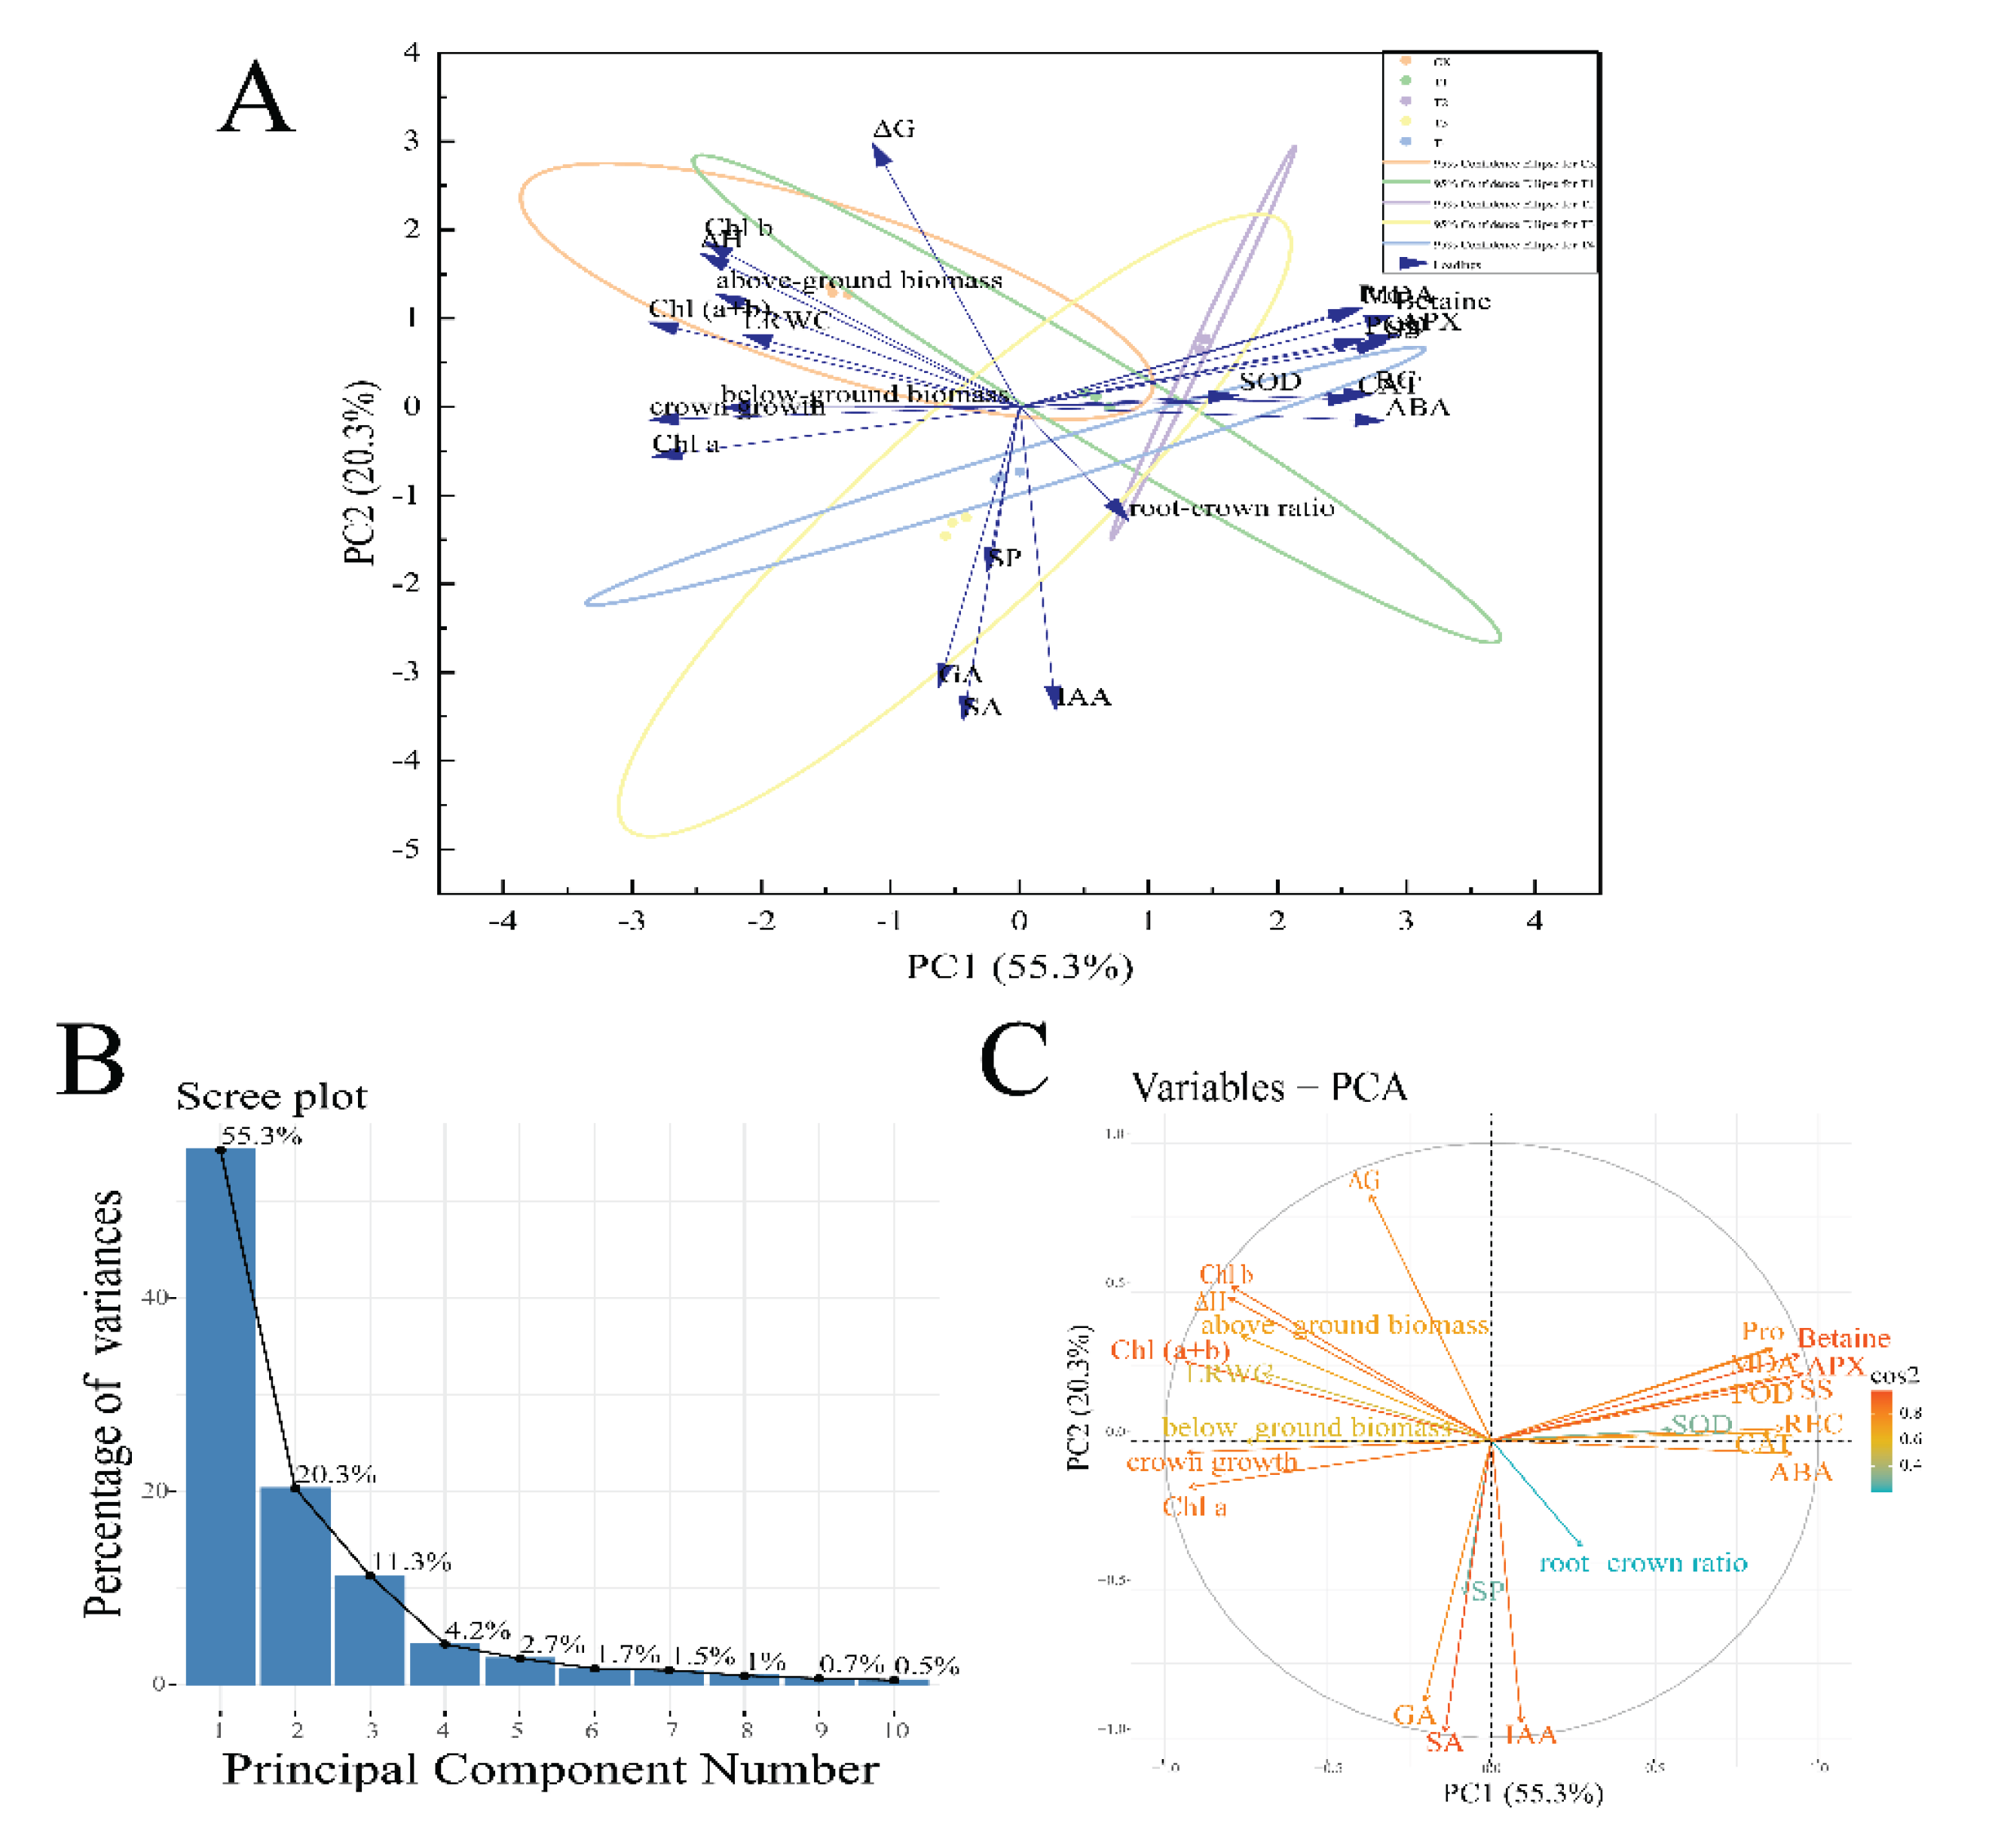

Table 1.
Effects of drought stress on chlorophyll a, chlorophyll b, and total chlorophyll contents of I. polycarpa. Different lowercase letters indicate significant differences between each treatment (p < 0.05).
Table 1.
Effects of drought stress on chlorophyll a, chlorophyll b, and total chlorophyll contents of I. polycarpa. Different lowercase letters indicate significant differences between each treatment (p < 0.05).
| Treatment |
Chlorophyll a content (mg·g−1 FW) |
Chlorophyllb content (mg·g−1 FW) |
Total chlorophyll content (mg·g−1 FW) |
| CK | 1.882±0.001a | 2.161±0.082a | 4.042±0.082a |
| T1 | 0.948±0.004c | 1.044±0.094b | 1.992±0.091c |
| T2 | 0.907±0.017c | 0.526±0.038d | 1.433±0.055d |
| T3 | 1.741±0.086a | 0.956±0.139bc | 2.696±0.224b |
| T4 | 1.499±0.121b | 0.688±0.104cd | 2.188±0.225bc |
Table 2.
Effects of drought stress on the growth of I. polycarpa seedlings. Different lowercase letters indicate significant differences between each treatment (p < 0.05).
Table 2.
Effects of drought stress on the growth of I. polycarpa seedlings. Different lowercase letters indicate significant differences between each treatment (p < 0.05).
| Treatment | ΔH(cm) | ΔG(mm) | crown growth(cm) | above-ground biomass(g) | below-ground biomass(g) | root-crown ratio |
| CK | 3.90±0.15a | 2.66±0.29a | 6.82±1.00a | 51.80±5.72a | 43.82±1.66a | 0.87±0.10c |
| T1 | 0.83±0.41b | 1.18±0.26bc | −0.92±0.16bc | 33.51±1.61bc | 33.07±1.44b | 0.99±0.03bc |
| T2 | 0.73±0.18b | 1.42±0.06b | −9.02±0.27d | 21.24±1.98c | 26.42±2.32b | 1.25±0.06b |
| T3 | 1.47±0.44b | 0.77±0.06cd | 0.92±0.19c | 34.42±3.86b | 34.19±2.19b | 1.01±0.11bc |
| T4 | 1.13±0.22b | 0.47±0.05d | 2.56±0.80b | 24.64±4.16bc | 42.69±3.85a | 1.79±0.16a |
Table 3.
Effects of drought stress on root growth of I. polycarpa seedlings. Different lowercase letters indicate significant differences between each treatment (p < 0.05).
Table 3.
Effects of drought stress on root growth of I. polycarpa seedlings. Different lowercase letters indicate significant differences between each treatment (p < 0.05).
| Treatment |
Root Length (cm) |
Root Surf area (cm2) |
Root Volume (cm3) |
Root Tips |
| CK | 1 923.44±14.41bc | 955.24±20.94a | 39.07±2.11a | 1 119.0±48.5c |
| T1 | 2 873.54±228.60a | 946.86±26.38a | 22.53±0.85c | 1 613.7±113.8ab |
| T2 | 2 165.50±71.36b | 645.79±24.28c | 14.91±1.92d | 1 685.7±29.8ab |
| T3 | 1 764.77±123.61bc | 827.66±50.09b | 33.45±0.91ab | 1 877.7±141.1a |
| T4 | 1 664.69±81.47c | 863.47±15.04ab | 31.85±2.49b | 1 408.0±47.1bc |
Table 4.
Parameters of I. polycarpa leaf structure TU: Upper epidermal thickness; TL: Lower epidermal thickness; TP: Palisade tissue thickness; TS: Spongy tissue thickness; LT: Leaf thickness. Different lowercase letters indicate significant differences between each treatment (p < 0.05).
Table 4.
Parameters of I. polycarpa leaf structure TU: Upper epidermal thickness; TL: Lower epidermal thickness; TP: Palisade tissue thickness; TS: Spongy tissue thickness; LT: Leaf thickness. Different lowercase letters indicate significant differences between each treatment (p < 0.05).
| Treatment | TU(μm) | TL(μm) | TP(μm) | TS(μm) | LT(μm) |
| CK | 19.07±0.90b | 7.83±0.38b | 60.07±1.34a | 76.70±2.16a | 154.40±3.99a |
| T1 | 11.53±0.99a | 6.40±0.56b | 56.23±2.09abc | 72.87±1.73ab | 145.97±0.75b |
| T2 | 12.40±0.72a | 8.33±1.28ab | 51.60±2.22bc | 66.90±0.69b | 138.00±2.79bc |
| T3 | 19.50±1.02b | 11.47±1.33a | 57.10±0.51ab | 77.13±3.59a | 158.37±1.03a |
| T4 | 19.53±1.55b | 7.27±0.73b | 51.33±1.44c | 67.67±2.72b | 137.40±2.08c |
Disclaimer/Publisher’s Note: The statements, opinions and data contained in all publications are solely those of the individual author(s) and contributor(s) and not of MDPI and/or the editor(s). MDPI and/or the editor(s) disclaim responsibility for any injury to people or property resulting from any ideas, methods, instructions or products referred to in the content. |
© 2025 by the authors. Licensee MDPI, Basel, Switzerland. This article is an open access article distributed under the terms and conditions of the Creative Commons Attribution (CC BY) license (http://creativecommons.org/licenses/by/4.0/).
Copyright: This open access article is published under a Creative Commons CC BY 4.0 license, which permit the free download, distribution, and reuse, provided that the author and preprint are cited in any reuse.


