1. Introduction
Climate change is increasingly acknowledged as one of the most significant challenges facing global agriculture and food security in the 21st century. Rising temperatures and altered precipitation patterns have profound implications for crop productivity worldwide.
The availability of water is a key factor determining the structure of ecosystems, the functioning of economies, and the well-being of human populations. In particular, drought can severely disrupt agriculture, energy production, industry, and household water supply, highlighting the central importance of water for the sustainability and progress of societies [
1]. Among these, drought stands out as a critical stress factor, threatening not only agricultural yields but also the sustainability of food systems and rural societies [
2].
Wheat (
Triticum aestivum L.) is a staple crop for much of the world’s population, valued for its high nutritional content. It is the world’s leading cereal crop, recognized for its nutritional value, extensive cultivation, and global consumption [
3,
4]. Several developmental stages in wheat are particularly vulnerable to water deficit, including germination, crop establishment, anthesis, and grain filling, each contributing distinctly to final yield [
5]. According to data on the website
https://www.statista.com/, in the 2024/25 marketing year, global wheat production reached nearly 793 million metric tons, an increase of approximately two million tons compared to the previous year. Wheat is particularly vulnerable to water scarcity during key developmental stages [
6]. Drought stress significantly influences both morphological and phenological traits of the plants [
7]. Among these, crop establishment is especially critical, as it determines early canopy development, root system architecture, and the potential for productive tillering. Drought stress during this phase can hinder leaf expansion, reduce biomass accumulation, and disrupt physiological processes essential for uniform crop establishment and subsequent yield formation. Specifically, water-deficit conditions during early vegetative growth impair key biochemical and physiological functions, leading to reductions in relative water content, osmotic and leaf water potential, leaf turgor, and chlorophyll level, while increasing diffusive resistance. These changes collectively suppress leaf transpiration, destabilize photosynthetic machinery, and inhibit the activity of enzymes vital for carbon assimilation and energy metabolism [
8,
9,
10]. Additionally, in drought conditions, plants have a more difficult time absorbing nutrients [
11]. Drought impairs photosynthetic machinery and disrupts the activity of key enzymes, such as Rubisco, leading to lower grain yields [
12].
The development and identification of drought-tolerant wheat varieties are, therefore, crucial strategies for mitigating the adverse impacts of climate change on crop production. A deeper physiological and biometric understanding of how different wheat genotypes respond to drought during crop establishment provides valuable insight into early-stage resilience mechanisms and supports breeding strategies aimed at improving adaptation to water-limited environments. To assess drought stress intensity, classical physiological indicators such as leaf water potential and water content (WC) are commonly used, with WC considered one of the most reliable metrics of plant water status [
13,
14]. In parallel, leaf chlorophyll content (LCC) is often measured as a baseline indicator of pigment concentration. Chlorophyll levels are influenced by nitrogen availability and are highly sensitive to environmental stresses such as drought, salinity, disease, and pest pressure [
15]. As the primary pigments responsible for capturing light energy and converting it into carbohydrates, chlorophylls are essential for maintaining crop productivity under adverse conditions [
16].
Beyond pigment quantification, chlorophyll
a (Chl
a) fluorescence provides a powerful, non-invasive tool for studying the functional state of the photosynthetic apparatus. This fluorescence, emitted in the red-to-far-red region (400–700 nm), reflects the fate of absorbed light energy [
17]. Although Chl a fluorescence accounts for only a small fraction of absorbed energy (0.5–10%), its intensity is inversely related to photochemical efficiency due to redox dynamics within the photosystems [
18].
Over recent decades, Chl a fluorescence has been employed as a rapid, information-rich method for assessing photosynthetic function across plants, bacteria, and algae that contain chlorophyll [
19]. Fluorescence kinetics are typically captured using either continuous or modulated excitation systems [
20]. Under continuous excitation, the resulting induction curves, first described by Kautsky and Hirsch [
21], are known as OJIP transients or Kautsky curves, and are recorded during prompt fluorescence (PF). These transients reflect sequential electron transport events in Photosystem II (PSII) and are interpreted using the energy flux theory developed by Reto Strasser [
22,
23], which enables the calculation of multiple parameters describing photochemical efficiency, energy dissipation, and reaction center dynamics. Another valuable approach is thermoluminescence (TL), which involves cooling pre-illuminated samples and gradually reheating them to detect recombination of trapped charge pairs as distinct emission bands [
24]. TL analysis provides further insight into the integrity and dynamics of the photosynthetic electron transport chain under stress conditions.
In our study, to provide a detailed analysis of the photosynthetic apparatus, we performed, in addition to the JIP test, statistical and multivariate analyses of the induction curves. By analyzing the curves—not only specific points, as in the JIP test—we obtain detailed information about the state of the photosynthetic apparatus, as well as the phases of the curves in which changes occur due to the applied stress. This is a new approach for studying prompt fluorescence induction curves, which would be suitable for relatively rapid analysis of the photosynthetic apparatus, without the need to calculate JIP parameters and their interpretation.
Taken together, these complementary measurements spanning physiological indicators, pigment content, and biophysical diagnostics offer a comprehensive framework for evaluating the impact of drought on photosynthetic function and overall plant health. Comparing drought-tolerant and drought-sensitive wheat genotypes provides a more detailed understanding of how water stress alters photosynthetic efficiency, water status, and growth-related traits. In the present study, we applied this integrated approach to investigate drought-induced changes in wheat during early vegetative development, with the aim of elucidating additional key mechanisms of drought tolerance, thus providing insights that may contribute to the development of more resilient cereal crops in response to a changing climate.
3. Discussion
Drought stress is one of the premier limitations to global agricultural production due to the complexity of the water-limiting environment and changing climate [
26]. Drought can affect wheat plants at any point in their life cycle, but the seedling stage appears to be highly vulnerable to water deficit.
Drought stress causes significant impacts on the morphology, biochemistry, and physiology of wheat. Drought also causes to a loss of turgor pressure and a reduction in plant height [
27]. On the other hand, when wheat height decreases under drought stress conditions, it leads to reduced spike length [
28]. Lack of water triggers serious disruptions in metabolic activity in wheat [
29]. Low water potential reduces stomatal conductance, resulting in diminished CO
2 uptake and lowered photosynthetic rate [
30]. These conditions increase the demand in ATP and might favor the alternative electron pathways. Moreover, the decline in photosynthetic activity restricts carbon assimilation and reduces sugar accumulation [
31]. Identifying physiological and biophysical markers associated with drought tolerance at the seedling stage is crucial for developing drought-resistant varieties with high yield.
In this study, we investigated two Bulgarian wheat varieties, Katya and Zora, which were exposed to drought, and after seven days of dehydration, they were rehydrated. Previous studies have found that Katya is drought-tolerant, while Zora is a sensitive variety [
32,
33].
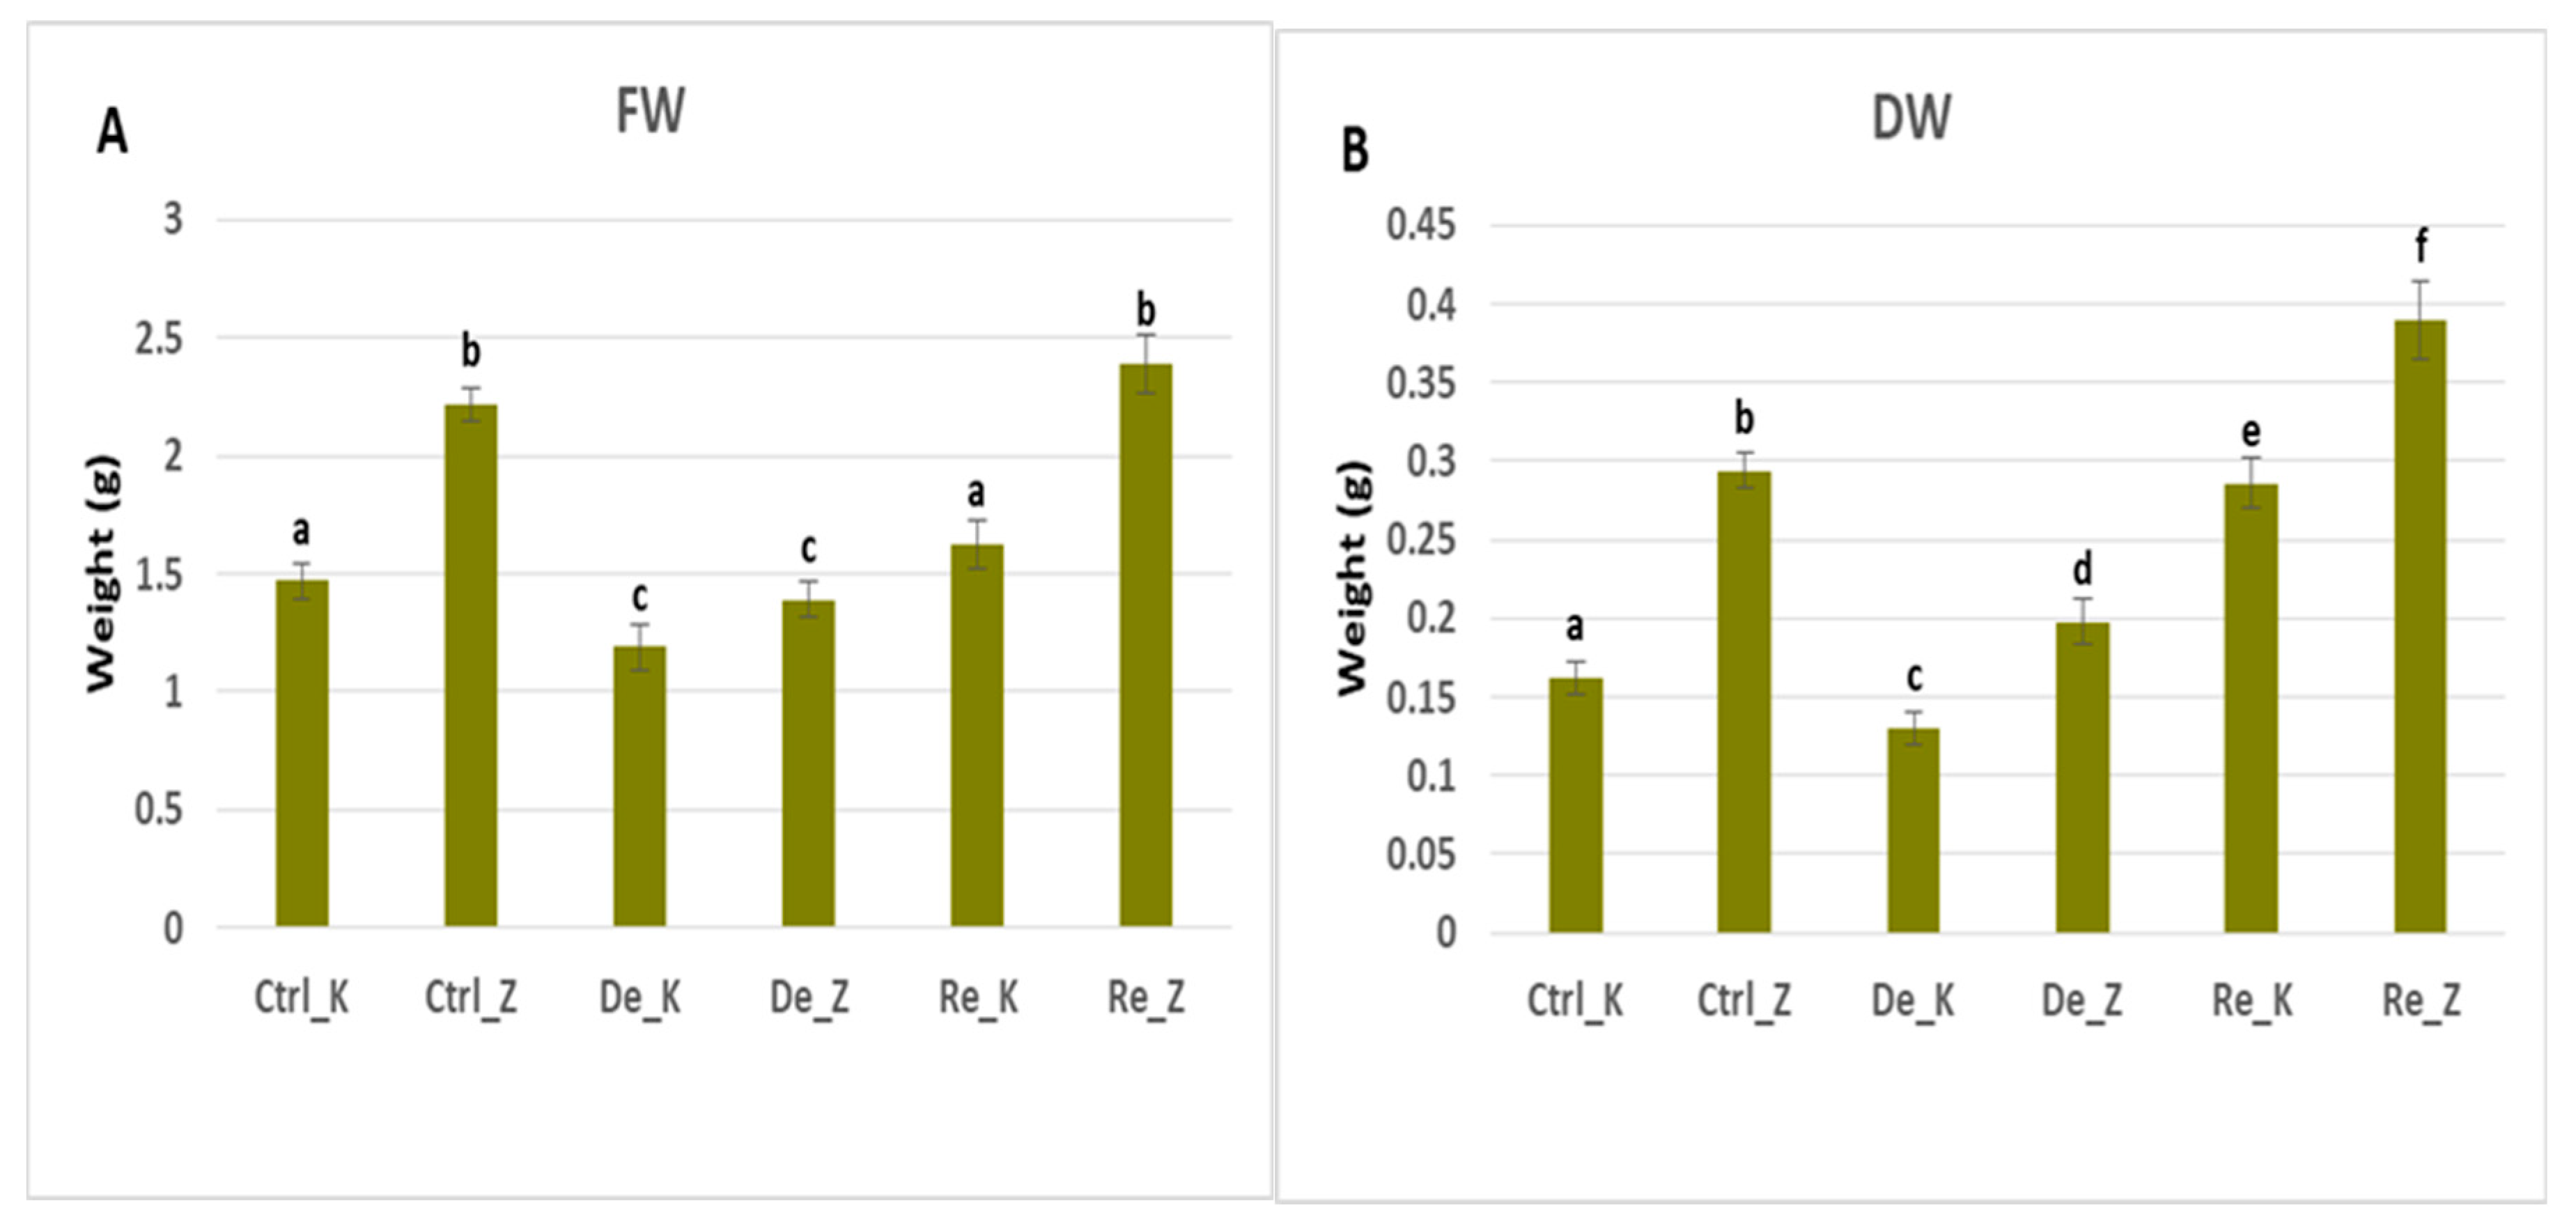
Our results showed that Zora loses approximately 40% of its fresh weight and 30% of its dry weight during the drought period, while Katya loses only 20%. These differences in dry and fresh weight loss between the two varieties suggest that Katya can retain more water than Zora, which is probably due to better stomatal control leading to an increase in water use efficiency and proline synthesis [
34]. Both varieties fully recovered their fresh weight after rehydration, and the dry weight of the rehydrated plants was greater than that of the controls, which means the plants restored their growth rate after resumption of watering. The fresh weight of the rehydrated plants was 10% higher than that of the controls for the Katya and 7% higher for Zora. The dry weight of the rehidrated plants from Katya variety was 75% higher than the dry weight of the controls, while that of Zora increased only 32% after restoring the water supply. These results show that Katya is much more drought-resistant than Zora, as it has much better rehydration compensatory mechanisms which can be associated with the synthesis of phytohormones such as indoleacetic acid (IAA), abscisic acid (ABA), jasmonic acid (JA), gibberellins (GA), and silicic acid (SA) during the stage of drought [
35].
These results are consistent with the water content measurements obtained in both varieties across control, dehydrated, and rehydrated plants. Both wheat varieties had approximately the same water content, losing about 45% of it during the drought. However, Katya was able to recover up to 60% of its water content during the rehydration period, while Zora was not able to.
The specific leaf area decreased slowly only in Katya variety. Still, the differences in this indicator are not significant between the control and dried plants. Statistical differences were observed only between rehydrated plants on the one hand and controls and dehydrated plants on the other. This means that the dry matter in the leaves of the rehydrated plants is more than that in the leaves of the controls and the dried ones, which corresponds to previous results. In Zora varietie, no significant changes between control, dehydrated and rehydrated plants in the SLA were observed. Conversely, Katya reduced SLA during dehydration as a strategy of investment in structural support.
In Zora wheat, chlorophyll content decreases during drought and continues to decline even during the rehydration period. During the drought period, the chlorophyll content decreases by 10% compared to plants not subjected to this stress, which aligns with results from previous studies [
36,
37]. During rehydration, Zora did not restore its chlorophyll content, but, on the contrary, lost another 10% compared to control plants. This ongoing degradation of chlorophyll in Zora variety may be due to oxidative damage or upregulation of the enzyme chlorophyllase during drought [
38,
39].
On the other hand, Katya showed an 18% increase in chlorophyll content during drought compared to control plants. This level also maintained during the rehydration period. That kind of behavior is typicall for drought-tolerant species, which use light very efficiently during drought [
40].
The decrease in SLA and the increase in chlorophyll indicate that wheat of the Katya variety retains its chlorophyll content during the drought, which allows for faster recovery upon rehydration [
41].
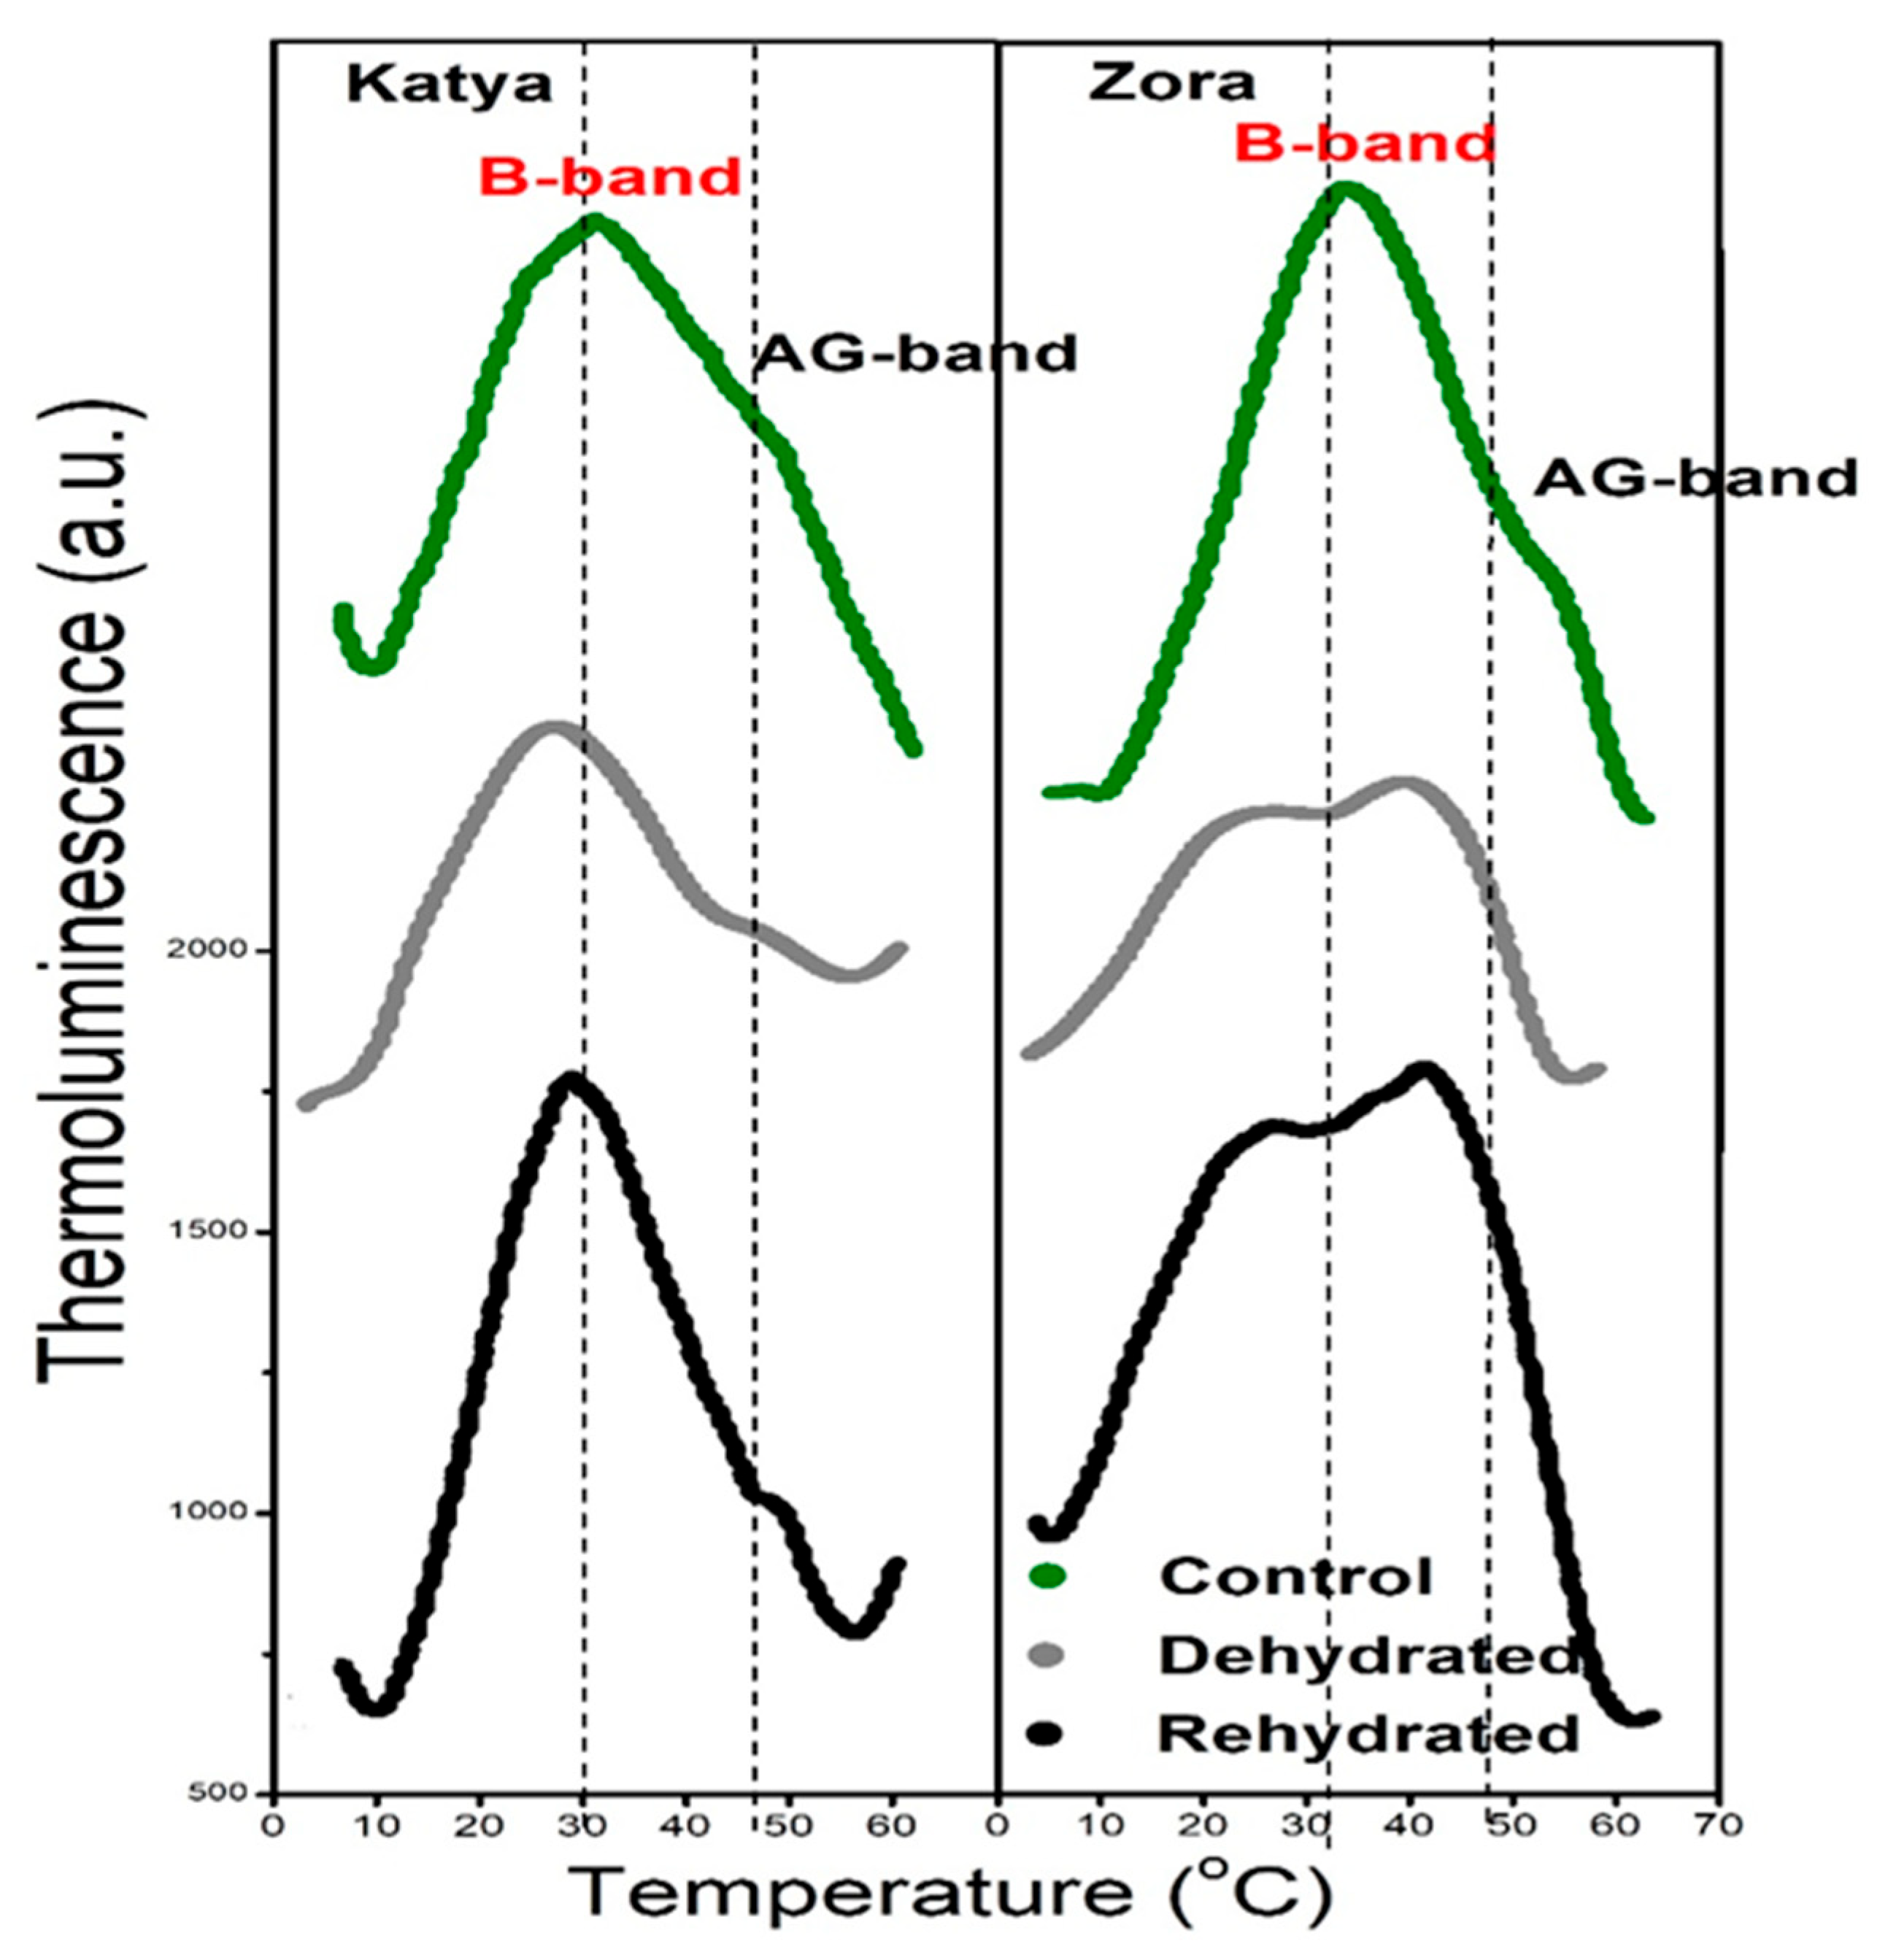
In dark adapted leaves, TL bands in result of flash excitation are associated with the recombination of charge pairs within the photosynthetic apparatus, particularly in PSII, which is the B band (S
2/3Q
B-), but also afterglow (AG) band (S
2/3Q
B +e) may appear, which is connected to electron transfer capacity and activation of cyclic electron flow around PSI, or a strong NADPH + ATP assimilatory potential [
42].
In the Katya variety, a decrease in the B and AG bands intensities, without a downshift in Tmax were observed during drought. That means there is a decline in the number of recombining pairs, but there are no disturbances in the functionality of photosynthetic reactions. During rehydration, they both bands recovered and assumed values close to those of the control plants.
Unlike in Katya, dehydration produced significant downshifts in TmaxB and TmaxAG in Zora variety of wheat and the intensity of AG increased. The downshift of the B band is due to a decrease in lumen pH and leads to disturbances in the charge recombination, which is not restored in the rehydrated plants [
43,
44]. AG increased and represents the more intensive band in the curve of rehydrated leaves, simultaneously TmaxAG remains downshifted, indicating that cyclic pathways are stimulated after rehydration.
In the initial drought period, only six JIP parameters changed statistically in Katya compared to control plants. Chlorophyll fluorescence reached its maximum Fm upon complete reduction of Q
A molecules. In dehydrated plants, Fm decreased by approximately 10% compared to non-stressed plants, due to disruption of the ETC, leading to fewer reduced Q
A molecules, and an increase in non-photochemical quenching. The parameter Fv/F0 decreased by 3% compared to non-dehydrated plants. This parameter provides information about the maximum efficiency of the water diffusion reaction on the donor side of PS II, and its slight decrease in the initial stage of drought indicates that minor disturbances occur in the electron transport chain of the photosynthetic apparatus. The parameter Vi reflects the ability of PS I acceptors to oxidize the plastoquinone pool. Its value increased by 3% under drought conditions. Although the lower Vi could in principle reflect accelerated oxidation of the PQ pool by PSI, the simultaneous increase in Vi with unchanged F0 and reduced Fm - together with the weakened AG-band - indicated disturbances in PS II operation and enhanced non-photochemical quenching. The parameter ABS/RC gives information about absorbed light energy per active PSII reaction center, TR0/RC refers to energy trapped at t₀ per RC, and ET0/RC shows the level of electron transport beyond Qᴀ⁻ per RC. In the initial stage of drought, the parameters ABS/RC, TR0/RC, and ET0/RC decreased slightly compared to that calculated for the control plants, with ABS/RC and ET0/RC decreasing by 5% and TR0/RC by 10%. These results align with those of Ghaffar [
45], who compared drought-tolerant and drought-intolerant wheat varieties. The decline in these parameters is considered to be a mechanism by which drought-tolerant plants adapt to drought conditions by limiting electron transport and reducing the photochemical activity of photosystem II [
46].
After seven days of dehydration, the parameters F0, Fm, Vj, Vi, ψ0, ET0/RC, ϕE0, and PI(abs) in Katya statistically change their values compared to the same parameters measured in plants not subjected to drought. F0 and Vj, decrease by 10% and 11% respectively, while the parameters ψ0, ϕE0 and PI(abs) increased by 14%, 11% and 20% respectively. The JIP parameters Fm, Vi and ET0/RC did not change from the values in the initial stage of the drought. F0 is the fluorescence intensity when all reaction centers are “open” and provides information about the emission from excited chlorophyll a molecules on the antenna before the excitation reaches the reaction centers [
47]. Low F0 values under stress are associated with reduced chlorophyll content, which is not the case according to our results, or with low light absorption capacity due to disorders in the light-harvesting complexes [
48]. In the Katya variety, these lower values of the minimal fluorescence of dried plants are due to the high adaptability of photosystem II to the applied stress. Reducing the value of the parameter Vj leads to an increase in the probability that an exciton moves an electron beyond Qᴀ⁻. Also, the parameter φE0, which indicates the quantum efficiency of electron transfer in the ETC after Q
A, increased in dried plants compared to controls. The parameter that increased its value the most under drought is PI(abs), which is an indication of high efficiency of photosystem II during dehydration.
In the initial period of rehydration, the parameters that restored the values are Fm and Vi, which means that the Katya variety very quickly begins to regain its photosynthetic activity. After 7 days of rehydration, the JIP parameters assumed values that were statistically indistinguishable from those measured in the control plants, indicating that after one week of rehydration, the Katya variety fully restored its photosynthetic activity.
Unlike Katya, Zora showed poor adaptability to drought. On the fourth day under stress, only one JIP parameter, Vi, had changed its value, with an increase by 1%. On the 7th day of drought, 14 parameters had statistically changed their values compared to the values of the same parameters calculated in the control plants. The parameters that change the most are ABS/RC, TR0/RC, ET0/RC and DI0/RC, which increased their values by 21%, 20%, 27%, and 29%, respectively. The change in these parameters indicates disturbances in the entire electron transport chain.
Although PI(abs) decreased by 5% on the seventh day of dehydration, its values were 25% lower than that of unstressed plants. This drop in the values of the index indicates that, as a result of dehydration, the photosynthetic apparatus of Zora has suffered irreversible damage. A similar trend is observed for some of the other studied JIP parameters, which confirms this assumption. Only Vi and φ(p0) did not undergo profound changes during the drought and subsequent rehydration of the plants. TR0/RC and ET0/RC are the parameters that during the rehydration process, take on values close to those of the control plants.
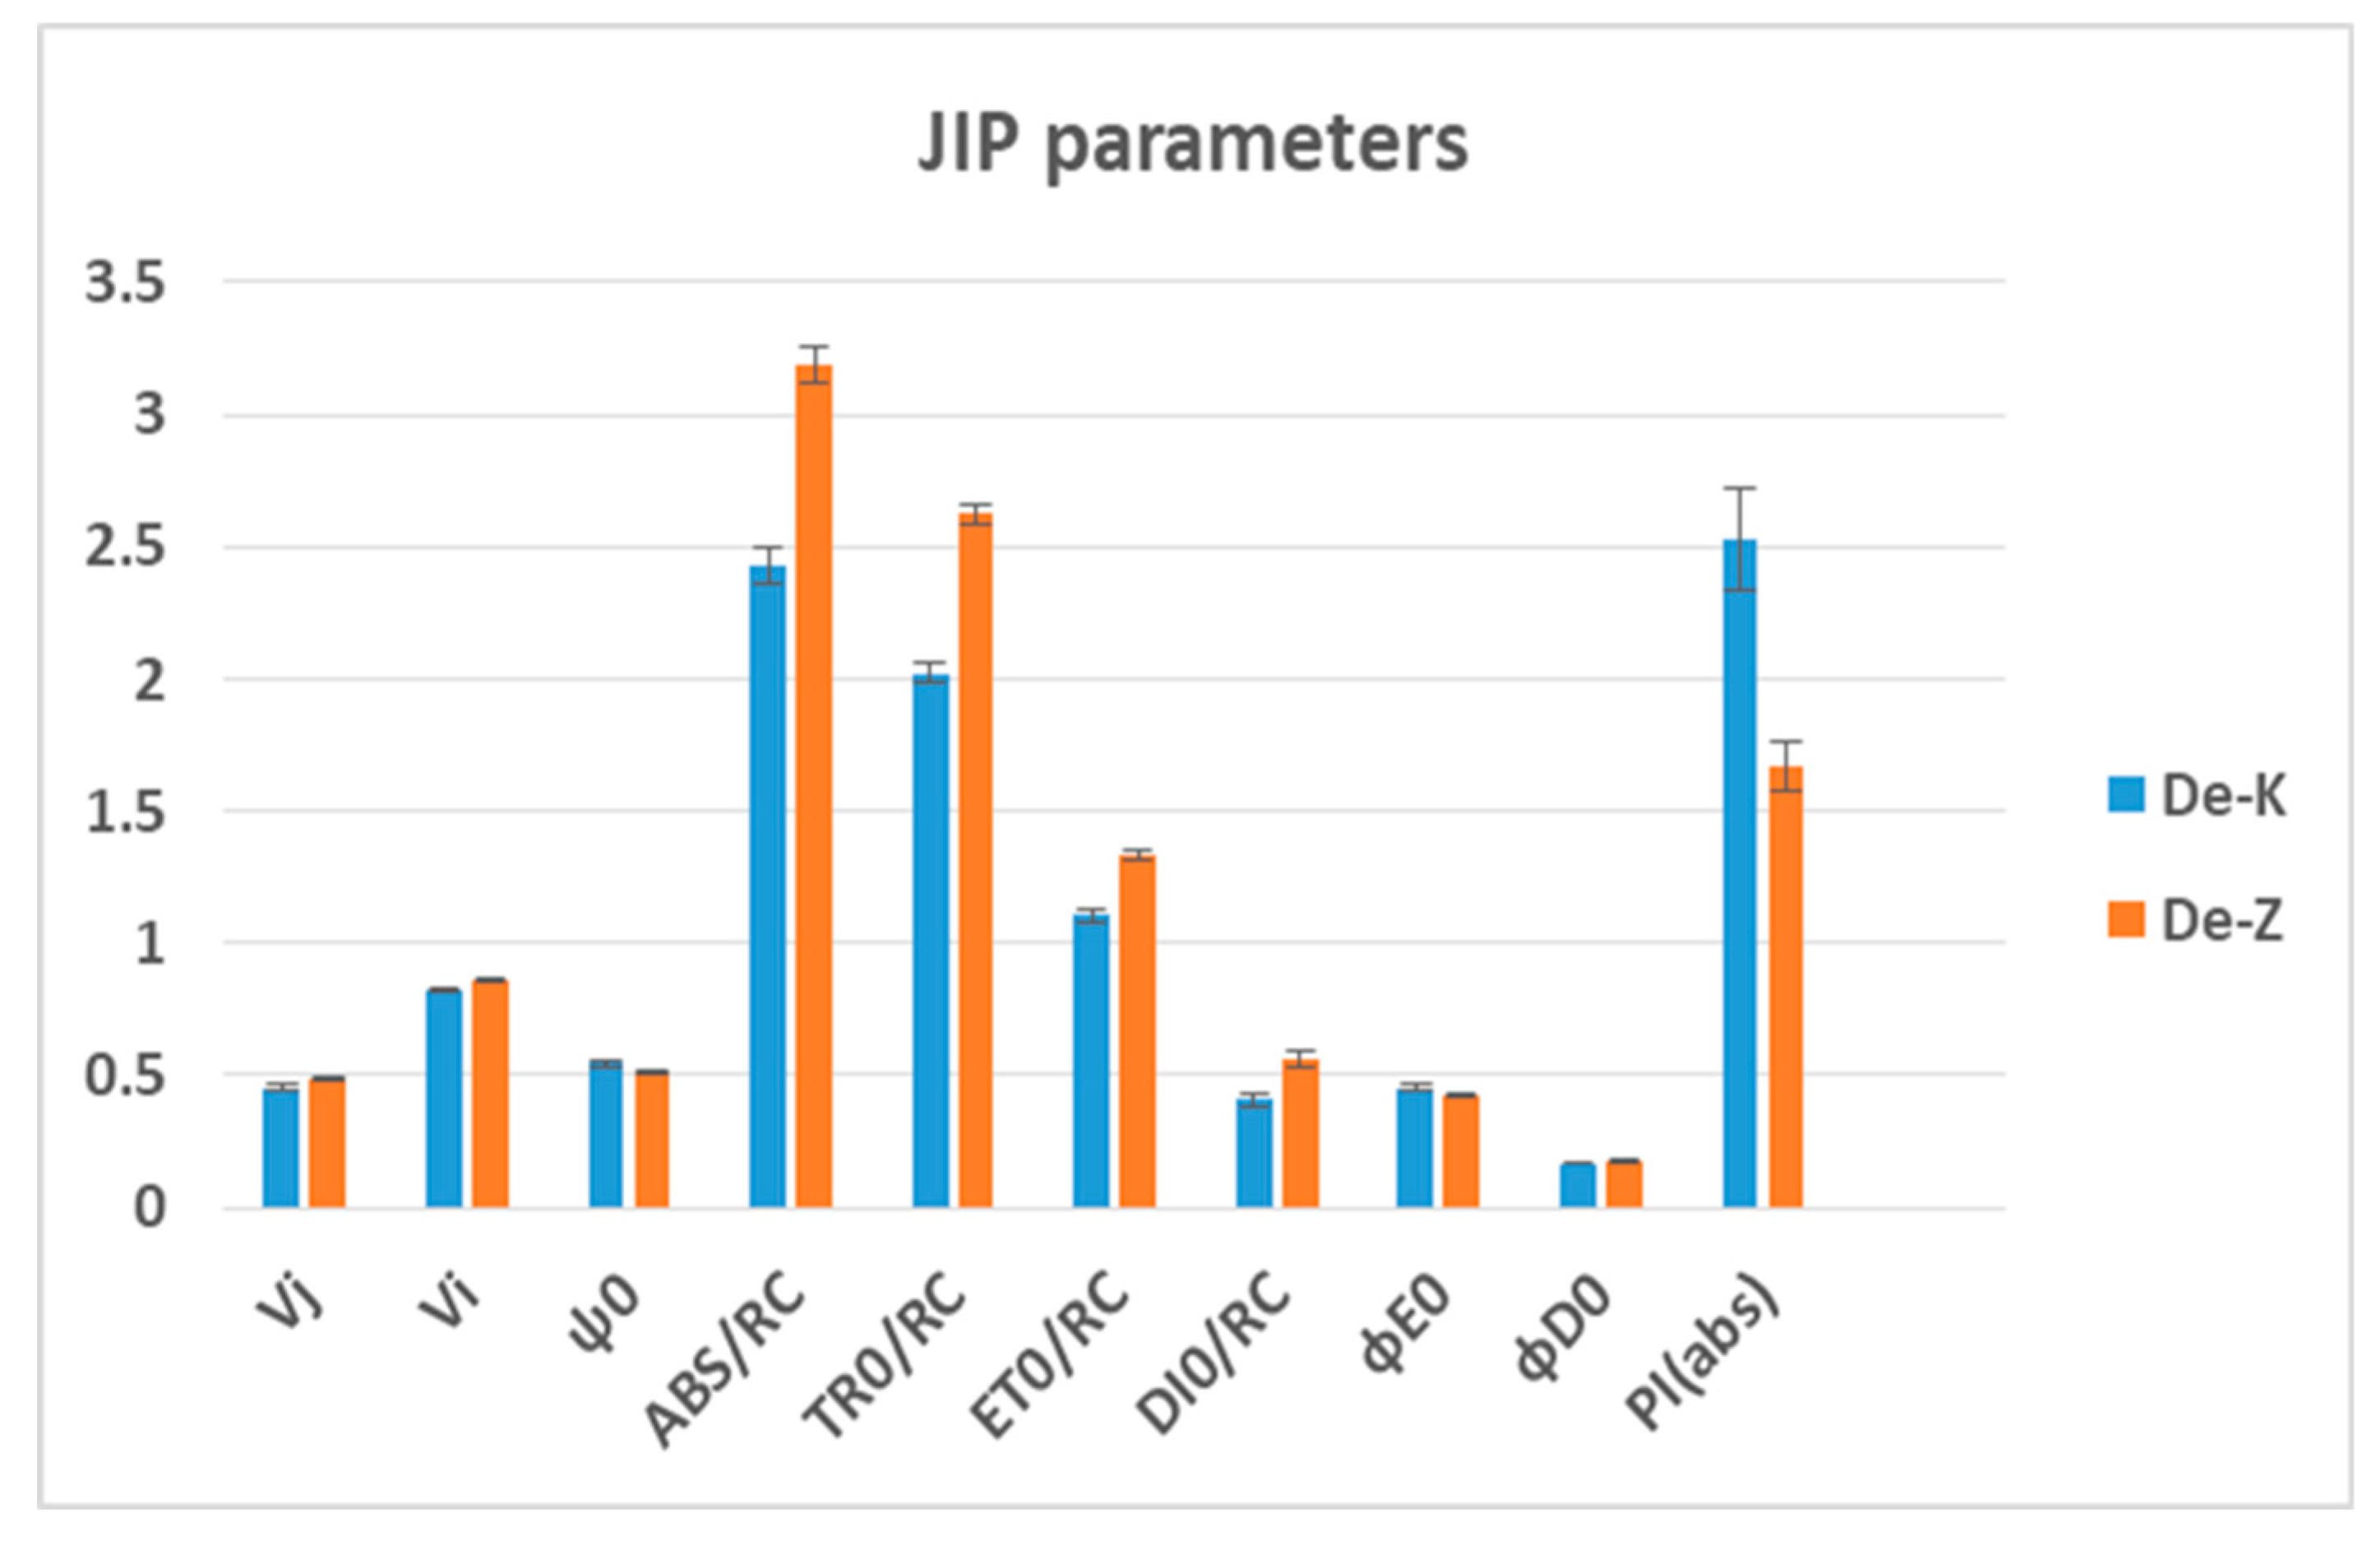
A comparison of the JIP parameters and the induction curves of chlorophyll a fluorescence between the two wheat varieties clearly demonstrates the high drought adaptability of the Katya variety. Under drought stress, Zora had higher ABS/RC, TR0/RC, ET0/RC and DI0/RC values, but significantly lower PI(abs) values, indicating less active PSII centers and reduced photochemical efficiency. In contrast, Katya maintained higher RC/ABS and a more balanced energy distribution, consistent with better drought tolerance.
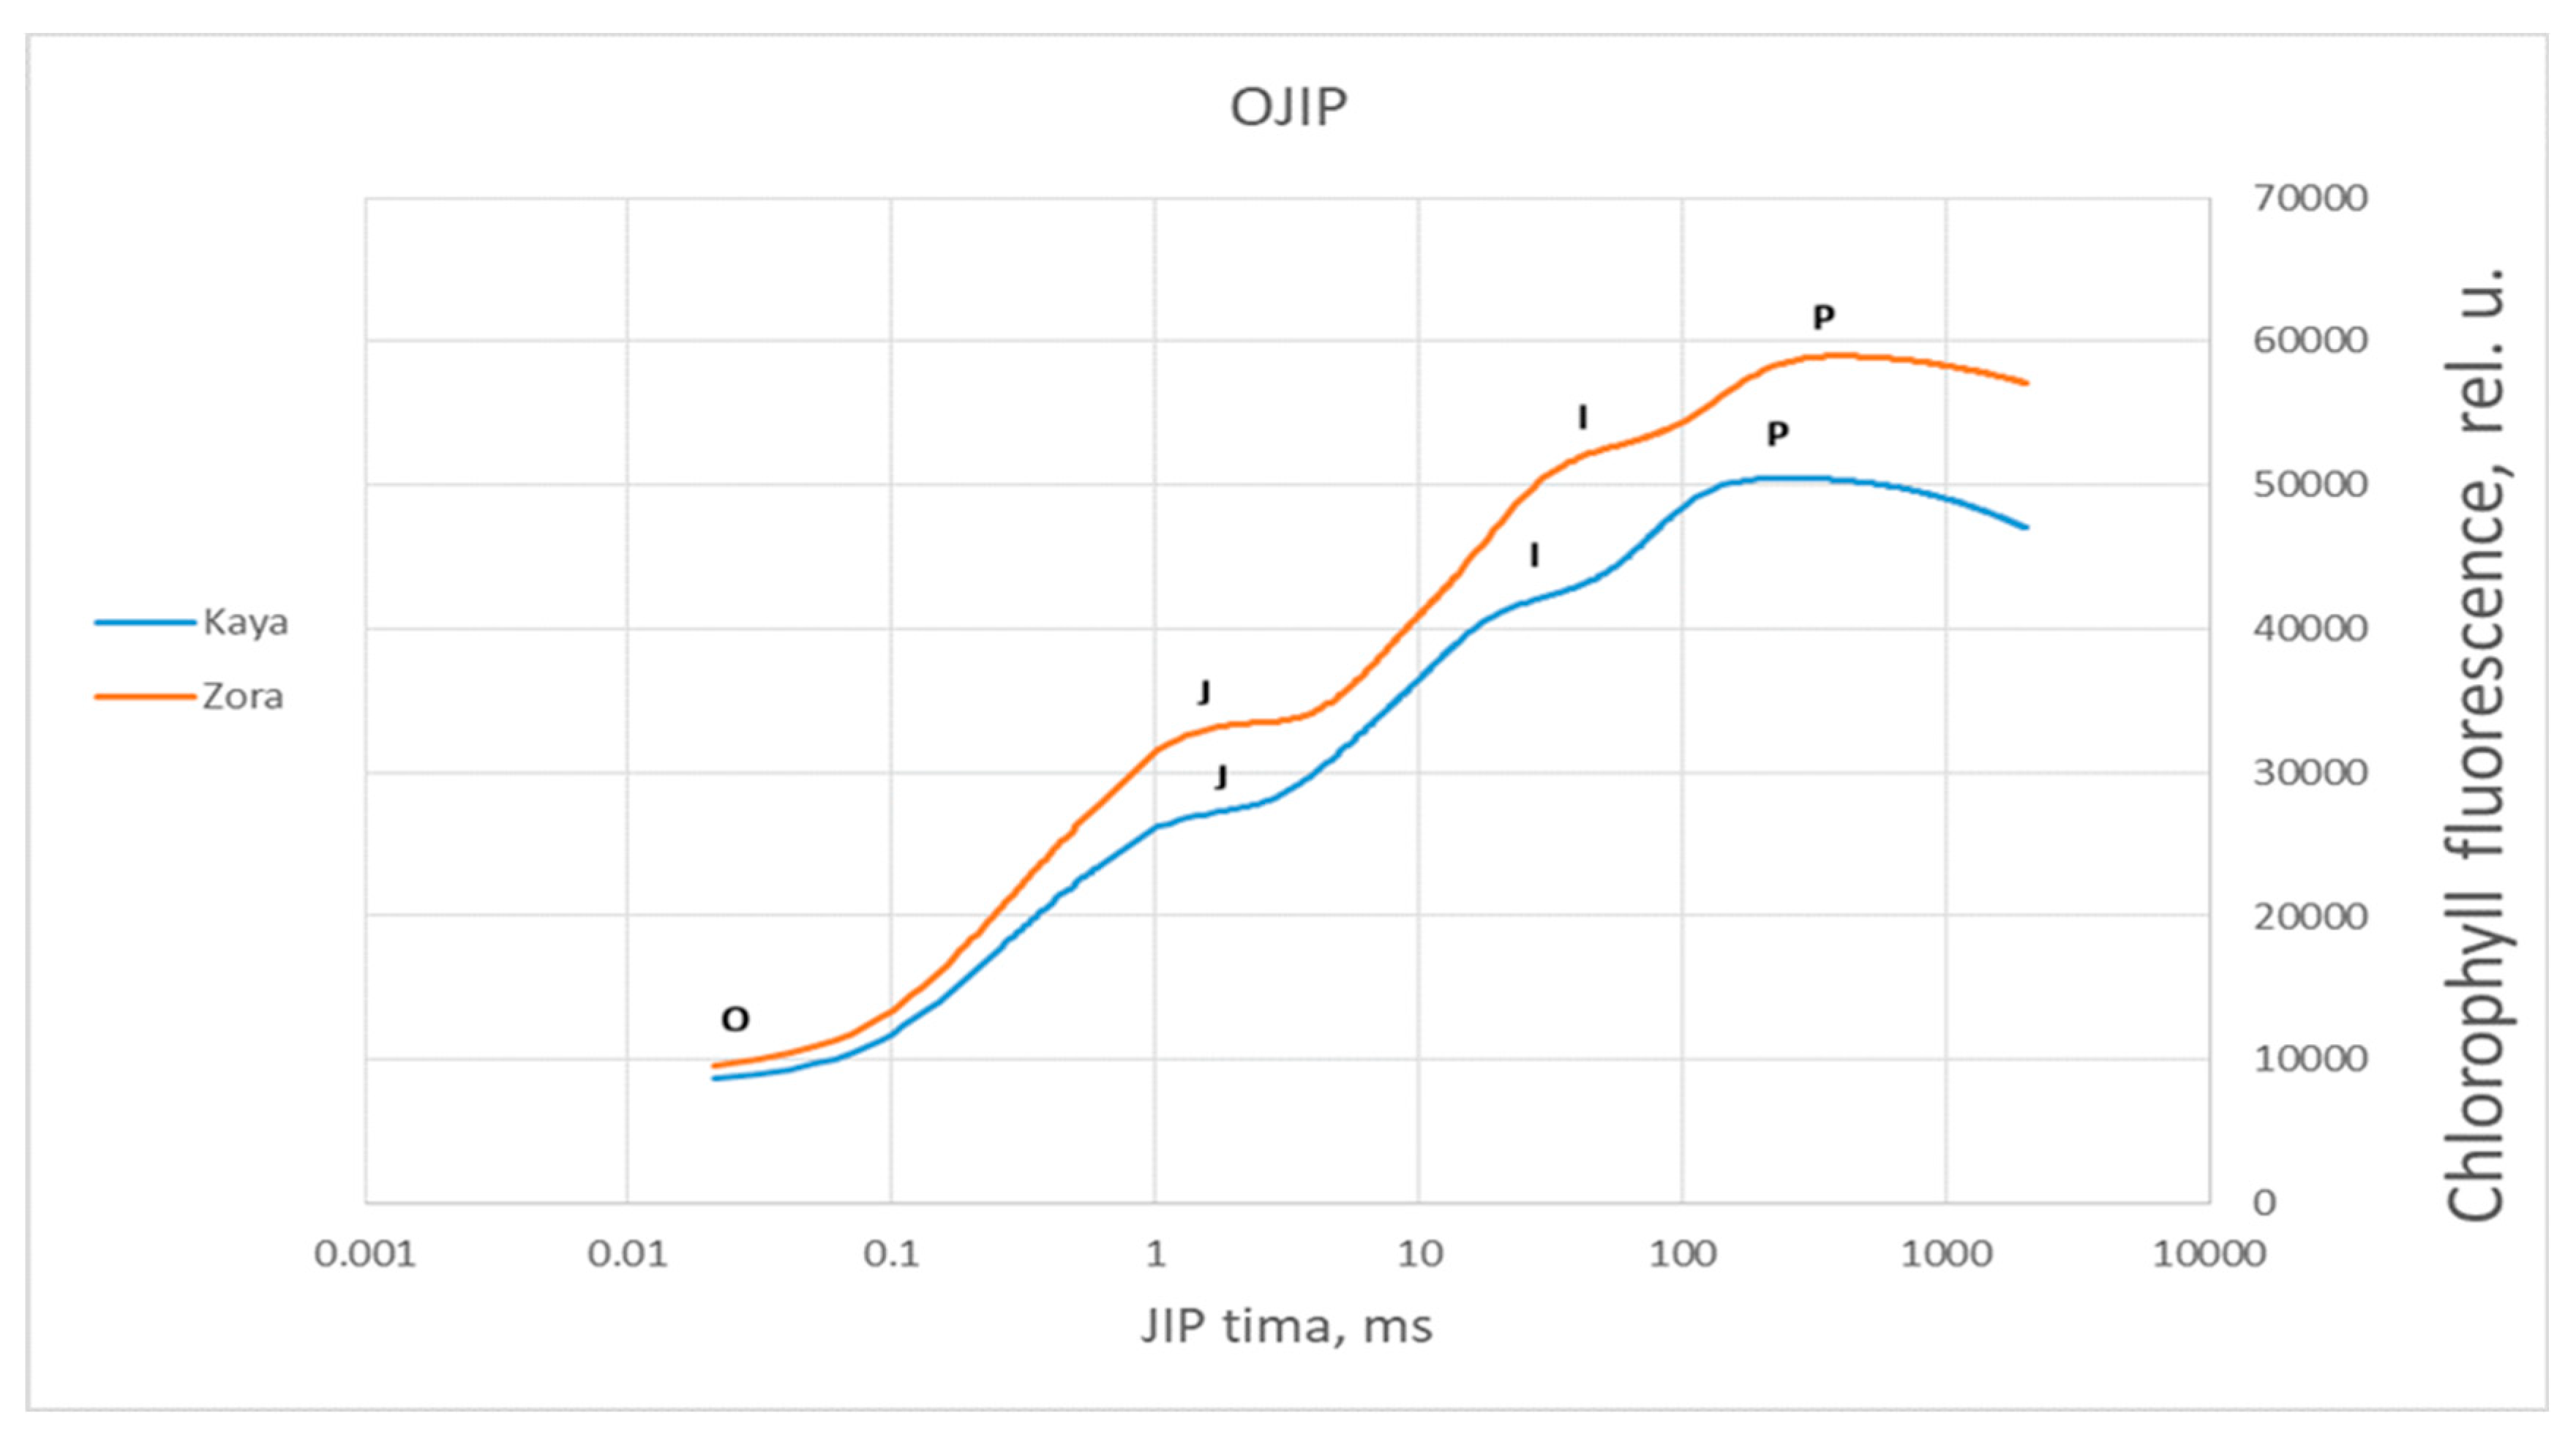
To obtain more detailed information about the differences in the photosynthetic apparatus of the two wheat varieties during drought, methods for analyzing the induction curves were employed. The induction curves between control, dried, and rehydrated plants of the two varieties were compared. The comparison of the induction curves of the control plants between Katya and Zora showed statistical differences in all phases. This means that they react differently to light when optimally watered.
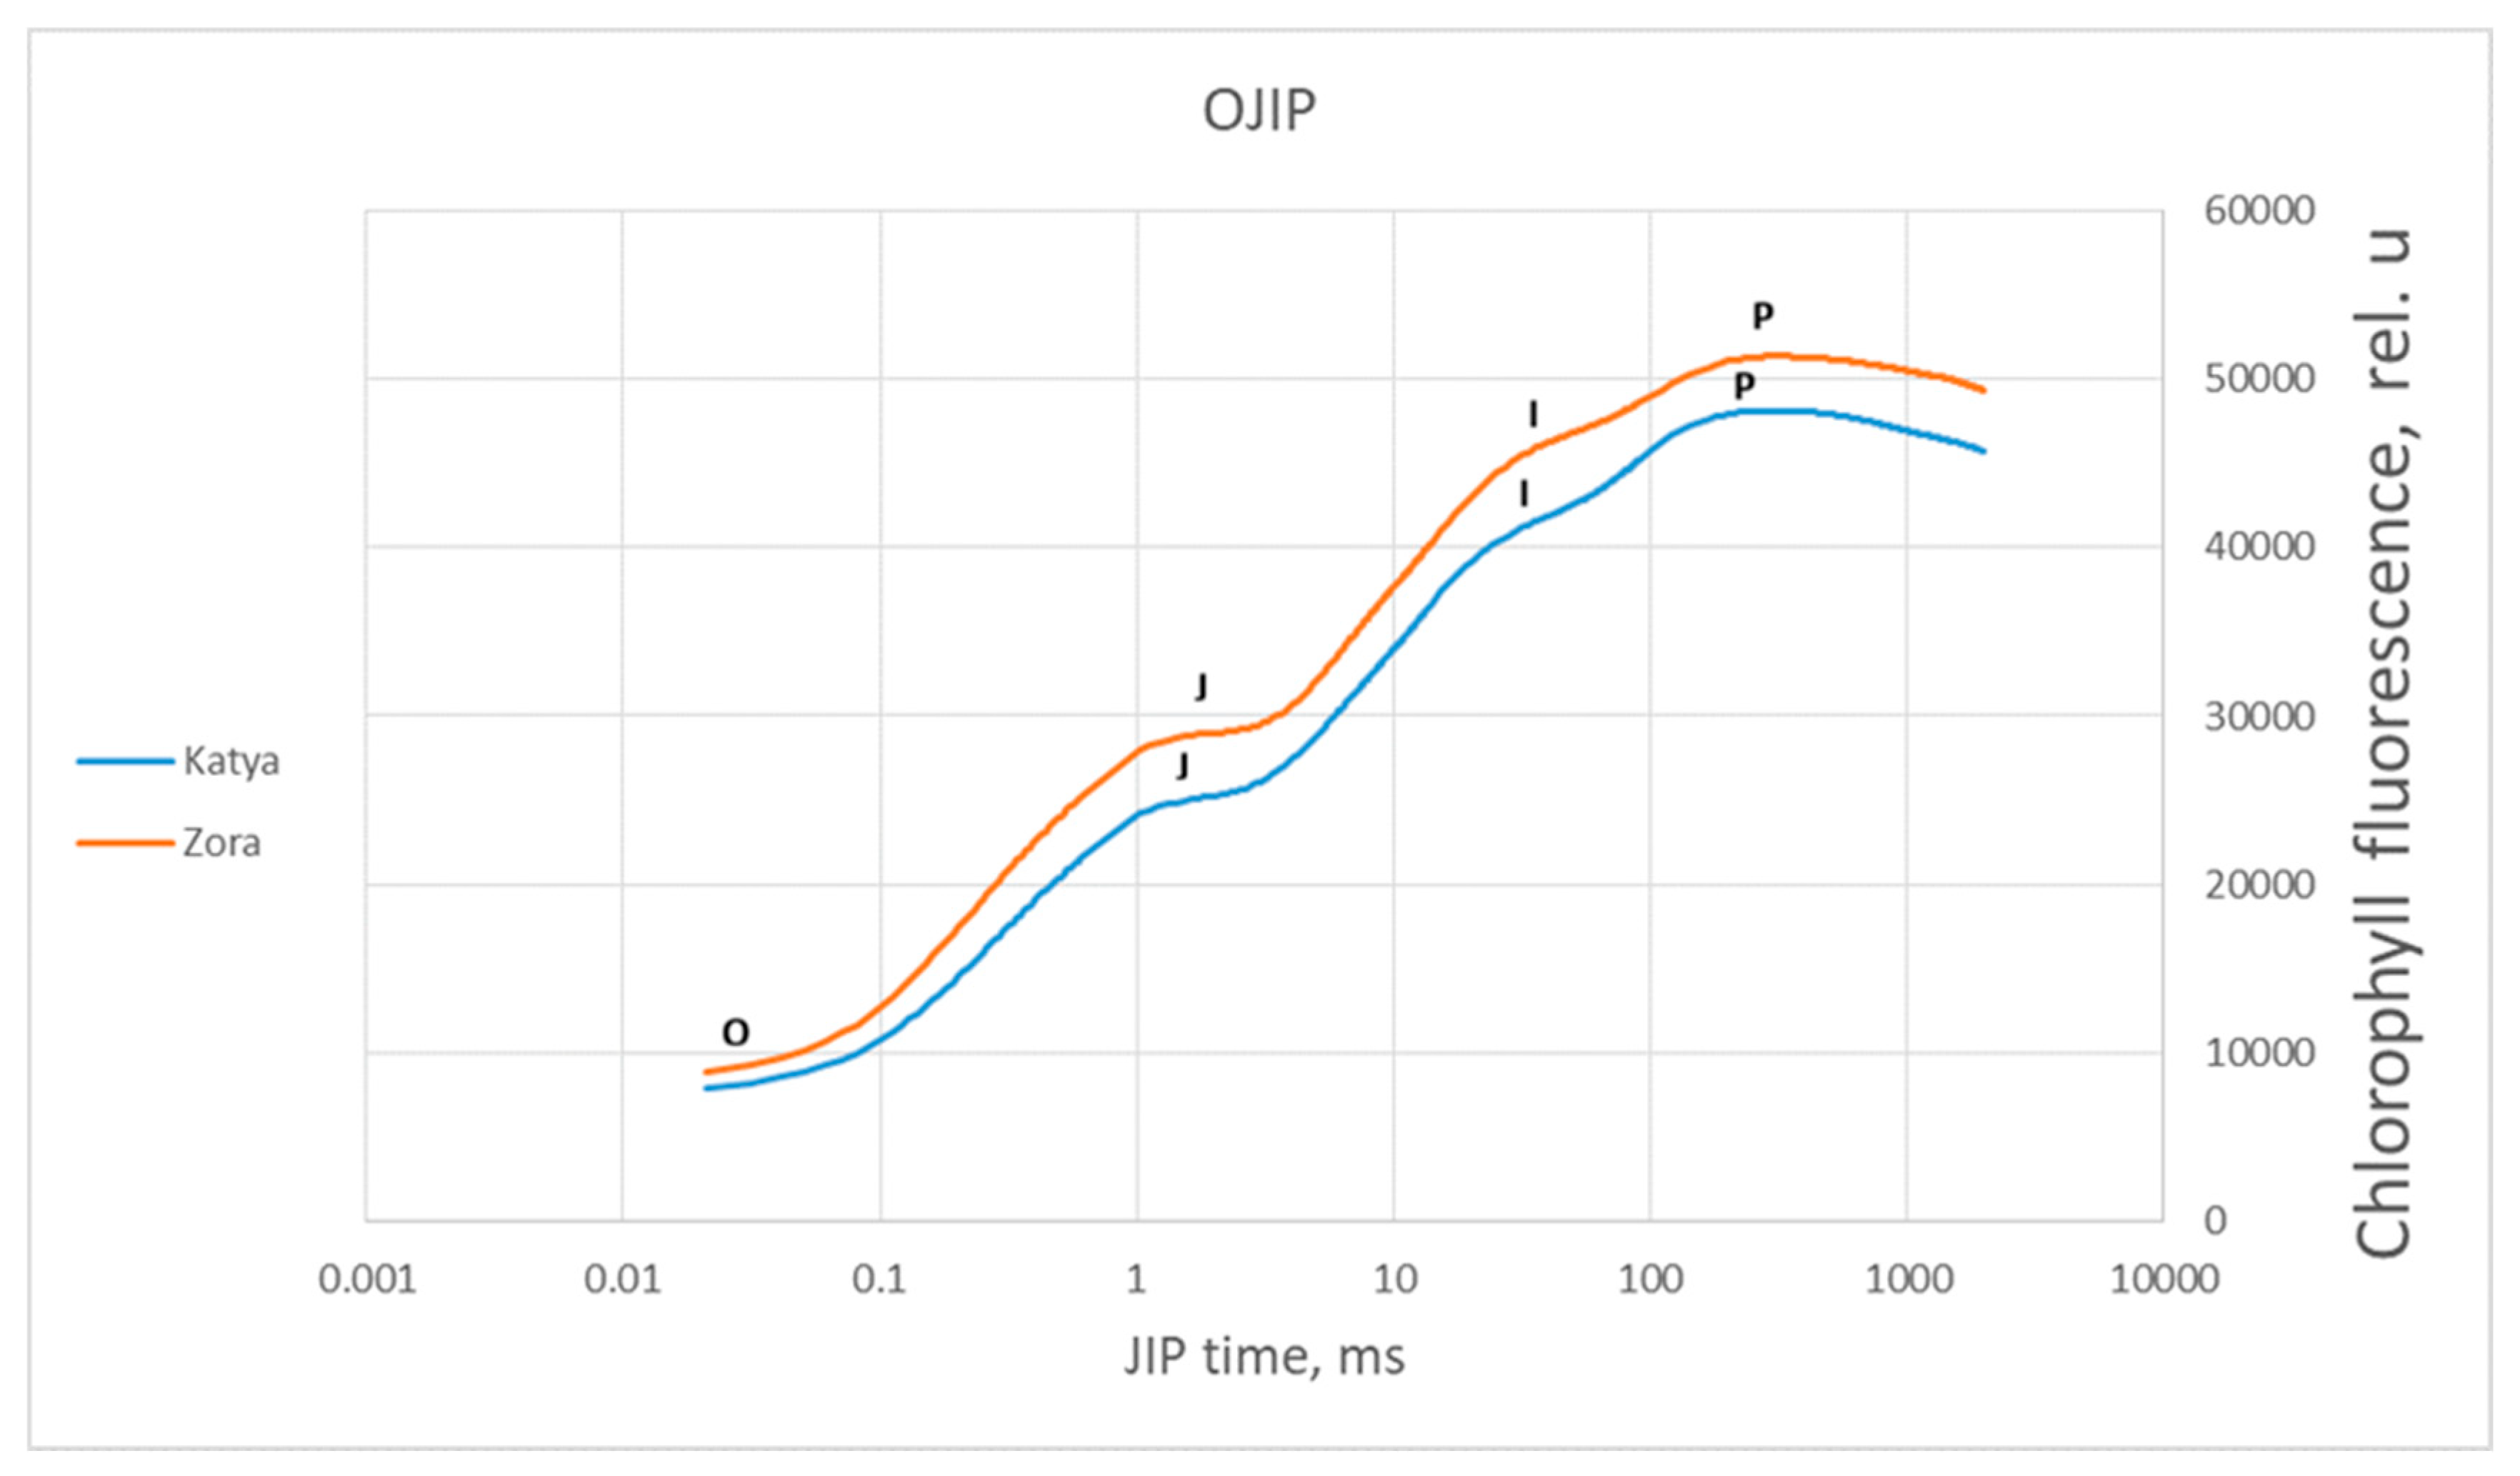
Under drought conditions, the two varieties showed statistical differences only in the OJ phase. This phase is mainly associated with the accumulation of reduced Q
A. Additionally, during the OJ phase, primary photochemistry takes place [
49]. According to the JIP test, F0 decreases in Katya. It increases in Zora, with the increase in F0 likely due to difficulties in electron transfer from Q
A to Q
B, disconnection of LHCII from the PSII RC, and loss of both functional and structural integrity of PSI II [
50].
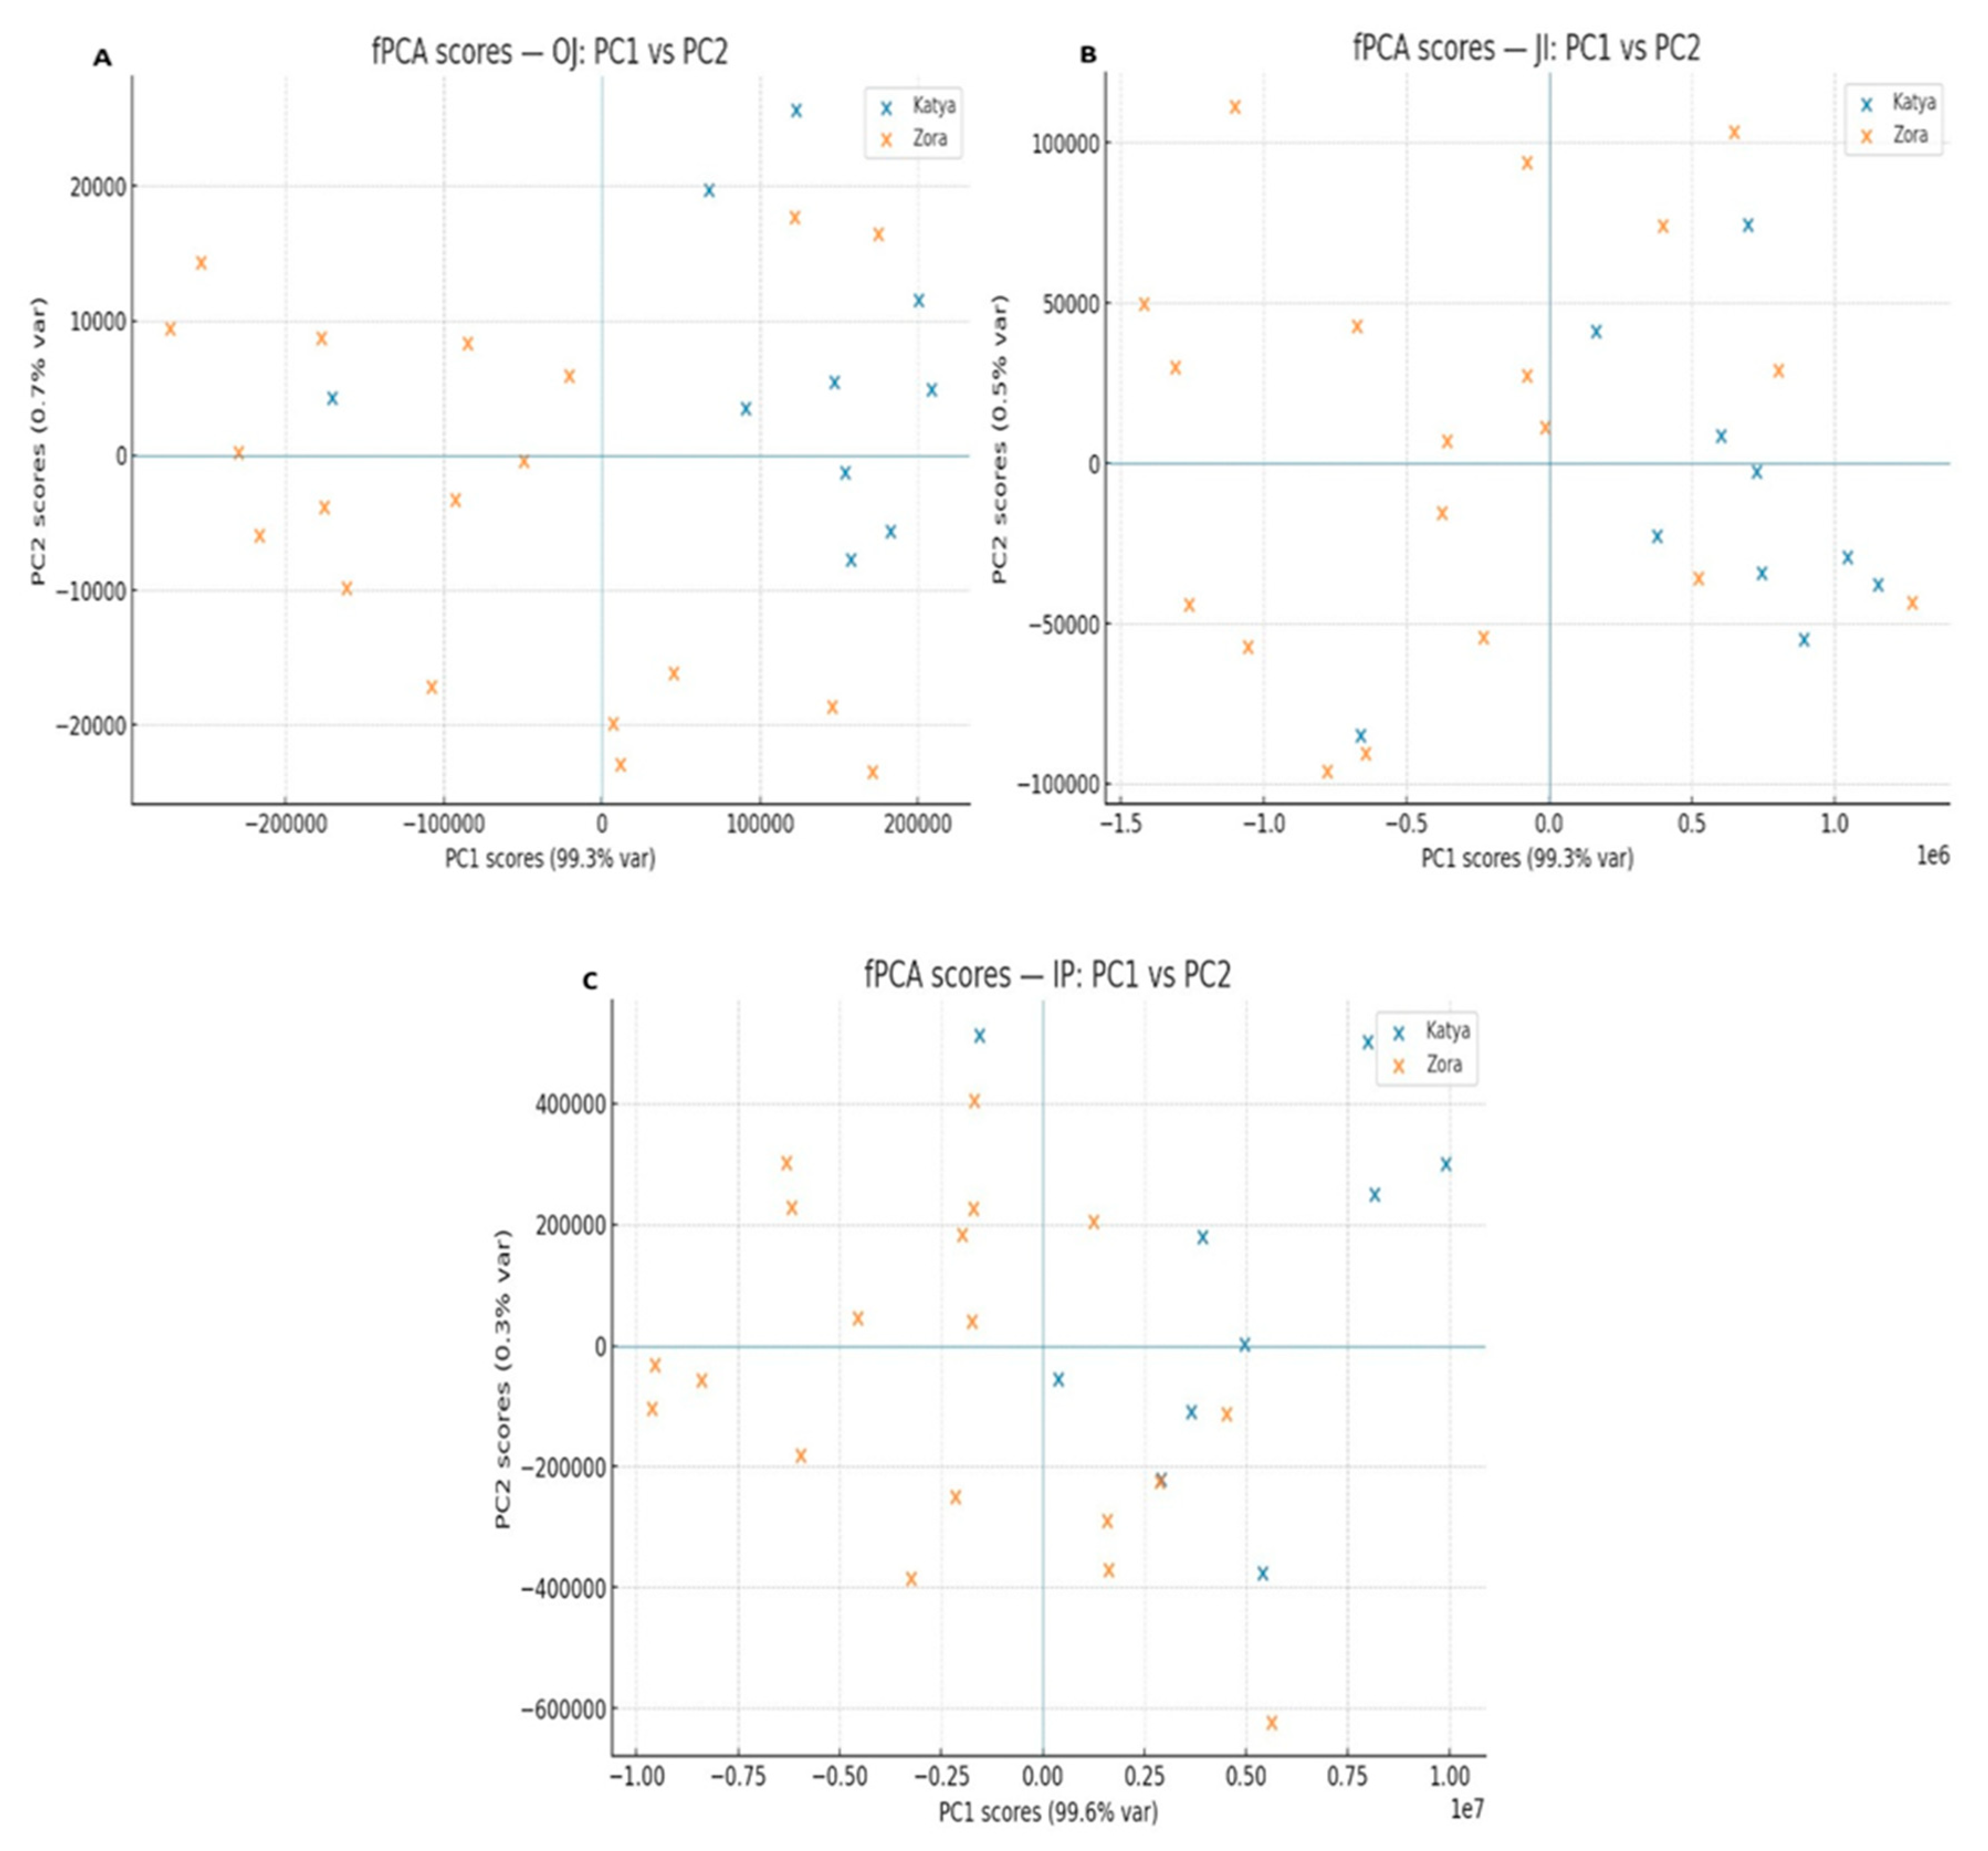
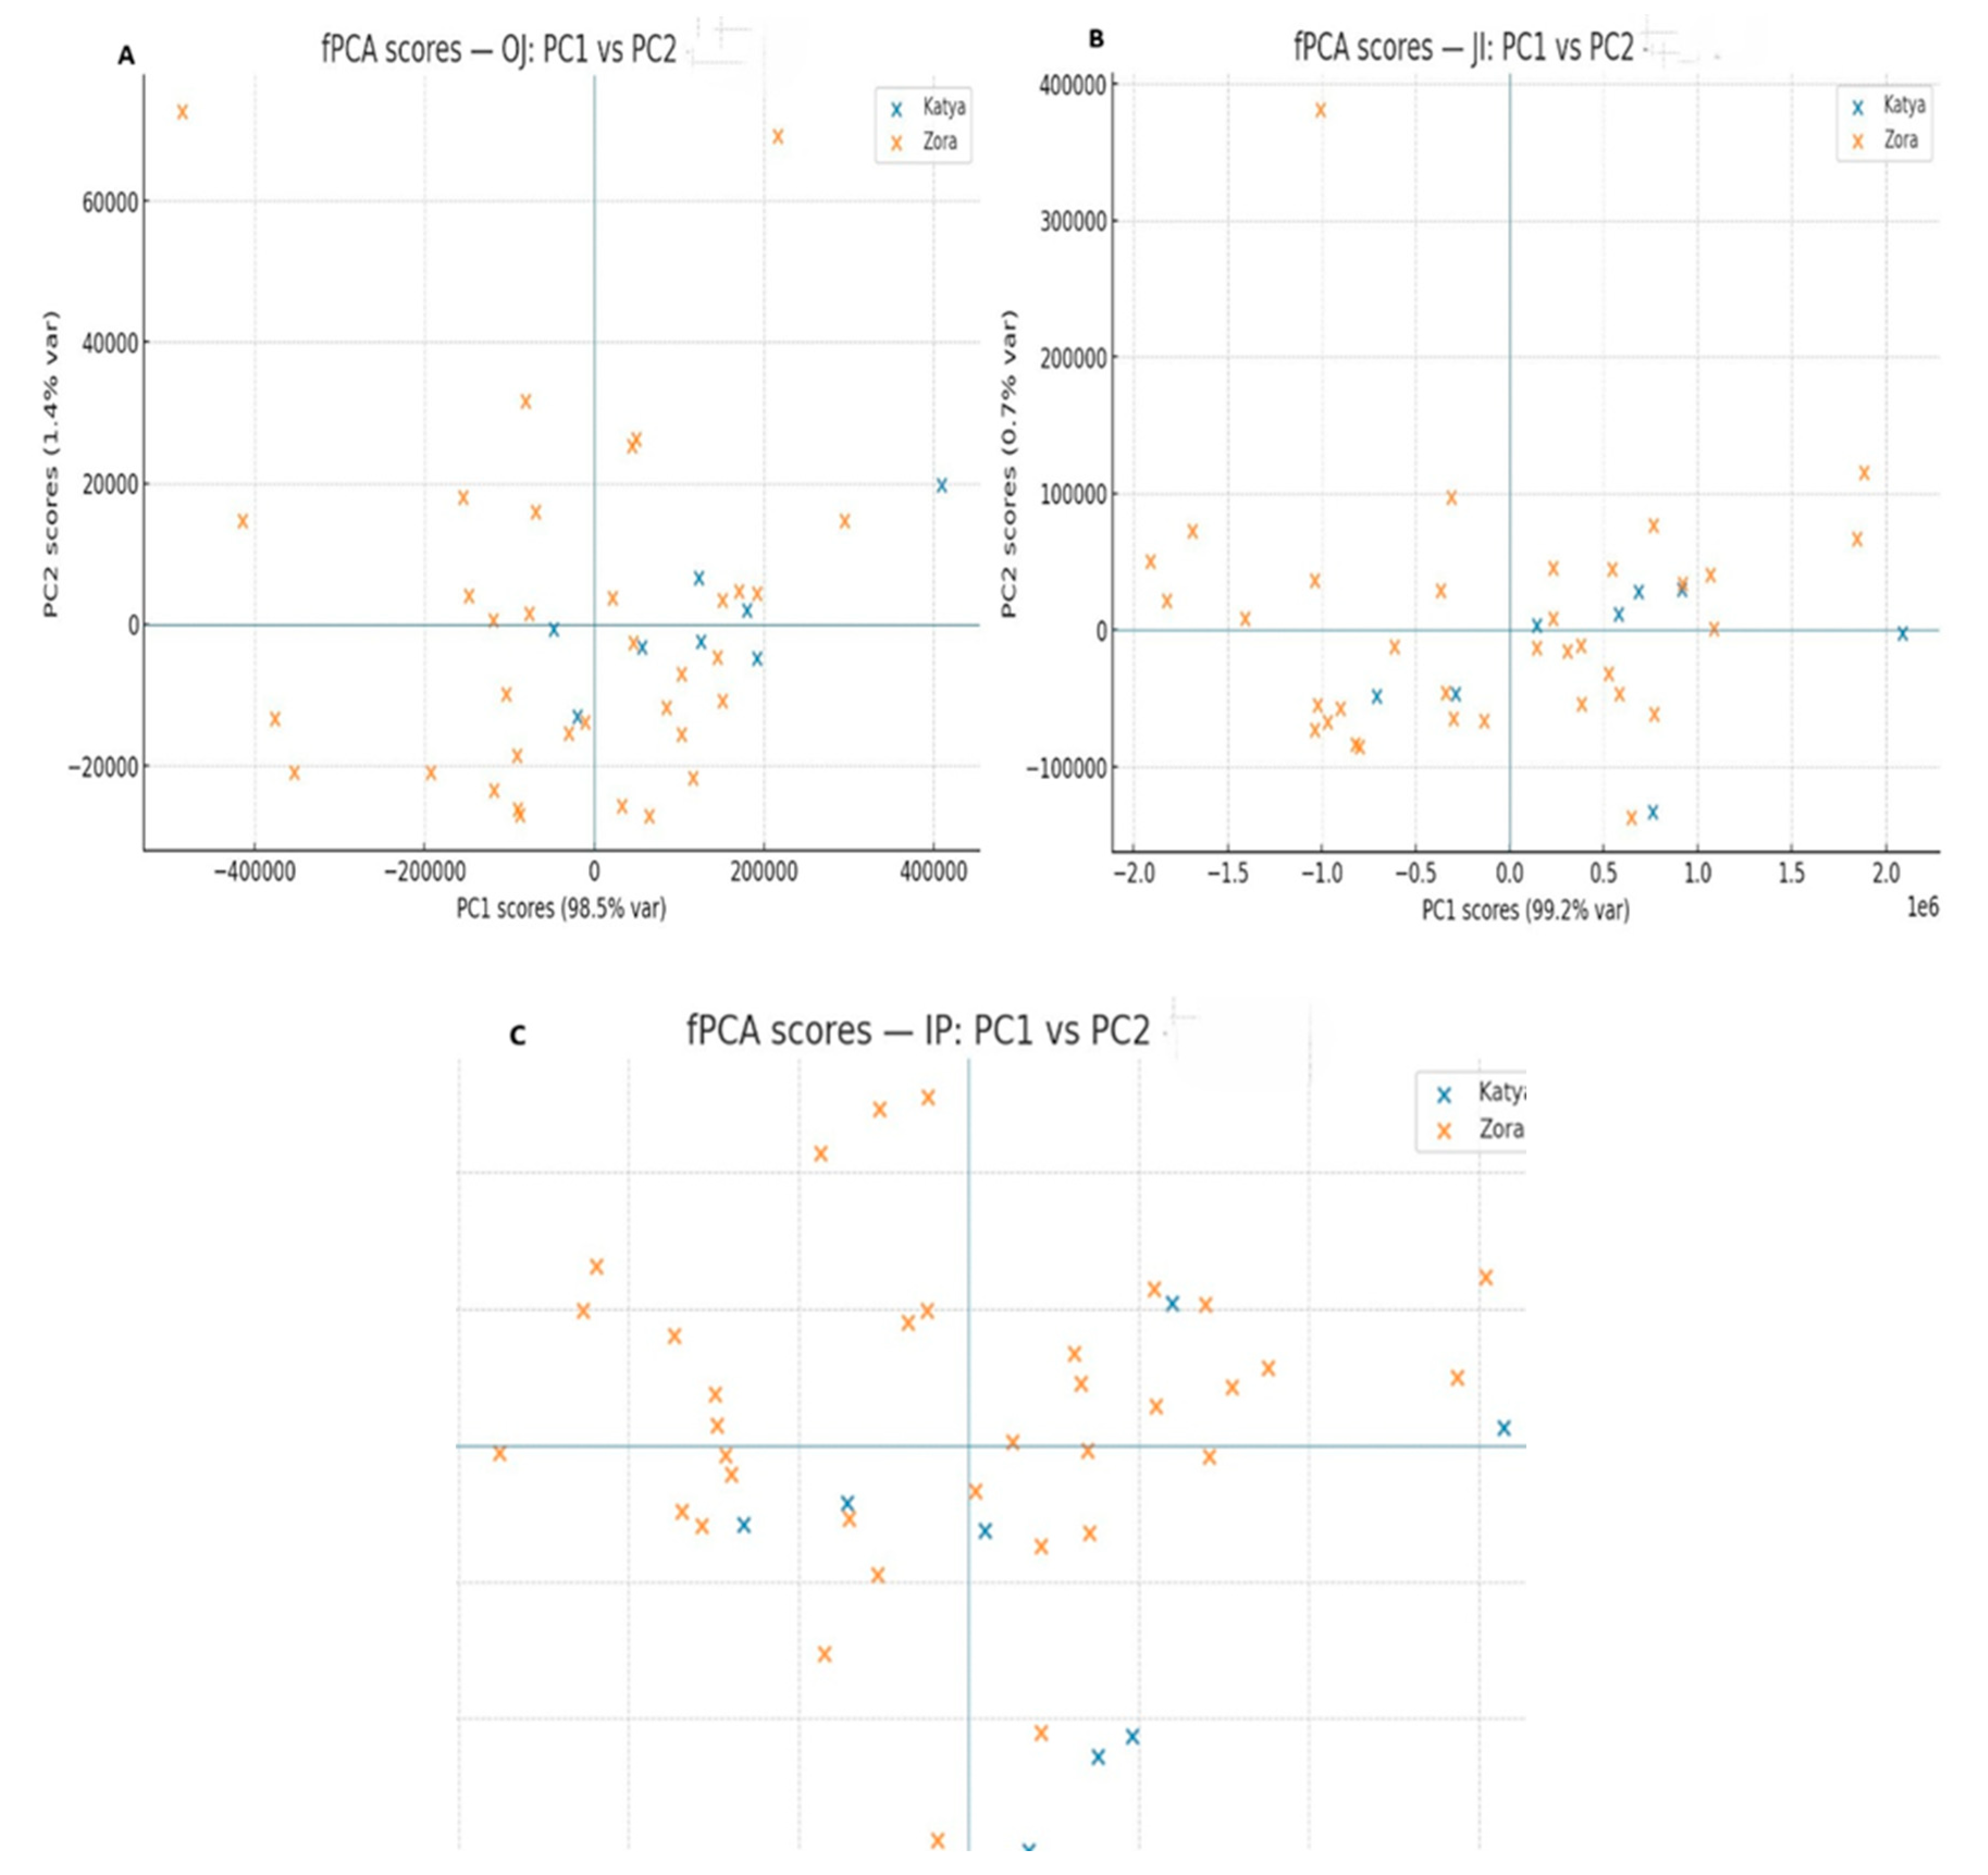
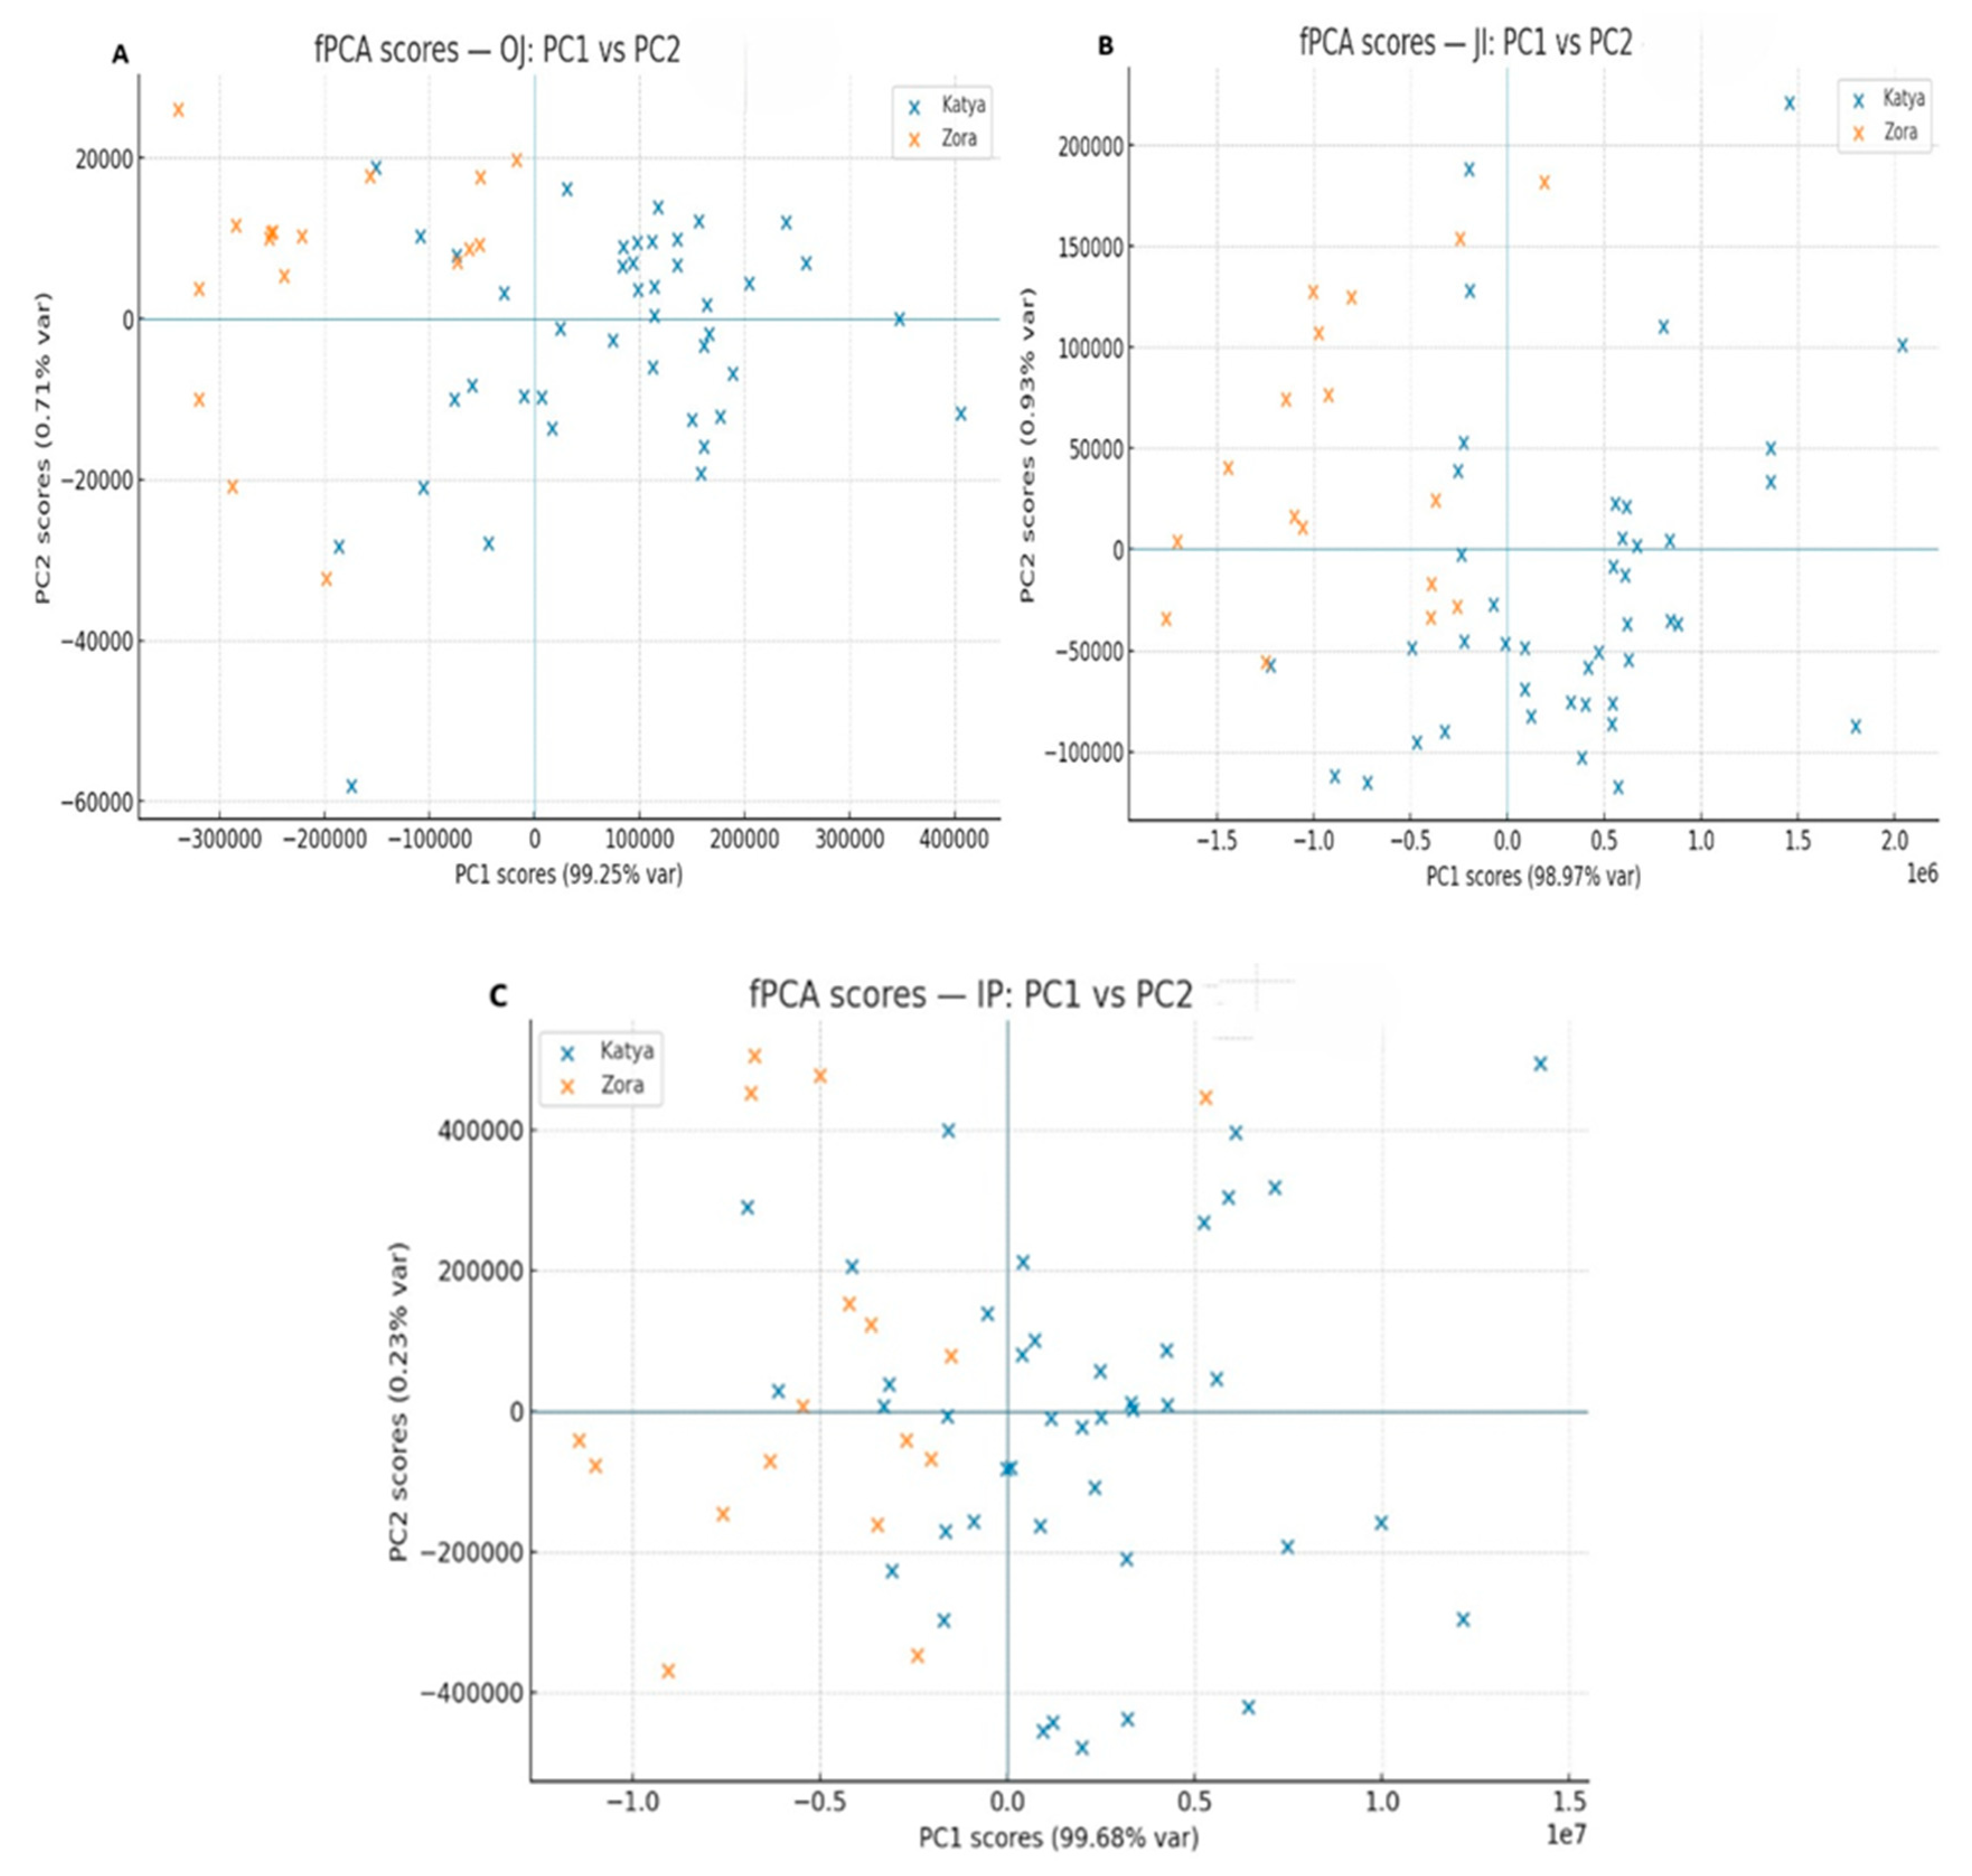
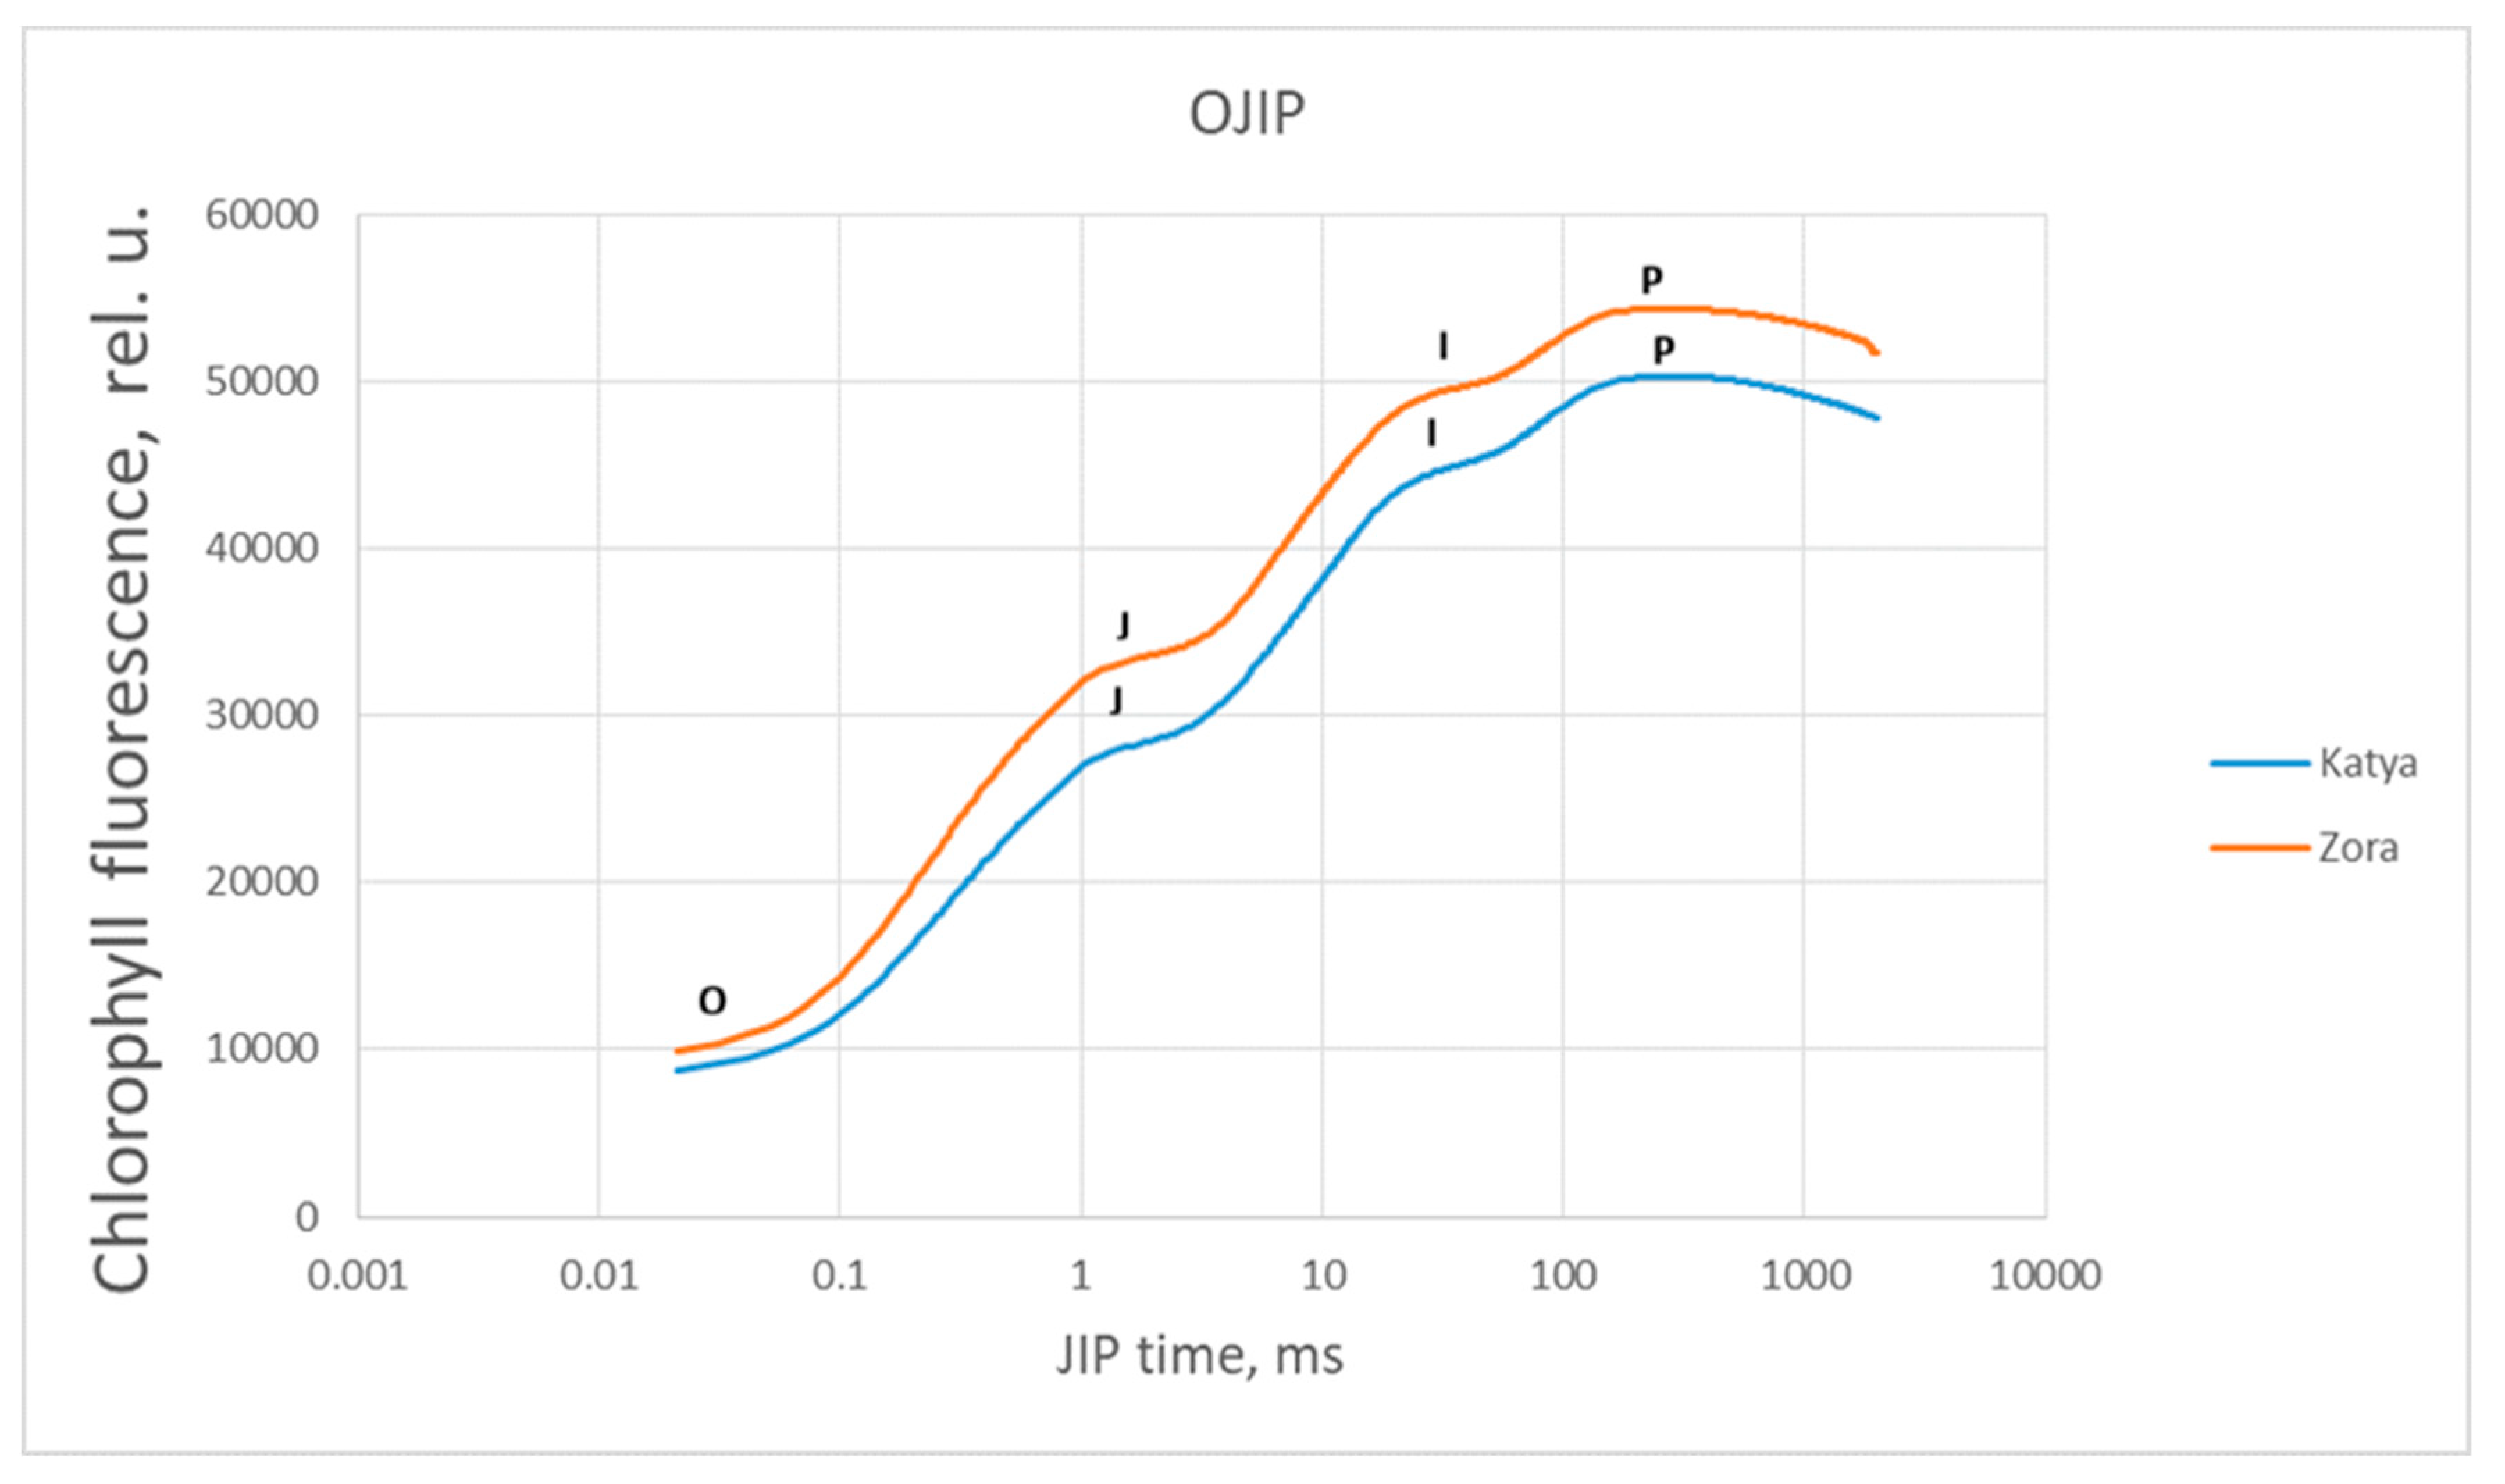
Rehydrated plants of both genotypes showed significant differences across all phases of the OJIP induction curves, indicating distinct responses of the two wheat varieties to drought and the high adaptability of Katya to this type of stress. The most significant differences again appear in the OJ phase, indicating that in Zora, severe structural and functional disorders occur in photosystem II. In contrast, in Katya, photosynthetic activity is fully restored.
5. Conclusions
Our results indicate that varietie divergence under drought is primarily localized to the initial phases of PSII photochemistry. Significant differences were observed only in the O–J region of the induction kinetics, indicating that primary charge separation, QA→QB turnover, antenna/connectivity, and donor-side (OEC) stability are the principal loci of stress sensitivity. Downstream phases (J–I and I–P) were essentially indistinguishable between varieties under stress, suggesting convergence of later electron-transport steps and PSI acceptor-side status at the imposed drought intensity.
Across the JIP-test, the sensitive genotype Zora exhibited a characteristic signature of reaction-center loss and overload of the remaining centers: ABS/RC, TR0/RC, ET0/RC, and DI0/RC were all elevated relative to Katya, consistent with a larger apparent antenna per active RC, greater per-RC trapping and transport, and enhanced thermal dissipation. Despite these per-RC increases, global photochemical performance declined sharply in Zora, as reflected by a markedly lower PI(abs), indicating a reduced probability of driving electrons beyond QA⁻. By contrast, the tolerant genotype Katya maintained a higher RC/ABS and a more balanced partitioning of absorbed energy between photochemistry and heat dissipation, thereby supporting sustained photosynthetic function under drought conditions.
With F0 unchanged but Fm depressed under drought, the normalized Vi increased (~3.9%; 0.80→0.83) even as the absolute Fi decreased (~5.1%; 42 836→40 668), implicating both enhanced non-photochemical quenching/photoinhibition (smaller Fm−F0 window) and a genuine slowdown of electron flow beyond QB. In early or mild stress instances, decreases in F0 and Vj are accompanied by slight reductions in ABS/RC, TR0/RC, and ET0/RC, together with increases in ψE0, φE0, and PI(abs), a pattern consistent with photoprotective antenna down-regulation that lowers the excitation pressure per RC rather than structural PSII damage.
Independent thermoluminescence measurements corroborated these fluorescence-based conclusions. Drought suppressed both the B and AG bands, with stronger post-rehydration recovery in Katya. In Zora, a downshifted split B-band revealed heterogeneous PSII populations and persistent charge-recombination instability, aligning with reaction-center loss, elevated dissipation, and weaker functional recovery. Collectively, these findings suggest that drought tolerance in wheat is associated with the preservation of PSII reaction-center density, balanced energy partitioning, homogeneous PSII behavior, and superior recovery capacity. In contrast, drought sensitivity is characterized by reaction-center depletion, heightened dissipation, impaired downstream transport, and persistent heterogeneity of PSII function.
Figure 1.
Fresh (FW) and dry weight (DW) measured on control plants, dehydrated and rehydrated plants on two wheat varieties - Katya and Zora. Single-factor ANOVA was applied to estimate the difference among all the variants. Different lowercase letters denote statistically significant differences. (Ctrl_K and Ctrl_Z – controls Katya and Zora plants respectively; De_K and De_Z - dehydrated Katya and Zora plants respectively, Re_K and Re_Z - rehydrated Katya and Zora plants respectively.).
Figure 2.
(A) Water content (WC) in percentages measured on control plants, dehydrated and rehydrated plants on two wheat varieties - Katya and Zora. Mann-Whitney U test was applied to estimate the difference among control plants and dehydrated and rehydrated plants. Wilcoxon signed-rank was used to calculate the difference between rehydrated and dehydrated plants. Different lowercase letters denote statistically significant differences. For both tests, statistically significant values are those with p<0.05. (B) Specific leaf area (SLA) in cm2/gDW measured on control plants, dehydrated and rehydrated plants on two wheat varieties - Katya and Zora. Mann-Whitney U test was applied to estimate the difference among control plants and dehydrated and rehydrated plants. Wilcoxon signed-rank was used to calculate the difference between rehydrated and dehydrated plants. Different lowercase letters denote statistically significant differences. For both tests, statistically significant values are those with p<0.05. (C) Leaf chlorophyll content in mg/m2 measured on control plants, dehydrated and rehydrated plants on two wheat varieties - Katya and Zora. Single-factor ANOVA was applied to estimate the difference among all the variants. Different lowercase letters denote statistically significant differences.
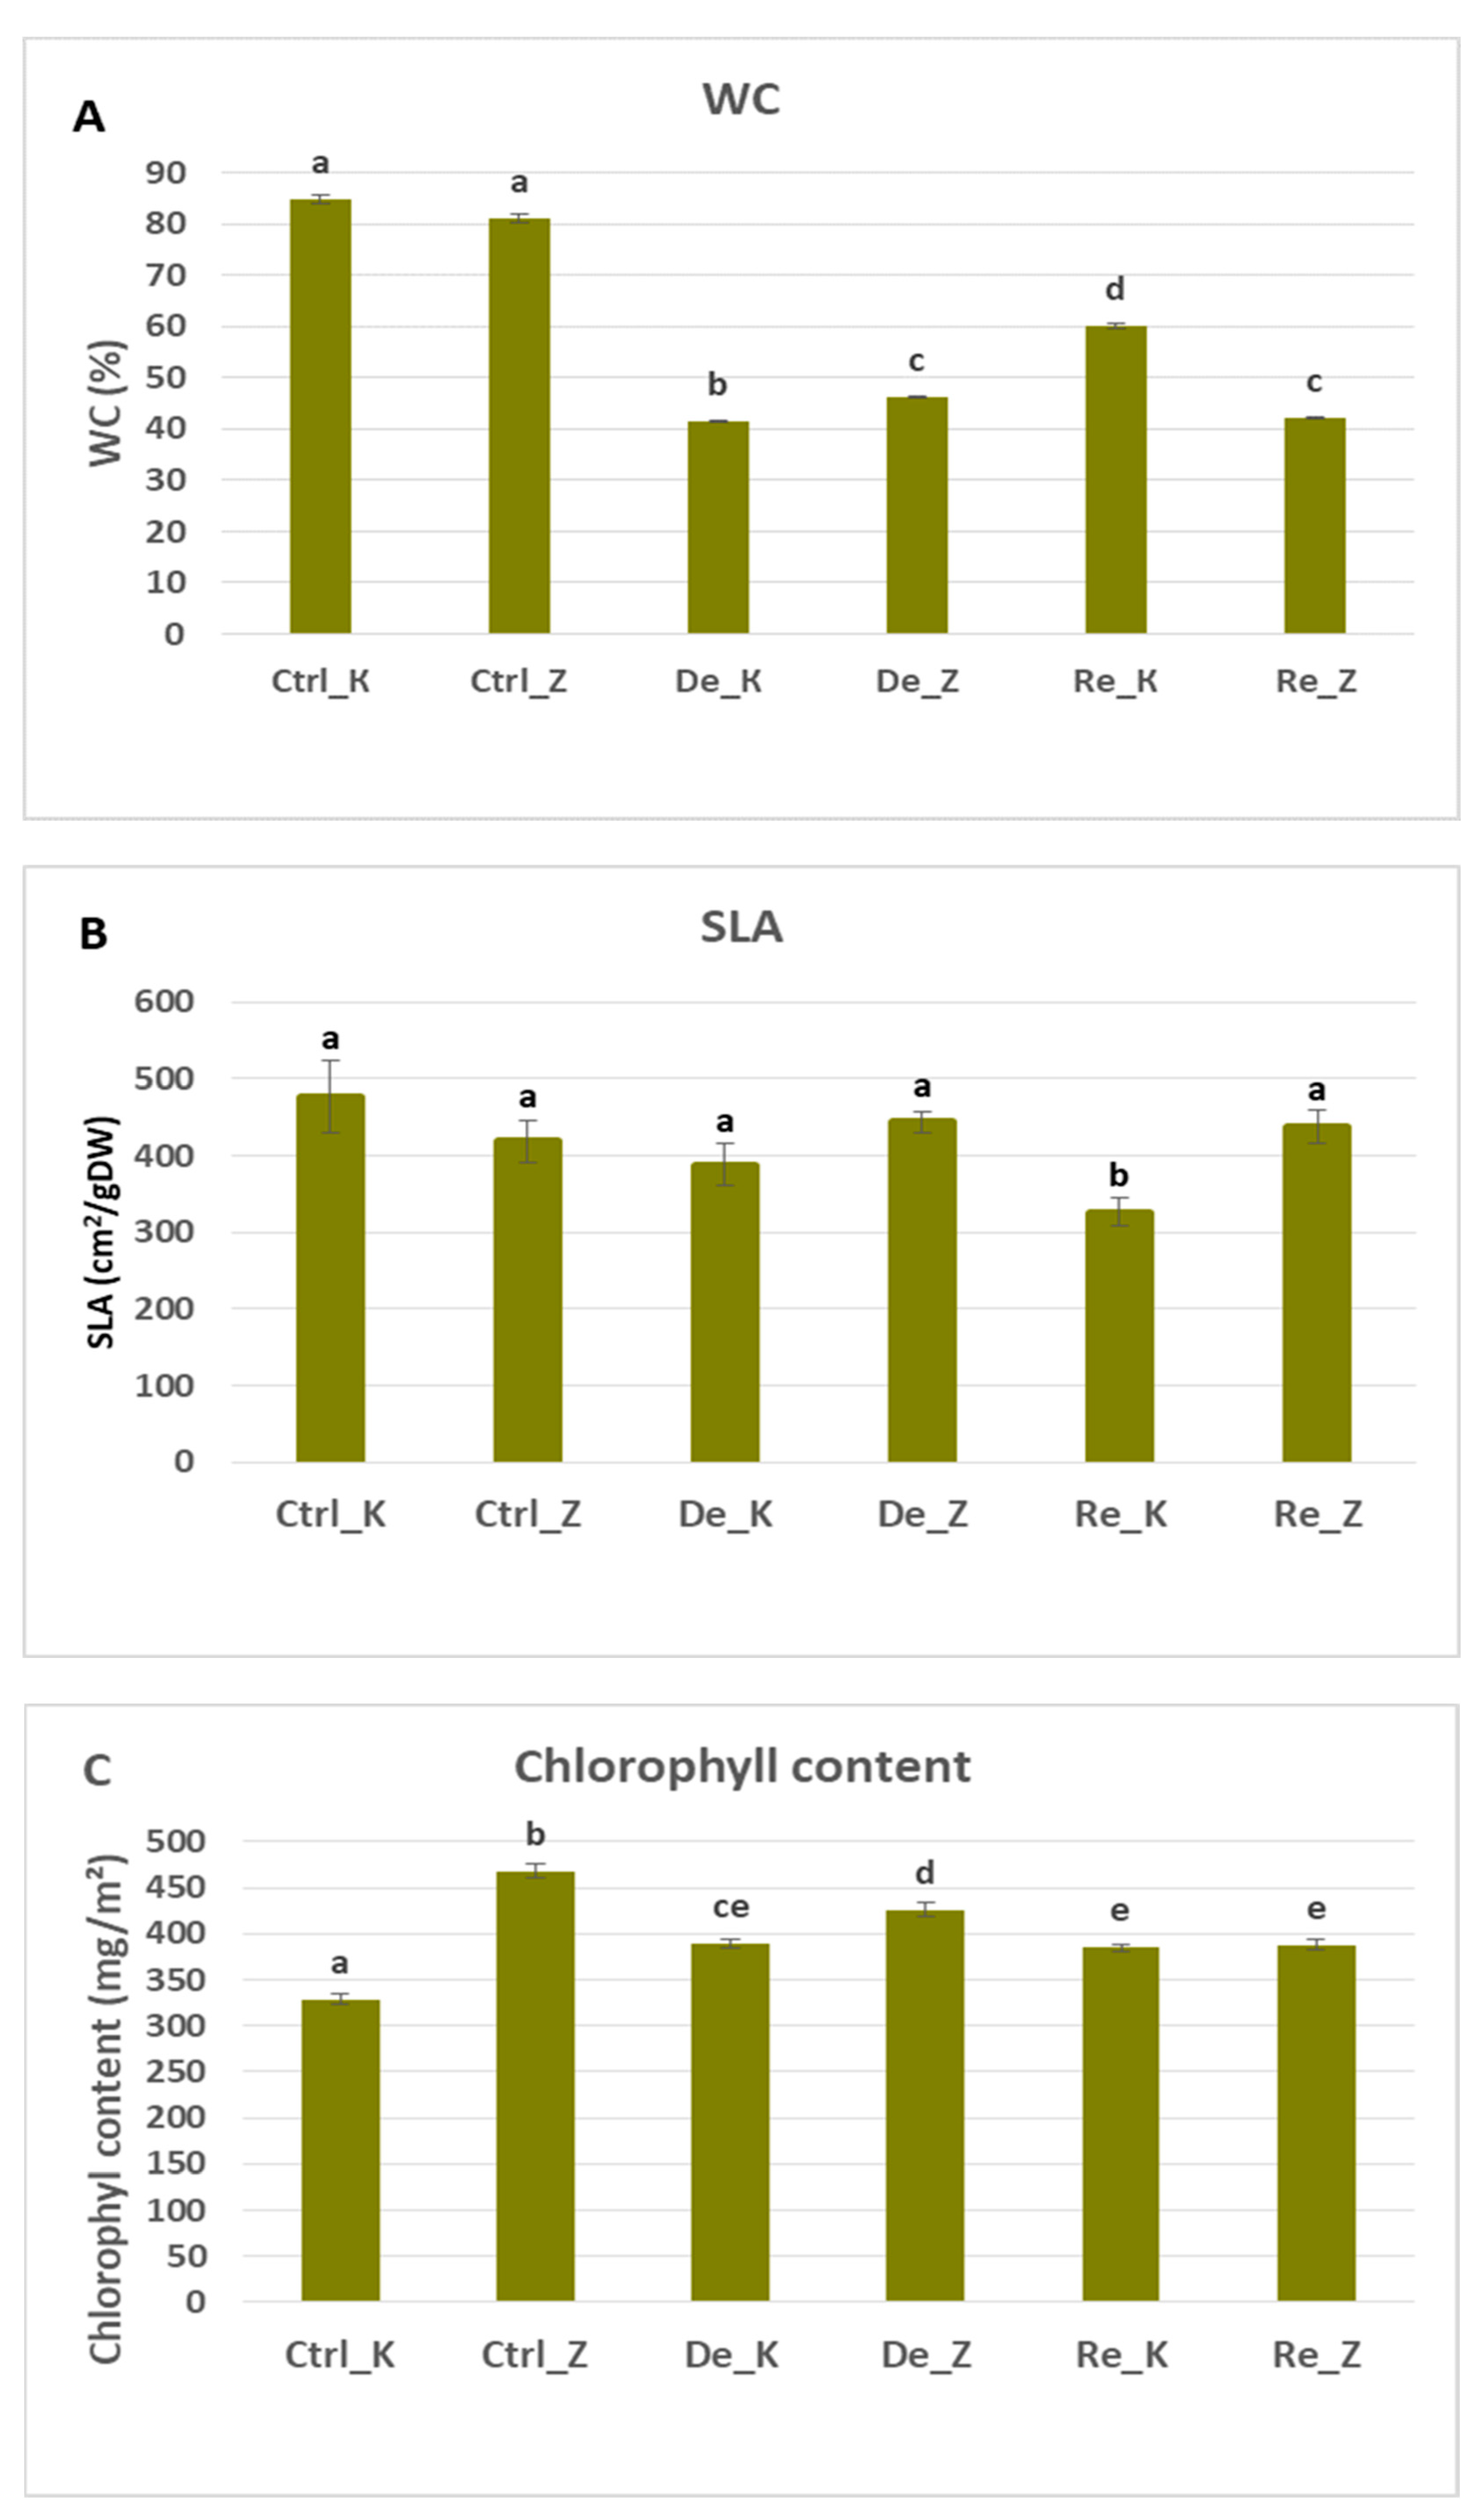
Figure 3.
Thermoluminescence glow curves from Katya and Zora wheat leaves of control, dehydrated, and rehydrated plants. The signals were obtained after excitation by two single saturation xenon flashes. The curves are vertically arranged, and the scale is the same for all curves.
Figure 3.
Thermoluminescence glow curves from Katya and Zora wheat leaves of control, dehydrated, and rehydrated plants. The signals were obtained after excitation by two single saturation xenon flashes. The curves are vertically arranged, and the scale is the same for all curves.
Figure 4.
(A) Maximal chlorophyll fluorescence in relative units (rel.u.) measured on the fourth day of dehydration and the third day of rehydration. Statistically significant differences when comparing control plants, dehydrated plants, and rehydrated plants are indicated by different lowercase letters (p ≤ 0.05). (B) Maximal and minimal chlorophyll fluorescence in relative units (rel.u.) measured on the seventh day of dehydration and the fifth day of rehydration. Statistically significant differences when comparing control plants, dehydrated plants, and rehydrated plants are indicated by different lowercase letters (p ≤ 0.05). (C) Chlorophyll fluorescence parameters (Fv/F0, Vi, ABS/RC, TR0/RC, ET0/RC) obtained from OJIP induction curves measured on the fourth day of dehydration and the third day of rehydration. Statistically significant differences compared to control plants, dehydrated plants, and rehydrated plants are shown with different small letters (* p ≤ 0.05). (D) Chlorophyll fluorescence parameters (Vj, Vi, ψ0, ET0/RC, ϕE0, and PI(abs)) obtained from OJIP induction curves measured on the seventh day of dehydration and the fifth day of rehydration.. Statistically significant differences compared to control plants, dehydrated plants, and rehydrated plants are shown with different small letters (p ≤ 0.05).
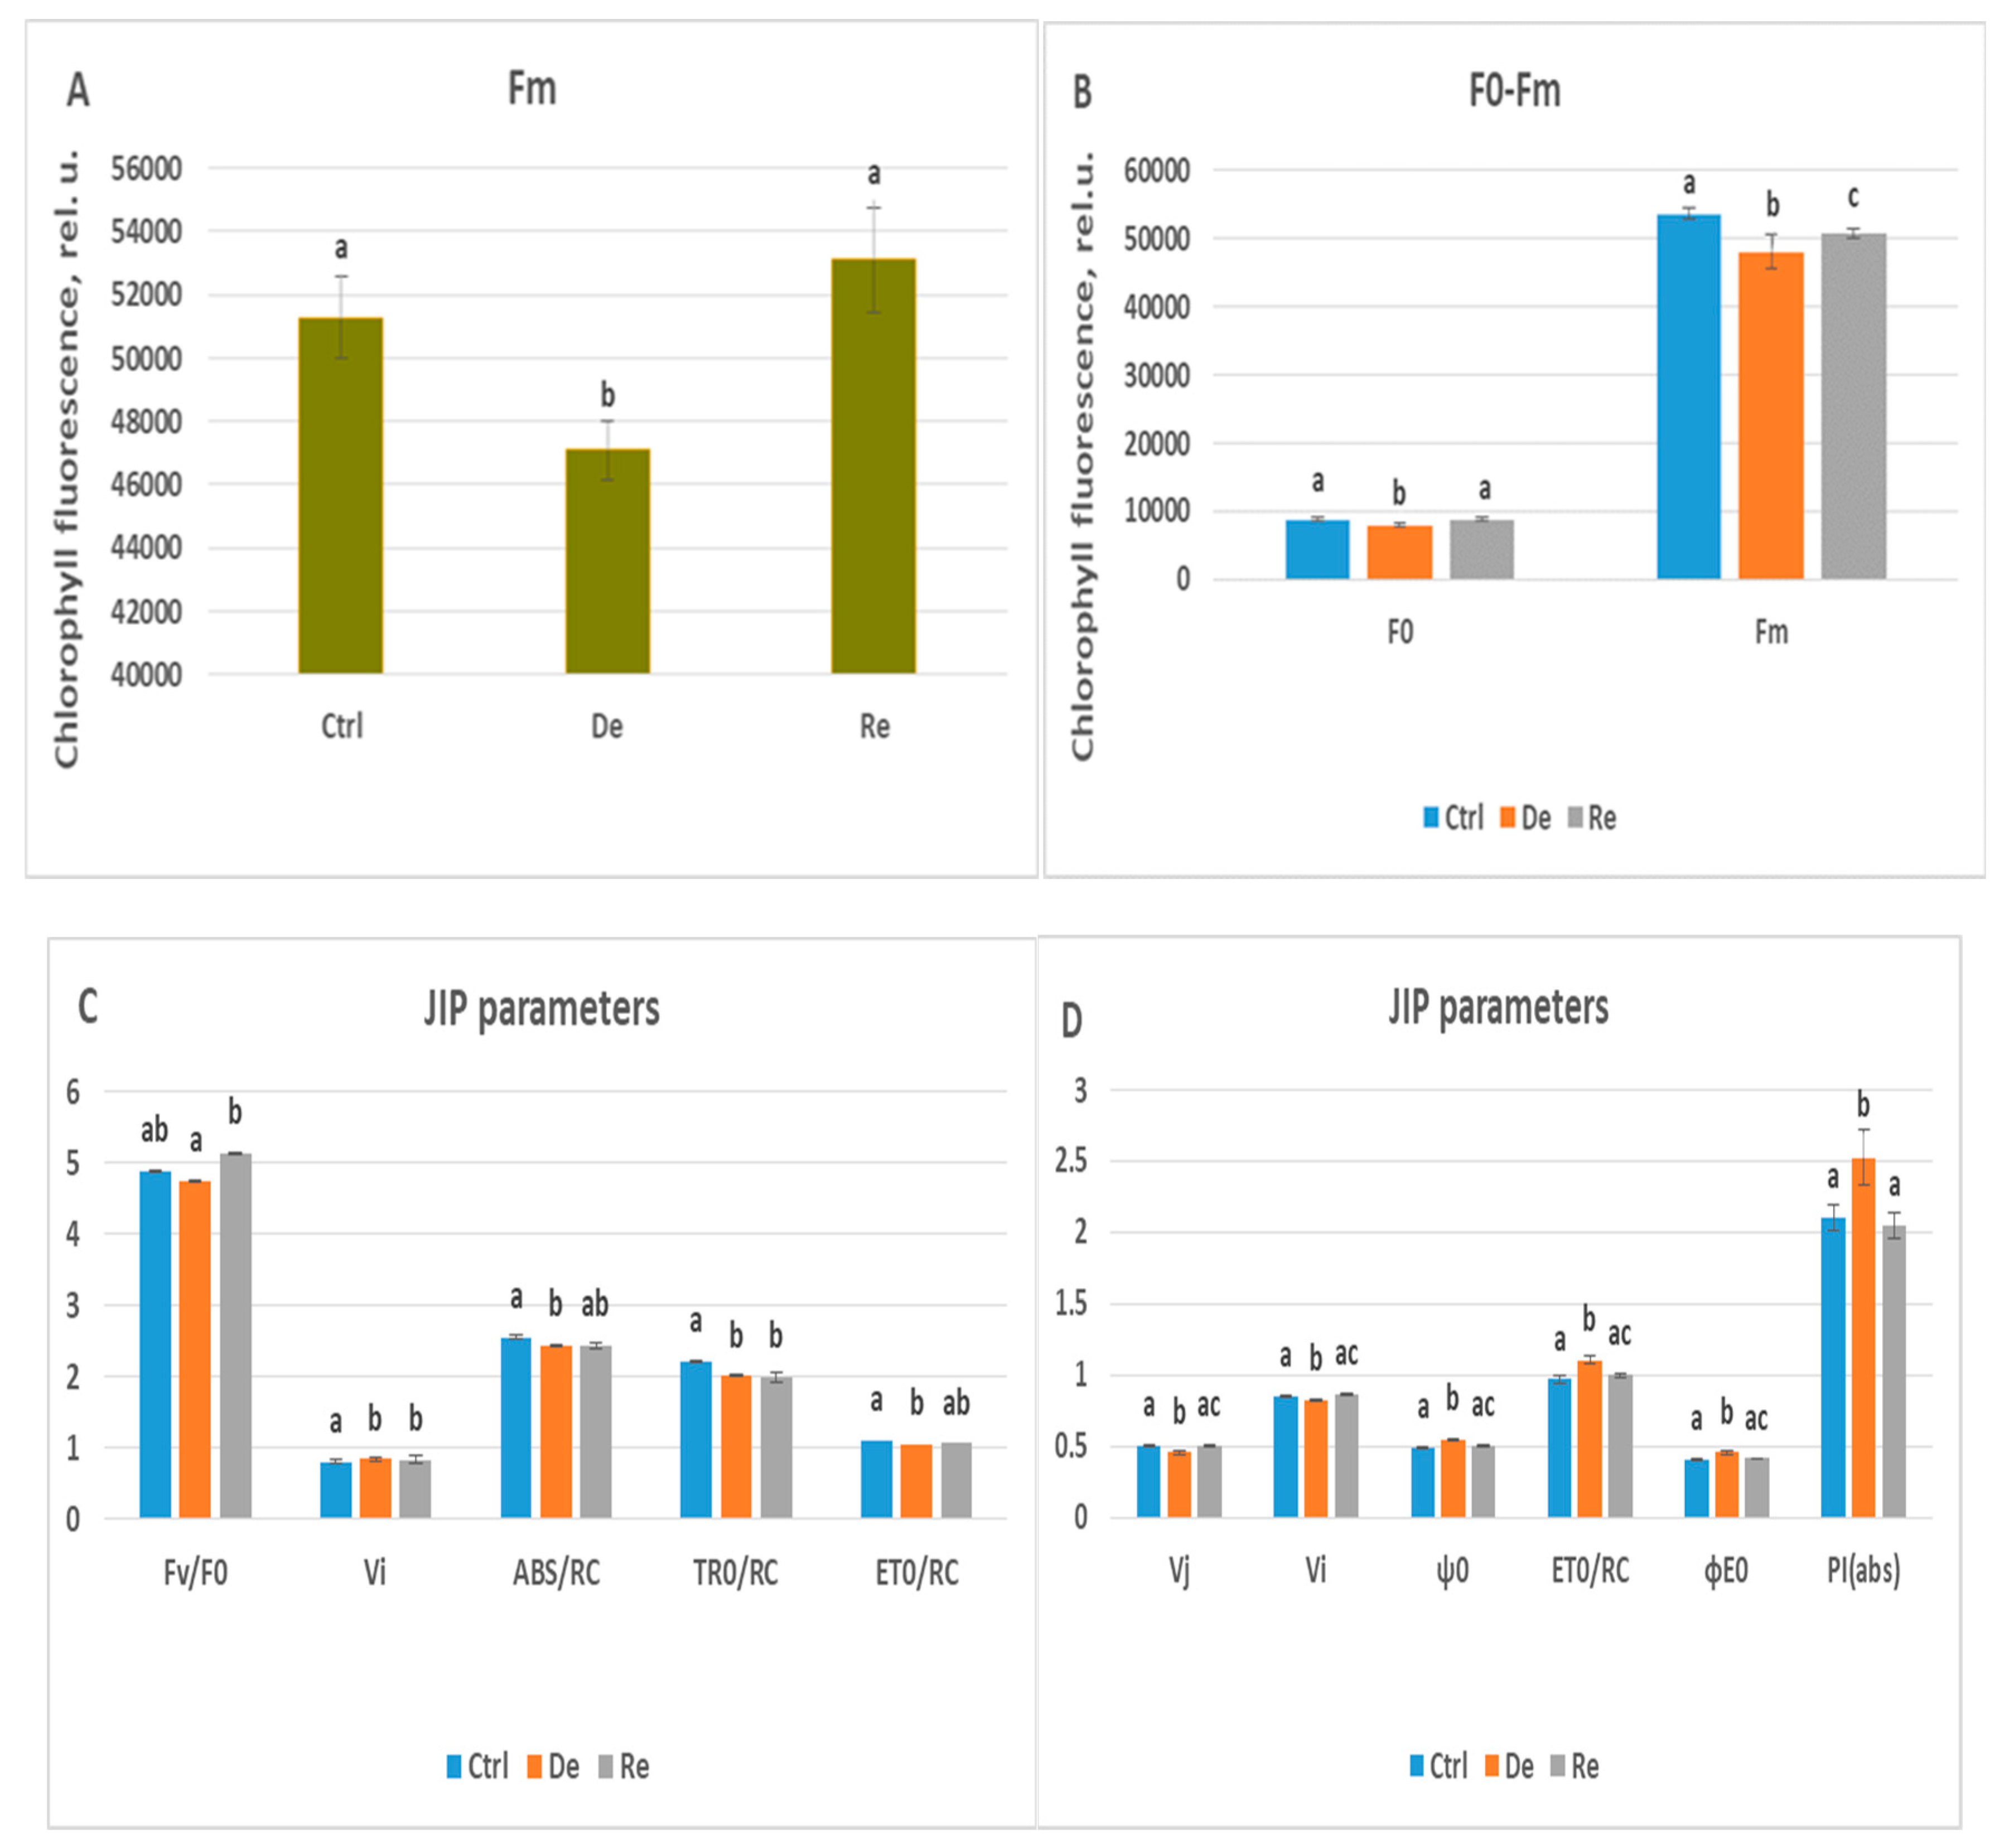
Figure 5.
(A) Minimal chlorophyll fluorescence in relative units (rel.u.) measured on the fourth day of dehydration and the third day of rehydration. Statistically significant differences when comparing control plants, dehydrated plants, and rehydrated plants are indicated by different lowercase letters (p ≤ 0.05). (B) Maximal and minimal chlorophyll fluorescence in relative units (rel.u.) measured on the seventh day of dehydration and the fifth day of rehydration. Statistically significant differences when comparing control plants, dehydrated plants, and rehydrated plants are indicated by different lowercase letters (p ≤ 0.05). (C) Chlorophyll fluorescence parameters (Fv/F0, Vj, Vi, ϕp(0), ψ0, (ABS/RC, TR0/RC, ET0/RC, DI0/RC, ϕE0, ϕD0, and PI(abs)) obtained from OJIP induction curves measured on the fourth day of dehydration and the third day of rehydration. Statistically significant differences compared to control plants, dehydrated plants, and rehydrated plants are shown with different small letters (p ≤ 0.05). (D) Chlorophyll fluorescence parameters (Fv/F0, Vj, Vi, ϕp(0), ψ0, (ABS/RC, TR0/RC, ET0/RC, DI0/RC, ϕE0, ϕD0, and PI(abs)) obtained from OJIP induction curves measured on the seventh day of dehydration and the fifth day of rehydration. Statistically significant differences compared to control plants, dehydrated plants, and rehydrated plants are shown with different small letters (p ≤ 0.05).
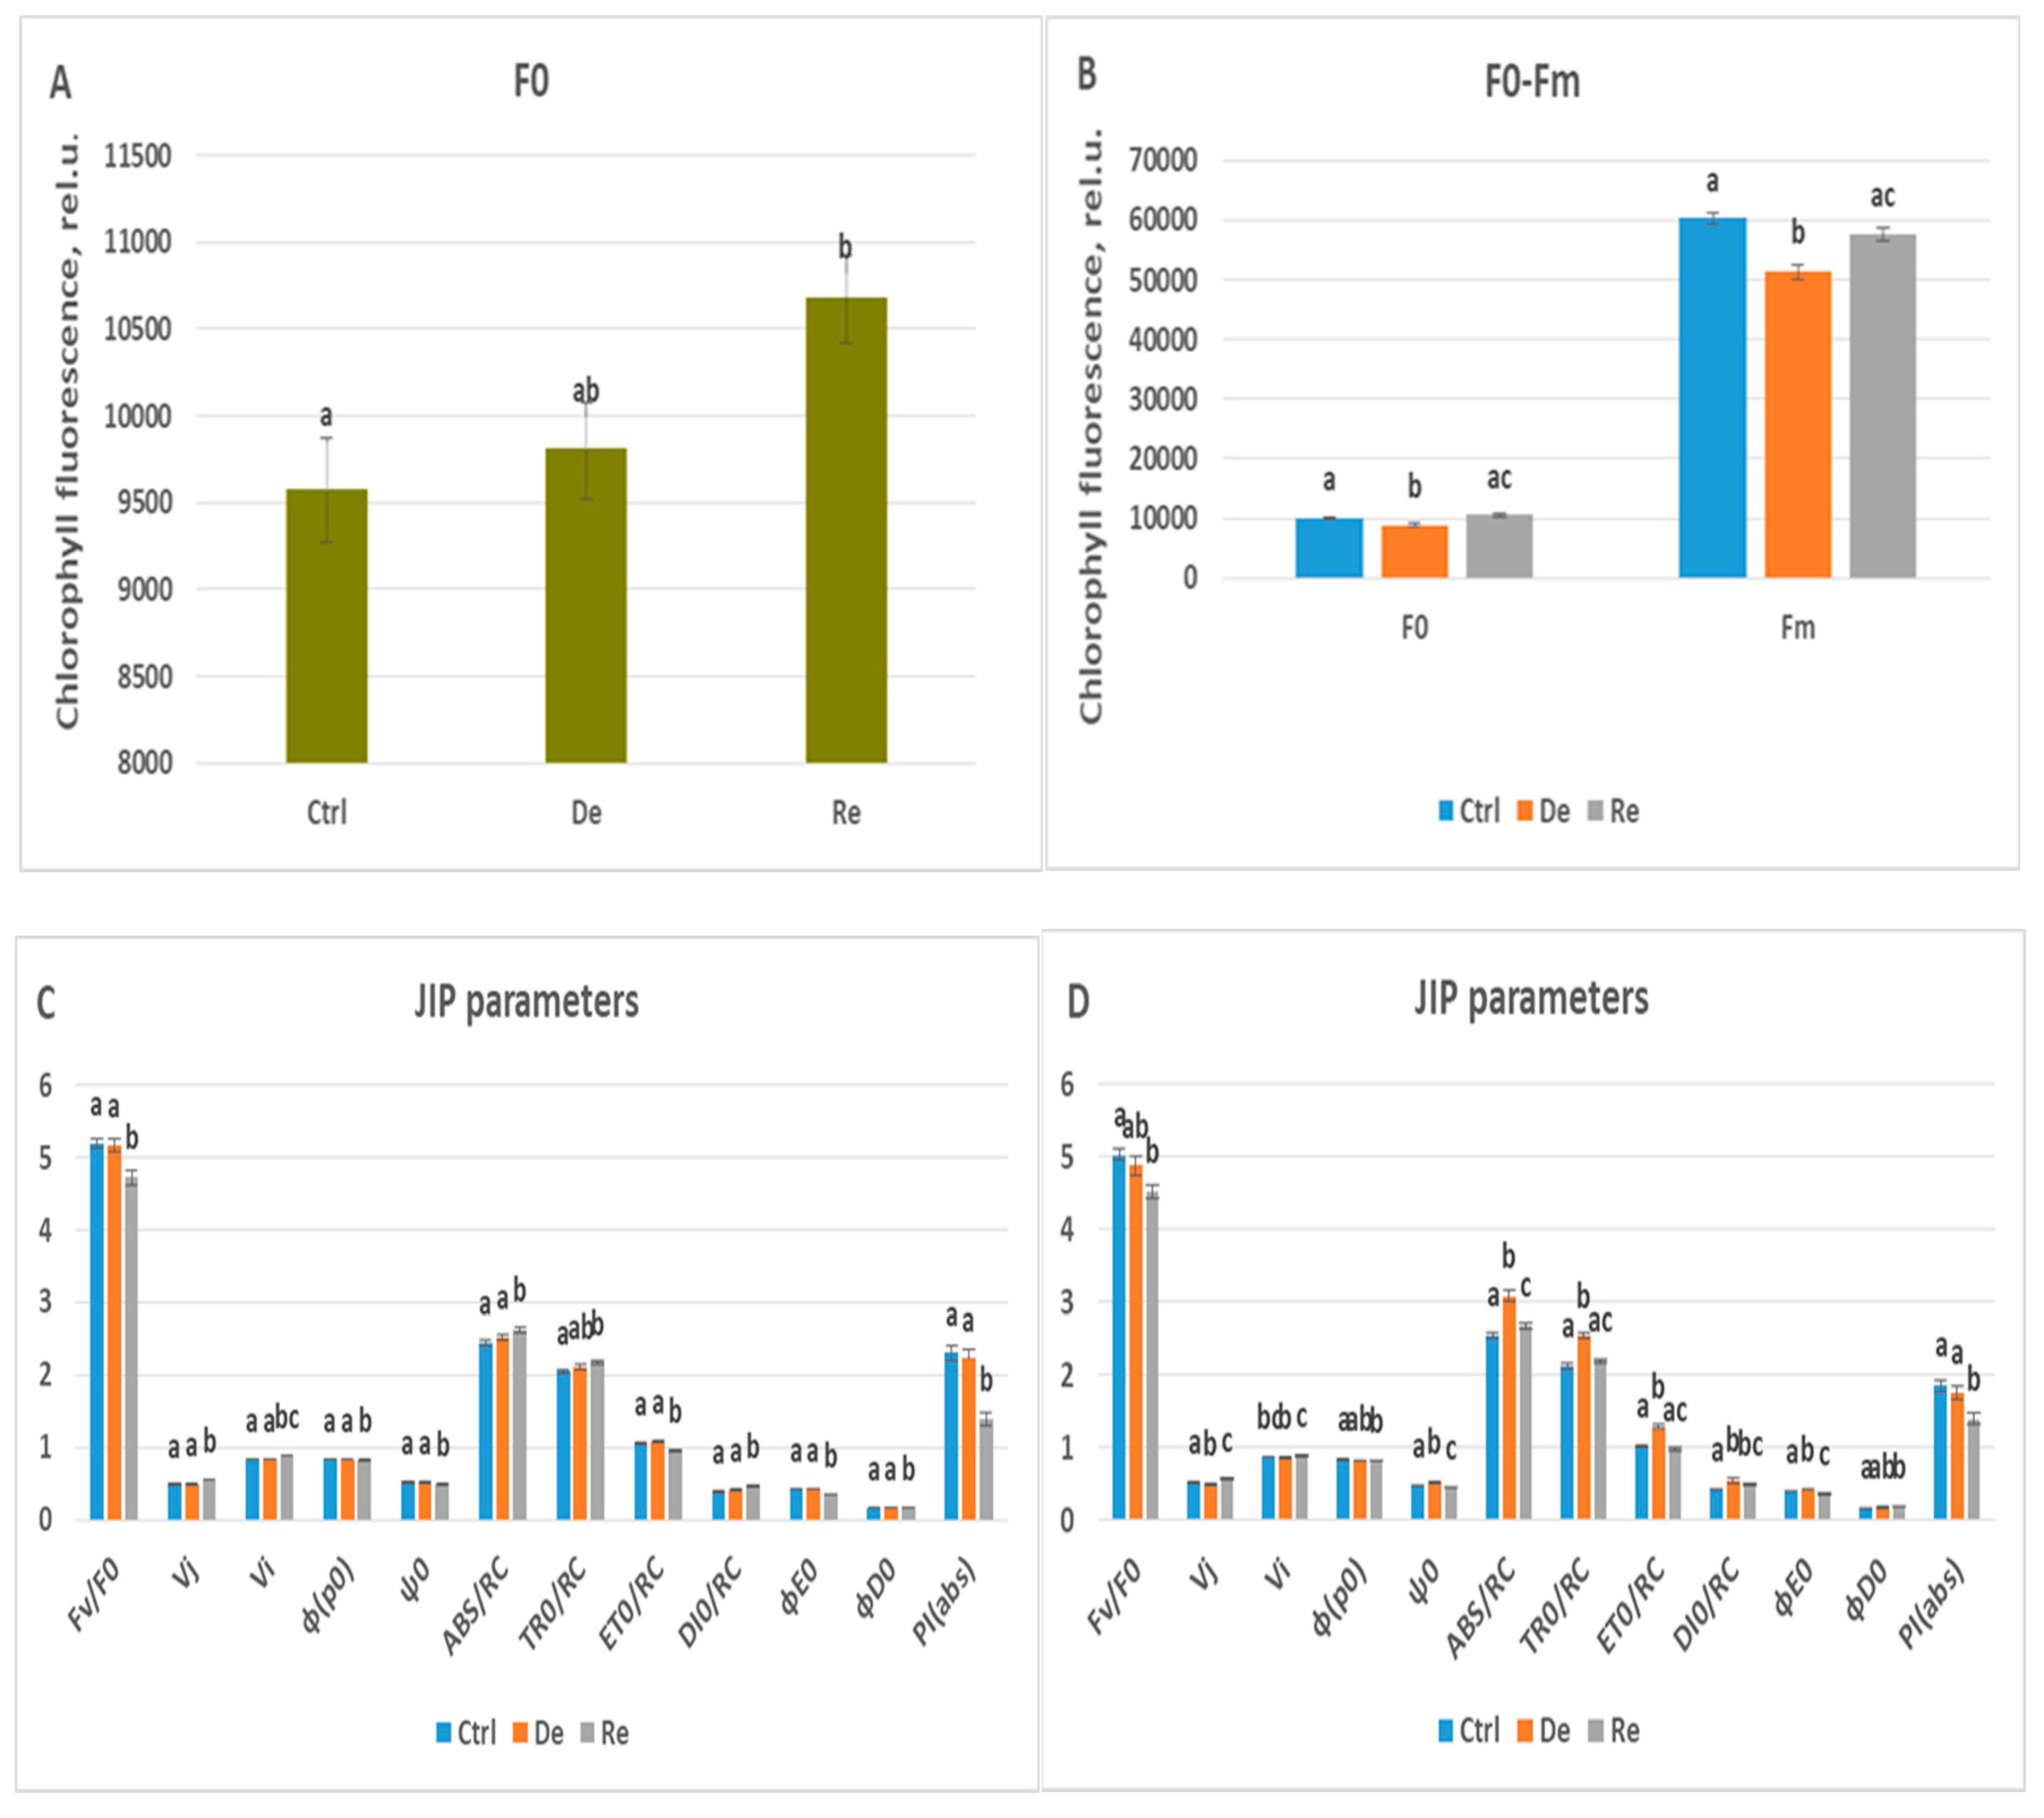
Figure 6.
Comparison of statistically significant values of chlorophyll fluorescence parameters (Vj, Vi, ψ0, ABS/RC, TR0/RC, ET0/RC, DI0/RC, ϕE0, ϕD0, and PI(abs)) obtained from OJIP induction curves measured on full dehydrated wheat varieties Katya and Zora (p ≤ 0.05).
Figure 6.
Comparison of statistically significant values of chlorophyll fluorescence parameters (Vj, Vi, ψ0, ABS/RC, TR0/RC, ET0/RC, DI0/RC, ϕE0, ϕD0, and PI(abs)) obtained from OJIP induction curves measured on full dehydrated wheat varieties Katya and Zora (p ≤ 0.05).
Figure 7.
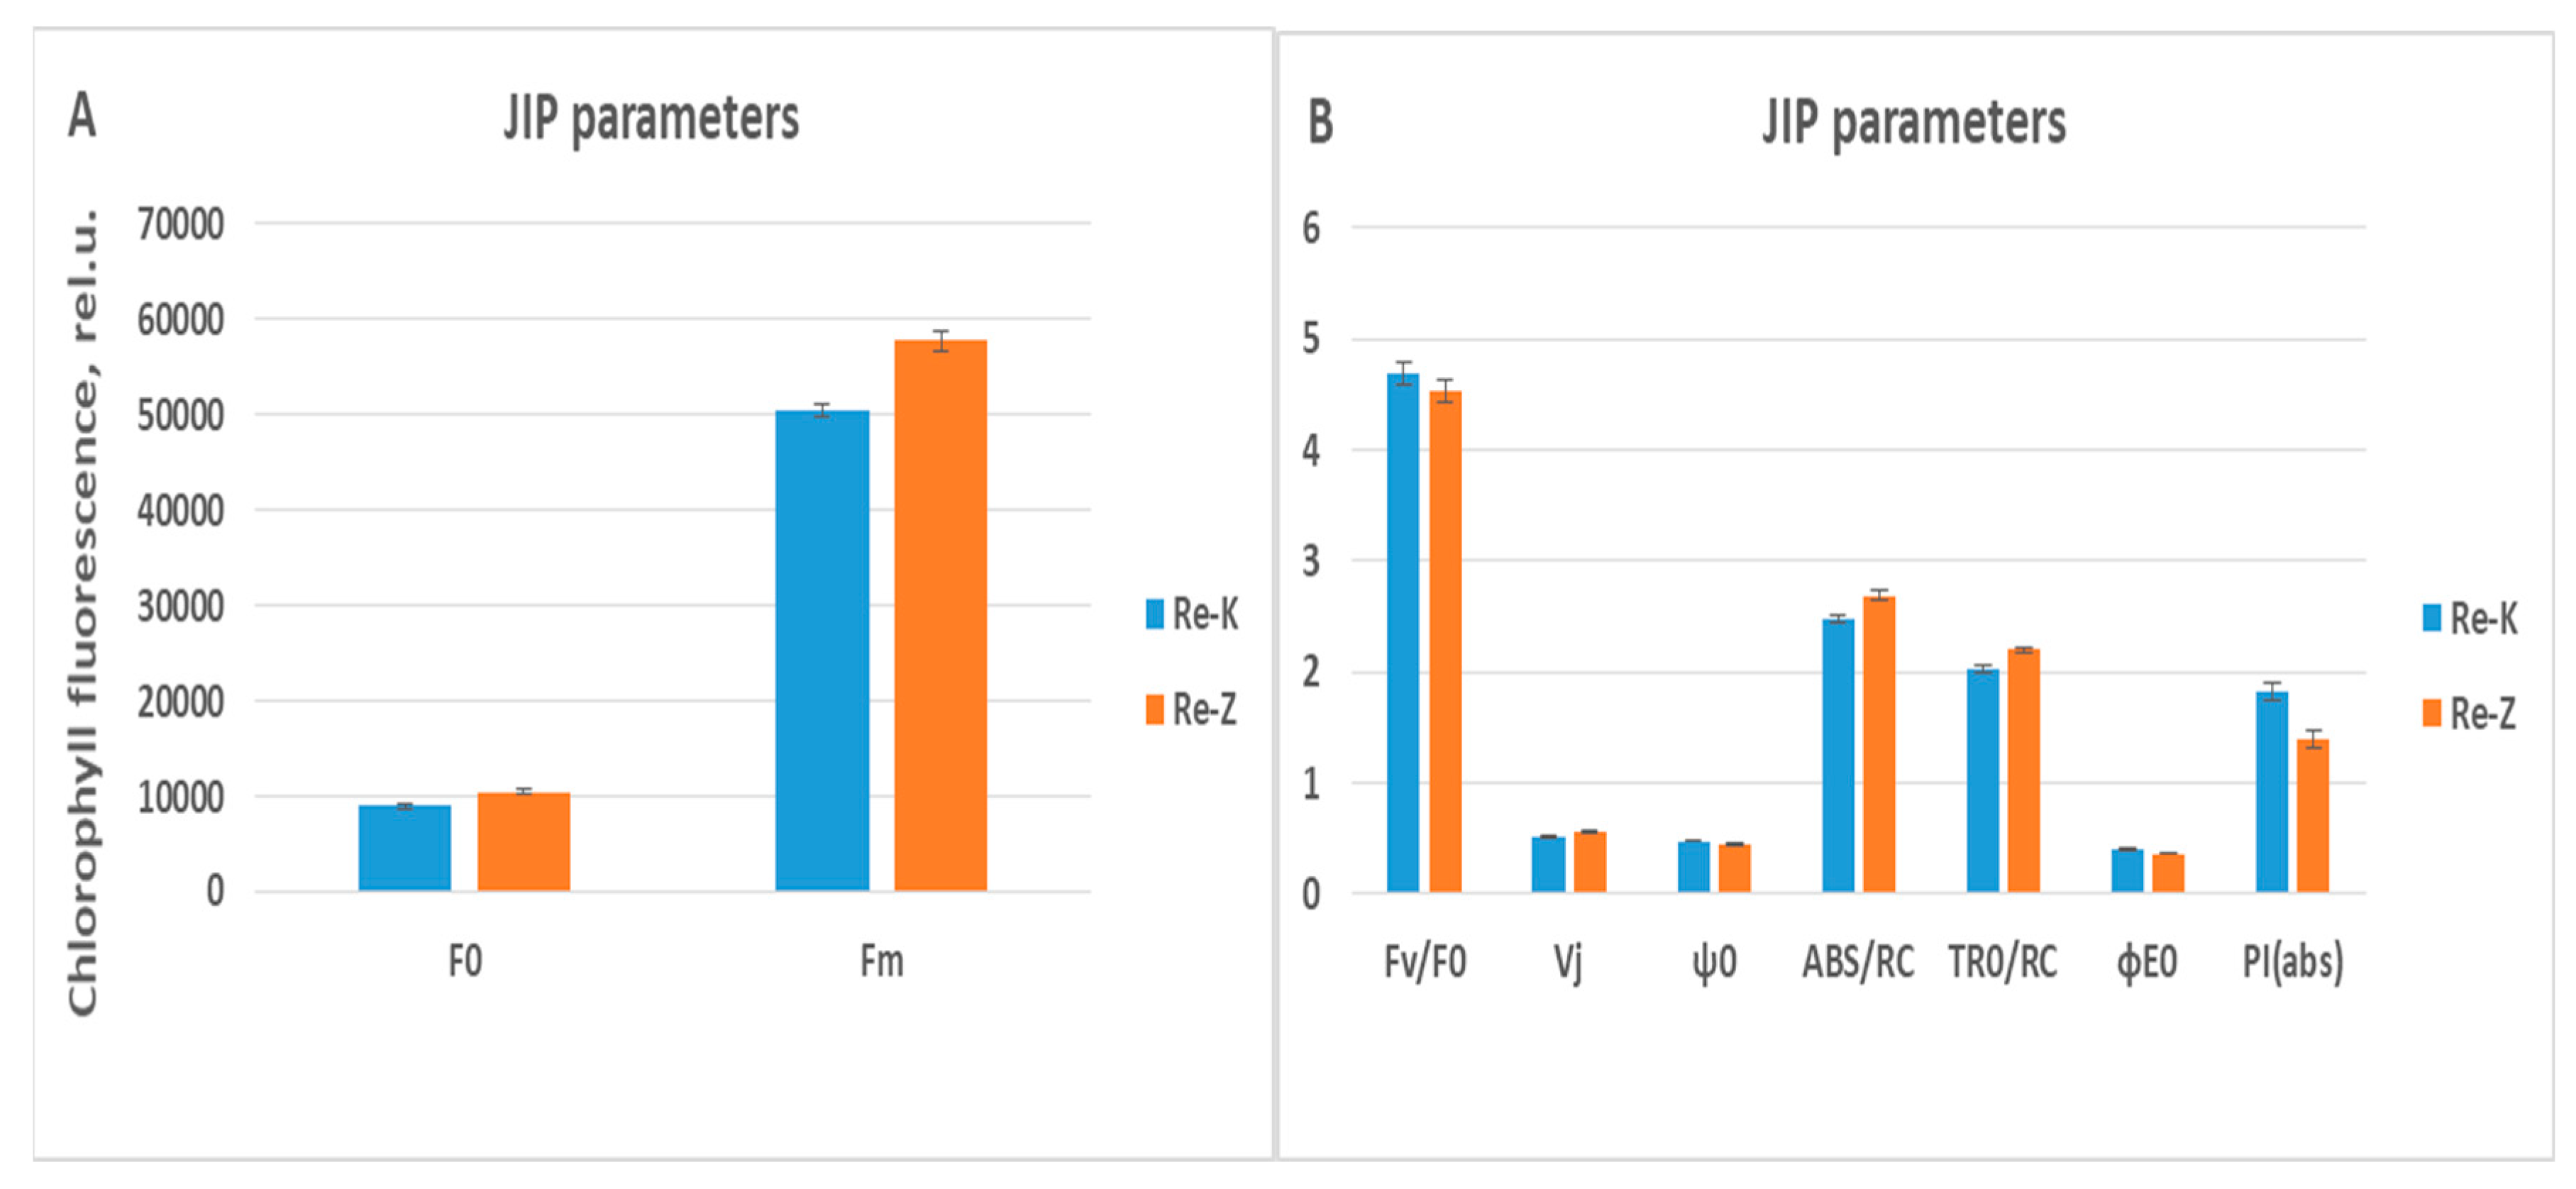
(A) Comparison of statistically significant values of maximal and minimal chlorophyll fluorescence in relative units (rel.u.) measured on full rehydrated wheat varieties Katya and Zora (p ≤ 0.05). (B) Comparison of statistically significant values of chlorophyll fluorescence parameters (Vj, ψ0, ABS/RC, TR0/RC, ϕE0, and PI(abs)) obtained from OJIP induction curves measured on full rehydrated wheat varieties Katya and Zora (p ≤ 0.05).
Figure 7.
(A) Comparison of statistically significant values of maximal and minimal chlorophyll fluorescence in relative units (rel.u.) measured on full rehydrated wheat varieties Katya and Zora (p ≤ 0.05). (B) Comparison of statistically significant values of chlorophyll fluorescence parameters (Vj, ψ0, ABS/RC, TR0/RC, ϕE0, and PI(abs)) obtained from OJIP induction curves measured on full rehydrated wheat varieties Katya and Zora (p ≤ 0.05).
Figure 8.
Averaged chlorophyll a fluorescence induction curve for the specific steps of the OJIP test, measured in control plants of wheat varieties Katya and Zora with a red actinic light irradiation intensity of 3000 µmol photons m−2 s−1 for a measurement period of 1 s.
Figure 8.
Averaged chlorophyll a fluorescence induction curve for the specific steps of the OJIP test, measured in control plants of wheat varieties Katya and Zora with a red actinic light irradiation intensity of 3000 µmol photons m−2 s−1 for a measurement period of 1 s.
Figure 10.
Averaged chlorophyll a fluorescence induction curve for the specific steps of the OJIP test, measured in dehydrated plants of wheat varieties Katya and Zora with a red actinic light irradiation intensity of 3000 µmol photons m−2 s−1 for a measurement period of 1 s.
Figure 10.
Averaged chlorophyll a fluorescence induction curve for the specific steps of the OJIP test, measured in dehydrated plants of wheat varieties Katya and Zora with a red actinic light irradiation intensity of 3000 µmol photons m−2 s−1 for a measurement period of 1 s.
Figure 12.
Averaged chlorophyll a fluorescence induction curve for the specific steps of the OJIP test, measured in rehydrated plants of wheat varieties Katya and Zora with a red actinic light irradiation intensity of 3000 µmol photons m−2 s−1 for a measurement period of 1 s.
Figure 12.
Averaged chlorophyll a fluorescence induction curve for the specific steps of the OJIP test, measured in rehydrated plants of wheat varieties Katya and Zora with a red actinic light irradiation intensity of 3000 µmol photons m−2 s−1 for a measurement period of 1 s.
Table 1.
Values of fresh and dry weight with standard error for Katya and Zora genotypes for controls, dehydrated, and rehydrated plants.
Table 1.
Values of fresh and dry weight with standard error for Katya and Zora genotypes for controls, dehydrated, and rehydrated plants.
| |
|
Control plants |
Dehydrated plants |
Rehydrated plants |
| Fresh weight (g) |
Katya |
1.47±0.06 |
1.19±0.02 |
1.63±0.08 |
| Zora |
2.22±0.08 |
1.39±0.1 |
2.39±0.1 |
| Dry weight (g) |
Katya |
0.16±0.01 |
0.13±0.005 |
0.29±0.02 |
| Zora |
0.29±0.01 |
0.2±0.01 |
0.39±0.03 |
Table 2.
Values of water content, specific leaf area and leaf chlorophyll content with standard error for Katya and Zora genotypes for controls, dehydrated, and rehydrated plants.
Table 2.
Values of water content, specific leaf area and leaf chlorophyll content with standard error for Katya and Zora genotypes for controls, dehydrated, and rehydrated plants.
| |
|
Control plants |
Dehydrated plants |
Rehydrated plants |
| Water content(%) |
Katya |
8.5±0.85 (85%) |
4.2±0.1 (42%) |
6.0±0.35 (60%) |
| Zora |
8.1±0.97 (81%) |
4.6±0.2 (46%) |
4.2±0.14 (42%) |
| Specific leaf area(cm2/gDW) |
Katya |
476.4±47.3 |
388.4±28 |
326.9±19.3 |
| Zora |
418.9±53 |
444.1±14.1 |
437.6±41.2 |
| Leaf chlorophyll content (mg/m2) |
Katya |
312.6±4.3 |
387.9±4.5 |
382±3.9 |
| Zora |
467.4±7.6 |
426.1±8 |
391.7±5.9 |
Table 3.
The effect of drought and rehydration on wheat plant Katya measured on the fourth day of drought and on the third day of rehydration analyzed by the JIP parameters. Kruskal-Wallis one-way analysis of variance by ranks was applied. Only parameters that are statistically different from each other are presented. (Significant differences at p<0.05).
| |
Ctrl |
De |
Re |
| Fm |
51269.4±1304 |
47085.4±934.9 |
53093.4±1651 |
| Fv/F0 |
4.87±0.081 |
4.74±0.04 |
5.12±`0.05 |
| Vi |
0.80±0.007 |
0.83±0.007 |
0.83±0.008 |
| ABS/RC |
2.55±0.033 |
2.43±0.028 |
2.43±0.049 |
| TR0/RC |
2.20±0.028 |
2.00±0.022 |
1.98±0.039 |
| ET0/RC |
1.09±0.009 |
1.04±0.015 |
1.06±0.073 |
Table 4.
The effect of drought and rehydration on wheat plant Katya measured on the seventh day of drought and on the fifth day of rehydration, and analyzed by the JIP parameters. Kruskal-Wallis one-way analysis of variance by ranks was applied. Only parameters that are statistically different from each other are presented. (Significant differences at p<0.05).
| |
Ctrl |
De |
Re |
| F0 |
8819.7±214.9 |
7972.7±`192.1 |
8823.1±188.4 |
| Fm |
53597.1±907.6 |
47965.5±2466.3 |
50616.8±707.9 |
| Vj |
0.51±0.007 |
0.45±0.009 |
0.50±0.006 |
| Vi |
0.85±0.005 |
0.82±0.01 |
0.86±0.006 |
| ψ0 |
0.49±0.007 |
0.54±0.009 |
0.5±0.006 |
| ET0/RC |
0.97±0.026 |
1.10±0.02 |
1.00±0.01 |
| ϕE0 |
0.41±0.006 |
0.45±0.01 |
0.41±0.0061 |
| PI(abs) |
2.10±0.09 |
2.52±0.19 |
2.04±0.09 |
Table 5.
The effect of drought and rehydration on wheat plant Zora measured on the fourth day of drought and on the third day of rehydration analyzed by the JIP parameters. Kruskal-Wallis one-way analysis of variance by ranks was applied. Only parameters that are statistically different from each other are presented. (Significant differences at p<0.05).
| |
Ctrl |
De |
Re |
| F0 |
9572.4±297.8 |
9811.1±260.1 |
10682.1±238.2 |
| Fv/F0 |
5.18±0.07 |
5.17±0.08 |
4.7±0.1 |
| Vj |
0.48±0.007 |
0.49±0.006 |
0.55±0.008 |
| Vi |
0.83±0.005 |
0.84±0.004 |
0.88±0.007 |
| φ(p0) |
0.84±0.002 |
0.84±0.002 |
0.82±0.003 |
| ψ0 |
0.52±0.007 |
0.51±0.006 |
0.48±0.008 |
| ABS/RC |
2.44±0.04 |
2.53±0.04 |
2.61±0.04 |
| TR0/RC |
2.05±0.03 |
2.11±0.03 |
2.17±0.03 |
| ET0/RC |
1.05±0.02 |
1.08±0.01 |
0.96±0.02 |
| DI0/RC |
0.39±0.01 |
0.41±0.01 |
0.46±0.01 |
| ϕE0 |
0.43±0.006 |
0.43±0.006 |
0.35±0.007 |
| ϕD0 |
0.16±0.002 |
0.16±0.002 |
0.17±0.003 |
| PI(abs) |
2.30±0.1 |
2.23±0.1 |
1.39±0.08 |