Submitted:
18 January 2025
Posted:
20 January 2025
You are already at the latest version
Abstract
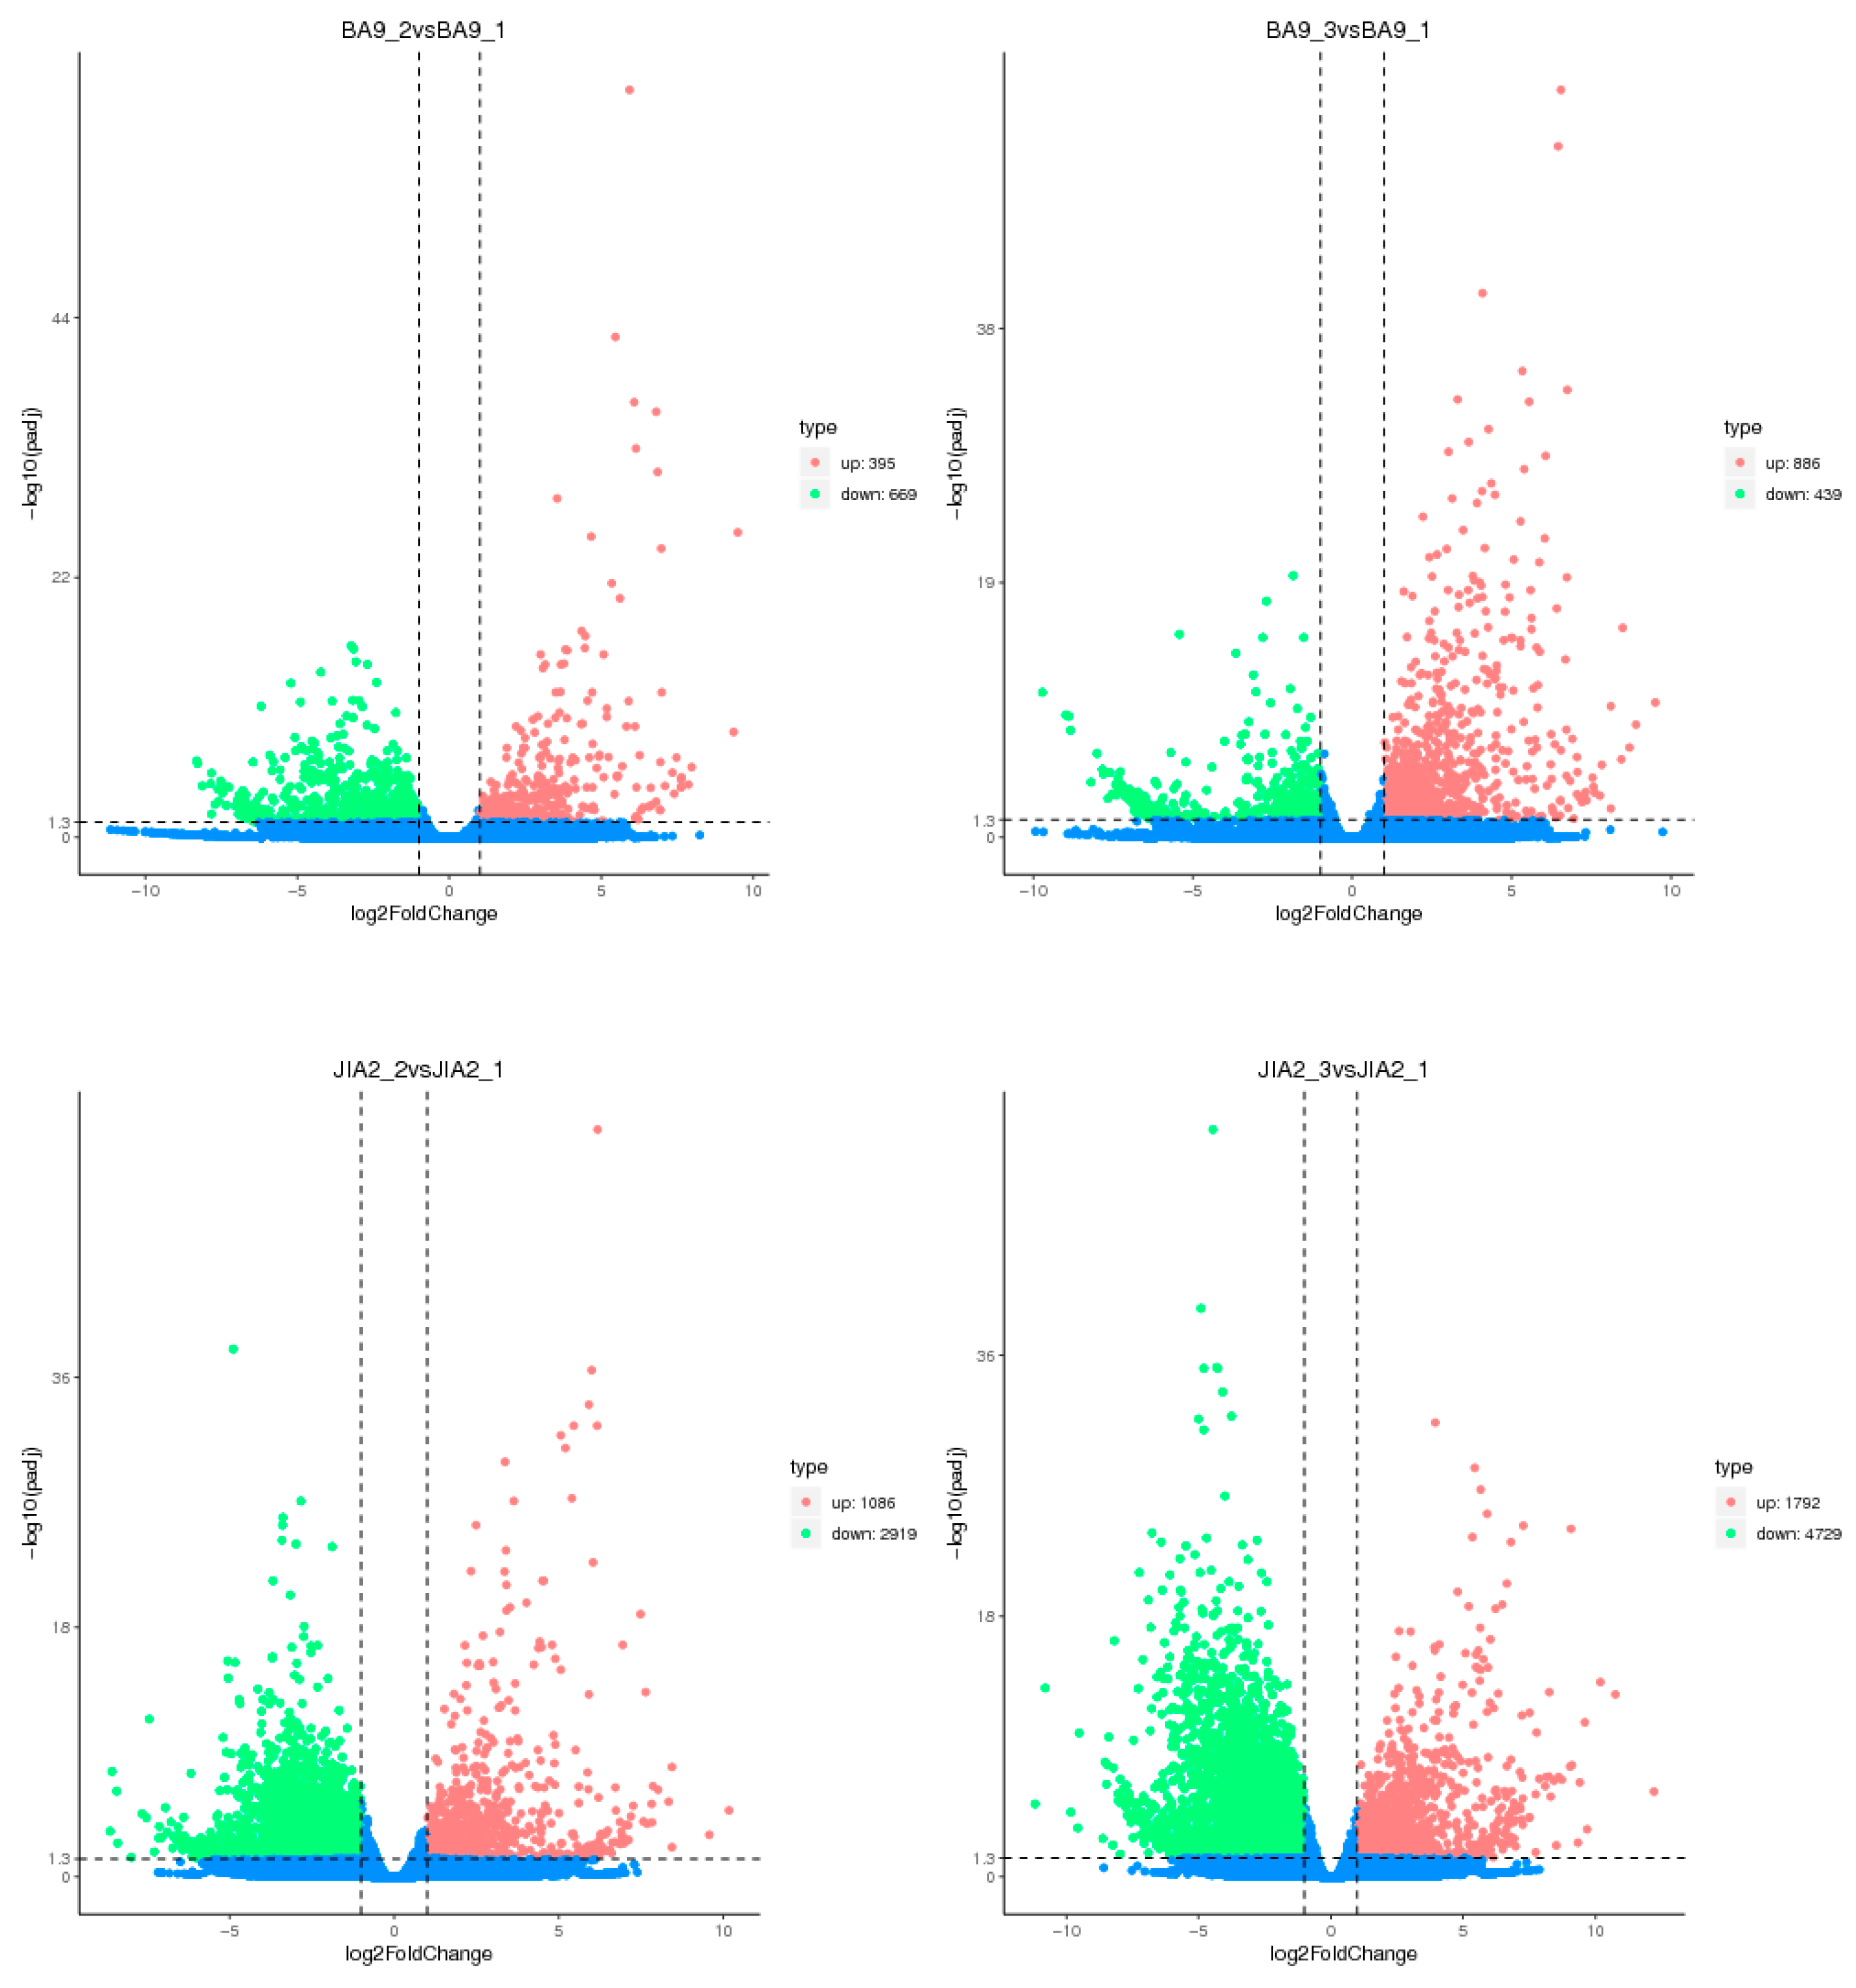
Oat is a crop and forage species with rich nutritional value, capable of adapting to various harsh growing environments, including dry and poor soils. It plays an important role in agricultural production and sustainable development. However, the molecular mechanisms underlying the response of oat to drought stress remain unclear, warranting further research. In this study, we conducted a pot experiment with drought-resistant cultivar JiaYan 2 (JIA2) and water-sensitive cultivar BaYou 9 (BA9) during the booting stage under three water gradient treatments: 30% field capacity (severe stress), 45% field capacity (moderate stress) and 70% field capacity (normal water supply). After 7 days of stress, root samples were collected for transcriptome and proteome analyses. Transcriptome analysis revealed that under moderate stress, JIA2 upregulated 1086 differential genes and downregulated 2919 differential genes, while under severe stress, it upregulated 1792 differential genes and downregulated 4729 differential genes. Under moderate stress, BA9 exhibited an upregulation of 395 differential genes, a downregulation of 669, and an upregulation of 886 differential genes and 439 downregulations under severe stress. In drought stress, most of the differentially expressed genes (DEGs) specific to JIA2 were downregulated, mainly involving redox reactions, carbohydrate metabolism, plant hormone signal regulation, and secondary metabolism. Proteomic analysis revealed that under moderate stress, 489 differential proteins were upregulated, and 394 were downregulated. Under severe stress, 493 differential proteins were upregulated, and 701 were downregulated. In BA9, 590 and 397 differential proteins were upregulated under moderate stress, with 126 and 75 upregulated differential proteins under severe stress. Correlation analysis between transcriptomics and proteomics demonstrated that compared with CK, four types of differentially expressed proteins (DEPs) were identified in the JIA2 differential gene-protein interaction network analysis under severe stress. These included 13 key cor DEGs and DEPs related to plant hormone signal transduction, biosynthesis of secondary metabolites, carbohydrate metabolism processes, and metabolic pathways. The consistency of gene and protein expression was validated using qRT-PCR, indicating their key role in the strong drought resistance of JIA2.
Keywords:
1. Introduction
2. Results
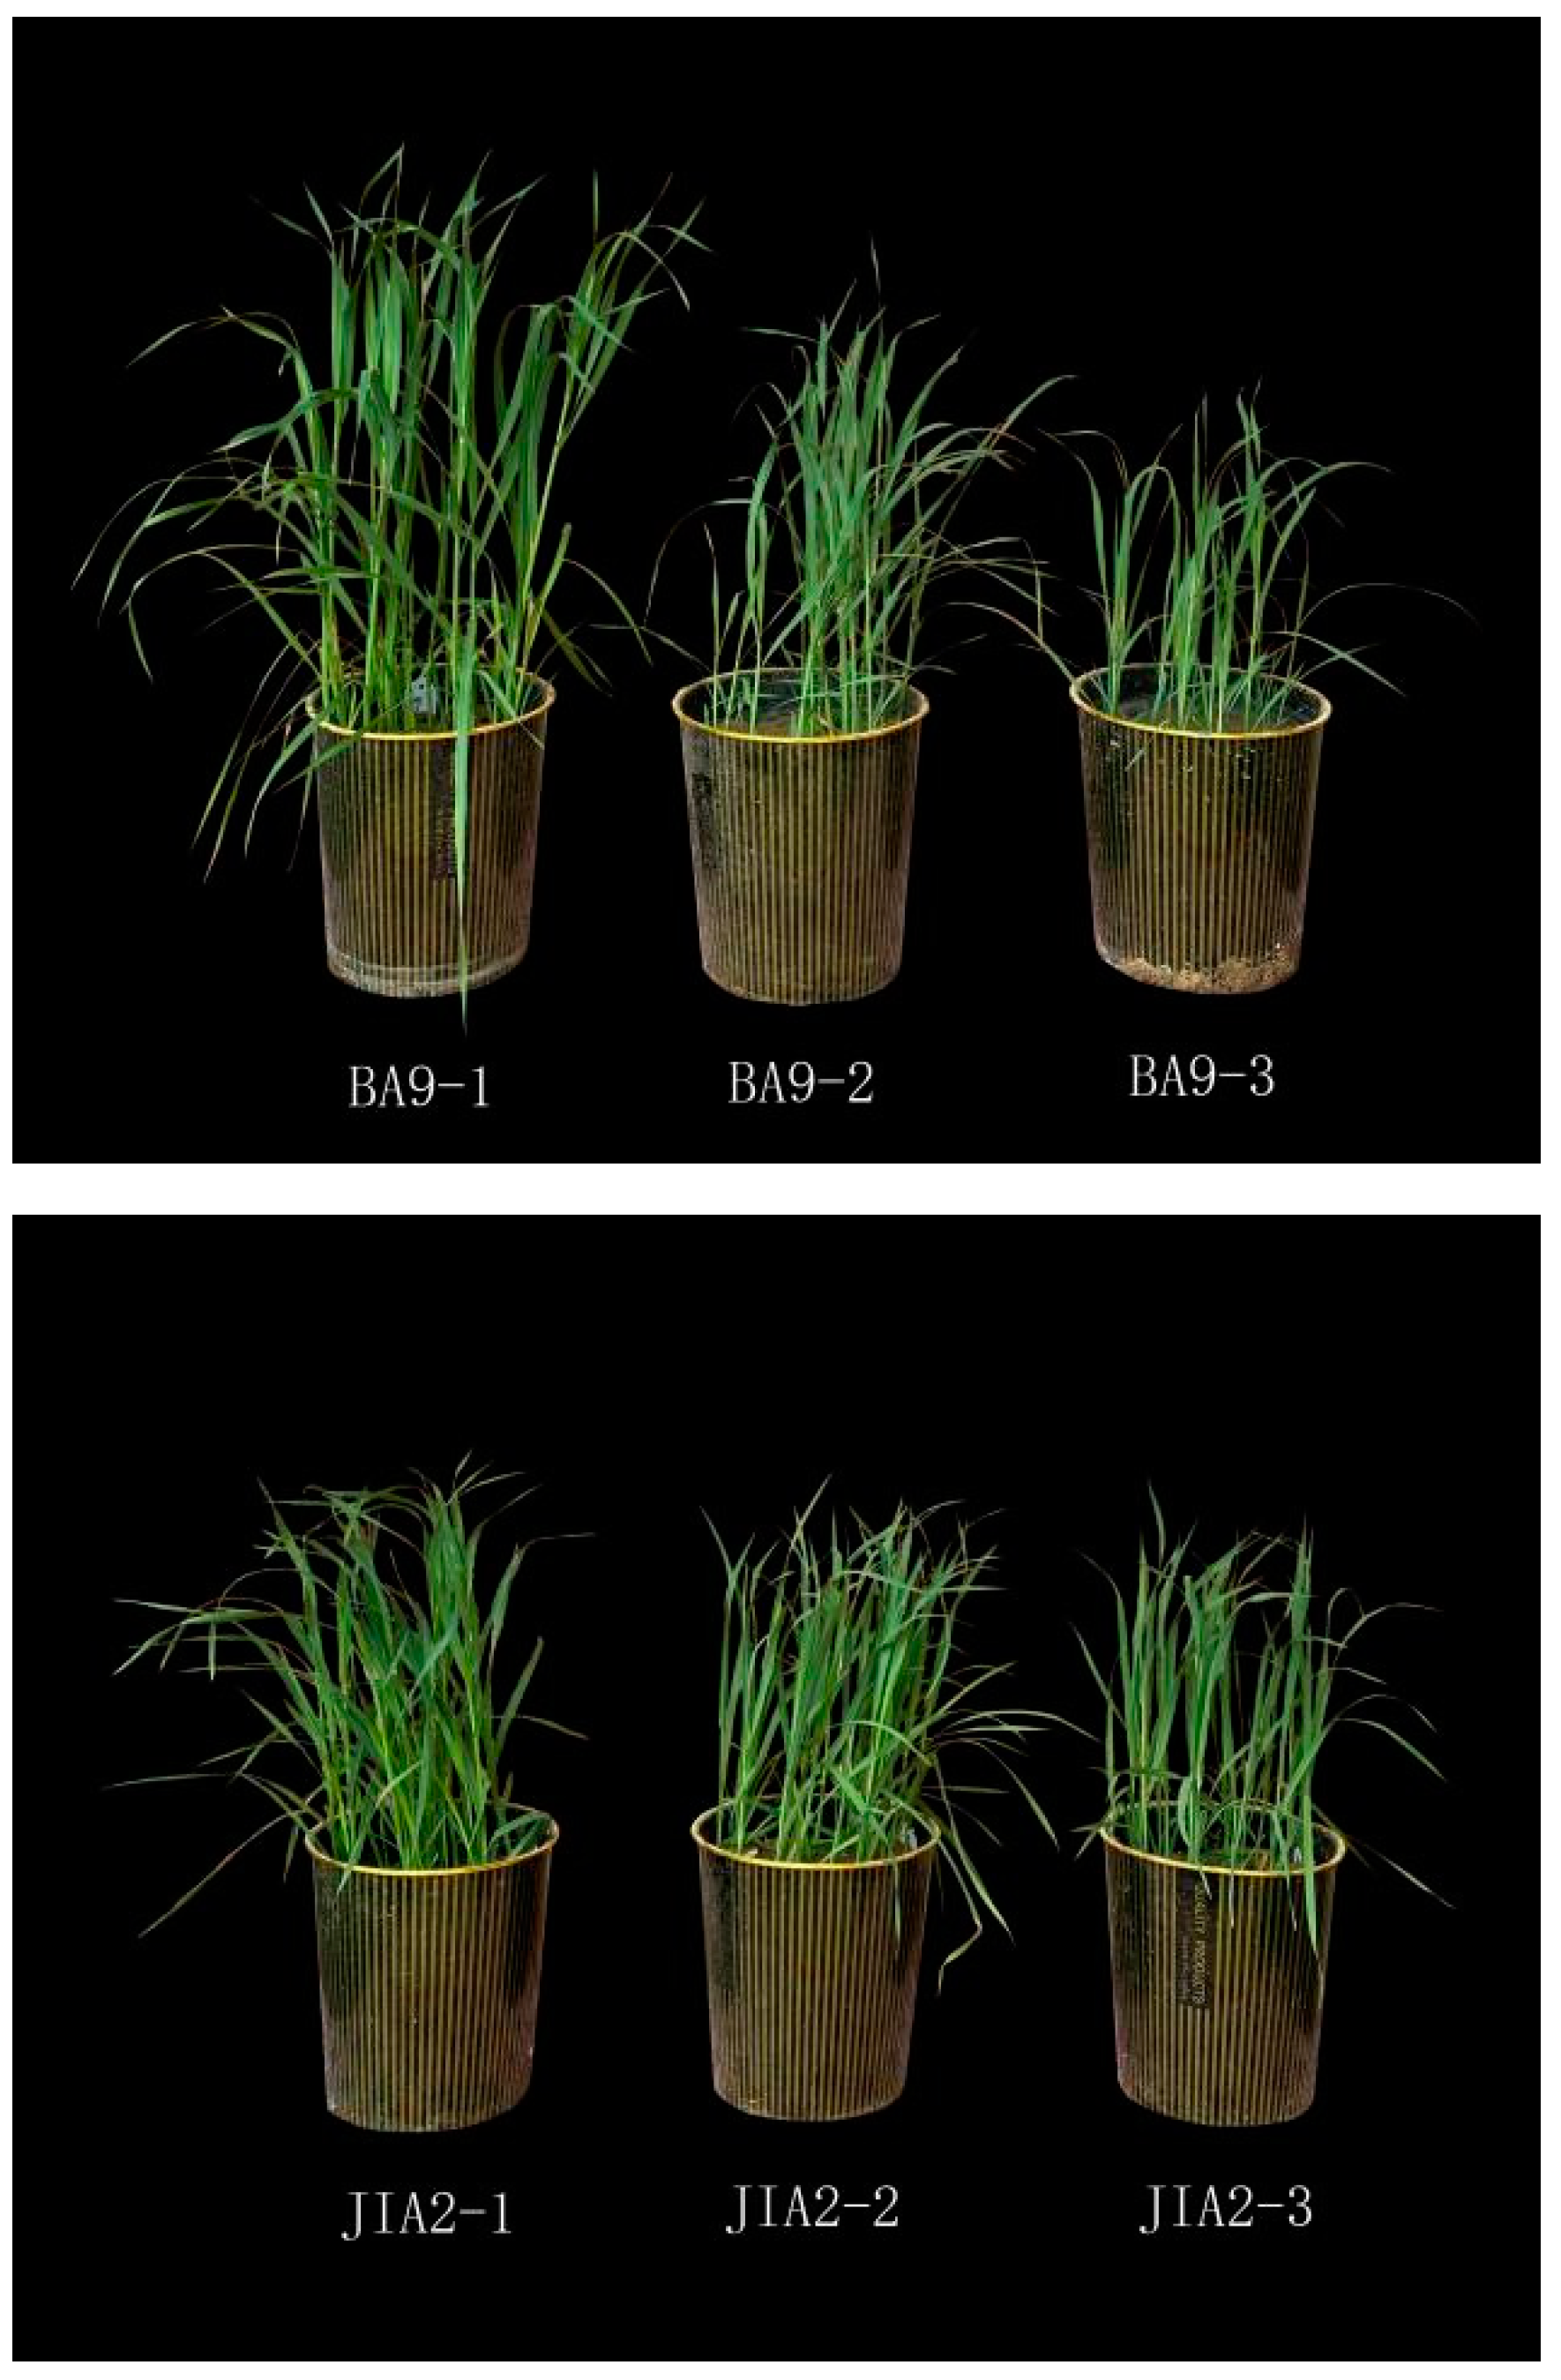
2.1. Effects of Drought Stress on Growth Between Two Oat Cultivars
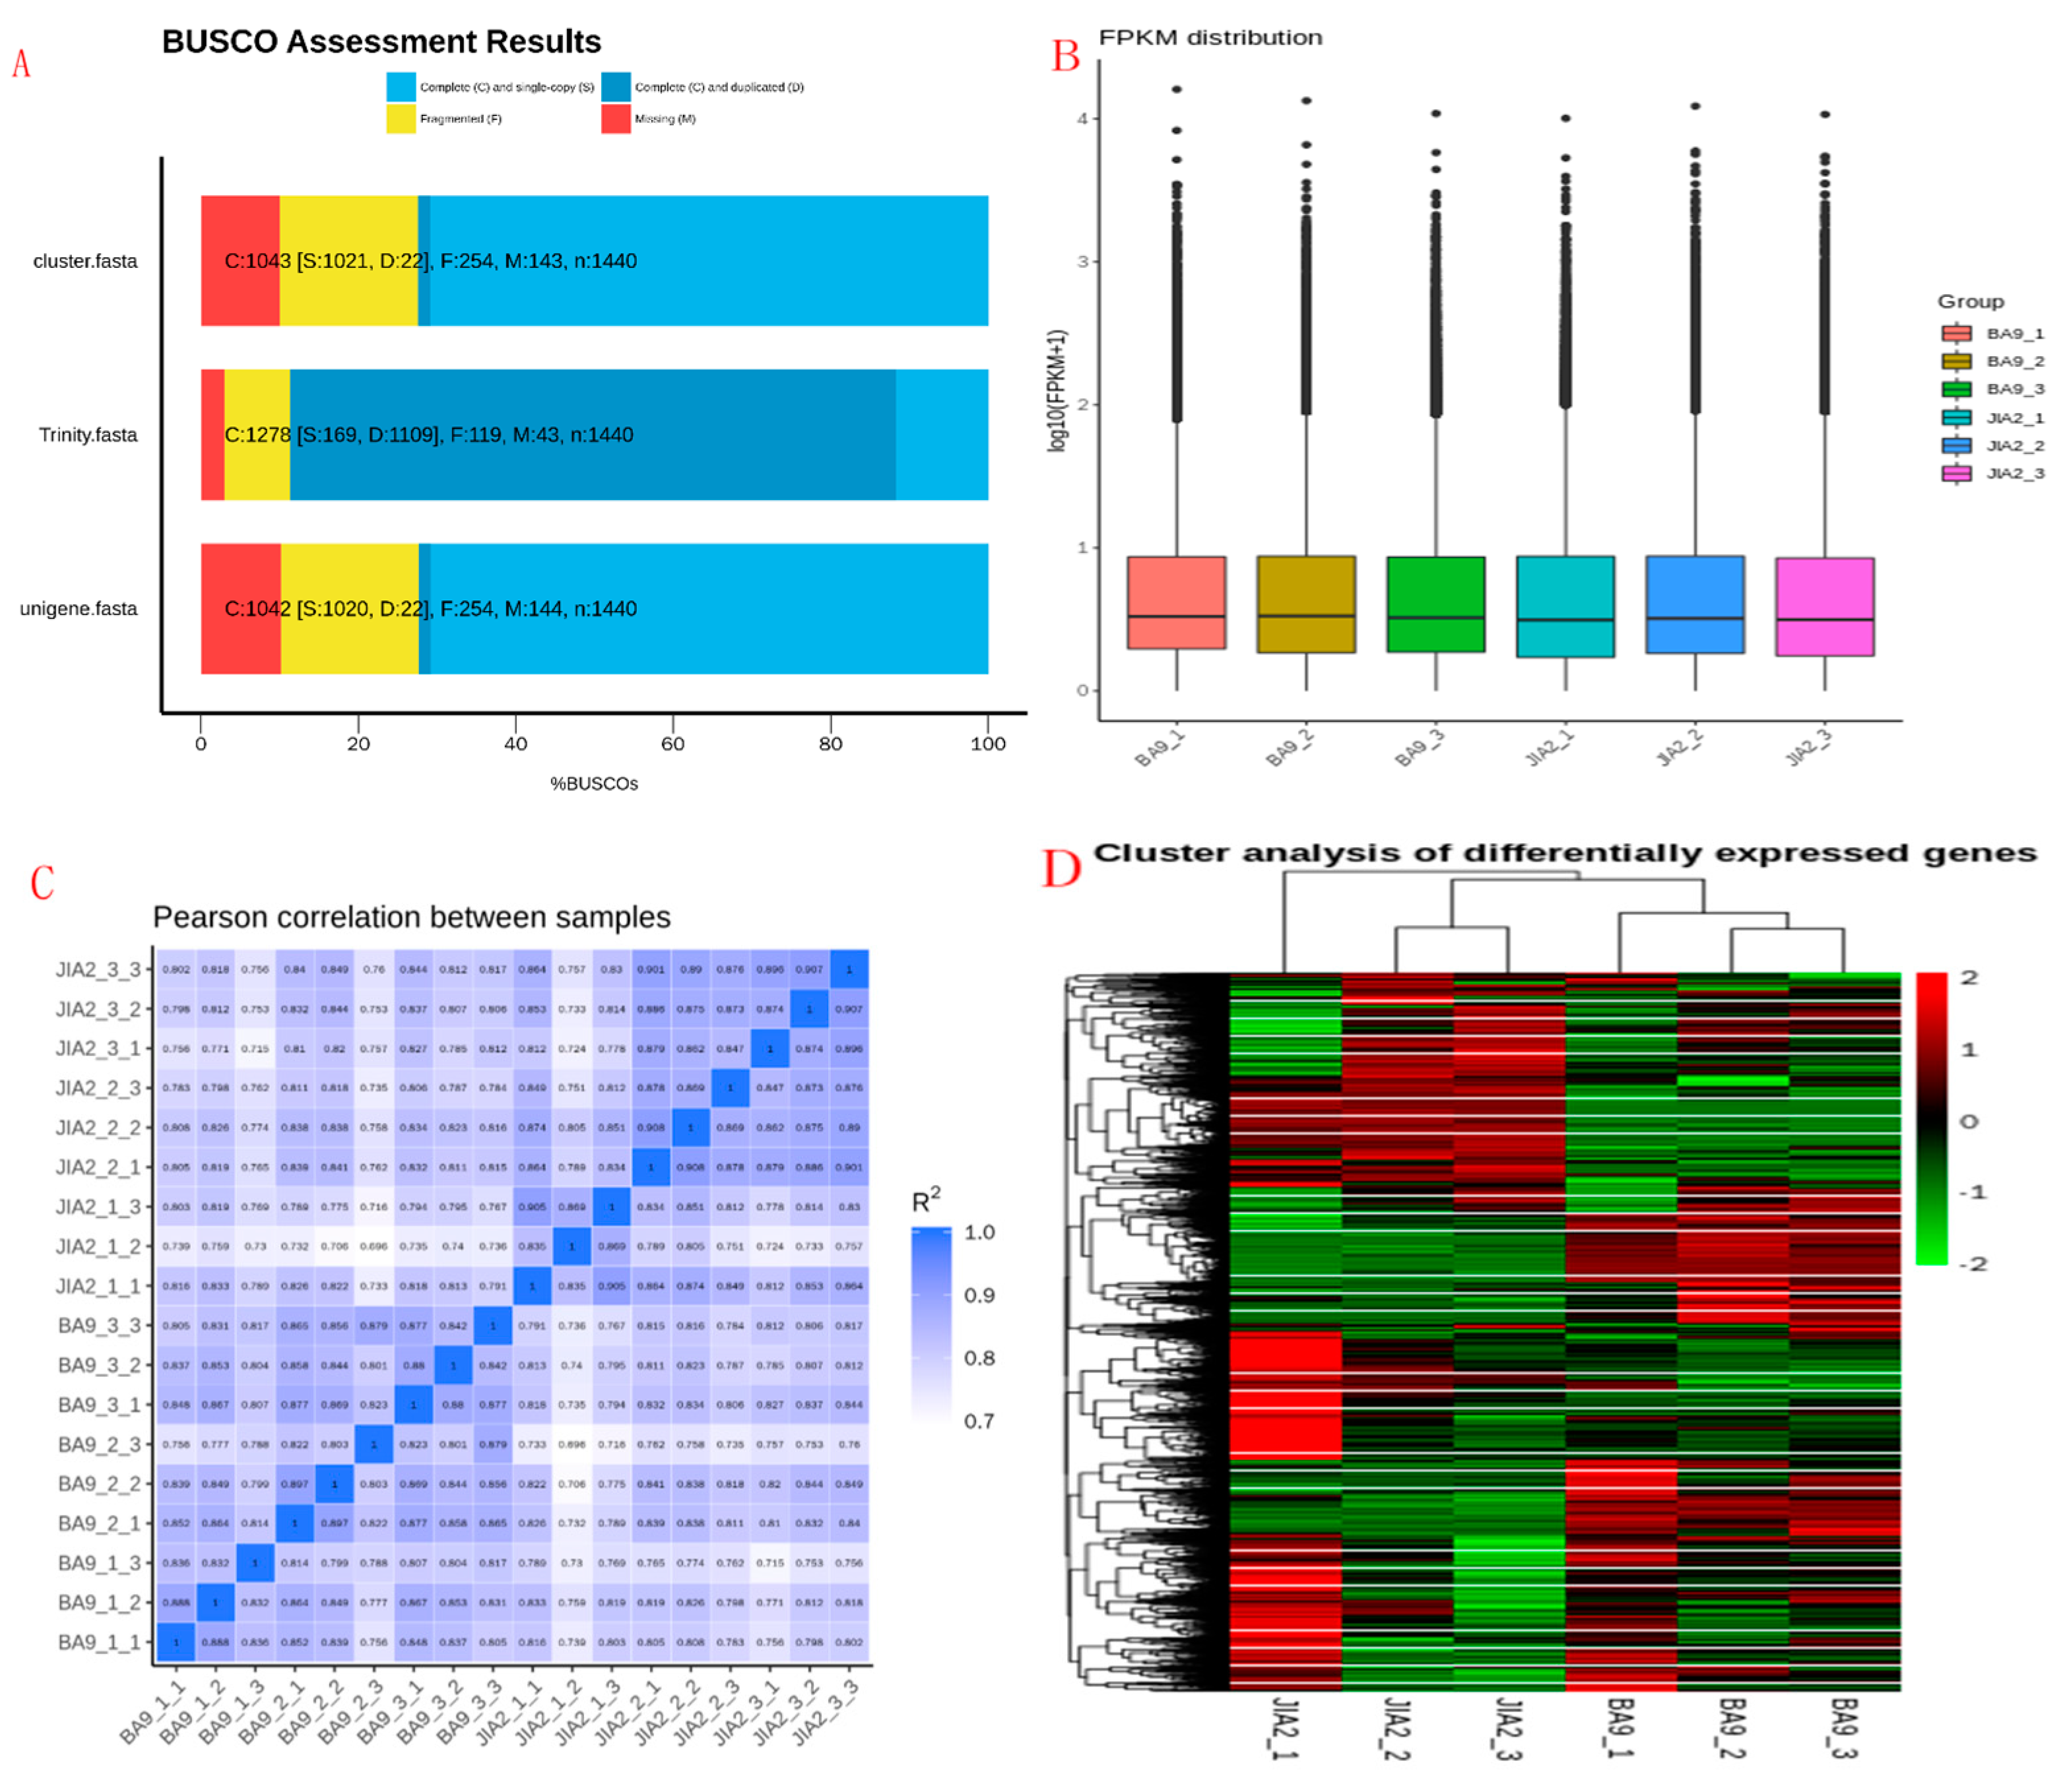
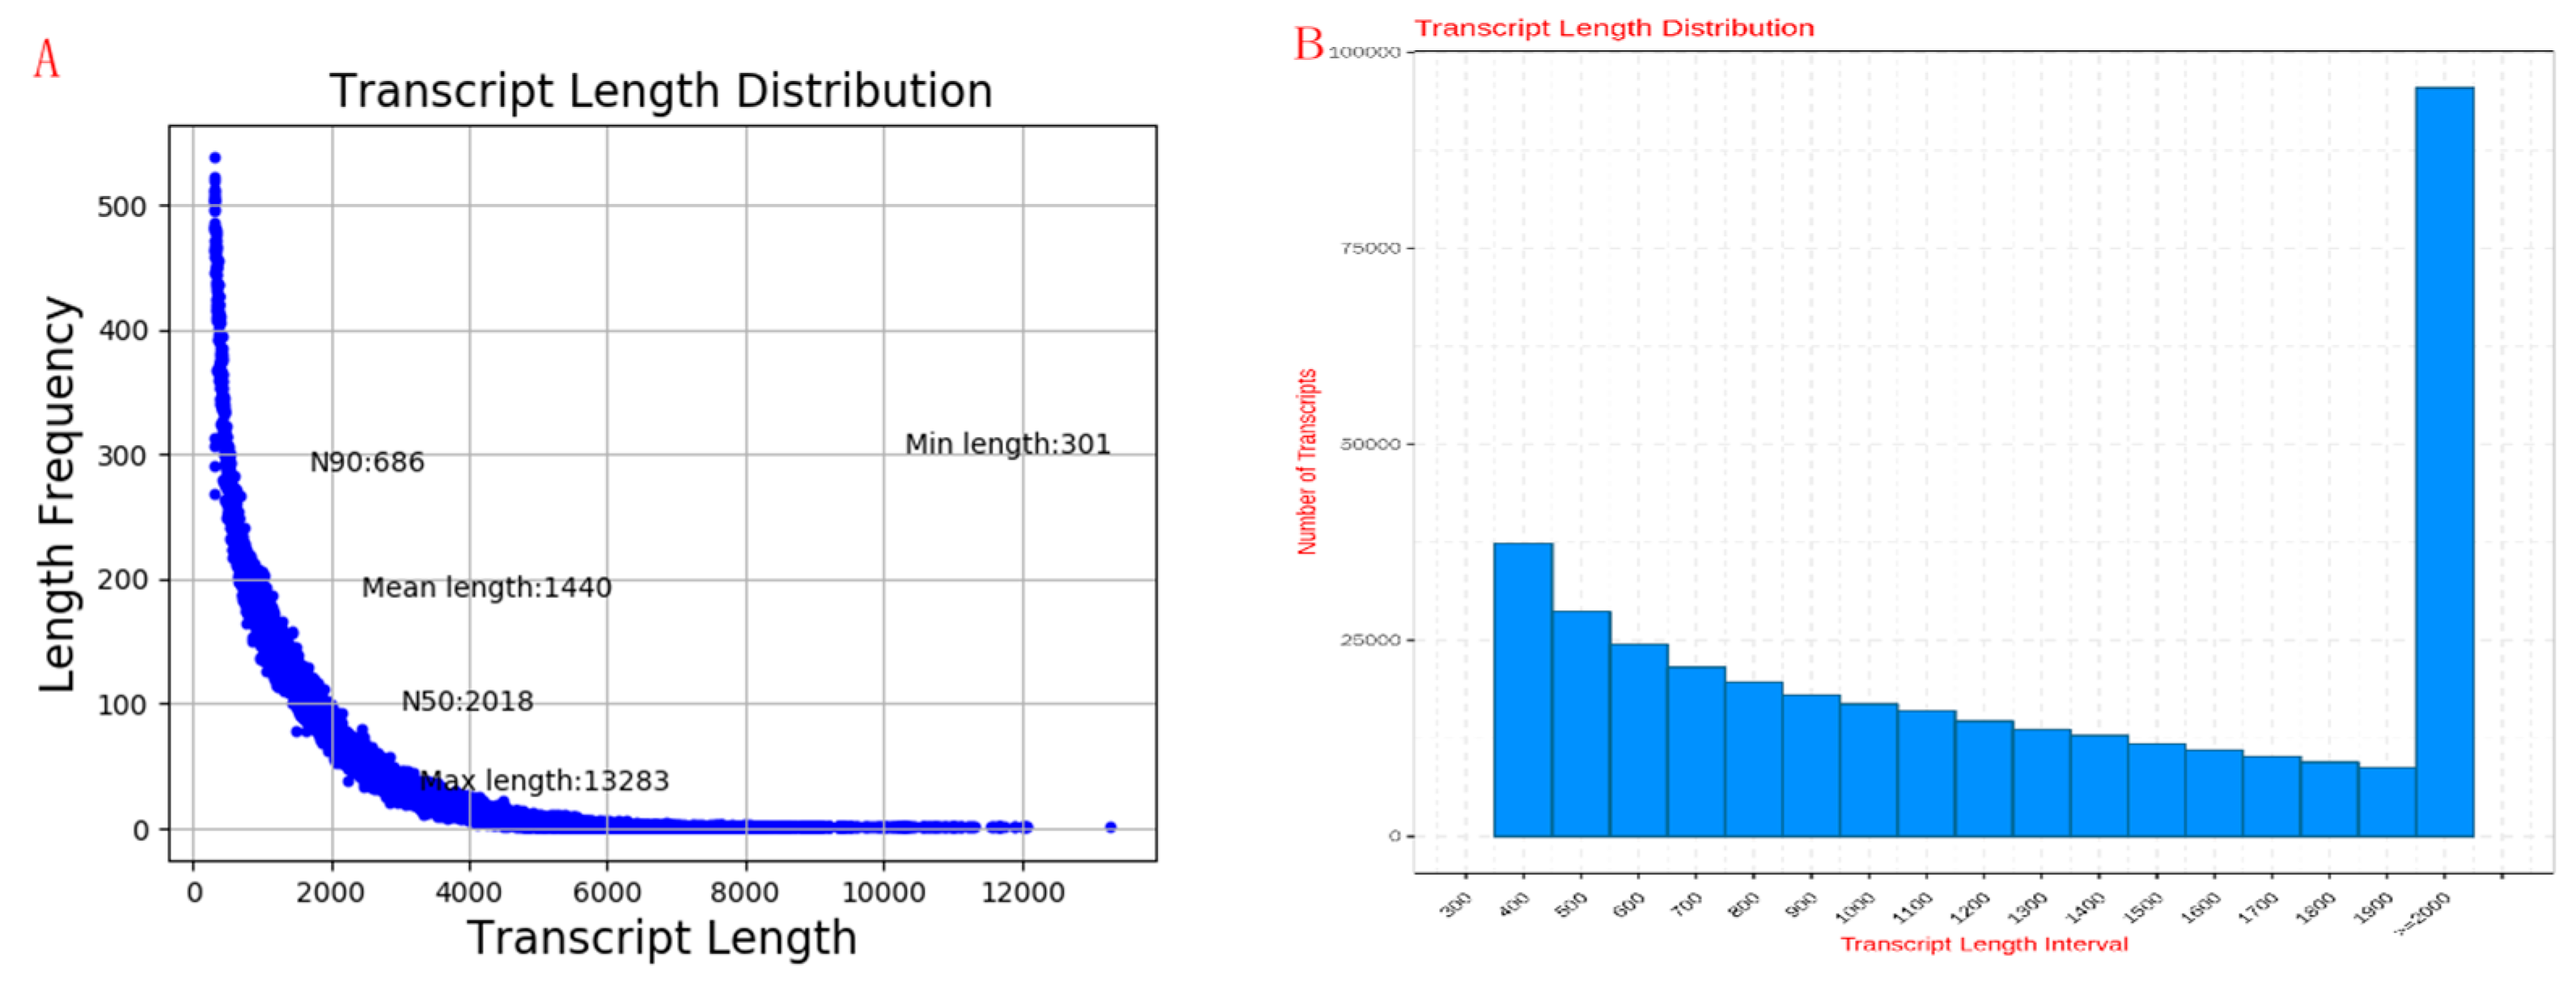
2.2. Transcriptome Sequencing Data Quality Control and Transcriptome Analysis
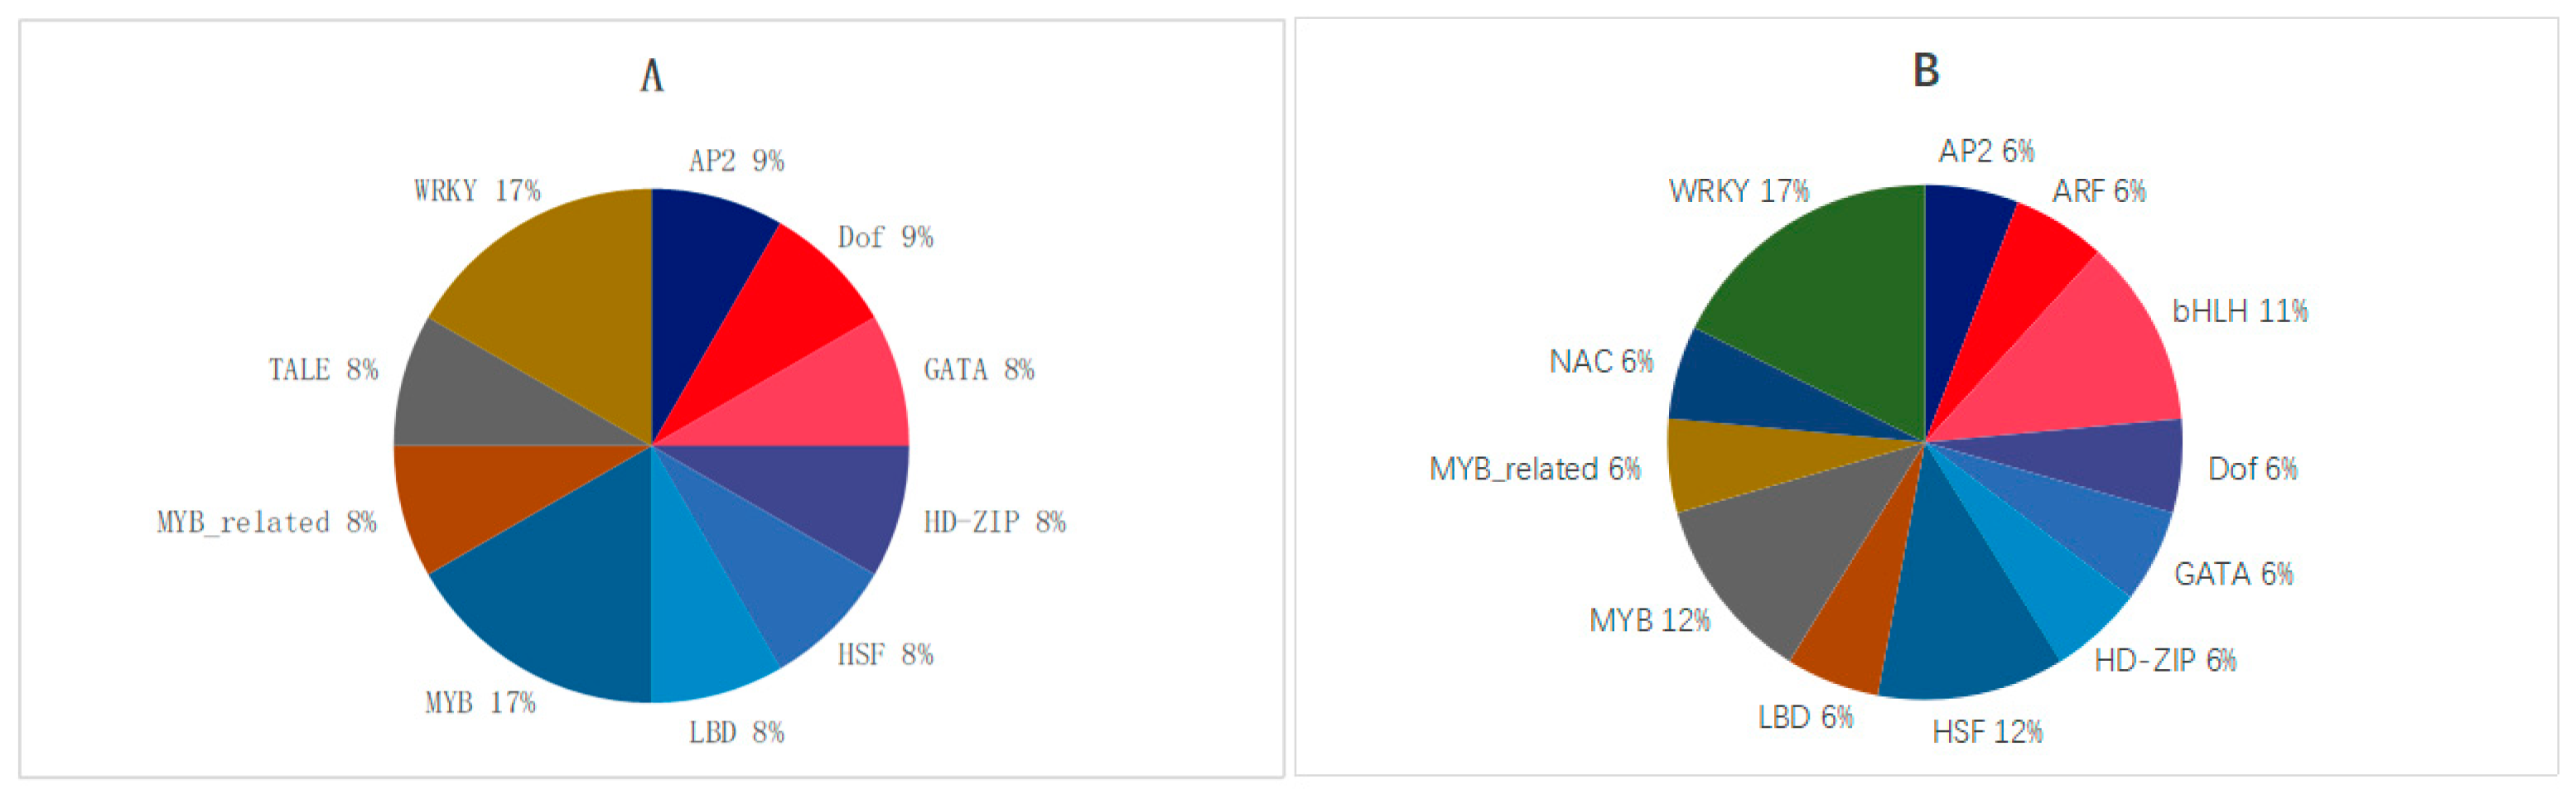
2.3. Annotations of Transcription Factors in Oat Roots with Different Drought Resistance Under Drought Stress
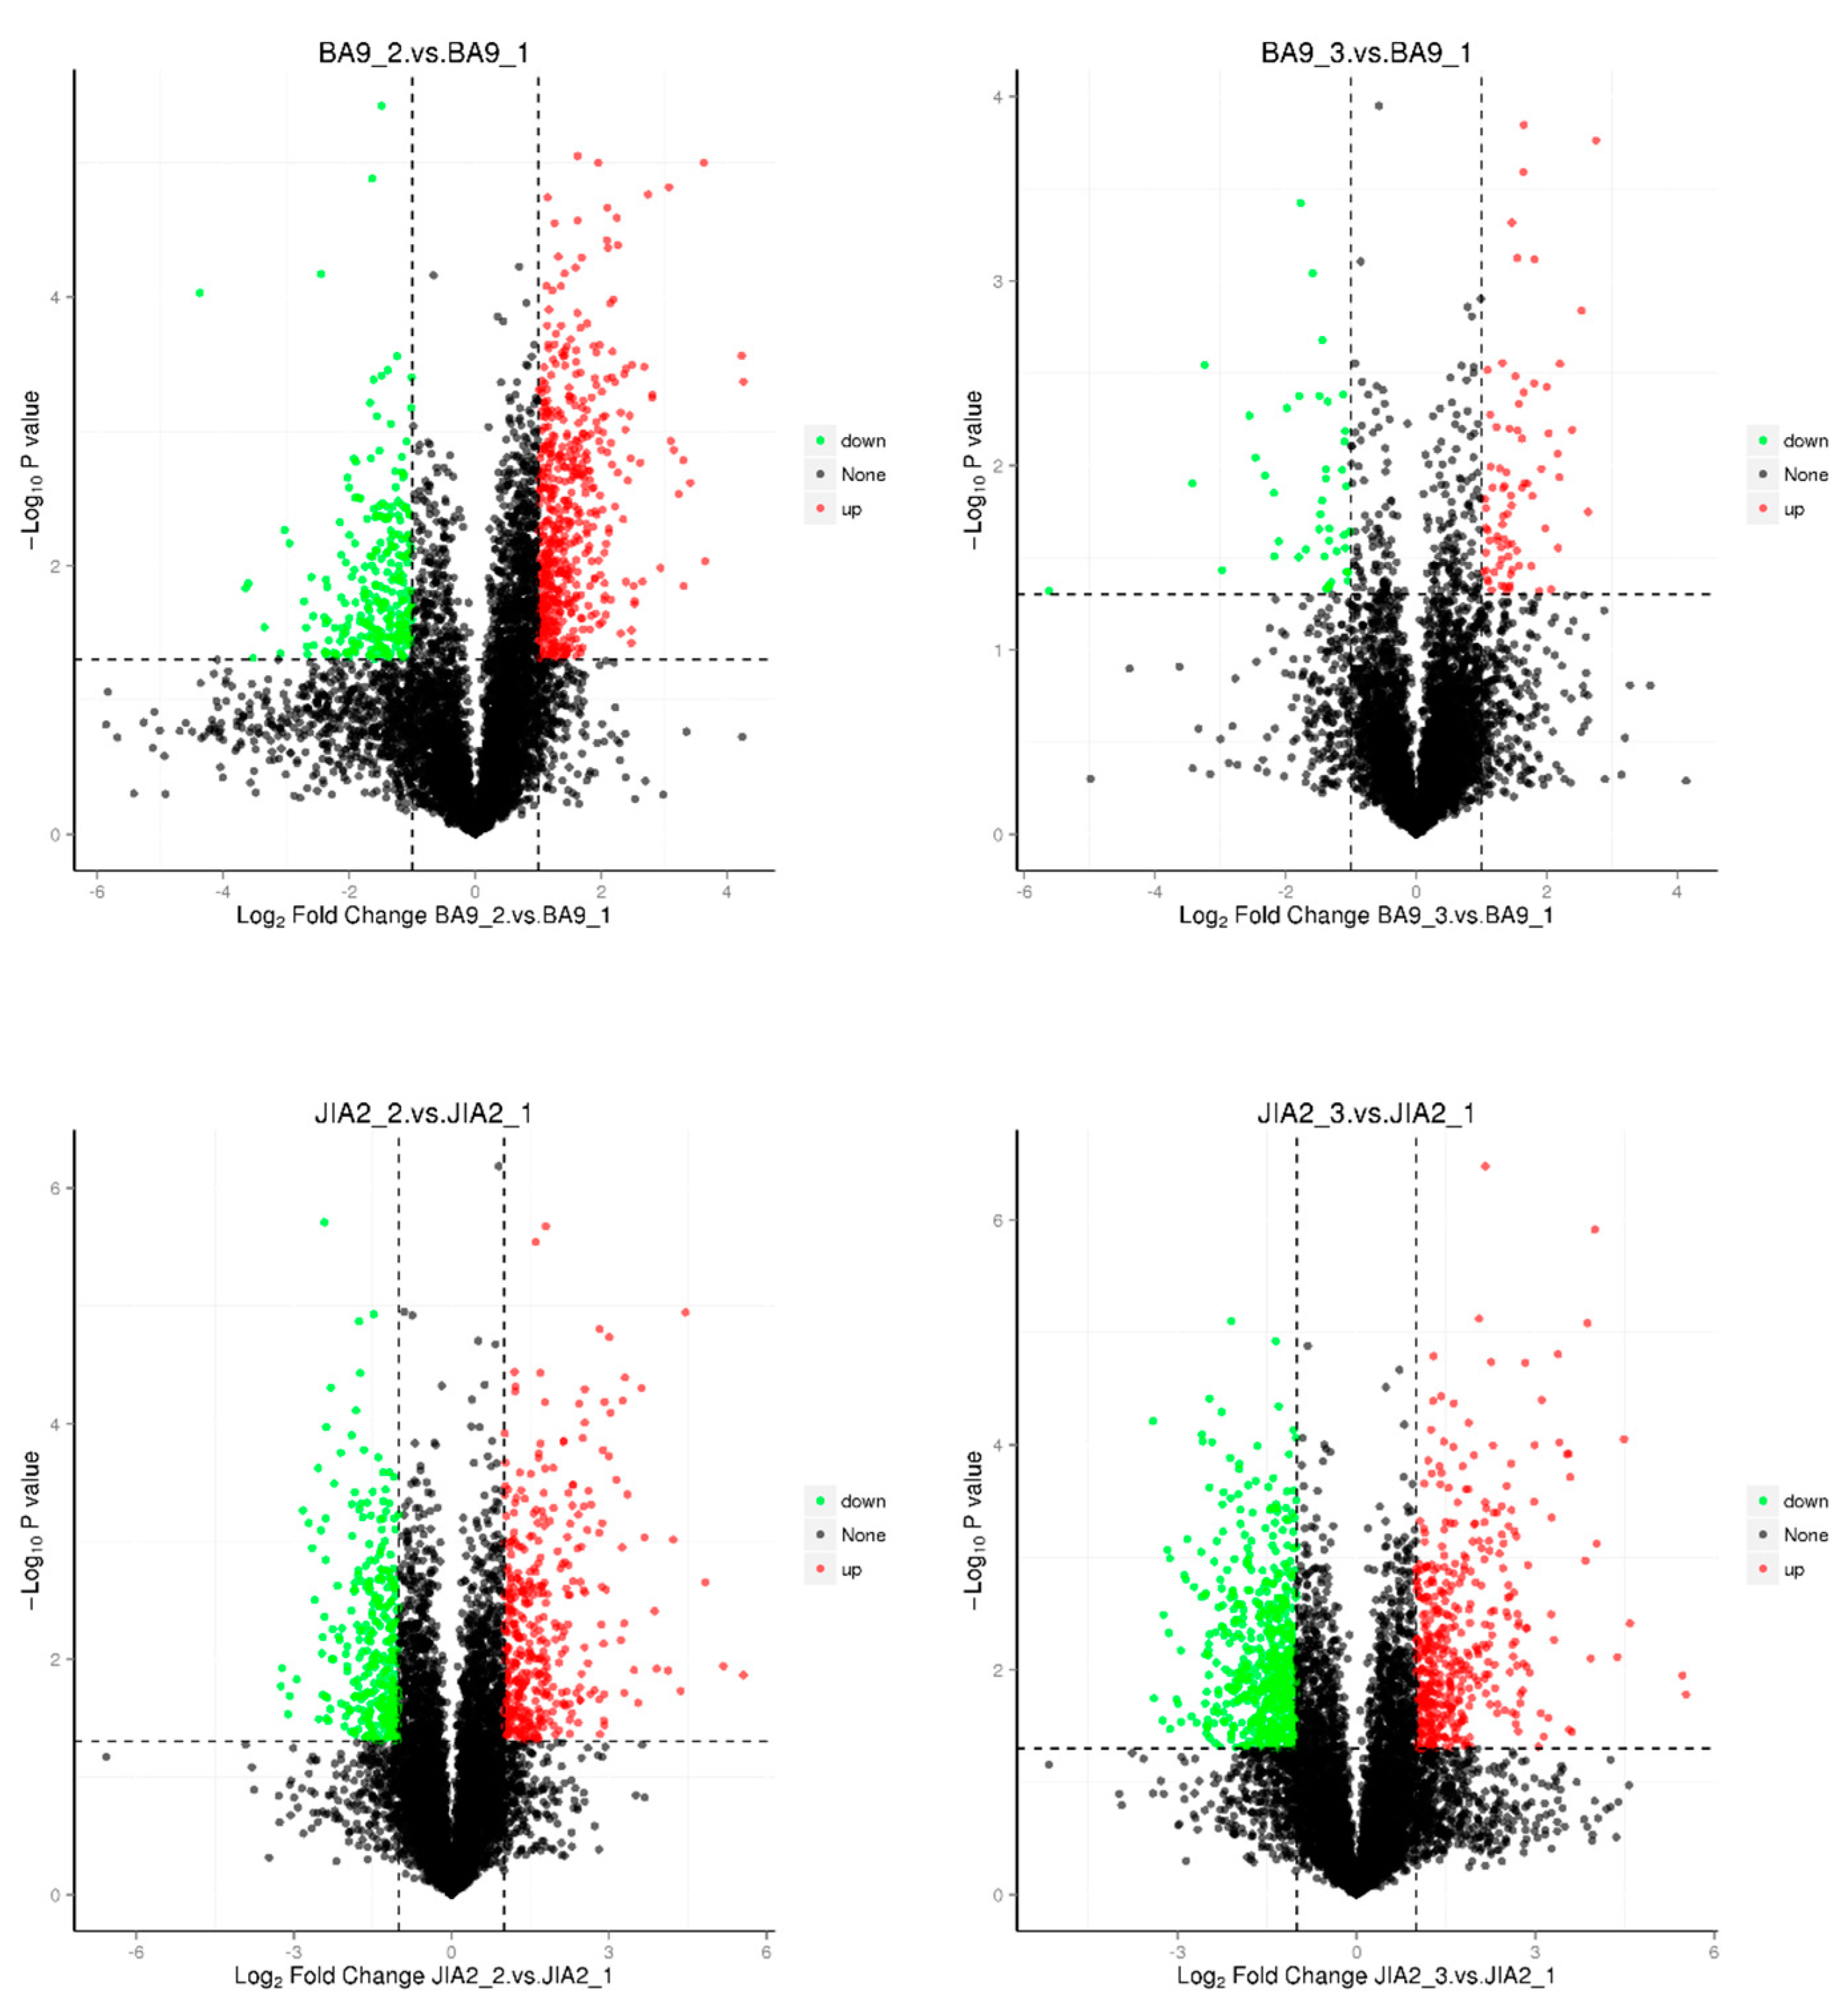
2.4. Identification of DEGs in Oats with Different Drought Resistance Under Drought Stress
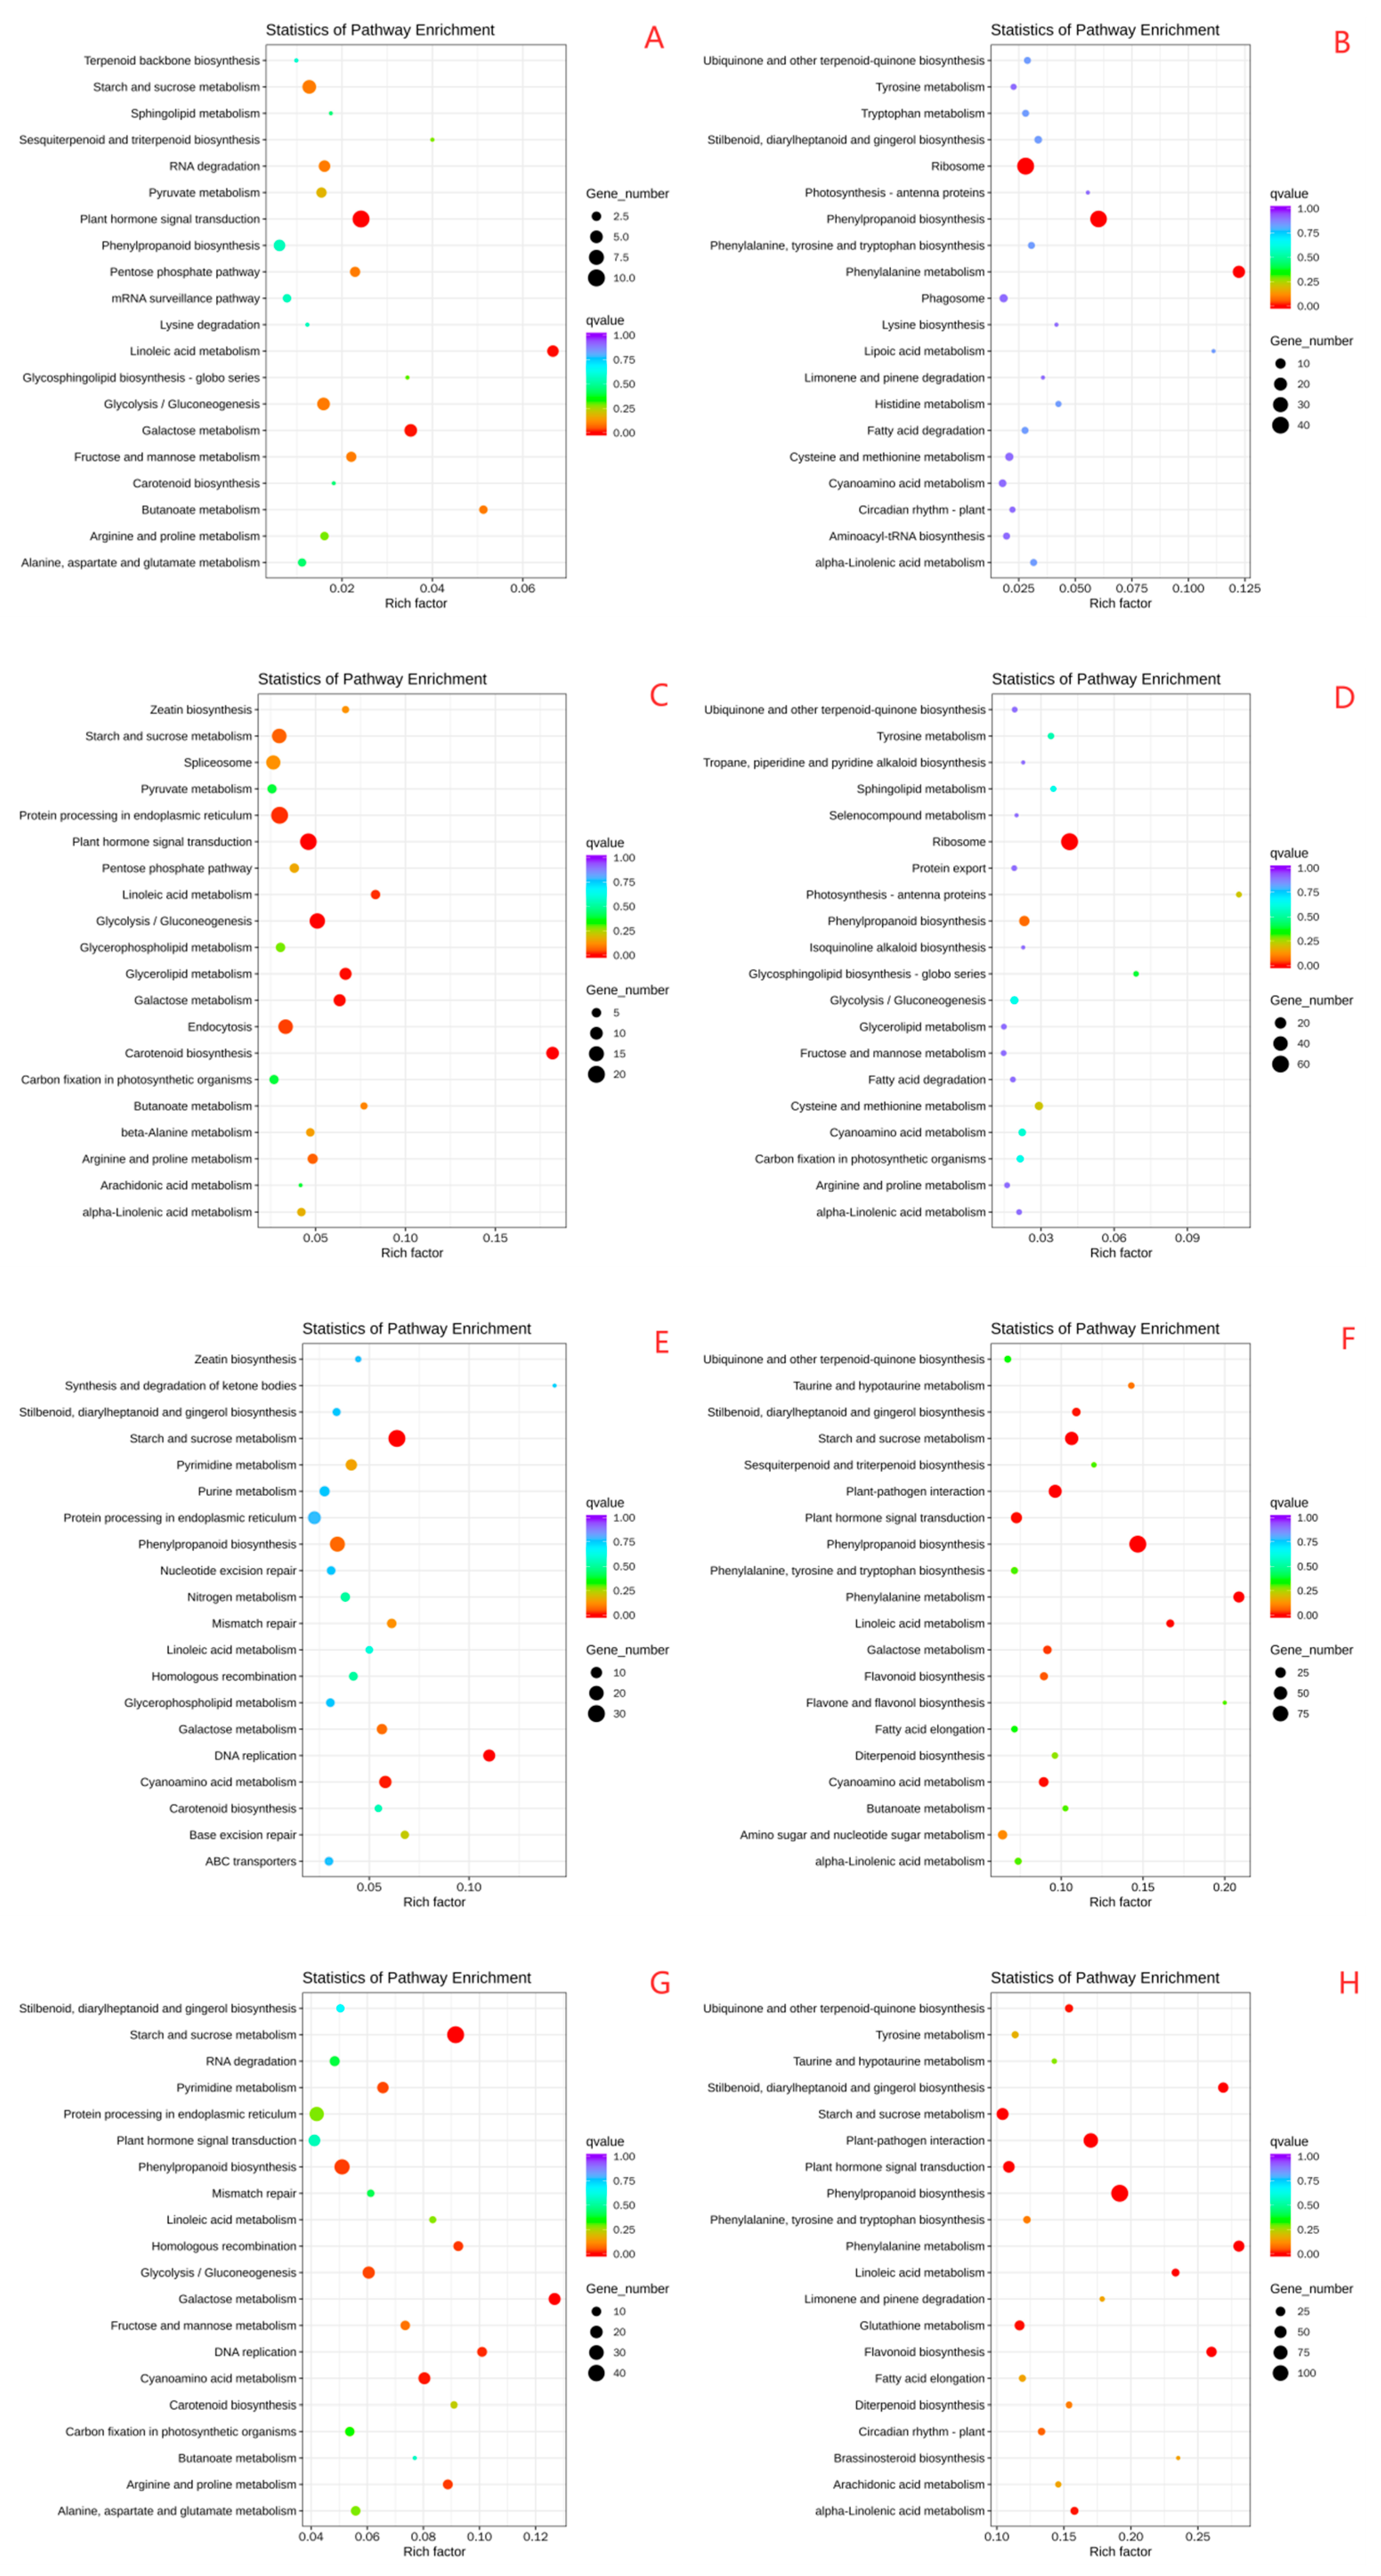
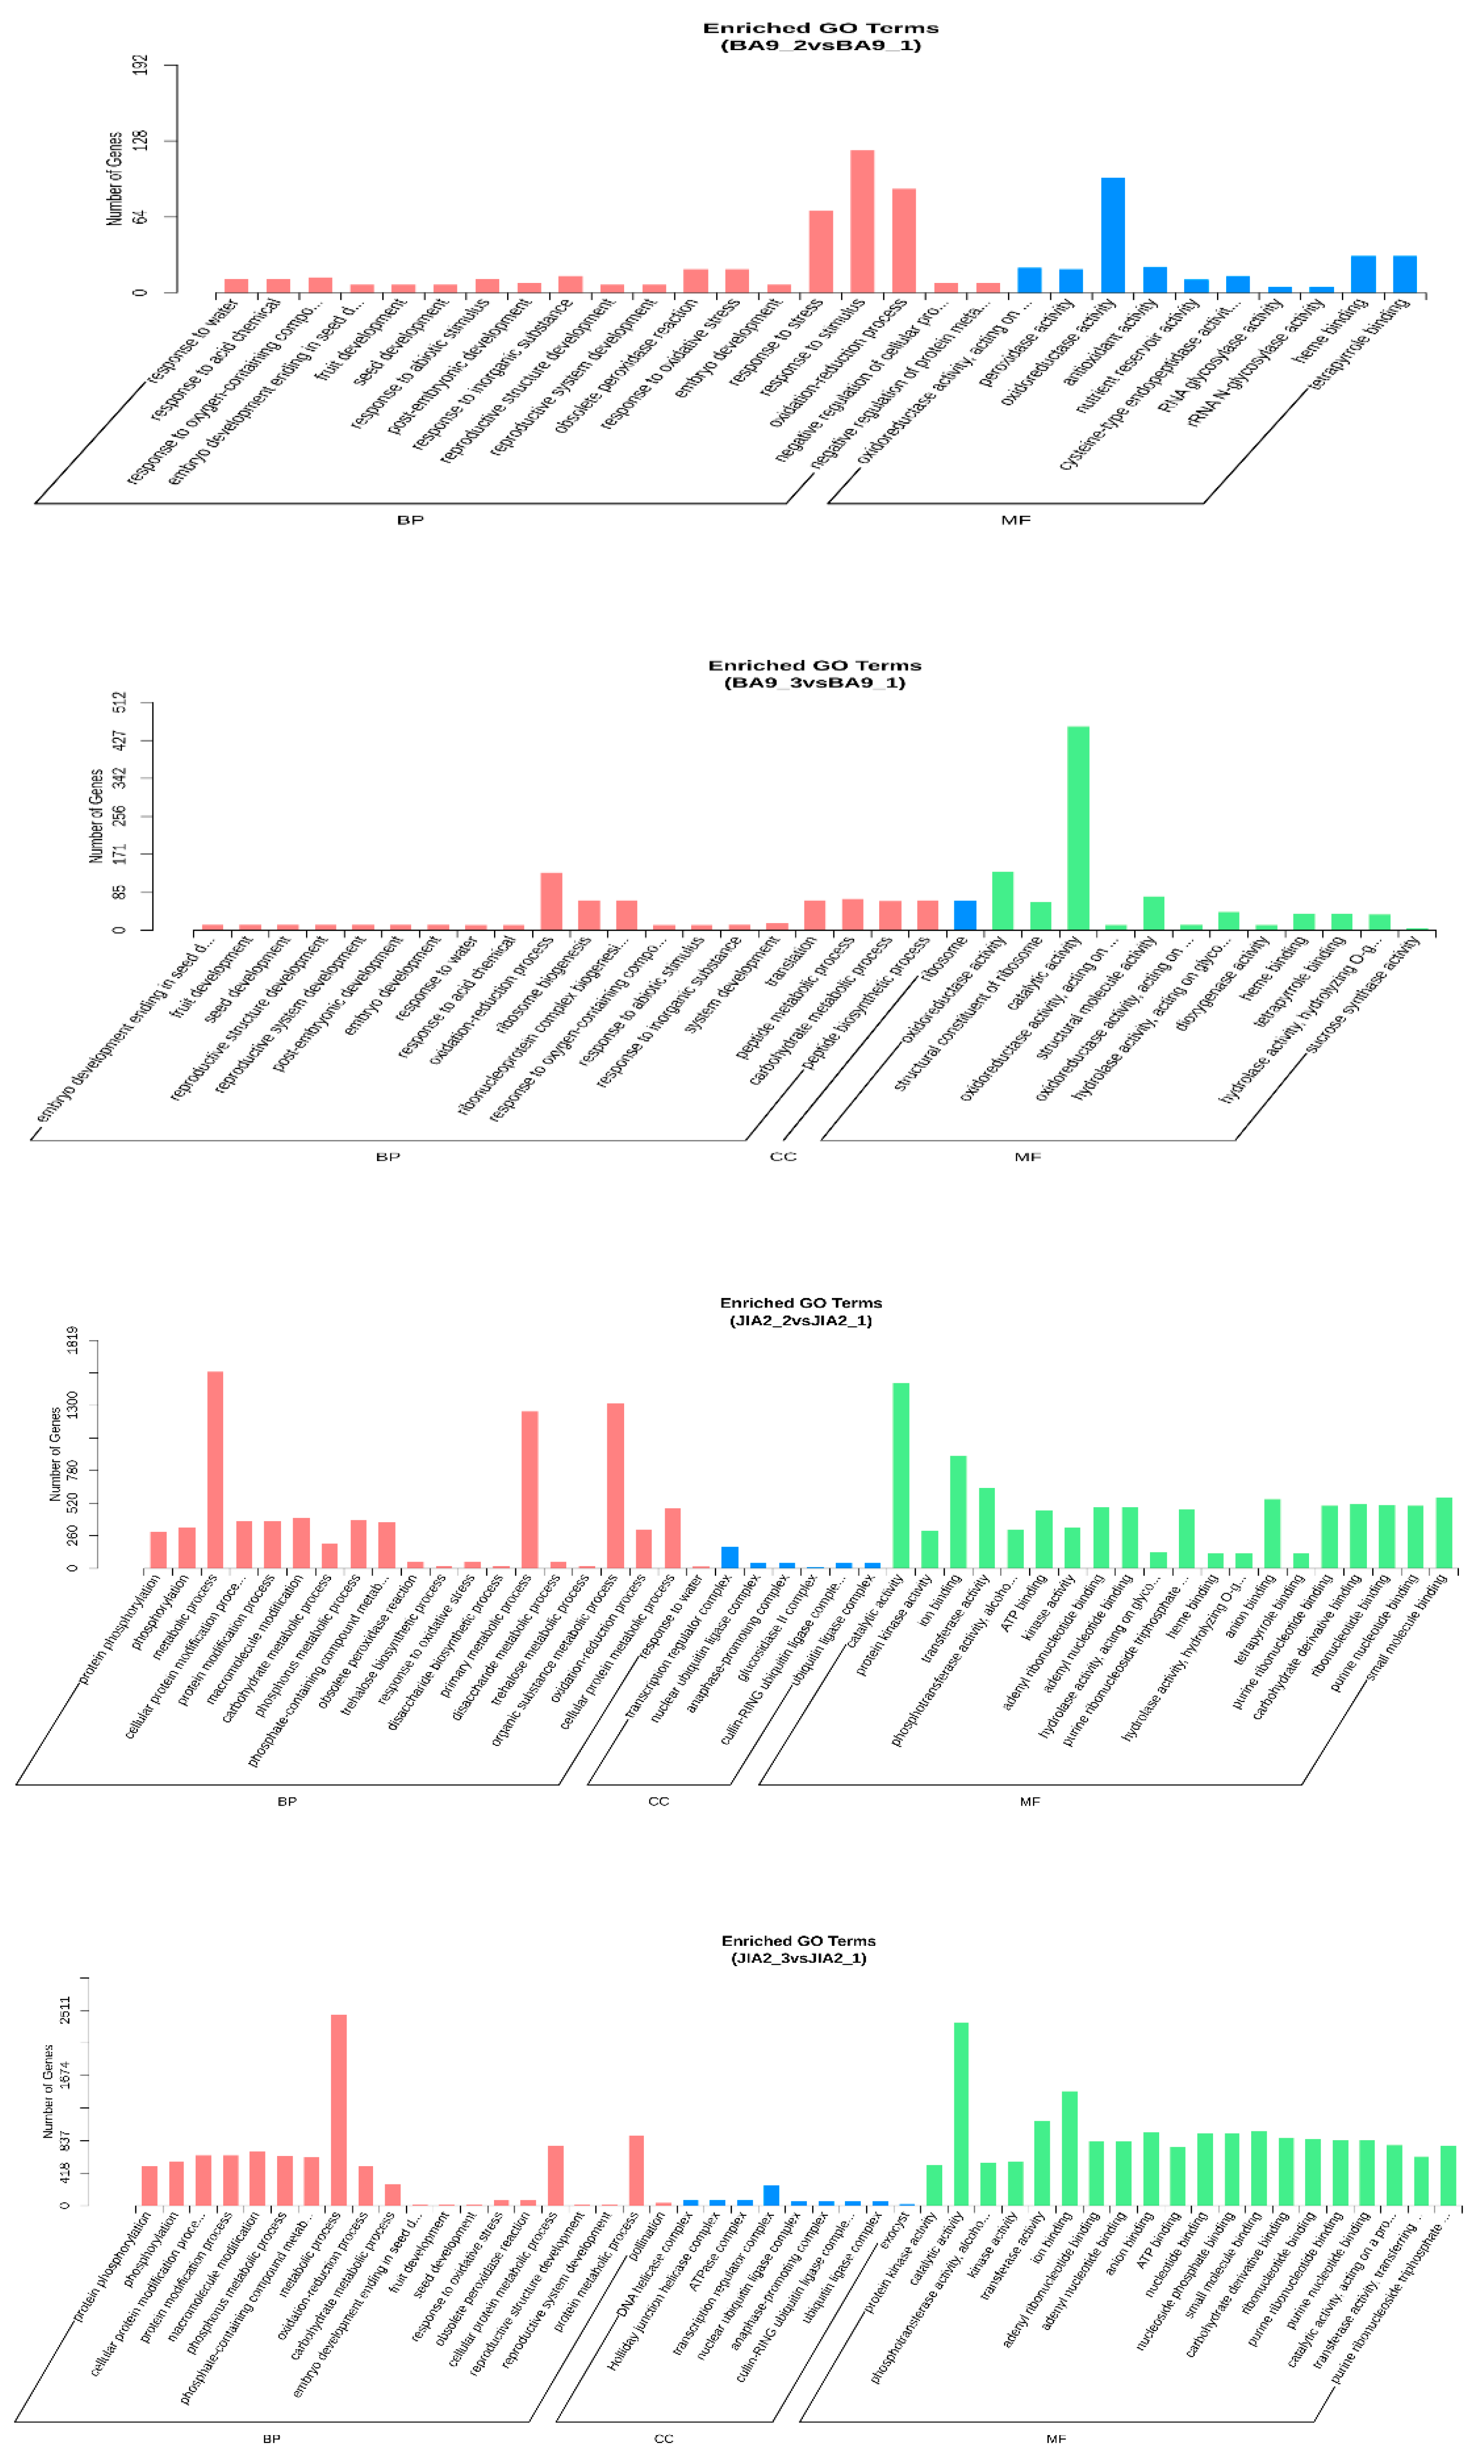
2.5. GO and KEGG Enrichment Analyses of DEGs
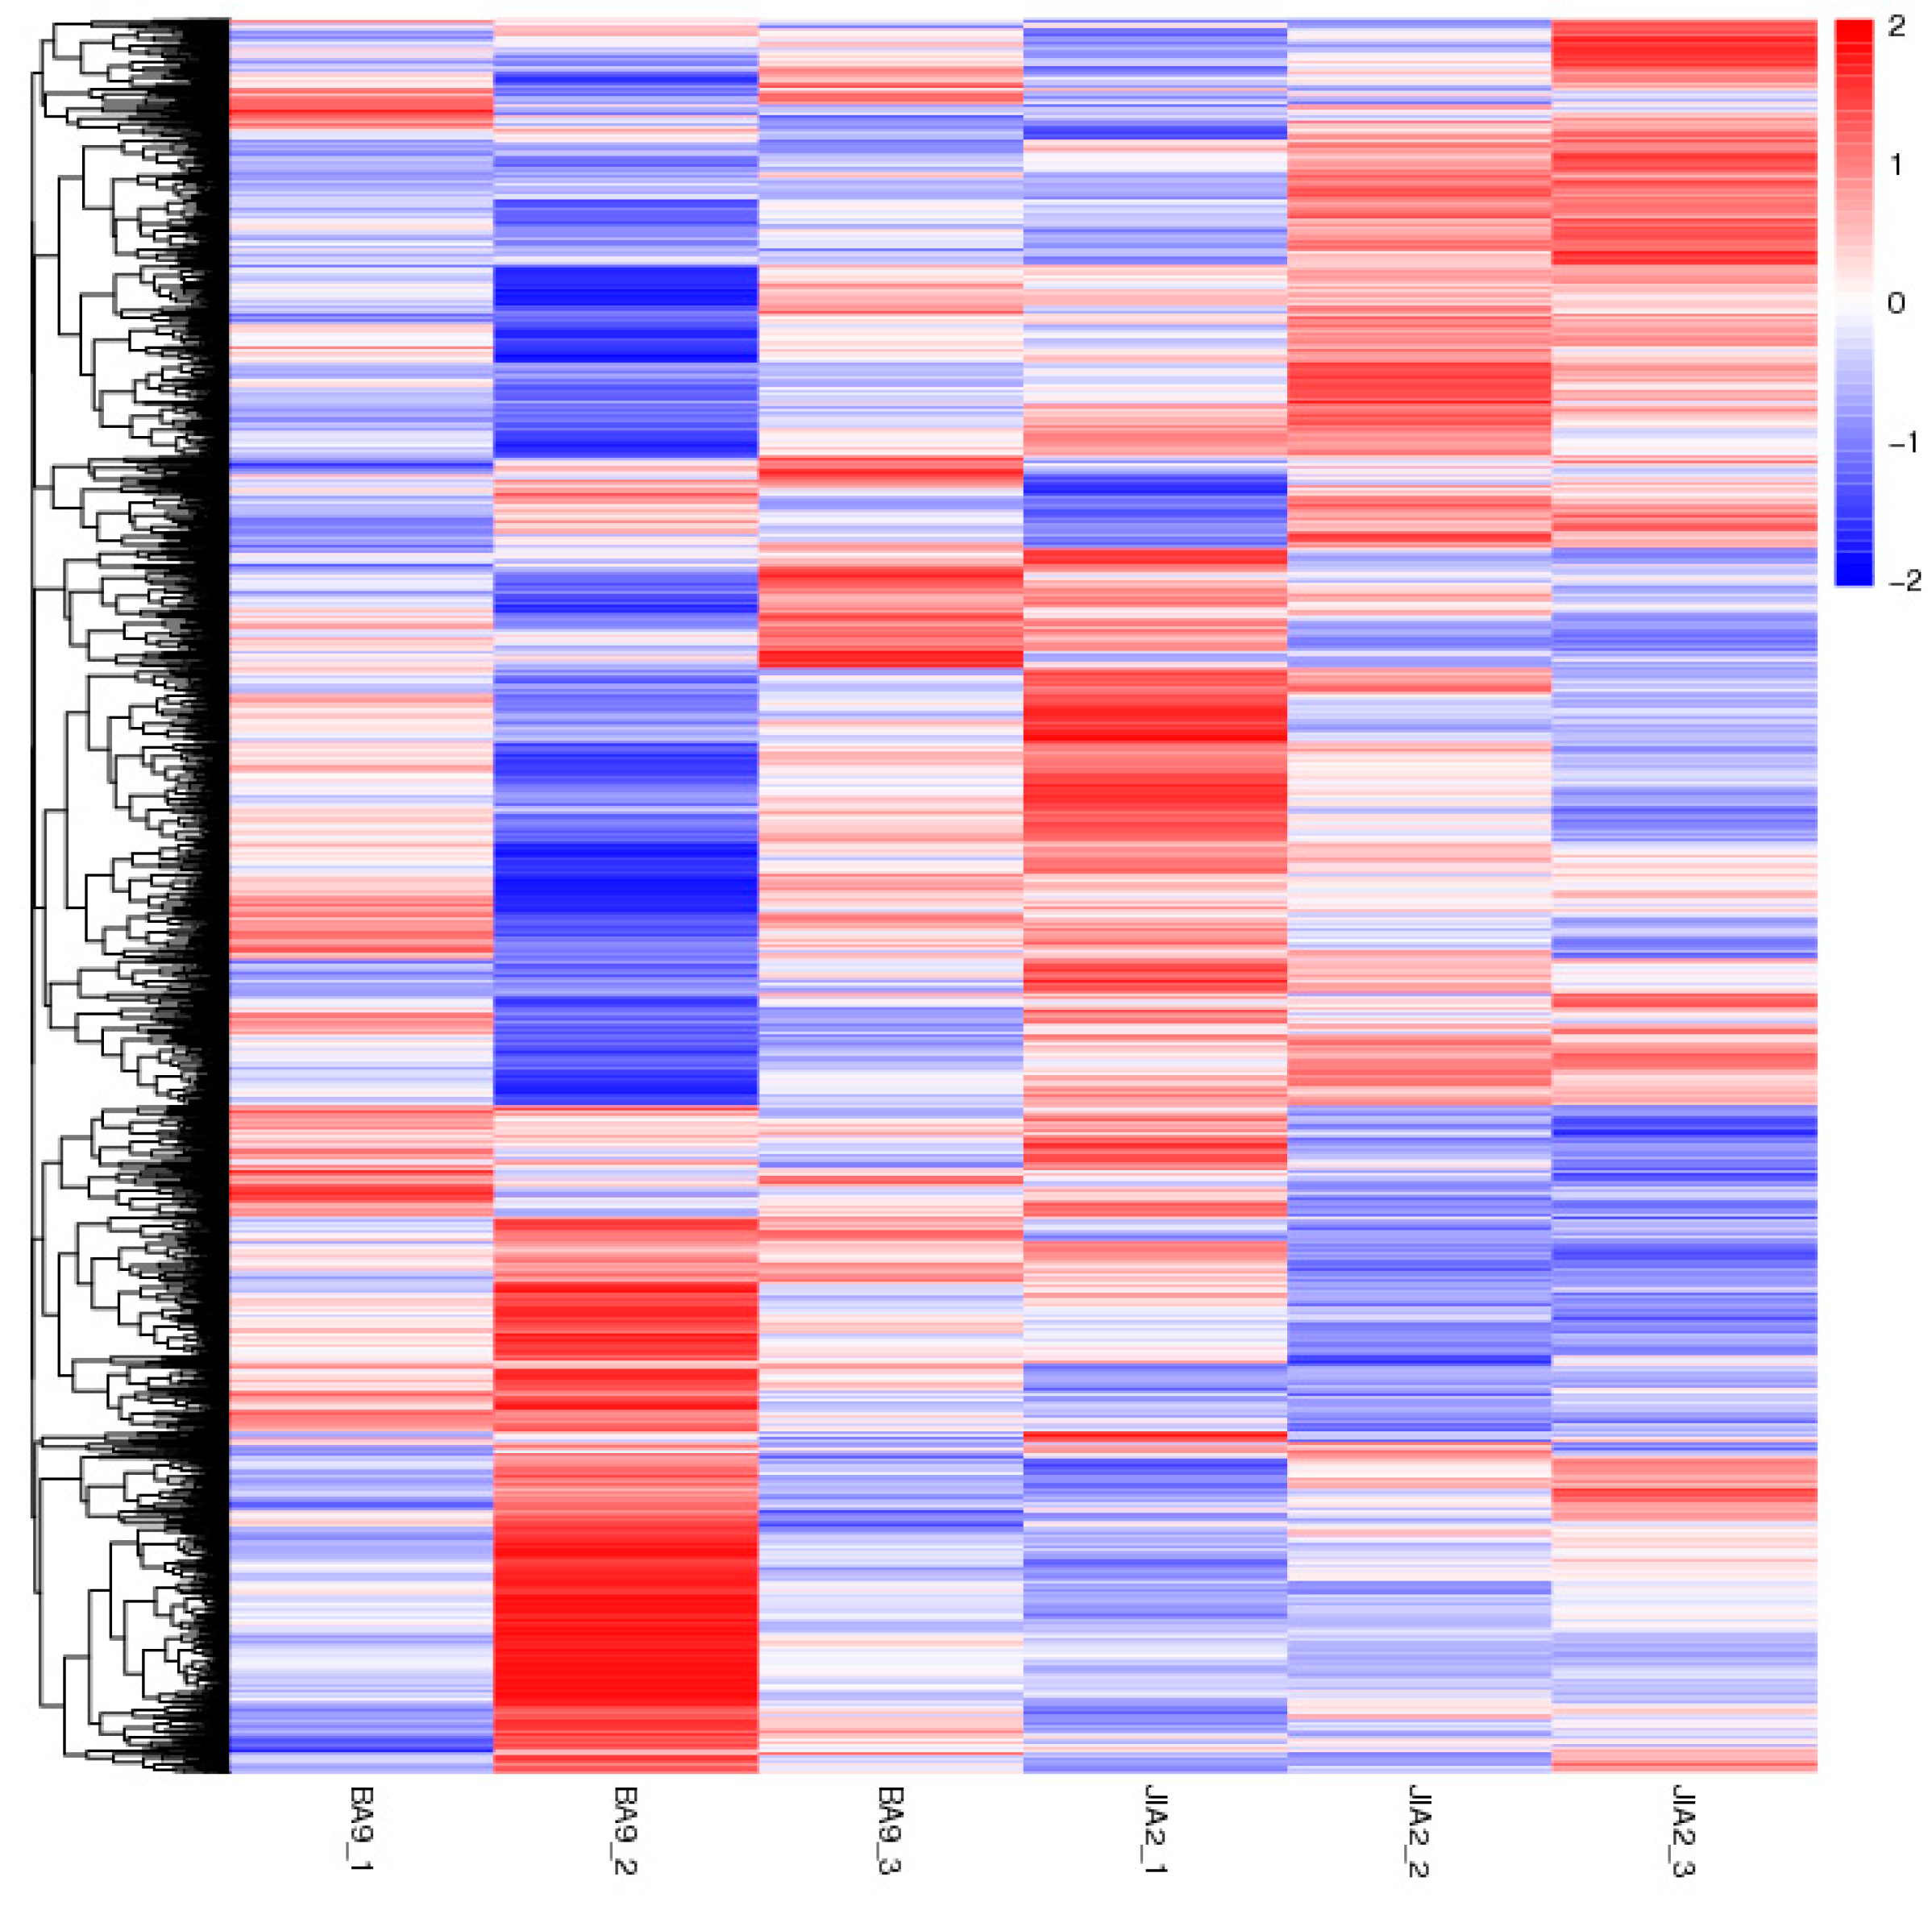
2.6. Effects of Drought Stress on the Transcriptomes in Oat Roots
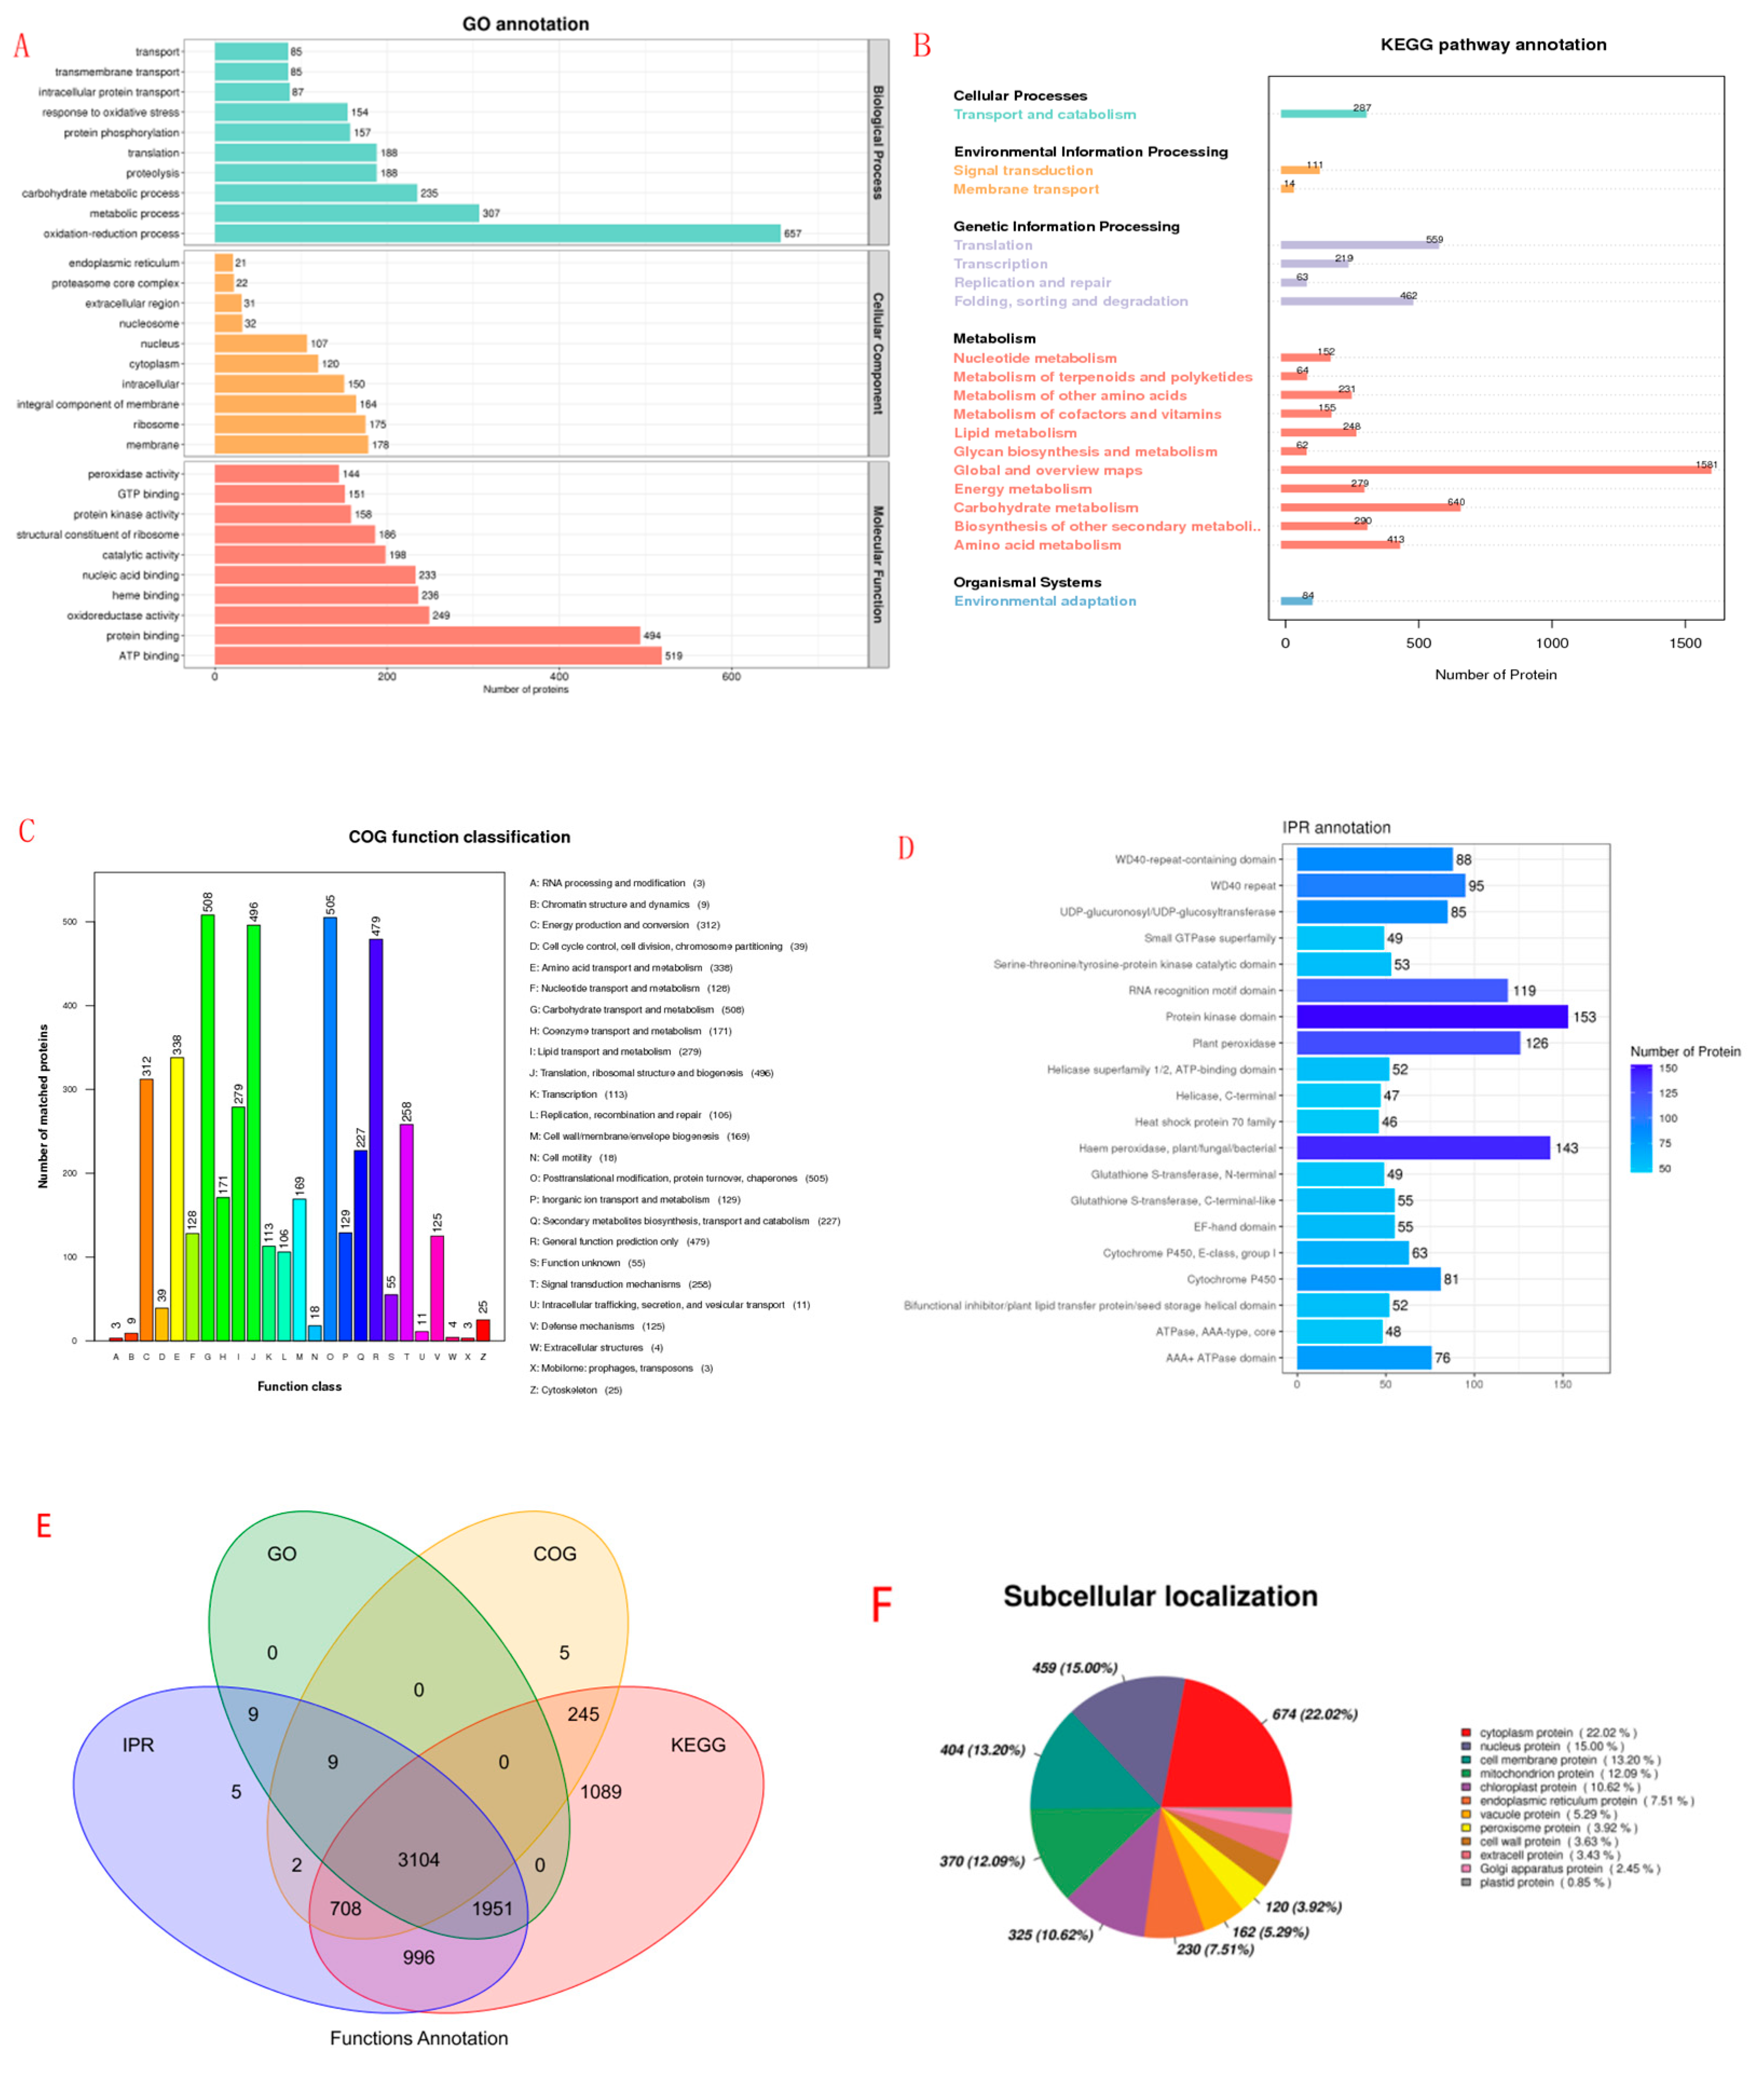
2.7. Protein Functional Annotation Analysis
2.8. Identification of DEPs

| Gene id | Description | BA9-2/9-1 | BA9-3/9-1 | JIA2-2/2-1 | JIA2-3/2-1 | ||||
| FC | p-value | FC | p-value | FC | p-value | FC | p-value | ||
| Cluster-12329.42730 | 12-oxo-phytodienoic acid reductase 2 | 0.457 | 0.002 | 0.564 | 0.004 | 0.568 | 0.001 | 0.530 | 0.000 |
| Cluster-12329.40415 | 26 kDa endochitinase 1-like | 3.224 | 0.000 | 2.921 | 0.001 | 2.143 | 0.042 | 2.809 | 0.009 |
| Cluster-12329.39510 | ABC transporter G family member 48-like | 2.081 | 0.002 | 1.828 | 0.020 | 0.985 | 0.973 | 1.140 | 0.781 |
| Cluster-12329.30175 | Adipocyte plasma membrane-associated protein | 3.083 | 0.000 | 1.724 | 0.001 | 0.682 | 0.027 | 0.603 | 0.013 |
| Cluster-12329.40387 | alpha-galactosidase-like | 0.656 | 0.017 | 1.556 | 0.024 | 1.160 | 0.742 | 1.468 | 0.305 |
| Cluster-12329.42859 | ammonium transporter AMT2.1 | 0.378 | 0.004 | 0.456 | 0.011 | 0.120 | 0.108 | 0.134 | 0.110 |
| Cluster-12329.58512 | anthranilate synthase alpha 2 subunit | 0.348 | 0.004 | 0.521 | 0.003 | 0.590 | 0.005 | 0.421 | 0.002 |
| Cluster-12329.42873 | ATP-citrate synthase alpha chain protein 2 | 3.520 | 0.002 | 2.604 | 0.011 | 1.428 | 0.448 | 1.520 | 0.449 |
| Cluster-12329.25236 | berberine bridge enzyme-like 27 | 0.356 | 0.000 | 0.555 | 0.007 | 0.310 | 0.001 | 0.282 | 0.001 |
| Cluster-12329.46928 | beta-glucosidase 4 | 1.761 | 0.011 | 2.979 | 0.035 | 1.433 | 0.303 | 1.829 | 0.238 |
| Cluster-12329.48569 | cinnamyl alcohol dehydrogenase | 0.369 | 0.041 | 0.542 | 0.031 | 0.821 | 0.352 | 0.733 | 0.229 |
| Cluster-12329.46789 | cytochrome P450 | 0.548 | 0.047 | 0.674 | 0.024 | 0.566 | 0.051 | 0.612 | 0.075 |
| Cluster-12329.48221 | cytochrome P450 | 1.656 | 0.012 | 1.428 | 0.036 | 0.304 | 0.033 | 0.294 | 0.032 |
| Cluster-12329.18884 | cytochrome P450 CYP99A1-like | 2.200 | 0.011 | 2.632 | 0.018 | 2.218 | 0.003 | 1.555 | 0.286 |
| Cluster-12329.53808 | cytosolic Cu/Zn superoxide dismutase | 0.770 | 0.044 | 1.424 | 0.025 | 1.341 | 0.002 | 1.381 | 0.006 |
| Cluster-12329.22699 | dicarboxylate transporter 2.1, chloroplastic | 0.611 | 0.038 | 0.627 | 0.028 | 1.170 | 0.544 | 1.766 | 0.220 |
| Cluster-12329.47448 | E3 ubiquitin-protein ligase KEG | 2.610 | 0.001 | 3.691 | 0.048 | 1.191 | 0.158 | 0.971 | 0.872 |
| Cluster-12329.38222 | electron transfer flavoprotein-ubiquinone oxidoreductase, mitochondrial isoform X3 | 0.459 | 0.048 | 0.478 | 0.038 | 2.809 | 0.002 | 2.571 | 0.001 |
| Cluster-12329.47209 | elongation factor-like GTPase 1 | 1.791 | 0.040 | 1.483 | 0.040 | 1.080 | 0.569 | 1.416 | 0.119 |
| Cluster-12329.43587 | fructan exohydrolase | 0.664 | 0.026 | 0.503 | 0.010 | 0.284 | 0.000 | 0.234 | 0.000 |
| Cluster-12329.44239 | hydroxyanthranilatehydroxycinnamoyltransferase 3 | 0.768 | 0.031 | 0.555 | 0.001 | 0.544 | 0.050 | 1.012 | 0.982 |
| Cluster-12329.29762 | hypothetical protein BRADI_1g07910v3 | 1.580 | 0.009 | 1.414 | 0.028 | 1.515 | 0.008 | 1.340 | 0.086 |
| Cluster-12329.45583 | hypothetical protein BRADI_2g08250v3 | 0.816 | 0.040 | 0.727 | 0.046 | 0.560 | 0.001 | 0.487 | 0.000 |
| Cluster-12329.46014 | hypothetical protein BRADI_2g42380v3 | 1.449 | 0.012 | 1.738 | 0.035 | 1.145 | 0.729 | 1.515 | 0.376 |
| Cluster-12329.54345 | hypothetical protein BRADI_2g44856v3 | 1.685 | 0.002 | 1.802 | 0.002 | 0.879 | 0.498 | 0.909 | 0.598 |
| Cluster-12329.76277 | hypothetical protein BRADI_2g52317v3 | 1.974 | 0.024 | 1.786 | 0.048 | 1.259 | 0.505 | 1.396 | 0.511 |
| Cluster-12329.49150 | hypothetical protein BRADI_4g08097v3 | 0.647 | 0.004 | 0.601 | 0.004 | 0.672 | 0.065 | 0.588 | 0.018 |
| Cluster-12329.70711 | hypothetical protein C2845_PM01G12550 | 2.075 | 0.001 | 1.812 | 0.012 | 0.469 | 0.242 | 0.856 | 0.731 |
| Cluster-12329.57642 | hypothetical protein OsI_09291 | 1.758 | 0.002 | 1.378 | 0.029 | 1.135 | 0.353 | 1.321 | 0.074 |
| Cluster-12329.47167 | hypothetical protein OsI_16658 | 0.473 | 0.015 | 0.523 | 0.023 | 0.435 | 0.018 | 0.566 | 0.095 |
| Cluster-12329.46264 | NADH--cytochrome b5 reductase 1 | 0.772 | 0.006 | 0.752 | 0.006 | 0.663 | 0.026 | 0.561 | 0.008 |
| Cluster-12329.40903 | papain-like cysteine proteinase | 0.083 | 0.014 | 0.106 | 0.003 | 0.336 | 0.068 | 0.308 | 0.060 |
| Cluster-12329.42451 | phospho-2-dehydro-3-deoxyheptonate aldolase 1, chloroplastic | 0.390 | 0.025 | 0.466 | 0.007 | 0.808 | 0.402 | 0.745 | 0.300 |
| Cluster-12329.45920 | phospholipid-transporting ATPase 3 isoform X1 | 0.315 | 0.001 | 0.293 | 0.000 | 0.913 | 0.563 | 1.120 | 0.253 |
| Cluster-12329.53668 | plastid glutamine synthetase isoform GS2b | 2.244 | 0.001 | 1.760 | 0.017 | 0.686 | 0.006 | 0.762 | 0.038 |
| Cluster-12329.47790 | polygalacturonase inhibitor | 1.994 | 0.019 | 1.450 | 0.050 | 1.967 | 0.001 | 1.828 | 0.151 |
| Cluster-12329.47853 | polyol transporter 5-like | 2.947 | 0.030 | 2.418 | 0.035 | 1.021 | 0.886 | 1.154 | 0.316 |
| Cluster-12329.43728 | predicted protein | 1.400 | 0.019 | 1.475 | 0.035 | 0.821 | 0.253 | 0.750 | 0.107 |
| Cluster-12329.45053 | predicted protein | 1.322 | 0.020 | 1.722 | 0.005 | 0.676 | 0.072 | 0.491 | 0.022 |
| Cluster-12329.64971 | predicted protein | 0.353 | 0.007 | 0.584 | 0.022 | 0.464 | 0.091 | 0.577 | 0.287 |
| Cluster-12329.45487 | predicted protein | 0.264 | 0.011 | 0.574 | 0.012 | 0.452 | 0.005 | 0.577 | 0.024 |
| Cluster-12329.58094 | predicted protein | 0.390 | 0.049 | 0.528 | 0.046 | 0.668 | 0.175 | 0.886 | 0.763 |
| Cluster-12329.50128 | predicted protein | 0.607 | 0.003 | 0.622 | 0.048 | 0.999 | 0.996 | 0.635 | 0.050 |
| Cluster-12329.29002 | predicted protein | 2.032 | 0.018 | 1.662 | 0.048 | 1.854 | 0.017 | 1.761 | 0.033 |
| Cluster-12329.19503 | predicted protein, partial | 1.585 | 0.007 | 1.277 | 0.020 | 0.899 | 0.739 | 0.601 | 0.215 |
| Cluster-12329.50406 | succinyl-CoA ligase subunit beta, mitochondrial | 1.159 | 0.012 | 1.235 | 0.035 | 0.810 | 0.067 | 0.773 | 0.047 |
| Cluster-12329.44784 | PREDICTED: sulfite oxidase | 0.448 | 0.002 | 0.561 | 0.006 | 0.960 | 0.805 | 0.635 | 0.127 |
| Cluster-12329.44784 | PREDICTED: sulfite oxidase | 0.754 | 0.037 | 0.698 | 0.026 | 0.909 | 0.066 | 0.803 | 0.038 |
| Cluster-12329.27553 | putativeUDP-rhamnose:rhamnosyltransferase 1 | 0.624 | 0.042 | 0.369 | 0.002 | 0.997 | 0.990 | 1.031 | 0.910 |
| Cluster-12329.21291 | pyridoxine/pyridoxamine 5-phosphate oxidase 1, chloroplastic | 1.300 | 0.037 | 0.333 | 0.001 | 1.011 | 0.689 | 1.060 | 0.359 |
| Cluster-12329.45221 | S-adenosyl-L-homocysteine hydrolase | 0.596 | 0.016 | 0.670 | 0.006 | 0.989 | 0.920 | 1.004 | 0.963 |
| Cluster-12329.47122 | subtilisin-like protease SBT1.7 | 0.447 | 0.006 | 0.679 | 0.023 | 0.620 | 0.176 | 0.394 | 0.083 |
| Cluster-12329.33253 | Threonine synthase 1, chloroplastic | 1.474 | 0.001 | 1.264 | 0.031 | 1.787 | 0.000 | 1.557 | 0.099 |
| Cluster-12329.58040 | UDP-glycosyltransferase 72B1-like | 0.335 | 0.014 | 0.471 | 0.007 | 0.279 | 0.002 | 0.200 | 0.015 |
| Cluster-12329.39344 | UGT80A24 | 2.163 | 0.001 | 1.986 | 0.001 | 0.790 | 0.058 | 0.980 | 0.909 |
| Cluster-12329.23406 | uncharacterized protein LOC100841867 | 0.320 | 0.042 | 0.398 | 0.026 | 0.339 | 0.255 | 1.033 | 0.957 |
| Cluster-12329.37542 | uncharacterized protein LOC109769744 | 1.988 | 0.004 | 1.349 | 0.033 | 1.295 | 0.207 | 2.294 | 0.077 |
| Cluster-12329.45937 | uncharacterized protein LOC109775963 | 1.316 | 0.003 | 1.287 | 0.005 | 1.049 | 0.399 | 1.168 | 0.015 |
| Cluster-12329.46196 | uncharacterized protein LOC541714 isoform X2 | 0.427 | 0.028 | 0.504 | 0.008 | 0.809 | 0.273 | 0.878 | 0.493 |
| Cluster-12329.17719 | universal stress protein PHOS32-like | 0.529 | 0.005 | 0.543 | 0.010 | 0.543 | 0.007 | 0.411 | 0.003 |
| Cluster-12329.41351 | unnamed protein product | 0.415 | 0.002 | 0.515 | 0.033 | 0.529 | 0.058 | 0.533 | 0.062 |
| Cluster-12329.71832 | unnamed protein product | 3.554 | 0.001 | 4.595 | 0.003 | 2.040 | 0.172 | 3.491 | 0.001 |
| Cluster-12329.46829 | V-type proton ATPase catalytic subunit A | 1.952 | 0.001 | 1.462 | 0.043 | 0.964 | 0.725 | 0.805 | 0.005 |
| Protein | JIA2-2/2-1 FC | p-value | JIA2-2/2-1 FC | p-value | GO/KEGG Description |
| Cluster-12329.48386 | 0.41 | 0.0128 | 0.37 | 0.0071 | xyloglucan galactosyltransferase MUR3 |
| Cluster-12329.14848 | 0.45 | 0.0225 | 0.47 | 0.0253 | xylan biosynthetic process |
| Cluster-12329.36881 | 2.12 | 0.0163 | 2.41 | 0.0127 | vacuolar protein sorting-associated protein 54 |
| Cluster-12329.43629 | 0.40 | 0.0257 | 0.44 | 0.0279 | urease accessory protein |
| Cluster-12329.46978 | 2.87 | 0.0091 | 3.27 | 0.0029 | tRNA guanosine-2′-O-methyltransferase |
| Cluster-12329.39756 | 0.48 | 0.0049 | 0.47 | 0.0289 | transporter activity |
| Cluster-12329.42106 | 0.44 | 0.0054 | 0.38 | 0.0017 | transporter activity |
| Cluster-12329.45904 | 0.40 | 0.0262 | 0.33 | 0.0341 | transporter activity |
| Cluster-12329.46297 | 0.40 | 0.0311 | 0.42 | 0.0077 | transporter activity |
| Cluster-12329.46729 | 0.28 | 0.0025 | 0.24 | 0.0022 | transporter activity |
| Cluster-12329.39937 | 0.44 | 0.0448 | 0.45 | 0.0448 | transport |
| Cluster-12329.44647 | 0.36 | 0.0029 | 0.30 | 0.0007 | transport |
| Cluster-12329.52083 | 0.50 | 0.0191 | 0.36 | 0.0094 | transport |
| Cluster-12329.57154 | 2.49 | 0.0254 | 2.52 | 0.0062 | transmembrane transport |
| Cluster-12329.39132 | 2.82 | 0.0022 | 2.76 | 0.0001 | transketolase |
| Cluster-12329.33100 | 3.04 | 0.0000 | 2.49 | 0.0022 | transaminase activity |
| Cluster-12329.36721 | 3.16 | 0.0489 | 4.92 | 0.0004 | trafficking protein particle complex subunit 9 |
| Cluster-12329.50073 | 2.32 | 0.0116 | 2.35 | 0.0058 | threonine-type endopeptidase activity |
| Cluster-12329.56189 | 2.54 | 0.0360 | 2.83 | 0.0017 | terpenoid biosynthetic process |
| Cluster-12329.59076 | 7.07 | 0.0000 | 11.86 | 0.0341 | telomere maintenance |
| Cluster-12329.41271 | 0.32 | 0.0002 | 0.50 | 0.0021 | sulfotransferase activity |
| Cluster-12329.38036 | 3.37 | 0.0376 | 3.03 | 0.0293 | structural constituent of ribosome |
| Cluster-11888.0 | 2.32 | 0.0105 | 2.92 | 0.0013 | structural constituent of ribosome |
| Cluster-12329.19614 | 2.05 | 0.0056 | 2.45 | 0.0030 | structural constituent of ribosome |
| Cluster-12329.25578 | 2.51 | 0.0178 | 2.98 | 0.0225 | structural constituent of ribosome |
| Cluster-12329.45480 | 2.97 | 0.0053 | 3.28 | 0.0298 | structural constituent of ribosome |
| Cluster-12329.47059 | 2.18 | 0.0030 | 2.05 | 0.0220 | structural constituent of ribosome |
| Cluster-12329.47776 | 2.20 | 0.0031 | 2.10 | 0.0135 | structural constituent of ribosome |
| Cluster-12329.47836 | 2.64 | 0.0033 | 2.85 | 0.0408 | structural constituent of ribosome |
| Cluster-12329.48202 | 3.17 | 0.0002 | 3.31 | 0.0082 | structural constituent of ribosome |
| Cluster-12329.50106 | 3.38 | 0.0044 | 3.55 | 0.0090 | structural constituent of ribosome |
| Cluster-12329.53055 | 2.33 | 0.0010 | 2.53 | 0.0029 | structural constituent of ribosome |
| Cluster-12329.59685 | 4.38 | 0.0001 | 5.86 | 0.0005 | structural constituent of ribosome |
| Cluster-12329.69623 | 5.79 | 0.0079 | 5.70 | 0.0031 | structural constituent of ribosome |
| Cluster-16534.0 | 5.81 | 0.0001 | 7.93 | 0.0001 | structural constituent of ribosome |
| Cluster-27122.0 | 2.08 | 0.0036 | 2.36 | 0.0131 | structural constituent of ribosome |
| Cluster-12329.47699 | 0.34 | 0.0025 | 0.31 | 0.0025 | structural constituent of cytoskeleton |
| Cluster-12329.60172 | 3.50 | 0.0099 | 3.37 | 0.0047 | splicing factor, arginine/serine-rich 7 |
| Cluster-12329.26481 | 2.28 | 0.0025 | 2.05 | 0.0057 | spartin |
| Cluster-12329.35552 | 2.45 | 0.0146 | 2.30 | 0.0196 | seryl-tRNA synthetase |
| Cluster-12329.35428 | 3.84 | 0.0005 | 6.42 | 0.0007 | serine-type endopeptidase inhibitor activity |
| Cluster-12329.60990 | 3.15 | 0.0265 | 2.65 | 0.0318 | serine-type endopeptidase inhibitor activity |
| Cluster-12329.48183 | 2.82 | 0.0136 | 2.95 | 0.0115 | serine-type endopeptidase activity |
| Cluster-12329.49419 | 0.17 | 0.0002 | 0.29 | 0.0172 | serine-type endopeptidase activity |
| Cluster-12329.38038 | 4.41 | 0.0236 | 4.96 | 0.0030 | serine-type carboxypeptidase activity |
| Cluster-12329.53402 | 0.32 | 0.0205 | 0.27 | 0.0030 | serine-type carboxypeptidase activity |
| Cluster-12329.43182 | 3.14 | 0.0463 | 3.70 | 0.0111 | sequence-specific DNA binding |
| Cluster-12329.27710 | 2.56 | 0.0487 | 2.82 | 0.0174 | SAP domain-containing ribonucleoprotein |
| Cluster-12329.52048 | 3.44 | 0.0002 | 3.86 | 0.0007 | RNA processing |
| Cluster-12329.50126 | 4.30 | 0.0192 | 4.98 | 0.0090 | RNA methylation |
| Cluster-12329.42822 | 2.09 | 0.0078 | 2.59 | 0.0029 | RNA binding |
| Cluster-12329.21735 | 2.42 | 0.0011 | 2.64 | 0.0110 | ribosome biogenesis protein BRX1 |
| Cluster-12329.46311 | 3.19 | 0.0024 | 2.86 | 0.0054 | ribosomal RNA-processing protein 12 |
| Cluster-12329.51283 | 2.53 | 0.0011 | 2.67 | 0.0031 | regulation of translation |
| Cluster-2168.0 | 0.21 | 0.0003 | 0.17 | 0.0021 | pyroglutamyl-peptidase |
| Cluster-12329.62295 | 3.15 | 0.0046 | 3.02 | 0.0250 | pseudouridine synthesis |
| Cluster-12329.58022 | 2.34 | 0.0055 | 2.98 | 0.0139 | proton-transporting ATP synthase complex assembly |
| Cluster-12329.43644 | 0.28 | 0.0155 | 0.11 | 0.0010 | proteolysis |
| Cluster-12329.35349 | 3.24 | 0.0096 | 3.24 | 0.0003 | proteolysis |
| Cluster-12329.43809 | 0.44 | 0.0053 | 0.38 | 0.0119 | proteolysis |
| Cluster-12329.45109 | 0.34 | 0.0022 | 0.32 | 0.0026 | proteolysis |
| Cluster-22035.1 | 0.34 | 0.0063 | 0.25 | 0.0182 | proteolysis |
| Cluster-12329.31876 | 0.36 | 0.0093 | 0.47 | 0.0203 | protein kinase activity |
| Cluster-12329.46753 | 0.45 | 0.0032 | 0.37 | 0.0049 | protein kinase activity |
| Cluster-12329.50363 | 0.50 | 0.0006 | 0.48 | 0.0014 | protein kinase activity |
| Cluster-12329.58642 | 0.18 | 0.0202 | 0.28 | 0.0347 | protein kinase activity |
| Cluster-12329.45749 | 0.36 | 0.0000 | 0.39 | 0.0000 | protein domain specific binding |
| Cluster-21280.0 | 4.95 | 0.0003 | 4.78 | 0.0000 | protein dimerization activity |
| Cluster-12329.41964 | 0.42 | 0.0139 | 0.38 | 0.0064 | protein binding |
| Cluster-12329.50319 | 0.38 | 0.0049 | 0.24 | 0.0020 | protein binding |
| Cluster-12329.15022 | 3.21 | 0.0135 | 3.11 | 0.0323 | protein binding |
| Cluster-12329.16346 | 2.42 | 0.0066 | 3.31 | 0.0017 | protein binding |
| Cluster-12329.22341 | 3.19 | 0.0323 | 4.47 | 0.0000 | protein binding |
| Cluster-12329.34668 | 3.41 | 0.0022 | 5.42 | 0.0006 | protein binding |
| Cluster-12329.39776 | 3.32 | 0.0024 | 2.71 | 0.0066 | protein binding |
| Cluster-12329.42509 | 0.37 | 0.0014 | 0.37 | 0.0404 | protein binding |
| Cluster-12329.46138 | 0.42 | 0.0344 | 0.32 | 0.0298 | protein binding |
| Cluster-12329.46986 | 4.39 | 0.0244 | 3.75 | 0.0472 | protein binding |
| Cluster-12329.47845 | 0.29 | 0.0019 | 0.29 | 0.0046 | protein binding |
| Cluster-12329.51162 | 2.29 | 0.0051 | 2.11 | 0.0135 | protein binding |
| Cluster-12329.54023 | 2.00 | 0.0265 | 2.35 | 0.0458 | protein binding |
| Cluster-12329.55764 | 3.46 | 0.0155 | 5.60 | 0.0231 | protein binding |
| Cluster-12329.61573 | 0.19 | 0.0001 | 0.17 | 0.0001 | protein binding |
| Cluster-12329.40181 | 0.29 | 0.0394 | 0.27 | 0.0377 | prenylcysteine oxidase activity |
| Cluster-30010.0 | 4.93 | 0.0005 | 3.71 | 0.0145 | phosphoglycerate mutase activity |
| Cluster-12329.33490 | 2.19 | 0.0038 | 2.63 | 0.0080 | peroxin-5 |
| Cluster-12329.14980 | 0.47 | 0.0025 | 0.30 | 0.0066 | peroxidase activity |
| Cluster-12329.33750 | 0.49 | 0.0092 | 0.32 | 0.0065 | peroxidase activity |
| Cluster-12329.36977 | 0.39 | 0.0007 | 0.30 | 0.0004 | peroxidase activity |
| Cluster-12329.40101 | 0.12 | 0.0205 | 0.11 | 0.0032 | peroxidase activity |
| Cluster-12329.42981 | 0.35 | 0.0040 | 0.28 | 0.0019 | peroxidase activity |
| Cluster-12329.43312 | 0.40 | 0.0020 | 0.42 | 0.0111 | peroxidase activity |
| Cluster-12329.43857 | 0.35 | 0.0195 | 0.30 | 0.0147 | peroxidase activity |
| Cluster-12329.52051 | 0.28 | 0.0004 | 0.26 | 0.0004 | peroxidase activity |
| Cluster-12329.52052 | 0.23 | 0.0064 | 0.23 | 0.0023 | peroxidase activity |
| Cluster-12329.59924 | 0.44 | 0.0005 | 0.36 | 0.0026 | peroxidase activity |
| Cluster-27561.0 | 0.34 | 0.0071 | 0.24 | 0.0039 | peroxidase activity |
| Cluster-12329.73097 | 2.53 | 0.0027 | 2.16 | 0.0023 | oxygen binding |
| Cluster-12329.45913 | 0.31 | 0.0057 | 0.26 | 0.0119 | oxidoreductase activity |
| Cluster-12329.46857 | 0.49 | 0.0348 | 0.48 | 0.0075 | oxidoreductase activity |
| Cluster-12329.49670 | 0.41 | 0.0042 | 0.36 | 0.0040 | oxidoreductase activity |
| Cluster-12329.61877 | 0.48 | 0.0024 | 0.25 | 0.0003 | oxidoreductase activity |
| Cluster-12329.60712 | 2.80 | 0.0073 | 2.50 | 0.0206 | oxidation-reduction process |
| Cluster-12329.61816 | 0.36 | 0.0468 | 0.12 | 0.0183 | omega-hydroxypalmitate O-feruloyl transferase |
| Cluster-12329.69497 | 6.09 | 0.0004 | 6.37 | 0.0302 | nutrient reservoir activity |
| Cluster-12329.58725 | 0.44 | 0.0020 | 0.34 | 0.0091 | nucleotide binding |
| Cluster-12329.45303 | 2.94 | 0.0025 | 2.37 | 0.0370 | nucleosome |
| Cluster-22588.0 | 2.80 | 0.0306 | 3.57 | 0.0002 | nucleosome |
| Cluster-12329.48442 | 2.19 | 0.0020 | 2.23 | 0.0063 | nucleolar protein 56 |
| Cluster-3608.0 | 9.51 | 0.0011 | 8.52 | 0.0244 | nucleic acid binding |
| Cluster-12329.17354 | 2.50 | 0.0384 | 2.66 | 0.0020 | nucleic acid binding |
| Cluster-12329.33078 | 2.48 | 0.0066 | 2.59 | 0.0049 | nucleic acid binding |
| Cluster-12329.42921 | 2.03 | 0.0201 | 2.68 | 0.0052 | nucleic acid binding |
| Cluster-12329.56144 | 2.22 | 0.0298 | 2.19 | 0.0301 | nucleic acid binding |
| Cluster-12329.30577 | 2.29 | 0.0270 | 2.41 | 0.0255 | nuclear pore complex protein Nup85 |
| Cluster-12329.45111 | 2.90 | 0.0094 | 2.56 | 0.0402 | nuclear GTP-binding protein |
| Cluster-12329.42303 | 0.27 | 0.0005 | 0.41 | 0.0415 | nicotinate phosphoribosyltransferase |
| Cluster-12329.42372 | 0.18 | 0.0008 | 0.20 | 0.0007 | negative regulation of translation |
| Cluster-25204.0 | 2.13 | 0.0204 | 2.12 | 0.0172 | NADH-ubiquinone oxidoreductase chain 6 |
| Cluster-12329.47768 | 0.46 | 0.0241 | 0.32 | 0.0112 | NADH dehydrogenase (ubiquinone) 1 beta subcomplex subunit 9 |
| Cluster-12329.46665 | 0.30 | 0.0005 | 0.33 | 0.0052 | NAD(P)H dehydrogenase (quinone) |
| Cluster-12329.46242 | 0.25 | 0.0114 | 0.29 | 0.0150 | N-acetylneuraminate 9-O-acetyltransferase |
| Cluster-12329.51060 | 3.29 | 0.0006 | 2.19 | 0.0064 | motor activity |
| Cluster-12329.23694 | 2.34 | 0.0108 | 2.86 | 0.0202 | Molecular Function:protein binding |
| Cluster-12329.24463 | 0.43 | 0.0018 | 0.21 | 0.0001 | Molecular Function:protein binding |
| Cluster-12329.41740 | 2.37 | 0.0148 | 2.66 | 0.0203 | Molecular Function:catalytic activity |
| Cluster-12329.11672 | 2.09 | 0.0137 | 2.97 | 0.0005 | mitochondrial phosphate transporter |
| Cluster-12329.17513 | 2.48 | 0.0084 | 2.45 | 0.0335 | mitochondrial outer membrane translocase complex |
| Cluster-12329.45277 | 0.15 | 0.0007 | 0.21 | 0.0042 | methyltransferase activity |
| Cluster-12329.45724 | 0.28 | 0.0205 | 0.37 | 0.0333 | methionine adenosyltransferase activity |
| Cluster-12329.43185 | 0.47 | 0.0006 | 0.45 | 0.0066 | metal ion transport |
| Cluster-12329.58884 | 2.12 | 0.0401 | 2.23 | 0.0164 | metal ion binding |
| Cluster-12329.61926 | 0.49 | 0.0486 | 0.44 | 0.0408 | metal ion binding |
| Cluster-12329.51889 | 2.66 | 0.0318 | 3.77 | 0.0013 | metabolic process |
| Cluster-12329.57912 | 2.71 | 0.0028 | 3.09 | 0.0000 | metabolic process |
| Cluster-12329.57969 | 0.35 | 0.0057 | 0.39 | 0.0087 | metabolic process |
| Cluster-12329.63524 | 3.83 | 0.0002 | 3.66 | 0.0002 | metabolic process |
| Cluster-12329.63525 | 5.34 | 0.0006 | 3.92 | 0.0001 | metabolic process |
| Cluster-12329.63525 | 4.70 | 0.0004 | 4.28 | 0.0008 | metabolic process |
| Cluster-30262.1 | 0.35 | 0.0006 | 0.26 | 0.0005 | metabolic process |
| Cluster-12329.19357 | 5.21 | 0.0195 | 3.97 | 0.0005 | membrane |
| Cluster-27225.0 | 3.33 | 0.0329 | 2.16 | 0.0201 | membrane |
| Cluster-12329.40661 | 0.20 | 0.0335 | 0.32 | 0.0265 | manganese ion binding |
| Cluster-12329.48850 | 0.40 | 0.0213 | 0.28 | 0.0068 | malate metabolic process |
| Cluster-12329.55547 | 0.43 | 0.0035 | 0.25 | 0.0026 | malate dehydrogenase |
| Cluster-12329.59603 | 7.03 | 0.0008 | 5.81 | 0.0023 | malate dehydrogenase |
| Cluster-12329.23725 | 2.08 | 0.0393 | 3.50 | 0.0012 | lipid transport |
| Cluster-12329.39105 | 0.35 | 0.0043 | 0.17 | 0.0023 | lipid metabolic process |
| Cluster-12329.42824 | 0.30 | 0.0000 | 0.23 | 0.0001 | lipid metabolic process |
| Cluster-12329.35244 | 4.75 | 0.0329 | 7.16 | 0.0043 | large subunit ribosomal protein L7e |
| Cluster-12329.41754 | 2.18 | 0.0023 | 2.62 | 0.0002 | large subunit ribosomal protein L7Ae |
| Cluster-12329.41497 | 2.51 | 0.0092 | 3.07 | 0.0034 | large subunit ribosomal protein L27Ae |
| Cluster-12329.39606 | 6.27 | 0.0198 | 5.48 | 0.0012 | large subunit ribosomal protein L24e |
| Cluster-12329.59427 | 3.41 | 0.0007 | 3.00 | 0.0174 | lactoylglutathione lyase |
| Cluster-12329.48942 | 0.41 | 0.0094 | 0.24 | 0.0051 | iron ion binding |
| Cluster-12329.48221 | 0.30 | 0.0334 | 0.29 | 0.0319 | iron ion binding |
| Cluster-12329.51058 | 2.38 | 0.0021 | 2.20 | 0.0075 | iron ion binding |
| Cluster-12329.17299 | 5.56 | 0.0011 | 4.36 | 0.0059 | integral component of membrane |
| Cluster-12329.23588 | 3.13 | 0.0362 | 3.72 | 0.0099 | integral component of membrane |
| Cluster-12329.26605 | 2.22 | 0.0038 | 3.14 | 0.0041 | integral component of membrane |
| Cluster-12329.39422 | 0.32 | 0.0016 | 0.29 | 0.0013 | integral component of membrane |
| Cluster-12329.44929 | 0.42 | 0.0010 | 0.28 | 0.0011 | integral component of membrane |
| Cluster-12329.46026 | 2.32 | 0.0151 | 2.77 | 0.0063 | inorganic diphosphatase activity |
| Cluster-12329.50264 | 0.40 | 0.0351 | 0.40 | 0.0409 | hydroxymethylglutaryl-CoA synthase |
| Cluster-12329.53567 | 2.02 | 0.0092 | 2.34 | 0.0057 | hydrolase activity |
| Cluster-12329.43240 | 7.43 | 0.0074 | 4.12 | 0.0137 | heat shock 70kDa protein |
| Cluster-12329.29526 | 2.61 | 0.0012 | 3.69 | 0.0029 | H/ACA ribonucleoprotein complex subunit 2 |
| Cluster-12329.45696 | 0.25 | 0.0307 | 0.23 | 0.0144 | GTPase activity |
| Cluster-12329.45717 | 0.43 | 0.0443 | 0.31 | 0.0270 | GTPase activity |
| Cluster-20139.0 | 0.50 | 0.0036 | 0.39 | 0.0089 | GTPase activity |
| Cluster-12329.45312 | 0.39 | 0.0052 | 0.38 | 0.0044 | GTP binding |
| Cluster-12329.47784 | 2.76 | 0.0087 | 3.12 | 0.0005 | GTP binding |
| Cluster-12329.49630 | 0.41 | 0.0385 | 0.28 | 0.0173 | GTP binding |
| Cluster-12329.15446 | 0.46 | 0.0411 | 0.18 | 0.0328 | glutathione S-transferase |
| Cluster-12329.29554 | 0.46 | 0.0338 | 0.24 | 0.0198 | FMN binding |
| Cluster-24056.0 | 0.24 | 0.0372 | 0.34 | 0.0136 | FMN binding |
| Cluster-12329.36679 | 2.03 | 0.0084 | 2.13 | 0.0284 | fatty acid metabolic process |
| Cluster-12329.68708 | 8.79 | 0.0003 | 6.95 | 0.0089 | extracellular space |
| Cluster-12329.55067 | 0.12 | 0.0293 | 0.11 | 0.0281 | exocyst |
| Cluster-12329.40027 | 4.64 | 0.0051 | 6.31 | 0.0056 | essential nuclear protein 1 |
| Cluster-12329.30167 | 0.40 | 0.0167 | 0.44 | 0.0110 | endoplasmic reticulum |
| Cluster-12329.42162 | 0.47 | 0.0017 | 0.36 | 0.0100 | endo-1,3(4)-beta-glucanase |
| Cluster-12329.32714 | 0.30 | 0.0068 | 0.11 | 0.0009 | electron carrier activity |
| Cluster-12329.43095 | 0.37 | 0.0089 | 0.40 | 0.0095 | electron carrier activity |
| Cluster-12329.45383 | 0.39 | 0.0020 | 0.22 | 0.0099 | electron carrier activity |
| Cluster-12329.50014 | 0.34 | 0.0241 | 0.26 | 0.0176 | electron carrier activity |
| Cluster-12329.51396 | 0.49 | 0.0416 | 0.33 | 0.0334 | electron carrier activity |
| Cluster-12329.53251 | 0.40 | 0.0003 | 0.45 | 0.0005 | electron carrier activity |
| Cluster-12329.63759 | 0.32 | 0.0305 | 0.18 | 0.0157 | electron carrier activity |
| Cluster-12329.58928 | 2.58 | 0.0045 | 3.41 | 0.0285 | DnaJ homolog subfamily C member 2 |
| Cluster-12329.47118 | 2.34 | 0.0301 | 3.00 | 0.0497 | DNA binding |
| Cluster-12329.50646 | 2.32 | 0.0000 | 2.08 | 0.0023 | DNA binding |
| Cluster-12329.10108 | 6.05 | 0.0108 | 6.18 | 0.0076 | defense response |
| Cluster-12329.32721 | 0.32 | 0.0024 | 0.14 | 0.0016 | cytochrome-c oxidase activity |
| Cluster-12329.46264 | 0.44 | 0.0003 | 0.40 | 0.0014 | cytochrome-b5 reductase |
| Cluster-12329.49622 | 0.46 | 0.0150 | 0.36 | 0.0035 | cysteine synthase A |
| Cluster-12329.47550 | 2.02 | 0.0096 | 2.86 | 0.0032 | cullin-associated NEDD8-dissociated protein |
| Cluster-12329.47555 | 7.02 | 0.0220 | 9.93 | 0.0054 | chitinase activity |
| Cluster-12329.39096 | 2.81 | 0.0085 | 2.76 | 0.0042 | chitinase |
| Cluster-12329.36403 | 0.42 | 0.0037 | 0.46 | 0.0425 | cellular amino acid metabolic process |
| Cluster-12329.36404 | 0.27 | 0.0039 | 0.19 | 0.0046 | cellular amino acid metabolic process |
| Cluster-12329.53200 | 0.32 | 0.0463 | 0.35 | 0.0467 | catalytic activity |
| Cluster-12329.42675 | 0.50 | 0.0251 | 0.30 | 0.0185 | catalytic activity |
| Cluster-12329.35194 | 0.16 | 0.0011 | 0.13 | 0.0014 | catalytic activity |
| Cluster-12329.41051 | 0.39 | 0.0013 | 0.19 | 0.0001 | catalytic activity |
| Cluster-12329.41231 | 0.47 | 0.0135 | 0.38 | 0.0334 | catalytic activity |
| Cluster-12329.58241 | 2.97 | 0.0061 | 3.05 | 0.0088 | catalytic activity |
| Cluster-12329.60324 | 12.28 | 0.0001 | 10.59 | 0.0001 | catalytic activity |
| Cluster-12329.60324 | 6.31 | 0.0005 | 4.79 | 0.0030 | catalytic activity |
| Cluster-12329.61956 | 0.25 | 0.0127 | 0.18 | 0.0403 | catalytic activity |
| Cluster-12329.70108 | 8.16 | 0.0001 | 8.62 | 0.0000 | catalytic activity |
| Cluster-12329.68563 | 0.29 | 0.0206 | 0.39 | 0.0266 | carbohydrate metabolic process |
| Cluster-12329.29591 | 2.03 | 0.0030 | 4.49 | 0.0162 | carbohydrate metabolic process |
| Cluster-12329.34933 | 2.81 | 0.0033 | 3.02 | 0.0219 | carbohydrate metabolic process |
| Cluster-12329.43587 | 0.28 | 0.0001 | 0.23 | 0.0000 | carbohydrate metabolic process |
| Cluster-12329.48578 | 0.44 | 0.0371 | 0.40 | 0.0496 | carbohydrate metabolic process |
| Cluster-12329.51456 | 2.57 | 0.0170 | 2.88 | 0.0067 | carbohydrate metabolic process |
| Cluster-12329.51985 | 0.36 | 0.0183 | 0.17 | 0.0317 | carbohydrate metabolic process |
| Cluster-12329.53243 | 0.36 | 0.0060 | 0.28 | 0.0118 | carbohydrate metabolic process |
| Cluster-12329.59871 | 0.19 | 0.0206 | 0.20 | 0.0212 | carbohydrate metabolic process |
| Cluster-12329.61460 | 0.34 | 0.0023 | 0.23 | 0.0003 | carbohydrate metabolic process |
| Cluster-12329.69576 | 0.38 | 0.0021 | 0.46 | 0.0048 | carbohydrate metabolic process |
| Cluster-12329.48513 | 3.38 | 0.0004 | 2.95 | 0.0020 | calcium ion binding |
| Cluster-12329.63459 | 2.17 | 0.0344 | 2.05 | 0.0229 | calcium ion binding |
| Cluster-12329.36041 | 0.39 | 0.0035 | 0.43 | 0.0054 | caffeoyl-CoA O-methyltransferase |
| Cluster-12329.21254 | 0.46 | 0.0232 | 0.26 | 0.0102 | biosynthetic process |
| Cluster-12329.19475 | 2.32 | 0.0191 | 2.05 | 0.0111 | Biological Process:cell redox homeostasis |
| Cluster-12329.49557 | 2.16 | 0.0114 | 2.39 | 0.0347 | ATP-dependent RNA helicase DOB1 |
| Cluster-12329.44150 | 2.20 | 0.0013 | 2.33 | 0.0100 | ATP-dependent RNA helicase DBP3 |
| Cluster-12329.36548 | 0.34 | 0.0369 | 0.41 | 0.0383 | ATP binding |
| Cluster-12329.39910 | 0.18 | 0.0089 | 0.13 | 0.0067 | ATP binding |
| Cluster-12329.65472 | 0.47 | 0.0172 | 0.37 | 0.0052 | ATP binding |
| Cluster-8220.0 | 0.34 | 0.0276 | 0.13 | 0.0291 | aspartic-type endopeptidase activity |
| Cluster-12329.33762 | 0.22 | 0.0024 | 0.17 | 0.0022 | aspartic-type endopeptidase activity |
| Cluster-12329.47560 | 2.51 | 0.0004 | 3.62 | 0.0473 | aspartic-type endopeptidase activity |
| Cluster-12329.47580 | 0.49 | 0.0080 | 0.22 | 0.0013 | aspartic-type endopeptidase activity |
| Cluster-12329.49924 | 0.31 | 0.0087 | 0.41 | 0.0116 | aspartic-type endopeptidase activity |
| Cluster-12329.58062 | 0.43 | 0.0273 | 0.32 | 0.0446 | aspartic-type endopeptidase activity |
| Cluster-12329.48665 | 2.31 | 0.0312 | 2.12 | 0.0102 | asparagine synthase (glutamine-hydrolysing) |
| Cluster-12329.64984 | 0.40 | 0.0018 | 0.18 | 0.0002 | amidase activity |
| Cluster-12329.47418 | 0.42 | 0.0004 | 0.41 | 0.0060 | actin, other eukaryote |
| Cluster-12329.43923 | 0.45 | 0.0167 | 0.37 | 0.0141 | actin binding |
| Cluster-12329.51553 | 0.37 | 0.0031 | 0.21 | 0.0003 | actin beta/gamma 1 |
| Cluster-12329.46649 | 0.37 | 0.0107 | 0.25 | 0.0048 | acid phosphatase activity |
| Cluster-12329.54954 | 3.38 | 0.0006 | 2.63 | 0.0320 | acid phosphatase activity |
| Cluster-12329.76839 | 0.35 | 0.0004 | 0.29 | 0.0012 | acid phosphatase activity |
| Cluster-12329.26903 | 2.96 | 0.0006 | 2.77 | 0.0006 | 6-phosphofructokinase activity |
| Cluster-12329.48062 | 0.32 | 0.0051 | 0.27 | 0.0039 | 4-coumarate--CoA ligase |
| Cluster-12329.70084 | 2.63 | 0.0004 | 2.11 | 0.0187 | 4-alpha-glucanotransferase activity |
| Cluster-12329.52214 | 0.49 | 0.0342 | 0.25 | 0.0138 | 3-phosphoshikimate 1-carboxyvinyltransferase |
| Cluster-12329.33319 | 2.60 | 0.0164 | 2.92 | 0.0130 | 3-hydroxyisobutyryl-CoA hydrolase activity |
| Cluster-17679.0 | 2.02 | 0.0001 | 2.45 | 0.0000 | 1-pyrroline-5-carboxylate dehydrogenase |
| Cluster-10701.1 | 3.83 | 0.0172 | 5.11 | 0.0004 | -- |
| Cluster-12329.45692 | 0.45 | 0.0033 | 0.41 | 0.0028 | -- |
| Cluster-12329.12 | 0.43 | 0.0025 | 0.32 | 0.0086 | -- |
| Cluster-12329.15521 | 0.46 | 0.0293 | 0.38 | 0.0317 | -- |
| Cluster-12329.16465 | 2.81 | 0.0373 | 5.13 | 0.0242 | -- |
| Cluster-12329.19760 | 4.98 | 0.0022 | 6.54 | 0.0041 | -- |
| Cluster-12329.20993 | 3.82 | 0.0278 | 5.00 | 0.0146 | -- |
| Cluster-12329.21425 | 0.47 | 0.0023 | 0.26 | 0.0001 | -- |
| Cluster-12329.22132 | 2.83 | 0.0051 | 2.06 | 0.0416 | -- |
| Cluster-12329.24467 | 5.39 | 0.0001 | 6.15 | 0.0240 | -- |
| Cluster-12329.26112 | 2.72 | 0.0034 | 2.15 | 0.0499 | -- |
| Cluster-12329.30725 | 0.39 | 0.0245 | 0.16 | 0.0296 | -- |
| Cluster-12329.30855 | 0.33 | 0.0192 | 0.39 | 0.0190 | -- |
| Cluster-12329.31252 | 2.46 | 0.0419 | 15.22 | 0.0079 | -- |
| Cluster-12329.32559 | 2.00 | 0.0241 | 2.87 | 0.0202 | -- |
| Cluster-12329.33447 | 2.36 | 0.0060 | 2.27 | 0.0161 | -- |
| Cluster-12329.34089 | 2.03 | 0.0055 | 2.41 | 0.0016 | -- |
| Cluster-12329.34631 | 0.27 | 0.0001 | 0.18 | 0.0000 | -- |
| Cluster-12329.37085 | 0.37 | 0.0226 | 0.33 | 0.0384 | -- |
| Cluster-12329.37995 | 0.11 | 0.0119 | 0.24 | 0.0145 | -- |
| Cluster-12329.40468 | 0.46 | 0.0318 | 0.24 | 0.0156 | -- |
| Cluster-12329.40963 | 0.45 | 0.0022 | 0.21 | 0.0016 | -- |
| Cluster-12329.40989 | 2.99 | 0.0472 | 4.62 | 0.0085 | -- |
| Cluster-12329.41906 | 7.56 | 0.0001 | 6.54 | 0.0353 | -- |
| Cluster-12329.41956 | 6.01 | 0.0008 | 9.31 | 0.0266 | -- |
| Cluster-12329.42024 | 0.50 | 0.0204 | 0.42 | 0.0345 | -- |
| Cluster-12329.42053 | 0.34 | 0.0113 | 0.21 | 0.0041 | -- |
| Cluster-12329.42685 | 2.09 | 0.0018 | 2.25 | 0.0012 | -- |
| Cluster-12329.44022 | 2.01 | 0.0371 | 2.89 | 0.0033 | -- |
| Cluster-12329.44215 | 7.51 | 0.0198 | 5.86 | 0.0018 | -- |
| Cluster-12329.44647 | 0.41 | 0.0328 | 0.33 | 0.0242 | -- |
| Cluster-12329.44648 | 0.39 | 0.0017 | 0.24 | 0.0010 | -- |
| Cluster-12329.44648 | 0.29 | 0.0018 | 0.32 | 0.0020 | -- |
| Cluster-12329.44802 | 0.41 | 0.0005 | 0.40 | 0.0044 | -- |
| Cluster-12329.44810 | 3.53 | 0.0073 | 3.62 | 0.0070 | -- |
| Cluster-12329.45397 | 2.46 | 0.0003 | 2.44 | 0.0000 | -- |
| Cluster-12329.45476 | 2.10 | 0.0290 | 3.18 | 0.0110 | -- |
| Cluster-12329.45721 | 2.84 | 0.0371 | 4.08 | 0.0124 | -- |
| Cluster-12329.45893 | 0.41 | 0.0104 | 0.32 | 0.0171 | -- |
| Cluster-12329.46781 | 0.42 | 0.0123 | 0.26 | 0.0052 | -- |
| Cluster-12329.48367 | 0.46 | 0.0180 | 0.45 | 0.0181 | -- |
| Cluster-12329.51534 | 0.30 | 0.0220 | 0.28 | 0.0188 | -- |
| Cluster-12329.51806 | 0.37 | 0.0030 | 0.16 | 0.0009 | -- |
| Cluster-12329.53646 | 0.25 | 0.0078 | 0.13 | 0.0200 | -- |
| Cluster-12329.53863 | 0.48 | 0.0359 | 0.36 | 0.0195 | -- |
| Cluster-12329.54583 | 3.24 | 0.0014 | 3.14 | 0.0027 | -- |
| Cluster-12329.54669 | 0.34 | 0.0011 | 0.39 | 0.0005 | -- |
| Cluster-12329.55286 | 0.19 | 0.0317 | 0.29 | 0.0432 | -- |
| Cluster-12329.55503 | 2.30 | 0.0049 | 2.24 | 0.0148 | -- |
| Cluster-12329.55504 | 4.14 | 0.0401 | 3.92 | 0.0005 | -- |
| Cluster-12329.55770 | 2.80 | 0.0096 | 3.73 | 0.0397 | -- |
| Cluster-12329.55856 | 2.20 | 0.0263 | 2.48 | 0.0195 | -- |
| Cluster-12329.56671 | 0.33 | 0.0117 | 0.36 | 0.0185 | -- |
| Cluster-12329.63149 | 0.19 | 0.0006 | 0.09 | 0.0001 | -- |
| Cluster-12329.63577 | 3.94 | 0.0436 | 3.01 | 0.0429 | -- |
| Cluster-12329.64664 | 2.64 | 0.0467 | 2.82 | 0.0048 | -- |
| Cluster-12329.65108 | 2.83 | 0.0018 | 3.37 | 0.0156 | -- |
| Cluster-12329.66452 | 3.06 | 0.0005 | 3.11 | 0.0014 | -- |
| Cluster-12329.68807 | 2.60 | 0.0273 | 2.80 | 0.0024 | -- |
| Cluster-12329.69143 | 4.48 | 0.0015 | 4.44 | 0.0120 | -- |
| Cluster-12329.75135 | 7.23 | 0.0051 | 6.71 | 0.0198 | -- |
| Cluster-2111.0 | 0.47 | 0.0487 | 0.26 | 0.0296 | -- |
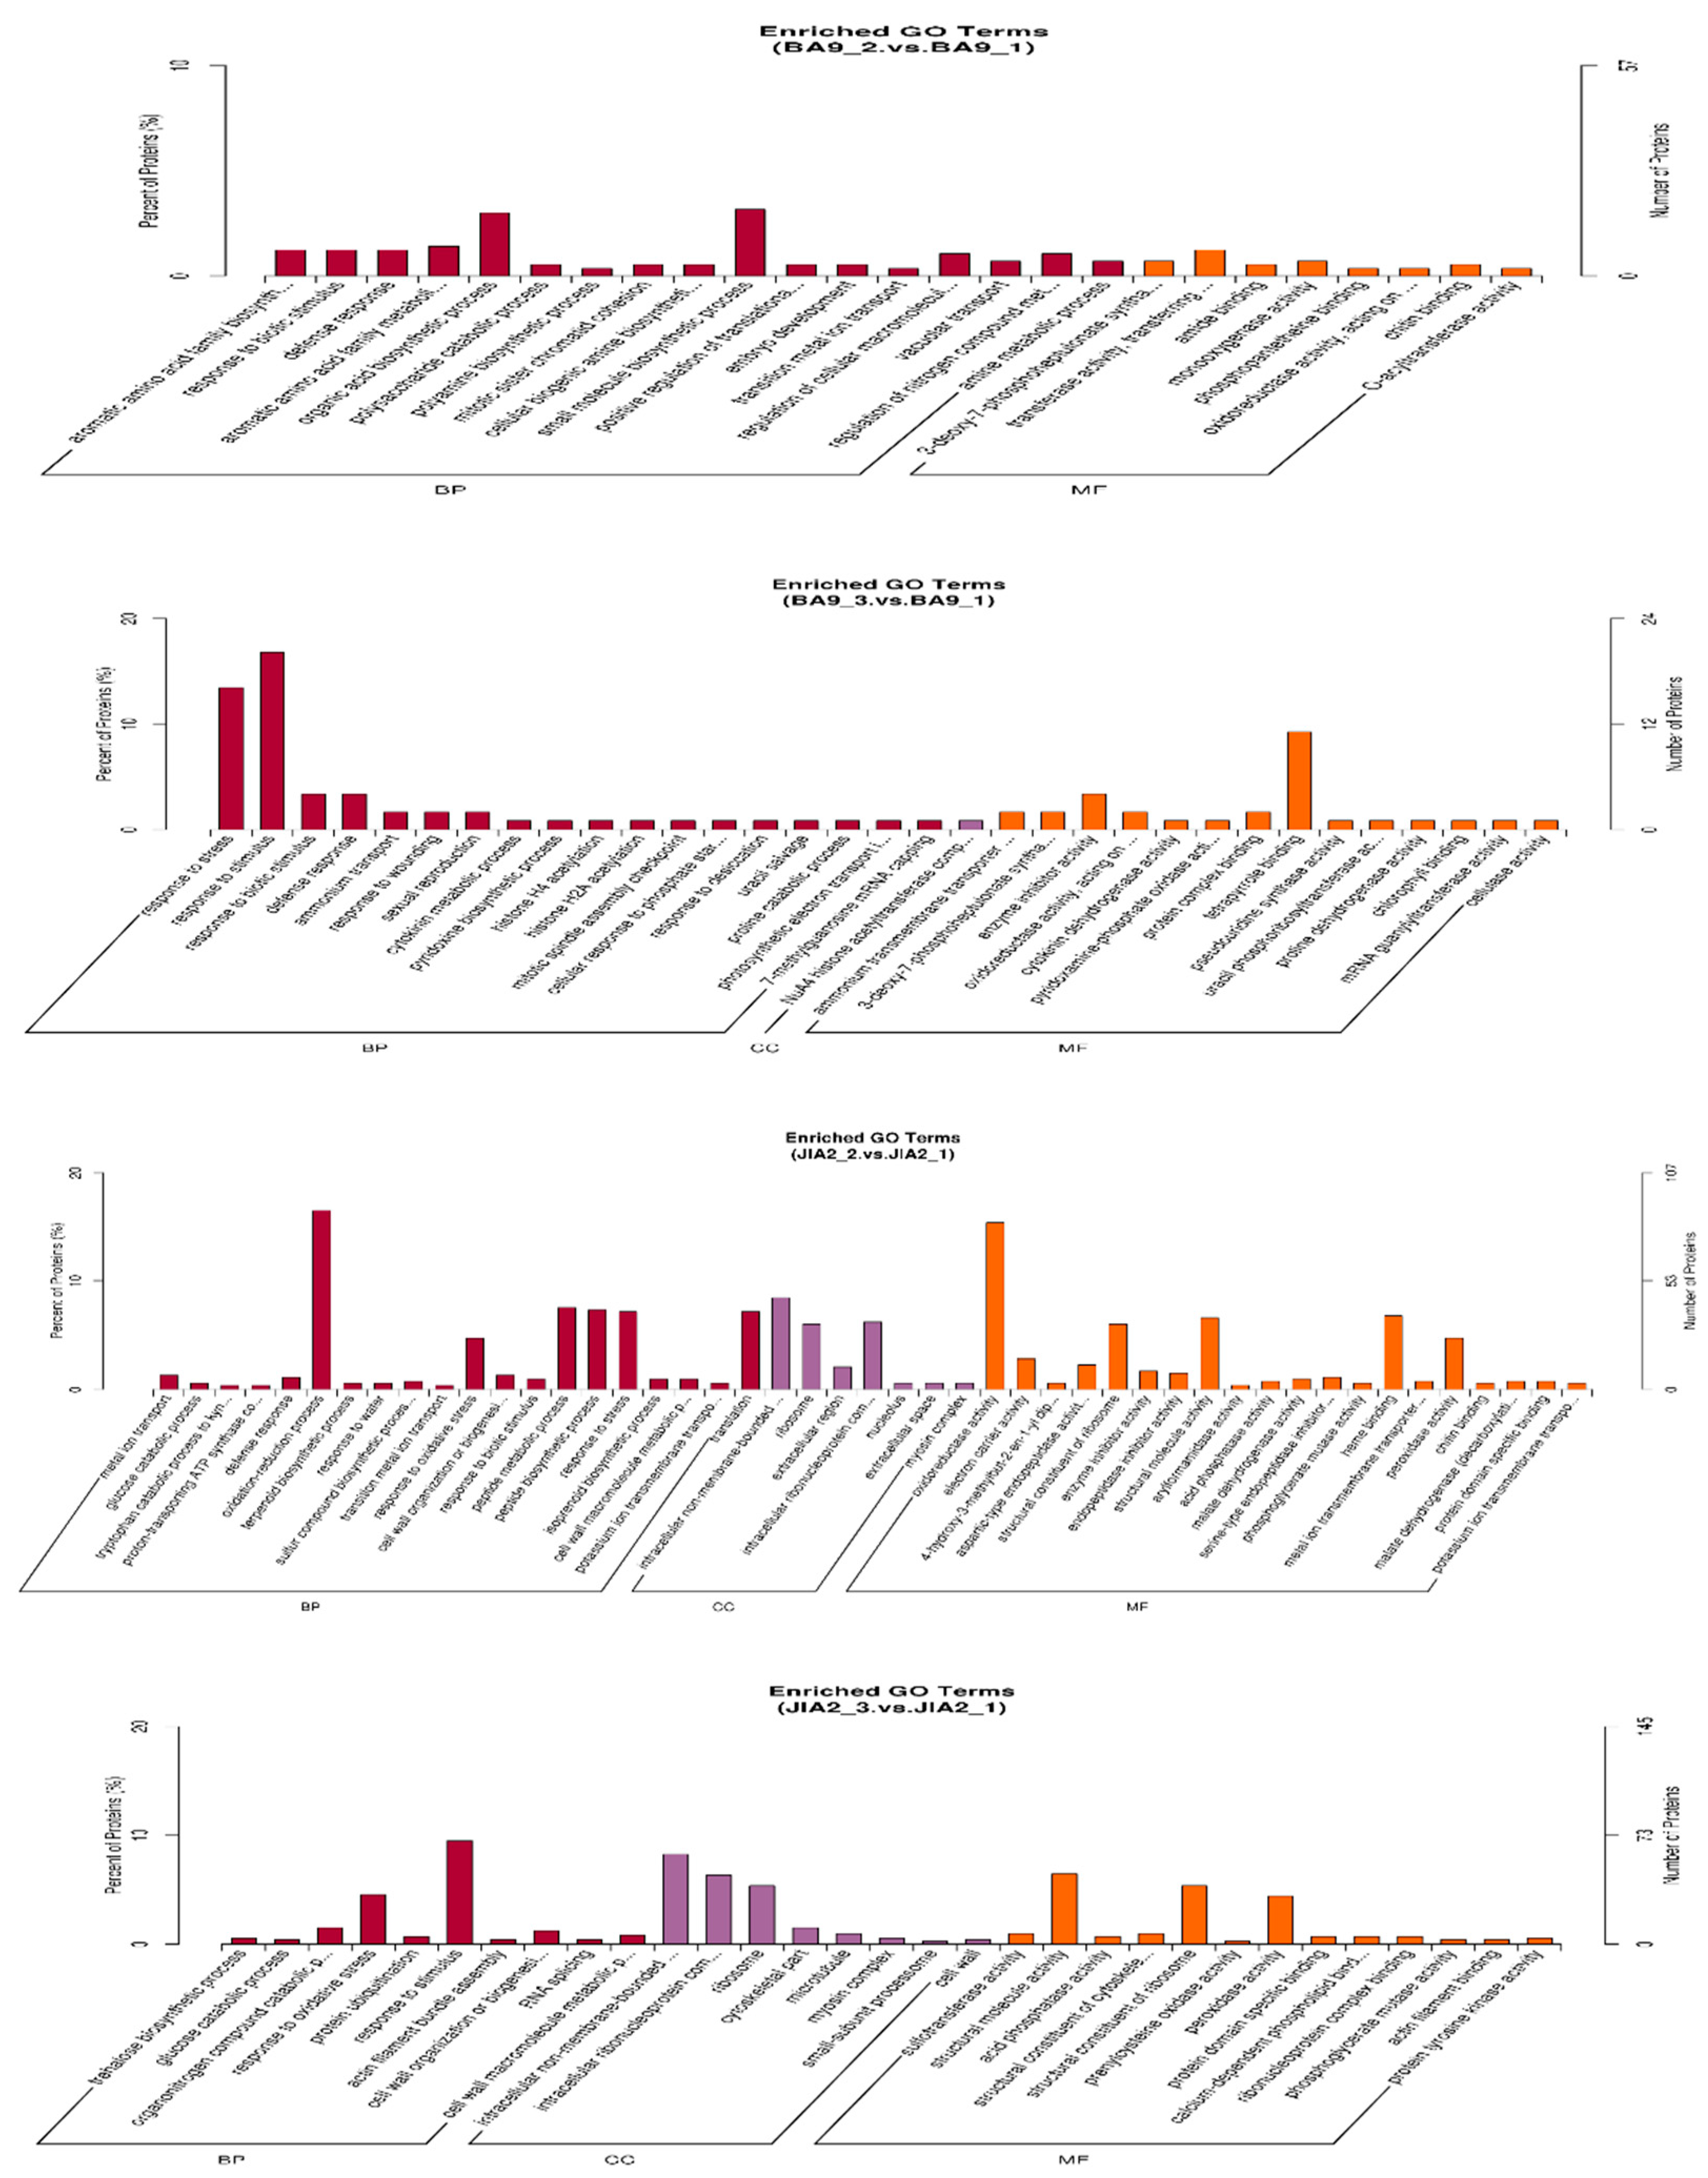
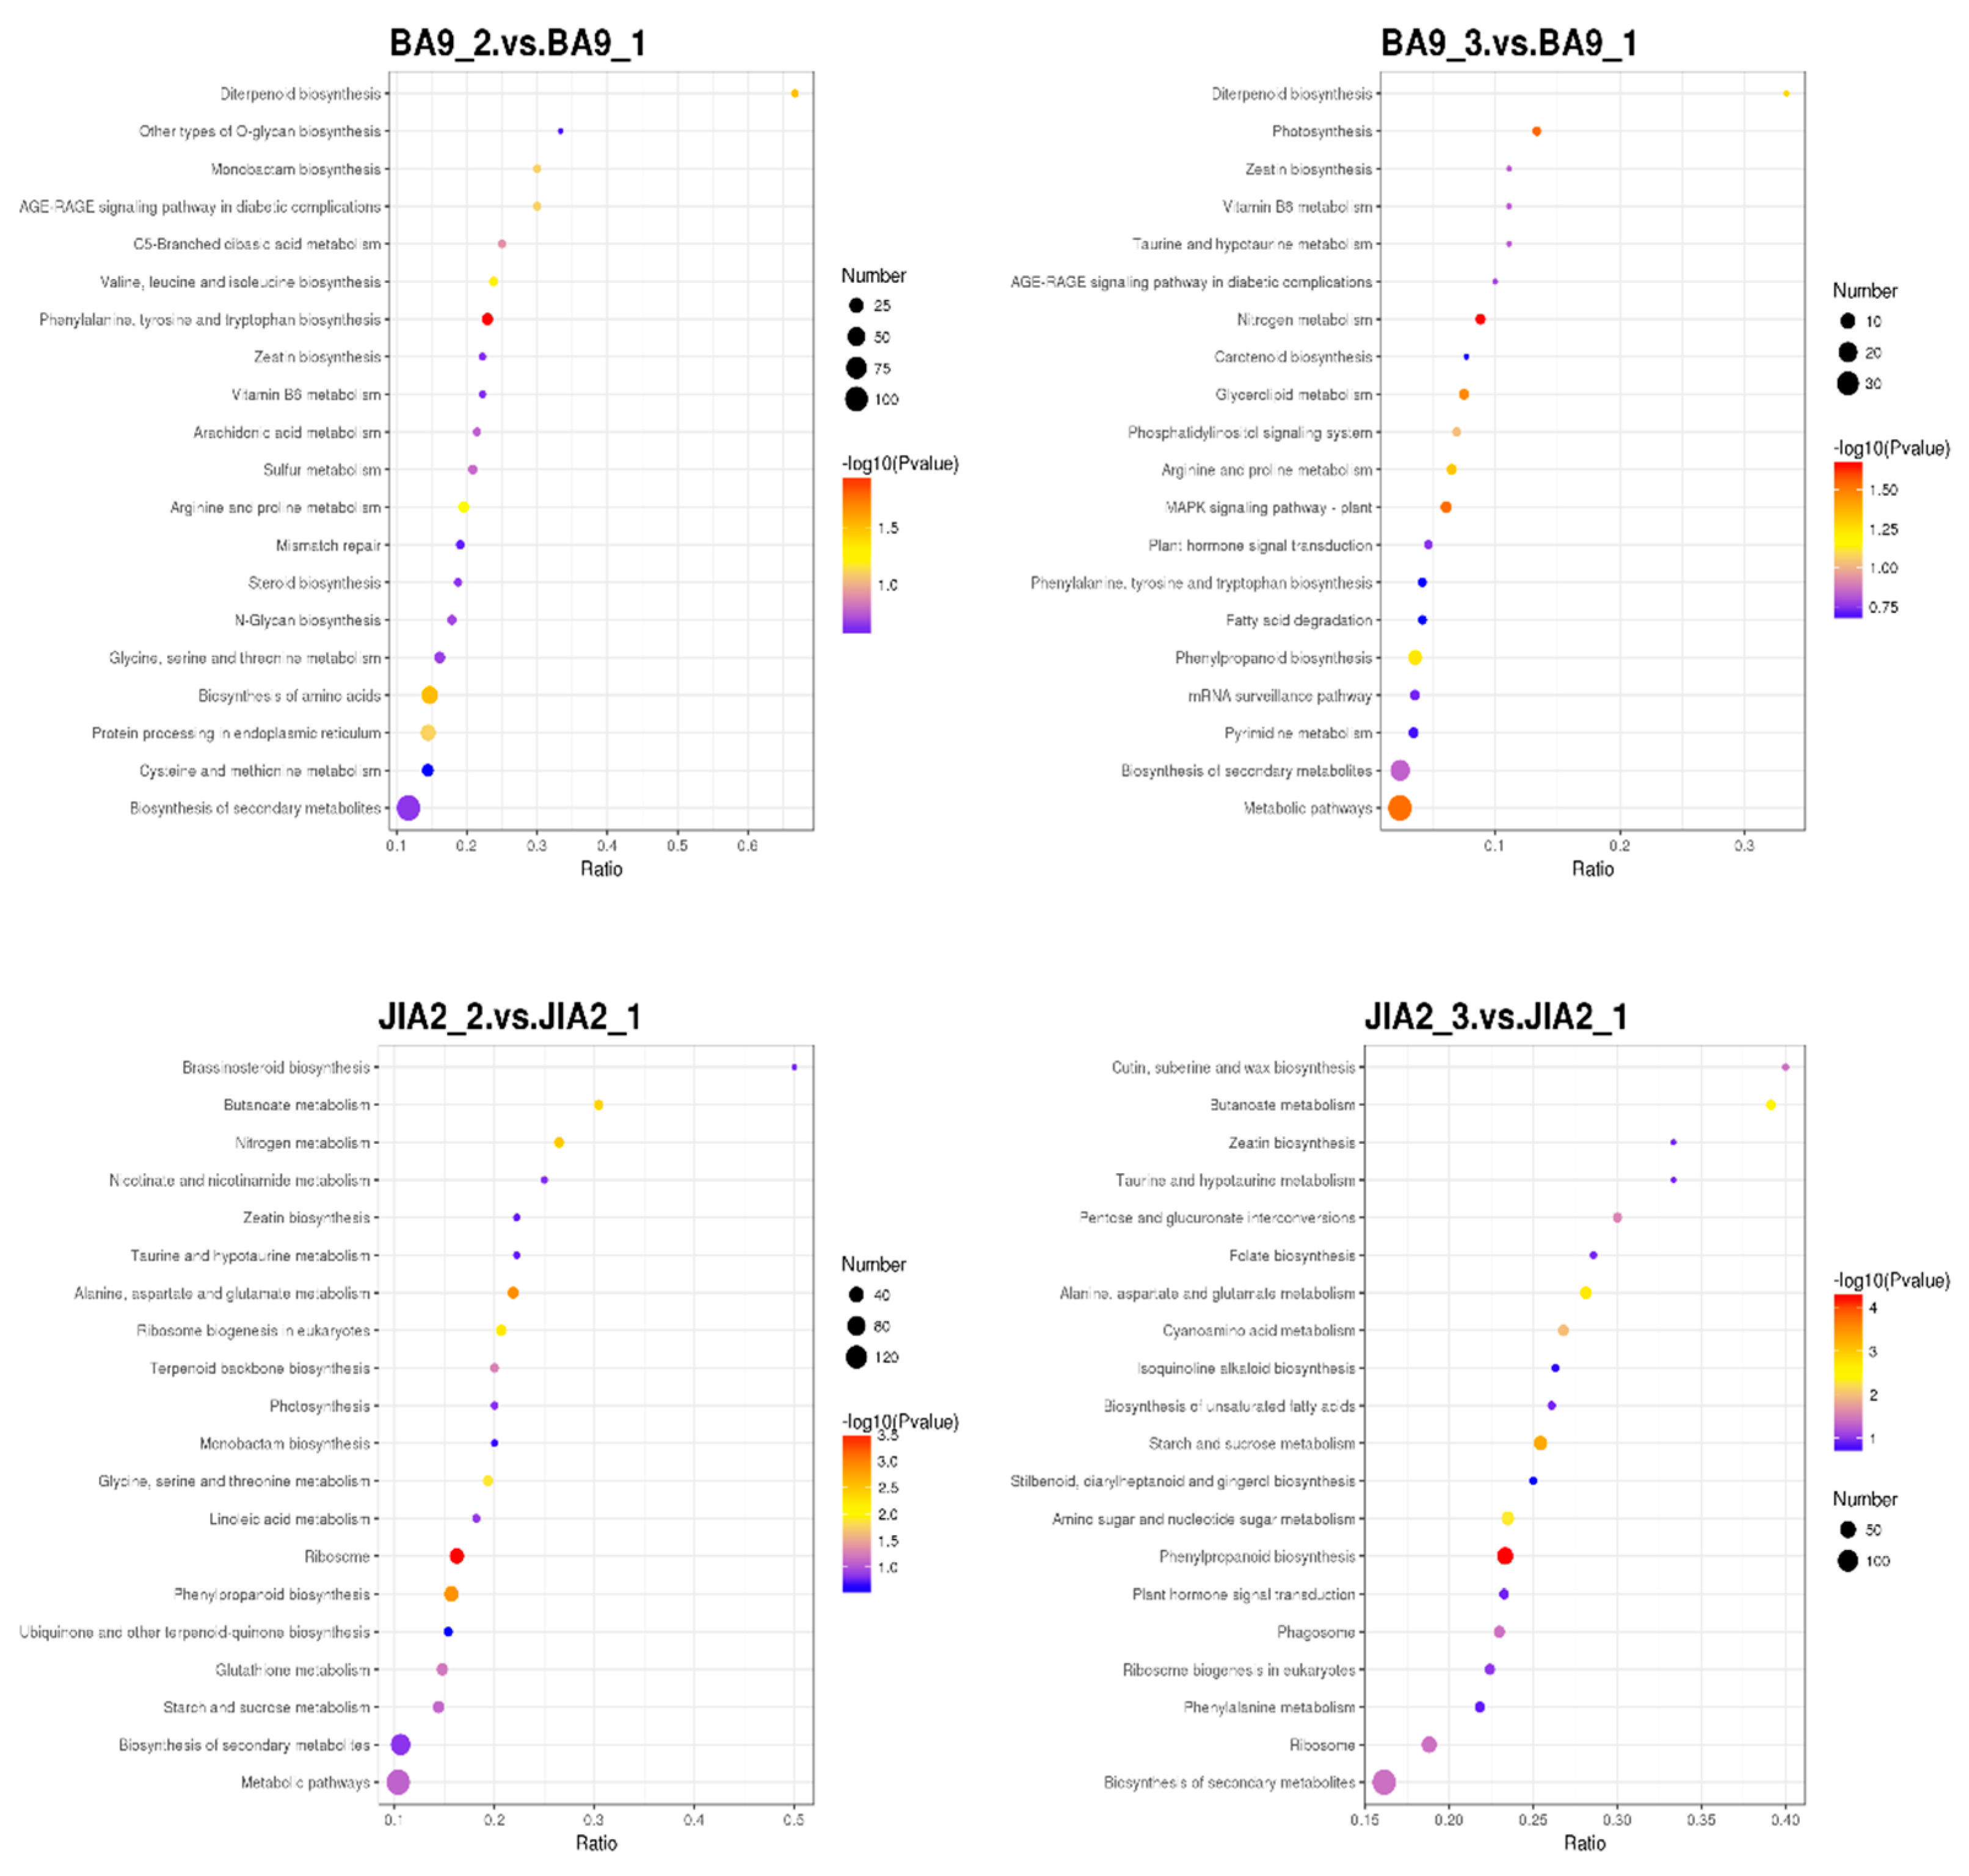
2.9. GO and KEGG Enrichment Analyses of DEPs
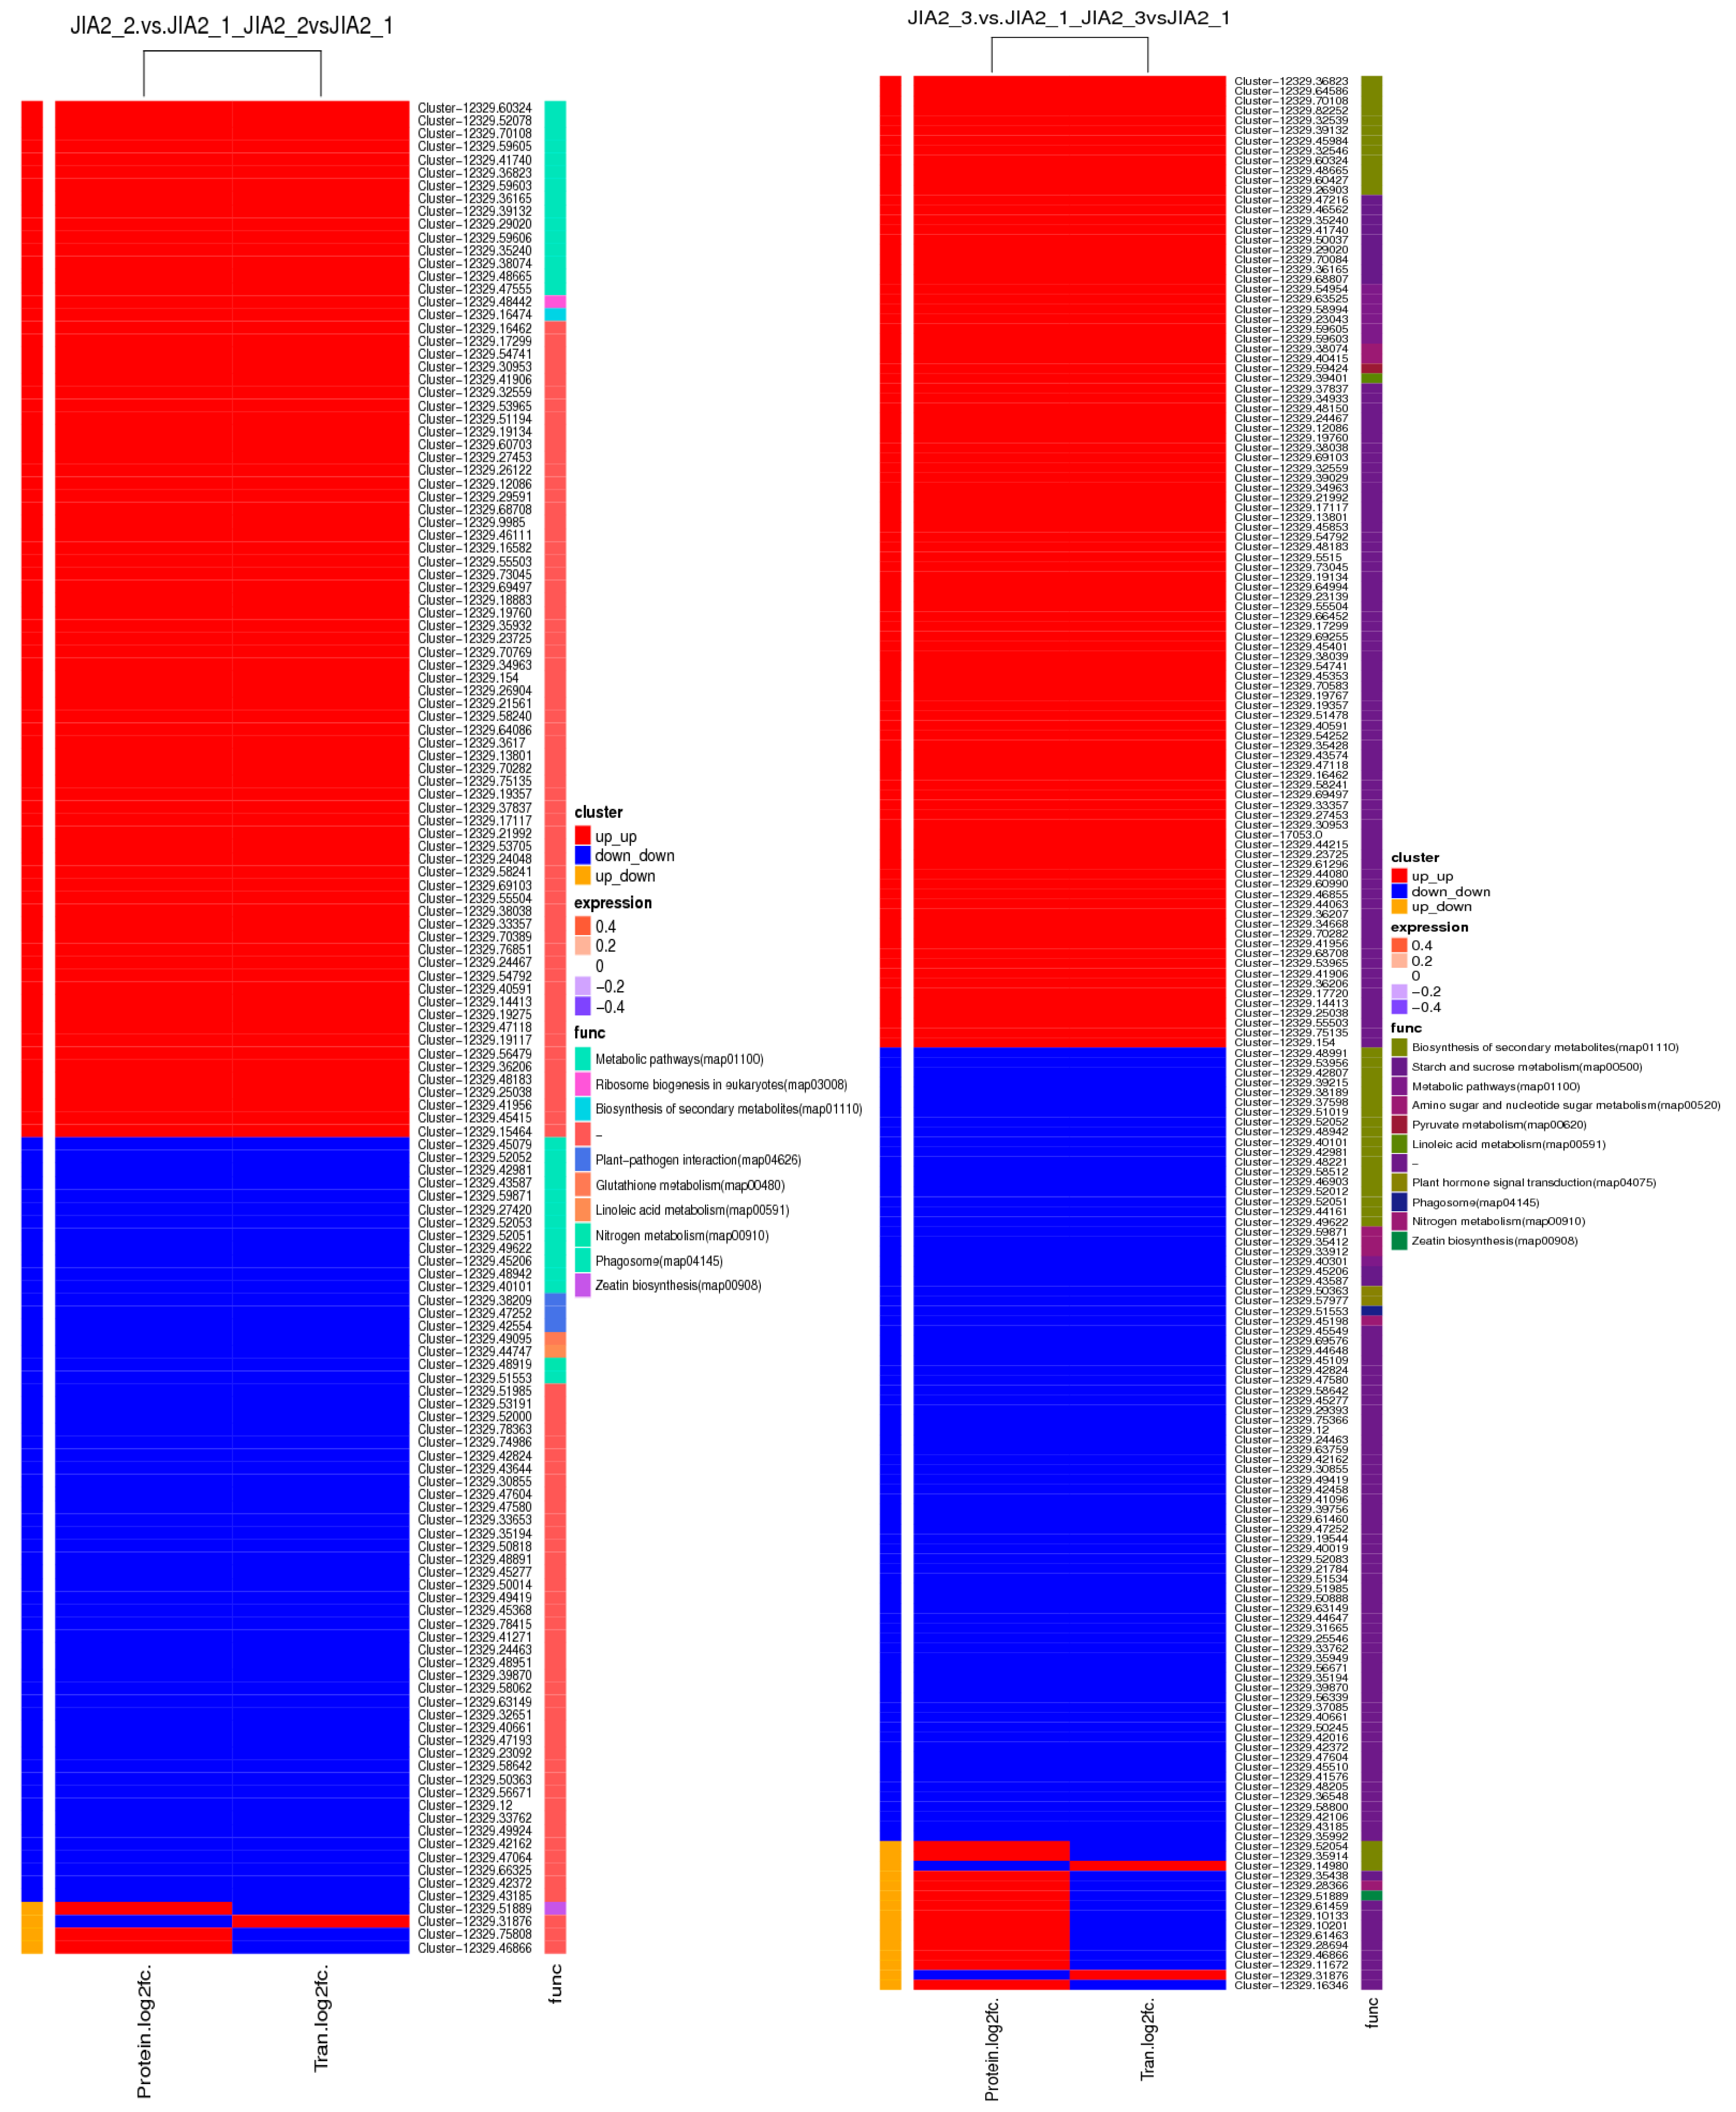
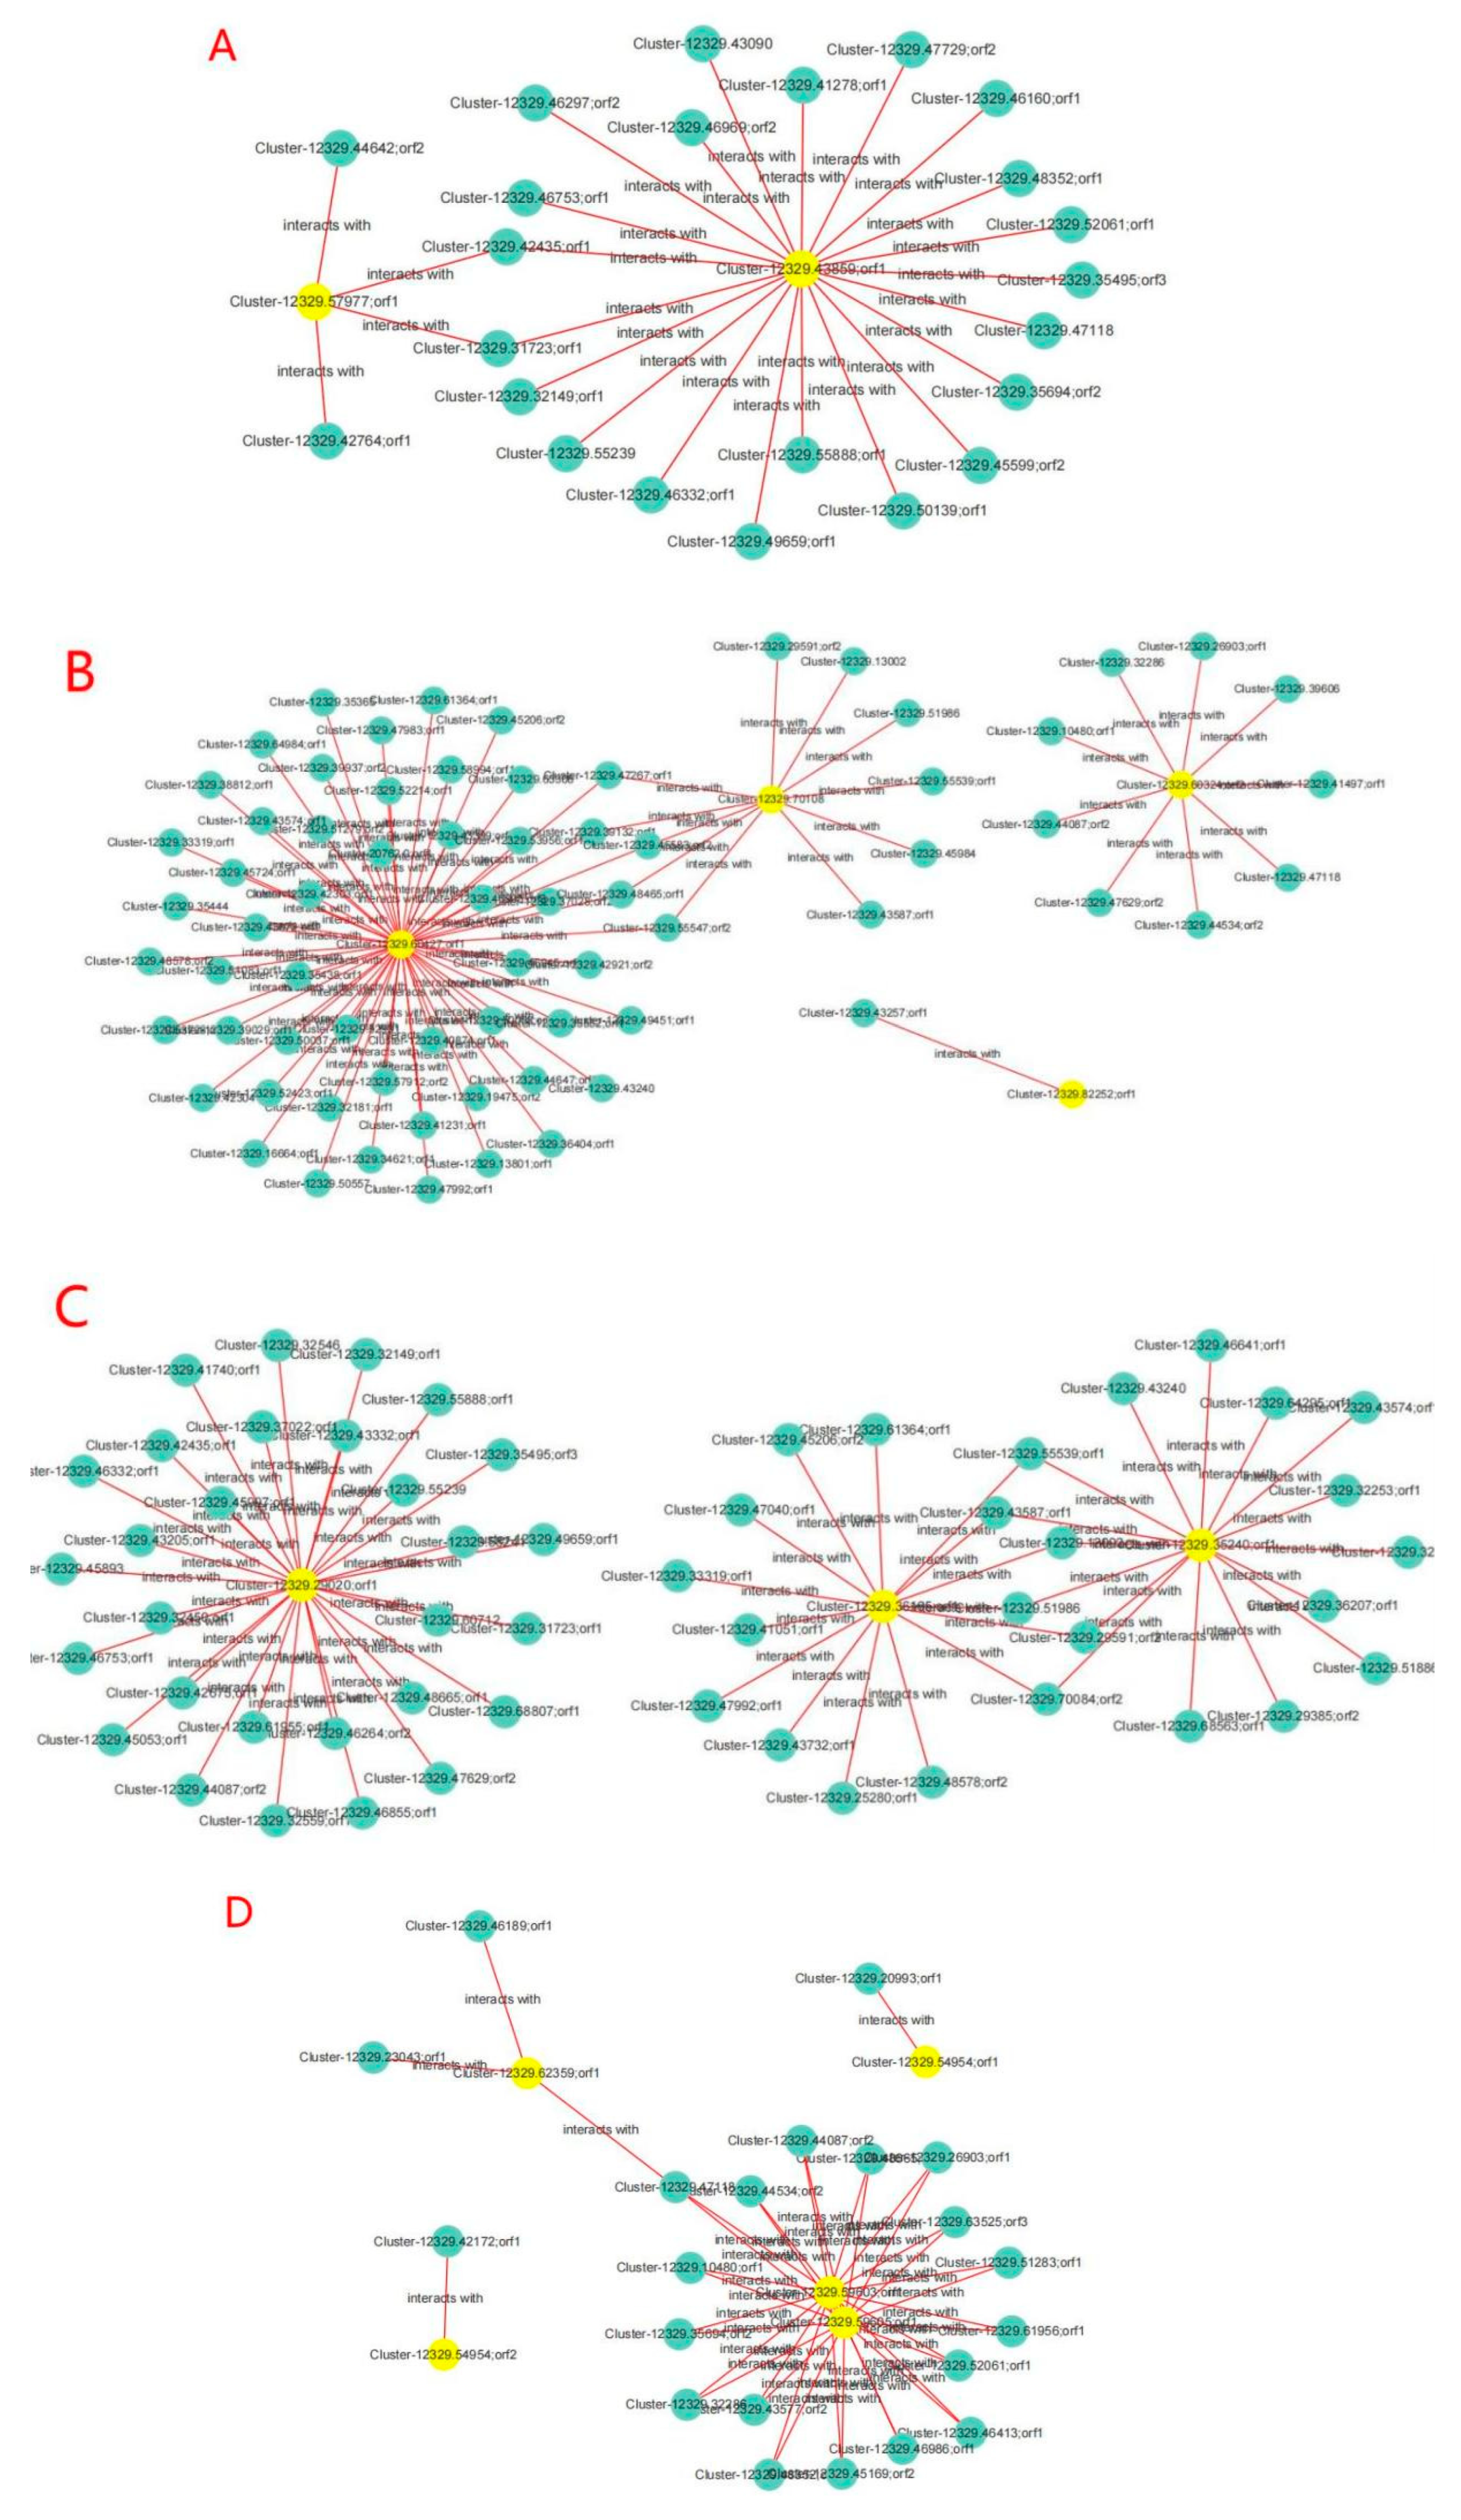
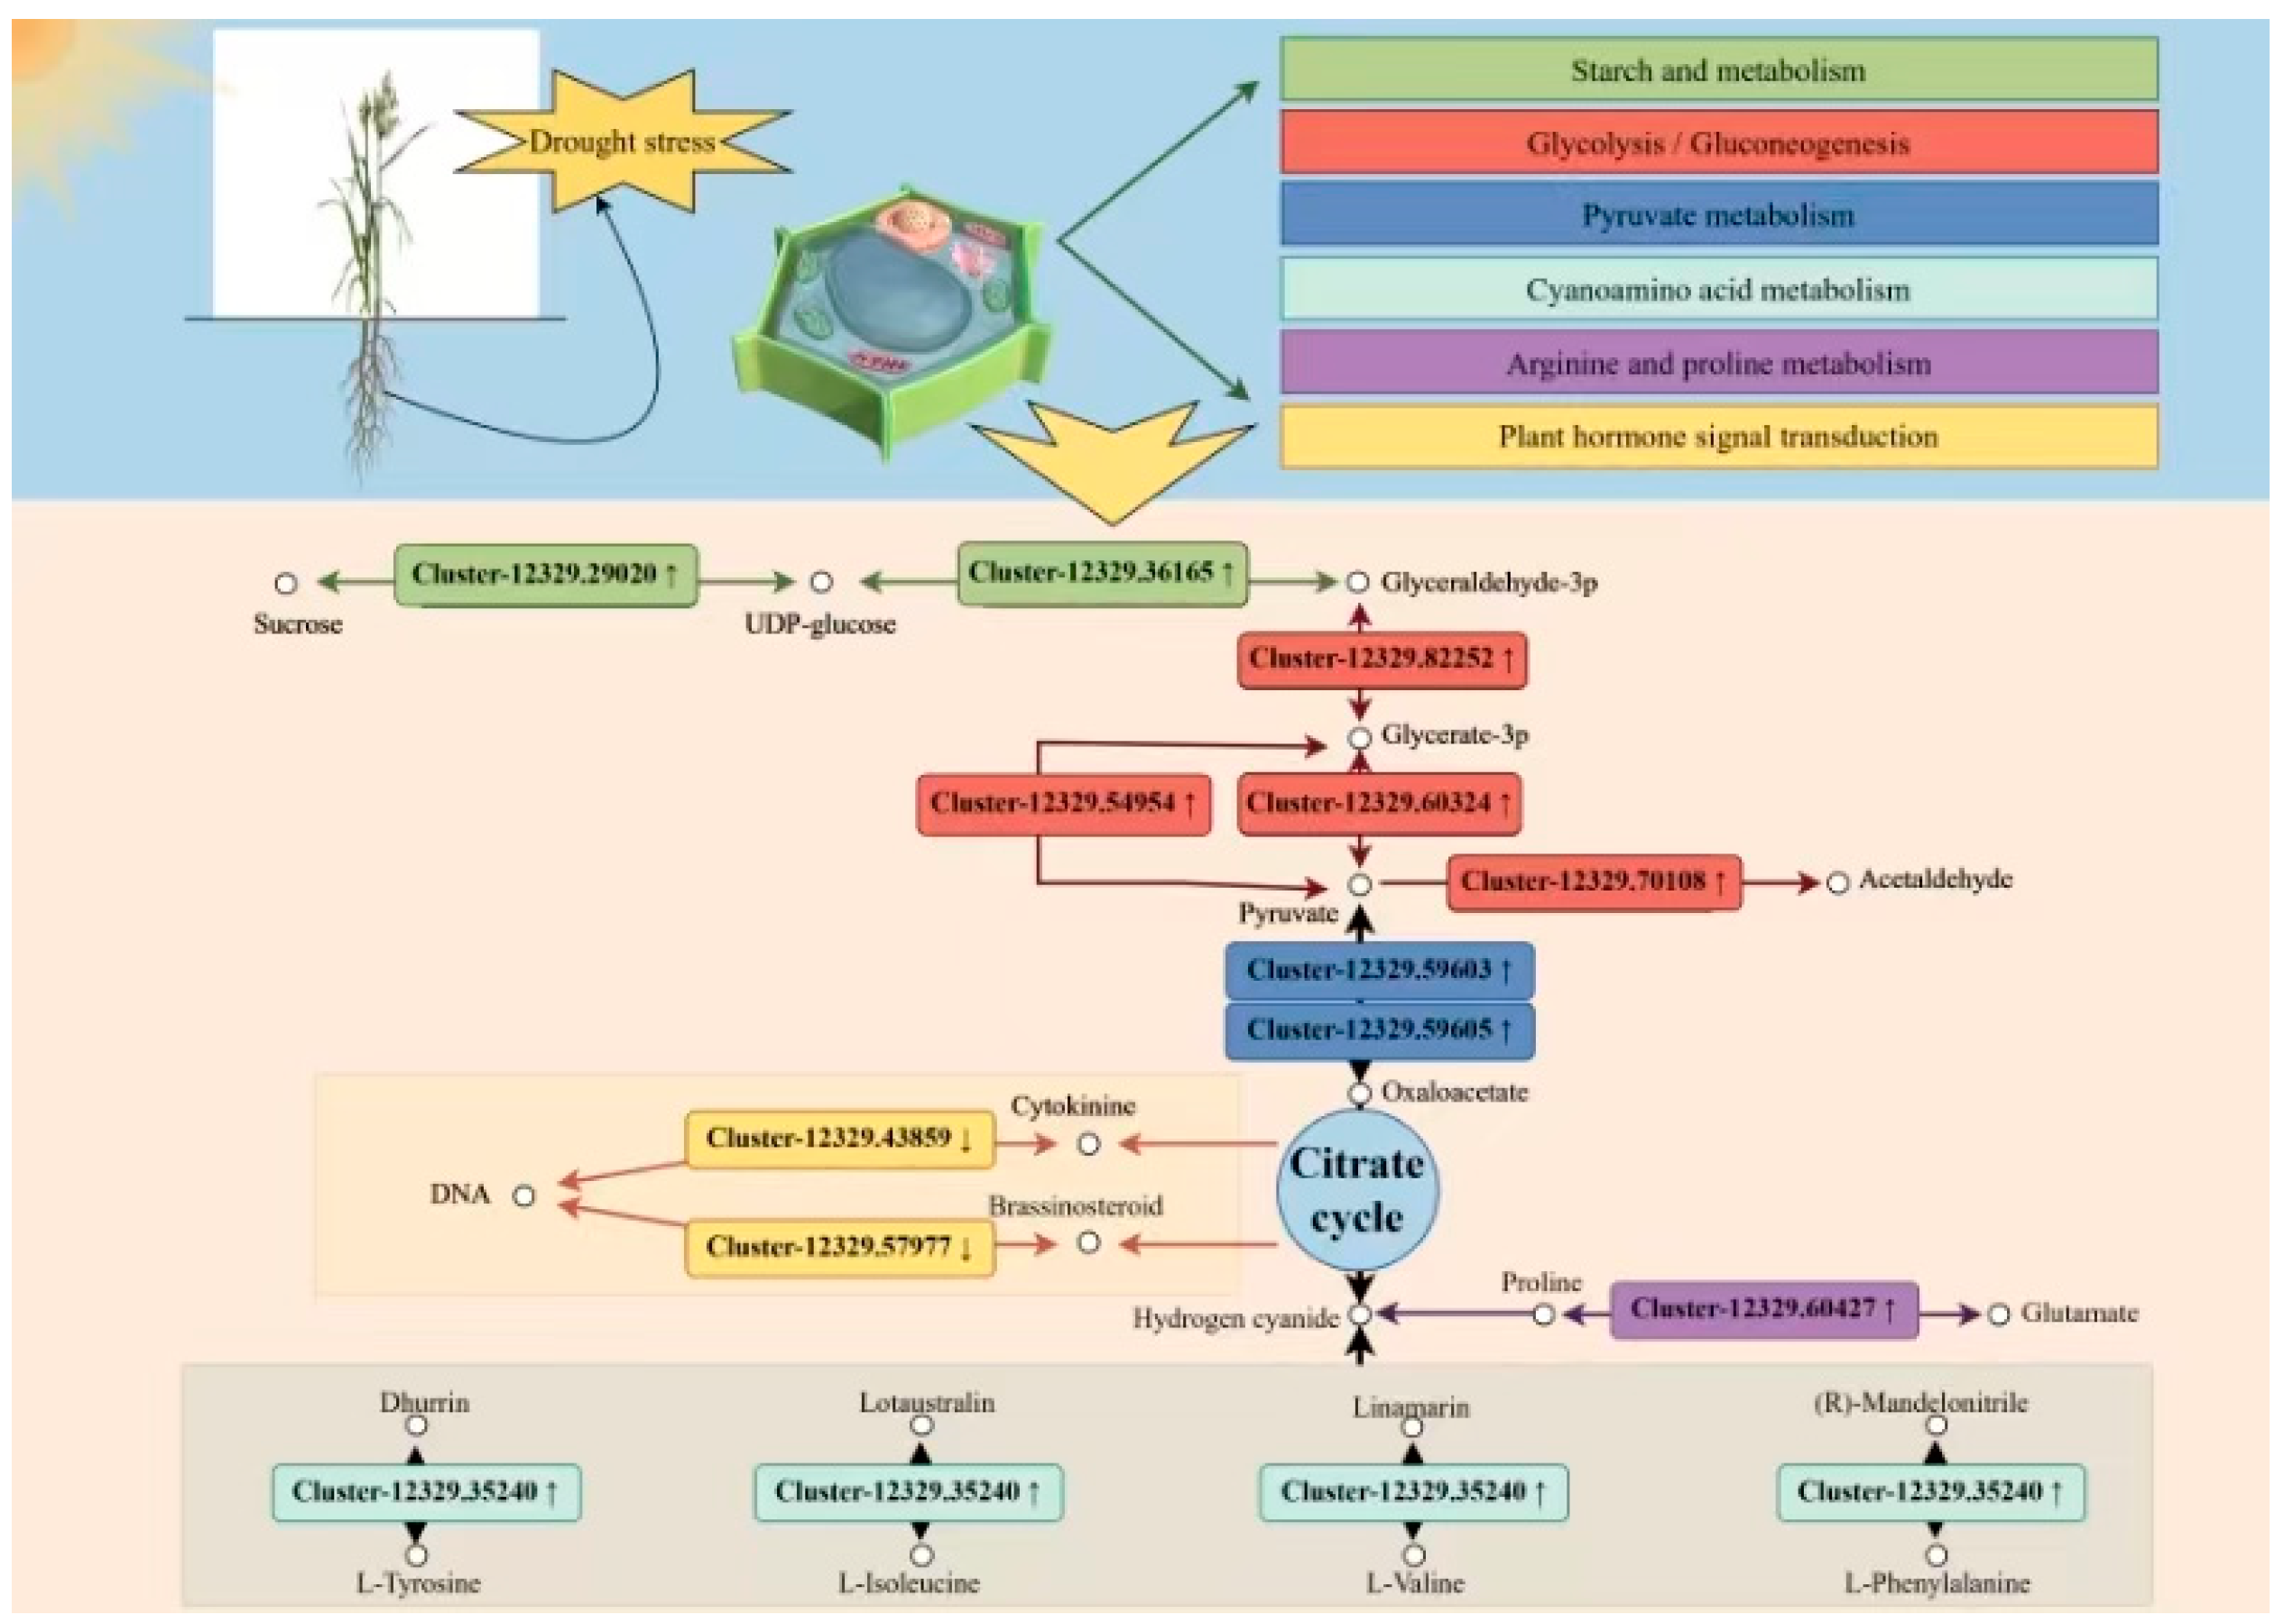
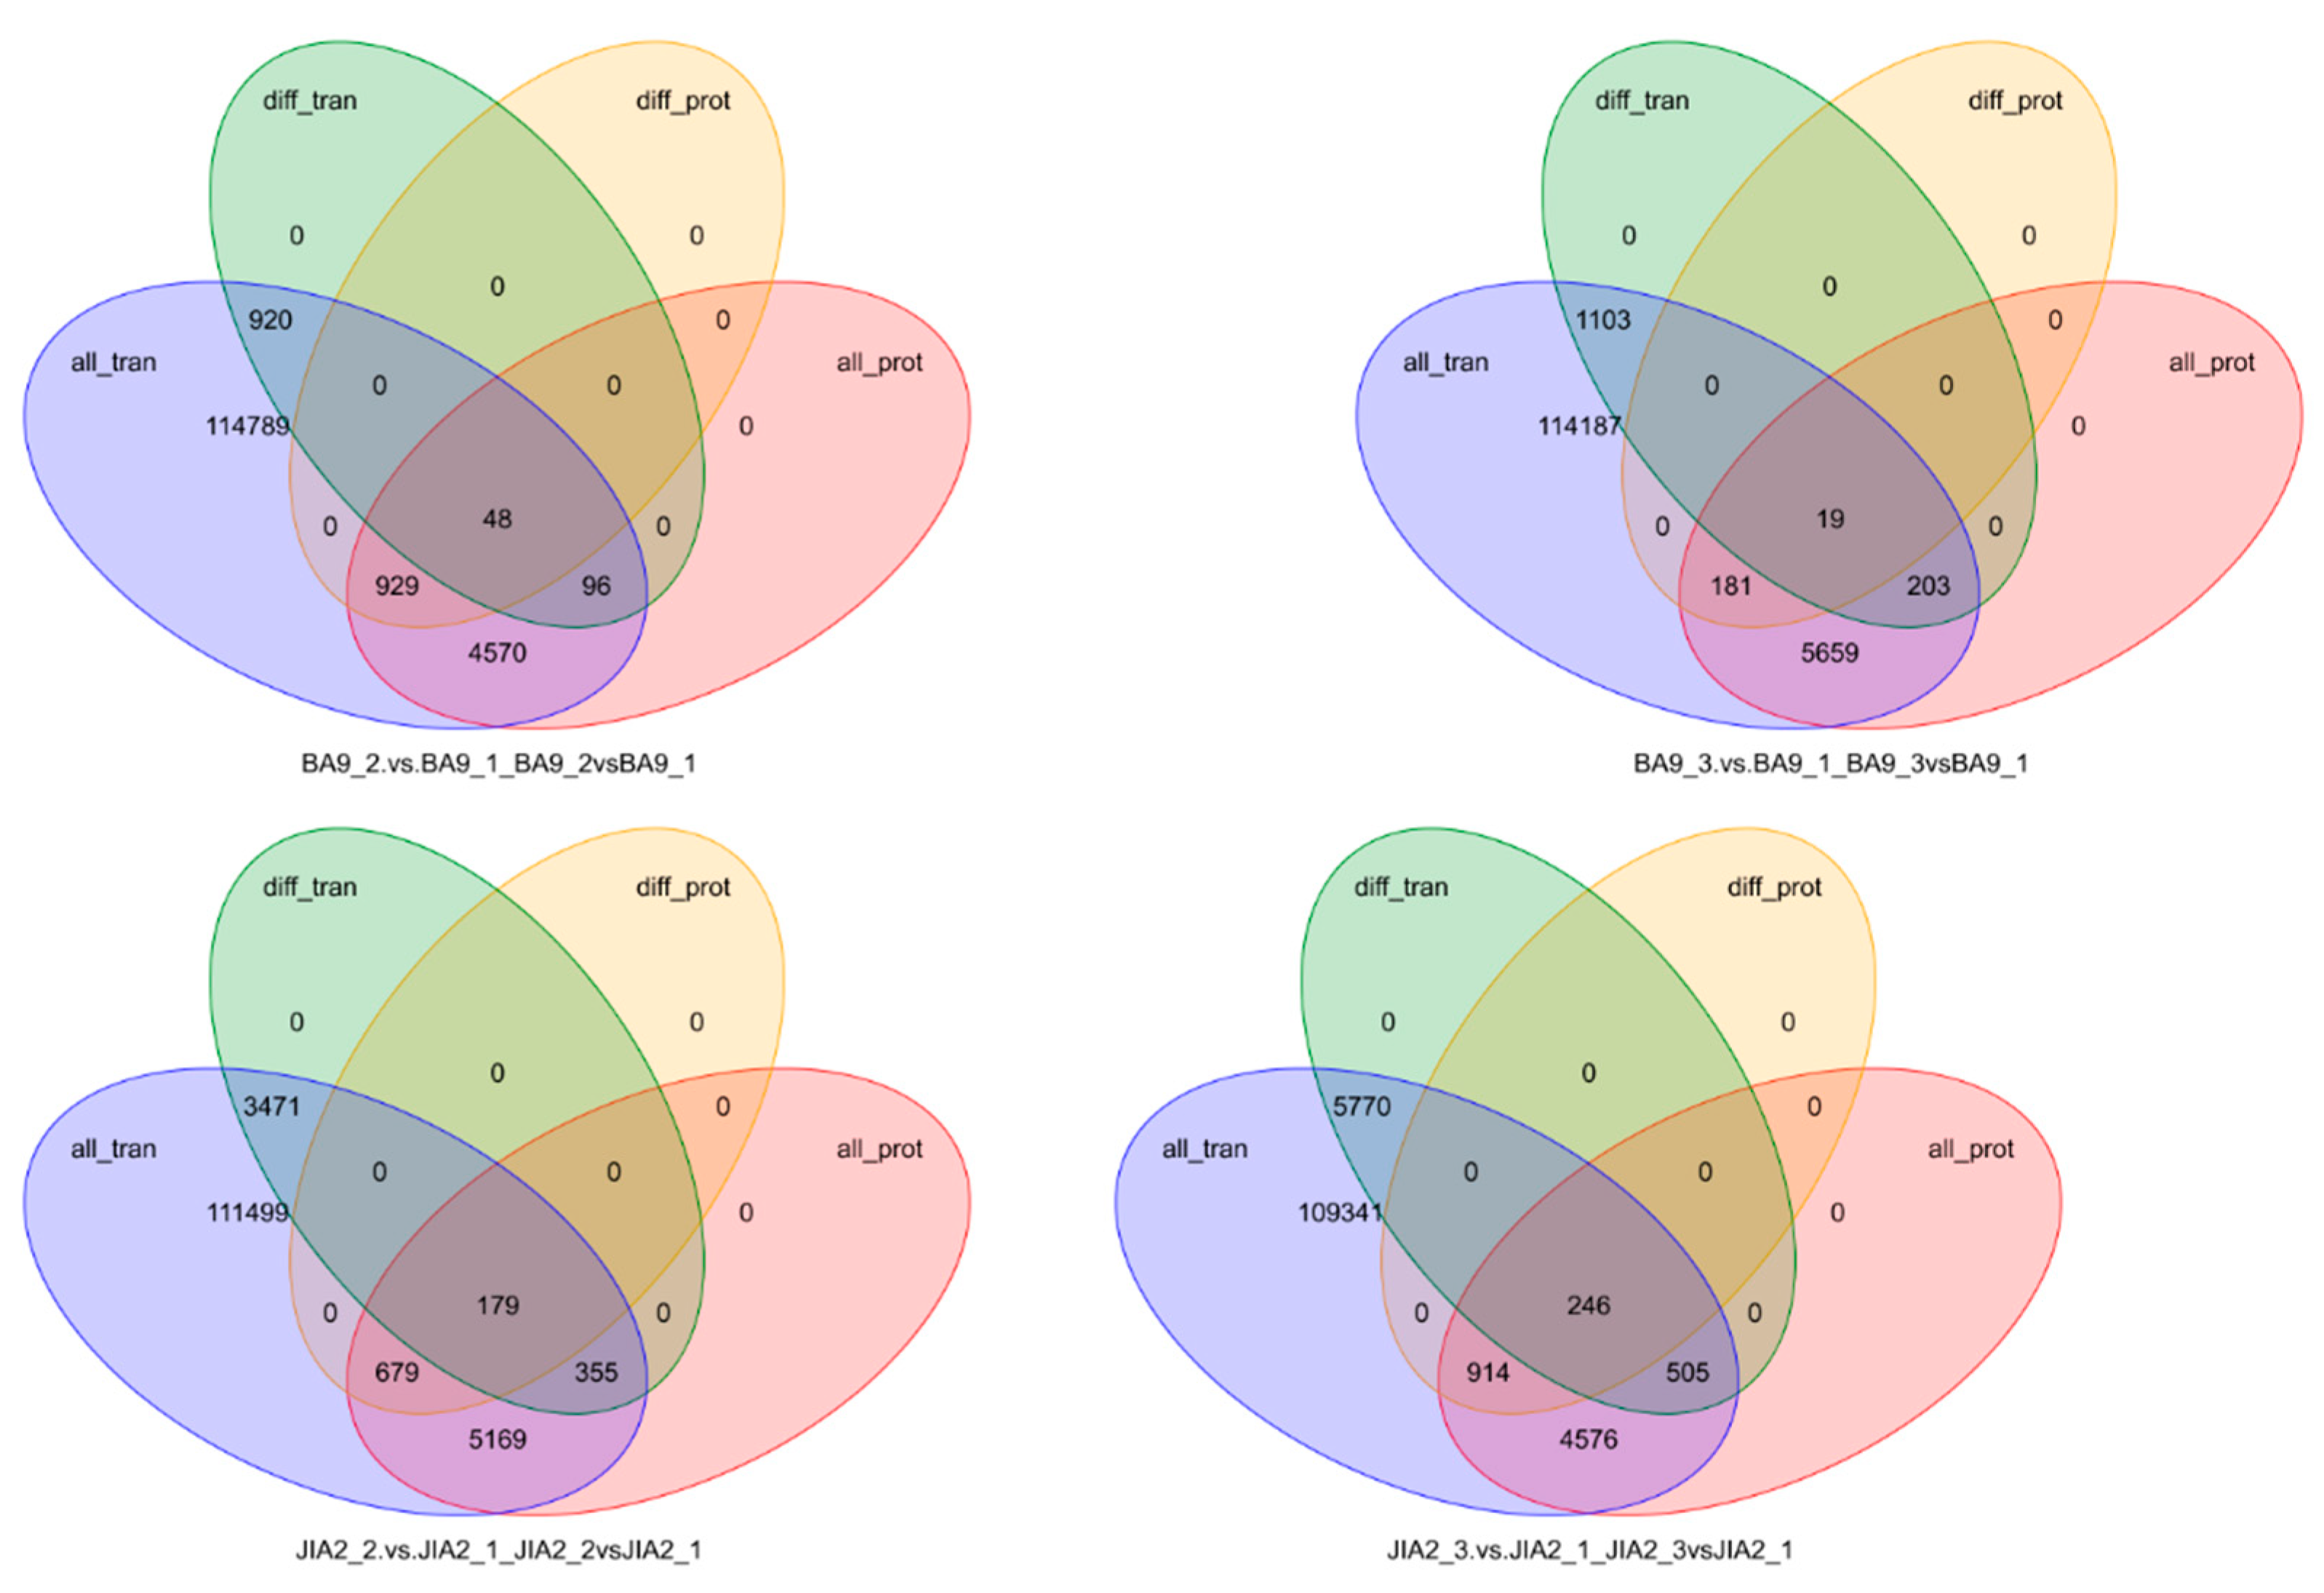
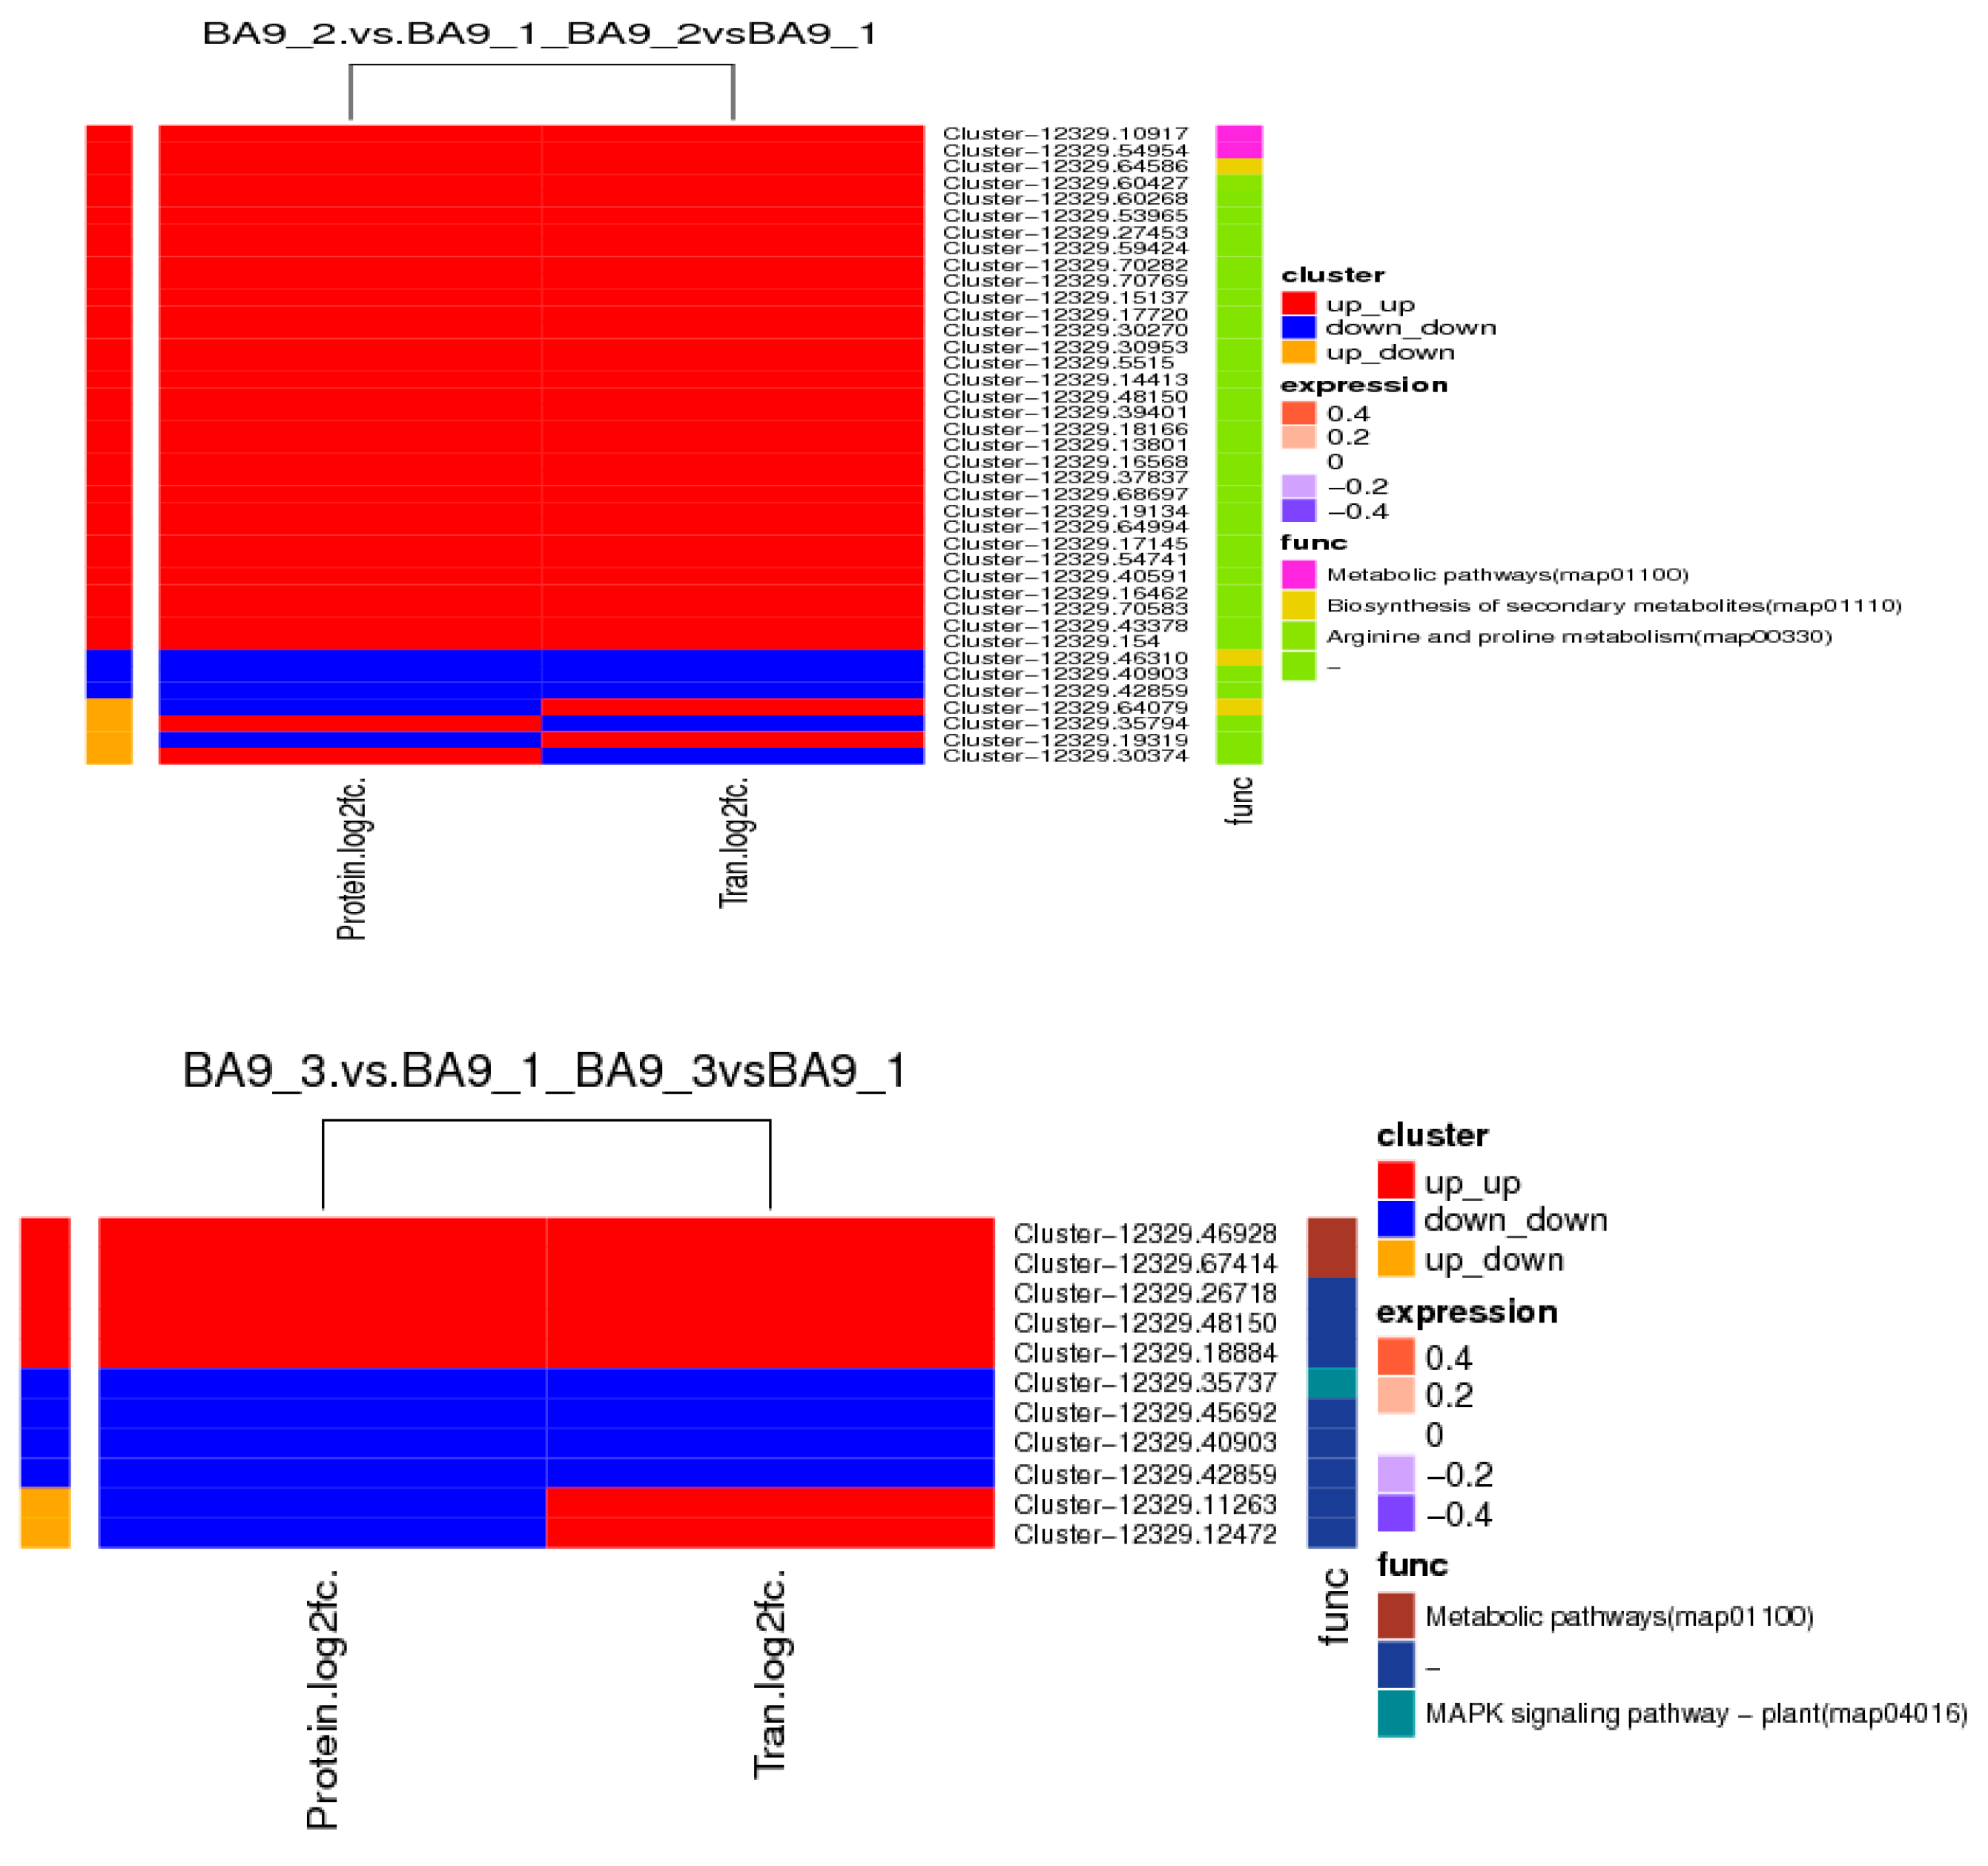
2.10. Transcriptomic and Proteomic Correlation Analysis of Oat Response to Drought Stress
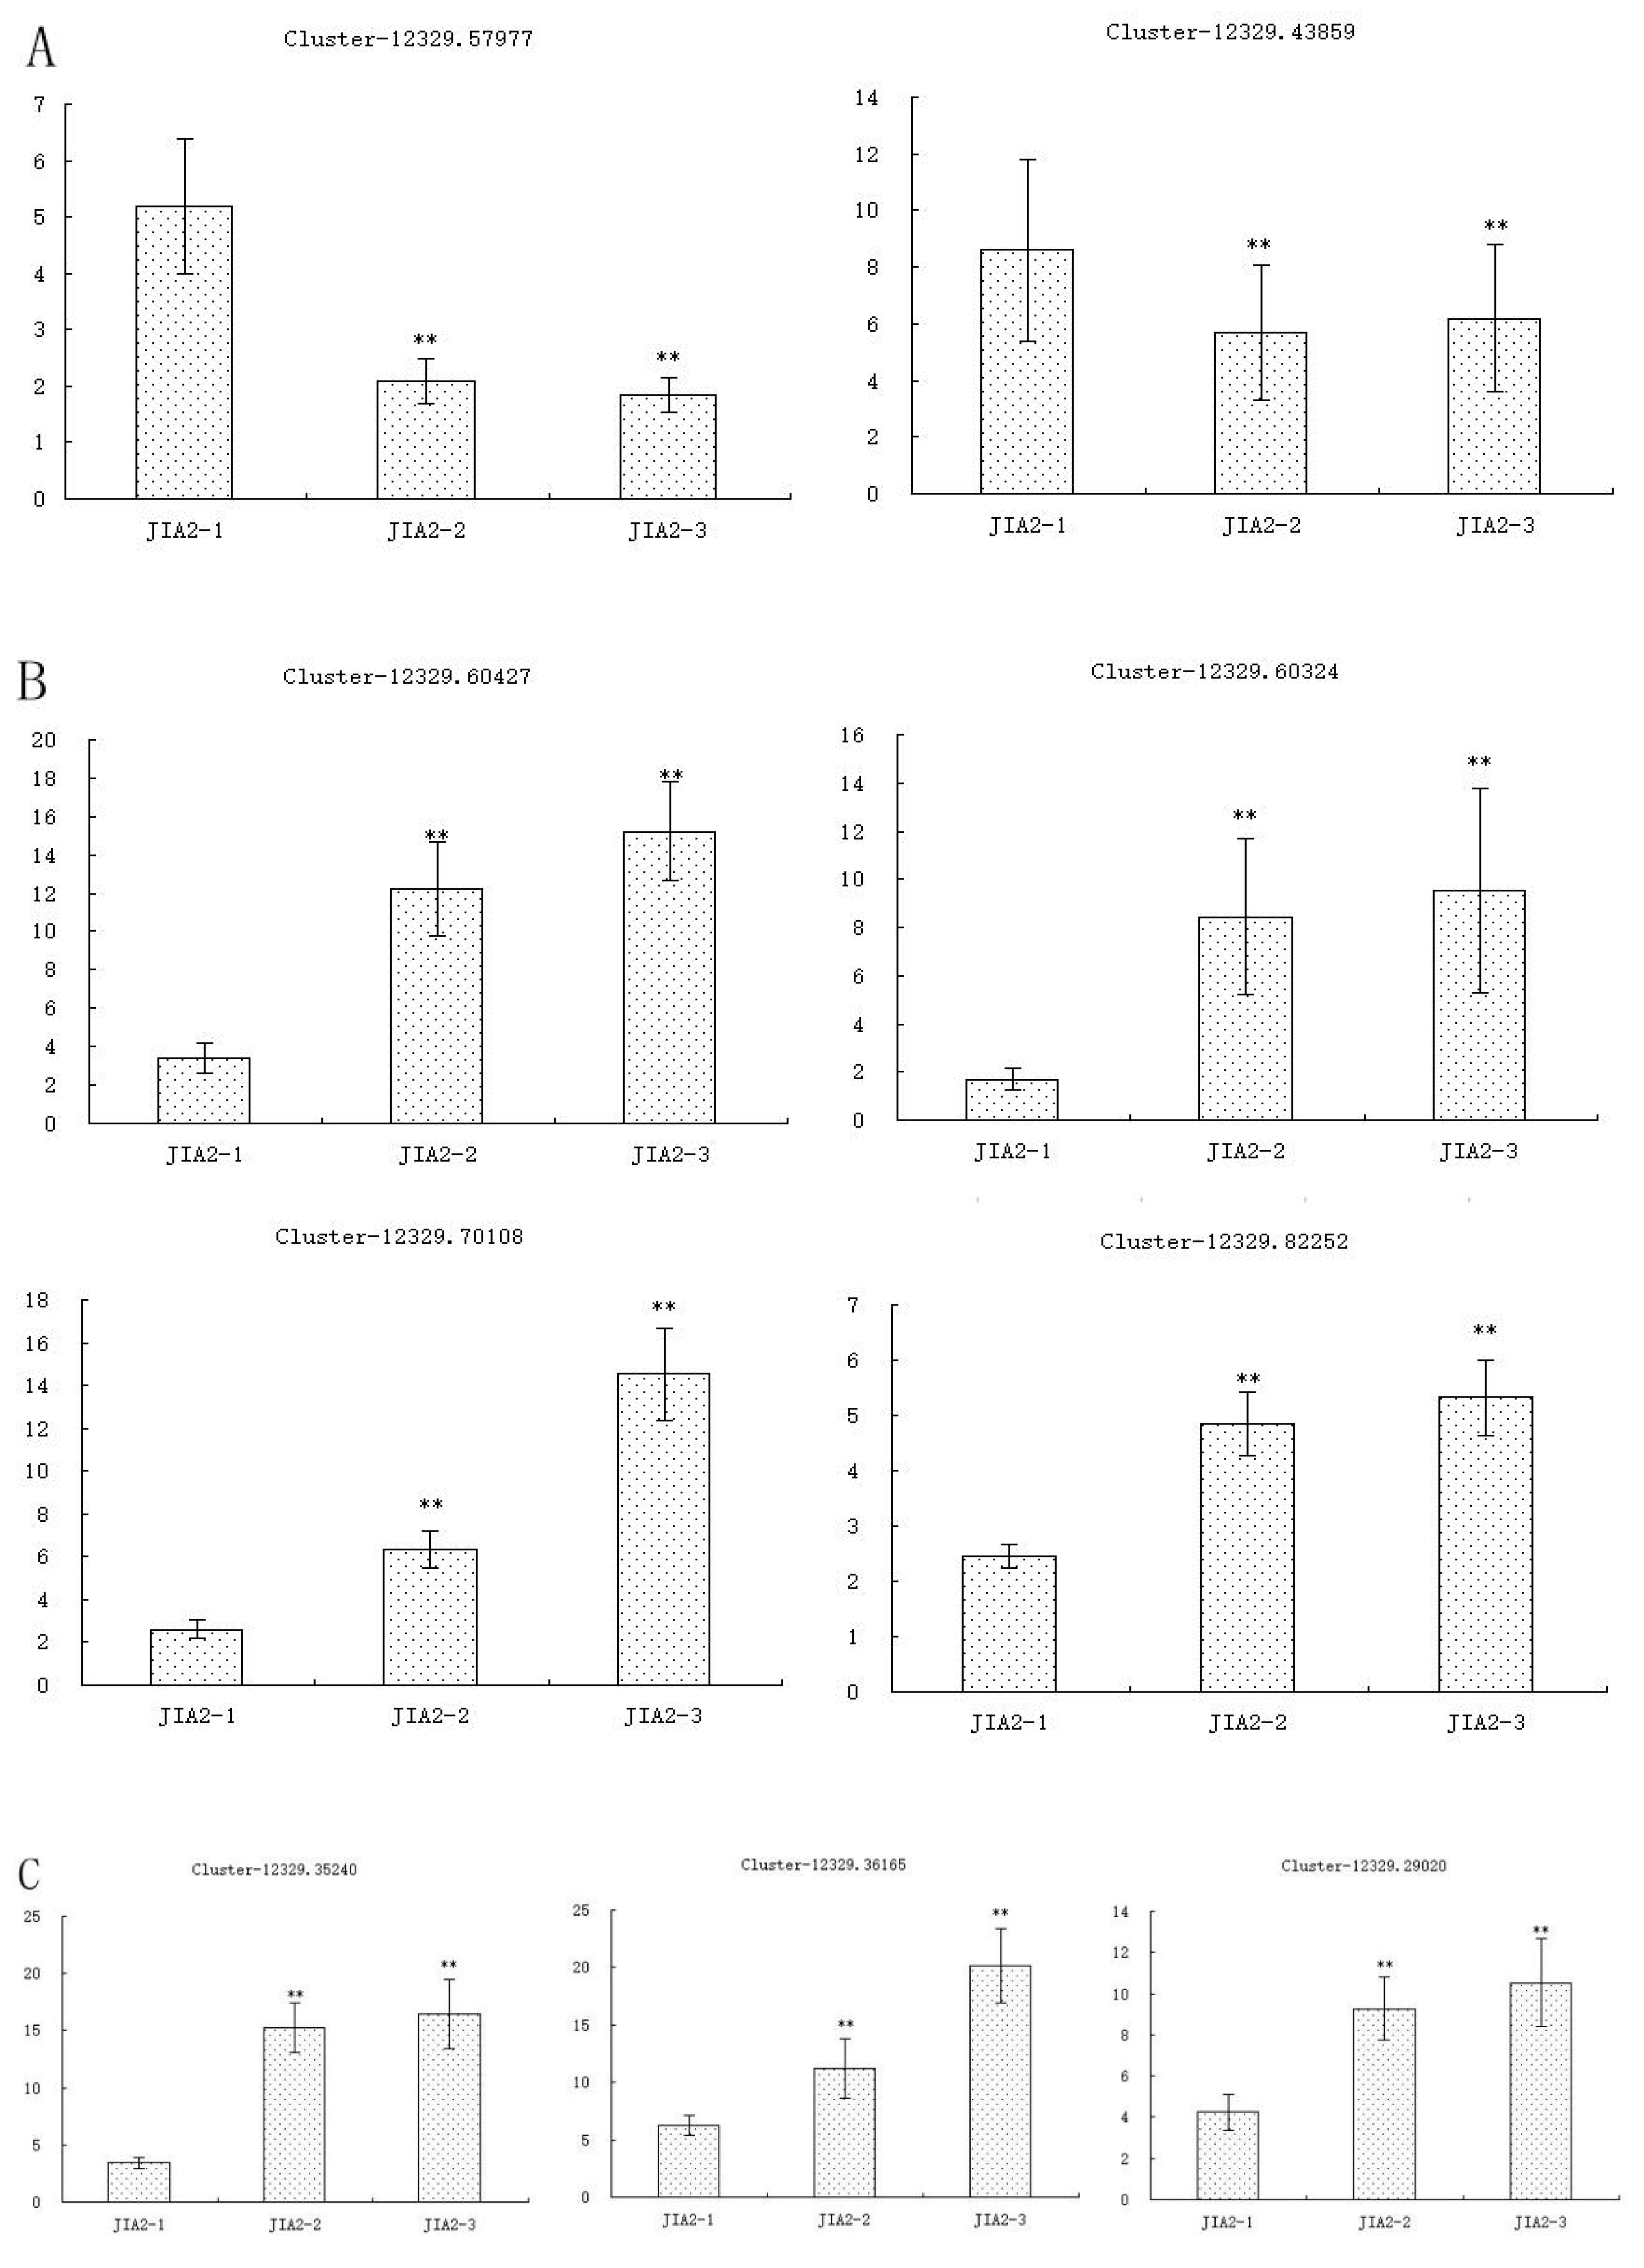
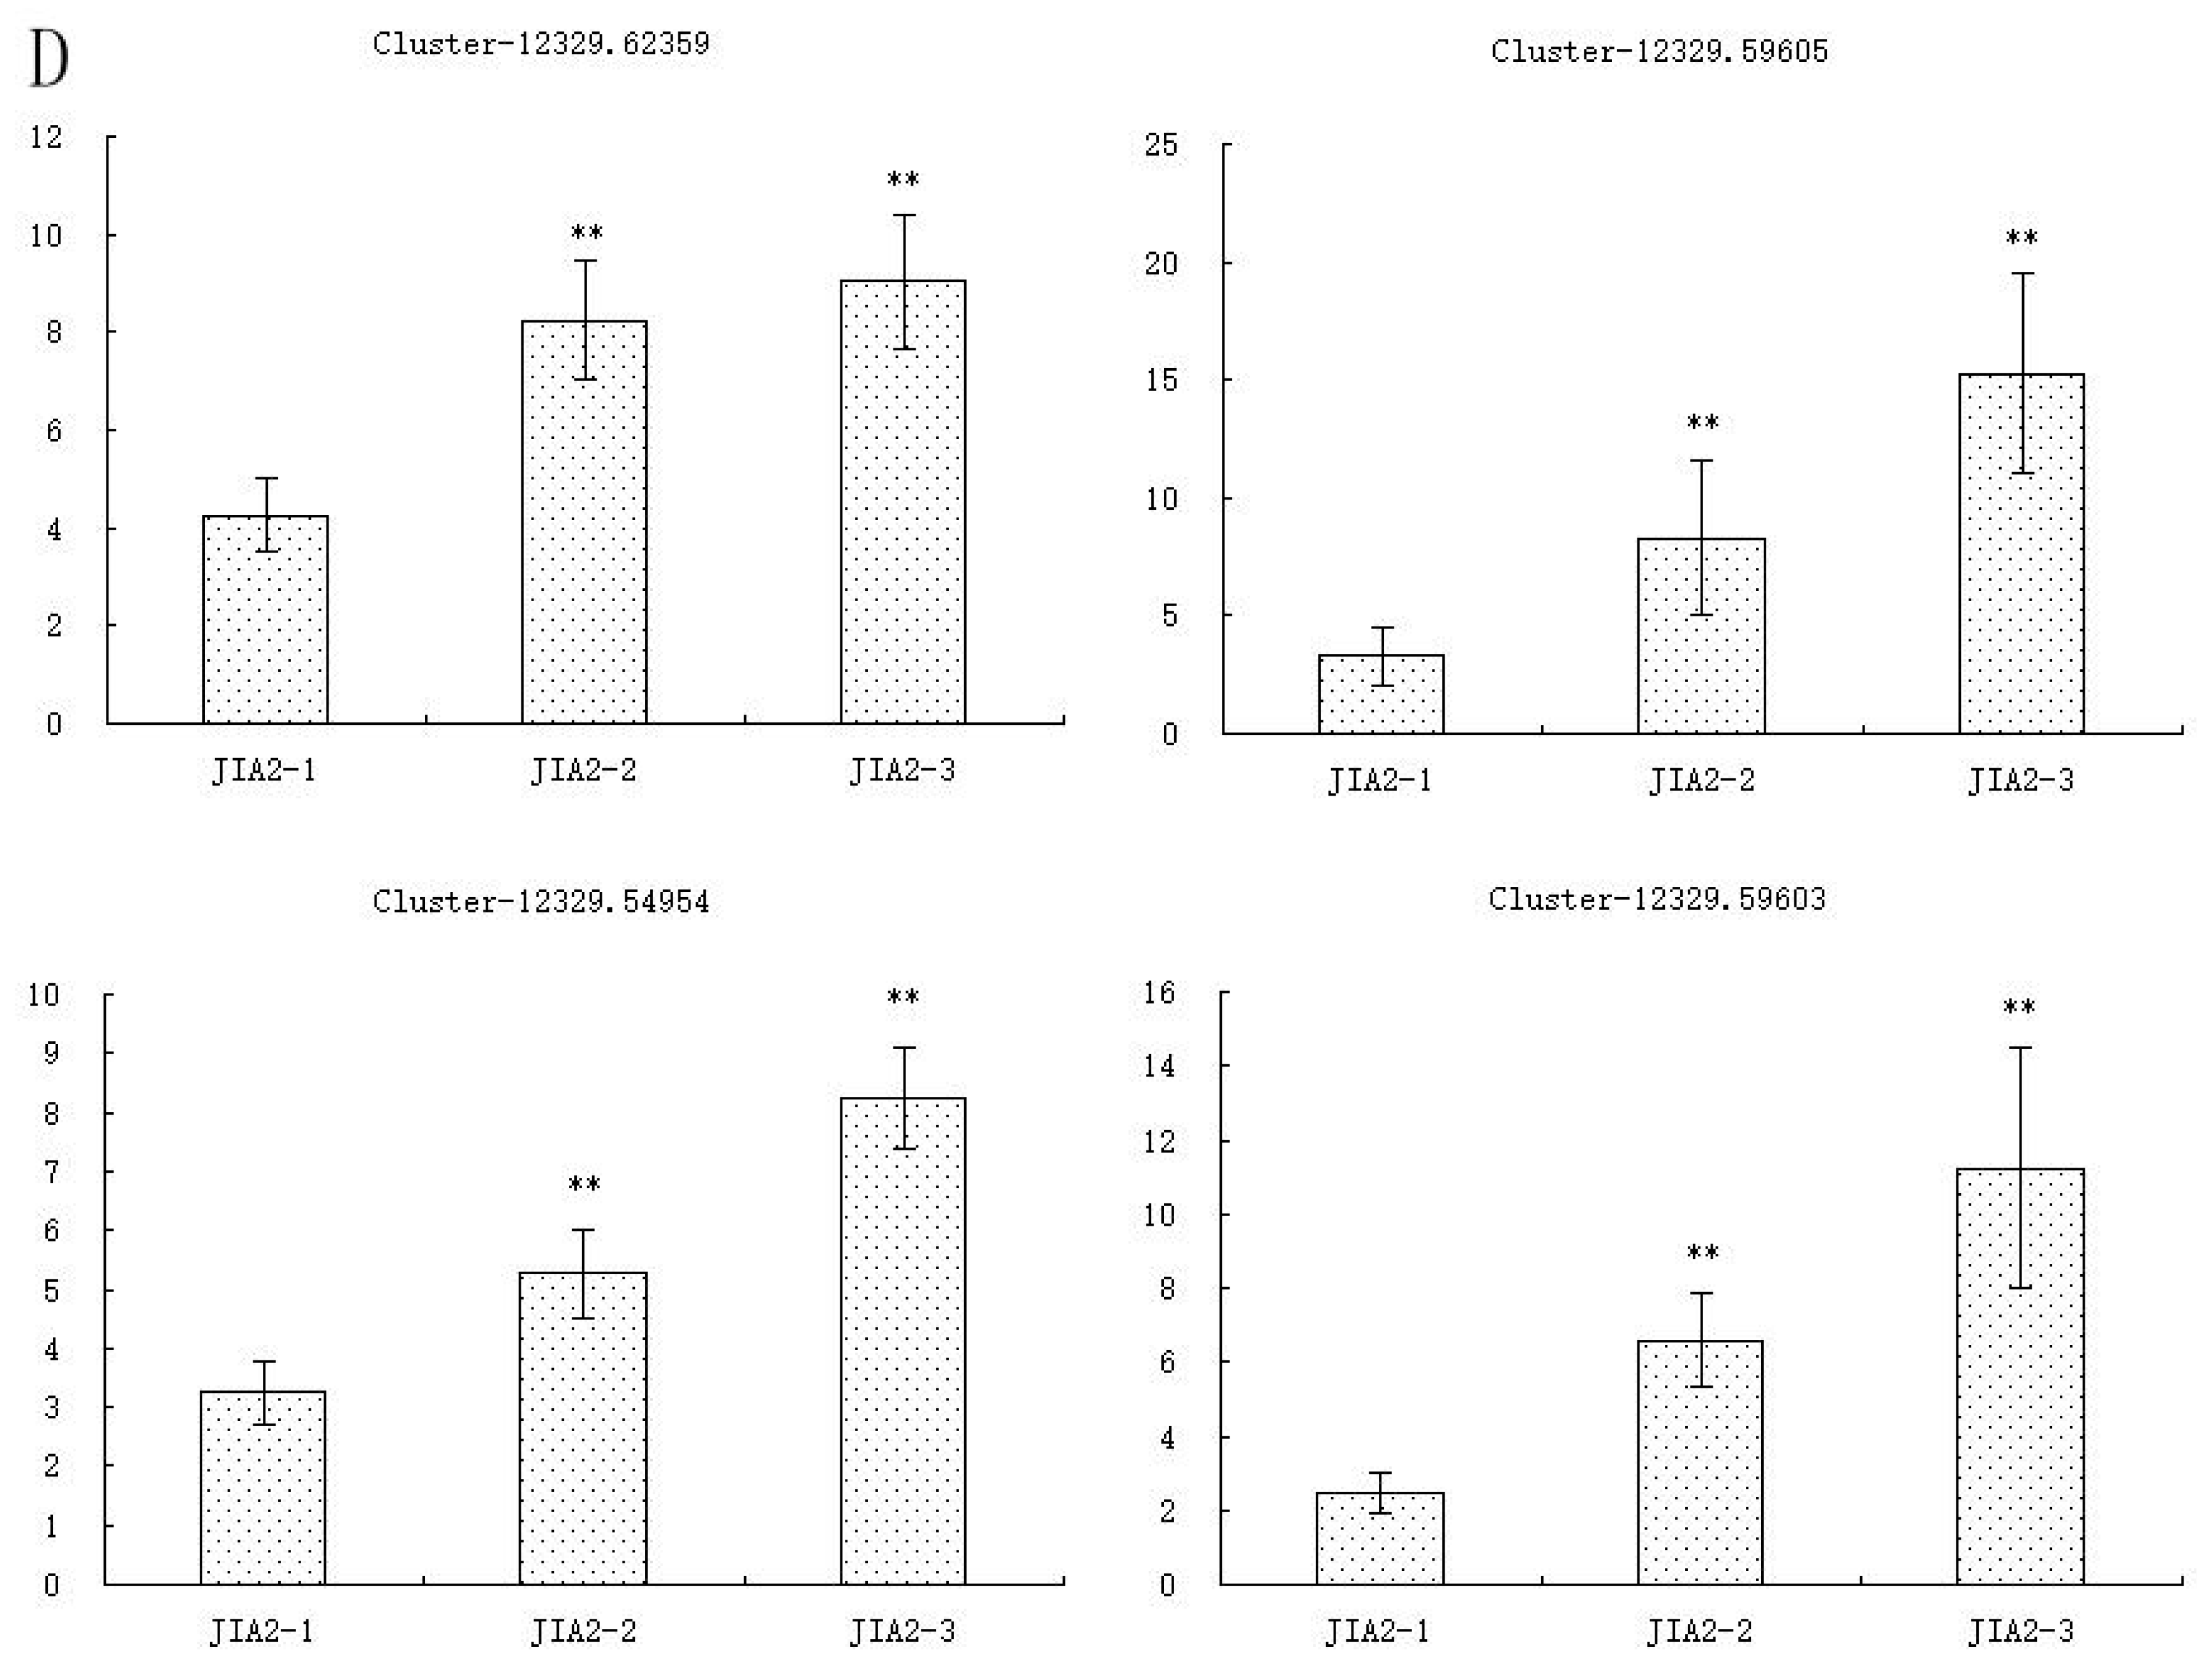
2.11. Validation of Key cor-DEGs-DEPs via qRT-PCR
| Gene | Sequence (5′ to 3′) | Length(bp) |
| Cluster-12329.57977 | F: CTCCTCACGCTTCATGGGTT | 280 |
| R: TACGAGGTTGGGAGCCTTCT | ||
| Cluster-12329.43859 | F:CGCCGACGAGATCTTCCAAA | 269 |
| R:AGAATTGGAGGCAGTCCCAC | ||
| Cluster-12329.60427 | F:AGGGGAGGTGACGAAGAGG | 170 |
| R:CTCCTCGACGCCTGCAAC | ||
| Cluster-12329.60324 | F:TCCTGAAGCAGAAGCAGAGC | 104 |
| R:GATCTCTCCAGCAGTCCGTC | ||
| Cluster-12329.70108 | F:GAGGGGAAGTGGAGGGAAGA | 170 |
| R:CCCCCAAAACAGAAATGGCG | ||
| Cluster-12329.82252 | F:CGCAGCTGAGTACAGATCGA | 255 |
| R:GGCTTTGATTTGGTTCCCCG | ||
| Cluster-12329.35240 | F:AGCTCACACAGGTTGTAGGC | 158 |
| R:CCACCGCCGATTGGAATAGA | ||
| Cluster-12329.36165 | F:TGAAGGAACAGAGCTGGCAG | 216 |
| R:GGATGACACGGTGGAGGATC | ||
| Cluster-12329.29020 | F:AGGTTTCCTCTGTTCTGGCT | 263 |
| R:GGCTCTCGTACTGTCCAACA | ||
| Cluster-12329.62359 | F:GCTCTCGACGCCCAATGTAT | 251 |
| R:GCAGTACGCACAGTCGATCT | ||
| Cluster-12329.59605 | F:AGATCCTCACGCTGCACTTC | 227 |
| R:ACCAGAACAGGCTGAGCATC | ||
| Cluster-12329.54954 | F:TCACCCCGCTTCATTCTTCT | 257 |
| R:AGCCTTGCACGGTACCATAG | ||
| Cluster-12329.59603 | F:GTGGAAGGTCGTGAAGCTGA | 116 |
| R:CCTCCACCACTTCACTCACC | ||
| actin | F: CCAATCGTGAGAAGATGACCC | 135 |
| R: CACCATCACCAGAATCCAACA |
3. Discussion
3.1. Correlation Analysis Revealed Key Metabolic Pathways of Oats in Response to Drought Stress
3.2. Carbohydrate Metabolism
3.3. Amino Acid Metabolism and Secondary Metabolism
3.4. Plant Hormone Signaling and Transcription Factors
4. Materials and Methods
4.1. Experimental Materials
4.2. Experimental Method
4.2.1. Oat Drought Stress Experiment
4.2.2. Transcriptome Sequencing Analysis of Oat Root
Extraction and Qualification of RNA
Transcriptome Sequencing and Quality Control
Gene Annotation, Different Expression, and Enrichment Analyses
qRT-PCR Analysis
4.2.3. Application of Label-Free Technology for Oat Root Proteome Sequencing
Extraction of Total Protein from Oat Roots
Protein Quantification
Proteolysis (Filter-Aided Sample Preparation)
Nano-Upgraded Reversed-Phase Chromatography-Q Exactive for Protein Analysis
Mass Spectrometry Data Analysis
Data Processing and Bioinformatics Analysis
5. Conclusions
Author Contributions
Funding
Data Availability Statement
Acknowledgments
Conflicts of Interest
References
- Bakhoum, G.S.; Sadak, M.S.; Thabet, M.S. Induction of Tolerance in Groundnut Plants Against Drought Stress and Cercospora Leaf Spot Disease with Exogenous Application of Arginine and Sodium Nitroprusside Under Field Conditions. J. Soil Sci. Plant Nutr. 2023, 23, 6612–6631. [CrossRef]
- Fathi, A.; Tari, D.B. Effect of Drought Stress and its Mechanism in Plants. Int. J. Life Sci. 2016, 10, 1–6. [CrossRef]
- Zandalinas, S.I.; Mittler, R.; Balfagón, D.; Arbona, V.; Gómez-Cadenas, A. Plant adaptations to the combination of drought and high temperatures. Physiol. Plant. 2017, 162, 2–12. [CrossRef]
- Guo, Y.Y.; Yu, H.Y.; Kong, D.S.; Yan, F.; Zhang, Y.J. Effects of drought stress on growth and chlorophyll fluorescence of Lycium ruthenicum Murr. seedlings. Photosynthetica 2016, 54, 524–531. [CrossRef]
- Maatallah, S.; Nasri, N.; Hajlaoui, H.; Albouchi, A.; Elaissi, A. Evaluation changing of essential oil of laurel (Laurus nobilis L.) under water deficit stress conditions. Ind. Crop. Prod. 2016, 91, 170–178. [CrossRef]
- Okunlola, G.O.; Olatunji, O.A.; Akinwale, R.O.; Tariq, A.; Adelusi, A.A. Physiological Response of the Three Most Cultivated Pepper Species (Capsicum Spp.) in Africa to Drought Stress Imposed at Three Stages of Growth and Development. Sci. Hortic. (Amsterdam). 2017, 224, 198–205.
- Fang, Y.; Xiong, L. General mechanisms of drought response and their application in drought resistance improvement in plants. Cell. Mol. Life Sci. 2015, 72, 673–689. [CrossRef]
- Khan, M.S.; Ahmad, D.; Khan, M.A. Utilization of Genes Encoding Osmoprotectants in Transgenic Plants for Enhanced Abiotic Stress Tolerance. Electron. J. Biotechnol. 2015, 18, 257–266.
- Ma, Q.; Shi, C.; Su, C.; Liu, Y. Complementary analyses of the transcriptome and iTRAQ proteome revealed mechanism of ethylene dependent salt response in bread wheat (Triticum aestivum L.). Food Chem. 2020, 325, 126866. [CrossRef]
- Michaletti, A.; Naghavi, M.R.; Toorchi, M.; Zolla, L.; Rinalducci, S. Metabolomics and proteomics reveal drought-stress responses of leaf tissues from spring-wheat. Sci. Rep. 2018, 8, 1–18. [CrossRef]
- Lv, L.; Zhao, A.; Zhang, Y.; Li, H.; Chen, X. Proteome and transcriptome analyses of wheat near isogenic lines identifies key proteins and genes of wheat bread quality. Sci. Rep. 2021, 11, 1–15. [CrossRef]
- Shinozaki, K.; Yamaguchi-Shinozaki, K. Gene Networks Involved in Drought Stress Response and Tolerance. J. Exp. Bot. 2007, 58, 221–227.
- Joshi, R.; Wani, S.H.; Singh, B.; Bohra, A.; Dar, Z.A.; Lone, A.A.; Pareek, A.; Singla-Pareek, S.L. Transcription Factors and Plants Response to Drought Stress: Current Understanding and Future Directions. Front. Plant Sci. 2016, 7, 1029. [CrossRef]
- Clemens, R.; van Klinken, B.J.-W. Oats, more than just a whole grain: an introduction. Br. J. Nutr. 2014, 112, S1–S3. [CrossRef]
- Ren, C.Z.; Hu, Y.G. Chinese Oatology. Beijing, China Agric. Press. Chinese) 2013, 1, 211–220.
- Ghimire, K.; McIntyre, I.; Caffe, M. Evaluation of Morpho-Physiological Traits of Oat (Avena Sativa L.) under Drought Stress. Agriculture 2024, 14, 109.
- Qiao, M.; Lv, S.; Qiao, Y.; Lin, W.; Gao, Z.; Tang, X.; Yang, Z.; Chen, J. Exogenous Streptomyces spp. enhance the drought resistance of naked oat (Avena nuda) seedlings by augmenting both the osmoregulation mechanisms and antioxidant capacities. Funct. Plant Biol. 2024, 51. [CrossRef]
- Zhang, X.; Liu, W.; Lv, Y.; Li, T.; Tang, J.; Yang, X.; Bai, J.; Jin, X.; Zhou, H. Effects of drought stress during critical periods on the photosynthetic characteristics and production performance of Naked oat (Avena nuda L.). Sci. Rep. 2022, 12, 1–11. [CrossRef]
- Gong, W.; Ju, Z.; Chai, J.; Zhou, X.; Lin, D.; Su, W.; Zhao, G. Physiological and Transcription Analyses Reveal the Regulatory Mechanism in Oat (Avena sativa) Seedlings with Different Drought Resistance under PEG-Induced Drought Stress. Agronomy 2022, 12, 1005. [CrossRef]
- Wang, Y.; Lysøe, E.; Armarego-Marriott, T.; Erban, A.; Paruch, L.; van Eerde, A.; Bock, R.; Liu-Clarke, J. Transcriptome and metabolome analyses provide insights into root and root-released organic anion responses to phosphorus deficiency in oat. J. Exp. Bot. 2018, 69, 3759–3771. [CrossRef]
- Lou, X.; Wang, H.; Ni, X.; Gao, Z.; Iqbal, S. Integrating proteomic and transcriptomic analyses of loquat (Eriobotrya japonica Lindl.) in response to cold stress. Gene 2018, 677, 57–65. [CrossRef]
- Oshone, R.; Ngom, M.; Chu, F.; Mansour, S.; Sy, M.O.; Champion, A.; Tisa, L.S. Genomic, transcriptomic, and proteomic approaches towards understanding the molecular mechanisms of salt tolerance in Frankia strains isolated from Casuarina trees. BMC Genom. 2017, 18, 1–21. [CrossRef]
- Chen, J.; Song, Y.; Zhang, H.; Zhang, D. Genome-Wide Analysis of Gene Expression in Response to Drought Stress in Populus simonii. Plant Mol. Biol. Rep. 2013, 31, 946–962. [CrossRef]
- Liu, S.-C.; Jin, J.-Q.; Ma, J.-Q.; Yao, M.-Z.; Ma, C.-L.; Li, C.-F.; Ding, Z.-T.; Chen, L. Transcriptomic Analysis of Tea Plant Responding to Drought Stress and Recovery. PLOS ONE 2016, 11, e0147306–e0147306. [CrossRef]
- Wang, W.; Xin, H.; Wang, M.; Ma, Q.; Wang, L.; Kaleri, N.A.; Wang, Y.; Li, X. Transcriptomic Analysis Reveals the Molecular Mechanisms of Drought-Stress-Induced Decreases in Camellia sinensis Leaf Quality. Front. Plant Sci. 2016, 7, 385. [CrossRef]
- Alvarez, S.; Roy Choudhury, S.; Pandey, S. Comparative Quantitative Proteomics Analysis of the ABA Response of Roots of Drought-Sensitive and Drought-Tolerant Wheat cultivars Identifies Proteomic Signatures of Drought Adaptability. J. Proteome Res. 2014, 13, 1688–1701.
- Bai, J.; Liu, J.; Jiao, W.; Sa, R.; Zhang, N.; Jia, R. Proteomic Analysis of Salt-responsive Proteins in Oat Roots (Avena Sativa L.). J. Sci. Food Agric. 2016, 96, 3867–3875.
- Schachtman, D.P.; Goodger, J.Q. Chemical root to shoot signaling under drought. Trends Plant Sci. 2008, 13, 281–287. [CrossRef]
- Ramadan, A.; Sabir, J.S.M.; Alakilli, S.Y.M.; Shokry, A.M.; Gadalla, N.O.; Edris, S.; Al-Kordy, M.A.; Al-Zahrani, H.S.; El-Domyati, F.M.; Bahieldin, A.; et al. Metabolomic Response of Calotropis procera Growing in the Desert to Changes in Water Availability. PLOS ONE 2014, 9, e87895. [CrossRef]
- Wang, H.; Wang, H.; Shao, H.; Tang, X. Recent Advances in Utilizing Transcription Factors to Improve Plant Abiotic Stress Tolerance by Transgenic Technology. Front. Plant Sci. 2016, 7, 67.
- Wang, B.; Lv, X.-Q.; He, L.; Zhao, Q.; Xu, M.-S.; Zhang, L.; Jia, Y.; Zhang, F.; Liu, F.-L.; Liu, Q.-L. Whole-Transcriptome Sequence Analysis of Verbena bonariensis in Response to Drought Stress. Int. J. Mol. Sci. 2018, 19, 1751. [CrossRef]
- Dastmalchi, M.; Chapman, P.; Yu, J.; Austin, R.S.; Dhaubhadel, S. Transcriptomic evidence for the control of soybean root isoflavonoid content by regulation of overlapping phenylpropanoid pathways. BMC Genom. 2017, 18, 1–15. [CrossRef]
- Ye, G.; Ma, Y.; Feng, Z.; Zhang, X. Transcriptomic Analysis of Drought Stress Responses of Sea Buckthorn (Hippophae Rhamnoides Subsp. Sinensis) by RNA-Seq. PLoS One 2018, 13, e0202213.
| Gene id |
JIA2-1 FPKM |
JIA2-2 FPKM |
log2FC | qvalue | Family |
| Cluster-12329.30654 | 114.83 | 21.46 | -2.53 | 0.000014 | WRKY |
| Cluster-12329.9983 | 3.06 | 0.94 | -1.81 | 0.008212 | WRKY |
| Cluster-12329.32221 | 14.72 | 7.21 | -1.14 | 0.005371 | TALE |
| Cluster-12329.64361 | 10.23 | 2.90 | -1.93 | 0.010695 | MYB_related |
| Cluster-12329.56093 | 33.69 | 4.58 | -2.99 | 0.000007 | MYB |
| Cluster-12329.75409 | 16.84 | 0.58 | -4.98 | 0.011413 | MYB |
| Cluster-12329.25874 | 59.96 | 20.78 | -1.65 | 0.000001 | LBD |
| Cluster-12329.79361 | 4.14 | 0.95 | -2.23 | 0.028308 | HSF |
| Cluster-12329.54718 | 3.48 | 10.69 | 1.50 | 0.000001 | HD-ZIP |
| Cluster-12329.44206 | 6.38 | 18.83 | 1.44 | 0.008599 | GATA |
| Cluster-12329.33174 | 17.00 | 8.22 | -1.16 | 0.000132 | Dof |
| Cluster-12329.34327 | 3.62 | 9.08 | 1.21 | 0.014410 | AP2 |
| Gene id | JIA2-1 FPKM | JIA2-3 FPKM | log2FC | qvalue | Family |
| Cluster-12329.30654 | 114.83 | 4.11 | -4.94 | 0.000001 | WRKY |
| Cluster-12329.9983 | 3.06 | 0.97 | -1.78 | 0.008281 | WRKY |
| Cluster-12329.53056 | 34.44 | 10.04 | -1.91 | 0.033821 | WRKY |
| Cluster-12329.71925 | 7.99 | 1.75 | -2.32 | 0.000012 | NAC |
| Cluster-12329.64361 | 10.23 | 2.23 | -2.33 | 0.000501 | MYB_related |
| Cluster-12329.56093 | 33.69 | 1.14 | -5.02 | 0.000001 | MYB |
| Cluster-12329.75409 | 16.84 | 0.20 | -6.55 | 0.006993 | MYB |
| Cluster-12329.25874 | 59.96 | 13.16 | -2.32 | 0.000001 | LBD |
| Cluster-12329.79361 | 4.14 | 0.65 | -2.80 | 0.003270 | HSF |
| Cluster-12329.40676 | 2.91 | 12.27 | 1.95 | 0.005442 | HSF |
| Cluster-12329.54718 | 3.48 | 12.03 | 1.66 | 0.000203 | HD-ZIP |
| Cluster-12329.44206 | 6.38 | 19.00 | 1.45 | 0.007739 | GATA |
| Cluster-12329.33174 | 17.00 | 6.40 | -1.54 | 0.000001 | Dof |
| Cluster-12329.51794 | 1.08 | 5.33 | 2.16 | 0.006461 | bHLH |
| Cluster-12329.49710 | 85.74 | 38.20 | -1.30 | 0.024487 | bHLH |
| Cluster-12329.54360 | 9.82 | 4.58 | -1.23 | 0.008187 | ARF |
| Cluster-12329.34327 | 3.62 | 9.86 | 1.31 | 0.000944 | AP2 |
| Gene id | log2FC/BA9-1 | log2FC/JIA2-1 | Description | ||
| BA9-2 | BA9-3 | JIA2-2 | JIA2-3 | ||
| Cluster-12329.57294 | 2.9 | 2.0 | 1.8 | 1.8 | 26 kDa endochitinase 1-like |
| Cluster-19271.0 | -6.9 | -5.9 | -4.6 | -7.0 | 40S ribosomal protein S6-B-like |
| Cluster-12329.5335 | -7.5 | -7.4 | -4.3 | -6.8 | 60S ribosomal protein L3 |
| Cluster-25393.0 | -4.7 | -5.6 | -3.7 | -7.6 | 60S ribosomal protein L8-1-like |
| Cluster-12329.64025 | 4.1 | 5.2 | 5.9 | 9.1 | ABA-inducible protein PHV A1-like |
| Cluster-12329.18166 | 5.2 | 5.8 | 4.6 | 7.3 | ABA-inducible protein PHV A1-like |
| Cluster-12329.29340 | -3.4 | -5.2 | -2.8 | -4.7 | actin 1 |
| Cluster-12329.38263 | -2.2 | -1.6 | -1.7 | -1.5 | alcohol dehydrogenase 3-like |
| Cluster-12329.7678 | -5.2 | -3.4 | -7.4 | -6.4 | alpha-humulene synthase-like |
| Cluster-12329.42859 | -1.9 | -2.1 | -1.5 | -2.4 | ammonium transporter AMT2.1 |
| Cluster-12329.47412 | 2.0 | 1.3 | 1.0 | 1.5 | AT-hook motif nuclear-localized protein 27-like |
| Cluster-12329.52341 | -1.6 | -1.4 | -2.0 | -2.2 | bidirectional sugar transporter SWEET4 |
| Cluster-12329.58240 | 1.5 | 1.3 | 2.8 | 3.4 | bifunctional epoxide hydrolase 2-like |
| Cluster-12329.39029 | 1.3 | 1.9 | 1.2 | 2.9 | CSC1-like protein HYP1 |
| Cluster-12329.14410 | 1.7 | 1.8 | 1.3 | 1.4 | dehydrin |
| Cluster-12329.43993 | 2.0 | 2.9 | 2.7 | 4.7 | dehydrin-/LEA group 2-like protein |
| Cluster-12329.71405 | 2.5 | 3.0 | 1.5 | 2.3 | delta-1-pyrroline-5-carboxylate synthase-like |
| Cluster-12329.58767 | -1.4 | -1.4 | -2.5 | -3.9 | disease resistance protein RPM1 isoform X1 |
| Cluster-12329.43994 | 2.8 | 3.9 | 4.5 | 6.7 | drought acclimation dehydrin WZY2, partial |
| Cluster-12329.29658 | -3.4 | -5.3 | 1.7 | -3.4 | ervatamin-B-like isoform X1 |
| Cluster-12329.40430 | -2.3 | -2.7 | -3.7 | -4.9 | ethylene response factor |
| Cluster-12329.27606 | 3.2 | 4.5 | 3.0 | 4.3 | eukaryotic peptide chain release factor subunit 1-2-like |
| Cluster-12329.32433 | 1.6 | 1.1 | 1.7 | 2.6 | expansin-A11 isoform X1 |
| Cluster-12329.42428 | -3.7 | -4.4 | -3.0 | -6.2 | extensin-like |
| Cluster-12329.59588 | 1.5 | 1.6 | 1.1 | 2.6 | G-box-binding factor 3 isoform X1 |
| Cluster-12329.7992 | -1.6 | -1.2 | -2.7 | -3.8 | G-type lectin S-receptor-like serine/threonine-protein kinase At1g34300 |
| Cluster-12329.69532 | 3.0 | 3.6 | 2.1 | 3.9 | Heat stress transcription factor C-2b |
| Cluster-12329.45966 | -2.0 | -1.9 | -2.6 | -4.0 | heavy metal-associated isoprenylated plant protein 43-like |
| Cluster-12329.72154 | 2.3 | 3.8 | 2.4 | 3.8 | hypothetical protein |
| Cluster-12329.58613 | 6.3 | 5.7 | 3.4 | 5.0 | hypothetical protein BRADI_1g09260v3 |
| Cluster-12329.6269 | -2.8 | -3.4 | -2.1 | -2.8 | hypothetical protein BRADI_1g10635v3 |
| Cluster-12329.47668 | -1.7 | -1.8 | -1.9 | -2.0 | hypothetical protein BRADI_1g31700v3 |
| Cluster-12329.16385 | -1.4 | -1.0 | -3.0 | -3.5 | hypothetical protein BRADI_1g46170v3 |
| Cluster-12329.16224 | 3.0 | 2.2 | 2.3 | 3.1 | hypothetical protein BRADI_1g65230v3 |
| Cluster-12329.6655 | -2.3 | -3.3 | -4.6 | -4.1 | hypothetical protein BRADI_2g00467v3 |
| Cluster-12329.71455 | 3.0 | 3.2 | 2.8 | 4.4 | hypothetical protein BRADI_2g17200v3 |
| Cluster-12329.14312 | 3.6 | 5.0 | 3.4 | 4.7 | hypothetical protein BRADI_2g27180v3 |
| Cluster-12329.10582 | 2.3 | 3.4 | 3.2 | 4.8 | hypothetical protein BRADI_2g27810v3 |
| Cluster-12329.48609 | -1.8 | -1.9 | -1.4 | -2.8 | hypothetical protein BRADI_2g52970v3 |
| Cluster-12329.76811 | -1.9 | -2.3 | -2.1 | -3.6 | hypothetical protein BRADI_2g54660v3 |
| Cluster-12329.60427 | 2.1 | 2.4 | 1.8 | 2.6 | hypothetical protein BRADI_2g54920v3 |
| Cluster-12329.16260 | 2.7 | 3.4 | 2.5 | 4.6 | hypothetical protein BRADI_3g22635v3 |
| Cluster-12329.38859 | -1.5 | -2.8 | -2.7 | -3.9 | hypothetical protein BRADI_4g02793v3 |
| Cluster-12329.44891 | -1.3 | -1.3 | -1.5 | -2.3 | hypothetical protein BRADI_4g31150v3 |
| Cluster-12329.56429 | -2.7 | -2.2 | -1.5 | -2.6 | hypothetical protein BRADI_5g03327v3 |
| Cluster-12329.23994 | 2.2 | 2.1 | 2.8 | 4.0 | hypothetical protein CUMW_252510, partial |
| Cluster-17139.0 | -7.9 | -7.8 | -5.4 | -5.4 | hypothetical protein DD237_003955 |
| Cluster-27360.1 | -3.2 | -6.5 | -4.3 | -5.2 | hypothetical protein DYB32_000658 |
| Cluster-12329.28366 | -2.1 | -1.2 | -1.5 | -2.5 | hypothetical protein GQ55_2G049000 |
| Cluster-12329.15541 | 2.5 | 2.8 | 1.9 | 3.0 | hypothetical protein GQ55_5G192500 |
| Cluster-12329.43996 | 3.6 | 4.5 | 4.0 | 6.2 | hypothetical protein GQ55_8G157800 |
| Cluster-12329.37837 | 4.4 | 5.3 | 5.5 | 7.5 | hypothetical protein GQ55_9G600100 |
| Cluster-12329.68880 | 2.1 | 2.7 | 2.8 | 4.1 | hypothetical protein OsI_14820 |
| Cluster-12329.57293 | 3.6 | 2.6 | 1.9 | 1.9 | hypothetical protein OsJ_18467 |
| Cluster-27955.0 | -6.3 | -7.2 | -6.2 | -6.2 | hypothetical protein SELMODRAFT_419864 |
| Cluster-12329.11108 | 4.1 | 4.5 | 2.8 | 4.1 | hypothetical protein TRIUR3_02712 |
| Cluster-12329.67466 | 2.9 | 3.1 | 2.5 | 3.9 | hypothetical protein TRIUR3_04131 |
| Cluster-12329.16582 | 6.1 | 5.9 | 3.3 | 5.4 | hypothetical protein TRIUR3_14005 |
| Cluster-12329.27476 | -2.2 | -1.6 | -2.6 | -3.5 | hypothetical protein TRIUR3_18039 |
| Cluster-12329.17145 | 6.8 | 6.4 | 4.9 | 7.3 | hypothetical protein TRIUR3_24891 |
| Cluster-12329.18011 | 2.5 | 2.3 | 3.1 | 3.7 | jacalin-related lectin 19-like, partial |
| Cluster-12329.53964 | 2.8 | 4.0 | 4.4 | 6.7 | late embryogenesis abundant protein 1 |
| Cluster-12329.53965 | 3.4 | 4.3 | 4.5 | 6.8 | late embryogenesis abundant protein, group 3-like |
| Cluster-12329.27453 | 4.4 | 5.1 | 3.1 | 5.6 | late embryogenesis abundant protein, group 3-like |
| Cluster-12329.70282 | 5.6 | 5.8 | 5.5 | 7.9 | late embryogenesis abundant protein, group 3-like |
| Cluster-12329.54680 | 3.2 | 3.0 | 2.8 | 3.7 | linoleate 9S-lipoxygenase 2-like |
| Cluster-12329.30862 | -1.5 | -2.3 | -2.8 | -4.3 | NAC domain-containing protein 21/22-like |
| Cluster-12329.59605 | 1.7 | 2.0 | 2.2 | 4.0 | NADP-dependent malic enzyme |
| Cluster-12329.52489 | -3.2 | -2.8 | -1.3 | -2.0 | nucleolar protein 58-like |
| Cluster-12329.73520 | 3.5 | 3.0 | 1.4 | 3.3 | oleosin 1-like |
| Cluster-12329.59601 | -3.2 | -2.3 | -3.3 | -5.9 | Peroxidase 15 |
| Cluster-12329.33694 | 2.8 | 4.3 | 1.4 | 2.9 | phytoene synthase 2, chloroplastic-like |
| Cluster-12329.15714 | 3.2 | 4.1 | 4.6 | 6.9 | plasma membrane associated protein-1 |
| Cluster-12329.73210 | 3.0 | 2.9 | 1.9 | 3.9 | potassium channel KOR1-like isoform X1 |
| Cluster-12329.82383 | 3.6 | 4.0 | 4.2 | 6.7 | predicted protein |
| Cluster-30628.0 | -6.6 | -6.6 | -3.5 | -6.2 | predicted protein |
| Cluster-12329.28775 | 3.8 | 3.2 | 2.0 | 3.5 | predicted protein |
| Cluster-12329.12011 | 4.6 | 5.3 | 2.4 | 5.0 | predicted protein |
| Cluster-12329.69415 | 5.2 | 3.5 | 1.8 | 2.5 | predicted protein |
| Cluster-12329.38069 | -1.3 | -1.6 | -1.3 | -2.0 | predicted protein |
| Cluster-12329.40903 | -2.6 | -2.2 | -3.8 | -4.6 | predicted protein |
| Cluster-12329.5387 | -2.5 | -2.0 | -2.9 | -4.5 | predicted protein |
| Cluster-12329.74926 | 4.9 | 4.5 | 2.9 | 3.9 | predicted protein |
| Cluster-12329.69554 | 3.6 | 3.5 | 4.9 | 6.8 | predicted protein |
| Cluster-12329.68697 | 5.9 | 6.1 | 5.1 | 7.8 | predicted protein |
| Cluster-12329.15409 | 4.1 | 4.0 | 4.2 | 6.1 | predicted protein |
| Cluster-12329.13801 | 4.3 | 6.5 | 4.7 | 8.1 | predicted protein |
| Cluster-12329.60164 | -2.5 | -2.3 | -1.5 | -3.0 | predicted protein |
| Cluster-12329.19357 | 2.4 | 2.8 | 1.8 | 2.8 | predicted protein |
| Cluster-12329.77573 | -8.1 | -5.2 | -3.2 | -5.4 | predicted protein |
| Cluster-12329.29960 | 2.1 | 2.0 | 1.4 | 2.4 | predicted protein |
| Cluster-12329.19255 | 3.9 | 3.9 | 3.7 | 5.6 | predicted protein |
| Cluster-12329.14664 | 3.4 | 5.0 | 2.1 | 4.8 | predicted protein |
| Cluster-12329.31089 | 3.2 | 2.4 | 1.9 | 2.2 | predicted protein, partial |
| Cluster-12329.59227 | -1.4 | -1.1 | -2.6 | -3.5 | probable calcium-transporting ATPase 6, plasma membrane-type |
| Cluster-12329.12846 | 2.3 | 2.6 | 1.6 | 3.1 | probable fucosyltransferase 8 |
| Cluster-12329.39746 | -2.1 | -1.6 | -1.9 | -2.5 | probable LRR receptor-like serine/threonine-protein kinase At1g56140 |
| Cluster-12329.50890 | -1.5 | -1.2 | -1.7 | -2.5 | probable LRR receptor-like serine/threonine-protein kinase At1g56140 |
| Cluster-12329.72876 | -1.6 | -1.7 | -2.3 | -2.9 | probable LRR receptor-like serine/threonine-protein kinase At3g47570 isoform X1 |
| Cluster-12329.57952 | 2.8 | 3.5 | 1.4 | 2.8 | probable protein phosphatase 2C 50 |
| Cluster-12329.13918 | 2.5 | 3.0 | 2.5 | 4.1 | probable protein phosphatase 2C 8 |
| Cluster-12329.54528 | 1.9 | 2.3 | 1.9 | 2.2 | probable sucrose-phosphate synthase 5 |
| Cluster-12329.19483 | 4.7 | 5.5 | 4.5 | 7.0 | Protein LE25 |
| Cluster-12329.53849 | 2.0 | 1.3 | 2.2 | 3.0 | protein RETICULATA-RELATED 5, chloroplastic-like |
| Cluster-12329.70665 | 3.5 | 4.8 | 1.9 | 3.9 | putative clathrin assembly protein |
| Cluster-12329.53530 | -1.2 | -1.3 | -1.3 | -1.5 | putative disease resistance protein RGA3 |
| Cluster-12329.12147 | 4.1 | 4.5 | 4.0 | 4.6 | Putative invertase inhibitor |
| Cluster-12329.26350 | -2.1 | -2.4 | -1.8 | -2.8 | putative receptor-like protein kinase At4g00960 isoform X1 |
| Cluster-12329.54104 | -2.0 | -2.1 | -1.9 | -3.8 | PYL3 |
| Cluster-12329.70108 | 2.5 | 2.8 | 2.3 | 3.3 | pyruvate decarboxylase 1-like |
| Cluster-12329.19311 | 2.3 | 2.6 | 2.2 | 3.9 | retrotransposon protein, putative, Ty3-gypsy subclass |
| Cluster-12329.19313 | 1.7 | 2.1 | 1.3 | 2.0 | retrotransposon protein, putative, Ty3-gypsy subclass |
| Cluster-12329.39137 | -1.6 | -1.1 | -1.2 | -1.4 | Rp1-like protein |
| Cluster-12329.25017 | -2.3 | -2.4 | -2.5 | -2.7 | SnTox1 sensitivity protein |
| Cluster-12329.29018 | 3.1 | 3.7 | 3.1 | 4.7 | sucrose synthase 4 |
| Cluster-12329.29020 | 3.0 | 3.5 | 3.0 | 4.6 | sucrose synthase 4 |
| Cluster-12329.21992 | 2.8 | 3.1 | 1.3 | 2.4 | TB2/DP1 protein |
| Cluster-12329.17299 | 5.1 | 6.0 | 4.1 | 7.2 | translocator protein homolog |
| Cluster-12329.74266 | 4.1 | 6.7 | 2.9 | 5.8 | uncharacterized protein LOC100828693 |
| Cluster-12329.42771 | 2.4 | 2.8 | 1.4 | 3.0 | uncharacterized protein LOC100837178 |
| Cluster-12329.43214 | -1.5 | -2.1 | -2.8 | -3.3 | uncharacterized protein LOC104584952 |
| Cluster-12329.48150 | 3.8 | 3.1 | 4.4 | 5.6 | uncharacterized protein LOC109716535 isoform X1 |
| Cluster-12329.17539 | 4.7 | 5.8 | 3.3 | 6.2 | uncharacterized protein LOC109732782 |
| Cluster-12329.83151 | 3.5 | 4.5 | 3.4 | 6.2 | uncharacterized protein LOC109745464 |
| Cluster-12329.69103 | 5.3 | 6.5 | 3.3 | 5.6 | uncharacterized protein LOC109752199 |
| Cluster-12329.70769 | 3.7 | 3.5 | 1.7 | 3.2 | uncharacterized protein LOC109753512 |
| Cluster-12329.18408 | 3.0 | 3.1 | 2.7 | 3.9 | uncharacterized protein LOC109753512 |
| Cluster-12329.19760 | 5.2 | 5.5 | 3.2 | 6.0 | uncharacterized protein LOC109754768 |
| Cluster-12329.30953 | 3.7 | 3.4 | 4.1 | 6.1 | uncharacterized protein LOC109762444 |
| Cluster-12329.14413 | 3.1 | 4.0 | 1.5 | 3.5 | uncharacterized protein LOC109767342 |
| Cluster-12329.61249 | 1.9 | 1.9 | 1.3 | 2.0 | uncharacterized protein LOC109772703 |
| Cluster-12329.19134 | 4.5 | 5.3 | 3.2 | 5.5 | uncharacterized protein LOC109773736 |
| Cluster-12329.70583 | 6.1 | 6.6 | 3.8 | 6.3 | uncharacterized protein LOC4331521 |
| Cluster-19103.0 | -6.2 | -7.1 | -5.7 | -6.6 | unknown |
| Cluster-12329.64076 | -4.4 | -6.8 | -4.1 | -5.1 | unknown |
| Cluster-12329.27244 | 2.4 | 2.6 | 2.1 | 3.3 | unnamed protein product |
| Cluster-12329.40591 | 3.1 | 2.3 | 2.1 | 2.9 | unnamed protein product |
| Cluster-12329.65650 | 2.4 | 2.7 | 1.6 | 3.1 | unnamed protein product |
| Cluster-12329.19319 | 4.3 | 4.2 | 3.6 | 5.7 | unnamed protein product |
| Cluster-12329.20262 | 3.5 | 4.0 | 1.5 | 3.1 | unnamed protein product |
| Cluster-12329.15018 | -2.5 | -2.1 | -2.9 | -5.6 | unnamed protein product |
| Cluster-12329.69497 | 4.9 | 4.0 | 4.5 | 5.7 | Vicilin-like antimicrobial peptides 2-2 |
| Cluster-12329.10917 | 3.2 | 5.0 | 3.4 | 5.9 | V-type proton ATPase subunit D-like |
| Cluster-12329.70389 | 2.4 | 3.2 | 2.6 | 2.5 | wheatwin-2 |
| Gene id |
JIA2-1 fpkm |
JIA2-2 fpkm |
JIA2-2 log2FC |
JIA2-3 fpkm |
JIA2-2 log2FC |
Description |
| Cluster-12329.52838 | 9.9 | 649.1 | 5.9 | 549.6 | 5.7 | -- |
| Cluster-12329.76640 | 40.6 | 2.3 | -4.2 | 1.8 | -4.7 | -- |
| Cluster-12329.46046 | 3.2 | 154.3 | 5.5 | 395.2 | 6.8 | -- |
| Cluster-12329.52286 | 50.2 | 6.5 | -3.1 | 6.3 | -3.1 | -- |
| Cluster-12329.44964 | 250.5 | 33.8 | -3.0 | 22.5 | -3.6 | 1-aminocyclopropane-1-carboxylate oxidase-like |
| Cluster-12329.48023 | 176.2 | 23.4 | -3.0 | 14.5 | -3.7 | 1-aminocyclopropane-1-carboxylate oxidase-like |
| Cluster-12329.49732 | 392.4 | 48.5 | -3.1 | 28.5 | -3.9 | ACC oxidase |
| Cluster-12329.49731 | 284.3 | 32.9 | -3.2 | 19.2 | -4.0 | ACC oxidase |
| Cluster-12329.27503 | 30.4 | 2.6 | -3.7 | 2.7 | -3.6 | aspartyl protease family protein At5g10770-like |
| Cluster-12329.55589 | 42.7 | 3.0 | -4.0 | 2.6 | -4.2 | cysteine-rich receptor-like protein kinase 10 |
| Cluster-12329.55590 | 31.3 | 3.7 | -3.2 | 2.0 | -4.1 | cysteine-rich receptor-like protein kinase 10 |
| Cluster-12329.22590 | 118.5 | 12.4 | -3.4 | 4.7 | -4.8 | dirigent protein 5-like |
| Cluster-12329.40430 | 61.3 | 5.2 | -3.7 | 2.2 | -4.9 | ethylene response factor |
| Cluster-12329.33234 | 60.6 | 7.4 | -3.2 | 4.7 | -3.8 | glucan endo-1,3-beta-glucosidase 3-like isoform X1 |
| Cluster-12329.33233 | 40.2 | 5.2 | -3.1 | 3.7 | -3.6 | glucan endo-1,3-beta-glucosidase 3-like isoform X1 |
| Cluster-12329.25273 | 64.7 | 7.9 | -3.2 | 2.5 | -4.8 | heme-binding-like protein At3g10130, chloroplastic |
| Cluster-12329.8036 | 126.0 | 12.5 | -3.4 | 2.6 | -5.7 | hypothetical protein BRADI_2g47510v3 |
| Cluster-12329.56709 | 39.0 | 4.8 | -3.1 | 3.4 | -3.6 | hypothetical protein BRADI_4g31430v3 |
| Cluster-12329.74492 | 173.8 | 11.7 | -4.0 | 7.0 | -4.8 | hypothetical protein OsI_20854 |
| Cluster-12329.54760 | 104.1 | 11.9 | -3.2 | 7.6 | -3.9 | hypothetical protein TRIUR3_01630 |
| Cluster-12329.38808 | 32.3 | 4.1 | -3.1 | 2.0 | -4.2 | hypothetical protein TRIUR3_31101 |
| Cluster-12329.26155 | 151.9 | 17.8 | -3.2 | 6.3 | -4.7 | IQ domain-containing protein IQM1 |
| Cluster-12329.28038 | 40.9 | 461.8 | 3.4 | 683.5 | 3.9 | metallothionein-like protein type 2 |
| Cluster-12329.18219 | 150.5 | 16.1 | -3.3 | 7.9 | -4.4 | mitogen-activated protein kinase kinase kinase 3-like |
| Cluster-12329.51406 | 152.6 | 19.1 | -3.1 | 9.4 | -4.2 | phenylalanine ammonia-lyase 1 |
| Cluster-12329.51405 | 134.3 | 15.4 | -3.2 | 8.5 | -4.1 | phenylalanine ammonia-lyase 2 |
| Cluster-12329.33610 | 60.7 | 7.3 | -3.2 | 2.3 | -4.9 | predicted protein |
| Cluster-12329.77790 | 20.5 | 1.9 | -3.5 | 2.2 | -3.3 | predicted protein |
| Cluster-12329.10176 | 49.8 | 6.3 | -3.1 | 4.3 | -3.7 | predicted protein |
| Cluster-12329.32862 | 167.9 | 20.2 | -3.2 | 10.1 | -4.2 | predicted protein |
| Cluster-12329.40903 | 26.8 | 2.0 | -3.8 | 1.2 | -4.6 | predicted protein |
| Cluster-12329.55591 | 23.7 | 2.4 | -3.4 | 1.3 | -4.3 | predicted protein |
| Cluster-12329.62594 | 4.4 | 90.1 | 4.2 | 192.6 | 5.3 | predicted protein |
| Cluster-12329.51932 | 162.6 | 13.2 | -3.8 | 18.7 | -3.3 | predicted protein |
| Cluster-12329.68011 | 79.4 | 4.2 | -4.3 | 2.8 | -5.0 | predicted protein, partial |
| Cluster-12329.24188 | 217.1 | 27.7 | -3.1 | 2.8 | -6.4 | predicted protein, partial |
| Cluster-12329.46439 | 196.6 | 26.2 | -3.0 | 18.9 | -3.5 | PREDICTED: cationic peroxidase SPC4-like |
| Cluster-12329.65038 | 54.8 | 7.2 | -3.1 | 4.4 | -3.8 | probable calcium-binding protein CML10 |
| Cluster-12329.54015 | 84.5 | 6.6 | -3.8 | 5.5 | -4.1 | probable carboxylesterase 15 |
| Cluster-12329.54017 | 70.2 | 6.8 | -3.5 | 4.6 | -4.1 | probable carboxylesterase 15 |
| Cluster-12329.53604 | 131.3 | 11.6 | -3.6 | 5.4 | -4.7 | probable WRKY transcription factor 70 |
| Cluster-12329.66018 | 396.5 | 40.6 | -3.4 | 19.2 | -4.5 | protein TIFY 11e-like |
| Cluster-12329.66019 | 182.6 | 19.7 | -3.3 | 8.5 | -4.6 | protein TIFY 11e-like |
| Cluster-12329.53548 | 57.4 | 7.4 | -3.1 | 6.9 | -3.2 | putative acyl transferase 6 |
| Cluster-12329.55264 | 69.5 | 9.3 | -3.0 | 2.0 | -5.2 | Putative disease resistance RPP13-like protein 1 |
| Cluster-12329.24192 | 88.8 | 11.9 | -3.0 | 2.1 | -5.6 | putative WRKY transcription factor 46 |
| Cluster-12329.44119 | 93.5 | 12.3 | -3.0 | 12.6 | -3.0 | Q-type C2H2 zinc finger protein |
| Cluster-12329.23063 | 81.4 | 8.8 | -3.3 | 3.1 | -4.9 | RING-H2 finger protein ATL3-like |
| Cluster-12329.23854 | 45.4 | 5.1 | -3.3 | 3.1 | -4.0 | serine/threonine-protein kinase RIPK |
| Cluster-12329.30337 | 31.3 | 4.1 | -3.0 | 1.8 | -4.2 | U-box domain-containing protein 27 |
| Cluster-12329.10245 | 35.3 | 1.7 | -4.5 | 1.7 | -4.5 | uncharacterized protein LOC109741409 |
| Cluster-12329.7920 | 65.7 | 7.1 | -3.3 | 5.6 | -3.7 | uncharacterized protein LOC109765335 |
| Cluster-12329.7921 | 37.1 | 4.2 | -3.3 | 1.5 | -4.8 | uncharacterized protein LOC109765335 |
| Cluster-12329.23823 | 28.4 | 350.5 | 3.5 | 519.5 | 4.0 | uncharacterized protein LOC109783551 |
| Cluster-12329.40403 | 6.0 | 57.5 | 3.1 | 55.5 | 3.1 | uncharacterized protein LOC109783551 |
| Cluster-12329.9976 | 79.3 | 8.2 | -3.4 | 2.3 | -5.3 | uncharacterized protein LOC109784088 |
| Cluster-12329.32861 | 113.7 | 12.1 | -3.3 | 4.6 | -4.8 | unnamed protein product |
| Cluster-12329.61828 | 18.7 | 2.1 | -3.3 | 2.2 | -3.2 | unnamed protein product |
| Cluster-12329.39006 | 21.0 | 2.8 | -3.0 | 1.7 | -3.8 | wall-associated receptor kinase 2-like |
Disclaimer/Publisher’s Note: The statements, opinions and data contained in all publications are solely those of the individual author(s) and contributor(s) and not of MDPI and/or the editor(s). MDPI and/or the editor(s) disclaim responsibility for any injury to people or property resulting from any ideas, methods, instructions or products referred to in the content. |
© 2025 by the authors. Licensee MDPI, Basel, Switzerland. This article is an open access article distributed under the terms and conditions of the Creative Commons Attribution (CC BY) license (http://creativecommons.org/licenses/by/4.0/).


