Submitted:
26 March 2025
Posted:
26 March 2025
You are already at the latest version
Abstract
Cotton, as a globally important fiber crop, is significantly affected by drought stress during production. This study uses the drought-resistant variety Jin and the drought-sensitive variety TM-1 as test materials. Through multi-period drought stress treatments at 0d, 7d, 10d, 15d, and 25d, combined with dynamic monitoring of physiological indicators, RNA sequencing (RNA-Seq), and weighted gene co-expression network analysis (WGCNA), the molecular mechanism of cotton drought resistance is systematically analyzed. Dynamic monitoring of physiological indicators showed that Jin significantly accumulated proline, maintained superoxide dismutase (SOD) activity, reduced malondialdehyde (MDA) accumulation, and delayed chlorophyll degradation. Transcriptome analysis revealed that Jin specifically activated 8,544 differentially expressed genes after stress, which were significantly enriched in lipid metabolism (α-linolenic acid, ether lipids) and secondary metabolic pathways. WGCNA identified co-expression modules significantly correlated with proline (r=0.81) and MDA (r=0.86) and selected the key hub gene Gh_A08G154500 (WRKY22), which was expressed 3.2 times higher in Jin than in TM-1 at 15 days of drought stress. Functional validation suggested that WRKY22 may form a "osmotic regulation-membrane protection" co-regulatory network by activating proline synthesis genes (P5CS) and genes involved in the jasmonic acid signaling pathway. This study reveals, for the first time, the possible dual regulatory mechanism of WRKY22 in cotton's drought resistance, providing a theoretical basis for cotton drought-resistant breeding.
Keywords:
Gossypium hirsutum
; Drought stress
; Weighted Gene Co-expression Network Analysis(WGCNA)
; Transcriptome
; WRKY transcription factor
1. Introduction
Cotton (Gossypium spp.) is not only one of the most important natural fiber crops in the world but also an ideal material for studying genome evolution, polyploidization, and cell elongation [1]. 35% of the world's fibers come from cotton [2]. There are approximately 50 species in the genus Gossypium [3], and the long-domesticated tetraploid cotton, Gossypium hirsutum, has a large yield potential and wide adaptability, with over 95% of cotton cultivation area planted with this species [4]. With global climate warming, freshwater scarcity, extreme weather such as high temperatures, and frequent droughts, drought has become a significant factor limiting cotton production[5]. Drought stress affects cotton yield and quality by altering metabolic activities and biological functions [6]. Ul-Allah et al. [7] reported that drought stress on cotton fiber development can lead to a yield loss of approximately 45%, and Abdelraheem et al. [8] found that water deficit during flowering reduces fiber strength, increases short fiber content, and lowers quality. Therefore, identifying drought-resistant genes in cotton, elucidating the molecular mechanisms of drought tolerance, and breeding drought-resistant cotton varieties are of significant importance for the textile industry.
Plants respond to drought stress through morphological, physiological, and biochemical changes [9]. They primarily resist drought stress by osmotic regulation, reactive oxygen species (ROS) scavenging, and maintaining cell membrane stability [10]. During this process, changes in the levels of certain substances are closely related to drought tolerance and can serve as important indicators for evaluating drought resistance in plants. When plants are subjected to drought stress, lipid peroxidation occurs, and malondialdehyde (MDA), the final product of lipid peroxidation [11], reflects the extent of damage to the plant cell membrane caused by environmental stress. Therefore, drought-resistant cotton varieties accumulate lower levels of MDA under drought conditions compared to sensitive varieties [12]. Proline (Pro) is a key osmotic regulator in plants [13]. When plants face drought stress, they produce large amounts of proline by upregulating the expression of the synthesis enzyme gene P5CS [14], maintaining cell osmotic potential to resist drought stress. Superoxide dismutase (SOD) can scavenge reactive oxygen species (ROS) generated during drought stress [15], reducing lipid peroxidation levels. Chlorophyll is an essential substance for photosynthesis in plants. Under drought stress, damage to the thylakoid structure of chloroplasts leads to a decrease in chlorophyll content (CHI), weakening photosynthesis [16]. Therefore, we selected MDA, Pro, SOD, and chlorophyll content (CHI) as indicators to reflect the extent of drought stress in cotton.
RNA sequencing (RNA-seq) is a method for sequencing all mRNA transcribed from a species under specific conditions to detect gene expression levels [17]. With the development of high-throughput sequencing technology, RNA-seq is increasingly used to identify key genes involved in plant responses to environmental stresses [18]. In the study of cotton drought resistance, Zheng et al. [19] conducted PEG 6000 simulated drought stress on the drought-resistant material Xinluzhong 82 and the drought-sensitive material Kexin No. 1, and identified two candidate genes, GhGABA-T and GhAO, which are closely related to cotton drought stress through whole transcriptome sequencing. Liu et al. [20] performed transcriptome analysis on Gossypium hirsutum under drought stress and identified that the expression of GhMYB102 significantly upregulated after drought stress. They confirmed through molecular biology methods that GhMYB102 enhances cotton drought resistance by participating in ABA synthesis or regulating the expression of drought-related genes. However, current studies on the cotton drought-resistant transcriptome mostly focus on the screening of differentially expressed genes, lacking a systematic analysis of the gene co-expression network. Using Weighted Gene Co-expression Network Analysis (WGCNA), tens of thousands of genes can be divided into functional modules according to their expression trends [21], and the association between the modules and the drought-resistant phenotype can be established to reveal the key regulatory hubs (Hub genes) and their interaction relationships in cotton drought resistance.
Currently, there is limited research on cotton drought resistance genes through physiological indicators under drought stress, RNA-seq, and WGCNA. This study used multi-timepoint drought stress treatments on TM-1 (drought-sensitive) and Jin (drought-resistant) at the flowering and boll stage, dynamically monitoring the changes in physiological indicators such as MDA, Pro, SOD, and CHI in cotton leaves in response to drought stress. RNA-seq was used to construct gene expression profiles at different stress stages, WGCNA was employed to identify gene modules significantly associated with key physiological indicators of drought resistance, and Cytoscape was used for network visualization [22]. Finally, we identified core regulatory genes responsive to cotton drought stress. This study lays the foundation for further understanding the molecular mechanisms of cotton drought resistance and developing new drought-resistant cotton varieties.
2. Experimental Methods
2.1. Planting and Treatment
TM-1 (sensitive to drought) and Jin (drought-resistant) were planted in 2024 in Huoyanghe City, Xinjiang Uygur Autonomous Region (44°20′N–47°04′N, 83°51′E–85°51′E). The experimental field was arranged with one film covering three rows (1 film 3 rows) and one film for planting (1 film 1 planting), each row 2 meters long. Before the flower-boll stage, manage according to normal irrigation and normal precipitation. In the boll stage of upland cotton, stop watering the drought treatment area until harvest. Samples were taken from the third leaf from the top of the plant at 0, 7, 10, 15, and 25 days after drought stress, wrapped in foil, and stored in cryotubes. Immediately after collection, the samples were placed in liquid nitrogen and stored. Each group was repeated three times, and the samples were sent to NovoZhiyuan Ltd. in Tianjin for library construction and sequencing.
2.2. Physiological Indicator Detection
Leaves were sampled from both "TM-1" and "Jin" materials at various time points: pre-stress (0d), 7 days (7d), 10 days (10d), 15 days (15d), and 25 days (25d) after natural drought treatment in the field. The leaves were then immediately placed in liquid nitrogen for storage. According to the instruction manual of the physiological indicator testing kit from Beijing Box Biotech Co., Ltd., chlorophyll content was measured using the plant chlorophyll content detection kit (Catalog No. KPL003M). Absorbance at 663 nm and 645 nm was measured with a microplate reader. Proline (PRO) content was measured using the proline detection kit (Catalog No. AKAM003M), with absorbance at 520 nm. Malondialdehyde (MDA) content was determined with the malondialdehyde detection kit (Catalog No. AKFA013M), measuring absorbance at 450 nm, 532 nm, and 600 nm. Superoxide dismutase (SOD) activity was measured with the superoxide dismutase activity detection kit (Catalog No. AKAO001M-50S), using absorbance at 560 nm to calculate SOD enzyme activity. Each treatment had three biological replicates.
2.3. Library Construction and Quality Inspection
Total RNA was extracted as the starting material for library construction. mRNA with a polyA tail was enriched using Oligo(dT) magnetic beads. The mRNA was then fragmented using divalent cations in Fragmentation Buffer. Using the fragmented mRNA as a template, cDNA was synthesized using random oligonucleotides as primers in an M-MuLV reverse transcription system. The RNA strand was degraded by RNaseH, and the second cDNA strand was synthesized in a DNA polymerase I system with dNTPs as substrates. The purified double-stranded cDNA underwent end repair, A-tailing, and ligation of sequencing adapters. AMPure XP beads were used to select cDNA fragments of approximately 370–420 bp in length. PCR amplification was performed, and the PCR product was purified again using AMPure XP beads. The final library was constructed. After library construction, preliminary quantification was carried out using the Qubit 2.0 Fluorometer. The library was diluted to 1.5 ng/µl, and the insert size was analyzed using an Agilent 2100 Bioanalyzer. Once the insert size met expectations, qRT-PCR was used to precisely quantify the effective concentration of the library (effective concentration above 1.5 nM) to ensure library quality.
2.4. Sequencing
Once the library passed quality control, different libraries were pooled according to their effective concentrations and the required sequencing output. Illumina sequencing was then performed to generate 150 bp paired-end reads. The sequencing principle is Sequencing by Synthesis (SBS). In the sequencing flow cell, four fluorescently labeled dNTPs, DNA polymerase, and adapter primers are added for amplification. As the complementary strand is extended during each sequencing cluster, the incorporation of a fluorescently labeled dNTP releases a corresponding fluorescence signal. The sequencer captures these fluorescence signals and converts them into sequencing peaks through software, which are then used to derive the sequence information of the target fragment.
2.5. Data Quality Control
The image data of sequencing fragments obtained from the high-throughput sequencer is converted into sequence data (reads) through CASAVA base calling, and the file is in fastq format, which mainly contains the sequence information of the sequencing fragments and their corresponding quality information. The raw data obtained by sequencing contains a small number of reads with sequencing adapters or low sequencing quality. To ensure the quality and reliability of data analysis, the raw data needs to be filtered. This mainly involves removing reads with adapters, reads containing N (N indicates undetermined base information), and low-quality reads (reads where more than 50% of bases have a Qphred score ≤5). At the same time, the clean data is evaluated for Q20, Q30, and GC content. Subsequent analyses are all performed based on the clean data for high-quality analysis.
2.6. Sequence Alignment to the Reference Genome
Using the upland cotton TM-1 reference genome (https://www.cottongen.org/species/Gossypium_hirsutum/CRI-TM1) [23], the index of the reference genome is constructed through HISAT2 v2.0.5 [24], and the paired-end clean reads are compared with the reference genome using HISAT2 v2.0.5.
2.7. Gene Expression Quantification
Feature Counts (1.5.0-p3) [25] was used to calculate the number of reads mapped to each gene. Then, the FPKM of each gene was calculated based on gene length, and the number of reads mapped to the gene was computed. FPKM refers to the expected number of transcript sequence fragments per kilobase of transcript length per million base pairs of sequencing. It also considers the effects of sequencing depth and gene length on read counts and is currently one of the most widely used methods for estimating gene expression levels.
2.8. Differential Expression Analysis
For samples with biological replicates, DESeq2 software [26] was used to perform differential expression analysis between two comparison groups. DESeq2 provides statistical programs for determining differential expression in count-based gene expression data using a model based on the negative binomial distribution. Genes with an adjusted P-value ≤ 0.05 discovered through DESeq2 were classified as differentially expressed. Before conducting differential gene expression analysis, the read counts for each sequencing library were adjusted using a normalization factor via the edgeR package [27]. Differential expression analysis between two conditions was performed using the edgeR package (3.22.5). The P-value was adjusted using the Benjamini & Hochberg method [28], with the corrected P-value and |log2 fold change| used as thresholds for significant differential expression.
2.9. Differential Gene Enrichment Analysis
Differentially expressed gene GO enrichment analysis was performed using the clusterProfiler (3.8.1) software [29], with gene length bias corrected. GO terms with a corrected P-value less than 0.05 were considered significantly enriched by differentially expressed genes. KEGG is a database resource used to understand the high-level functions and utilities of biological systems, particularly from molecular-level information such as large-scale molecular datasets generated by genome sequencing and other high-throughput databases, including systems such as cells, organisms, and ecosystems. We used clusterProfiler (3.8.1) software to analyze the statistical enrichment of differentially expressed genes in KEGG pathways.
2.10. WGCNA Analysis
Weighted Gene Co-expression Network Analysis (WGCNA) is a systems biology approach used to describe gene association patterns between different samples. It can identify highly co-expressed gene sets and, based on the internal connectivity of the gene set and its association with phenotypes, identify candidate biomarker genes or therapeutic targets. The R package WGCNA is a functional collection used for performing various weighted association analyses. It can be used for network construction, gene selection, gene cluster identification, topological feature calculation, data simulation, and visualization. Cytoscape (Cytoscape_v3.9.1) was used to visualize the gene modules.
2.11. qRT-PCR Validation
Drought-tolerant material Jin and drought-sensitive material TM-1 were selected as the extreme materials for candidate gene qRT-PCR analysis. Leaf samples were collected from field-grown cotton under natural drought conditions at 0d, 7d, 10d, 15d, and 25d during the flowering and bolling stage. Total RNA was extracted using the RNAprep Pure Polysaccharide Polyphenol Plant Total RNA Extraction Kit (Tiangen, Beijing, China), and cDNA was synthesized using a reverse transcription kit (Tiangen). Cotton Ubiquitin7 (UBQ7) was chosen as the reference gene. Based on the reaction system provided by the Abm BlasTaqTM 2X qPCR Mix (dye) manual, the running program was set, and the relevant genes were amplified using the Applied BiosystemsTM 7500 Fast Real-Time PCR Systems (3 replicates). Relative expression levels were analyzed using the 2-ΔΔCt method. Finally, GrandPad Prism version 10 [30] was used for data visualization.
3. Results
3.1. Identification of Drought Resistance of Jin and TM-1
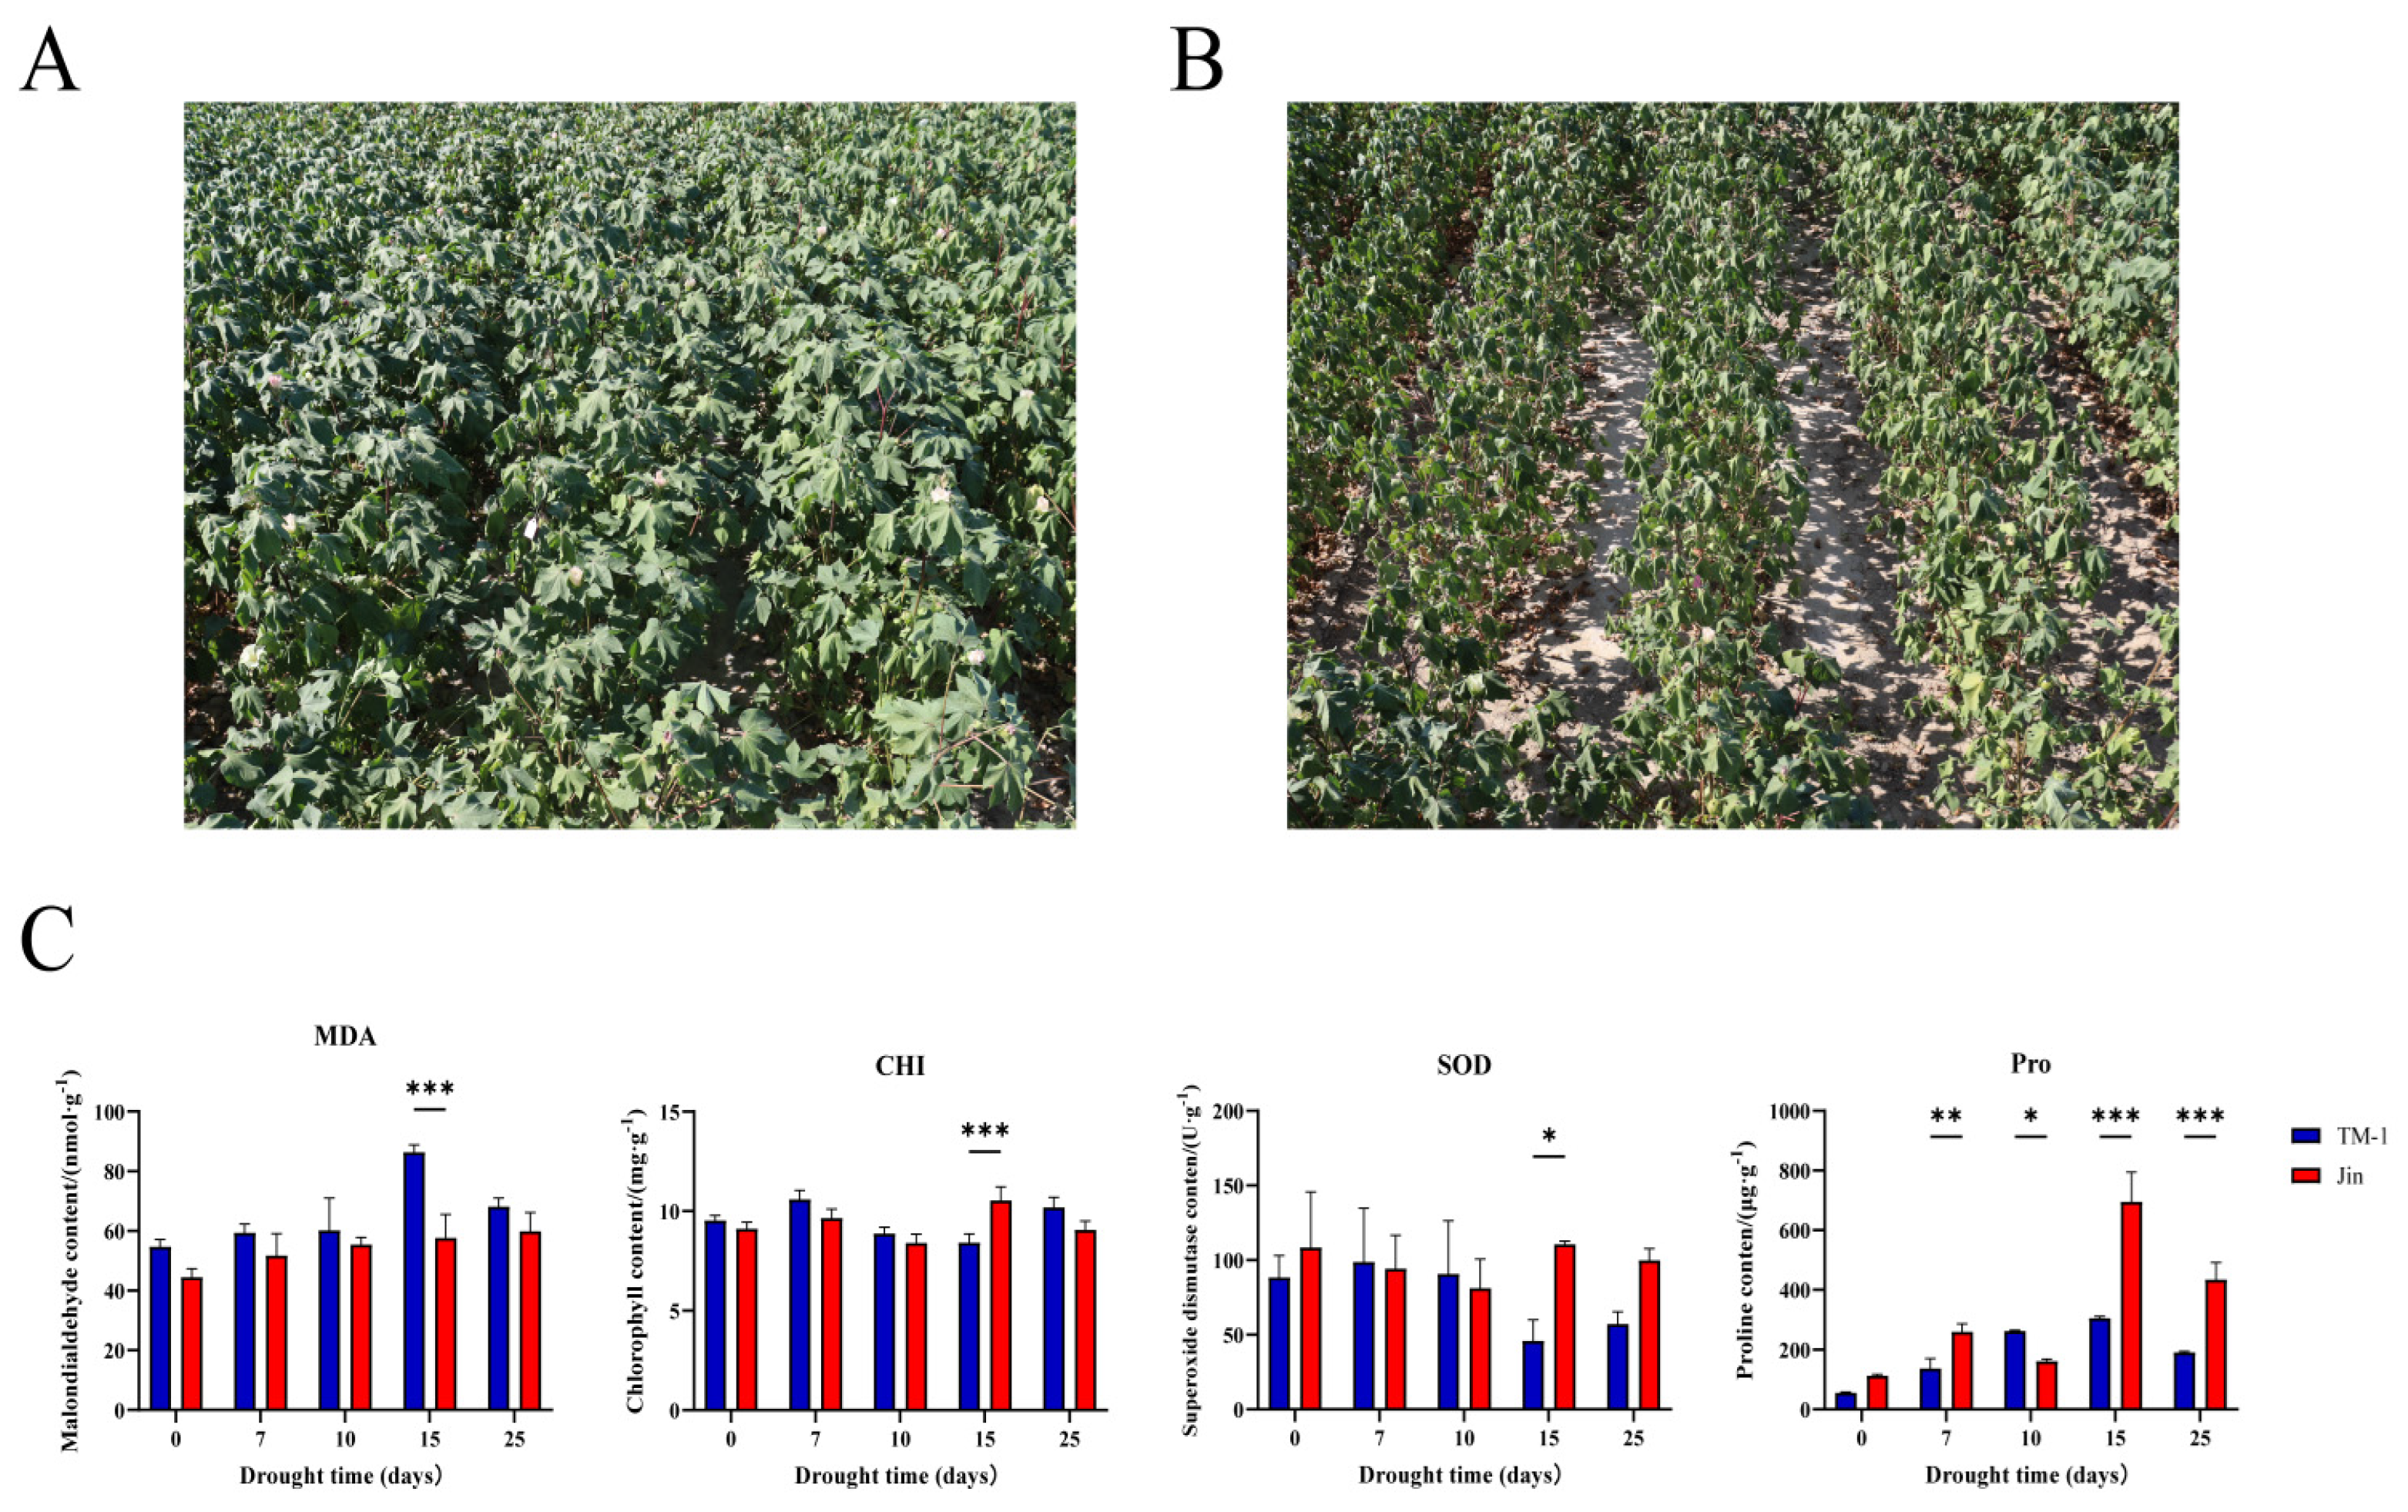
To further compare the drought resistance levels between TM-1 and Jin, the physiological parameters of TM-1 and Jin under different drought stress conditions were measured. After drought stress, the malondialdehyde (MDA) content in TM-1 leaves significantly increased with the intensification of drought stress, while the increase in MDA content in Jin leaves was relatively smaller. Chlorophyll (CHI) and superoxide dismutase (SOD) content showed significant differences between TM-1 and Jin after 15 days of drought stress. Proline (Pro) significantly increased in the leaves of both TM-1 and Jin under drought stress, and the Pro content in Jin leaves was significantly higher than in TM-1 with increasing drought stress. These results indicate that there are significant differences in drought resistance between Jin and TM-1. To further investigate the molecular mechanisms and candidate genes responsible for these differences in drought resistance, RNA-seq analysis was performed on leaf samples from Jin and TM-1 at five time points (0 d, 7 d, 10 d, 15 d, and 25 d) under drought stress.
Figure 1.
(A) Phenotypic photographs of Jin under drought stress. (A) Phenotypic photographs of Jin under drought stress. (C) Statistical analysis of MDA, CHI, SOD, and Pro content in TM-1 and Jin under different drought stress conditions. Significant differences were determined using one-way ANOVA (*, **, *** represent P-values less than 0.05, 0.01, and 0.001, respectively).
3.2. RNA-Seq Data Analysis
In this study, 204.43 Gb of clean data were generated from 30 cotton leaf samples of TM-1 and Jin under drought stress at the flowering and boll-setting stages. Each sample had an average of 6.81 Gb of clean data, with Q30 base percentages exceeding 97.10%. Furthermore, the alignment rate of the reads to the reference genome ranged from 90.23% to 96.00%, with an average alignment rate of 94.60%. The Pearson correlation coefficient between the three biological replicates of the same sample showed correlations over 0.90 (Figure 2A). PCA results indicated that biological replicates clustered together, and samples without drought stress clustered together, while samples under moderate drought stress (7d and 10d) clustered together, and samples under severe drought stress (15d and 25d) clustered together, suggesting that the transcriptomic data were highly reliable and reproducible (Figure 2B).
3.3. Differentially Expressed Genes (DEGs) Analysis
To uncover the molecular mechanisms behind the drought resistance differences between different cotton varieties, we identified differentially expressed genes (DEGs) under drought stress using stringent thresholds (FDR < 0.05, |log2FC| ≥ 1). As shown in Figure 3A, the sensitive variety TM-1 exhibited 13,439 DEGs (6,687 upregulated/6,752 downregulated) during the early stress stage (0-7d), while the drought-resistant variety Jin maintained a high response level during prolonged stress (15-25d) with 6,204 DEGs (2,409 upregulated/3,795 downregulated). Notably, Jin showed a significantly higher number of DEGs (2,927) during the mid-stress stage (7-10d) compared to TM-1 (469, P < 0.01), suggesting that Jin may possess the characteristic of continuously activating drought resistance pathways. Venn analysis revealed that out of 25,123 DEGs, 12,406 were common genes, and the number of unique genes in Jin (8,544) was 2.05 times that of TM-1 (4,172). This difference may explain the divergence in drought resistance between the varieties: Jin maintains cell homeostasis by continuously regulating the synthesis of osmotic protectants (e.g., trehalose, proline), while TM-1 response mechanism is limited to the early stage of stress.
3.4. KEGG and GO Enrichment Analysis of Differentially Expressed Genes Shared by Jin and TM-1.
To explore the coordinated response mechanisms of the drought-resistant material Jin and the drought-sensitive material TM-1 under drought stress, we performed a systematic analysis of the 12,406 common DEGs. Through temporal expression pattern clustering, DEGs were divided into four characteristic modules (Figure 3A): Cluster 1 genes were lowly expressed under no stress and significantly upregulated as stress duration increased (15-25d); Cluster 2 and Cluster 4 genes were highly expressed under no stress, but exhibited TM-1-specific (Cluster 2) and Jin-specific (Cluster 4) expression advantages; Cluster 3 genes were activated early in the stress period and maintained a stable expression level throughout the stress stages. KEGG enrichment analysis revealed that DEGs mainly participated in metabolic regulation (Figure 3B), including lipid metabolism (fatty acid elongation, glycerophospholipid metabolism), carbohydrate metabolism (fructose/mannose metabolism), amino acid metabolism (alanine/aspartate/glutamate metabolism), secondary metabolism (steroid/carotenoid biosynthesis), and transport processes (ABC transporter proteins). Notably, stress response pathways closely related to ascorbate metabolism, sulfur metabolism, and redox regulation were significantly enriched. GO analysis (Figure 3C) showed that biological processes primarily involved amino acid biosynthesis (cell/α-amino acids/sulfur-containing amino acids), polysaccharide metabolism (glucan synthesis), and catabolism (aromatic amino acids); cellular components enriched in structures related to genetic information regulation (chromatin/nucleosome) and stress response sites (cell wall/extracellular matrix); molecular functions were prominent in metabolic catalytic activities (isomerases/transferases/oxidoreductases) and molecular binding capabilities (unfolded proteins/ssDNA). These findings systematically reveal that plants may adapt to drought stress through a multidimensional molecular regulatory network.
3.5. Jin and TM-1 Specific Differentially Expressed Genes KEGG and GO Enrichment Analysis
Through functional analysis of drought-related differentially expressed genes (DEGs) in Jin and TM-1 cotton varieties, it was found that the 8,544 DEGs specifically expressed in Jin (|log2FC| >1, FDR <0.05) were dynamically divided into four clusters based on drought stress duration: Cluster 1 (high expression at 0 days control), Cluster 2 (high expression at 15 days drought), Cluster 3 (high expression at 25 days drought), and Cluster 4 (high expression at 7 and 10 days drought). The KEGG pathways of these DEGs were significantly enriched in lipid metabolism (ether lipids, alpha-linolenic acid metabolism), stress response signaling (MAPK, phosphoinositide signaling), and secondary metabolism (isoquinoline alkaloid, sesquiterpene biosynthesis), while GO functions were involved in microtubule binding, jasmonic acid biosynthesis, and outer mitochondrial membrane. In TM-1, among the 4,172 specific DEGs, Cluster 2 (1,870 genes) was highly expressed under control conditions and suppressed under drought stress. The metabolic characteristics of this cluster were focused on energy metabolism (TCA cycle, glycolysis), DNA repair (non-homologous end joining), and ion channel activity. The comparison between the two varieties indicated that Jin might maintain membrane stability through lipid metabolism and microtubule-related mechanisms, while TM-1 relies on energy supply and genomic stability to cope with drought, revealing the molecular differentiation of drought resistance strategies between them.
3.6. TF Analysis
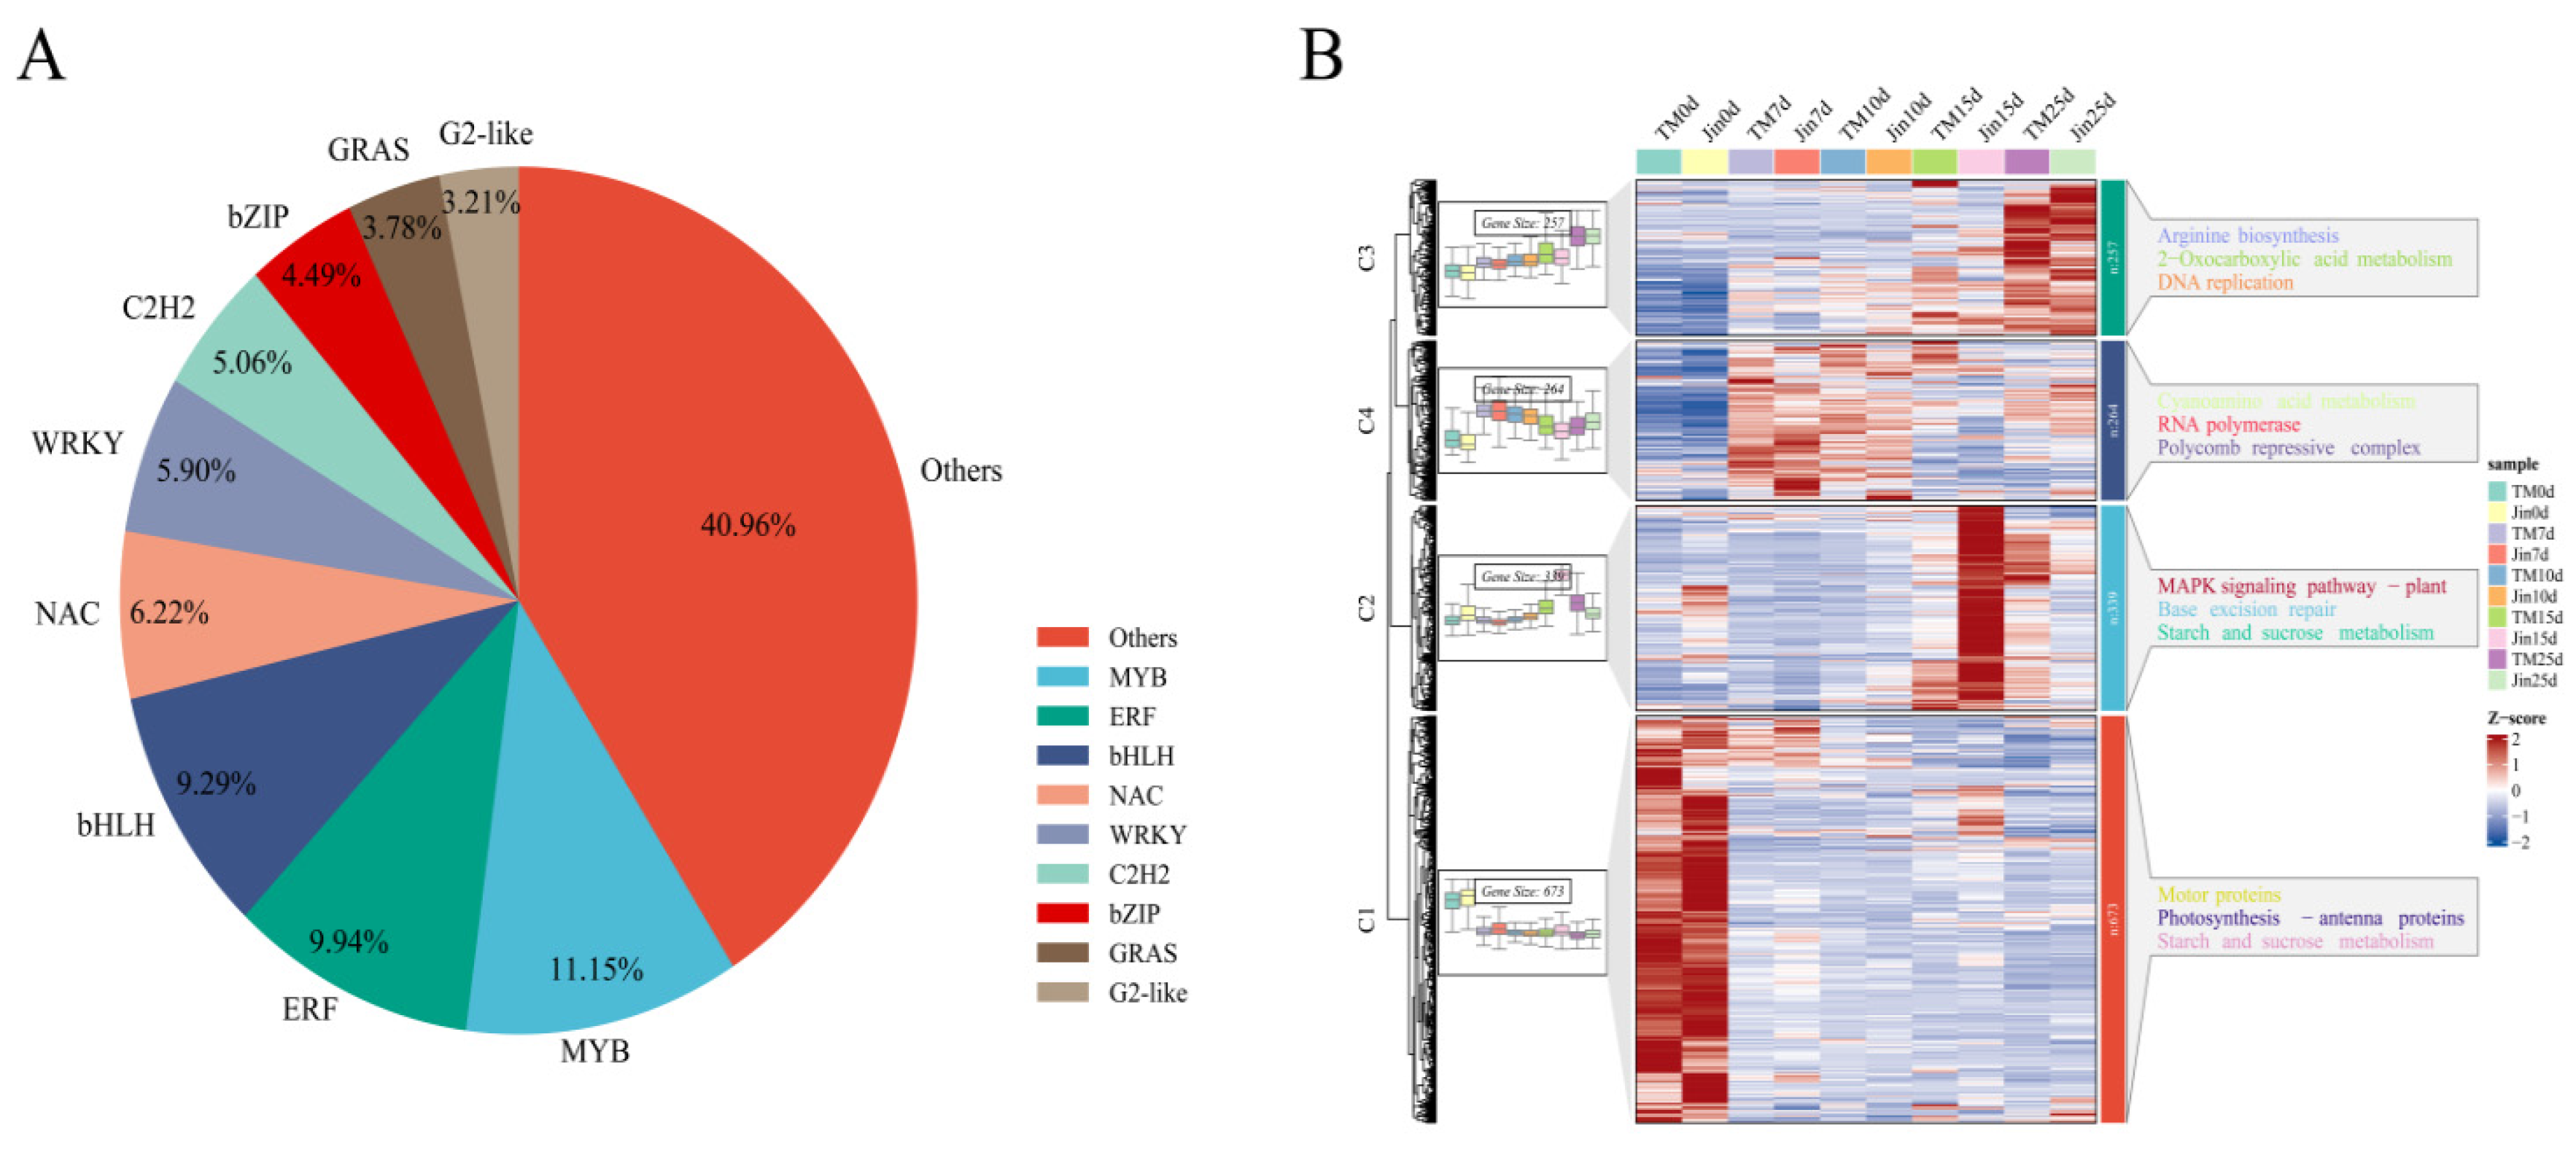
We submitted the genomic sequences of the 25,123 identified DEGs to the PlantTFDB database (http://planttfdb.cbi.pku.edu.cn/) for transcription factor prediction, and a total of 1,551 transcription factors were identified. These transcription factors were classified into different families, including MYB, ERFs, bHLHs, C2H2s, NAC, and WRKYs (Figure 4A). To further understand the function of these 1,551 transcription factors, we used the k-means clustering algorithm to cluster the 1,551 differentially expressed transcription factors into 4 clusters, and then annotated the functional categories of each cluster using KEGG (Figure 4B).
Cluster 1 was highly expressed without drought stress and showed a decrease in expression under drought stress. It was mainly annotated in nitrogen metabolism, isoquinoline alkaloid biosynthesis, betaine biosynthesis, glycine, serine, and threonine metabolism, and tyrosine metabolism. Cluster 2 was highly expressed under drought stress at 15 days and was mainly annotated in linolenic acid metabolism, MAPK signaling pathway, N-glycan biosynthesis, galactose metabolism, and brassinosteroid biosynthesis. Cluster 3, in contrast to Cluster 1, was lowly expressed without drought stress but showed an increase in expression under drought stress. It was mainly annotated in ribosome biogenesis in eukaryotes, RNA polymerase, RNA degradation, valine, leucine, and isoleucine degradation, and nucleotide excision repair. These results suggest that transcription factors coordinate responses to drought stress through the regulation of lipid metabolism, osmotic regulation (such as betaine), and signaling pathways (such as MAPK). These results suggest that transcription factors coordinate responses to drought stress through the regulation of lipid metabolism, osmotic regulation (such as betaine), and signaling pathways (such as MAPK).
Figure 6.
(A) Proportion of differentially expressed transcription factor families. (B) Expression patterns and functional enrichment analysis of differentially expressed transcription factors. The KEGG annotation results for each cluster are shown on the right, displaying the top 5 pathways with the smallest p-values.
3.7. WGCNA Analysis
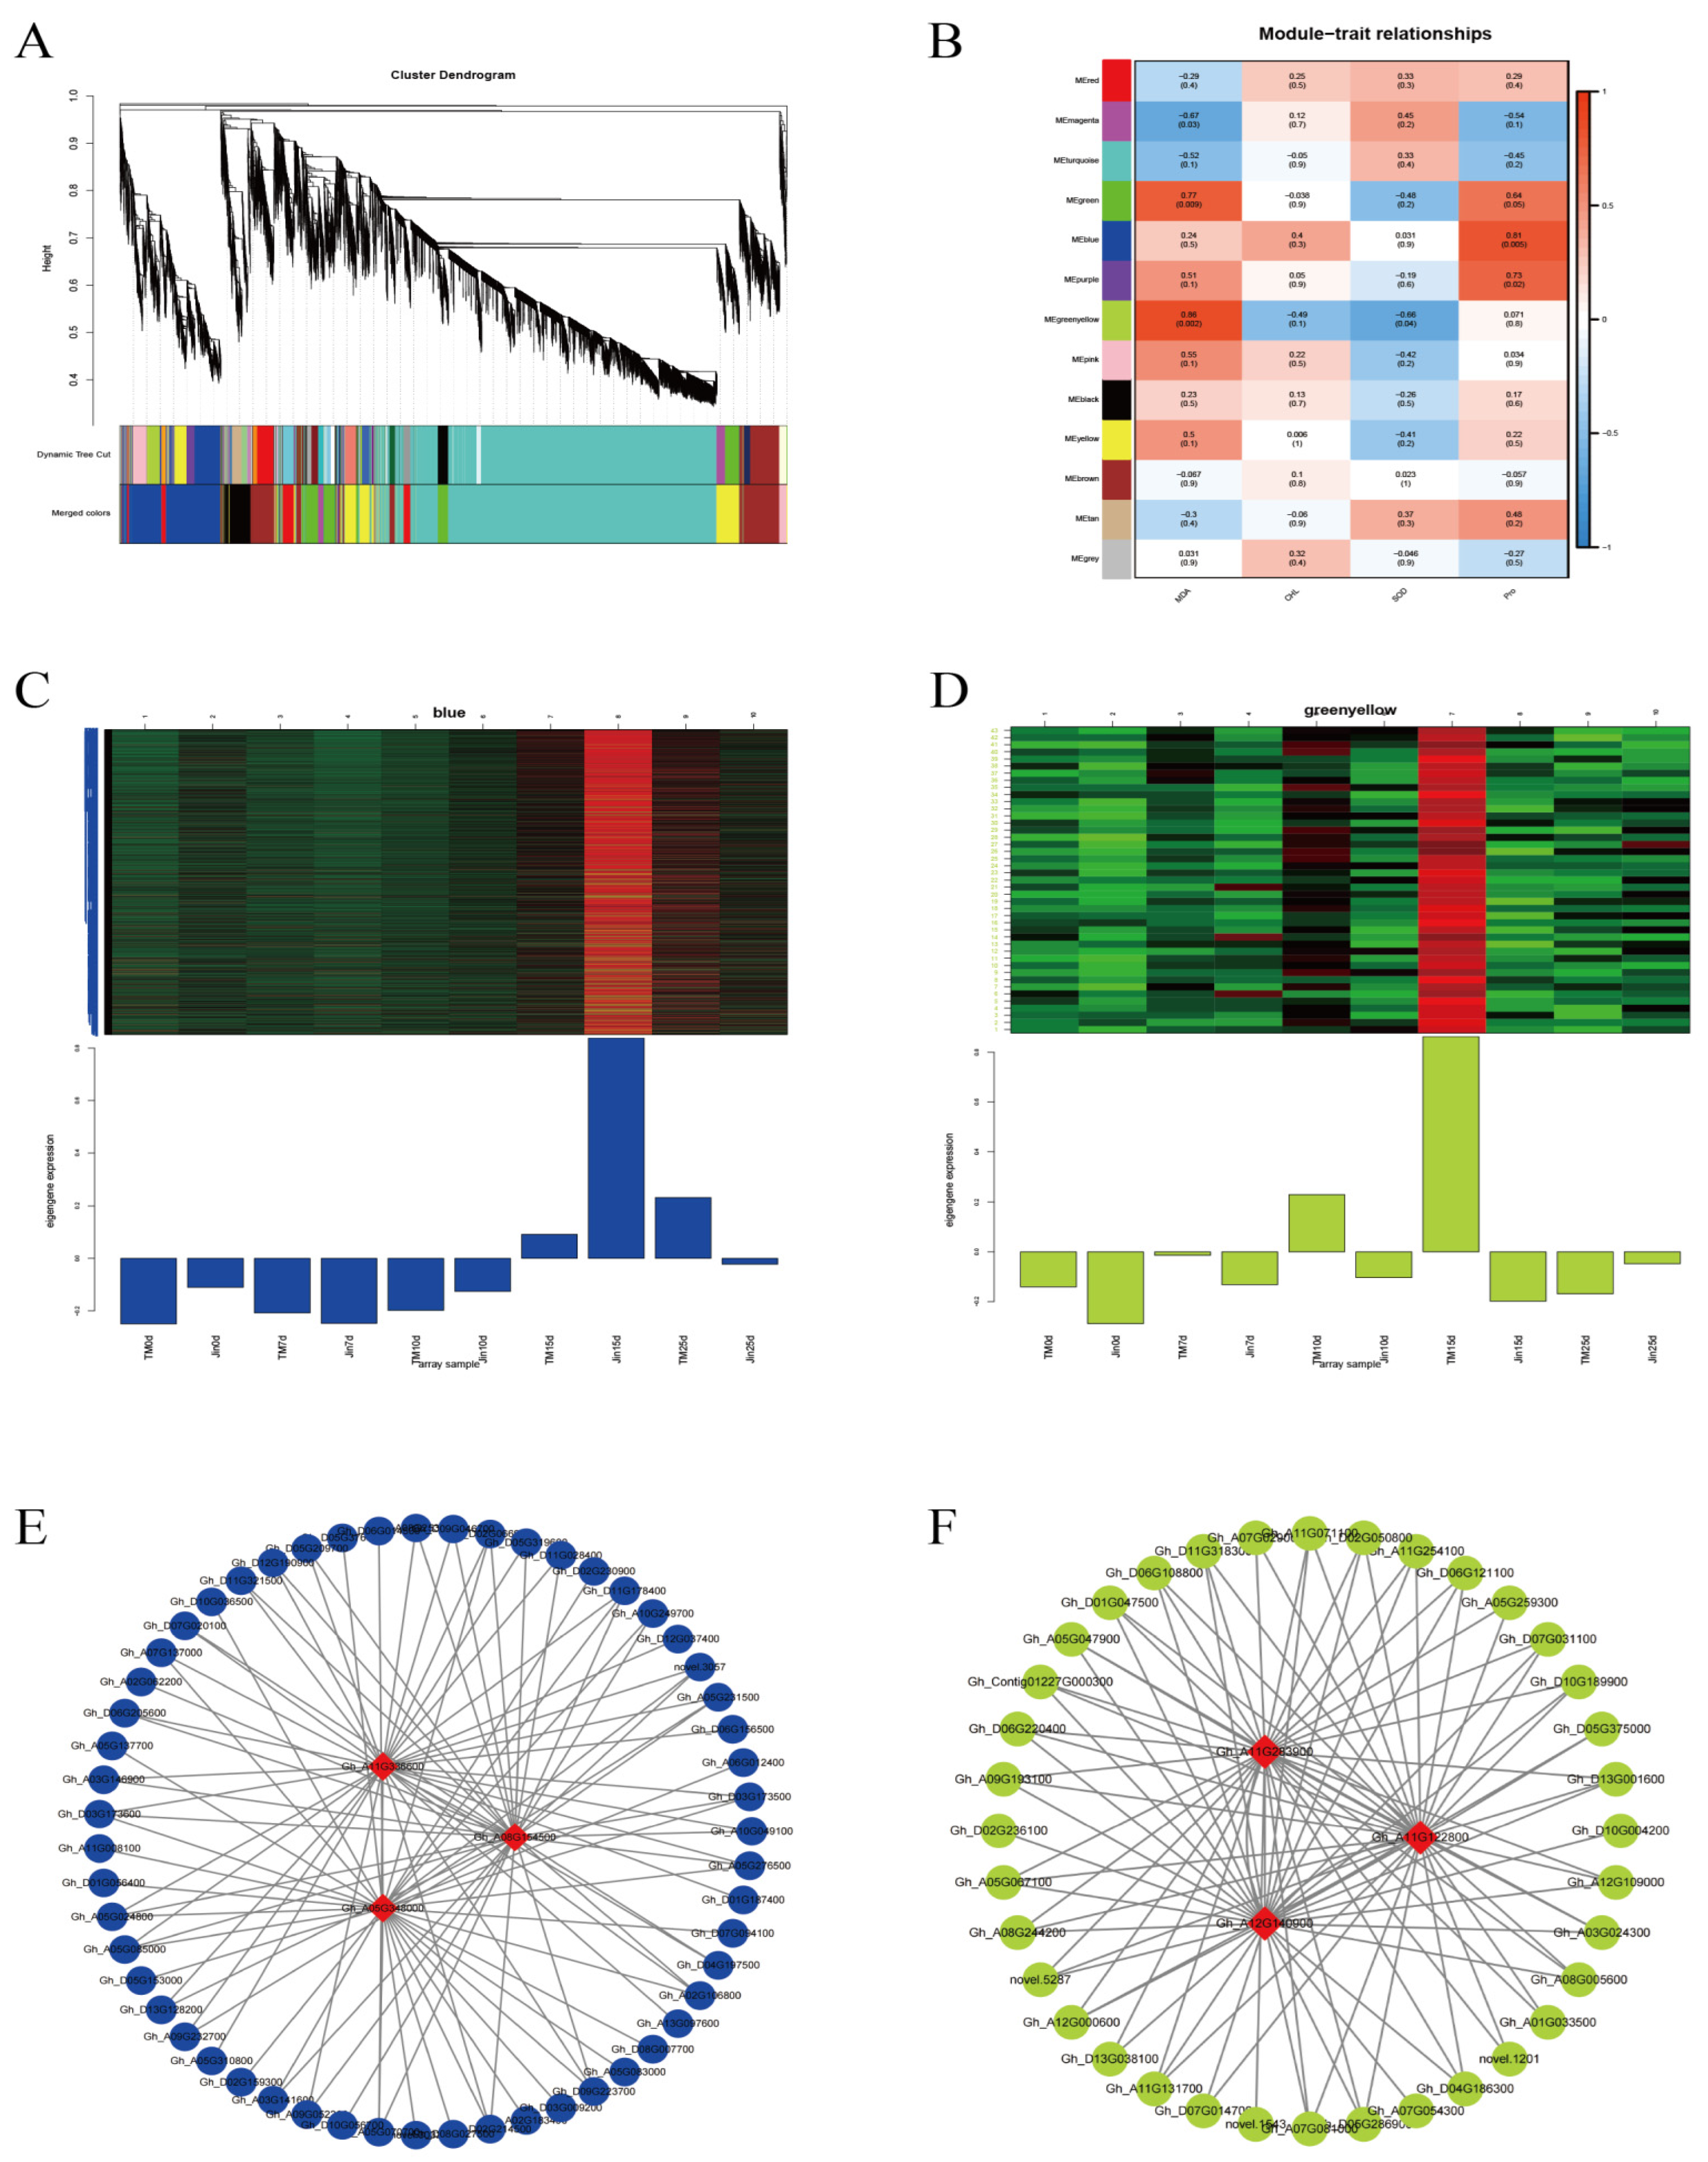
To study the gene regulatory network involved in cotton under drought stress, we constructed a co-expression network of 25,123 differentially expressed genes (DEGs) in the cotton lines using weighted gene co-expression network analysis (WGCNA) (β soft-thresholding value of 7, scale-free R2 > 0.8). Thirteen co-expression modules were obtained, with different colors representing different modules. The correlation between the modules and physiological indicators was calculated, and two significantly highly correlated modules were identified: the blue module, which was significantly correlated with proline (Pro) (r = 0.81, p < 0.01), and the yellow-green module, which was significantly correlated with MDA (malondialdehyde) (r = 0.86, p < 0.01). The hub genes within the blue and yellow-green modules were selected using Cytoscape, and the three genes with the highest connectivity were identified as hub genes. A total of six hub genes were obtained, and the top 100 connections within the blue and yellow-green modules were visualized using Cytoscape based on weight values. Among the six hub genes, Gh_A08G154500 encodes a WRKY transcription factor, Gh_A05G348000 encodes a bromodomain-containing protein BET subfamily transcription factor, Gh_A11G336600 encodes protein kinase C conserved region 2 (CalB), Gh_A12G140900 encodes a cotton sugar and high-affinity sucrose synthase as well as a sucrose and Gol-specific galactoside hydrolase activity protein, Gh_A11G122800 encodes a drought-related protein PCC13-62, and Gh_A11G283900 encodes a protein similar to the antifungal chitin-binding protein hevein from rubber tree latex.
Figure 7.
(A) Hierarchical clustering dendrogram of WGCNA modules; different modules are represented by different colors. (B) Heatmap of the correlation and significance between samples and modules. (C) Gene expression pattern of the blue module. (D) Gene expression pattern of the yellow-green module. (E) Gene interaction network of the blue module. (F) Gene interaction network of the yellow-green module.
3.8. qRT-PCR
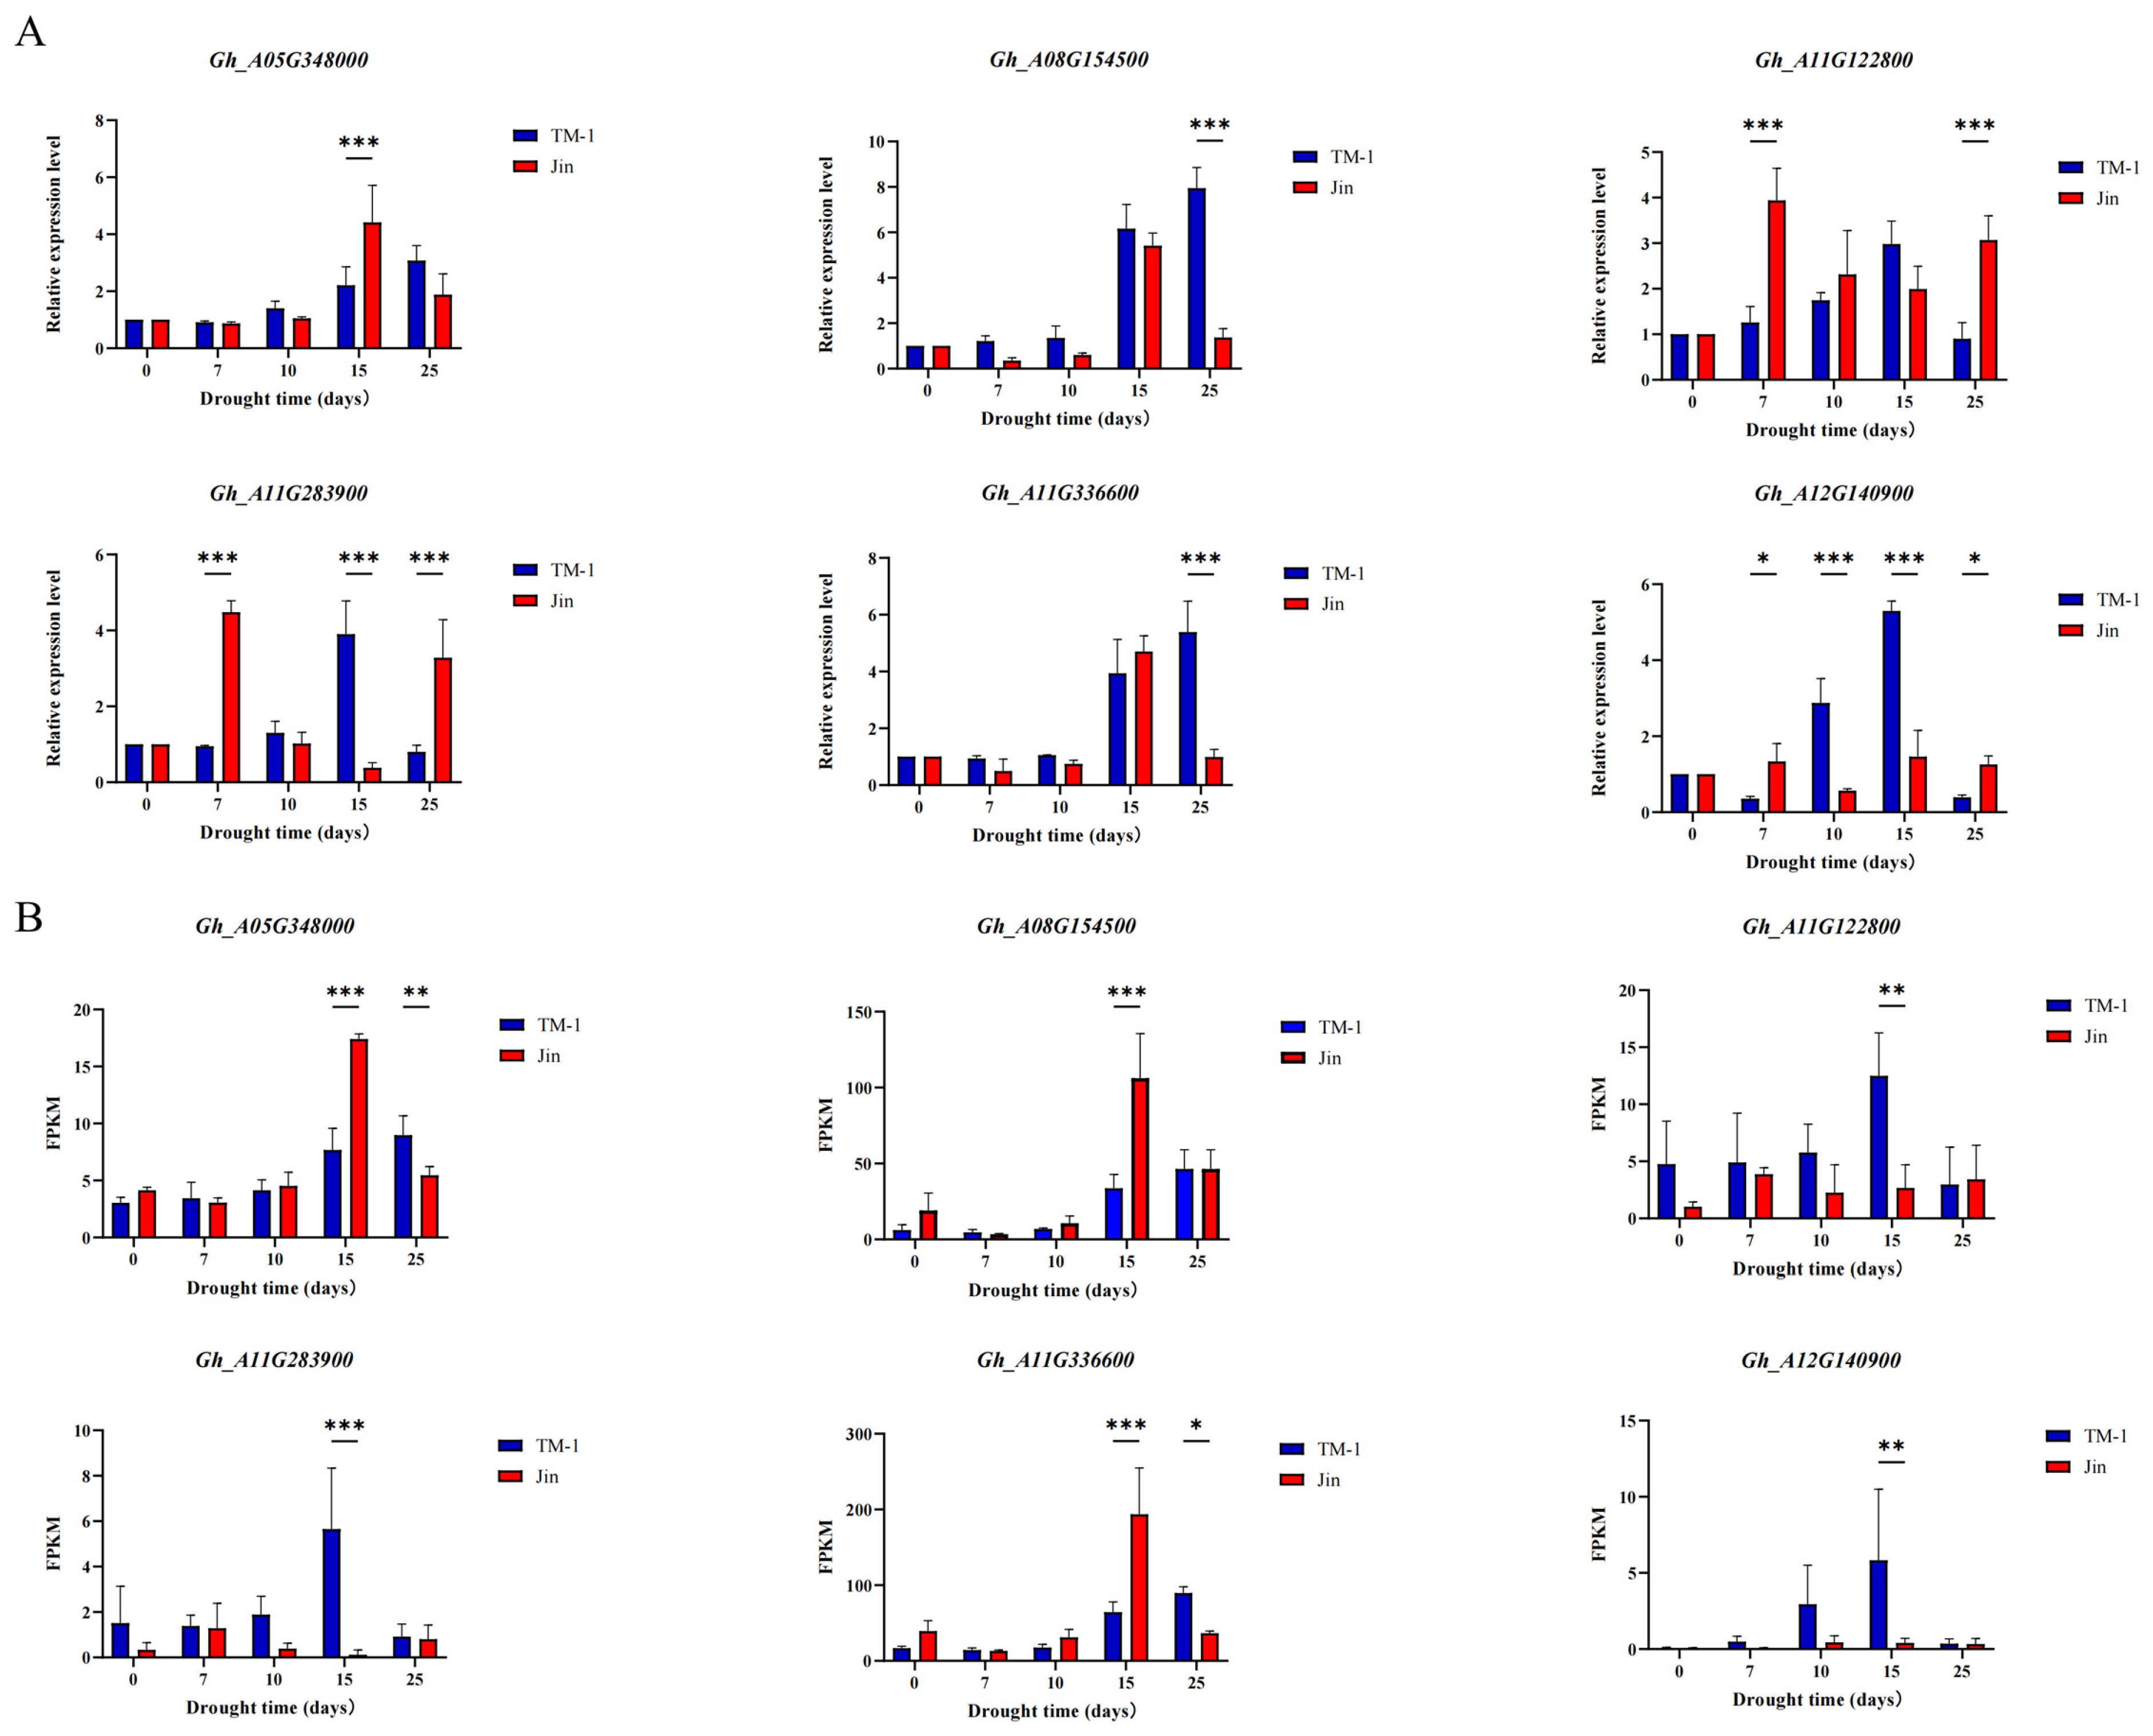
qRT-PCR was used to detect the expression patterns of these six candidate genes in the leaves of TM-1 and Jin under different drought stress conditions. The expression levels of Gh_A11G122800 and Gh_A11G283900 significantly increased after 7 days of drought stress, while the expression levels of Gh_A08G154500, Gh_A05G348000, Gh_A11G336600, and Gh_A12G140900 significantly increased after 15 or 25 days of drought stress. Furthermore, there were significant differences in the expression levels of these six candidate genes at the same time point after drought stress between TM-1 and Jin, indicating that the expression patterns of these six candidate genes were different under drought stress. The results also suggested that these genes participate in the regulation of cotton drought stress through different expression patterns. Moreover, the expression trends of these six candidate genes under drought stress were consistent with the transcriptome data, further confirming the reliability of the transcriptome sequencing results.
4. Discussion
4.1. Physiological Response and Molecular Regulatory Network Differentiation Between Drought-Tolerant and Drought-Sensitive Materials
This study systematically compares the dynamic changes in physiological indicators and transcriptomic responses of the drought-tolerant variety Jin and the drought-sensitive variety TM-1 under drought stress, revealing significant differentiation in their drought resistance mechanisms. Physiological phenotype analysis shows that Jin efficiently regulates osmotic balance (continuous accumulation of Pro) and antioxidant defense (SOD activity maintenance) systems under drought stress, significantly reducing membrane lipid peroxidation levels (low MDA accumulation), while delaying chloroplast damage (small decrease in CHI), thus maintaining cell homeostasis[31]. In contrast, TM-1 exhibits significant membrane system collapse (MDA surge) and loss of photosynthetic capacity (sharp decline in CHI) in the later stages of stress, suggesting a lack of sustained and systematic drought resistance mechanisms[32]. This physiological phenotype difference is further supported at the transcriptomic level: Jin activates a large number of differentially expressed genes (DEGs, 2,927) during the mid-stress stage (7-10d), significantly more than TM-1 (469), and its unique DEGs (8,544) are double that of TM-1 (4,172). This difference in gene expression dynamics indicates that Jin possesses an earlier, broader molecular response network that continuously regulates lipid metabolism (α-linolenic acid metabolism, ether lipid synthesis) and secondary metabolism (sesquiterpene, isoquinoline alkaloid biosynthesis) pathways to enhance membrane stability and stress signal transmission efficiency. In contrast, TM-1’s molecular response is focused on early-stage energy metabolism (TCA cycle, glycolysis) and DNA repair mechanisms, which may result in physiological breakdown in the later stages due to a failure to activate osmotic protection systems in time[33].
The analysis of transcription factors (TFs) further revealed the complexity differences in the regulatory networks between the two varieties. The WRKY, NAC, and MYB family members specifically upregulated in Jin during the mid-stress period (7-15 d) were significantly enriched in the MAPK signaling and jasmonic acid biosynthesis pathways. These TF families have been widely reported to enhance drought resistance by regulating the synthesis of osmotic substances and the expression of antioxidant genes [34,35,36]. In contrast, the suppressed bHLH and C2H2 family members (cluster 2) in TM-1 are related to ion channel activity and DNA repair [37], with its drought resistance strategy focusing more on maintaining genomic stability rather than actively adapting to the stress environment. Notably, cluster 3 (stress-induced) TFs in Jin were significantly enriched in ribosome biosynthesis and RNA degradation pathways, suggesting that they may rapidly reshape the proteome by regulating translation efficiency to adapt to drought. This mechanism has also been reported in Arabidopsis and rice [38,39], but it is being revealed for the first time in cotton. In summary, the differences in drought resistance between Jin and TM-1 are not only reflected in the dynamic physiological responses but also arise from significant differentiation in the breadth, timing, and functional integration efficiency of their molecular regulatory networks.
4.2. WGCNA Analysis of Co-Expressed Modules and Functional Validation of Hub Genes
The gene co-expression network constructed based on WGCNA for the first time dynamically correlates the gene modules related to cotton drought resistance with key physiological indicators, breaking through the limitations of traditional differential gene screening. The blue module (r = 0.81, p < 0.01) was highly positively correlated with proline (Pro) content, with the core hub gene Gh_A12G140900 encoding cotton raffinose synthase, which catalyzes the synthesis of raffinose family oligosaccharides (RFOs), substances that not only serve as osmotic regulators but also enhance cell dehydration tolerance by protecting membrane integrity[40]. Another hub gene, Gh_A11G122800, encodes a drought-related protein PCC13-62, which stabilizes cell membrane structures to prevent dehydration damage during plant recovery[41], Its homologous gene's function in cotton has been reported for the first time. The green-yellow module (r = 0.86, p < 0.01) was significantly correlated with MDA content, and its hub gene Gh_A05G348000 (BET bromodomain protein) might regulate the expression of ROS-related genes through epigenetic regulation[42]. While Gh_A11G336600 (protein kinase C) might activate membrane lipid repair enzymes via phosphorylation modification[43]. These findings directly link traditional physiological indicators to molecular regulatory networks, offering a new perspective on the modular regulatory mechanisms underlying cotton drought resistance.
qRT-PCR validation showed that the expression patterns of the six candidate Hub genes were highly consistent with the RNA-seq data (Figure 8A-B), and there were significant expression differences between varieties. For example, Gh_A08G154500 (WRKY22) showed a 3.2-fold higher expression in Jin compared to TM-1 at 25 days of drought (p<0.001), with its peak expression coinciding with the trend of proline accumulation, suggesting that it may enhance osmotic regulation by positively regulating the proline synthesis pathway [44]. It is noteworthy that Gh_A11G283900 (chitinase-binding protein homolog) was significantly upregulated (2.8-fold, p<0.01) in Jin at 7 days of drought, while no significant change was observed in TM-1. This gene may help resist mechanical damage caused by osmotic stress by enhancing cell wall rigidity [45]. This spatiotemporal expression specificity reflects the functional differentiation of Hub genes in drought resistance strategies between varieties, providing target combinations for multi-gene collaborative breeding.
4.3. WRKY22 Enhances Cotton Drought Resistance Through a Multidimensional Regulatory Network
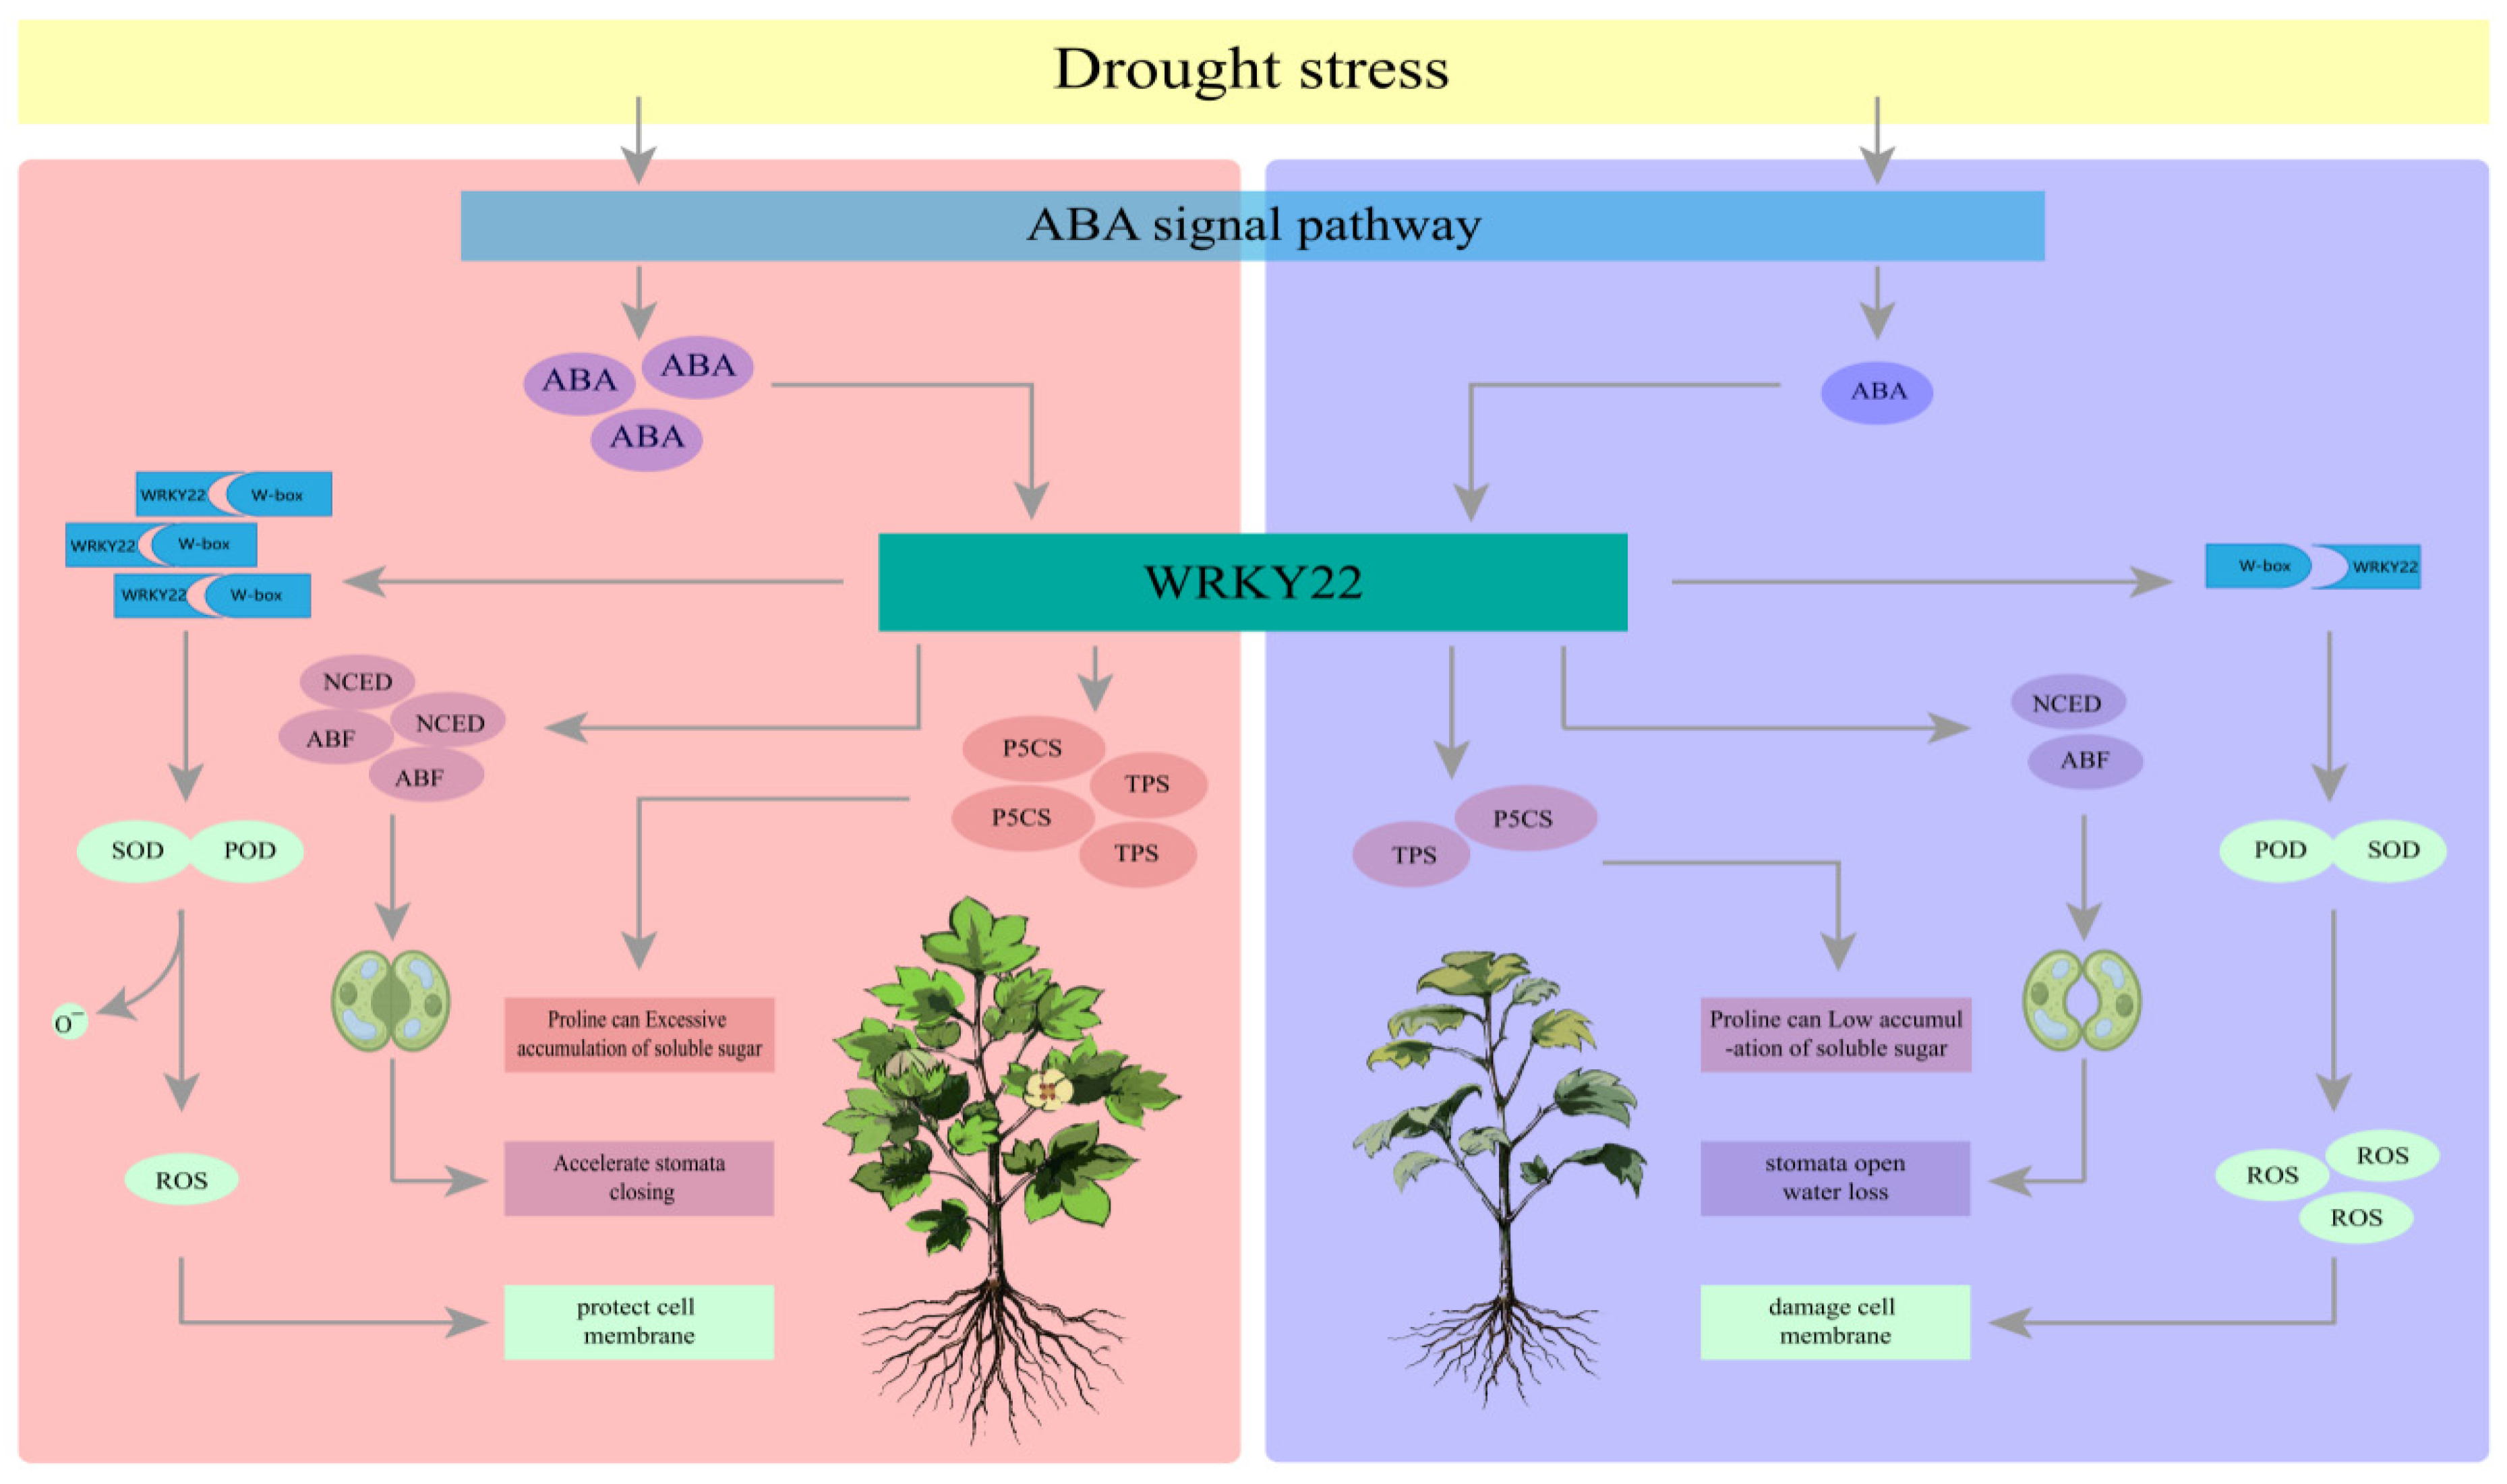
This study found that the WRKY transcription factor Gh_A08G154500 (WRKY22) continuously expressed at high levels in Jin after drought, and its expression dynamics were significantly correlated with proline accumulation and MDA inhibition, indicating its core role in cotton drought resistance regulation. Previous studies have shown that WRKY family members can directly activate key proline synthesis genes, such as P5CS (1-pyrroline-5-carboxylate synthetase), by binding to the W-box cis-element [46]. In this study, the expression of P5CS in Jin was 1.8 times higher than that in TM-1 at the mid-stress period (10 d), consistent with the expression trend of WRKY22. Further analysis revealed that the co-expression module of WRKY22 (blue module) was enriched in MAPK signaling pathways and jasmonic acid biosynthesis genes. It may amplify stress signals through the MAPK-WRKY cascade [47], while also cooperating with the jasmonic acid pathway to regulate the antioxidant system (SOD activity) to reduce MDA production [48]. This regulatory pattern is similar to the mechanism by which Arabidopsis AtWRKY57 enhances drought resistance through JA signaling [49].
Additionally, WRKY22 may coordinate physiological responses through a dual mechanism: on one hand, it directly activates the proline synthesis pathway to maintain cellular osmotic potential [50]; on the other hand, it enhances membrane lipid repair ability by regulating downstream genes such as Gh_A11G336600 (protein kinase C). This "osmotic-membrane protection" dual-module regulatory network may be key to Jin's stronger drought resilience compared to TM-1. It is worth noting that the expression of WRKY22 in TM-1 decreased (0.6-fold, p<0.05) at 25 days of drought, which is consistent with the phenotype of a dramatic increase in MDA content, indicating a functional defect in the regulatory network of this gene in the drought-sensitive variety. Future research can systematically analyze the regulatory effects of WRKY22 on proline metabolism, ROS clearance, and membrane stability by CRISPR knockout/overexpression, and use molecular biology techniques to identify upstream and downstream regulatory genes, in order to improve the WRKY22 regulatory network model for cotton drought resistance.
Figure 9.
The Regulatory Mechanism of Cotton Drought Stress Involving WRK22 through Physiological Indicators.
Figure 9.
The Regulatory Mechanism of Cotton Drought Stress Involving WRK22 through Physiological Indicators.
5. Conclusion
This study integrated physiological phenotypes and multi-timepoint transcriptomic analysis to reveal the molecular regulatory network characteristics of the drought-resistant cotton variety Jin and its differentiation mechanism with the drought-sensitive variety TM-1. Under drought stress, Jin significantly inhibited malondialdehyde (MDA) accumulation and delayed chlorophyll degradation by continuously accumulating proline and enhancing superoxide dismutase activity, demonstrating stronger osmotic regulation and redox homeostasis maintenance. Transcriptomic dynamic analysis revealed that Jin specifically activated 8,544 differentially expressed genes after stress, enriched in lipid metabolism (α-linolenic acid, ether lipids) and secondary metabolism pathways, uncovering a synergistic mechanism of enhanced membrane stability and optimized stress signaling. The WGCNA co-expression network identified modules significantly associated with proline (r=0.81) and MDA (r=0.86), and identified the key hub gene Gh_A08G154500 (WRKY22), which exhibited 3.2 times higher expression in Jin compared to TM-1 after 15 days of drought stress. This gene regulates the synthesis of proline by activating the proline synthesis gene (P5CS) and the MAPK-Jasmonic acid signaling cascade, forming a dual-module regulatory network of "osmotic-membrane protection." This study provides key gene resources such as WRKY22 for cotton drought-resistant breeding, accelerating the breeding process of cotton drought-resistant varieties.
Author Contributions
Conceptualization, Hu Zhang; Data curation, Qingtao Zeng and Quanjia Chen; Formal analysis, Jinsheng Wang and Qin Chen; Investigation, Wengju Gao; Methodology, Yu Tang; Resources, Wen Zhang; Validation, Yuantao Guo; Writing – review & editing, Qin Chen.
Funding
National Major Project of Agricultural Biological Breeding (2023ZD04040-3), National Natural Science Foundation of China Regional Fund Project (32260503), The Seventh Division Financial Science and Technology Program (2023D01).
Data Availability Statement
Data can be obtained according to the requirements.
Conflicts of Interest
The authors declare that they have no competing interests.
Abbreviations
The following abbreviations are used in this manuscript:
| RNA-Seq | RNA Sequencing |
| WGCNA | Weighted Gene Co-expression Network Analysis |
| MDA | Malondialdehyde |
| Pro | Proline |
| SOD | superoxide dismutase |
| CHI | Chlorophyl |
References
- Xu, Z., et al., Distribution and evolution of cotton fiber development genes in the fibreless Gossypium raimondii genome. Genomics, 2015. 106(1): p. 61-9.
- Huang, G., et al., Recent advances and future perspectives in cotton research. Annual review of plant biology, 2021. 72(1): p. 437-462.
- Anwar, M., et al., Inter-Specific Hybridization in Cotton (Gossypium hirsutum) for Crop Improvement. Agronomy, 2022. 12(12): p. 3158.
- Sun, F., et al., Quantitative trait loci and candidate genes for yield-related traits of upland cotton revealed by genome-wide association analysis under drought conditions. BMC Genomics, 2023. 24(1): p. 531.
- Meshram, J.H., et al., Drought stress tolerance in cotton: progress and perspectives. Climate Change and Crop Stress, 2022: p. 135-169.
- Ullah, A., et al., Drought coping strategies in cotton: increased crop per drop. Plant Biotechnol J, 2017. 15(3): p. 271-284.
- Ul-Allah, S., et al., Fiber yield and quality in cotton under drought: Effects and management. Agricultural Water Management, 2021. 255: p. 106994.
- Abdelraheem, A., N. Adams, and J. Zhang, Effects of drought on agronomic and fiber quality in an introgressed backcross inbred line population of Upland cotton under field conditions. Field Crops Research, 2020. 254: p. 107850.
- Naikwade, P.V., Plant responses to drought stress: Morphological, physiological, molecular approaches, and drought resistance, in Plant Metabolites under Environmental Stress. 2023, Apple Academic Press. p. 149-183.
- Impa, S., S. Nadaradjan, and S. Jagadish, Drought stress induced reactive oxygen species and anti-oxidants in plants. Abiotic stress responses in plants: metabolism, productivity and sustainability, 2012: p. 131-147.
- Anjum, S.A., et al., Morphological, physiological and biochemical responses of plants to drought stress. African journal of agricultural research, 2011. 6(9): p. 2026-2032.
- Yildiz-Aktas, L., et al., Drought tolerance in cotton: involvement of non-enzymatic ROS-scavenging compounds. Journal of Agronomy and crop science, 2009. 195(4): p. 247-253.
- Zulfiqar, F. and M. Ashraf, Proline alleviates abiotic stress induced oxidative stress in plants. Journal of Plant Growth Regulation, 2023. 42(8): p. 4629-4651.
- Luo, Q., et al., Proline Metabolism in Response to Climate Extremes in Hairgrass. Plants, 2024. 13(10): p. 1408.
- Gill, S.S., et al., Superoxide dismutase—mentor of abiotic stress tolerance in crop plants. Environmental science and pollution research, 2015. 22: p. 10375-10394.
- Hemati, A., et al., Physiological effects of drought stress in plants, in Plant stress mitigators: Action and application. 2022, Springer. p. 113-124.
- Wang, Z., M. Gerstein, and M. Snyder, RNA-Seq: a revolutionary tool for transcriptomics. Nat Rev Genet, 2009. 10(1): p. 57-63.
- Li, J.-R., et al., Plant stress RNA-seq Nexus: a stress-specific transcriptome database in plant cells. BMC Genomics, 2018. 19(1): p. 966.
- Zheng, J., et al., Whole Transcriptome Sequencing Reveals Drought Resistance-Related Genes in Upland Cotton. Genes (Basel), 2022. 13(7).
- Liu, R., et al., GhMYB102 promotes drought resistance by regulating drought-responsive genes and ABA biosynthesis in cotton (Gossypium hirsutum L.). Plant Sci, 2023. 329: p. 111608.
- Langfelder, P. and S. Horvath, WGCNA: an R package for weighted correlation network analysis. BMC Bioinformatics, 2008. 9: p. 559.
- Doncheva, N.T., et al., Cytoscape StringApp: Network Analysis and Visualization of Proteomics Data. J Proteome Res, 2019. 18(2): p. 623-632.
- Yu, J., et al., CottonGen: The Community Database for Cotton Genomics, Genetics, and Breeding Research. Plants (Basel), 2021. 10(12).
- Kim, D., B. Langmead, and S.L. Salzberg, HISAT: a fast spliced aligner with low memory requirements. Nat Methods, 2015. 12(4): p. 357-60.
- Liao, Y., G.K. Smyth, and W. Shi, featureCounts: an efficient general purpose program for assigning sequence reads to genomic features. Bioinformatics, 2014. 30(7): p. 923-30.
- Love, M.I., W. Huber, and S. Anders, Moderated estimation of fold change and dispersion for RNA-seq data with DESeq2. Genome Biology, 2014. 15(12): p. 550.
- Robinson, M.D., D.J. McCarthy, and G.K. Smyth, edgeR: a Bioconductor package for differential expression analysis of digital gene expression data. Bioinformatics, 2010. 26(1): p. 139-40.
- Benjamini, Y. and Y. Hochberg, Controlling the False Discovery Rate: A Practical and Powerful Approach to Multiple Testing. Journal of the Royal Statistical Society. Series B (Methodological), 1995. 57(1): p. 289-300.
- Yu, G., et al., clusterProfiler: an R package for comparing biological themes among gene clusters. Omics, 2012. 16(5): p. 284-7.
- Swift, M.L., GraphPad Prism, Data Analysis, and Scientific Graphing. Journal of Chemical Information and Computer Sciences, 1997. 37(2): p. 411-412.
- Yang, P., et al., Brassinosteroids regulate antioxidant system and protect chloroplast ultrastructure of autotoxicity-stressed cucumber (Cucumis sativus L.) seedlings. Agronomy, 2019. 9(5): p. 265.
- Wang, Z., et al., Effects of drought stress on photosynthesis and photosynthetic electron transport chain in young apple tree leaves. Biol Open, 2018. 7(11).
- Wu, S., et al., Osmotic adjustment and antioxidant system regulated by nitrogen deposition improve photosynthetic and growth performance and alleviate oxidative damage in dwarf bamboo under drought stress. Frontiers in Plant Science, 2022. 13: p. 819071.
- Shang, C., et al., SlWRKY81 regulates Spd synthesis and Na/K homeostasis through interaction with SlJAZ1 mediated JA pathway to improve tomato saline-alkali resistance. 2024.
- Xiong, H., et al., Multiple roles of NAC transcription factors in plant development and stress responses. Journal of Integrative Plant Biology, 2025.
- Wang, Z., et al., Unveiling the power of MYB transcription factors: Master regulators of multi-stress responses and development in cotton. International Journal of Biological Macromolecules, 2024: p. 133885.
- Yang, L., et al., Full-length transcriptome sequences of ephemeral plant Arabidopsis pumila provides insight into gene expression dynamics during continuous salt stress. BMC genomics, 2018. 19: p. 1-14.
- Chintakovid, N., et al., Proteomic analysis of drought-responsive proteins in rice reveals photosynthesis-related adaptations to drought stress. Acta Physiologiae Plantarum, 2017. 39: p. 1-13.
- Alqurashi, M., et al., Early responses to severe drought stress in the Arabidopsis thaliana cell suspension culture proteome. Proteomes, 2018. 6(4): p. 38.
- ElSayed, A., M. Rafudeen, and D. Golldack, Physiological aspects of raffinose family oligosaccharides in plants: protection against abiotic stress. Plant biology, 2014. 16(1): p. 1-8.
- Iturriaga, G., M.A.F. Cushman, and J.C. Cushman, An EST catalogue from the resurrection plant Selaginella lepidophylla reveals abiotic stress-adaptive genes. Plant Science, 2006. 170(6): p. 1173-1184.
- Michaeloudes, C., et al., Bromodomain and extraterminal proteins suppress NF-E2–related factor 2–mediated antioxidant gene expression. The Journal of Immunology, 2014. 192(10): p. 4913-4920.
- Campo, S., et al., Overexpression of a calcium-dependent protein kinase confers salt and drought tolerance in rice by preventing membrane lipid peroxidation. Plant physiology, 2014. 165(2): p. 688-704.
- Delauney, A.J. and D.P.S. Verma, Proline biosynthesis and osmoregulation in plants. The plant journal, 1993. 4(2): p. 215-223.
- Tenhaken, R., Cell wall remodeling under abiotic stress. Frontiers in plant science, 2015. 5: p. 771.
- Gu, L., et al., The cotton GhWRKY91 transcription factor mediates leaf senescence and responses to drought stress in transgenic Arabidopsis thaliana. Frontiers in Plant Science, 2019. 10: p. 1352.
- Lin, L., et al., Plant mitogen-activated protein kinase cascades in environmental stresses. International Journal of Molecular Sciences, 2021. 22(4): p. 1543.
- Jiang, J., et al., WRKY transcription factors in plant responses to stresses. Journal of integrative plant biology, 2017. 59(2): p. 86-101.
- Bai, Y., et al., Overexpression of a WRKY transcription factor McWRKY57-like from Mentha canadensis L. enhances drought tolerance in transgenic Arabidopsis. BMC plant biology, 2023. 23(1): p. 216.
- Zhao, P., et al., GhWRKY1bD improves drought tolerance by co-regulation of ABA, ROS, and proline homeostasis in cotton (Gossypium hirsutum). Industrial Crops and Products, 2024. 220: p. 119179.
Figure 2.
(A) Correlation analysis of RNA-seq data of cotton leaves under different stress conditions in TM-1 and Jin. (B) PCA of RNA-seq data of cotton leaves under different stress conditions in TM-1 and Jin.
Figure 2.
(A) Correlation analysis of RNA-seq data of cotton leaves under different stress conditions in TM-1 and Jin. (B) PCA of RNA-seq data of cotton leaves under different stress conditions in TM-1 and Jin.
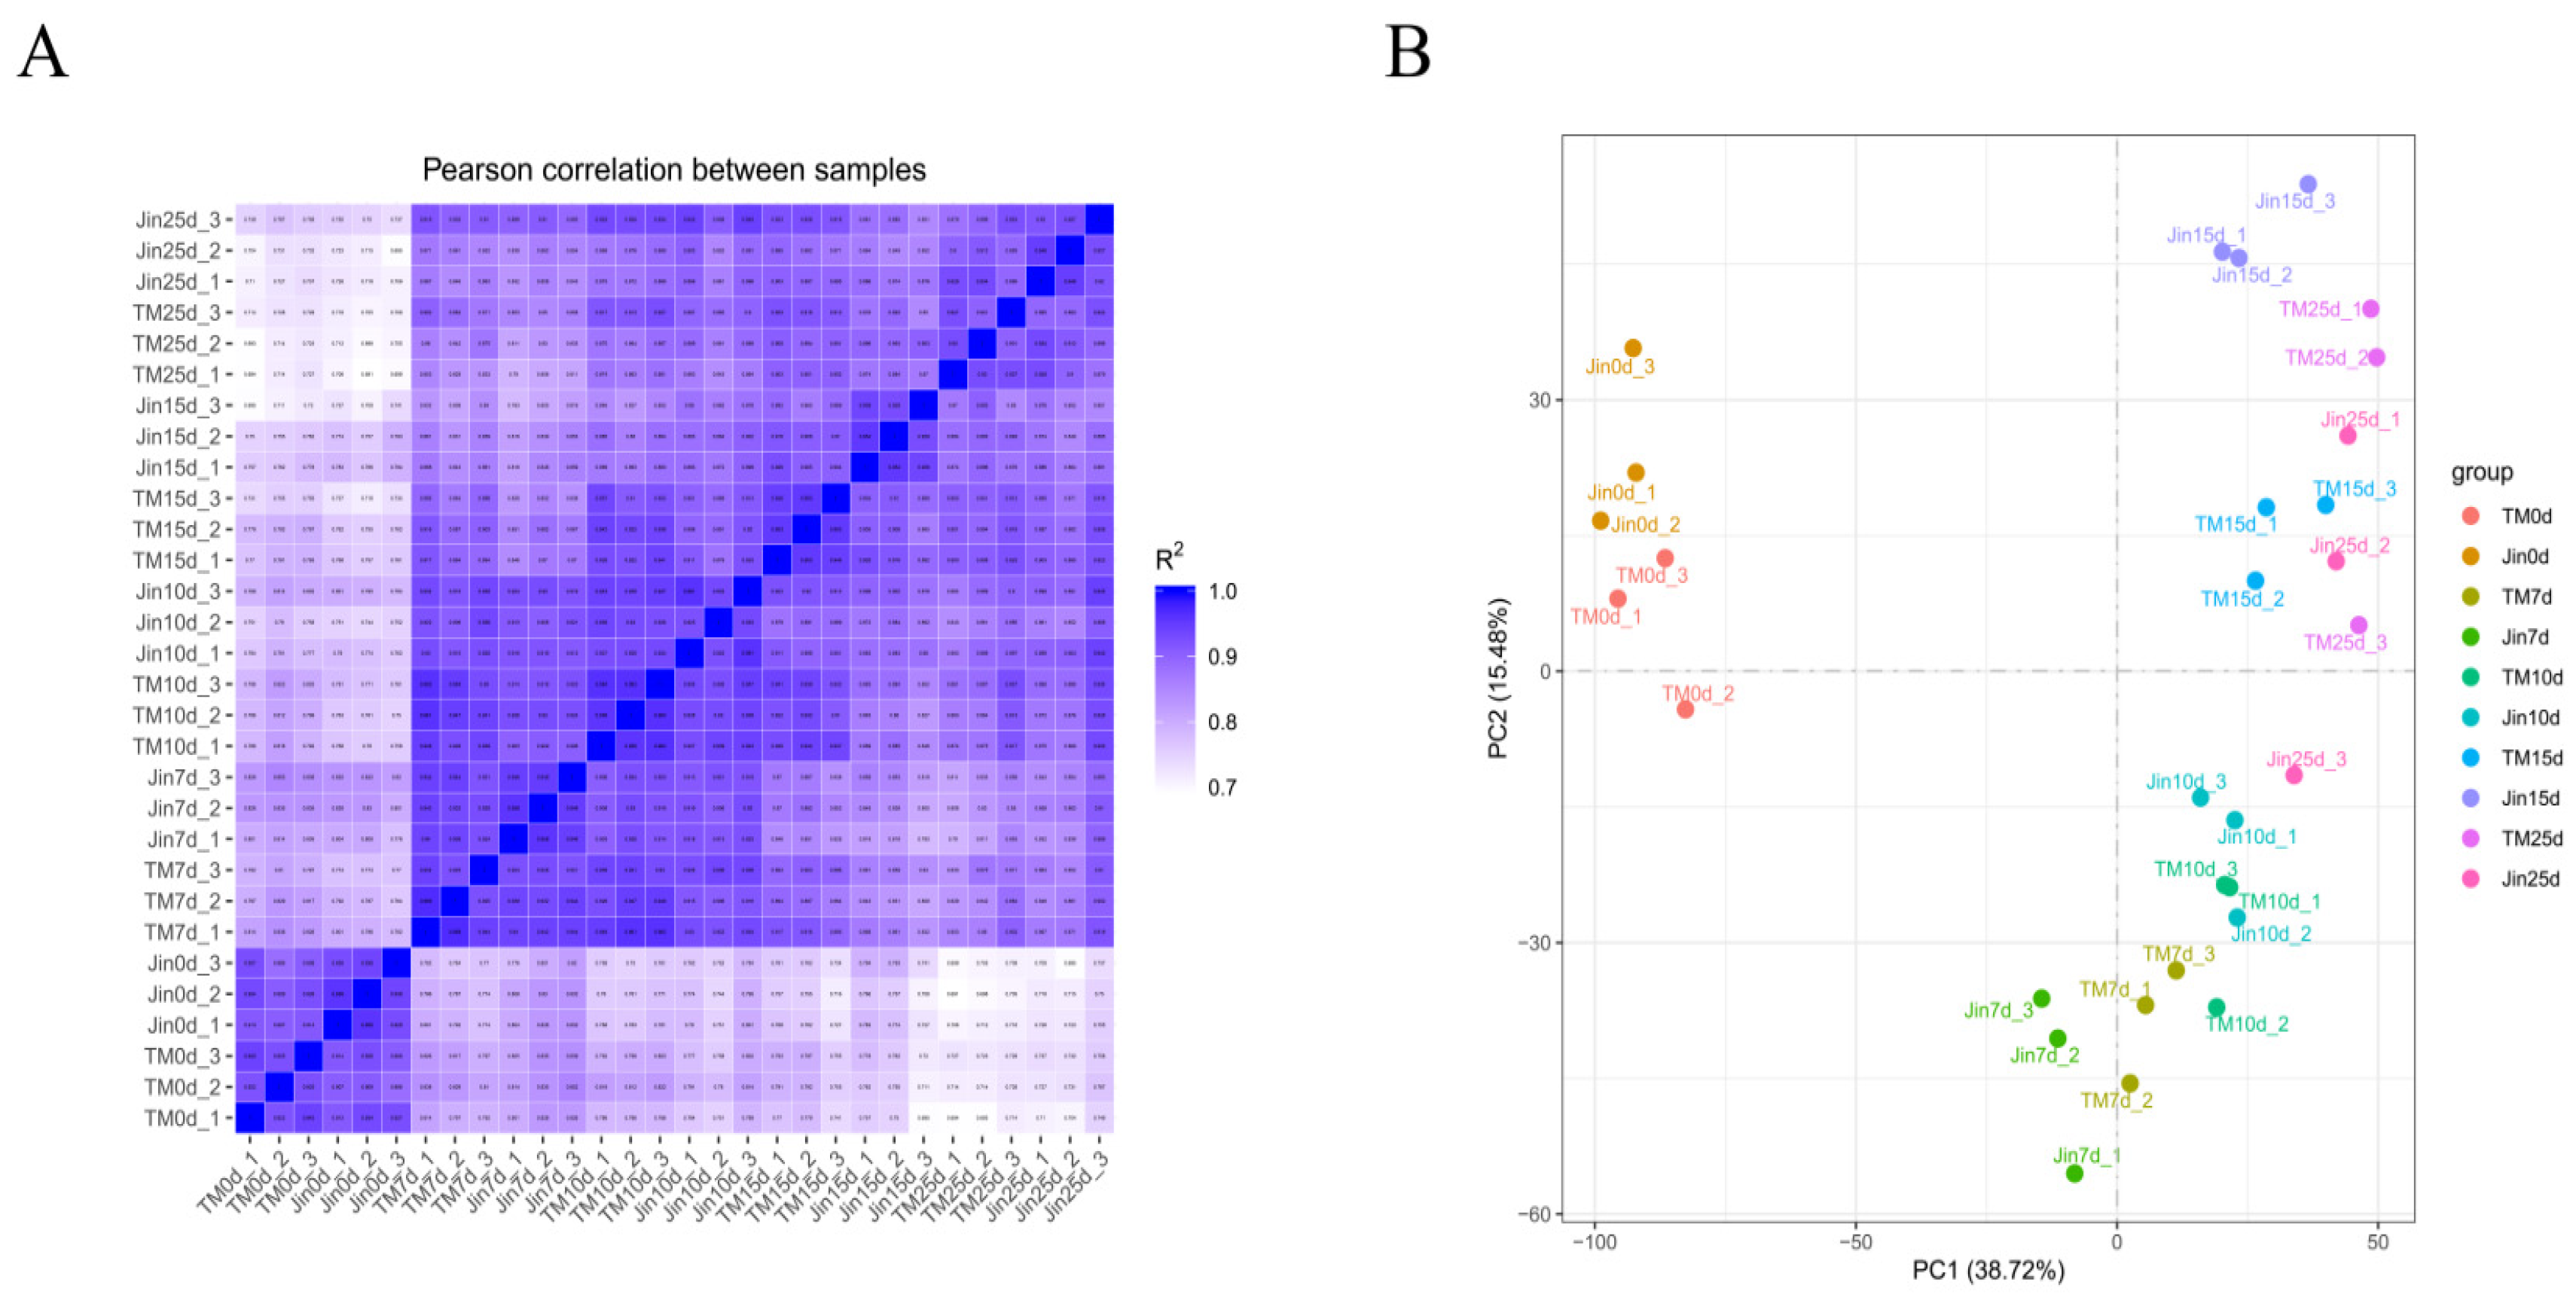
Figure 3.
(A) Number of upregulated and downregulated DEGs in Jin and TM-1 under drought stress. (B) Number of DEGs in Jin at different stages of drought stress. (C) Number of DEGs in TM-1 at different stages of drought stress. (D) Number of DEGs between Jin and TM-1.
Figure 3.
(A) Number of upregulated and downregulated DEGs in Jin and TM-1 under drought stress. (B) Number of DEGs in Jin at different stages of drought stress. (C) Number of DEGs in TM-1 at different stages of drought stress. (D) Number of DEGs between Jin and TM-1.
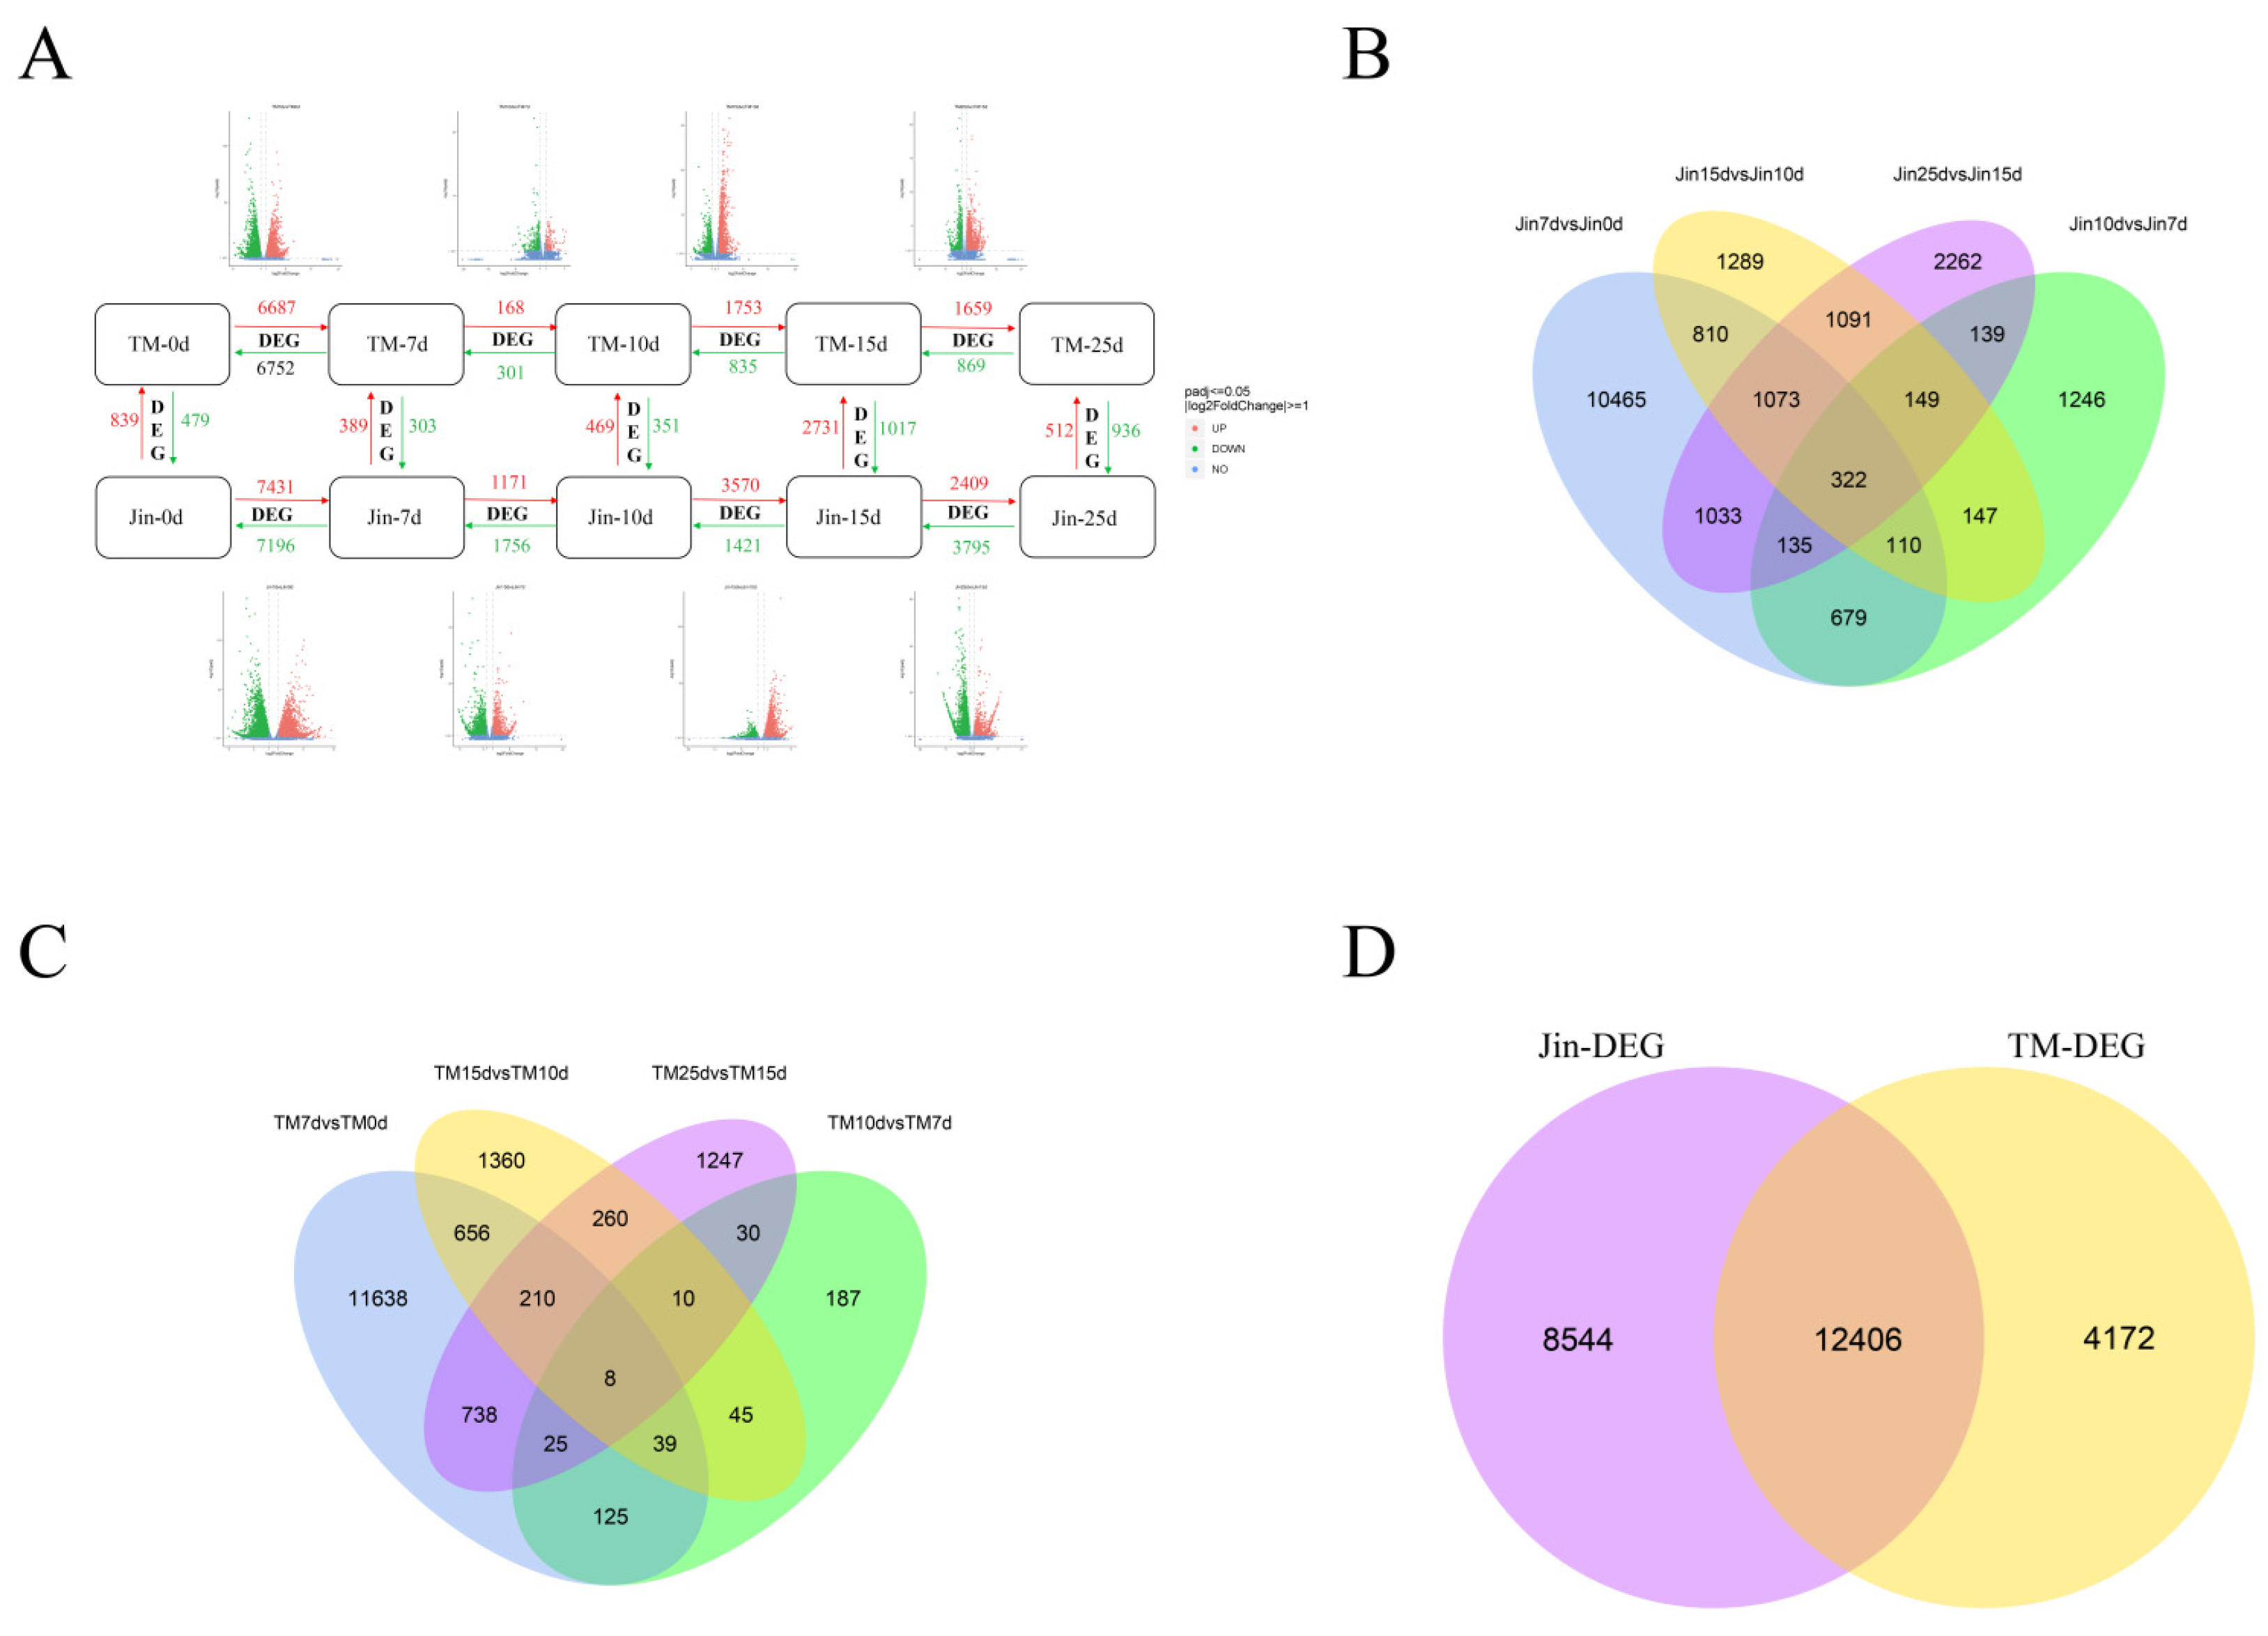
Figure 4.
(A) KEGG pathway enrichment of DEGs specifically expressed in Jin. (B) GO term enrichment of DEGs specifically expressed in Jin. (C) KEGG pathway enrichment of DEGs specifically expressed in TM-1. (D) GO term enrichment of DEGs specifically expressed in TM-1.
Figure 4.
(A) KEGG pathway enrichment of DEGs specifically expressed in Jin. (B) GO term enrichment of DEGs specifically expressed in Jin. (C) KEGG pathway enrichment of DEGs specifically expressed in TM-1. (D) GO term enrichment of DEGs specifically expressed in TM-1.
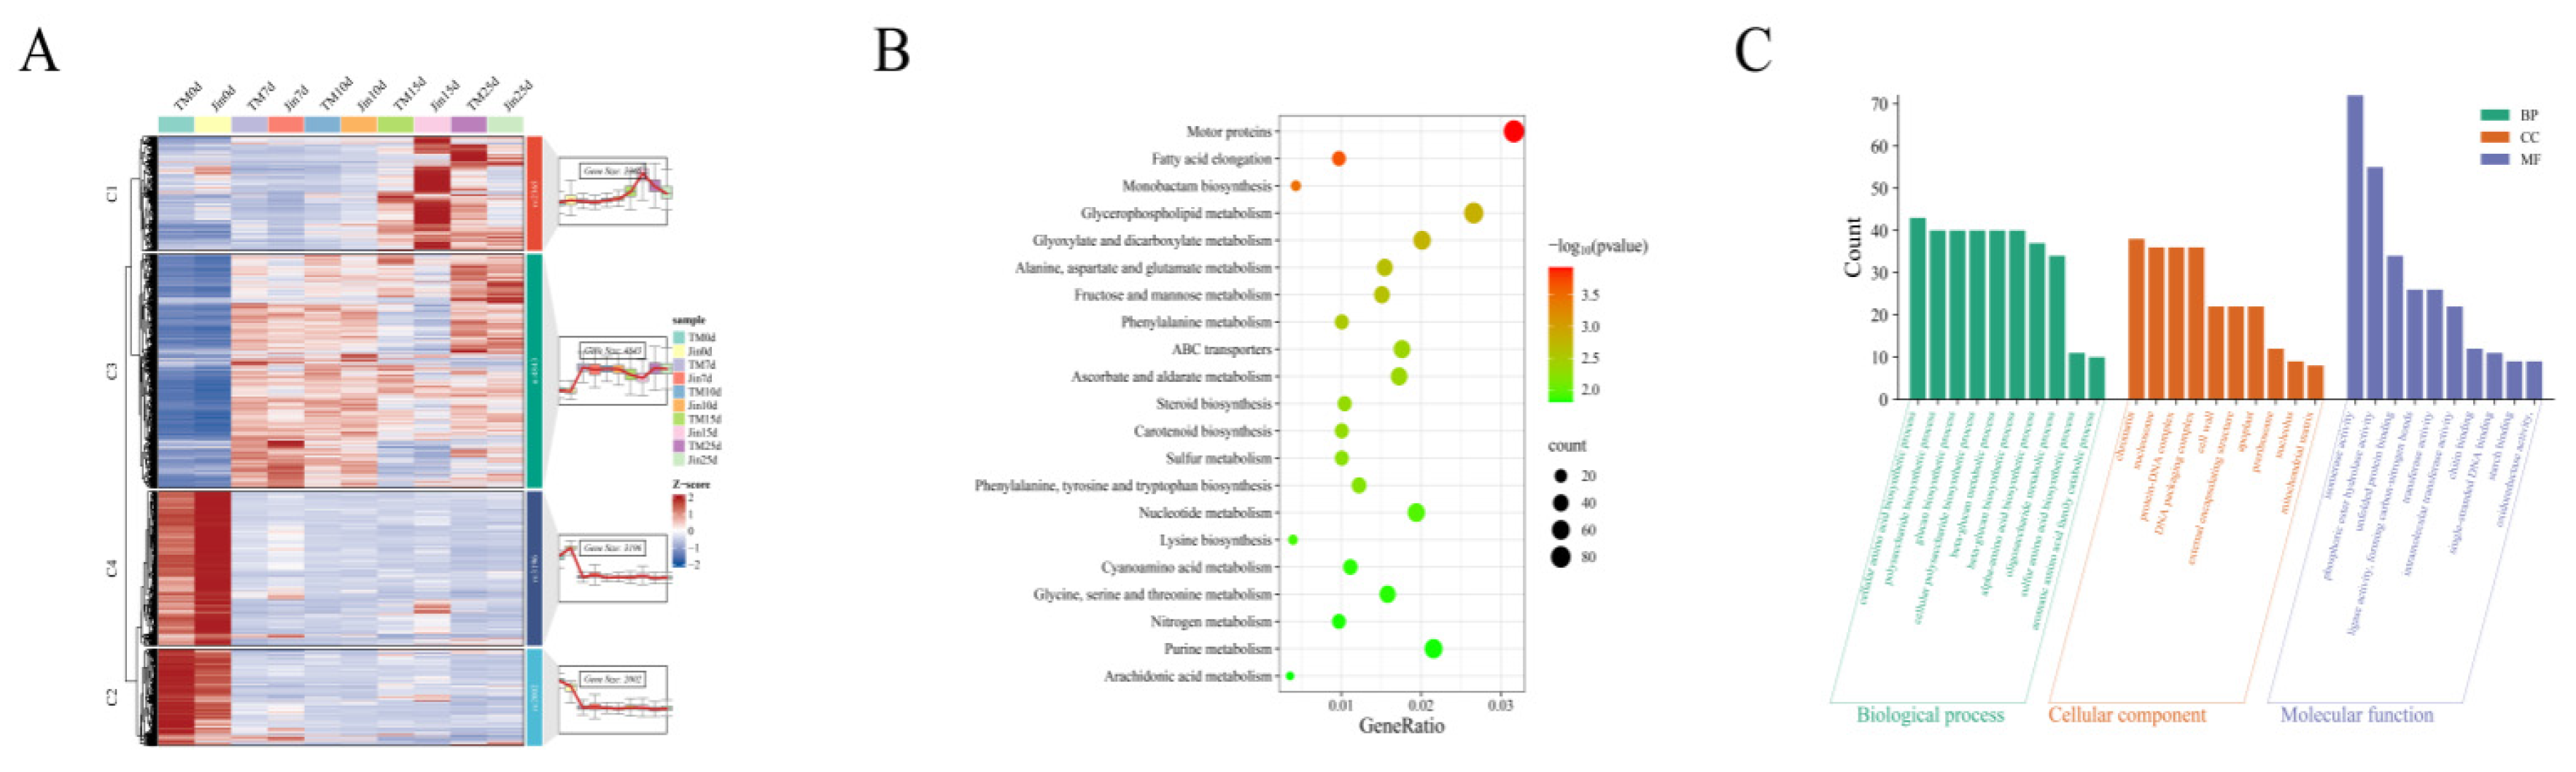
Figure 5.
(A) KEGG pathway enrichment of DEGs specifically expressed in Jin. (B) GO pathway enrichment of DEGs specifically expressed in Jin. (C) KEGG pathway enrichment of DEGs specifically expressed in TM-1. (D) GO pathway enrichment of DEGs specifically expressed in TM-1.
Figure 5.
(A) KEGG pathway enrichment of DEGs specifically expressed in Jin. (B) GO pathway enrichment of DEGs specifically expressed in Jin. (C) KEGG pathway enrichment of DEGs specifically expressed in TM-1. (D) GO pathway enrichment of DEGs specifically expressed in TM-1.
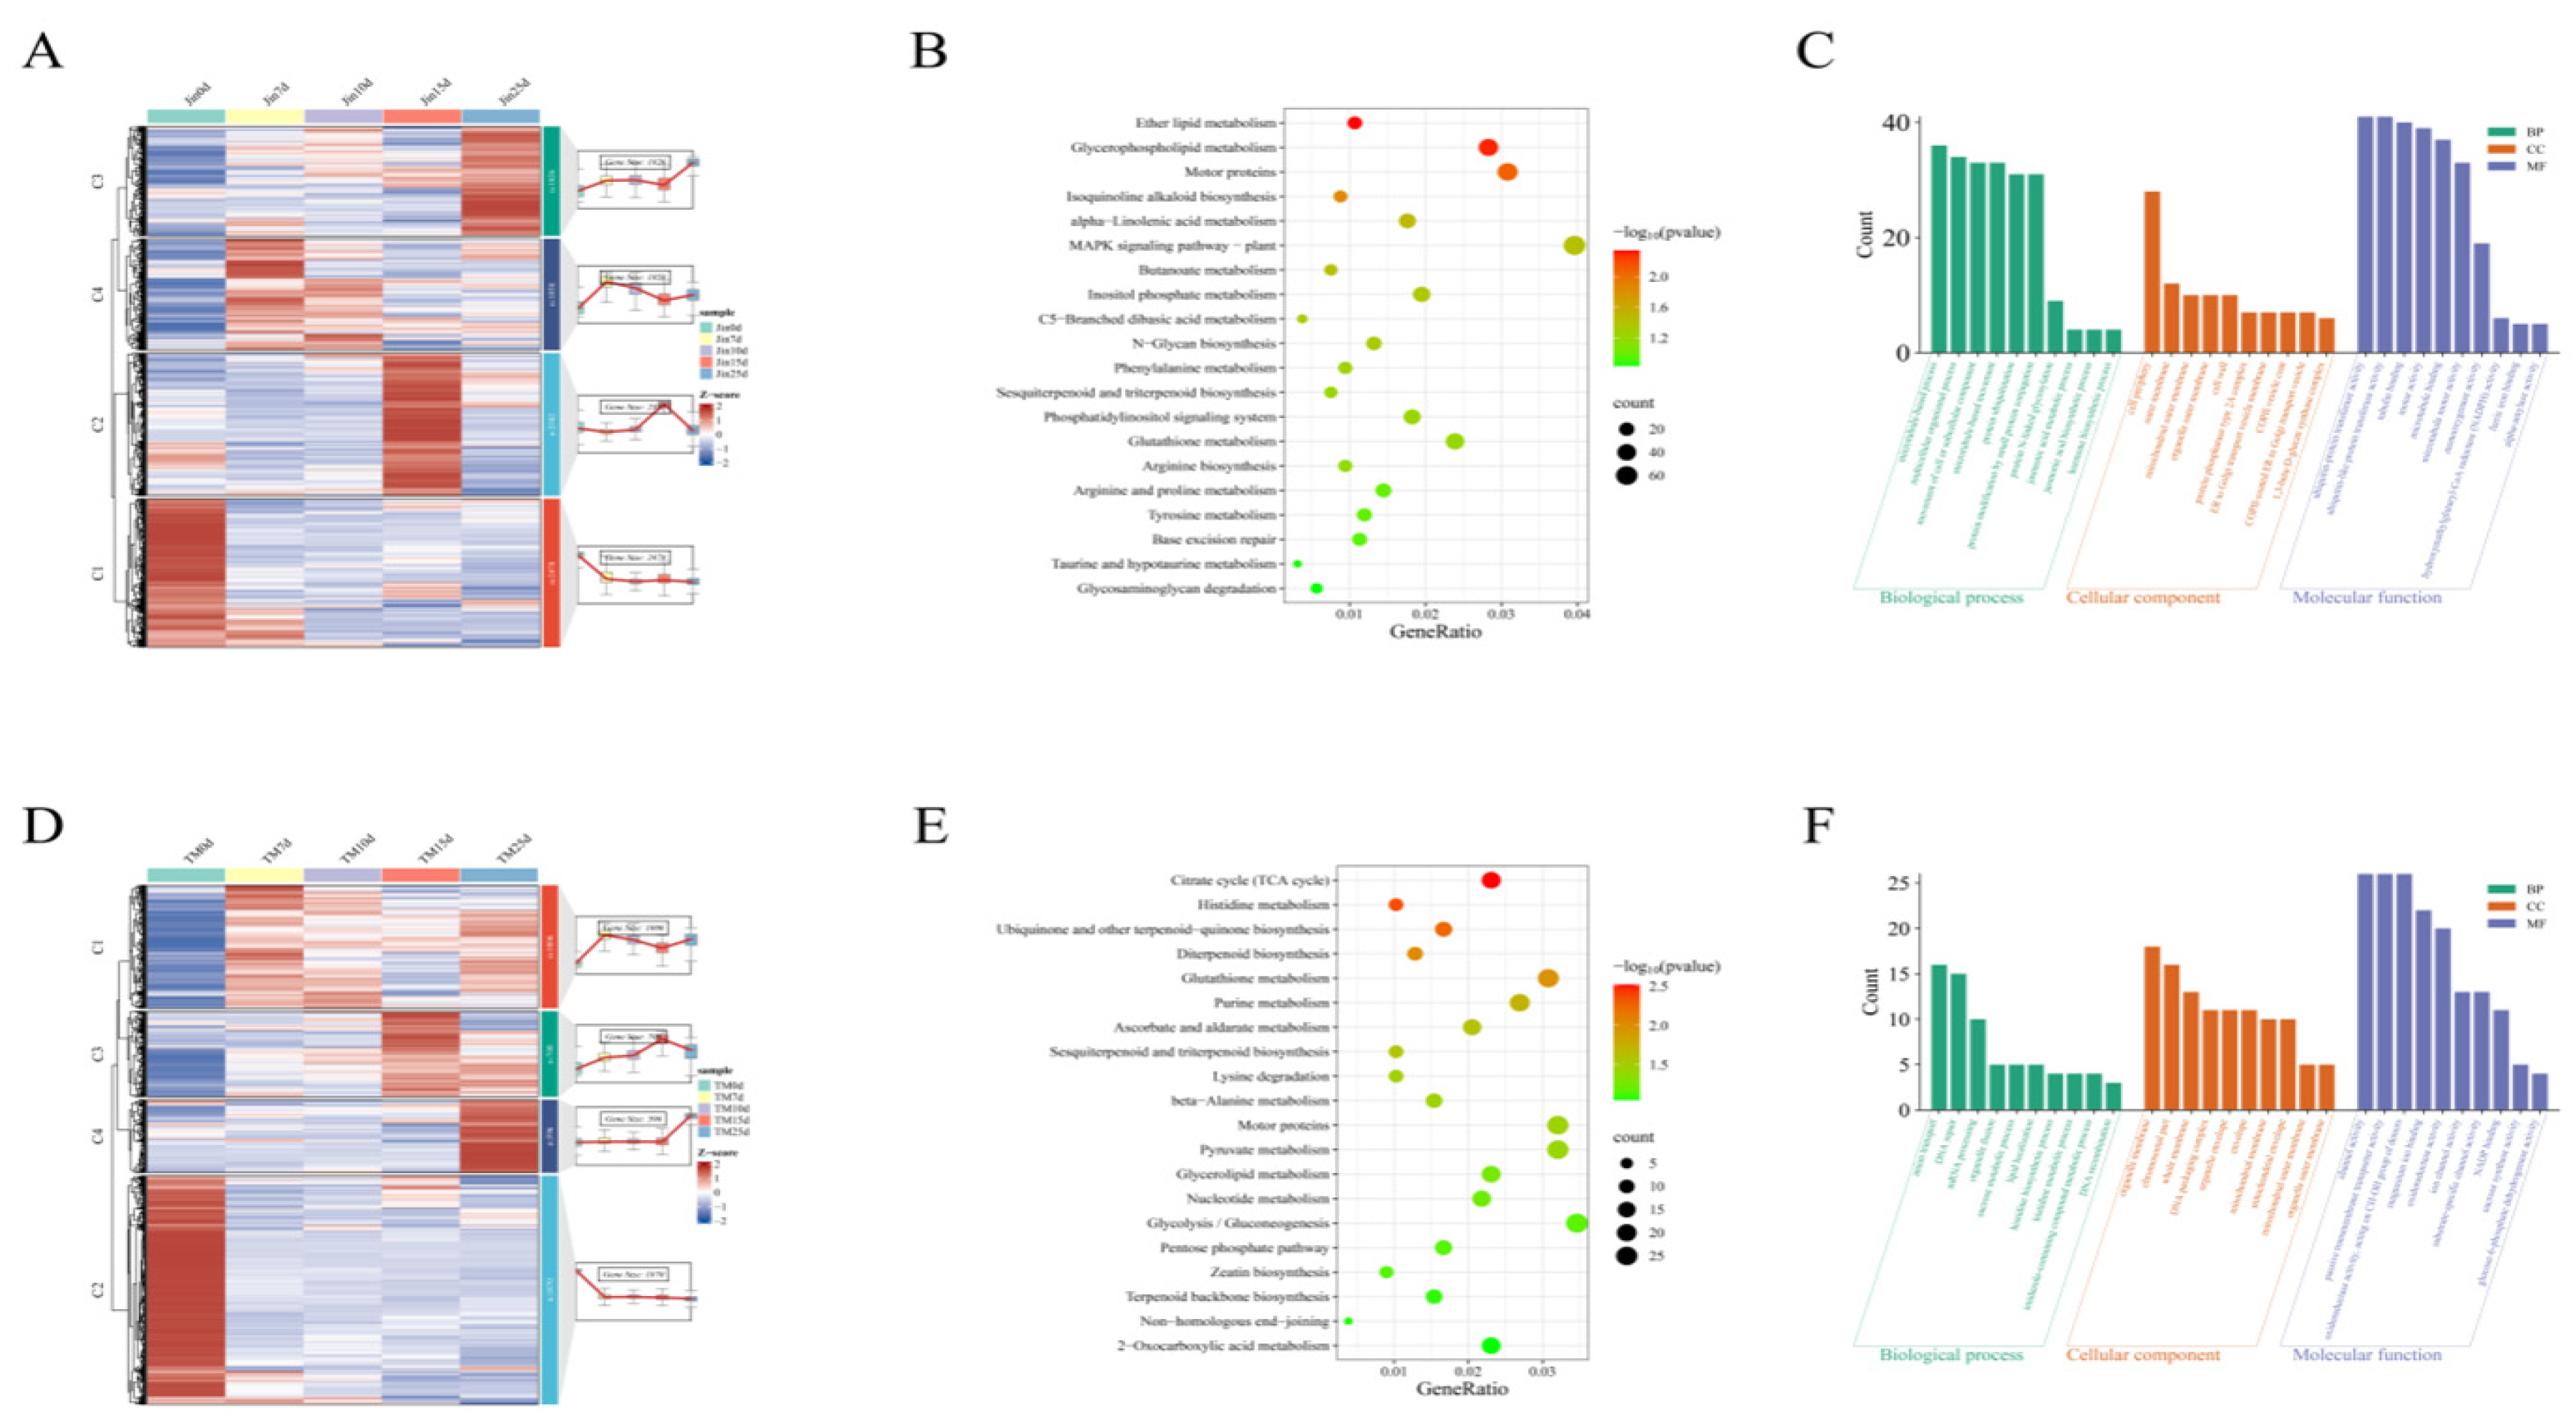
Figure 8.
(A) qRT-PCR detection of the expression patterns of candidate genes under different drought stress conditions (error bars represent SE ± mean of three replicates; *p < 0.05, **p < 0.01, ***p < 0.001). (B) FPKM values of candidate genes under different drought stress conditions.
Figure 8.
(A) qRT-PCR detection of the expression patterns of candidate genes under different drought stress conditions (error bars represent SE ± mean of three replicates; *p < 0.05, **p < 0.01, ***p < 0.001). (B) FPKM values of candidate genes under different drought stress conditions.
Disclaimer/Publisher’s Note: The statements, opinions and data contained in all publications are solely those of the individual author(s) and contributor(s) and not of MDPI and/or the editor(s). MDPI and/or the editor(s) disclaim responsibility for any injury to people or property resulting from any ideas, methods, instructions or products referred to in the content. |
© 2025 by the authors. Licensee MDPI, Basel, Switzerland. This article is an open access article distributed under the terms and conditions of the Creative Commons Attribution (CC BY) license (http://creativecommons.org/licenses/by/4.0/).
Copyright: This open access article is published under a Creative Commons CC BY 4.0 license, which permit the free download, distribution, and reuse, provided that the author and preprint are cited in any reuse.


