
Submitted:
27 October 2025
Posted:
28 October 2025
You are already at the latest version
Abstract
Climate change necessitates a deeper understanding of plant tolerance mechanisms to dual water stresses. This study investigated the distinct physiological and genetic responses of Longleaf Speedwell (Pseudolysimachion longifolium) to drought and waterlogging using RNA-Seq. Physiological data showed a rapid and comparable reduction in photosynthetic efficiency after one week and biomass under both stresses after two weeks. However, transcriptomic analysis revealed fundamentally distinct strategies: Drought induced a massive transcriptional upheaval (5 times more DEGs), characterized by the upregulation of defense pathways (e.g., Phenylpropanoid biosynthesis) and the severe shutdown of growth-related metabolism (e.g., Ribosome, Photosynthesis). In contrast, waterlogging triggered a constrained hypoxic response, prioritizing energy conservation by downregulating synthesis processes (Nitrogen, Arginine biosynthesis) and activating ethylene signaling. The reliability of the RNA-Seq data was confirmed by qRT-PCR, which also crucially identified Alcohol dehydrogenase (ADH), Ethylene Responsive Factor (ERF), and Peroxidase (POD) as common candidate genes highly induced under both drought and waterlogging conditions, suggesting a generalized role in broad-spectrum water stress tolerance. These findings provide critical molecular evidence demonstrating the divergent and specific adaptive strategies of P. longifolium to different water regimes and highlight ADH, ERF, and POD as promising targets for engineering broad-spectrum water stress tolerance.
Keywords:
water stress
; RNA-Seq
; drought tolerance
; waterlogging tolerance
; Pseudolysimachion longifolium
1. Introduction
Climate change-driven water stress poses a significant threat to global plant life, with drought being the most widespread water-related climate disaster and waterlogging ranking as the second [1]. Upon facing drought, plants exhibit a number of defense mechanisms, such as reduced stomatal conductance and a corresponding decrease in photosynthetic rate. This cascade of events can result in oxidative stress due to the build-up of reactive oxygen species (ROS), ultimately leading to inhibited growth and, in severe cases, plant mortality [2]. Also, the onset of waterlogging triggers stress in plants as the water-saturated soil leads to oxygen deprivation, which in turn severely compromises root respiration [3]. While plants employ different defense mechanisms for drought and waterlogging, a central component of their tolerance is the upregulation of antioxidant enzymes to reduce cellular damage caused by these stresses [1]. Moreover, plant hormones such as ethylene have been shown to positively influence plant resistance to both drought and waterlogging stresses [4,5]. Although studying the resistance mechanisms for drought and waterlogging stresses individually is important, focusing on their common underlying mechanisms can lead to effective breeding for the climate change era.
The perennial plant, Longleaf Speedwell (Psuedolysimachion longifolium), is natively distributed across a wide range, from Europe to the Korean Peninsula [6]. Because of its notable ornamental and medicinal potential, the plant has been the subjects of diverse scientific studies [7,8,9]. Recently, native plants have been attracting attention as a crucial resource for developing new horticultural varieties to cope with climate change, and the necessity for breeding research for climate change adaptation has also been raised in studies targeting native Korean Poaceae plants [10]. Additionally, research on other native Korean plants has investigated their tolerance to various abiotic stresses, such as salinity, which suggests the importance of studying their genetic, protein, and transcriptional responses for climate change adaptation [11]. However, researches on genetic response of P. longifolium to environmental stresses are missing yet.
RNA sequencing (RNA-Seq) provides a powerful advantage by quantitatively measuring gene expression, which helps to clarify the molecular-level responses of plants to environmental stress [12]. Unlike traditional PCR-based methods that target specific genes, RNA-Seq allows for a comprehensive analysis of the entire transcriptome, enabling the simultaneous discovery of diverse genes and gene networks that respond to stress [13]. For non-model plants like Pseudolysimachion longifolium that lack a reference genome, de novo transcriptome assembly can be utilized to construct genetic information and enable molecular studies on species that have been understudied [14]. RNA-Seq has been instrumental in studying abiotic stress responses in plants, such as investigating drought resistance in cassava leaves [15] and flood tolerance in wheat leaves [16]. Furthermore, Baldi et al. [17] identified molecular responses to drought and waterlogging stresses of kiwifruit (Actinidia chinensis var. deliciosa) using RNA-Seq. Consequently, RNA-Seq is a highly effective method for elucidating the genetic responses of Pseudolysimachion longifolium to drought and waterlogging stresses.
This study aimed to elucidate the genetic mechanisms of P. longifolium in response to drought and waterlogging stress. We hypothesized that the genes expressed under each stress condition are distinct. To test this, we first performed RNA-Seq analysis to identify differentially expressed genes (DEGs) specific to each stress. Second, we functionally characterized these genes through gene annotation and GO/KEGG analysis. Finally, we validated the reliability of our RNA-Seq data by performing qRT-PCR on key candidate genes, thereby identifying genes associated with drought and waterlogging tolerance in P. longifolium.
2. Materials and Methods
2.1. Plant Material and Treatments
The study was performed at the Forest Biological Resources Utilization Center of the Korea National Arboretum. P. longifolium was collected from Gurye-gun, Jeollanam-do, Korea (35°17’37.1”N 127°31’34.6”E). The collected plants were propagated by seed and cutting method at the Forest Biological Resources Utilization Center of the Korea National Arboretum. A specimen of P. longifolium was deposited at the Korea National Arboretum (Dr. Dong Chan Son, sdclym@korea.kr) with the voucher number KHB1663331. Seedlings were transplanted to square pots (12 cm × 12 cm × 15.5 cm) containing horticultural soil (Superbaroker, Seoul Bio Co., Korea).
At the flowering stage, P. longifolium were exposed to drought or waterlogging for 2 weeks. Control pots got watered normally once every 2 days for 2 weeks instead of stress treatment. Drought stress was applied by withholding water for the 2-weeks period; however, a minimal amount of water was supplied after the first week (Day 7) to prevent complete plant morality and ensure sufficient biological material for the 2-week physiological and transcriptomic sampling. Waterlogging stress was treated by placing the pots in a water-filled container to a depth of approximately 2 cm above the soil surface for 2 weeks. At least five plants of each experimental group were assigned.
Soil water content was monitored continuously throughout the 2-week treatment period. Volumetric water content (θv) was recorded hourly using a data logger (WatchDog 1650, Spectrum Technologies, Inc., Aurora, IL, USA) equipped with soil moisture sensors.
2.2. Plant Phenotypic Measurements and Chlorophyll Fluorescence
SPAD values were measured on fully expanded leaves after one week of treatment using a portable chlorophyll meter (SPAD-502, Konica Minolta, Japan). Plant fresh weight (FW) and dry weight (DW) were measured immediately after the 2-week treatment period. Dry weight was determined after drying the plant samples in an oven at 80ºC until a constant weight was achieved.
Chlorophyll a fluorescence was measured using a pulse-amplitude modulation (PAM) fluorometer (PAM-2500, Heinz Walz GmbH, Effeltrich, Germany). Measurements were conducted on fully expanded leaves sampled from the control, drought, and waterlogging groups after the 1-week treatment period to assess the early photosynthetic impact. Before measurement, leaves were dark-adapted for 20 minutes to ensure full oxidation of the primary electron acceptor (QA). The maximum quantum yield of photosystem II (Fv/Fm) was calculated as (Fm-Fo)/Fm, where Fo is the minimum fluorescence and Fm is the maximum fluorescence in the dark-adapted state. The effective quantum yield of photosystem II (ΦPSII) was measured under actinic light and calculated as (Fm’-Fs)/Fm’. The electron transport rate (ETR) was then estimated using the formula ETR = ΦPSII × PAR × 0.5 × absorption, assuming an average leaf absorption of 0.84 and partitioning light energy equally between PSII and PSI (0.5) [18,19].
2.3. RNA Isolation and Sequencing
The leaf was sampled, immediately frozen in liquid nitrogen, and stored at -80 °C until RNA extraction. Total RNA was extracted using the Maxwell RSC Plant RNA Kit (Promega, Madison, WI, USA) following the manufacturer’s instructions. Total RNA concentration was determined using Quant-IT RiboGreen (Invitrogen, Waltham, MA, USA). RNA integrity was assessed on the TapeStation RNA ScreenTape (Agilent), and only high-quality RNA with a RIN value greater than 7.0 was used for library construction. For each sample, an RNA library was independently prepared with 1 µg of total RNA using the Illumina TruSeq Stranded mRNA Sample Prep Kit (Illumina Inc., San Diego, CA, USA). The workflow involved purifying poly-A-containing mRNA using poly-T-attached magnetic beads, followed by mRNA fragmentation using divalent cations. First-strand cDNA was synthesized using SuperScript II reverse transcriptase (Invitrogen, Carlsbad, CA, USA) and random primers, and second-strand cDNA was synthesized using DNA Polymerase I, RNase H, and dUTP. The resulting cDNA fragments were then subjected to end repair, A-base addition, and adapter ligation. The final cDNA libraries were purified and enriched via PCR. Libraries were quantified using KAPA Library Quantification kits for Illumina sequencing platforms (KAPA BIOSYSTEMS) and qualified using the TapeStation D1000 ScreenTape (Agilent Technologies). Paired-end (2×100 bp) sequencing was performed on an Illumina NovaSeqX (Illumina Inc.) by Macrogen Incorporated.
Raw sequencing reads were preprocessed to remove low-quality and adapter sequences. The processed reads were assembled de novo into unigenes using the Trinity program [20]. Read alignment and abundance estimation were performed on the unigenes using Bowtie v1.1.2 [21] and RSEM v1.3.1 [22]. The expression level of each unigene was calculated using the Fragments Per Kilobase of exon per Million mapped fragments (FPKM) method. For functional annotation, the unigenes were blasted against public databases including NCBI Nucleotide (NT), NCBI non-redundant Protein (NR), Kyoto Encyclopedia of Genes and Genomes (KEGG), Pfam, Gene Ontology (GO), UniProt, and EggNOG. Based on the annotation results, contigs annotated as fungal, bacterial, or animal-related were excluded from further analysis to ensure the focus on P. longifolium transcripts.
Relative abundances were measured in read counts using RSEM. Statistical analysis was performed using DESeq2 to identify differentially expressed genes (DEGs). A false discovery rate (FDR) was controlled by an adjusted p-value using the Benjamini-Hochberg algorithm. Enrichment of GO and KEGG analysis was carried out and visualized using R 4.5.1.
2.4. qRT-PCR Validation
To validate the expression patterns of key genes identified through RNA-Seq, 3 genes with significant differential expression were selected for quantitative reverse transcription polymerase chain reaction (qRT-PCR). Gene-specific primers were designed based on the sequences obtained from the de novo analysis using NCBI Primer-BLAST program (https://www.ncbi.nlm.nih.gov/tools/primer-blast/) (Table 1). First-strand cDNA was synthesized from the same RNA samples of RNA-Seq analysis using the PrimeScript™ 1st strand cDNA Synthesis Kit (Takara Bio Inc, Japan), according to the manufacturer’s protocol. qRT-PCR was carried out on a CFX Duet real-time PCR System (Bio-Rad Laboratories, Hercules, CA, USA) in a 10 μL reaction mixture, containing 5 μL of BrightGreen 2× qPCR MasterMix-No Dye (Applied Biological Materials, Richmond, Canada), 500 nM of each primer, and 1 μL of template cDNA (diluted 1:10). Gene expression levels were established based on the quantitation cycle (Cq). The Cq values were established using Bio-Rad CFX Manager 3.1 (BioRad Laboratories), and the results were calculated using the 2-ΔΔCq method [23]. Pearson correlation coefficients were then calculated between the transcripts per million (TPM) values from RNA-Seq and the expression levels from qRT-PCR for each gene.
3. Results
3.1. Phenotypic and Physiological Responses to Drought and Waterlogging
To evaluate the impact of drought and waterlogging on P. longifolium, various phenotypic and physiological parameters were measured. Soil water content (θv) was measured before and after the 2-week treatment period (Table 2). Before treatment, there was no significant difference in θv among the control (20.93% ± 0.26), drought (20.93% ± 0.78), and waterlogging (21.07% ± 0.38) groups (Table 2). After the 2-week treatment, the θv clearly showed three distinct, statistically significant groups (p < 0.001). The waterlogging treatment maintained the highest θv (58.57% ± 1.07), significantly higher than the control (21.37% ± 0.26). Conversely, the drought treatment resulted in the lowest θv (1.44% ± 0.78), confirming the successful imposition of severe moisture stress in the experimental setup.
The stress treatments significantly impacted both photosynthetic efficiency and plant growth (Table 3). Photosynthetic indicators measured after 1 week of treatment showed rapid decline. The maximum quantum yield of Photosystem II (Fv/Fm) was highest in the control (0.787 ± 0.006 a), indicating optimal photosynthetic efficiency, but dropped significantly under waterlogging (0.654 ± 0.038 b) and under drought stress (0.651 ± 0.025 b). Similarly, SPAD value was highest in the control group (42.13 ± 0.99 a), followed by the waterlogging group (24.10 ± 1.43 b), and the drought group showed the lowest value (21.32 ± 1.87 b).
Crucially, all measured growth parameters, including both fresh weight (FW) and dry weight (DW) recorded after two weeks, showed the same statistical grouping. The control group was significantly higher than the two stress groups, which were not statistically different from each other. Specifically, the control (FW: 69.87g ± 5.66 a; DW: 16.00g ± 1.38 a) showed significantly higher than waterlogging (FW: 39.93g ± 5.27 b; DW: 10.37g ± 1.21 b) and drought (FW: 35.04g ± 4.42 b; DW: 8.05g ± 1.12 b).
This consistent statistical grouping across all physiological and growth metrics indicates that both severe drought and waterlogging imposed an equivalent overall stress level on P. longifolium, leading to an equivalent physiological cost. These results demonstrate a severe, immediate, and functionally indistinguishable impairment of the plant’s photosynthetic apparatus and growth capabilities under these severe water stress conditions.
3.2. Sequencing Data Quality and Differential Expression Statistics
Illumina RNA-Seq generated 75.0 million raw reads and 74.2 million clean reads on average for each leaf sample. The Q30 percentages of clean reads, a critical quality metric, consistently ranged from 96.41 to 96.77%, while the GC contents were stable at around 44.0% and 43.9%. These metrics confirm the high quality and reliability of the sequencing data.
Following assembly using Trinity, a comprehensive set of 312,649 unigenes (193,744,640 nucleotides) was generated (Supplementary Table S1). To ensure the biological relevance and purity of the final dataset, these unigenes were subjected to two sequential quality filtering steps. First, non-plant transcripts (sequences potentially originating from microbes or animals) were strictly removed based on annotation and homology searches. Second, to define the set of functionally active genes used as the background for subsequent differential expression analysis, poorly expressed genes were filtered out, resulting in genes with a Fragments Per Kilobase of transcript sequence per Million base pairs sequenced (FPKM) value greater than 1. This two-step filtering process ultimately yielded a final set of 17,322 expressed genes, which were used as the background for all subsequent differential expression analysis. A Venn diagram summarizing the expression status of these 17,322 genes among the treatments is presented in Figure 1. It was revealed that more than 80% of annotated genes were commonly expressed across the control, drought, and waterlogging treatments. Furthermore, the number of shared expressed genes between the drought and control groups was comparatively low, while the number of shared expressed genes between the control and waterlogging groups was approximately 10-fold higher. This initial comparison indicated a more similar gene expression profile between the control and waterlogging treatments than between the control and drought treatments.
A total of 953 genes were differentially expressed between waterlogging and the control (Figure 2), whereas a stronger effect was detected following drought, with 4,735 DEGs compared to the control. The number of downregulated DEGs was lower than those upregulated in both between drought and the control and between waterlogging and the control (Figure 2). It suggests that drought triggered a significantly more extensive molecular response than waterlogging.
3.3. Functional Annotation and Pathway Analysis
To systematically investigate the functional roles of the DEGs identified under drought and waterlogging stress, Gene Ontology (GO) enrichment analysis was performed using the classical Fisher’s exact test across three main categories: Biological Process (BP), Molecular Function (MF), and Cellular Component (CC).
The analysis identified a substantial number of GO terms significantly enriched (p-value < 0.05) in response to both stress conditions. Under drought stress, a total of 428 unique GO terms were significantly enriched. In contrast, waterlogging stress resulted in the enrichment of 330 unique GO terms. This suggests that while both stresses induce significant transcriptional changes, drought may trigger a broader range of functional adjustments in P. longifolium.
The bubble charts (Figure 3) visualize the top 30 most significantly enriched GO terms across all categories for each stress. For drought stress, the most enriched terms in the Biological Process category primarily involved response to chemical and regulation of primary metabolic process (Figure 3A). Highly significant Molecular Function terms frequently included those related to ATP binding and catalytic activity, indicating enhanced energy metabolism and enzymatic regulation. The enrichment profile for waterlogging stress was distinct (Figure 3B). Key Biological Process terms were associated with the regulation of defense response and response to stress, suggesting a highly focused immune and survival mechanism. Molecular Function terms were dominated by categories such as oxidoreductase activity and binding functions, likely reflecting cellular efforts to manage oxidative stress and cellular damage caused by hypoxia. The distinct profiles highlight the differential molecular strategies employed by P. longifolium to cope with these two contrasting abiotic stresses.
To further understand the biological systems and metabolic pathways affected by each stress, a KEGG (Kyoto Encyclopedia of Genes and Genomes) pathway enrichment analysis was conducted on the differentially expressed genes (DEGs). The analysis focused on pathways significantly enriched with DEGs (p-value < 0.05). For subsequent discussion and visualization (Figure 4 and Figure 5), the top 20 most significantly enriched pathways were selected and separately analyzed for upregulated and downregulated genes.
The upregulated DEGs suggest an active defense and adaptation strategy, primarily involving stress-specific signaling and the biosynthesis of protective compounds (Figure 4). Analysis of upregulated genes under drought stress revealed that the most significantly enriched pathways included Phenylpropanoid biosynthesis (ko00940), Ubiquitin mediated proteolysis (ko04120), and Plant hormone signal transduction (ko04075) (Figure 4A). The strong enrichment of these pathways suggests a primary defense strategy in P. longifolium involving the enhanced production of defensive compounds (e.g., lignin, flavonoids) via phenylpropanoid synthesis, coupled with rapid protein degradation and recycling through the ubiquitin system, and modulation of hormonal signaling (e.g., ABA) to cope with dehydration. For waterlogging stress, the upregulated genes showed distinct enrichment in pathways related to stress signaling and secondary metabolism, most notably Plant hormone signal transduction (ko04075), Efferocytosis (ko04147), and Terpenoid backbone biosynthesis (ko00900) (Figure 4B). The prominence of hormone signaling and terpenoid biosynthesis indicates that P. longifolium employs rapid cellular communication and initiates the production of specialized protective molecules as a primary, immediate response to the hypoxic stress.
The downregulated DEGs suggest a common strategy of reducing energy-intensive processes, alongside stress-specific suppression mechanisms (Figure 5). Downregulated pathways in response to drought primarily targeted core metabolic and growth processes, with the most significant enrichment found in Ribosome (ko03010), Carbon metabolism (ko01200), and pathways related to energy capture and production such as Photosynthesis (ko00195) and Peroxisome (ko04146) (Figure 5A). This widespread suppression of protein synthesis, primary carbon utilization, and photosynthesis machinery is characteristic of a severe growth arrest strategy aimed at minimizing water and energy expenditure under limited water availability. The waterlogging stress led to a marked downregulation of pathways associated with energy-intensive primary metabolism, particularly in nitrogen and amino acid assimilation. Key enriched pathways include Arginine biosynthesis (ko00220), Nitrogen metabolism (ko00910), and Alanine, aspartate and glutamate metabolism (ko00250) (Figure 5B). This suggests a critical shutdown of resource-demanding synthesis processes, allowing the plant to conserve energy and shift metabolic resources toward immediate survival mechanisms under anaerobic (low-oxygen) conditions.
These combined pathway analyses (upregulated in Figure 4 and downregulated in Figure 5) provide comprehensive evidence for the highly differential and specialized transcriptional reprogramming employed by P. longifolium to survive these contrasting abiotic stresses.
3.4. qPCR Validation
To validate the reliability of the RNA-Seq data, the expression levels of three candidate genes (ADH, ERF, and POD) were compared with the relative expression levels from qRT-PCR (Figure 6). Each gene showed a strong positive correlation between its RNA-Seq TPM values and qRT-PCR expression levels, with Pearson correlation coefficients (r) of 0.97 for ADH, 0.93 for ERF, and 0.87 for POD. Overall, the integrated analysis of all three genes showed a very high correlation, confirming the high reliability of the RNA-Seq data. All three genes showed a similar trend, with their expression being higher under stress conditions than in the control group. Specifically, their expression was highest under drought stress, followed by waterlogging stress and then the control group.
4. Discussion
The results determine the genetic response of P. longifolium leaf under two extreme and contrasting water regimes, drought and waterlogging. The present study successfully imposed clear and contrasting water stresses on P. longifolium, as confirmed by the significant differences in soil water content (θv) after the two-week treatment period. The severe reduction in θv in the drought group (~ 1.44%) and the maintenance of saturated conditions in the waterlogging group (~ 58.57%) confirmed the suitability of the experimental setup for investigating these two major abiotic stresses. Plant responses and adaptation mechanisms to both drought and waterlogging stresses are critical areas of research in water stress physiology, and are essential for breeding water-tolerant varieties [1].
Phenotypic analysis revealed that both drought and waterlogging significantly compromised plant vigor. Both fresh weight (FW) and dry weight (DW) were highest in the control and significantly reduced in both stress groups, indicating a rapid, non-specific arrest of growth. Photosynthetic efficiency, a key indicator of plant health, was also severely impaired. After one week of stress, both chlorophyll content (SPAD) and the maximum quantum yield of Photosystem II (Fv/Fm) showed a sharp decline. Importantly, the consistent statistical grouping (b) across all physiological and growth metrics (FW, DW, SPAD, and Fv/Fm) in both stress treatments indicated an equivalent overall physiological impairment under both dehydration and hypoxia. This rapid and comparable physiological deterioration underscores the sensitivity of P. longifolium to abrupt changes in soil moisture. Indeed, a study on cherry trees (Prunus yedoensis) found that while both stresses caused rapid physiological decline (similar to our findings), overall growth indices such as total dry weight were most severely reduced by waterlogging stress, highlighting a potentially greater long-term vulnerability to hypoxia in that species compared to drought [24].
While both stresses led to comparable physiological damage, the global transcriptome analysis revealed a profoundly differential molecular response. Drought stress induced the differential expression of 4,735 genes (DEGs) compared to the control, a number approximately five times higher than the 953 DEGs observed under waterlogging stress. This significant disparity suggests that drought triggers a far more extensive and pervasive molecular reprogramming cascade than waterlogging in P. longifolium. The initial comparison showed a comparatively low number of shared expressed genes between the control and drought groups, while the control and waterlogging groups shared a significantly higher number of genes. This indicates that the gene expression profile under waterlogging remains relatively closer to the basal state compared to the massive shift observed under drought. This difference may reflect P. longifolium’s inherent tolerance or specific molecular mechanisms for coping with moderate waterlogging, requiring fewer widespread transcriptional changes than the highly damaging dehydration caused by drought. This finding is consistent with transcriptomic studies in other plant species, such as kiwifruit, where the molecular response to waterlogging was also reported to be less intense and involve fewer differentially expressed genes compared to drought stress [17].
Functional enrichment analysis, including both GO and KEGG pathway analysis, provides complementary insights into the biological implications of DEGs [25]. While GO terms provided a general overview of affected cellular components, molecular functions, and biological processes (e.g., ‘oxidation-reduction process,’ ‘response to abscisic acid stimulus’), the subsequent discussion focuses on the KEGG pathway enrichment results. This is because KEGG offers a more detailed, mechanistic view by mapping DEGs onto specific, well-defined metabolic and signal transduction pathways, allowing for a clearer, biochemically grounded interpretation of the plant’s adaptation strategies. KEGG is generally preferred for exploring metabolic and signaling interactions as it organizes genes into broader, systemic pathway diagrams, unlike the more fragmented, ontology-based classification provided by GO [26]. The KEGG pathway enrichment analysis confirmed that P. longifolium employs highly specialized and contrasting molecular strategies to survive drought and waterlogging.
The molecular response to drought was characterized by an active defense mechanism coupled with a pervasive suppression of core metabolic processes. Upregulated pathways were dominated by Phenylpropanoid biosynthesis (ko00940), Ubiquitin mediated proteolysis (ko04120), and Plant hormone signal transduction (ko04075) (Figure 4A). The enhancement of Phenylpropanoid biosynthesis is crucial, as its products (lignin, flavonoids) are central to cell wall reinforcement and the scavenging of reactive oxygen species (ROS) to reduce oxidative damage caused by dehydration [27]. This role is well-established, as the phenylpropanoid pathway is typically activated under abiotic stress to detoxify ROS and protect cellular components [28]. The enrichment of the Ubiquitin system highlights the plant’s need for rapid protein quality control, recycling, and the degradation of regulatory proteins essential for stress adaptation [29]. The hormone signal transduction pathway is typically associated with ABA signaling, which is the master regulator for drought, controlling stomatal closure and inducing stress-responsive gene expression [30].
Conversely, the most significantly downregulated pathways included high-energy, growth-related processes such as Ribosome (ko03010), Carbon metabolism (ko01200), and Photosynthesis (ko00195) (Figure 5A). This widespread transcriptional suppression of protein synthesis and primary energy capture systems is the molecular hallmark of a severe growth-arrest strategy, aimed at minimizing water and energy expenditure under conditions of extreme scarcity [31]. This aggressive resource conservation aligns with the observed severe reduction in FW and DW.
The waterlogging response, while inducing fewer DEGs, was specific and focused on adapting to low-oxygen conditions. Upregulated pathways included Plant hormone signal transduction (ko04075) and Terpenoid backbone biosynthesis (ko00900) (Figure 4B). In waterlogging, the hormone signaling pathway often involves ethylene and auxin, which mediate morphological adaptations such as aerenchyma formation and adventitious root development, critical for oxygen supply under hypoxia. Ethylene accumulation is recognized as a rapid and reliable signal for initiating these flood-adaptive traits [32]. The downregulation of pathways like Nitrogen metabolism (ko00910) and Arginine biosynthesis (ko00220) suggests a critical shutdown of resource-demanding synthesis processes, allowing the plant to conserve energy and shift metabolic resources toward immediate survival mechanisms under anaerobic conditions [33].
The qRT-PCR validation confirmed the high reliability of the RNA-Seq data (Pearson correlation coefficients of 0.97 for ADH, 0.93 for ERF, and 0.87 for POD). Furthermore, the expression patterns of these three genes are highly notable. All three genes were significantly upregulated under both drought and waterlogging conditions, with the highest expression observed under drought stress. This suggests they play a crucial role in the common or interconnected stress-response network in P. longifolium.
The strong upregulation of ADH (Alcohol dehydrogenase) is a classic indicator of anaerobic fermentation under waterlogging stress, essential for maintaining NAD+ regeneration and detoxifying acetaldehyde [5]. However, ADH can also contribute to drought resistance [34]. Its highest expression under drought suggests an unexplored function in dehydration stress, possibly related to ethanol-mediated signaling or protection.
ERF (Ethylene Responsive Factor) transcription factors are directly involved in the regulation of waterlogging stress through ethylene signaling [5]. ERF also plays a crucial role in plant drought resistance by regulating the expression of various stress-responsive genes [35]. Its dual upregulation confirms its pivotal role as a signaling node managing adaptation to both stresses.
POD (Peroxidase) activity is central to mitigating oxidative damage, a common consequence of both drought (due to ROS accumulation from suppressed photosynthesis) and waterlogging (due to reoxygenation injury). In maize (Zea mays), POD appeared to enhance both drought tolerance and waterlogging tolerance [36]. The high induction of POD in P. longifolium suggests a vital and generalized role in cellular protection against the distinct ROS production mechanisms induced by each stress.
In summary, P. longifolium utilizes fundamentally distinct molecular strategies to cope with water stress. Drought induced a massive transcriptional upheaval (~ 5× DEGs), focusing on robust defense (Phenylpropanoid biosynthesis) while severely shutting down growth (Ribosome, Photosynthesis). Conversely, waterlogging triggered a more constrained hypoxic response that prioritized energy conservation by downregulating resource-intensive synthesis and activating key ethylene signaling. Critically, the identification of Alcohol dehydrogenase (ADH), Ethylene Responsive Factor (ERF), and Peroxidase (POD) as commonly induced genes highlights their potential as targets for broad-spectrum water stress tolerance. These findings provide essential genetic mechanisms for P. longifolium’s adaptation.
5. Conclusions
This study successfully elucidated the differential and specific molecular strategies employed by Pseudolysimachion longifolium to cope with two distinct water stress regimes: drought and waterlogging. Physiological measurements revealed a rapid and comparable reduction in photosynthetic efficiency (Fv/Fm and SPAD) under both stresses after one week. However, the subsequent comprehensive RNA-Seq analysis demonstrated that the molecular responses were profoundly divergent. Drought stress instigated a massive transcriptional reorganization, resulting in five times more differentially expressed genes (DEGs) than waterlogging. This response was characterized by the upregulation of defense mechanisms, notably Phenylpropanoid biosynthesis, and a severe, growth-arresting suppression of core metabolic pathways like Ribosome and Photosynthesis. Conversely, waterlogging induced a more contained and focused hypoxic response, involving the downregulation of energy-intensive processes such as Nitrogen and Arginine biosynthesis to conserve energy, alongside the activation of key hormone signal transduction pathways (ethylene/auxin). The high correlation between RNA-Seq and qRT-PCR confirmed the reliability of the data and, critically, identified Alcohol dehydrogenase (ADH), Ethylene Responsive Factor (ERF), and Peroxidase (POD) as common candidate genes highly induced under both stress conditions, suggesting a generalized role in broad-spectrum water stress tolerance. These findings provide the first genetic basis for understanding P. longifolium’s adaptation to extreme water fluctuations and offer valuable molecular targets for developing climate-resilient horticultural varieties. Future studies should focus on the precise regulatory roles and common upstream signaling pathways governing the co-induction of ADH, ERF, and POD in P. longifolium under simultaneous or sequential water stresses.
Funding
This work was supported by the Korea National Arboretum of the Korea Forest Service (Development of Breeding Models for Native Garden Plants in the New Climate Regime, KNA 1-5-1-24-1).
Data Availability Statement
All data were uploaded to the National Center for Biotechnology Information (NCBI) with the following BioProject ID: PRJNA1347928.
Conflicts of Interest
The authors declare no conflicts of interest.
References
- Wu, J.; Wang, J.; Hui, W.; Zhao, F.; Wang, P.; Su, C.; Gong, W. Physiology of plant responses to water stress and related genes: A review. Forests 2022, 13, 324. [Google Scholar] [CrossRef]
- Haghpanah, M.; Hashemipetroudi, S.; Arzani, A.; Araniti, F. Drought tolerance in plants: physiological and molecular responses. Plants 2024, 13, 2962. [Google Scholar] [CrossRef]
- Zhang, Y.; Chen, X.; Geng, S.; Zhang, X. A review of soil waterlogging impacts, mechanisms, and adaptive strategies. Frontiers in Plant Science 2025, 16, 1545912. [Google Scholar] [CrossRef] [PubMed]
- Nazir, F.; Peter, P.; Gupta, R.; Kumari, S.; Nawaz, K.; Khan, M.I.R. Plant hormone ethylene: A leading edge in conferring drought stress tolerance. Physiologia Plantarum 2024, 176, e14151. [Google Scholar] [CrossRef]
- Pan, J.; Sharif, R.; Xu, X.; Chen, X. Mechanisms of waterlogging tolerance in plants: Research progress and prospects. Frontiers in Plant Science 2021, 11, 627331. [Google Scholar] [CrossRef] [PubMed]
- Trávníček, B. Notes on the taxonomy of Pseudolysimachion longifolium complex (Scrophulariaceae). THAISZIA-KOSICE- 2000, 10, 1–26. [Google Scholar]
- Kim, J.M.; Lee, H.M.; Park, B.S.; Lee, H.N.; Nam, J.I.; Ahn, C.H. Adventitious Shoot Regeneration from Petiole and Stem Explants of Pseudolysimachion longifolium (L.) Opiz. Journal of Forest and Environmental Science 2024, 40, 413–416. [Google Scholar]
- Kwon, H.; Kim, S.; Bae, J.; Cho, W. Effects of Plug Tray Size, Light Intensity, and Fertilization Condition on Seedling Growth of Pseudolysimachion longifolium (L.) Opiz. Korean Journal of Medicinal Crop Science 2023, 31, 254–258. [Google Scholar] [CrossRef]
- Oh, S.-R.; Lee, M.Y.; Ahn, K.; Park, B.-Y.; Kwon, O.-K.; Joung, H.; Lee, J.; Kim, D.-Y.; Lee, S.; Kim, J.H.; et al. Suppressive effect of verproside isolated from Pseudolysimachion longifolium on airway inflammation in a mouse model of allergic asthma. International Immunopharmacology 2006, 6, 978–986. [Google Scholar] [CrossRef]
- Kim, S.H.; Cho, W. An Exploration of Candidate Korean Native Poaceae Plants for Breeding New Varieties as Garden Materials in the New Climate Regime Based on Existing Data. Horticulturae 2024, 10, 1158. [Google Scholar] [CrossRef]
- Kim, J.W.; Yi, J.H.; Jeong, S.E.; Choi, E.J.; Ko, C.H.; Jung, J.Y.; Kim, S.H.; Cho, W. Seed Germination and Responses of Five Native Veronica Species Under Salinity Stress in Korea. International Journal of Plant Biology 2025, 16, 60. [Google Scholar] [CrossRef]
- Zhou, Z.; Liu, J.; Meng, W.; Sun, Z.; Tan, Y.; Liu, Y.; Tan, M.; Wang, B.; Yang, J. Integrated analysis of transcriptome and metabolome reveals molecular mechanisms of rice with different salinity tolerances. Plants 2023, 12, 3359. [Google Scholar] [CrossRef] [PubMed]
- Wolf, J.B. Principles of transcriptome analysis and gene expression quantification: an RNA-seq tutorial. Molecular ecology resources 2013, 13, 559–572. [Google Scholar] [CrossRef]
- Martin, J.A.; Wang, Z. Next-generation transcriptome assembly. Nature Reviews Genetics 2011, 12, 671–682. [Google Scholar] [CrossRef]
- Zhu, Y.; Luo, X.; Wei, M.; Khan, A.; Munsif, F.; Huang, T.; Pan, X.; Shan, Z. Antioxidant enzymatic activity and its related genes expression in cassava leaves at different growth stages play key roles in sustaining yield and drought tolerance under moisture stress. Journal of Plant Growth Regulation 2020, 39, 594–607. [Google Scholar] [CrossRef]
- Li, B.; Hua, W.; Zhang, S.; Xu, L.; Yang, C.; Zhu, Z.; Guo, Y.; Zhou, M.; Jiao, C.; Xu, Y. Physiological, epigenetic, and transcriptome analyses provide insights into the responses of wheat seedling leaves to different water depths under flooding conditions. International Journal of Molecular Sciences 2023, 24, 16785. [Google Scholar] [CrossRef] [PubMed]
- Baldi, E.; Pastore, C.; Chiarelli, G.; Quartieri, M.; Spinelli, F.; Toselli, M. Molecular Responses to Drought and Waterlogging Stresses of Kiwifruit (Actinidia chinensis var. deliciosa) Potted Vines. Horticulturae 2024, 10, 834. [Google Scholar] [CrossRef]
- Genty, B.; Briantais, J.-M.; Baker, N.R. The relationship between the quantum yield of photosynthetic electron transport and quenching of chlorophyll fluorescence. Biochimica et Biophysica Acta (BBA)-General Subjects 1989, 990, 87–92. [Google Scholar] [CrossRef]
- Baker, N.R. Chlorophyll fluorescence: a probe of photosynthesis in vivo. Annu. Rev. Plant Biol. 2008, 59, 89–113. [Google Scholar] [CrossRef]
- Grabherr, M.G.; Haas, B.J.; Yassour, M.; Levin, J.Z.; Thompson, D.A.; Amit, I.; Adiconis, X.; Fan, L.; Raychowdhury, R.; Zeng, Q. Trinity: reconstructing a full-length transcriptome without a genome from RNA-Seq data. Nature Biotechnology 2011, 29, 644. [Google Scholar] [CrossRef]
- Langmead, B. Ultrafast andmemory-efficient alignment of short DNA sequences to the human genome. Genome Biol 10, R25 Genome Biology 2009, 10, R5. [Google Scholar]
- Li, B.; Dewey, C.N. RSEM: accurate transcript quantification from RNA-Seq data with or without a reference genome. BMC bioinformatics 2011, 12, 323. [Google Scholar] [CrossRef]
- Livak, K.J.; Schmittgen, T.D. Analysis of relative gene expression data using real-time quantitative PCR and the 2− ΔΔCT method. Methods 2001, 25, 402–408. [Google Scholar] [CrossRef] [PubMed]
- Lee, K.-C.; Kweon, H.; Sung, J.-W.; Kim, Y.S.; Song, Y.G.; Cha, S.; Koo, N. Physiological response analysis for the diagnosis of drought and waterlogging damage in Prunus yedoensis. Forest Science and Technology 2022, 18, 14–25. [Google Scholar] [CrossRef]
- Chen, L.; Zhang, Y.-H.; Wang, S.; Zhang, Y.; Huang, T.; Cai, Y.-D. Prediction and analysis of essential genes using the enrichments of gene ontology and KEGG pathways. PloS one 2017, 12, e0184129. [Google Scholar] [CrossRef]
- Yu, G.; Wang, L.-G.; Han, Y.; He, Q.-Y. clusterProfiler: an R package for comparing biological themes among gene clusters. Omics: a journal of integrative biology 2012, 16, 284–287. [Google Scholar] [CrossRef] [PubMed]
- Aluko, O.O.; Ninkuu, V.; Jianpei, Y.; Chen, S.; Zeng, H.; Dakurah, F.D. Phenylpropanoids metabolism: Recent insight into stress tolerance and plant development cues. Frontiers in Plant Science 2025, 16, 1571825. [Google Scholar] [CrossRef]
- Sharma, A.; Shahzad, B.; Rehman, A.; Bhardwaj, R.; Landi, M.; Zheng, B. Response of phenylpropanoid pathway and the role of polyphenols in plants under abiotic stress. Molecules 2019, 24, 2452. [Google Scholar] [CrossRef]
- Sharma, B.; Joshi, D.; Yadav, P.K.; Gupta, A.K.; Bhatt, T.K. Role of ubiquitin-mediated degradation system in plant biology. Frontiers in plant science 2016, 7, 806. [Google Scholar] [CrossRef]
- Salvi, P.; Manna, M.; Kaur, H.; Thakur, T.; Gandass, N.; Bhatt, D.; Muthamilarasan, M. Phytohormone signaling and crosstalk in regulating drought stress response in plants. Plant Cell Reports 2021, 40, 1305–1329. [Google Scholar] [CrossRef]
- Bergkessel, M. Regulation of protein biosynthetic activity during growth arrest. Current Opinion in Microbiology 2020, 57, 62–69. [Google Scholar] [CrossRef] [PubMed]
- Voesenek, L.; Sasidharan, R. Ethylene–and oxygen signalling–drive plant survival during flooding. Plant Biology 2013, 15, 426–435. [Google Scholar] [CrossRef]
- Vartapetian, B.B.; Jackson, M.B. Plant adaptations to anaerobic stress. Annals of Botany 1997, 79, 3–20. [Google Scholar] [CrossRef]
- Bashir, K.; Todaka, D.; Rasheed, S.; Matsui, A.; Ahmad, Z.; Sako, K.; Utsumi, Y.; Vu, A.T.; Tanaka, M.; Takahashi, S. Ethanol-mediated novel survival strategy against drought stress in plants. Plant and Cell Physiology 2022, 63, 1181–1192. [Google Scholar] [CrossRef] [PubMed]
- Wu, Y.; Li, X.; Zhang, J.; Zhao, H.; Tan, S.; Xu, W.; Pan, J.; Yang, F.; Pi, E. ERF subfamily transcription factors and their function in plant responses to abiotic stresses. Frontiers in Plant Science 2022, 13, 1042084. [Google Scholar] [CrossRef] [PubMed]
- Salah, A.; Li, J.; Ge, J.; Cao, C.; Li, H.; Wang, Y.; Liu, Z.; Zhan, M.; Zhao, M. Morphological and physiological responses of maize seedlings under drought and waterlogging. Journal of Agricultural Science and Technology 2019, 21, 1199–1214. [Google Scholar]
Figure 1.
Venn diagram showing the overlap of expressed genes for each treatment in P. longifolium (FPKM > 1).
Figure 1.
Venn diagram showing the overlap of expressed genes for each treatment in P. longifolium (FPKM > 1).
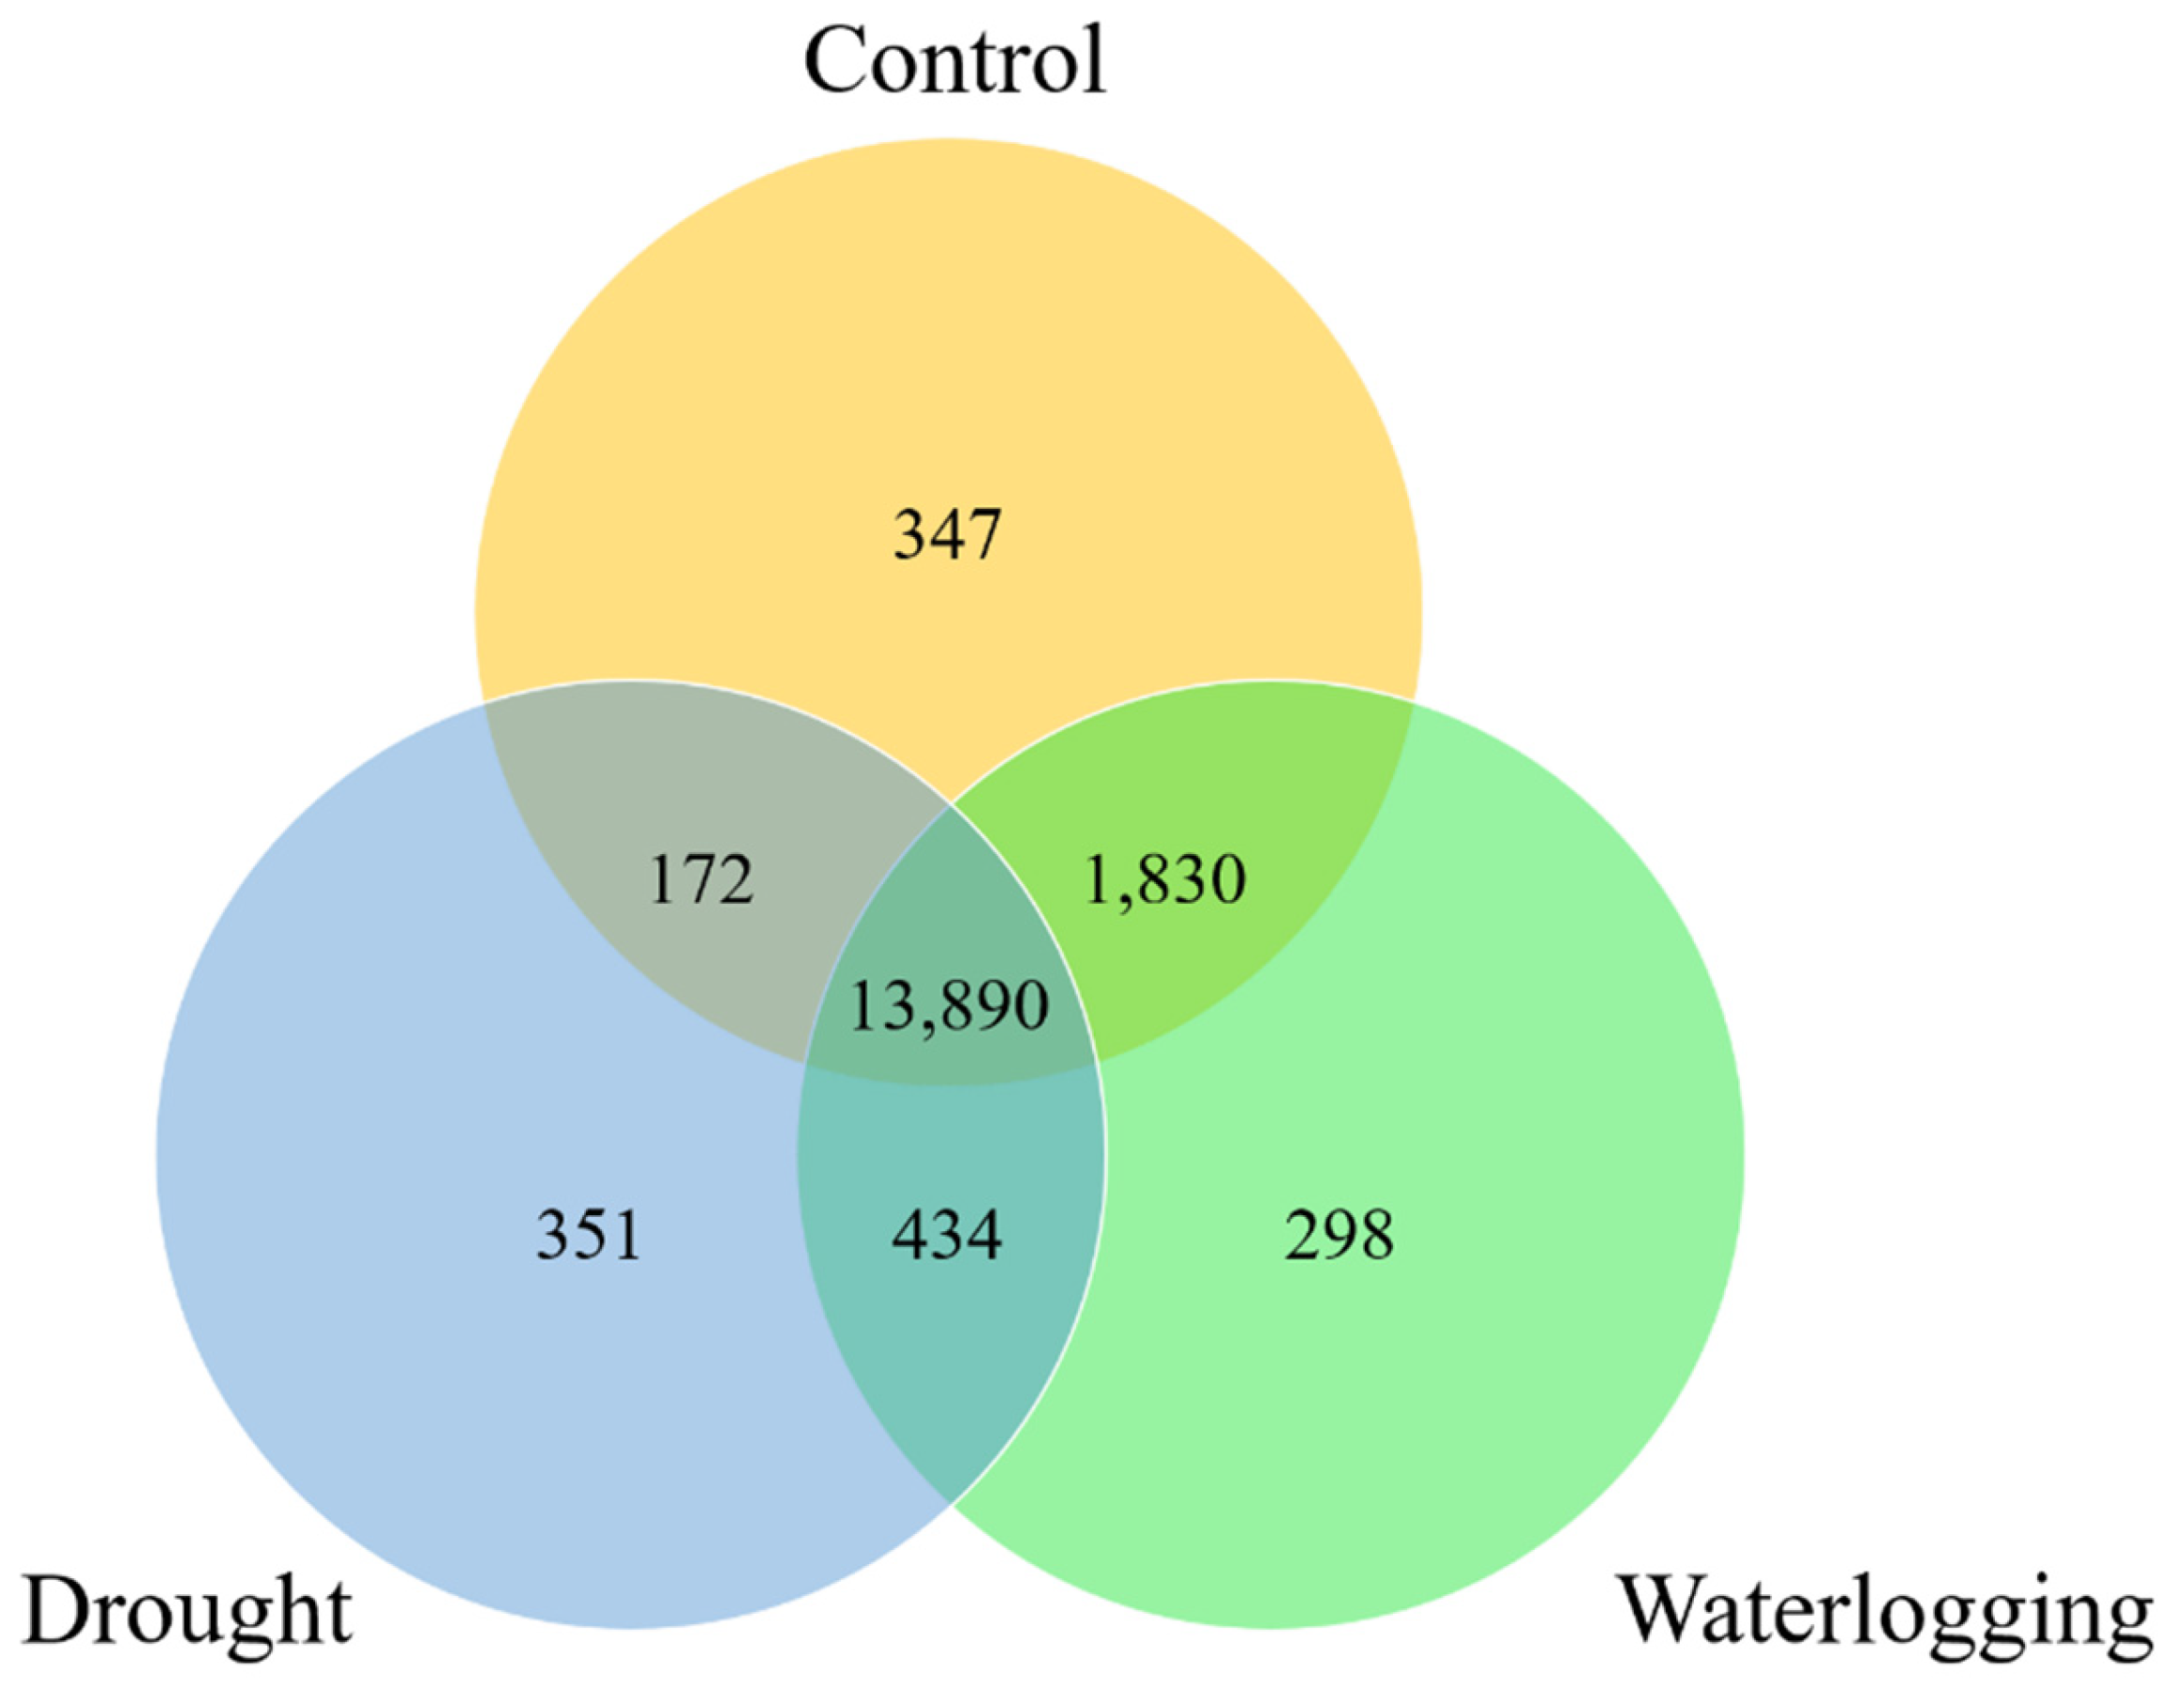
Figure 2.
Differentially expressed genes (DEGs) under drought vs. control (left) and waterlogging vs. control (right). The bars indicate the total number of DEGs that were upregulated (Up) or downregulated (Down) under each stress condition (padj < 0.05).
Figure 2.
Differentially expressed genes (DEGs) under drought vs. control (left) and waterlogging vs. control (right). The bars indicate the total number of DEGs that were upregulated (Up) or downregulated (Down) under each stress condition (padj < 0.05).
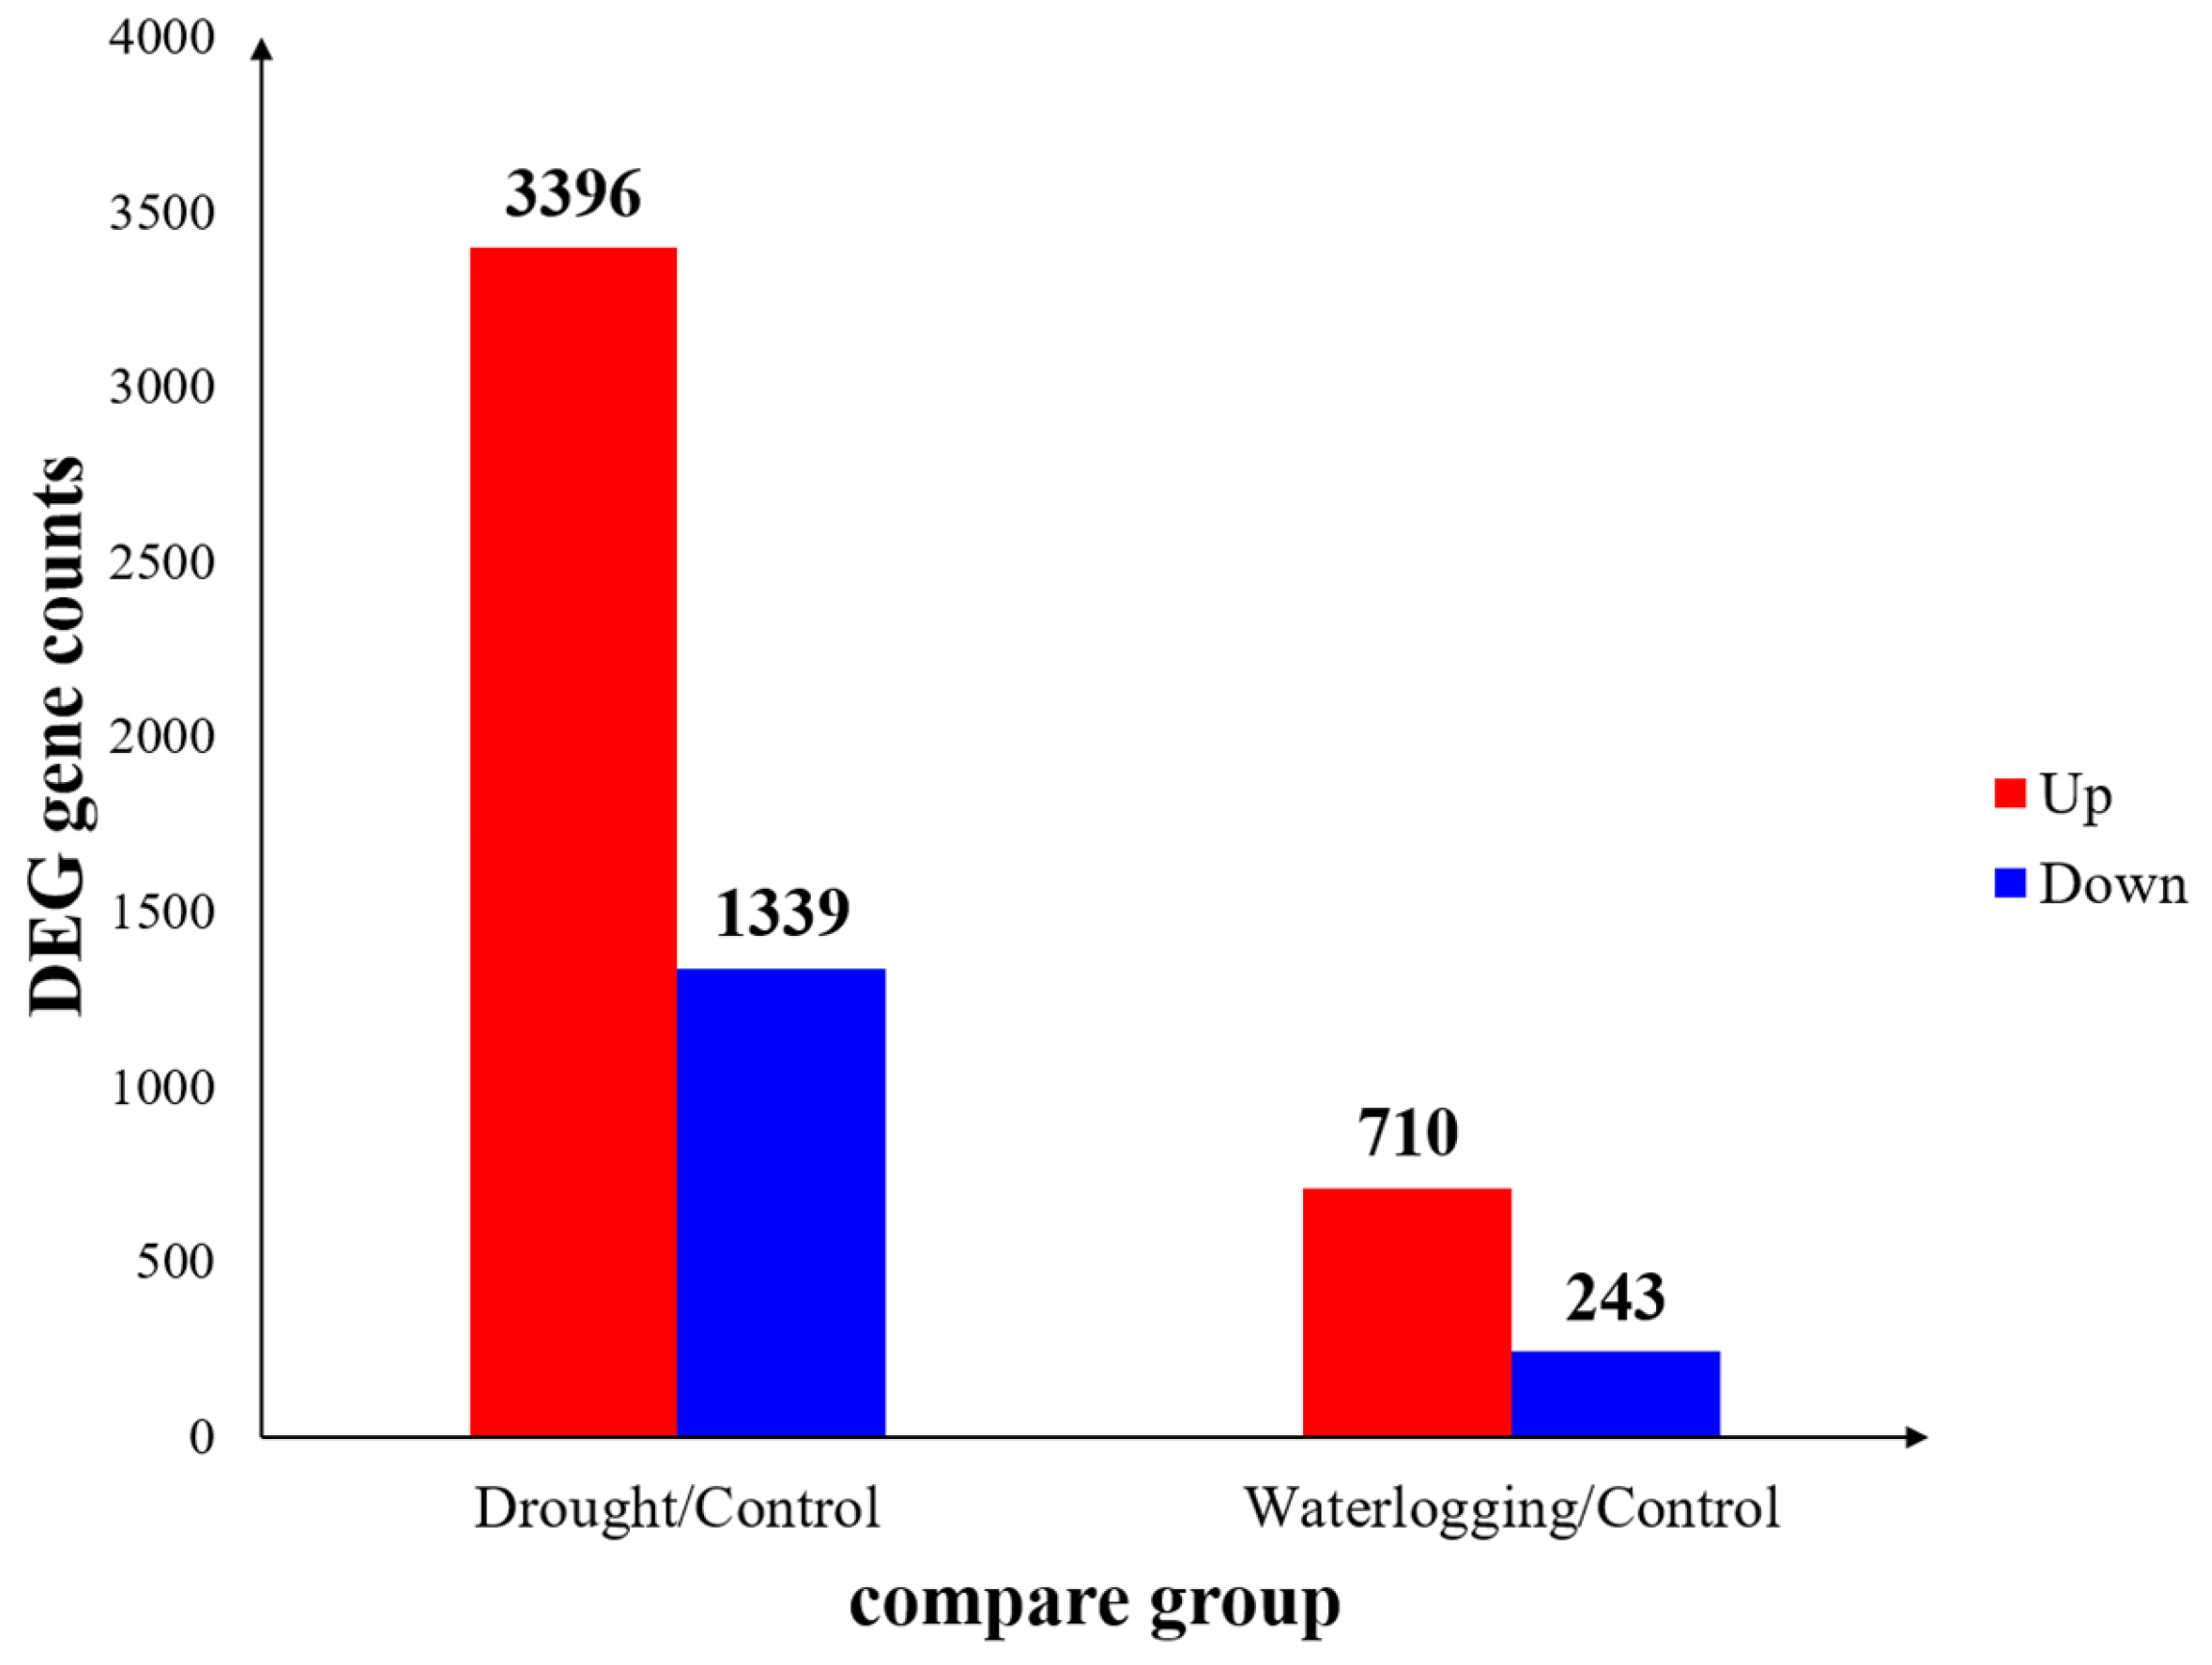
Figure 3.
Gene Ontology (GO) enrichment scatter plots showing the top 30 significantly enriched terms for differentially expressed genes (DEGs). (A) Comparison of drought vs. control, and (B) Comparison of waterlogging vs. control. Gene Ratio is defined as the ratio of the number of DEGs associated with a specific GO term to the total number of DEGs that are mappable to the GO database.
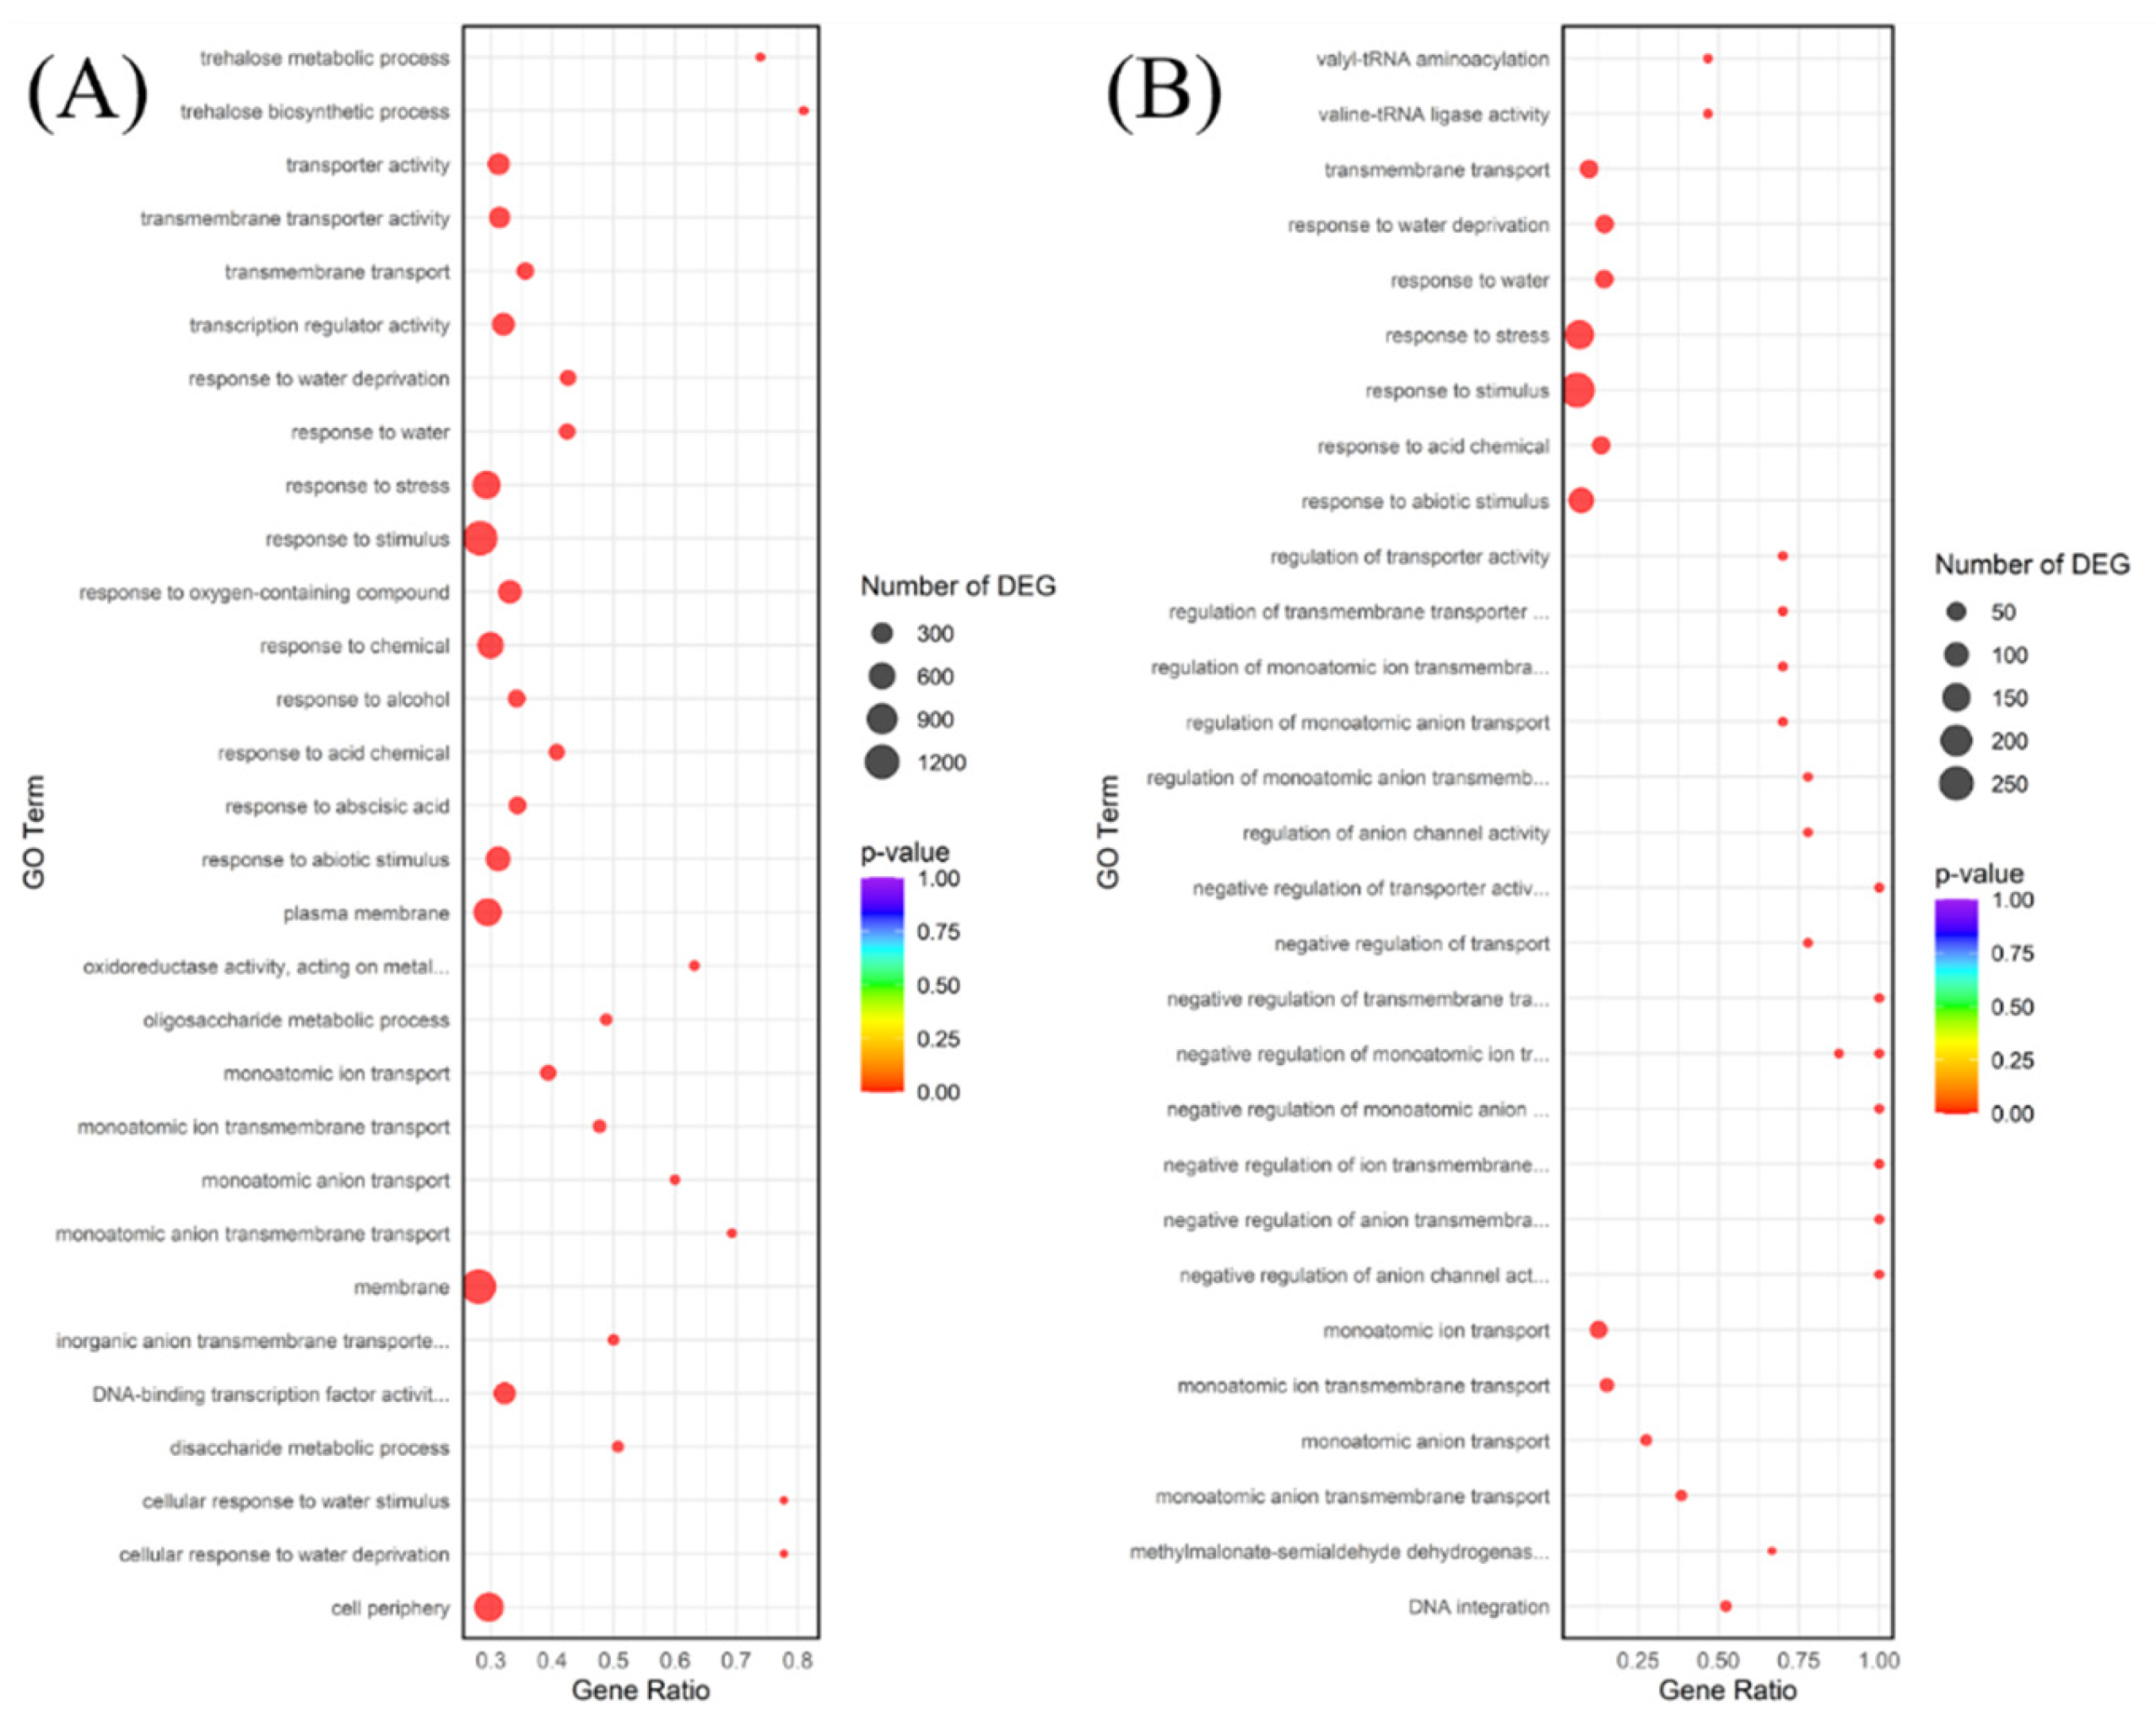
Figure 4.
Kyoto Encyclopedia of Genes and Genomes (KEGG) enrichment scatter plots showing the top 20 significantly upregulated enriched terms for differentially expressed genes (DEGs). (A) Comparison of drought vs. control, and (B) Comparison of waterlogging vs. control. Gene Ratio is defined as the ratio of the number of DEGs in each pathway to the total number of DEGs that are mappable to the KEGG database.
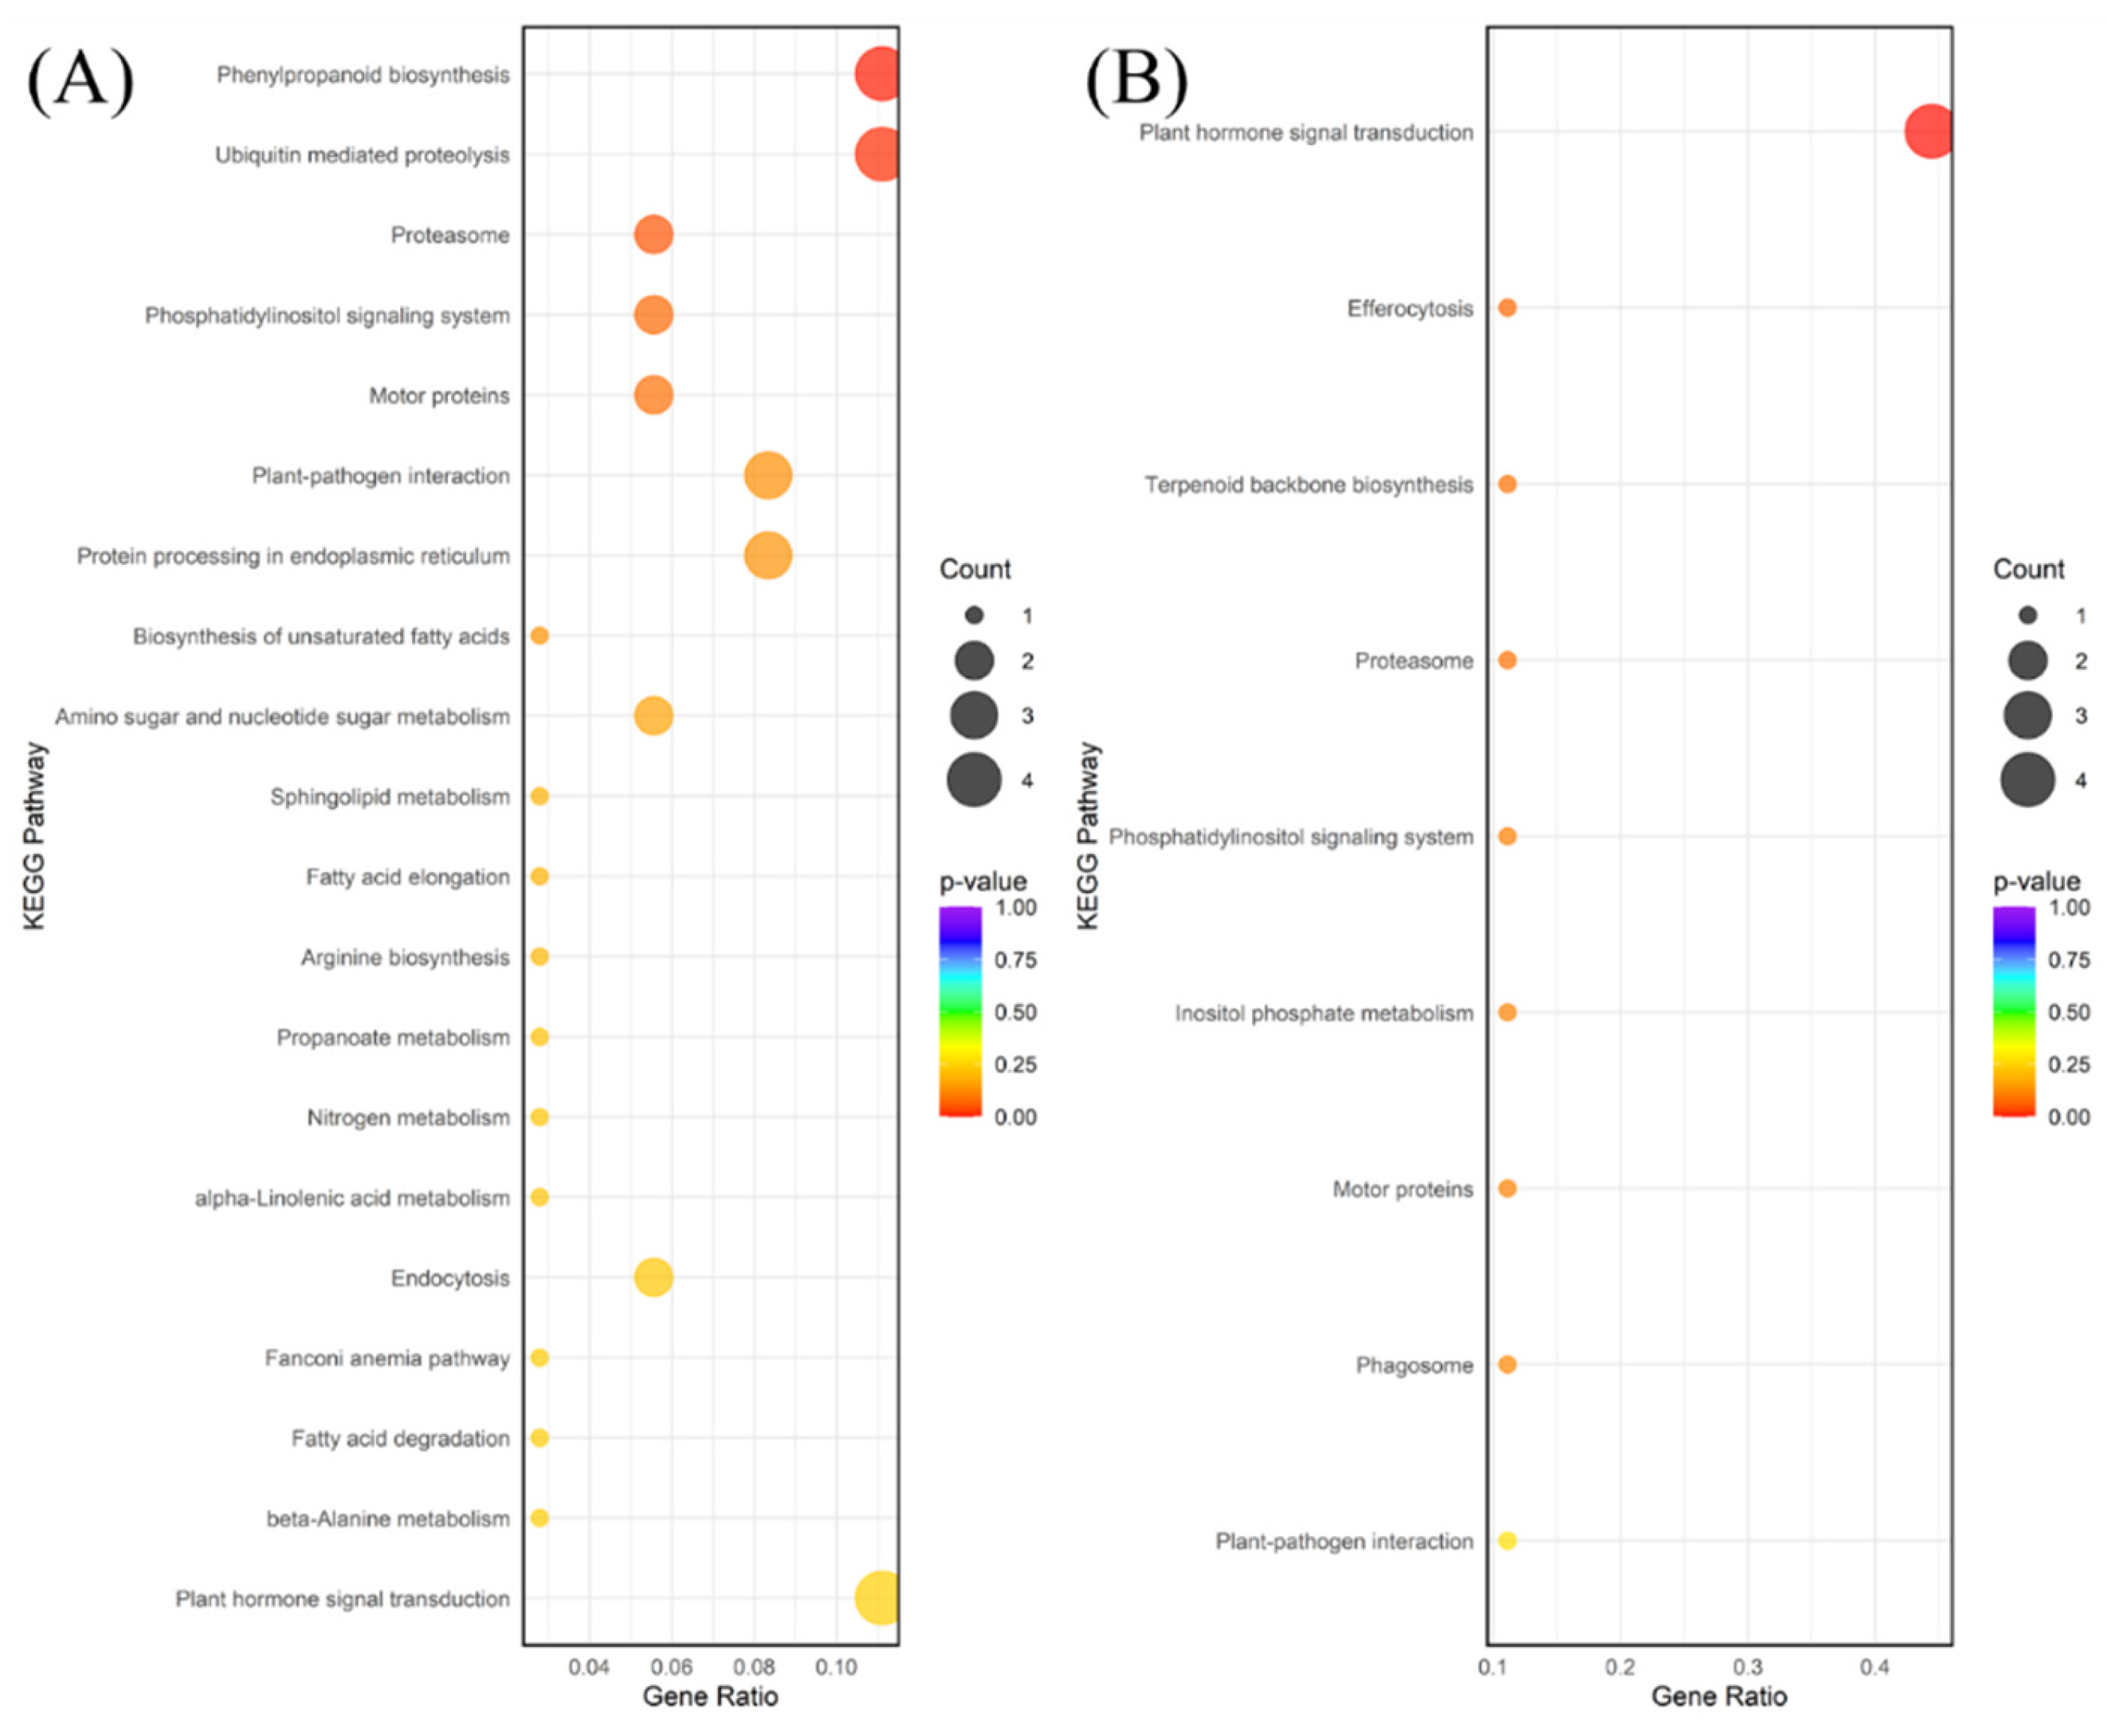
Figure 5.
Kyoto Encyclopedia of Genes and Genomes (KEGG) enrichment scatter plots showing the top 20 significantly downregulated enriched terms for differentially expressed genes (DEGs). (A) Comparison of drought vs. control, and (B) Comparison of waterlogging vs. control. Gene Ratio is defined as the ratio of the number of DEGs in each pathway to the total number of DEGs that are mappable to the KEGG database.
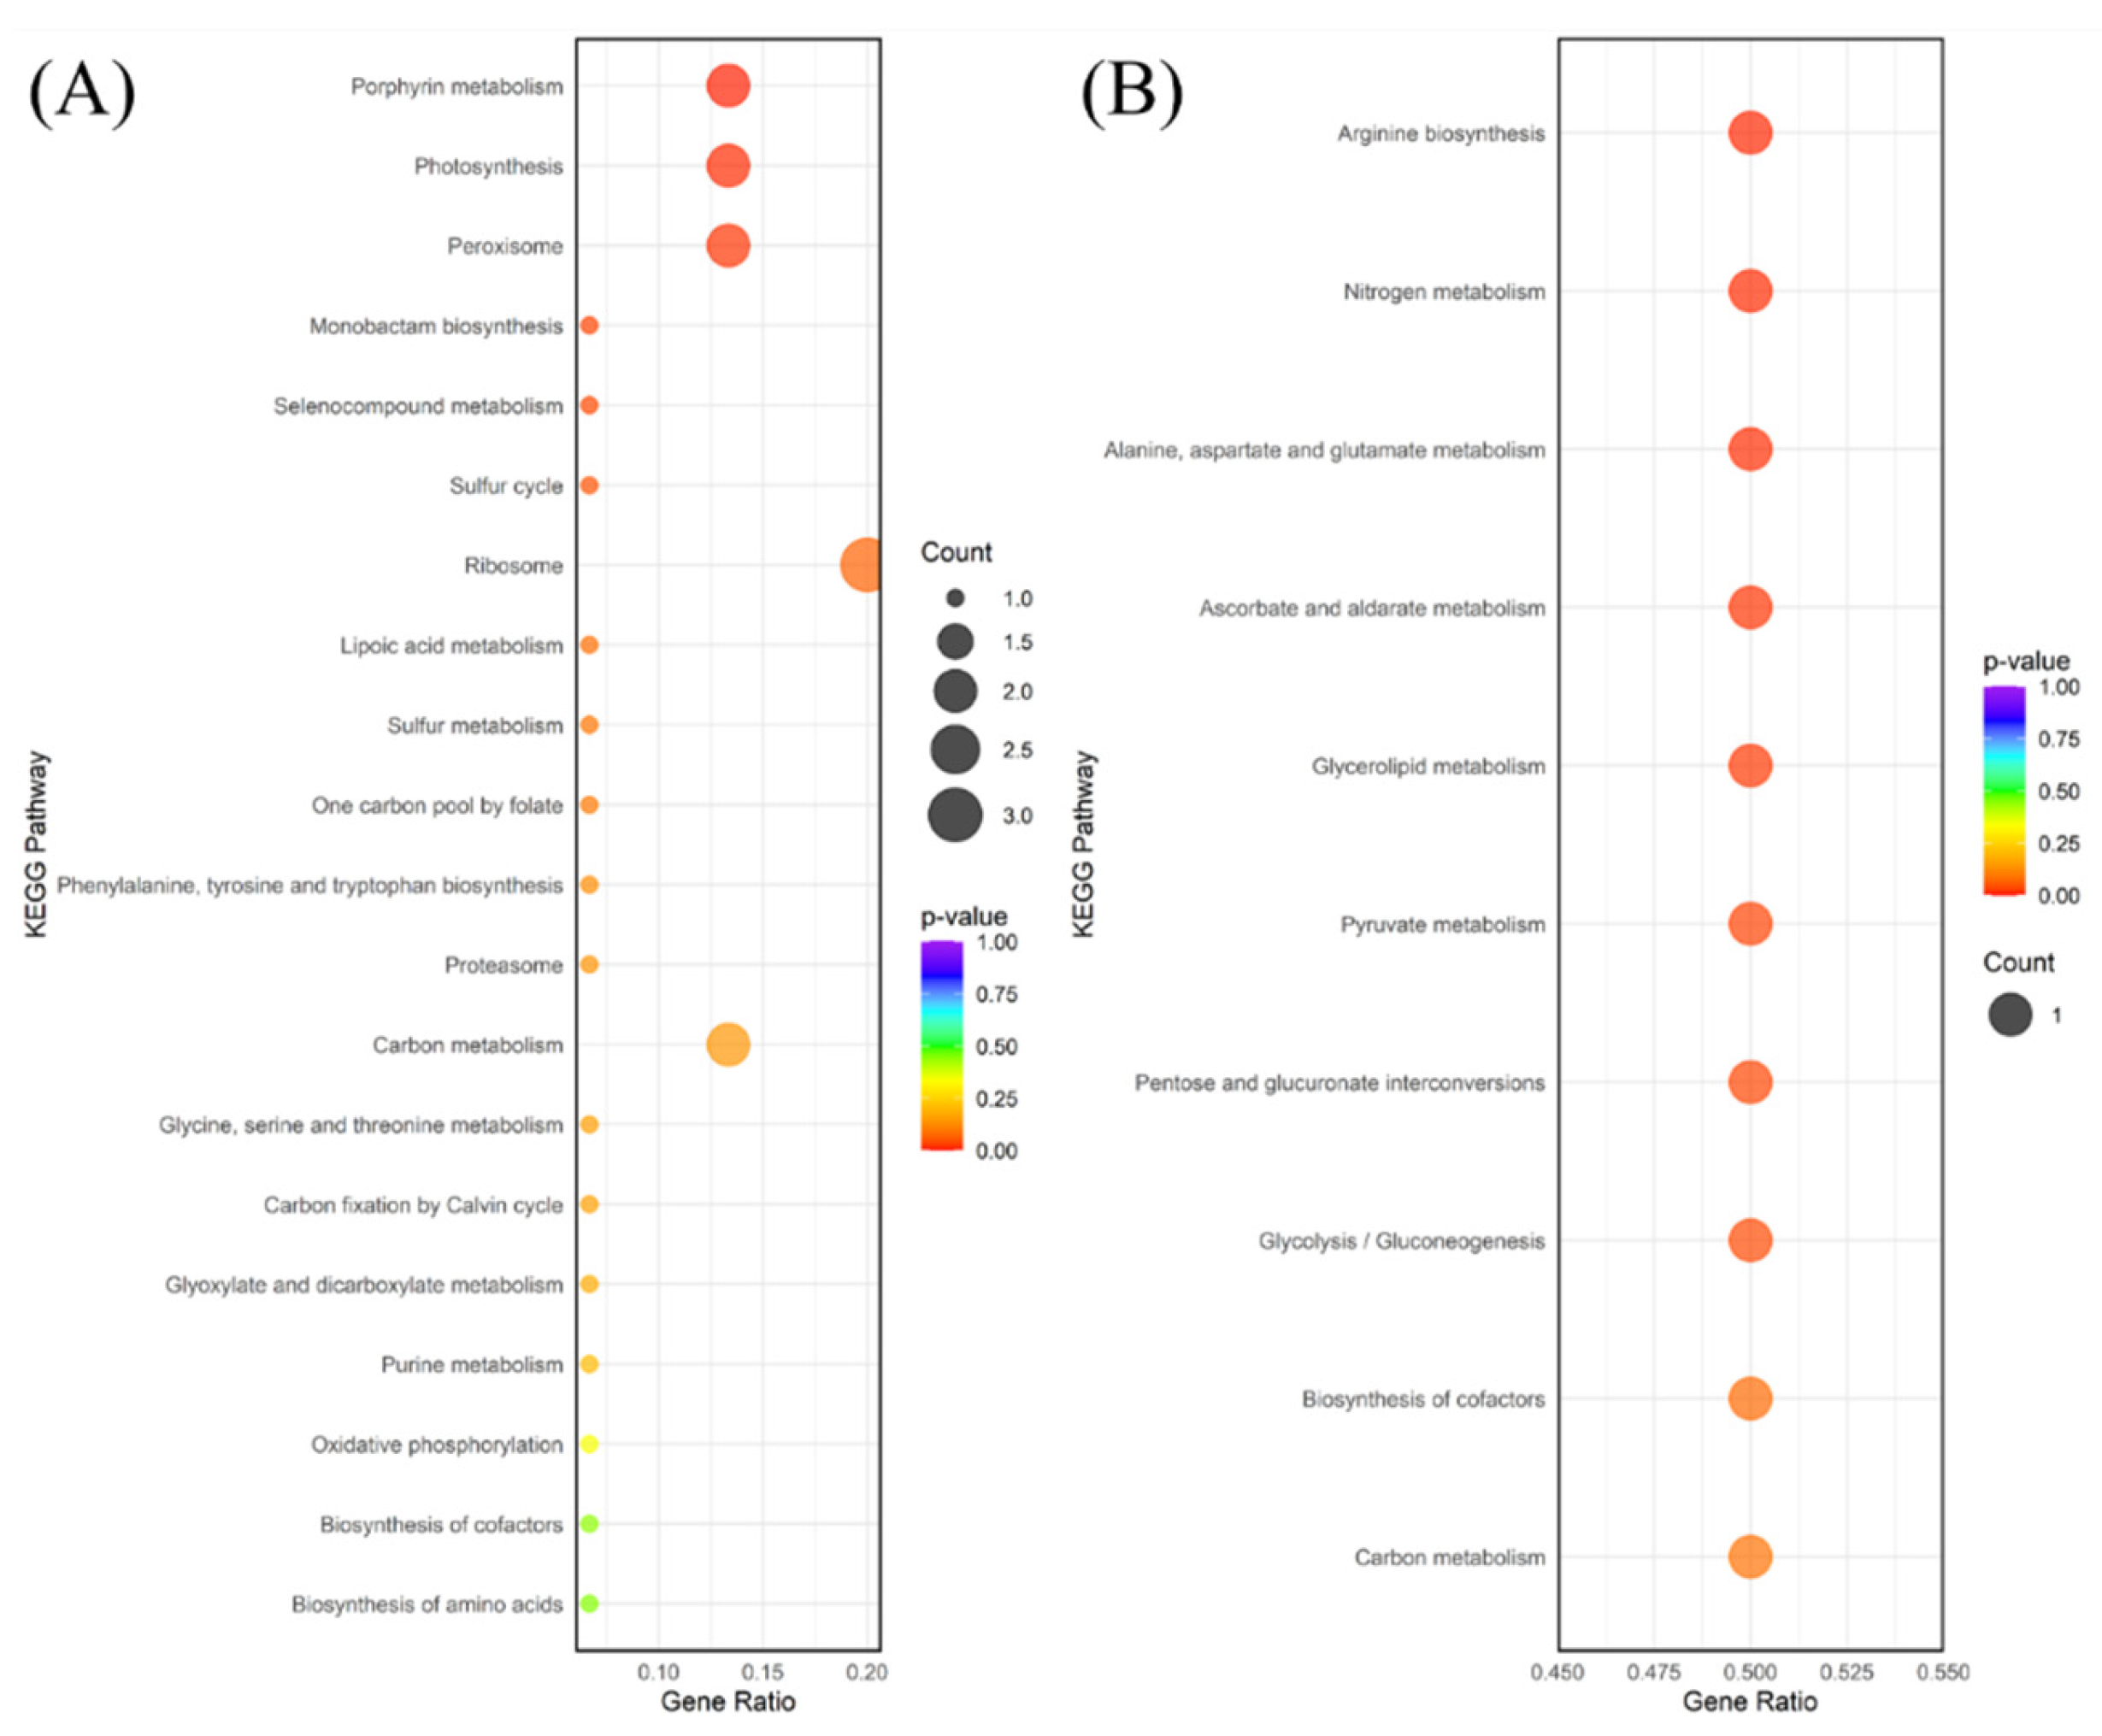
Figure 6.
Comparison of the TPM (Transcripts Per Million) values derived from RNA-Seq and the relative expression levels obtained from quantitative reverse transcript PCR (qRT-PCR) for three selected genes: Alcohol Dehydrogenase (ADH), Ethylene Responsive Factor (ERF), and Peroxidase (POD). The bars show the mean expression values (± standard errors, SE). TPM values are based on three biological replicates. Relative expression levels are based on three biological replicates and multiple technical replicates (five for ADH and ERF, and nine for POD). The Pearson correlation coefficient (r) calculated between the TPM values and the relative expression levels for each gene is indicated to confirm the reliability of the RNA-Seq dataset.
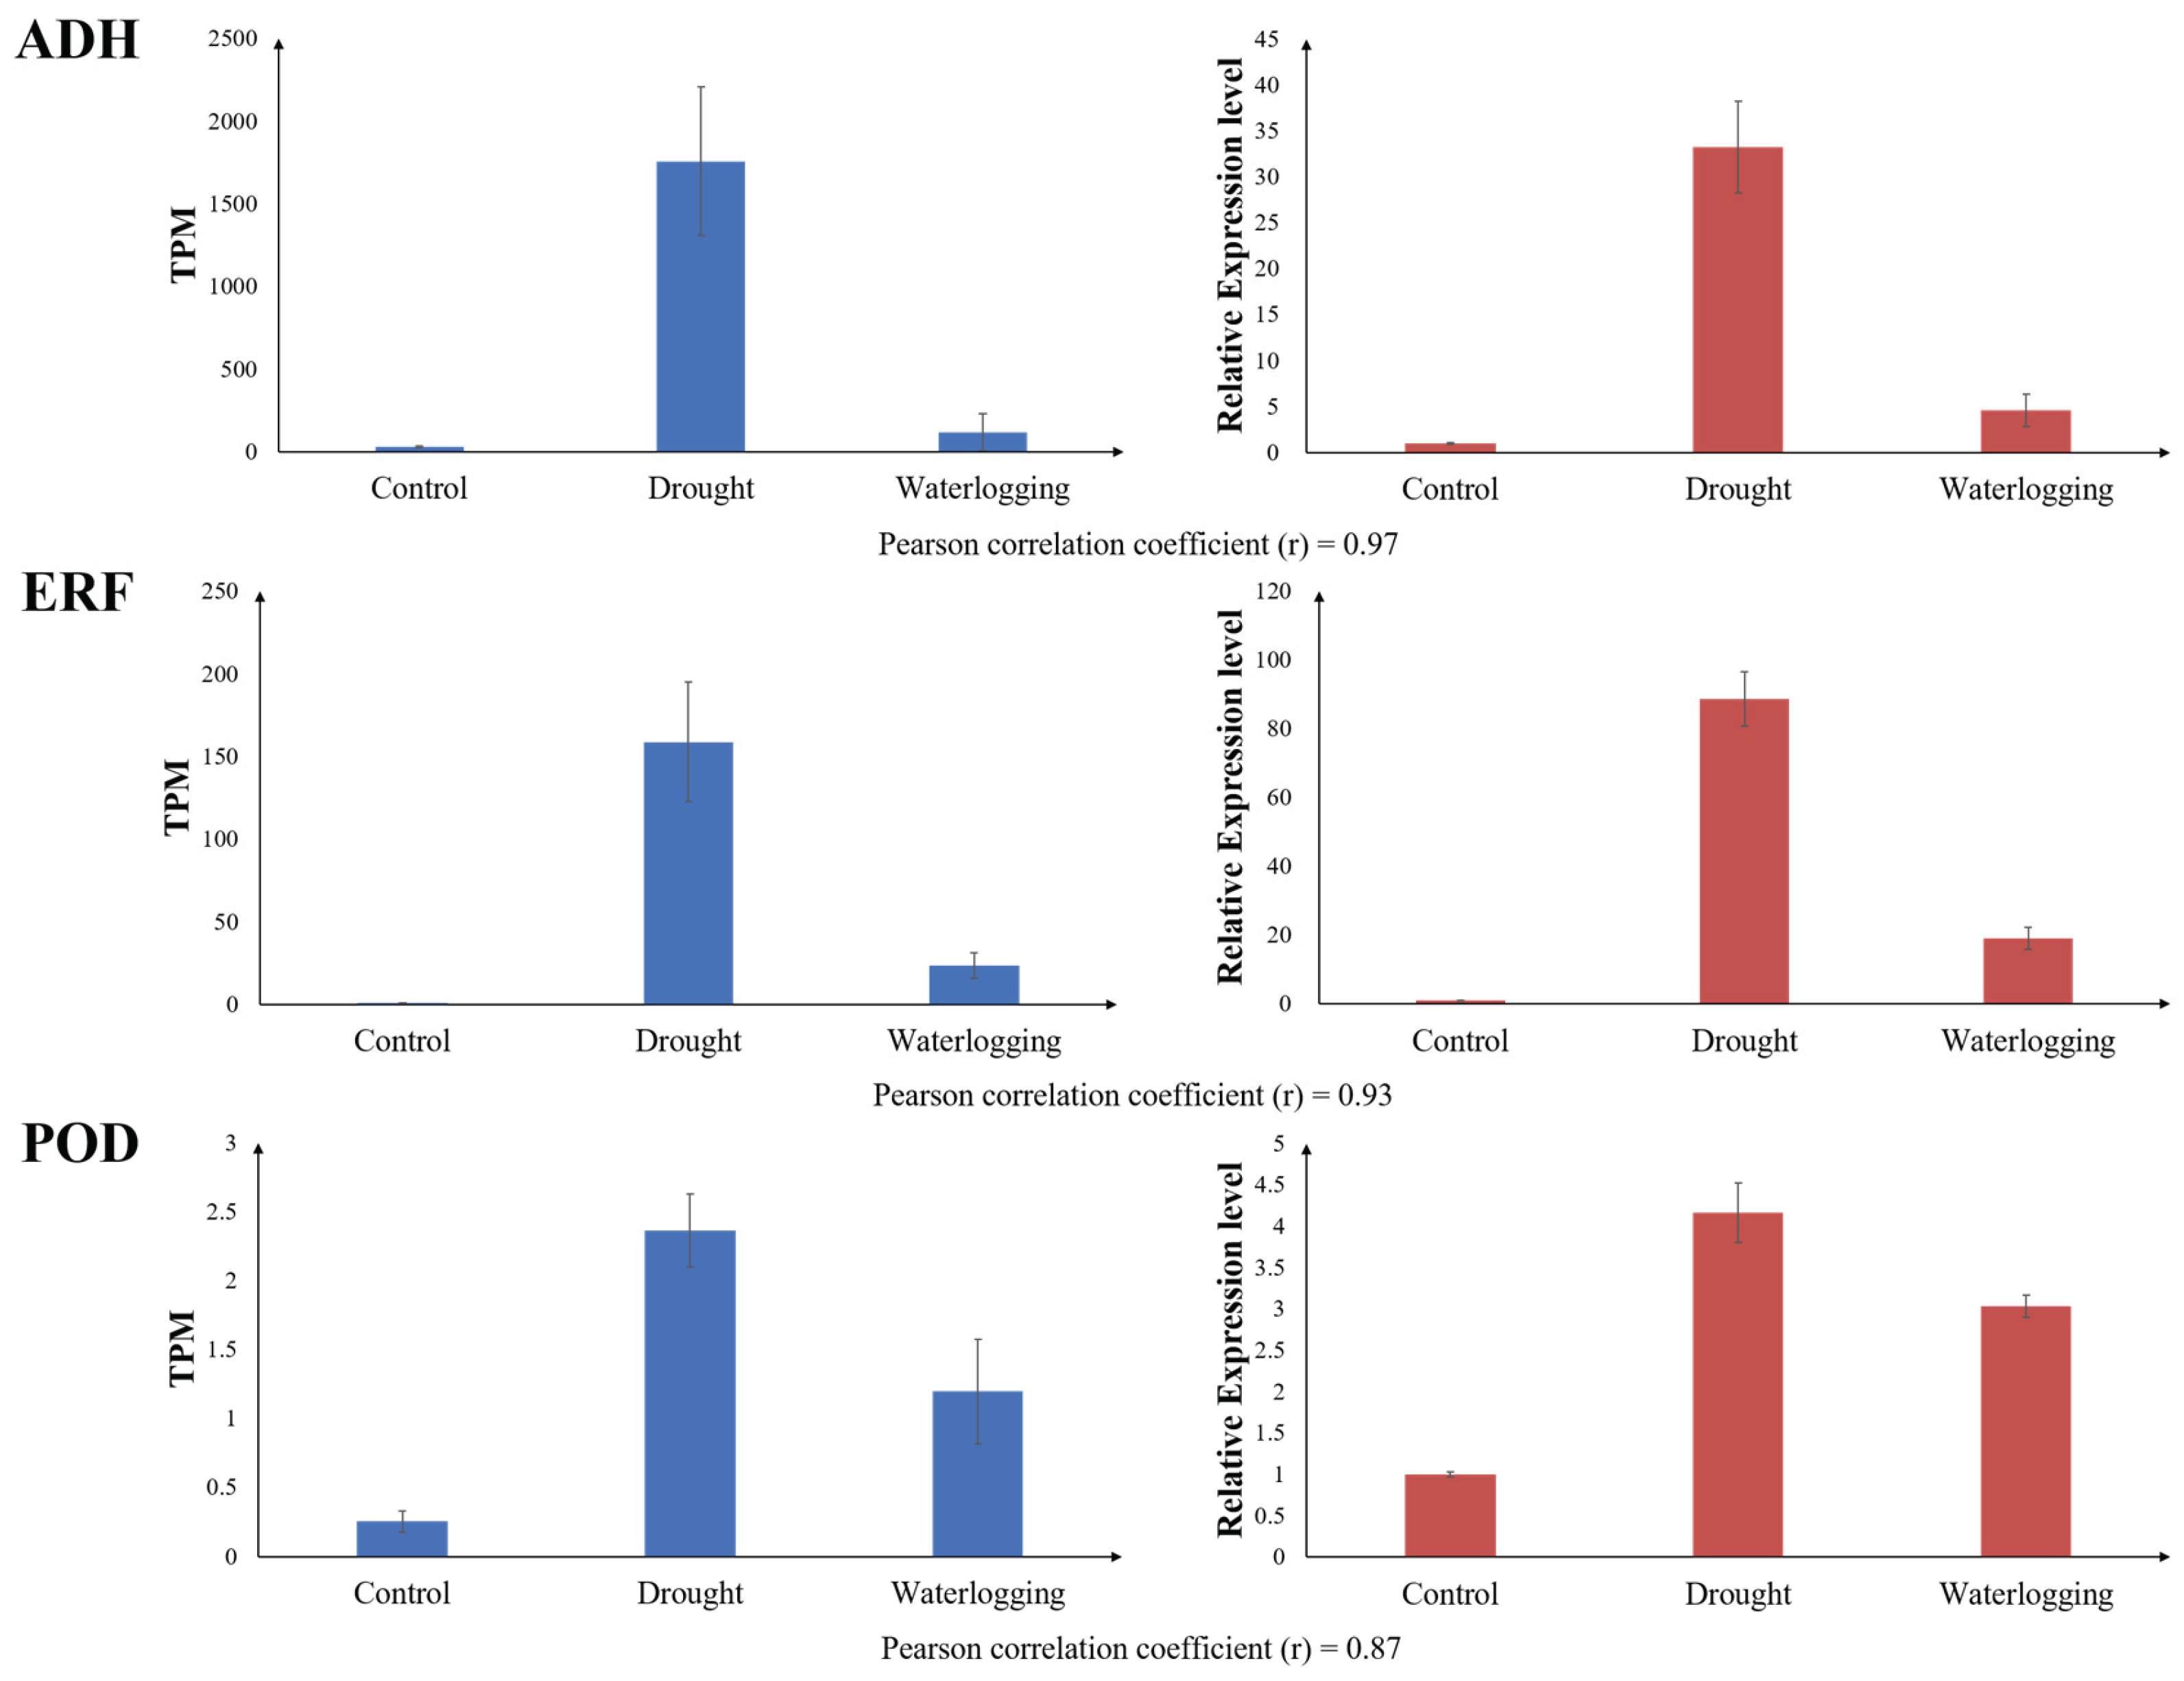

Table 1.
Primers used for quantitative reverse transcript PCR (qRT-PCR) analysis.
| Genes | Feature | Primer Sequence (5’→3’) | Annealing |
| Temperature (ºC) | |||
| Actin | Internal Standard | F: GAGTGAGCCACACTGTTCCA | 60 |
| R: CGCGAACAATTTCCCGTTCA | |||
| ADH | Alcohol dehydrogenase | F: GATCGCAGCGTAGAATGCAC | 60 |
| R: GGATGTCGCTTCTGGGCTTA | |||
| ERF | Ethylene Response Factor | F: GCTCCTATGACACGGTGGAA | 60 |
| R: TTCCTTGCATGTTTCGACGC | |||
| POD | Peroxide | F: CGTCCAATCAGGTTGACCCA | 60 |
| R: GATCCGACGTGAACAACCCT |
Table 2.
Comparison of soil water content (θv) before and after two weeks treatment.
| Treatment | θv (%) (Mean ± SE) | |
| Before treatment | After treatment | |
| Control | 20.93 ± 0.26 a | 21.37 ± 0.26 b |
| Drought | 20.93 ± 0.78 a | 1.44 ± 0.78 c |
| Waterlogging | 21.07 ± 0.38 a | 58.57 ± 1.07 a |
| Significance | Ns | *** |
*, **, and *** indicate significance at probability levels of 0.05, 0.01, and 0.001, respectively. Ns indicates not significant. Values in the same column followed by the same letter are not statistically different according to the Tukey HSD test (p < 0.05).
Table 3.
Comparison of photosynthetic efficiency after 1 week of stress treatment and plant growth parameters in Pseudolysimachion longifolium after 2 weeks of stress treatment.
Table 3.
Comparison of photosynthetic efficiency after 1 week of stress treatment and plant growth parameters in Pseudolysimachion longifolium after 2 weeks of stress treatment.
| Treatment |
Fv/Fm (1 week) |
SPAD (1 week) |
Fresh Weight (g/plant, 2 weeks) |
Dry Weight (g/plant, 2 weeks) |
| Control | 0.787 ± 0.006 a | 42.13 ± 0.99 a | 69.87 ± 5.66 a | 16.00 ± 1.38 a |
| Drought | 0.651 ± 0.025 b | 21.32 ± 1.87 b | 35.04 ± 4.42 b | 8.05 ± 1.12 b |
| Waterlogging | 0.654 ± 0.038 b | 24.10 ± 1.43 b | 39.93 ± 5.27 b | 10.37 ± 1.21 b |
| Significance | *** | *** | *** | *** |
*, **, and *** indicate significance at probability levels of 0.05, 0.01, and 0.001, respectively. Values in the same column followed by the same letter are not statistically different according to the Tukey HSD test (p < 0.05).
Disclaimer/Publisher’s Note: The statements, opinions and data contained in all publications are solely those of the individual author(s) and contributor(s) and not of MDPI and/or the editor(s). MDPI and/or the editor(s) disclaim responsibility for any injury to people or property resulting from any ideas, methods, instructions or products referred to in the content. |
© 2025 by the authors. Licensee MDPI, Basel, Switzerland. This article is an open access article distributed under the terms and conditions of the Creative Commons Attribution (CC BY) license (https://creativecommons.org/licenses/by/4.0/).
Copyright: This open access article is published under a Creative Commons CC BY 4.0 license, which permit the free download, distribution, and reuse, provided that the author and preprint are cited in any reuse.


