Submitted:
06 June 2025
Posted:
09 June 2025
You are already at the latest version
Abstract
Grapevine is one of the most extensively cultivated and economically important fruit crops, renowned for its nutritional and health benefits. However, salt stress severely impairs its growth, development, and yield. Rootstocks play a crucial role in enhancing salt stress tolerance in grafted grapevines, however the underlying mechanisms particularly at morphophysiological and transcriptomic study remain poorly understood and require further investigation. Therefore, in the present study, morphophysiological and transcriptomic sequencing was performed on tolerant grapevine rootstock ‘SO4’ and susceptible ‘Beida’ in response to salt stress and control group. Morphophysiological results showed that the plant height, stem diameter, root length, root weight, number of roots, root surface area, malondialdehyde, soluble sugar, proline, antioxidants enzymes after 12 days of salt stress boosted more significantly in ‘SO4’ than ‘Beida’. Furthermore, transcriptomic analysis studies showed that a total of 2268, 1066, and 1135 differentially expressed genes (DEGs) were identified in ‘SO4’, and ‘Beida’ rootstock after 0, 6, and 12 days. The metabolic pathways, pyruvate metabolism, plant hormone signal transduction, biosynthesis of secondary metabolites, and osmotic adjustment were the primary response systems in both grapevine rootstock under salt stress. Different transcription factors involving bHLH, AP2, ERF, HSF, WRKY, MYB, and MYB-related had more annotated in ‘SO4’ than ‘Beida’ rootstock under salt stress. In addition, using weighted gene coexpression analysis (WGCNA), five modules (MEblack, MEblue, MEyellow, MEgreen, and MEgrey) were highly associated with salinity stress tolerance. Among them, MEblack was the most positive (upregulated) module color in ‘SO4’, while it was negatively correlated with ‘Beida’ rootstocks under salt stress. Furthermore, 10 DEGs related to the tolerance response were selected and validated based on transcriptomic data and RT-qPCR. Our findings outline a tolerance mechanism model for rootstocks under abiotic stress, providing necessary information for improving the tolerance of grapevine genotypes.
Keywords:
grapevine
; rootstock
; salt stress
; physiological characteristic
; transcriptomic analysis
; defense response related genes
1. Introduction
Salt stress is one of the serious abiotic stresses affecting crop productivity. Approximately 16% of arable lands worldwide are affected by salt, flooding, and heat stresses [1,2]. The climate change exacerbates soil salinity, potentially expanding because of the genetic heterogeneousness of vineyard resources, there are often always remarkable distinctions in salt tolerance between plant genotypes [3]. Various tissues of plants are associated with each other in response to salt stress. Under salinity, leaf growth becomes more profitable than root germination [4]. As the plant organs are accountable for mineral transportation, the leaf arrangement can be injured under salt stress [5]. Salt stress impacts diverse plant characteristics, such as leaf color, size, height, thickness, and curling of the margins. In addition, salt suppresses leaf growth that turns impacts fresh weight, number of leaves, photosynthetic activity, ion homeostasis, chlorophyll metabolism, flavonoid integration, transpiration, perception, cellular signaling, osmotic balance, water use efficiency, and ultimately inhibiting plant growth and development [6,7]. In consequence, to prevent such trouble, plants have developed various acclimation plans to withstand salt stress, including activation of osmoprotectant, signaling coordination, antioxidant enzymes, non-enzymatic antioxidants, hormonal regulation, defensive genes, transcription factors, and signaling transduction to varying degree. Moreover, reactive oxygen species (ROS) may function as an advantageous biological component to anticipate tress and serve various indications, though intolerable ROS may generate enfeeblement to the tissue [8,9]. At the same time, plants generate an antioxidant protection course under increasing ROS signaling mechanism [10]. Under salt stress, the contents of ascorbate and glutathione (AsA-GSH) are normally widely activated, decreasing oxidized non-enzymatic antioxidants in maize leaves [11]. Variation under plant growth regulators (PGRs), for instance gibberellic acid (GA), abscisic acid (ABA), indoleacetic acid (IAA), cytokinin (CK), jasmonate (JA), melatonin (MA) and 5-aminolevulinic acid (5-ALA) have shown essential roles in response to high salinity conditions when crops are subjected to salt stress [12,13]. For good measure, mitogen-activated protein kinase (MAPK), and basic helix loop helix (bHLH) cascade were involved in many PGR responses that are triggered by salt and drought stresses, respectively. For instance, in Arabidopsis thaliana and Poncirus trifoliata, AtMAPK18 and PtrbHLH in overexpression supply tolerance to different abiotic stress [14,15]. Moreover, the accumulation of solutes, nitrates, carbohydrates, and signaling regulation are essential for plant improvement and production under abiotic stress situations to preserve the biosynthesis of various metabolites. For instance, in Oryza sativa (mays B73) in response to water deficit accumulated trehalose-phosphate synthase, trehalose-6 phosphate, trehalose-6 phosphate phosphatase, and malondialdehyde [16]. Additionally, a subsequent elevate in different amino acid conditions is memorialized in growing tolerant grapevines in response to abiotic stress [17]. Therefore, understanding the molecular mechanisms of the grapevine rootstock genotype salt stress adaptation and developing crops with enhanced salt tolerance are crucial.
Grapevine (Vitis vinifera L.) is one of the most economically significant fruit crops worldwide. The influence of the rootstock genotypes is very essential for the production of grapevine stress tolerance [18]. They are mostly used for wine quality, fresh food, antioxidant products, and influential responses depending upon climate change [19]. Plant genotypes are widely cultivated worldwide because of their excellent traits for instance, higher adaptability, variation to atmospheric conditions, high yield, better quality, environmental adaptation, good persistence, and economic benefits to different abiotic stresses [3,20]. The first use of resistant rootstocks in the 1870s rescued the grape industry in Europe from the phylloxera disaster, which is a destructive insect pest of grapevines [21,22]. Europe and America then continued to research grapevine rootstocks to improve the resistance of grapevines to a variety of biotic and abiotic stresses [20,23]. The application of rootstock has proven to considerably enhance the resistance of planted types to drought, cold, flood, disease, and insects, as well as broaden the scope of grapevine cultivation, improve the quality of the grapes, and minimize the pollution produced by pesticides and chemical reagent [24,25]. With grapevine phylloxera occurring in many places in the world, and the threat of salt, extreme temperatures, drought, and other ecological environment stresses caused by the deterioration of the natural environment, grapevine grafting for scion-rootstock seedling propagation has become popular [26]. The study of the genetic diversity of rootstocks routinely used in grapevine production could help us better understand their stress tolerance and expand the genetic resources available for breeding novel rootstocks. 1,343 rootstocks from 22 countries are registered in the Vitis International Variety Catalogue (VIVC, http://www.vivc.de /), 90% of which are bred through hybridization and show some significant resistance in specific areas, while less than 10% of the rootstocks are seedling offspring of wild genotypes [20].
The grafting of scion grapevines onto suitable rootstocks may significantly improve the interaction between plants and the environment and may reduce the impact of abiotic stress [27,28]. This may currently be the most effective way to deal with abiotic stress and reduce production losses [29,30]. Hence, interest in grapevine rootstocks has intensified. There is a wide variation in salt tolerance among rootstock genotypes [31,32]. Grapevine rootstocks vary in their response to soil salinity in terms of maintaining scion growth, sustaining yield, berry quality, and ion concentrations in the leaves [33,34,35,]. Salinity tolerance may also involve the exclusion of chloride and sodium ions [36]. Elucidating the stress resistance process of the rootstocks at the physiological and molecular responses will play an important role in improving crop growth performance under stress conditions [24]. Therefore, we selected the two most common grapevine rootstocks to analyze and evaluate the morphological, and physiological characteristics of plants under salt stress, and finally screened the resistant genotypes SO4 (V. berlandieri× V. riparia), and the susceptible genotypes Beida (V. riparia×V. labrusca), which is consistent with viticulture research and previous findings [24,31,37,38].
Previously the transcriptomic study detected the genetic mechanisms of grapevine genotypes responses to salt stress at the whole genome sequencing [30]. Some research was done on crop adaptations to salt stress, such as in tomato [39], rice [40], apple [41], rose [42], and pomegranate [43] at transcriptomic sequencing technologies. Gene ontology (GO), and Kyoto Encyclopedia of Gene and Genomes (KEGG) were significantly enriched in photosynthesis-related pathways, signal transduction, metabolic pathway, transcription factors, chlorophyll degradation, post-transcriptional activities, and physiological responses under salt stress [44,45]. This further indicates that these investigations were focused on salt stress utilization or adaptation in roots and leaves. However, comparative physiological and transcriptomic sequence mechanisms for regulating grapevine plant responses to salt stress tolerance largely poorly understood, particularly in ‘SO4’ and ‘Beida’ rootstocks that could be grown globally and need comprehensive salinity tolerance.
In this study, we used ‘SO4’, and ‘Beida’ grapevine rootstocks to investigate their phenotypical, physiological, and gene expression changes following salt stress. Notably, salt stress decreased the phenotypical traits of both grapevine rootstocks. While increasing the levels of compatible solutes such as antioxidant enzymes, malondialdehyde, proline, and sugar in ‘SO4’ then ‘Beida’ grapevine rootstocks under salt stress. Through transcriptomic data (RNA-seq), we analyzed differential gene expression in ‘SO4’ and ‘Beida’ grapevine rootstocks under salt stress and investigated salinity-responsive transcription factors and module color. Our study sheds light on the physiological responses and regulatory mechanisms involved in salt tolerance in grapevine rootstocks, providing a theoretical foundation for the breeding research of salt resistance in grapevine genotypes.
2. Materials and Methods
2.1. Experimental Details, Salt Treatments, and Sampling Layout
The experiment was handled in June 2023, in which two-year-old, non-grafting rootstocks of two grapevine genotypes SO4 (V. berlandieri × V. riparia), and Beida (V. riparia×V. labrusca) were used as plant material. They were grown in pots (25-cm diameter and 30 cm deep) in an artificial climates chamber at Baima base research field, Nanjing Agricultural University (NJAU), Nanjing, Jiangsu, China (31°36′36′′ N, 119°10′48′′E), at 65 % of relative humidity vs 16-hours light and 8-hours dark period at NJAU, under greenhouse conditions. The soil kind for this grapevine rootstock genotype cultivation was used as a mixture of peat, vermiculite, and perlite (3:1:1, v/v/v). The total number of pots was sixty-four (including 32 vs 32 for SO4 and Beida) genotypes in each pot ten non-grafted genotypes were grown under greenhouse conditions and the treatments were repeated. Two treatments (1) control group (CK), and (2) NaCl (100 mmol/L) concentrations were used until the plant changed their phenotypes [3]. From both genotypes 18 sampling was done from the fourth to sixth leaf tissue stage for 0, 6, and 12 days of the treatments. Three biological replicates were made. We determined the physiological, biochemical, and RNA-seq analysis from both rootstocks under 0, 6, and 12 d after treatments. At the end of the experimental work, we also collected roots for both grapevine rootstocks for this study. For this, at least three independent biological replicates were performed, and three technical replicates were used.
2.2. Assessment of Phenotypic Traits of Two Grapevine Rootstocks under Salt Stress
Leaf growth parameters were observed for ‘SO4’, and ‘Beida’ grapevine rootstock genotypes at 0, 6, and 12 days after treatments. In this way, we measured four phenotypic traits including (a) plant height (cm), (b) stem diameter (cm), (c) number of internodes, and (d) number of leaves. The scale measuring ruler and vernier caliper were used for these parameters. At the 12 d of treatments root morphological data was recorded which covers root weight (g), root length (cm), total number of roots, root volume, and root surface area were measured. And their pictures were taken.
2.3. Assessment of Leaf Photosynthetic Pigment Contents
The chlorophylls and carotenoid pigments are measured using pestle and mortar by grinding 0.5 grams (gs) of leaf samples followed by 80% acetone. The solution is mixed well, and extraction is performed for 24 h at 4 ℃ in the dark with several shaking cycles before measuring the photosynthetic pigments for “SO4”, and “Beida” grapevine rootstock genotypes. The absorbance of the extracted samples at 645, 663, 652, and 470 nm was used to analyze with the help of an electronic machine called UV-1800 spectrophotometer, and their photosynthetic pigments contents were measured by using the following equations [46].
Chl a (mg/g fresh weight) = [12.7 (O.D 663)–2.69 (O.D 645)×V/1000×W]
Chl b (mg/g fresh weight) = [22.9 (O.D 645)–4.68 (O.D 663)×V/1000×W]
Total Chl (mg/g fresh weight) =[8.04A663 + 20.2A645) × V/1000×W]
Carotenoid contents (mg/g fresh weight) = total Chl-Chla-Chlb
2.4. Determination of Antioxidant Enzyme Indicators
The fourth to sixth functional leaf tissues from three biological replicates per each condition and genotypes were sampled to measure the physiological and biochemical indicators including malondialdehyde (MDA), proline contents, and enzymatic activities. The assay of MDA and proline measurements were measured according to the method suggested by [47,48,49]. The measurement of superoxide dismutase (SOD) activity was performed by spectrophotometry using the nitro-blue tetrazolium method [50]. Peroxidase dismutase (POD) activity was measured by the guaiacol colorimetric method [10,51]. And, the activities of catalase (CAT), ascorbate peroxidase (APX) were calculated using the methods described by [52,53].
2.5. RNA Isolation, cDNA Synthesis, and Transcriptome Sequencing Analysis
The ‘SO4’, and ‘Beida’ grapevine leaves that had been treated with salt stress for 0, 6, and 12 d were used for RNA extraction, containing three independent biological replications for each sample. Their RNA was extracted by using the cetyltrimethylammonium bromide (CTAB) method [54]. Extracted RNA from both genotypes was treated with RNase-free DNase I (Takara, China) at 25 ℃ for 15 min to eliminate the remaining DNA. Thereafter, the concentration and purity of the extracted RNA were measured using a Nanodrop™ 2000 spectrophotometer (Thermo/Fisher Scientific, USA). The integrity of total RNA was determined using a Bioanalyzer 2100 system (Agilent Technologies, USA). The RNA library of each sample was annotated and prepared using a high Illumina Novaseq 6000 by Gene Denovo Biotechnology Company Ltd. (Guangzhou, PR China).
For RN-seq, 18 samples from the control group and salt stress treatments for 0, 6, and 12 d of each, containing three independent biological replicates and 9 comparison groups were subjected to assess the higher levels of tolerance and comparative treatments on gene expression values “B vs D (0d_6d of NaCl), B vs F (0d_12d of NaCl), B vs H (0d_0d of NaCl), D vs F (6d_12d of NaCl), D vs J (6d_6d of NaCl), J vs L (6d_12d of NaCl), F vs L (12d_12d of NaCl), H vs J (0d_6d of NaCl), and H vs L (0d_12d of NaCl)”. The library sequencing was completed using an Illumina HiSeq platform, and raw data were considered as raw reads. Moreover, the clean reads were acquired by reads involving adapter and low-quality reads, and then extracting the biological sequencing data using a custom Perl script with a base pair quality of Q ≥ 20. The filtered reads were mapped to the reference genome (https://plants.ensembl.org/Vitis_vinifera/Info/Index?db=core) using HISAT2 software (version: v1.2.8) was applied to calculate the fragments per kilobase per exon (FPKM) per million tagged reads to estimate the transcript abundance within a 95% confidence interval. DESeq2 was used to determine DEGs with the screening criteria |log2FC (fold change)| ≥ 1 and false discovery rate (FDR) < 0.05. To obtain more detailed information on the DEGs, we performed an enrichment analysis using the R program (version: 3.18.1) [55]. The omicshare web tool (https://www.omicshare.com/tools/Home/Soft/getsoft) was used to construct Gene ontology (GO; http:// geneontology.org/) and Kyoto Encyclopedia of Genes and Genomes (KEGG; https: //www. genome.jp/kegg/) database annotation pathways of all the DEGs [56]. To determine the significant enrichment analysis of KEGG-related terms, we use the threshold to padj < 0.05. Each sample contained three independent biological replications.
2.6. Construction of the Weighted Gene Co-Expression Network Analysis
To identify gene expression networks, we used weighted gene co-expression network analysis (WGCNA) analysis based on FPKM values for both cultivars to recognize categorical modules of co-expressed modules related to salinity stress [10,57]. Moreover, we first investigated genes and samples with too many missing values using the goodSamplesGenes functions in WGCNA 1.7.2 R software. We then eliminated the offensive genes whose last description shows a ‘FALSE’ result. To build a comparative scale-free network association, a soft threshold power of 5 was applied to calculate the adjacency matrix for a signed co-expression network association. Then, the topological overlap matrix (TOM) and dynamic-cut tree algorithm were applied to construct network modules. To discover significantly salt-related modules, module eigengenes were applied to calculate correlation networks with samples with differentiable limitations. Gene networks and heatmaps were generated using the Cytoscape and TBtools software [58].
2.7. The Validation of RNA-Seq by RT-qPCR Analysis
In this study, (Supplementary Table S1-S2) delineates the specific primer list for this study, which was designed by using the Primer 3 Plus web tool and (NCBI) National Center for Biotechnology Information (http://primer3.ut.ee/ vs https://www.ncbi.nlm.nih.gov/). Quantitative real-time polymerase chain reaction (RT-qPCR) was performed to validate the relative expression of screened genes from SO4 and Beida grapevine rootstocks under salt stress. The RNA was extracted from the leaves of both rootstocks based on the cetyltrimethylammonium bromide (CTAB) procedure [59] with minor modifications. The acquired cDNA was synthesized using HifairII First Strand cDNA Synthesis SuperMix for qPCR (Yaseen, Shanghai, PR China), and qRT-PCR was carried out using a 2 × TSINGKE® Master qPCR Mix (SYBR Green I) (Tsingke Biotechnology Co., Ltd.). The total 10 μL of reaction mixtures contained 5 μL SYBR Green Supermix, 0.3 μL primer (10 μM), 2 μL cDNA, and 2.4 μL RNase free Water. qPCR cycle parameters were set to predenaturation at 95 ℃ for 2 min, followed by denaturation at 95 ℃ for 10 s, primer annealing at 60 ℃ for 40 s with extension for 40 cycles, followed by denaturation. The relative expression of treated samples and control group was calculated according to the 2−∆∆CT method [60].
2.8. Statistical Analysis
The experimental data underwent a two-way analysis of variance (ANOVA). Each treatment had three technical replications and was presented in the form of mean ± standard deviation (SD). Tukey’s test assessment was applied to determine whether treatment means from repeated trials differed significantly at p < 0.05 value. The graphs and heat maps have been created using Microsoft EXCEL 2018, Origin Pro 2021, Omicsahre, and TBtools software [61].
3. Results
3.1. Effects of Salt Stress Treatments on Grapevine Rootstock Leaf Phenotypic Observation
The grapevine rootstocks were treated with a control group and salt stress treatments for 12 days. The plant morphological parameters are measured such as plant height, stem diameter, number of internodes, and number of leaves for 0, 6, and 12 days of the treatments. Both treatments affected the grapevine rootstock leaves. For instance, it was observed from the phenotypic leaf of the whole plant, that both grapevine rootstocks showed some degree of leaf etiolation, stunt growth, wilting, and salt stress symptoms, and even leaf abscission occurred after 12 days of the treatment groups. In the meantime, we can see that salinity stress had a stronger impact on “SO4” in comparison to “Beida” (Figure 1 A, B and C). The control treatment group showed greater plant height compared to the salt stress treatments. However, under salinity stress the initial plant height decreased significantly for both grapevine rootstocks (12.23%, 43.73%, and 66.60%) and (34.04%, 44.39%, and 116.23%). However, a greater loss of plant height is shown for “Beida” in comparison to “SO4” rootstock. Indicating that “SO4” is highly tolerant when compared with “Beida” under salinity stress.
Similarly, stem diameter, the number of internodes, and the number of leaves were significantly increased under CK for “SO4”, and “Beida” grapevine rootstocks in comparison to salt stress. Based on the analysis of phenotypic traits of both grapevine genotypes, we recommend that they are under severe salinity stress after 12 days of treatments, and ‘SO4’, had a stronger salt tolerance than ‘Beida’ genotypes (Supplementary Table S3).
3.2. Effects of Salt Stress on Photosynthetic Pigmsnt Content of Grapevine Rootstocks Leaves
Contents of chlorophyll and carotenoids are important pillars of plants, which keep the plant healthy and survive for better performance under salt stress. Therefore, in the present study, we measured the contents of chlorophyll a, chlorophyll b, total chlorophylls, and carotenoids for “SO4”, and “Beida” grapevine rootstocks under control and salt stress (Figure 2). Salt stress sustainably affected the pigment contents of grapevines as depicted by the linear decline in photosynthetic pigments and seedling attribution. Compared to the control, the photosynthetic pigments including, Chla, Chlb, and total chlorophyll indicators significantly decreased by (26.45%, 45.83%, 46.57%), and (25.78%, 85.11%, and 46.37%), respectively. However, the content of carotenoids was different between the two rootstocks under 0 days of the salt stress (26.95%, and 6.99%) for “SO4”, and “Beida” grapevine rootstocks (Figure 2A-D).
3.3. Effects of Salt Stress Treatments on Proline, Malondialdehyde, Protein, and Soluble Sugar Contents of Grapevine Rootstocks
To assess the osmoprotective potential of grapevine rootstocks after salt stress, we measured the levels of four biochemical traits including, foliar proline, malondialdehyde (MDA), proteins, and sugar contents, in the leaves of “SO4”, and “Beida” rootstocks. Our results showed that salt stress significantly increased the accumulation of foliar proline and MDA (115.78%, 97.23%, and 84.54%, 69.19%) in leaves of “SO4”, and “Beida” grapevine rootstocks, after 12 days of salt stress (Figure 3A-B). Though, the salt stress, negatively influenced the protein contents, and a significant reprobate (42.04%, and 36.36%) was noticed in leaves after 12 days of salt stress (Figure 3C). Taken together, the salt stress, positively increased the sugar contents, and a significant level (19.92%, and 12.19%) was observed in leaves of “SO4”, and “Beida” grapevine rootstocks after 12 days of salt stress (Figure 3D).
3.4. Effects of Salt Stress Treatments on Antioxidant Enzyme Activity on Grapevine Rootstocks
Salt stress triggered the activities of relative antioxidant enzymes to counter the production of excessive reactive oxygen species (ROS). The activity of “SO4”, and “Beida” grapevine rootstock plant defense enzymes superoxide dismutase (SOD), peroxide dismutase (POD), catalase (CAT), and ascorbate peroxidase (APX) is elaborated after exposure to the control and salt stress in grapevine rootstocks (Figure 4). Our result showed that the activity of antioxidant enzymes was elevated in salt stress as compared to the control group. The SOD, POD, CAT, and APX activities were significantly increased in salt stress by (38.33%, 138.35%, 95.19%, 661.71%), and, (58.67%, 81.96%, 121.12%, and 596.15%), respectively, as compared to control for “SO4”, and “Beida” grapevine rootstocks after 12 days (Figure 4A-D).
3.5. Morphological Indices, and Plant Growth Promotion Genes in Response to Salt Stress Treatment in the Grapevine Root
Under salt stress, root morphology, root weight, root length, total number of roots, root indicators, and growth promotion of genes in roots of ‘SO4’, and ‘Beida’ rootstocks were studied (Figure 5). For example, in comparison to a control group (CK), the salt stress inhibited the root system of both rootstocks characterized by shorter, fewer, and thinner roots, leading to evident inhibition of overall grapevine growth and root development. Additionally, it can be seen that under 100 mmol/L of NaCl, the ‘Beida’ variety showed more sensitivity as compared to ‘SO4’ rootstocks, which also vary in phenotype (Figure 5A and B). Notable reductions in root weight (18.0, 14.0%), root length (2.4, 1.1%), and total number of roots (72.0, 46.7%) were found for ‘SO4’, and ‘Beida’ rootstocks under salt stress in comparison to CK (Figure 5C-E). Salt stress showed a reduction level in the percentage of root surface area (RSA), root fresh weight (RFW), root volume (RV), and root dry weight (RDW) in “SO4” and “Beida” grapevine rootstocks (Figure 5). Under salinity stress, RSA (17.7 & 34.3%), RFW (36.11 & 33.04%), RV (64.2 & 63.6%), and RDW (58.06 & 44.64%) was significantly decreased in SO4 and Beida rootstock, when compared with control treatment (Figure 5F and G). Moreover, RSA and RFW had strong potential in both grapevine rootstocks followed by RV and RDW under treated groups. Overall, changes in the root morphological traits of two grapevine rootstocks suggest that it can alleviate the profiling of plant defense-related genes caused by salt stress.
Salt is the common abiotic stress in grapes, which showed different expression levels of FeSOD (superoxide dismutase) Cu/ZnSOD (superoxide dismutase), MnSOD (manganese superoxide dismutase), POD (peroxidase), CAT (catalase), APX ascorbate peroxidase, MDHAR (monodehydroascorbate reductase), and DHAR (dehydroascorbate peroxidase) can be involved in different pathways of plant growth promotion or tolerance levels between ‘SO4’ and ‘Beida’ rootstocks (Figure 5). Our results on plant growth-promoting genes in roots showed divergence expression between two grapevine rootstocks under salt stress. For instance, Cu/ZnSOD, MnSOD, and FeSOD genes were significantly up-regulated followed by POD, and MDHAR in ‘SO4’ rootstocks with salt level in comparison to a CK group (Figure 5H). Similarly, FeSOD and MnSOD genes were significantly up-regulated in ‘Beida’ rootstocks with salt levels as compared to a CK group (Figure 5I). Additionally, the transcript level of APX, CAT, DHAR and APX, MDHAR, POD, DHAR, CAT, and Cu/ZnSOD genes between ‘SO4’, and ‘Beida’ did not show a greater difference in their relative gene expression under salt stress. Overall, we observed that the adaptation level was higher in ‘SO4’ when compared with ‘Beida’ grapevine rootstock genotype roots under salt stress when compared to the CK group.
3.6. Transcriptome Analysis Revealed Potential Response Mechanims of Two Grapevine Rootstocks under Salt Stress
To investigate the transcriptomic differences during the salinity stress in two grapevine rootstocks, a present study produced a set of comprehensive transcriptome sequencing analyses. Three independent biological replications at each set point, which included 36 samples of grapevine rootstocks SO4 (salt resistant), and Beida (salt susceptible), were collected for RNA-seq study. A total of 427,491,928 & 427,730,639 clean reads and 128,247,578,400 & 128,319,191,700 clean bases were obtained for biological replicates. The average percentage of the Q2, Q3, and GC contents were 98.002, 93.649, 45.198%, and 97.947, 93.492, and 45.233%, (Supplementary Table S4). For differentially expressed genes (DEGs), a pairwise comparison was used to explain the up and down-regulation of gene expression. The number of DEGs was positively significant after salt stress treatments at different intervals. Based on volcano plots B0d_vs_D6d, B0d_vs_F12d, B0d_vs_H0d, D6d_vs_F12d, D6d_vs_J6d, J6d_vs_L12d, F12d_vs_L12d, H0d_vs_J6d, and H0d_vs_L12d showed that most genes were up-regulated after salt stress treatments (Figure 6). The red color indicates up-regulation, while the green color indicates downregulation of DEGs in SO4 and Beida grapevine rootstocks under salt stress.
3.7. Principal Component Analysis and Identification of Differentially Expressed Genes
The principal components analysis (PC1 and PC2) was performed in SO4, and Beida grapevine rootstocks in response to salt stress (Supplementary Figure S1A). Our results showed significant differences between the treated and non-treated groups, with slight differences and high reproducibility. Moreover, a potential difference was noticed between the results after 6 and 12 d of the salt stress treatments, respectively. Based on the Venn diagram, our results showed that the differentially expressed genes (DEGs) with general and unique variation between SO4 and Beida grapevine rootstocks as mentioned in (Figure 7A–C). At the initial stage of resistant and susceptibility levels, 2269 DEGs were shown in (Figure 7A), while 3138, 2128, and 2463 DEGs were unique and belonged to the B vs H (0d_0d), D vs J (6d_6d), and F vs L (12d_12d) between SO4 and Beida rootstock in response to salt stress. In addition, 1066 DEGs were shown in (Figure 7B) during their resistant levels, 1378, 1424, and 1418 DEGs belonged to the B vs D (0d_6d), B vs F (0d_12d), and D vs F (6d_12d) in SO4 grapevine. Furthermore, 1135 DEGs were shown in (Figure 7C) during the susceptible period, 1030, 2021, and 781 DEGs belonged to the H vs J (0d_6d), (0d_12d), and (6d_12d) in Beida under salt stress, respectively. Of these DEGs, 72 genes were found to produce genomic similarity in biological samples, on the other hand only 2935 DEGs were displayed to the particular levels, including 499 in the B vs H, 398 in the D vs J, 529 in the F vs L, 189 in the B vs D, 348 in the B vs F, 263 in the D vs F, 113 in the H vs J, 481 in the H vs L, and 115 in the J vs L phase (Figure 7D). In addition, Kyoto Encyclopedia of Gene and Genome (KEGG) annotations revealed that these 72 DEGs in the biological process pathways of tropane, piperidine, and pyridine alkaloid biosynthesis, metabolic pathways, photosynthesis, glyoxylate, dicarboxylate metabolism, glycerophospholipid metabolisms, pyruvate metabolism, isoflavonoid biosynthesis, linolic acid metabolism, biosynthesis of secondary metabolites, biosynthesis of unsaturated fatty acids, protein processing in the endoplasmic reticulum, carbon fixation in photosynthetic organisms, and carbon metabolim were found in the B vs H, D vs J, F vs L, B vs D, B vs F, D vs F, H vs J, H vs L, and J vs L group (Figure 7E). Notably (Figure 7A-C) showed that GO term analysis was mainly enriched in chloroplast stroma, non-membrane bounded organelle, cell periphery, macromolecular complex, protein self-association, protein binding, tissue development, response to hydrogen peroxide, regulation of meristem growth, cutin biosynthesis process, meristem growth, regulation of development growth, response to a toxic substance and cell morphogenesis involved in differentiation (Supplementary Figure S1B-D).
Furthermore, our results investigated KEGG enrichment among functionally expressed genes with K-orthology (KO) as mentioned in (Figure 8A). The results identified that these KO responses were mainly enriched in four pathways including 1) metabolism, 2) genetic information process, 3) environmental information process, and 4) organismal system. For instance, metabolism responses were mainly enriched in metabolic pathways, photosynthesis, glyoxylate and dicarboxylate metabolism, glycerophospholipid metabolism, pyruvate metabolism, isoflavonoid biosynthesis, biosynthesis of secondary metabolites, biosynthesis of unsaturated fatty acids, and porphyrin metabolism. Moreover, the genetic information process, environmental information process, and organismal systems only included single pathways, such as protein processing in the endoplasmic reticulum, plant hormone signal transduction, and circadian rhythm – plant (Figure 8B).
3.8. Interpretation of the Coexpression by WGCNA Analysis and Identification of Module Involved in Two Grapevine Rootstocks Under Salt Stress
The WGCNA webtool was applied to calculate the weight values to make the network verify the principle of scale-free network alignment. The change in average gene connectivity under various power values was computed (Figure 9A, right side), and the analysis parameter was chosen to be the minimal power value (b = 8) when the correlation coefficient reached the platform period (Figure 9A, left side). Consistent with the above results, the regulatory network of salt stress, we applied leaves of two grapevine genotypes, namely SO4 and Beida to analyze the correspondence between RNA seq data and recognized genes based on WGCNA, as shown in (Figure 9B). Next, we identified the Eigengene adjacency network in the SO4 and Beida grapevine rootstocks under salt stress (Figure 9C). We found that 24 modules were involved in treated groups and the number of DEGs in each module. For instance, MEpurple (81), MEsalmon (64), MEroyalblue (51), MEdarkred (50), MEturquoise (27), MEpink (106), MElightyellow (53), MEmagenta (85), MEtan (67), MEcyan (62), MEmidnightblue (62), MEred (120), MEdarkturquoise (27), MEbrown (144), MEgreen (126), MEdarkgreen (41), MEblue (163), MEgrey60 (57), MEblack (274), MEyellow (136), MElightcyan (56), MEgreenyellow (80), MElightgreen (54), MEdarkgrey (26), and MEgrey (1). Among them, MEblack was the most positive (upregulated) module color in SO4 grapevine, while it was negatively correlated with Beida grapevine rootstock under salt stress. While MEgrey was the most negative (downregulated) module in both rootstocks. However, the name of the module color, number of DEGs, and gene ID as shown in (Supplementary Table S5-6).
3.9. Expression Pattern of DEGs and Transcription Factors Families in Two Grapevine Rootstocks under Salt Stress
The analysis of the trend of RNA seq data was performed to visualize the adaptations of DEGs in the grapevine genotype during the tolerance levels. Our results show that all the DEGs were mapped to the nineteen dissimilar clusters from Profile 0 to Profile 19 based on P-value < 0.05 as the threshold, as mentioned in (Figure 10). We verified that the DEGs in Profile 2, Profile 3, Profile 4, and Profile 5 were consistent with the alterations trends of tolerance conditions. Profile 0, and Profile 1 described a negative trend with susceptibility conditions in grape rootstocks under salt stress (Figure 10A), respectively. It is worth noting that 3088, 2725, 2082, 1976, 1750, and 1423 DEGs were assembled into Profile 0, Profile 1, Profile 2, Profile 3, Profile 4, and Profile 5 in SO4 and Beida grapevine rootstocks under salt stress. The enrichment of KEGG pathway analysis of these DEGs into six different Profiles 0, 1, 2, 3, 4, and 5 expressed a different trend in the resistance and susceptibility pathways related genes, respectively. For instance, Profile 0 is generally abundance in tolerance pathways such as sesquiterpenoid and triterpenoid biosynthesis, plant-pathogen interaction, aminoacyl-tRNA biosynthesis, ribosomes, fatty acid metabolism, and protein processing in the endoplasmic reticulum. The genes in Profile 1, 2, 3, 4, and 5 were enriched in metabolic pathways, biosynthesis of secondary metabolites, phenylpropanoid biosynthesis, ubiquitin-mediated proteolysis, plant hormone, and signal transduction. Starch and sucrose metabolism (Figure 10B).
GO-based enrichment analysis of DEGs in Profile 0 to Profile 5 showed that most of the annotated genes were positively categorized into biological process (PB), cellular components (CC), and molecular function (MF) in grapevine rootstocks under salt stress (Supplementary Figure S2). We identified most annotated GO terms belonging to BF including cellular process, metabolic process, single-organism process, response to stimuli, biological regulation, developmental process, regulation of biological process, cellular component organization or biogenesis, multicellular organismal process, and reproductive process. For the CC trend, we investigated cell, cell part, organelle, membrane, organelle part, macromolecule complex, and membrane-enclosed lumen. On behalf of MF, we observed catalytic activity, binding, transporter activity, structural molecule activity, and nucleic acid binding transcription factor activity. Overall, it has been delineated that these resistant and susceptible genotypes have potential pathways under salt stress tolerance.
3.10. Transcription Factors in Grapevine Rootstocks under Salt Stress
Previous research finds a total of 738 TFs belonging to 26 families were identified to be regulated by salt treatment [62]. Similarly, our transcriptome analysis identified a total of 676 TFs belonging to 7 families that were identified in both grapevine genotypes under salt stress (Supplementary Figure S3). Moreover, these seven families mobilized with TFs including DEGs, such as bHLH, AP2, ERF, HSF, WRKY, MYB, and MYB-related had the most annotated TFs are 172, 133, 26, 73, 159, and 94 intolerant, and susceptible grapevine rootstocks under salt stress. Interestingly, the majority of expressed genes in the AP2, and HSF families were significantly down-regulated, whereas the majority of genes in the MYB, WRKY, and ERF families were up-regulated in both grapevine rootstock under salt stress.
3.11. Validation of RNA-Seq Data by RT-qPCR Analysis
To further understand the biological role and reliability of DEGs under salt stress by using sequencing data, we confirmed the gene expression levels that were annotated in SO4 and Beida grapevine rootstock leaves from 12 days of the salt stress treatment by RT-qPCR analysis (Supplementary Figure S4) using three independent biological replicates. In this study, we selected 10 DEGs: LOC104881068, LOC100263824, LOC100853815, LOC100250930, LOC100252516, LOC100266883, LOC100251452, LOC100259311, LOC104880396, and LOC100251750. These DEGs were involved in different biological pathways such as cellular process, regulation of the biological process, catalytic activity, pyruvate metabolism, stress tolerance, plant hormone signal transduction, transcription factors, protein self-association, chloroplast organization, plant-pathogen interaction, protein processing in endoplasmic reticulum, biosynthesis of secondary metabolites, and metabolic pathways. Our results expressed that the LOC104881068, LOC100250930, and LOC100251452 relative expression levels were significantly up-regulated in the SO4 grapevine after 12 d of treatment. While, LOC100259311, LOC104880396, and LOC100251750 relative expression levels were significantly down-regulated in SO4. Furthermore, the LOC100250930 gene was significantly up-regulated in the Beida grapevine after 12 d of treatment. Relative expression levels of LOC100853815, LOC100266883, LOC100251452, LOC100259311, LOC104880396, and LOC100251750 explained a down-regulated trend in Beida. We observed the relative expression level was highly elevated in SO4 as compared to Beida genotypes after 12 d of salt treatment. The gene expression data approved the modification in relative expression levels discovered by transcriptomic understanding, approving the RNA-Seq data. Thus, the vigorous kinship between transcriptomic data and RT-qPCR results verified that RAN-seq data could be used to establish the comparative gene expression in SO4 and Beida grapevine leaves under salt stress treatments.
4. Discussion
Salt stress is one of the most important abiotic stresses that severely disrupts viticultural systems and ecosystem biodiversity, leading to declined grapevine crop yield production, economic value, and tissue development [30]. Therefore, it is required to analyze the metabolic regulation network of salt stress and resilience in grapevine genotypes. In this study, we evaluated morphological, physiological, transcriptome, and biological responses in leaves of ‘SO4’, and ‘Beida’ rootstocks under salt stress. Based on the above findings, we interpreted that ‘SO4’ may have an excellent resilience to salt stress than ‘Beida’ rootstock. Alternatively, by comparing the differences in the differentially expressed genes, metabolic activities, biological regulation, transcription factors, module-related traits, and dynamic pathways between both rootstock genotypes, the regulatory factors that led to their salt-tolerant differences were disclosed. In addition, this study also discovered examples of salt stress responses involving, rootstock genotype-specific, and leaf tissue-specific variations.
Salt stress affects agronomic traits because of higher salinity conditions in plants [63]. It suppressed root growth, number of buds, root length, root vigor, root fresh weight, shoot length, total number of roots, biomass, chlorophyll pigments, and carotenoids in salt-susceptible (IR29). While maintaining plant height, several leaves, stem diameter, proline, protein, sugar accumulation, lower malondialdehyde, and antioxidant enzymes in the salt-tolerant (Pokkali) genotypes of rice [64]. In the present study, plant height, stem diameter, number of leaves, number of internodes, the proline, malondialdehyde, antioxidant enzymes, soluble sugars, and root indicators were elevated in salt-tolerant (SO4) as compared to salt-susceptible (Beida) grapevine rootstocks, except chlorophyll pigments. The inhibition of chlorophyll pigments might be due to environmental conditions and high salinity conditions [65].
Roots are the first plant organs to understand the physiochemical properties, biological activities, nutrient cycling, osmotic stress, and root quality under abiotic stress [66,67]. After sensing physiochemical assessment, a collection of metabolic responses to salt stress could be developed to regulate genetic variations and photosynthetic, phenotypical, and homeostatic mechanisms. Grapevine rootstocks play a vital role in root growth promotion, developmental processes, and signaling pathways under salt stress [68]. Studies revealed that rootstock and scion cultivar association had positive impacts on plant root growth promotion [69]. Plants focus more of their energy on surviving under harsh environmental conditions than on improving growth, some of the most incredible signs of abiotic stresses, are inhibition of root growth, decline in root morphology, variation in root formation, root growth reduction, oxidative damage, and growth restriction [70]. Likewise, the present finding showed that the increasing salinity stress positively decreased the grapevine root morphology, root weight, root length, and total number of roots between SO4 and Beida rootstocks. The decreased activity of the protein involved in the production of cellular components and increased activity of soluble sugar, proline quantification, malondialdehyde, and cell viability which accumulated the pigments concentrations under salt stress, may be the reason behind the causes of these losses for altered root system and developmental regulations [10,71,72].
All of the plant growth-promoting genes involved with antioxidant enzymes were involved in the regulation of metabolic activities of grapevine rootstock root tissue under salinity stress. Previous studies showed that growth promotion related to antioxidant enzymes (FeSOD, Cu/ZnSOD, MnSOD, POD, CAT, APX, MDHAR, and DHAR) genes were positively up-regulated [73]. Similarly, the current study showed that SO4 grapevine, MnSOD, FeSOD, Cu/ZnSOD, MDHAR, and POD were positively up-regulated with salinity stress. While, in Beida, only two genes were highly up-regulated such as FeSOD and MnSOD under salt stress when compared with a control group. Indicating that the plant growth-related genes involved with antioxidant enzymes were higher in SO4, followed by Beida grapevine rootstocks. Overall, the outcomes of the present investigations delineated that salt-stress responsive root growth of grapevine rootstock exhibited a phenomenal pattern of growth related to antioxidant enzymes. After 12 d of salt stress, SO4 grapevine rootstocks significantly down-regulated CAT and DHAR genes, while, Cu/ZnSOD, POD, CAT, APX, MDHAR, and DHAR genes in Beida grapevine rootstocks. Indicating that after a long duration of abiotic stress, rootstocks could be a better option for growing plants in such a harsh environment for deeper root morphological growth and development [74].
A pair-wise comparison of DEG analysis explained that salt-resistant grapevines had more DEGs than salt-susceptible grapevines, comparable to the results from salt and drought stress research for sustainable crop production [75,76]. The reason behind it could be the leaf differences such as resistant (grow broader) leaves and susceptible genotypes (grow thinner) leaves. Additionally, the leaf of resistant genotypes had more DEGS as compared to susceptible genotypes, referring that leaves are the primary plant traits engaged in the salt-stress response [77]. The metabolic pathway appeared to be significantly important, as our results found 72 DEGs in salt-stressed leaves of both genotypes, supporting different plant genotypes in response to salt stress [78,79]. Furthermore, these 72 DEGs were linked to the four types of stress response such as metabolic (carbon fixation in photosynthetic organisms), organismal system (circadian rhythm-plant), genetic information processing (protein processing in the endoplasmic reticulum), and environmental information processing (plant hormone-mediated signaling transduction), which is in agreement with previous findings under abiotic stress [10,80]. GO and KEGG analysis explained different salt adaptation pathways in both grapevine genotypes, for instance (alkaloid biosynthesis, biosynthesis of unsaturated fatty acids, glycerophospholipid biosynthesis, linoleic acid metabolism, porphyrin metabolism, carbon fixation in photosynthetic organisms, and plant hormone signal transduction). Indicating that biological signaling response mechanisms under salt stress resilience were conserved across different genotypes [75].
From RNA-seq data and gene coexpression network analysis, we discovered five modules (MEblack, MEblue, MEyellow, MEgreen, and MEgrey) were highly enriched with salinity tolerance in between grapevine rootstocks. Among them, MEblack was the most positive (upregulated) module color in SO4, while it was negatively correlated with Beida grapevine under salt stress. Among these gene coexpression networks, we found that the MEblack module involved the highest number of 274 DEGs. Our results are in agreement with previous findings that vary in stress tolerance and susceptible responses of plants between cultivars [10]. These findings are also consistent with the results of past studies that MEturquoise, MEgreen, MEblue, and MEpink modules were highly associated with salinity stress tolerance in Astragalus cicer L. [81]. In the scientific community at a worldwide level, each crop genotype has produced specific tolerance conditions during the genetic diversity and evolutionary perspective [82]. For instance, previous studies showed that module genes summarize the eigengene adjacency heatmap together with DEGs and were positively correlated with the expression profile of each module [83].
The different pattern analyses of DEGs based on their robust variations in gene expression approach have been illustrated. Moreover, our results showed a more comprehensive analysis of 6 profiles during the tolerance and susceptibility period of grapevine genotypes including Profile 0, Profile 1, Profile 2, Profile 3, Profile 4, and Profile 5. We find that Profile 2, Profile 3, Profile 4, and Profile 5 were significantly positively associated with salinity stress tolerance, while Profile 0, and Profile 1 were significantly negatively associated with susceptible responses. The consequence of KEGG annotation analysis encyclopedic explained metabolic pathways, plant-pathogen interaction, biosynthesis of secondary metabolites, sesquiterpenoid, and triterpenoid biosynthesis [84].
Upon salt, transcription factors (TF) including (bHLH, ERF, MYB, NAC, and bZIP) were involved in regulating stress responses in citrus rootstocks [85]. The TFs are essential for regulating plant growth and development under salt stress [86]. Previous research showed that TF i.e., bHLH, WRKY, GeBP, G2-like, and MYB were more highly mobilized in tolerant genotypes of grapevine [3], and NY (salt-stress sensitive) than in TC (salt-stress tolerant) as compared to susceptible genotypes under salt stress [75]. Similarly, our studies also show that differentially represented TFs are mostly present in SO4 as compared to the Beida genotypes. Overall, TF families could be most influential for abiotic stress adaptation in crops [87]. Our research provides a deeper understanding of how morphophysiological adaptations are intricately associated with genomic responses in grapevine seedlings exposed to salt stress.
5. Conclusions
In summary, we conducted comparative morphophysiological and transcriptome sequencing analysis to investigate the salt adaptation and resistance mechanism between tolerant and susceptible genotypes of grapevine. Results showed that the tolerance and coping mechanism of both genotypes after 12 days of salinity stress were significantly different even though both grapevine genotypes had varying resistance to saline environments. Our morphophysiological results suggest the potential of ‘SO4’ rootstock genotypes to survive in response to salt stress. Importantly, findings of the present research have provided various expression (4469 DEGs), module color, and transcription factors including bHLH, AP2, ERF, HSF, WRKY, MYB, and MYB-related that are involved in metabolic pathways, pyruvate metabolism, plant hormone signal transduction, biosynthesis of secondary metabolites, and osmotic adjustment can be used in molecular genetics and breeding salt-tolerant grapevine genotypes. Furthermore, to better investigate the link between saline condition and molecular research we suggest the use of metabolomics research. Identified DEGs in the current research will be functionally characterized which help to understand further regulatory mechanisms in response to salt-resistant grapevine rootstocks. Further, utilizing these DEGs in epigenetics and computational biology will help to develop salt-resistance grapevine genotypes under global climate change.
Supplementary Materials
The following supporting information can be downloaded at the website of this paper posted on Preprints.org.
Author Contributions
Conceptualization, A.H. and L.S.; methodology, L.W.; software, C.X.; validation, A.H, L.S. and L.W.; formal analysis, C.X.; investigation, A.H.; resources, J.C.; data curation, L.W.; writing—original draft preparation, A.H.; writing—review and editing, F.J.; visualization, Y.H.; supervision, F.J.; project administration, F.J.; funding acquisition, Y.H. All authors have read and agreed to the published version of the manuscript.
Funding
This project was funded by the National Natural Science Foundation of China (32272647), Jiangsu Provincial Key Research and Development Program (BE2022381), and Jiangsu Agricultural Industry Technology System (JATS [2023]414), Priority Academic Program Development of Jiangsu Higher Education Institutions (PADA). Bagui Young Scholars’ special fund of Guangxi, the Science and Technology Development Fund of Guangxi Academy of Agricultural Sciences.
Data Availability Statement
The data presented in this study are available on request from the corresponding author.
Conflicts of Interest
The authors declare no conflicts of interest.
References
- Tripathy, S.K.; Nayak, G.; Naik, J.; Patnaik, M.; Dash, A.; Sahoo, D.; Prusti, A.M. Signal Transduction in Plants under Drought and Salt Stress-An Overview. International Journal of Current Microbiology and Applied Sciences 2019, 8, 318–325. [Google Scholar] [CrossRef]
- Jin, J.; Wang, J.; Li, K.; Wang, S.; Qin, J.; Zhang, G.; Na, X.; Wang, X.; Bi, Y. Integrated Physiological, Transcriptomic, and Metabolomic Analyses Revealed Molecular Mechanism for Salt Resistance in Soybean Roots. International Journal of Molecular Sciences 2021, 22, 12848. [Google Scholar] [CrossRef]
- Zhao, F.; Zheng, T.; Liu, Z.; Fu, W.; Fang, J.J.P. Transcriptomic analysis elaborates the resistance mechanism of grapevine rootstocks against salt stress. 2022, 11, 1167.
- Rengasamy, P. World salinization with emphasis on Australia. Journal of experimental botany 2006, 57, 1017–1023. [Google Scholar] [CrossRef]
- Zhou, H.; Shi, H.; Yang, Y.; Feng, X.; Chen, X.; Xiao, F.; Lin, H.; Guo, Y.J.J.o.G.; Genomics. Insights into plant salt stress signaling and tolerance. 2024, 51, 16-34.
- Xiao, F.; Zhou, H.J.F.i.P.S. Plant salt response: Perception, signaling, and tolerance. 2023, 13, 1053699.
- Van Zelm, E.; Zhang, Y.; Testerink, C.J.A.r.o.p.b. Salt tolerance mechanisms of plants. 2020, 71, 403-433.
- Hasanuzzaman, M.; Bhuyan, M.B.; Zulfiqar, F.; Raza, A.; Mohsin, S.M.; Mahmud, J.A.; Fujita, M.; Fotopoulos, V.J.A. Reactive oxygen species and antioxidant defense in plants under abiotic stress: Revisiting the crucial role of a universal defense regulator. 2020, 9, 681.
- Liang, W.; Ma, X.; Wan, P.; Liu, L.J.B.; communications, b.r. Plant salt-tolerance mechanism: A review. 2018, 495, 286-291.
- Lin, Y.; Liu, S.; Fang, X.; Ren, Y.; You, Z.; Xia, J.; Hakeem, A.; Yang, Y.; Wang, L.; Fang, J.J.P.P. The physiology of drought stress in two grapevine cultivars: Photosynthesis, antioxidant system, and osmotic regulation responses. 2023, 175, e14005.
- Shan, C.; Liu, H.; Zhao, L.; Wang, X.J.B.p. Effects of exogenous hydrogen sulfide on the redox states of ascorbate and glutathione in maize leaves under salt stress. 2014, 58, 169-173.
- Kaya, C.; Tuna, A.; Yokaş, I.J.S.; efficiency, w.s.i.c. The role of plant hormones in plants under salinity stress. 2009, 45-50.
- Zhang, M.; Gao, C.; Xu, L.; Niu, H.; Liu, Q.; Huang, Y.; Lv, G.; Yang, H.; Li, M. Melatonin and Indole-3-Acetic Acid Synergistically Regulate Plant Growth and Stress Resistance. Cells 2022, 11. [Google Scholar] [CrossRef]
- Lin, L.; Wu, J.; Jiang, M.; Wang, Y.J.I.J.o.M.S. Plant mitogen-activated protein kinase cascades in environmental stresses. 2021, 22, 1543.
- Huang, X.-S.; Wang, W.; Zhang, Q.; Liu, J.-H.J.P.p. A basic helix-loop-helix transcription factor, PtrbHLH, of Poncirus trifoliata confers cold tolerance and modulates peroxidase-mediated scavenging of hydrogen peroxide. 2013, 162, 1178-1194.
- Guo, Q.; Li, X.; Niu, L.; Jameson, P.E.; Zhou, W.J.P.P. Transcription-associated metabolomic adjustments in maize occur during combined drought and cold stress. 2021, 186, 677-695.
- Prinsi, B.; Negri, A.S.; Failla, O.; Scienza, A.; Espen, L.J.B.p.b. Root proteomic and metabolic analyses reveal specific responses to drought stress in differently tolerant grapevine rootstocks. 2018, 18, 1-28.
- Xia, J.; Wang, Z.; Liu, S.; Fang, X.; Hakeem, A.; Fang, J.; Shangguan, L.J.P.; Plants, M.B.o. VvATG6 contributes to copper stress tolerance by enhancing the antioxidant ability in transgenic grape calli. 2024, 30, 137-152.
- Hanana, M.; Hamrouni, L.; Hamed, K.; Abdelly, C.J.J.P.B.P. Influence of the rootstock/scion combination on the grapevines behavior under salt stress. 2015, 3, 1000154.
- Wang, P.; Zhao, F.; Zheng, T.; Zhongjie, L.; Ji, X.; Zhang, Z.; Pervaiz, T.; Shangguan, L.; Fang, J. Whole-genome re-sequencing, diversity analysis, and stress-resistance analysis of 77 grape rootstock genotypes. Frontiers in Plant Science 2023, 14. [Google Scholar] [CrossRef] [PubMed]
- Viala, P.; Ravaz, L. American vines: their adaptation, culture, grafting and propagation; Government Printer, South Africa: 1901.
- Wang, F.-P.; Zhao, P.-P.; Zhang, L.; Zhai, H.; Du, Y.-P.J.H.R. Functional characterization of WRKY46 in grape and its putative role in the interaction between grape and phylloxera (Daktulosphaira vitifoliae). 2019, 6.
- Ferris, H.; Zheng, L.; Walker, M.J.J.o.n. Resistance of grape rootstocks to plant-parasitic nematodes. 2012, 44, 377.
- Lowe, K.; Walker, M.J.T.; Genetics, A. Genetic linkage map of the interspecific grape rootstock cross Ramsey (Vitis champinii)× Riparia Gloire (Vitis riparia). 2006, 112, 1582-1592.
- Reisch, B.I.; Owens, C.L.; Cousins, P.S.J.F.b. Grape. 2012, 225-262.
- Riaz, S.; Pap, D.; Uretsky, J.; Laucou, V.; Boursiquot, J.-M.; Kocsis, L.; Andrew Walker, M.J.T.; Genetics, A. Genetic diversity and parentage analysis of grape rootstocks. 2019, 132, 1847-1860.
- Jellouli, N.; Jouira, H.B.; Skouri, H.; Ghorbel, A.; Gourgouri, A.; Mliki, A.J.J.o.p.p. Proteomic analysis of Tunisian grapevine cultivar Razegui under salt stress. 2008, 165, 471-481.
- Tillett, R.L.; Ergül, A.; Albion, R.L.; Schlauch, K.A.; Cramer, G.R.; Cushman, J.C.J.B.p.b. Identification of tissue-specific, abiotic stress-responsive gene expression patterns in wine grape (Vitis viniferaL.) based on curation and mining of large-scale EST data sets. 2011, 11, 1–23. [Google Scholar] [CrossRef] [PubMed]
- Wen, Y.; Wang, X.; Xiao, S.; Wang, Y.J.P. Ectopic expression of VpALDH2B4, a novel aldehyde dehydrogenase gene from Chinese wild grapevine (Vitis pseudoreticulata), enhances resistance to mildew pathogens and salt stress in Arabidopsis. 2012, 236, 525-539.
- Zhao, F.; Zheng, T.; Zhongjie, L.; Fu, W.; Fang, J. Transcriptomic Analysis Elaborates the Resistance Mechanism of Grapevine Rootstocks against Salt Stress. Plants 2022, 11, 1167. [Google Scholar] [CrossRef]
- Alizadeh, M.; Singh, S.; Patel, V.; Bhattacharya, R.; Yadav, B.J.B.P. In vitro responses of grape rootstocks to NaCl. 2010, 54, 381-385.
- Suarez, D.L.; Celis, N.; Anderson, R.G.; Sandhu, D.J.A. Grape rootstock response to salinity, water and combined salinity and water stresses. 2019, 9, 321.
- Walker, R.R.; Blackmore, D.H.; Clingeleffer, P.R.; Tarr, C.J.A.j.o.g.; research, w. Rootstock effects on salt tolerance of irrigated field-grown grapevines (Vitis vinifera L. cv. Sultana). 3. Fresh fruit composition and dried grape quality. 2007, 13, 130-141.
- WALKER, R.R.; BLACKMORE, D.H.; CLINGELEFFER, P.R.; CORRELL, R.L.J.A.J.o.G.; Research, W. Rootstock effects on salt tolerance of irrigated field-grown grapevines (Vitis vinifera L. cv. Sultana) 2. Ion concentrations in leaves and juice. 2004, 10, 90–99. [Google Scholar] [CrossRef]
- WALKER, R.R.; BLACKMORE, D.H.; CLINGELEFFER, P.R.; CORRELL, R.L.J.A.J.o.G.; Research, W. Rootstock effects on salt tolerance of irrigated field-grown grapevines (Vitis vinifera L. cv. Sultana).: 1. Yield and vigour inter-relationships. 2002, 8, 3–14. [Google Scholar] [CrossRef]
- Upadhyay, A.; Upadhyay, A.; Bhirangi, R.J.B.p. Expression of Na+/H+ antiporter gene in response to water and salinity stress in grapevine rootstocks. 2012, 56, 762-766.
- Mehanna, H.; Fayed, T.; Rashedy, A.J.J.H.S.; Plants, O. Response of two grapevine rootstocks to some salt tolerance treatments under saline water conditions. 2010, 2, 93-106.
- Wooldridge, J.; Olivier, M.J.S.A.J.o.E.; Viticulture. Effects of weathered soil parent materials on Merlot grapevines grafted onto 110 Richter and 101-14Mgt rootstocks. 2014, 35, 59-67.
- Gan, J.; Qiu, Y.; Tao, Y.; Zhang, L.; Okita, T.; Yan, Y.; Tian, L. RNA-seq analysis reveals transcriptome reprogramming and alternative splicing during early response to salt stress in tomato root. Frontiers in Plant Science 2024, 15. [Google Scholar] [CrossRef] [PubMed]
- Fang, X.; Mo, J.; Zhou, H.; Shen, X.; Xie, Y.; Xu, J.; Yang, S. Comparative transcriptome analysis of gene responses of salt-tolerant and salt-sensitive rice cultivars to salt stress. Scientific Reports 2023, 13. [Google Scholar] [CrossRef] [PubMed]
- Li, X.L.; Li, M.; Zhou, 周.; Yang, Y.; Wei, Q.; Zhang, J. Transcriptome analysis provides insights into the stress response crosstalk in apple (Malus × domestica) subjected to drought, cold and high salinity. Scientific Reports 2019, 9. [CrossRef]
- Bao, Y.; Chen, C.; Fu, L.; Chen, Y. Comparative transcriptome analysis of Rosa chinensis ‘Old Blush’ provides insights into the crucial factors and signaling pathways in salt stress response. Agronomy Journal 2021, 113. [Google Scholar] [CrossRef]
- Liu, C.; Zhao, Y.; Zhao, X.; Wang, J.; gu, M.; Yuan, Z. Transcriptomic Profiling of Pomegranate Provides Insights into Salt Tolerance. Agronomy 2019, 10, 44. [Google Scholar] [CrossRef]
- Yousefirad, S.; Soltanloo, H.; Ramezanpour, S.; Nezhad, K.; Shariati, V. The RNA-seq transcriptomic analysis reveals genes mediating salt tolerance through rapid triggering of ion transporters in a mutant barley. PLOS ONE 2020, 15, e0229513. [Google Scholar] [CrossRef]
- Guan, L.; Muhammad Salman, H.; Khan, N.; Nasim, M.; Jiu, S.; Fiaz, M.; Zhu, X.; Zhang, K.; Fang, J. Transcriptome Sequence Analysis Elaborates a Complex Defensive Mechanism of Grapevine (Vitis vinifera L.) in Response to Salt Stress. International Journal of Molecular Sciences 2018, 19. [Google Scholar] [CrossRef]
- Shafqat, W.; Jaskani, M.J.; Maqbool, R.; Khan, A.S.; Ali, Z.J.I.J.A.B. Evaluation of citrus rootstocks against drought, heat and their combined stress based on growth and photosynthetic pigments. 2019, 22, 1001-1009.
- Du, Z.; Bramlage, W. Modified thiobarbituric acid assay for measuring lipid oxidation in sugar-rich plant tissue extracts. Journal of Agricultural and Food Chemistry - J AGR FOOD CHEM 1992, 40. [Google Scholar] [CrossRef]
- Wellburn, A. The Spectral Determination of Chlorophylls a and b, as well as Total Carotenoids, Using Various Solvents with Spectrophotometers of Different Resolution *. Journal of Plant Physiology 1994, 144, 307–313. [Google Scholar] [CrossRef]
- Bizzi, C.; Flores, É.; Nóbrega, J.; Souza da Silva, J.; Schmidt, L.; Mortari, S. Evaluation of a digestion procedure based on the use of diluted nitric acid solutions and H2O2 for the multielement determination of whole milk powder and bovine liver by ICP-based techniques. Journal of Analytical Atomic Spectrometry 2014, 29, 332. [Google Scholar] [CrossRef]
- Giannopolitis, C.; Ries, S. Superoxide Dismutases: I. Occurrence in Higher Plants. Plant physiology 1977, 59, 309–314. [Google Scholar] [CrossRef]
- Guo, T.-R.; Zhang, G.P.; Zhou, M.; Wu, F.; Chen, J. Effects of aluminum and cadmium toxicity on growth and antioxidant enzyme activities of two barley genotypes with different Al resistance. Plant and Soil 2004, 258, 241–248. [Google Scholar] [CrossRef]
- Durner, J.; Klessig, D. Salicylic Acid Is a Modulator of Tobacco and Mammalian Catalases. The Journal of biological chemistry 1996, 271, 28492–28501. [Google Scholar] [CrossRef] [PubMed]
- Wang, K.; Jiang, Y. Waterlogging Tolerance of Kentucky Bluegrass Cultivars. HortScience 2007, 42, 386–390. [Google Scholar] [CrossRef]
- Dong, T.; Zhang, P.; Hakeem, A.; Liu, Z.; Su, L.; Ren, Y.; Pei, D.; Xuan, X.; Li, S.; Fang, J.J.E.; et al. Integrated transcriptome and metabolome analysis reveals the physiological and molecular mechanisms of grape seedlings in response to red, green, blue, and white LED light qualities. 2023, 213, 105441.
- Wang, L.; Feng, Z.; Wang, X.; Wang, X.; Zhang, X.J.B. DEGseq: an R package for identifying differentially expressed genes from RNA-seq data. 2010, 26, 136-138.
- Kanehisa, M.; Goto, S.J.N.a.r. KEGG: kyoto encyclopedia of genes and genomes. 2000, 28, 27-30.
- Langfelder, P.; Wgcna, S.H.J.D.h.d.o.-.-.-. An R package for weighted correlation network analysis., 2008, 9, 559.
- Ge, M.; Sadeghnezhad, E.; Hakeem, A.; Zhong, R.; Wang, P.; Shangguan, L.; Fang, J.J.S.H. Integrated transcriptomic and metabolic analyses unveil anthocyanins biosynthesis metabolism in three different color cultivars of grape (Vitis vinifera l.). 2022, 305, 111418. [Google Scholar] [CrossRef]
- Dong, T.; Hao, T.; Hakeem, A.; Ren, Y.; Fang, J.J.F.C. Synergistic variation in abscisic acid and brassinolide treatment signaling component alleviates fruit quality of ‘Shine Muscat’grape during cold storage. 2024, 141584.
- Livak, K.J.; Schmittgen, T.D.J.m. Analysis of relative gene expression data using real-time quantitative PCR and the 2− ΔΔCT method. 2001, 25, 402-408.
- Chen, C.; Chen, H.; Zhang, Y.; Thomas, H.R.; Frank, M.H.; He, Y.; Xia, R.J.M.p. TBtools: an integrative toolkit developed for interactive analyses of big biological data. 2020, 13, 1194-1202.
- Gan, J.; Qiu, Y.; Tao, Y.; Zhang, L.; Okita, T.W.; Yan, Y.; Tian, L.J.F.i.P.S. RNA-seq analysis reveals transcriptome reprogramming and alternative splicing during early response to salt stress in tomato root. 2024, 15, 1394223.
- Soltabayeva, A.; Ongaltay, A.; Omondi, J.O.; Srivastava, S.J.P. Morphological, physiological and molecular markers for salt-stressed plants. 2021, 10, 243.
- Alshiekheid, M.A.; Dwiningsih, Y.; Alkahtani, J. Analysis of morphological, physiological, and biochemical traits of salt stress tolerance in Asian rice cultivars at different stages. 2023.
- Shin, Y.K.; Bhandari, S.R.; Jo, J.S.; Song, J.W.; Cho, M.C.; Yang, E.Y.; Lee, J.G.J.A. Response to salt stress in lettuce: Changes in chlorophyll fluorescence parameters, phytochemical contents, and antioxidant activities. 2020, 10, 1627.
- Zou, Y.; Zhang, Y.; Testerink, C. Root dynamic growth strategies in response to salinity. Plant, Cell & Environment 2021, 45. [Google Scholar] [CrossRef]
- Maciel Henschel, J.; Dias, T.; de Moura, V.; Silva, A.; Lopes, A.; da Silva Gomes, D.; Araujo, D.; Silva, J.; Cruz, O.; Batista, D. Hydrogen peroxide and salt stress in radish: effects on growth, physiology, and root quality. Physiology and Molecular Biology of Plants 2024. [Google Scholar] [CrossRef]
- Abdalazez, F.; El-Gazzar, A.; Mansour, N.; Samaan, M. Biochemical and Physiological Responses of Some Grape Rootstocks to Salt Stress. Egyptian Journal of Horticulture 2023, 51, 117–136. [Google Scholar] [CrossRef]
- Tandonnet, J.-P.; Cookson, S.; Vivin, P.; Ollat, N. Scion genotype biomass allocation and root development in grafted grapevine. Australian Journal of Grape and Wine Research 2010, 16, 290–300. [Google Scholar] [CrossRef]
- Altaf, M.; Shahid, R.; Ren, M.-X.; Altaf, M.; Khan, L.; Shahid, S.; Shah Jahan, M. Melatonin alleviates salt damage in tomato seedling: A root architecture system, photosynthetic capacity, ion homeostasis, and antioxidant enzymes analysis. Scientia Horticulturae 2021, 285, 110145. [Google Scholar] [CrossRef]
- Khan, T.; Saleem, M.; Fariduddin, Q. Melatonin Influences Stomatal Behavior, Root Morphology, Cell Viability, Photosynthetic Responses, Fruit Yield, and Fruit Quality of Tomato Plants Exposed to Salt Stress. Journal of Plant Growth Regulation 2022, 42, 1–25. [Google Scholar] [CrossRef]
- yıldırım, K.; Yağci, A.; Sucu, S.; Tunç, S. Responses of grapevine rootstocks to drought through altered root system architecture and root transcriptomic regulations. Plant Physiology and Biochemistry 2018, 127. [Google Scholar] [CrossRef] [PubMed]
- Muhammad Salman, H.; Jogaiah, S.; Pervaiz, T.; Zhao, Y.; Khan, N.; Fang, J. Physiological and Transcriptional Variations Inducing Complex Adaptive Mechanisms in Grapevine by Salt Stress. Environmental and Experimental Botany 2019. [Google Scholar] [CrossRef]
- Wang, X.; Yan, L.; Wang, B.; Qian, Y.; Wang, Z.; Wu, W. Comparative Proteomic Analysis of Grapevine Rootstock in Response to Waterlogging Stress. Frontiers in Plant Science 2021, 12, 749184. [Google Scholar] [CrossRef]
- Yang, Z.; Lu, R.; Dai, Z.; Yan, A.; Tang, Q.; Cheng, C.; Xu, Y.; Yang, W.; Su, J.J.G. Salt-stress response mechanisms using de novo transcriptome sequencing of salt-tolerant and sensitive Corchorus spp. genotypes. 2017, 8, 226. [Google Scholar] [CrossRef]
- Fracasso, A.; Trindade, L.M.; Amaducci, S.J.B.P.B. Drought stress tolerance strategies revealed by RNA-Seq in two sorghum genotypes with contrasting WUE. 2016, 16, 1-18.
- Muthusamy, M.; Uma, S.; Backiyarani, S.; Saraswathi, M.S.; Chandrasekar, A.J.F.i.p.s. Transcriptomic changes of drought-tolerant and sensitive banana cultivars exposed to drought stress. 2016, 7, 1609.
- Zhang, F.; Zhu, G.; Du, L.; Shang, X.; Cheng, C.; Yang, B.; Hu, Y.; Cai, C.; Guo, W.J.S.r. Genetic regulation of salt stress tolerance revealed by RNA-Seq in cotton diploid wild species, Gossypium davidsonii. 2016, 6, 20582.
- Dalal, M.; Inupakutika, M.J.M.b. Transcriptional regulation of ABA core signaling component genes in sorghum (Sorghum bicolor L. Moench). 2014, 34, 1517–1525. [Google Scholar] [CrossRef]
- Ojosnegros, S.; Alvarez, J.M.; Grossmann, J.; Gagliardini, V.; Quintanilla, L.G.; Grossniklaus, U.; Fernández, H.J.I.J.o.M.S. Proteome and interactome linked to metabolism, genetic information processing, and abiotic stress in gametophytes of two woodferns. 2023, 24, 12429.
- Zhang, Y.; Dong, W.; Ma, H.; Zhao, C.; Ma, F.; Wang, Y.; Zheng, X.; Jin, M. Comparative transcriptome and coexpression network analysis revealed the regulatory mechanism of Astragalus cicer L. in response to salt stress. BMC Plant Biology 2024, 24, 817. [Google Scholar] [CrossRef]
- Cortes, A. Abiotic Stress Tolerance Boosted by Genetic Diversity in Plants. International Journal of Molecular Sciences 2024, 25, 5367. [Google Scholar] [CrossRef]
- Zeng, Z.; Zhang, S.; Li, W.; Chen, B.; Li, W. Gene-coexpression network analysis identifies specific modules and hub genes related to cold stress in rice. BMC Genomics 2022, 23, 251. [Google Scholar] [CrossRef]
- Li, P.; Cao, W.; Fang, H.; Xu, S.; Yin, S.; Zhang, Y.; Lin, D.; Wang, J.; Chen, Y.; Xu, C.J.F.i.p.s. Transcriptomic profiling of the maize (Zea mays L.) leaf response to abiotic stresses at the seedling stage. 2017, 8, 290.
- Song, X.; Duan, Y.-Y.; Tan, F.-Q.; Ren, J.; Cao, H.-X.; Xie, K.-D.; Wu, X.-M.; Guo, W.-W.J.S.H. Comparative transcriptome analysis of salt tolerance of roots in diploid and autotetraploid citrus rootstock (C. junos cv. Ziyang xiangcheng) and identification of salt tolerance-related genes. 2023, 317, 112083. [Google Scholar]
- Hussain, Q.; Asim, M.; Zhang, R.; Khan, R.; Farooq, S.; Wu, J.J.B. Transcription factors interact with ABA through gene expression and signaling pathways to mitigate drought and salinity stress. 2021, 11, 1159.
- Joshi, R.; Wani, S.H.; Singh, B.; Bohra, A.; Dar, Z.A.; Lone, A.A.; Pareek, A.; Singla-Pareek, S.L.J.F.i.p.s. Transcription factors and plants response to drought stress: current understanding and future directions. 2016, 7, 1029.
Figure 1.
Impact of salt stress on phenotypic grapevine rootstock leaves. (A) SO4, (B) Beida, and (C) plant height of grapevine rootstock grown for 12 days under control group and salt stress. Values are means ± SD of three biological replicates. Alphabet letter: Significant differences compared with the control (normal water-treated) sample at p < 0.05, using Tukey’s test at a p-value ≤ 0.05. Error bars demonstrate the standard deviation based on three biological replicates.
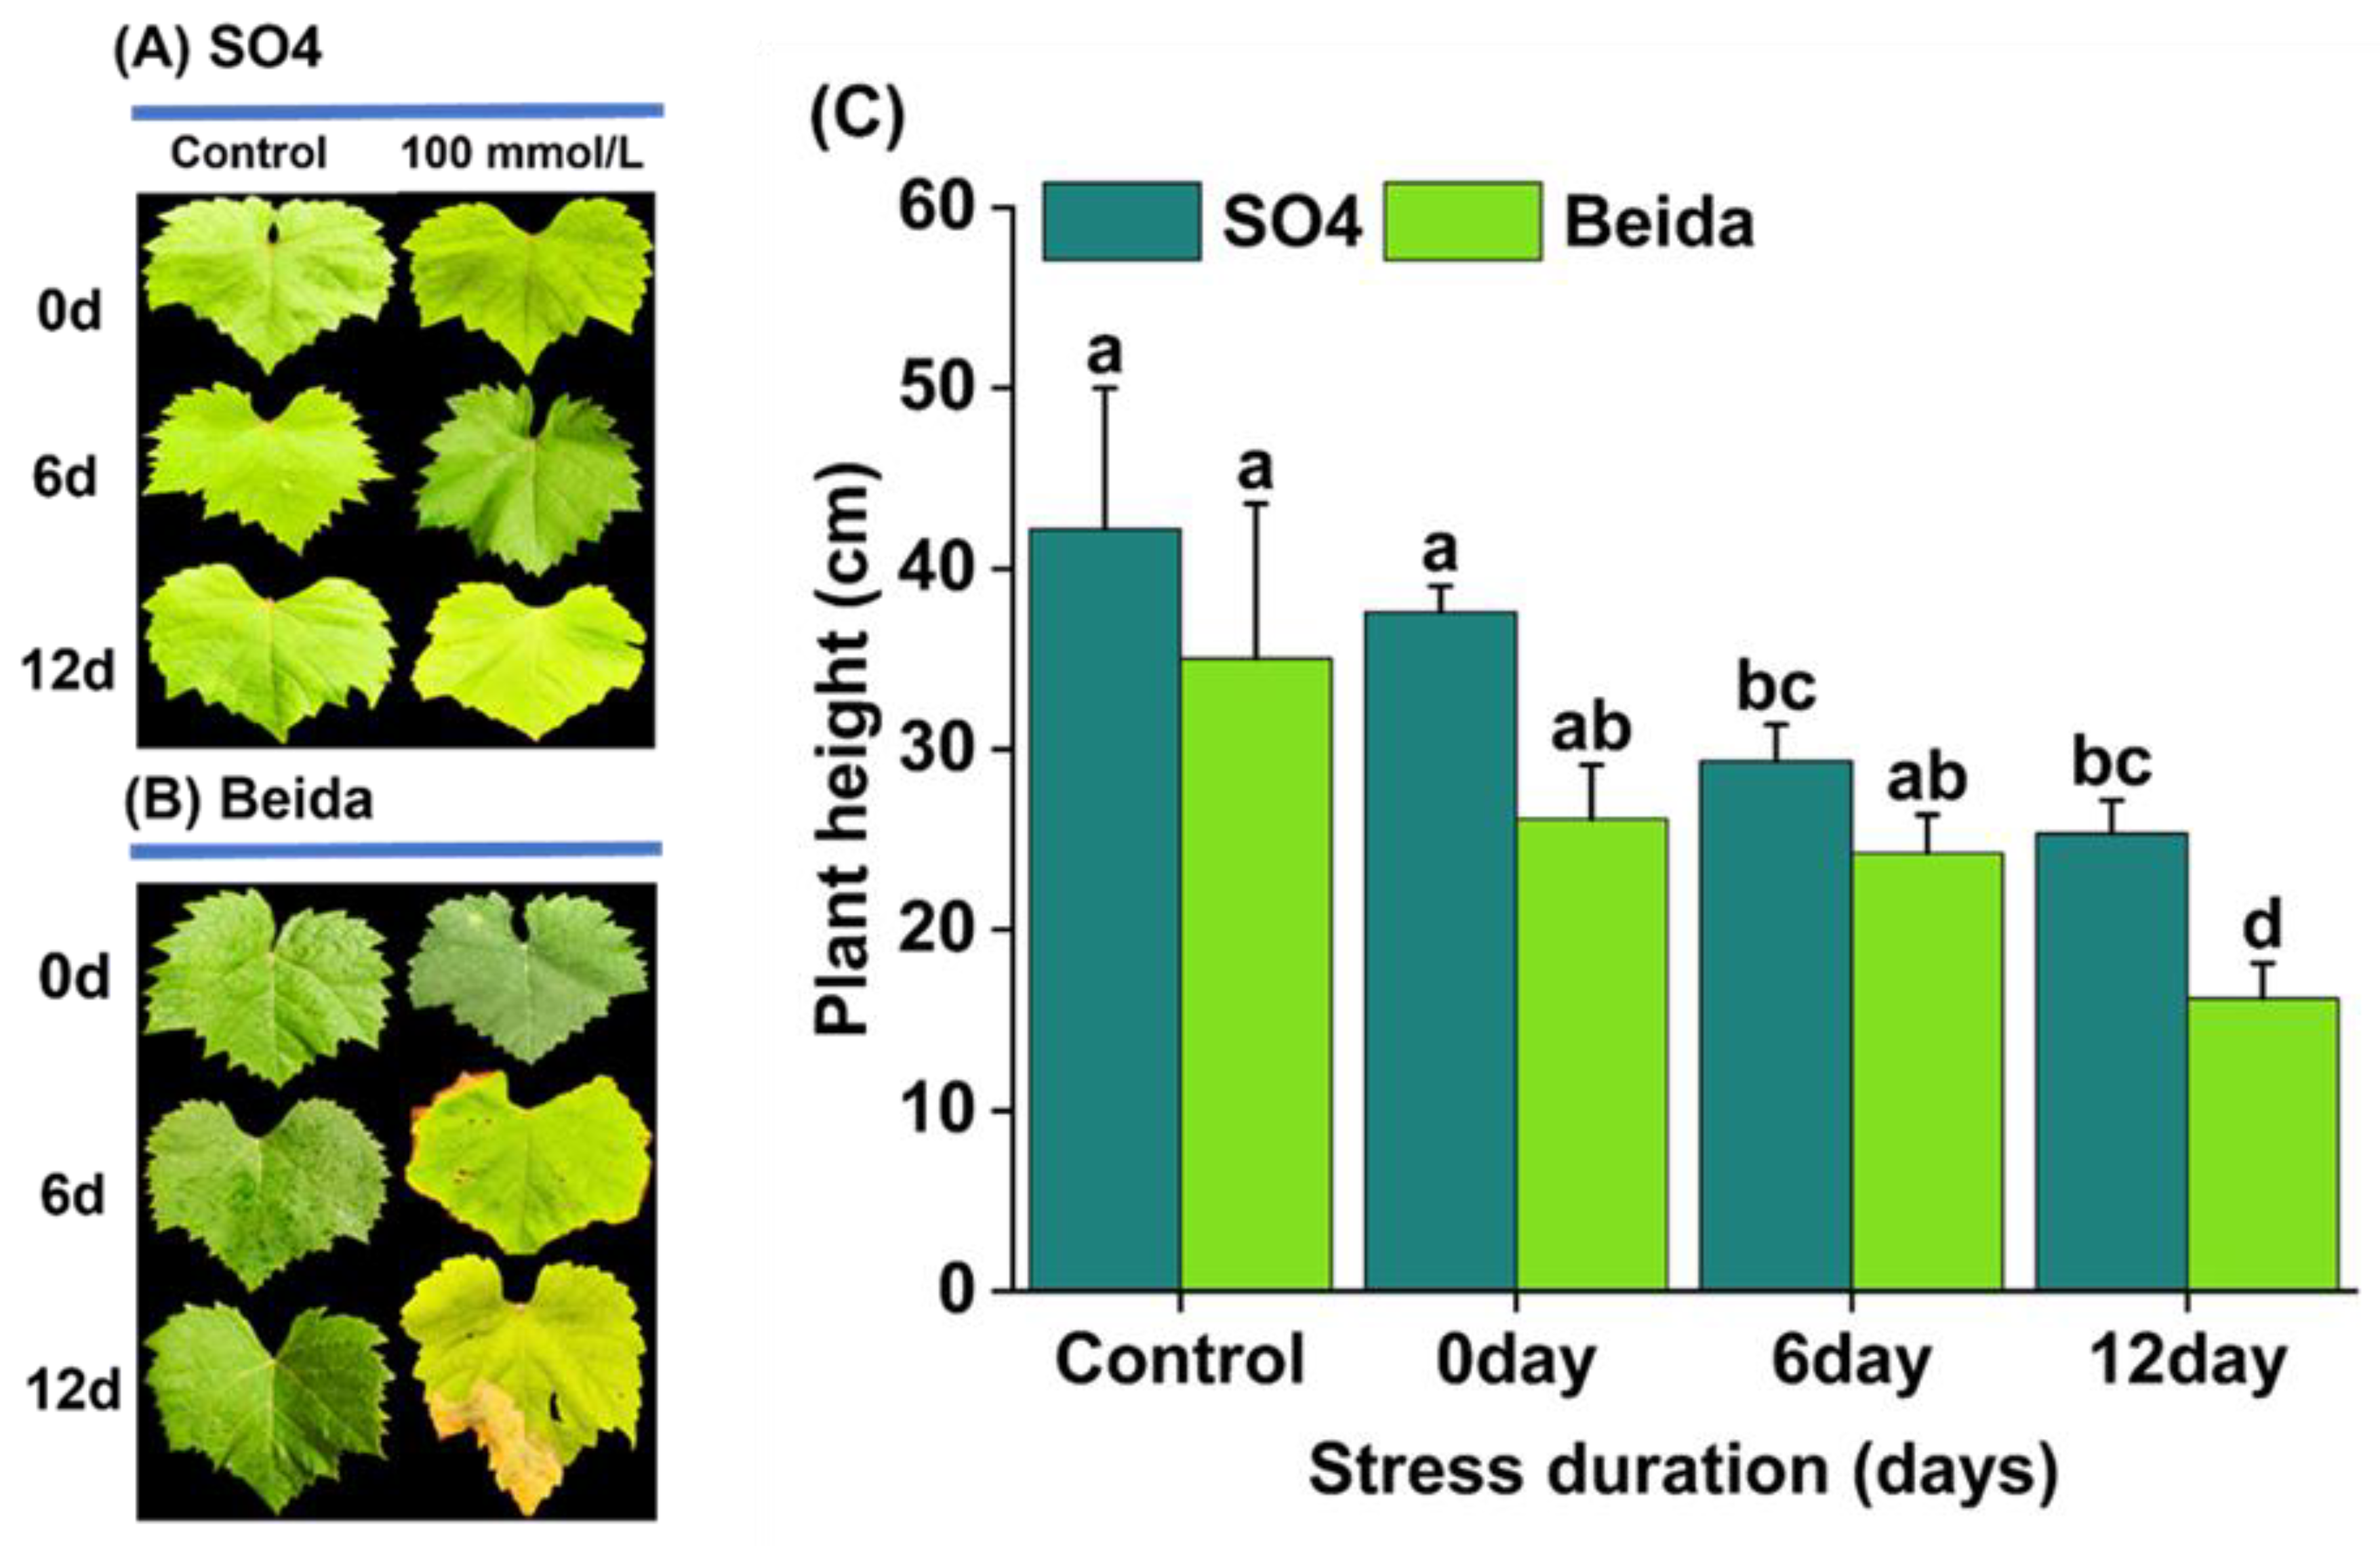
Figure 2.
Impact of salt stress on pigment contents (A) Chla, (B) Chlb, (C) Total chl, and (D) carotenoids in “SO4”, and “Beida” grapevine rootstocks leaves grown for 12 days under control group and salt stress. Values are means ± SD of three biological replicates. Alphabet letter: Significant differences compared with the control (normal water-treated) sample at p < 0.05, using Tukey’s test at a p-value ≤ 0.05. Error bars demonstrate the standard deviation based on three biological replicates.
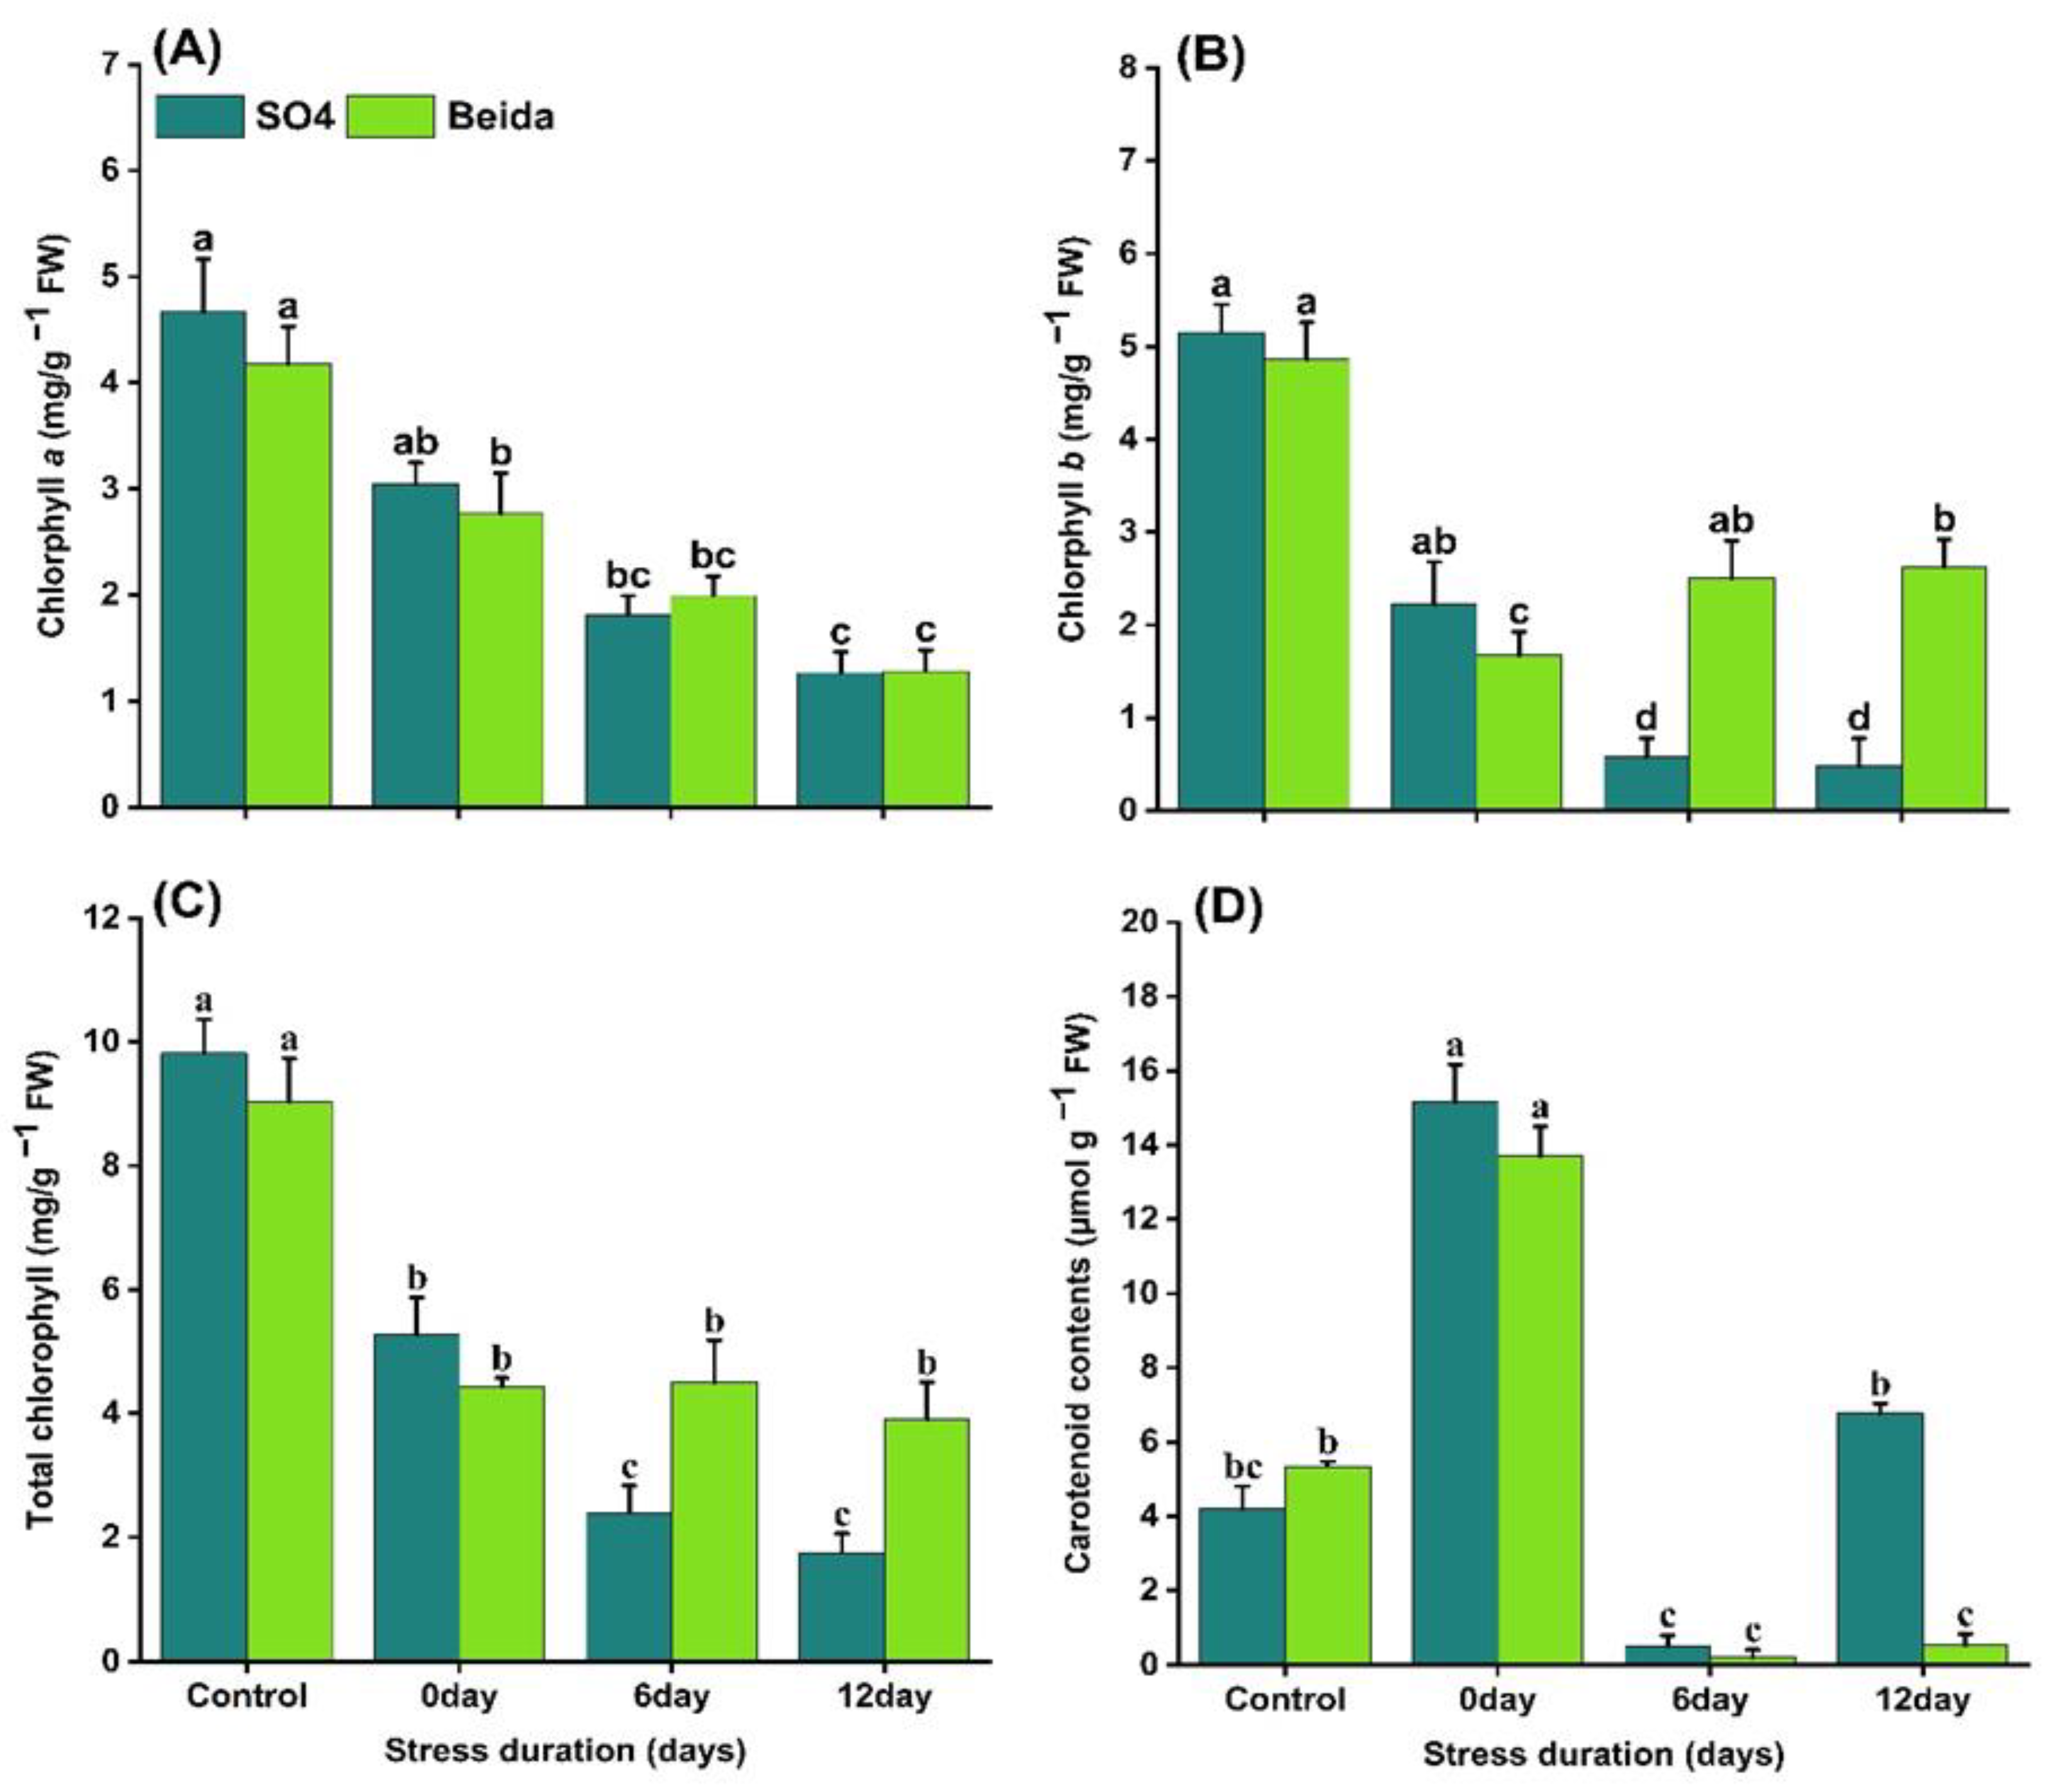
Figure 3.
Impacts of salt stress on biochemical parameters. (A) Proline, (B) malondialdehyde (MDA), (C) protein, and (D), sugar contents in “SO4”, and “Beida” grapevine rootstocks leaves grown for 12 days under control group and salt stress. Values are means ± SD of three biological replicates. Alphabet letter: Significant differences compared with the control (normal water-treated) sample at p < 0.05, using Tukey’s test at a p-value ≤ 0.05. Error bars demonstate the standard deviation based on three biological replicates.
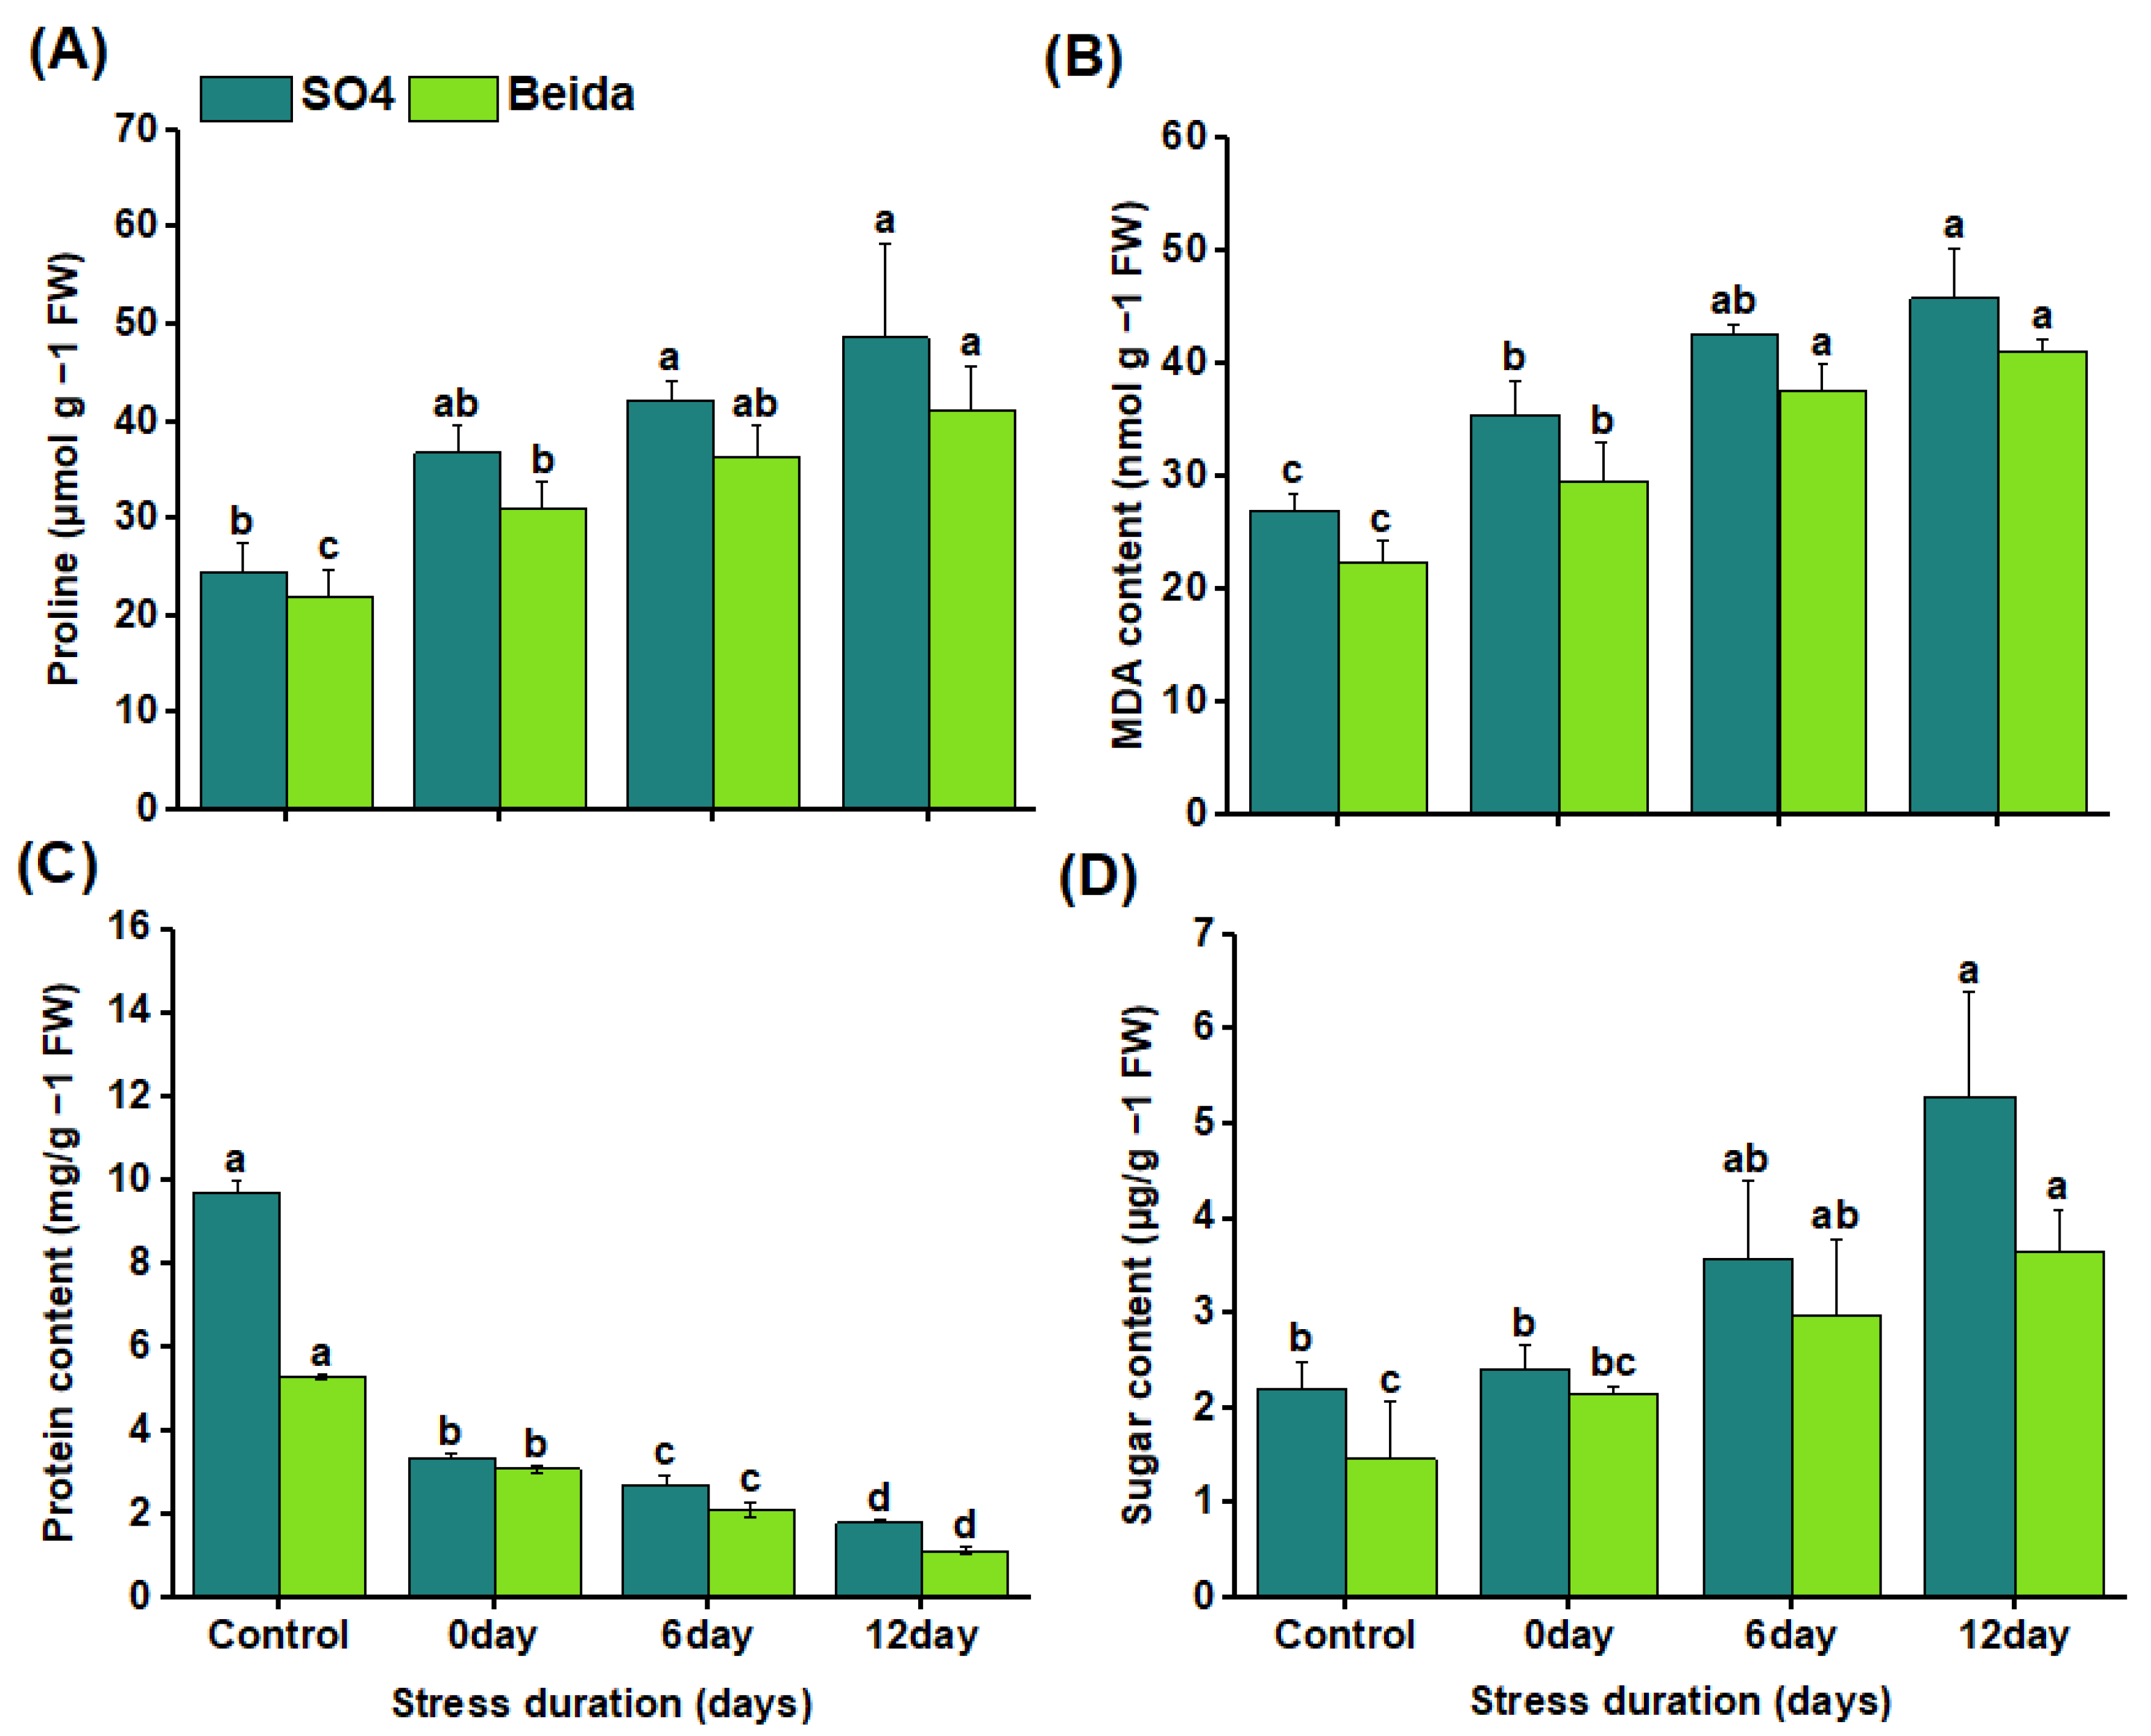
Figure 4.
The effect of salt stress on antioxidant enzymes. (A) SOD, (B) POD, (C) CAT, and (D) APX, in “SO4”, and “Beida” grapevine rootstock leaves grown for 12 days under a control group and salt stress. Values are means ± SD of three biological replicates. Alphabet letter: Significant differences compared with the control (normal water-treated) sample at p < 0.05, using Tukey’s test at a p-value ≤ 0.05. Error bars demonstrate the standard deviation based on three biological replicates.
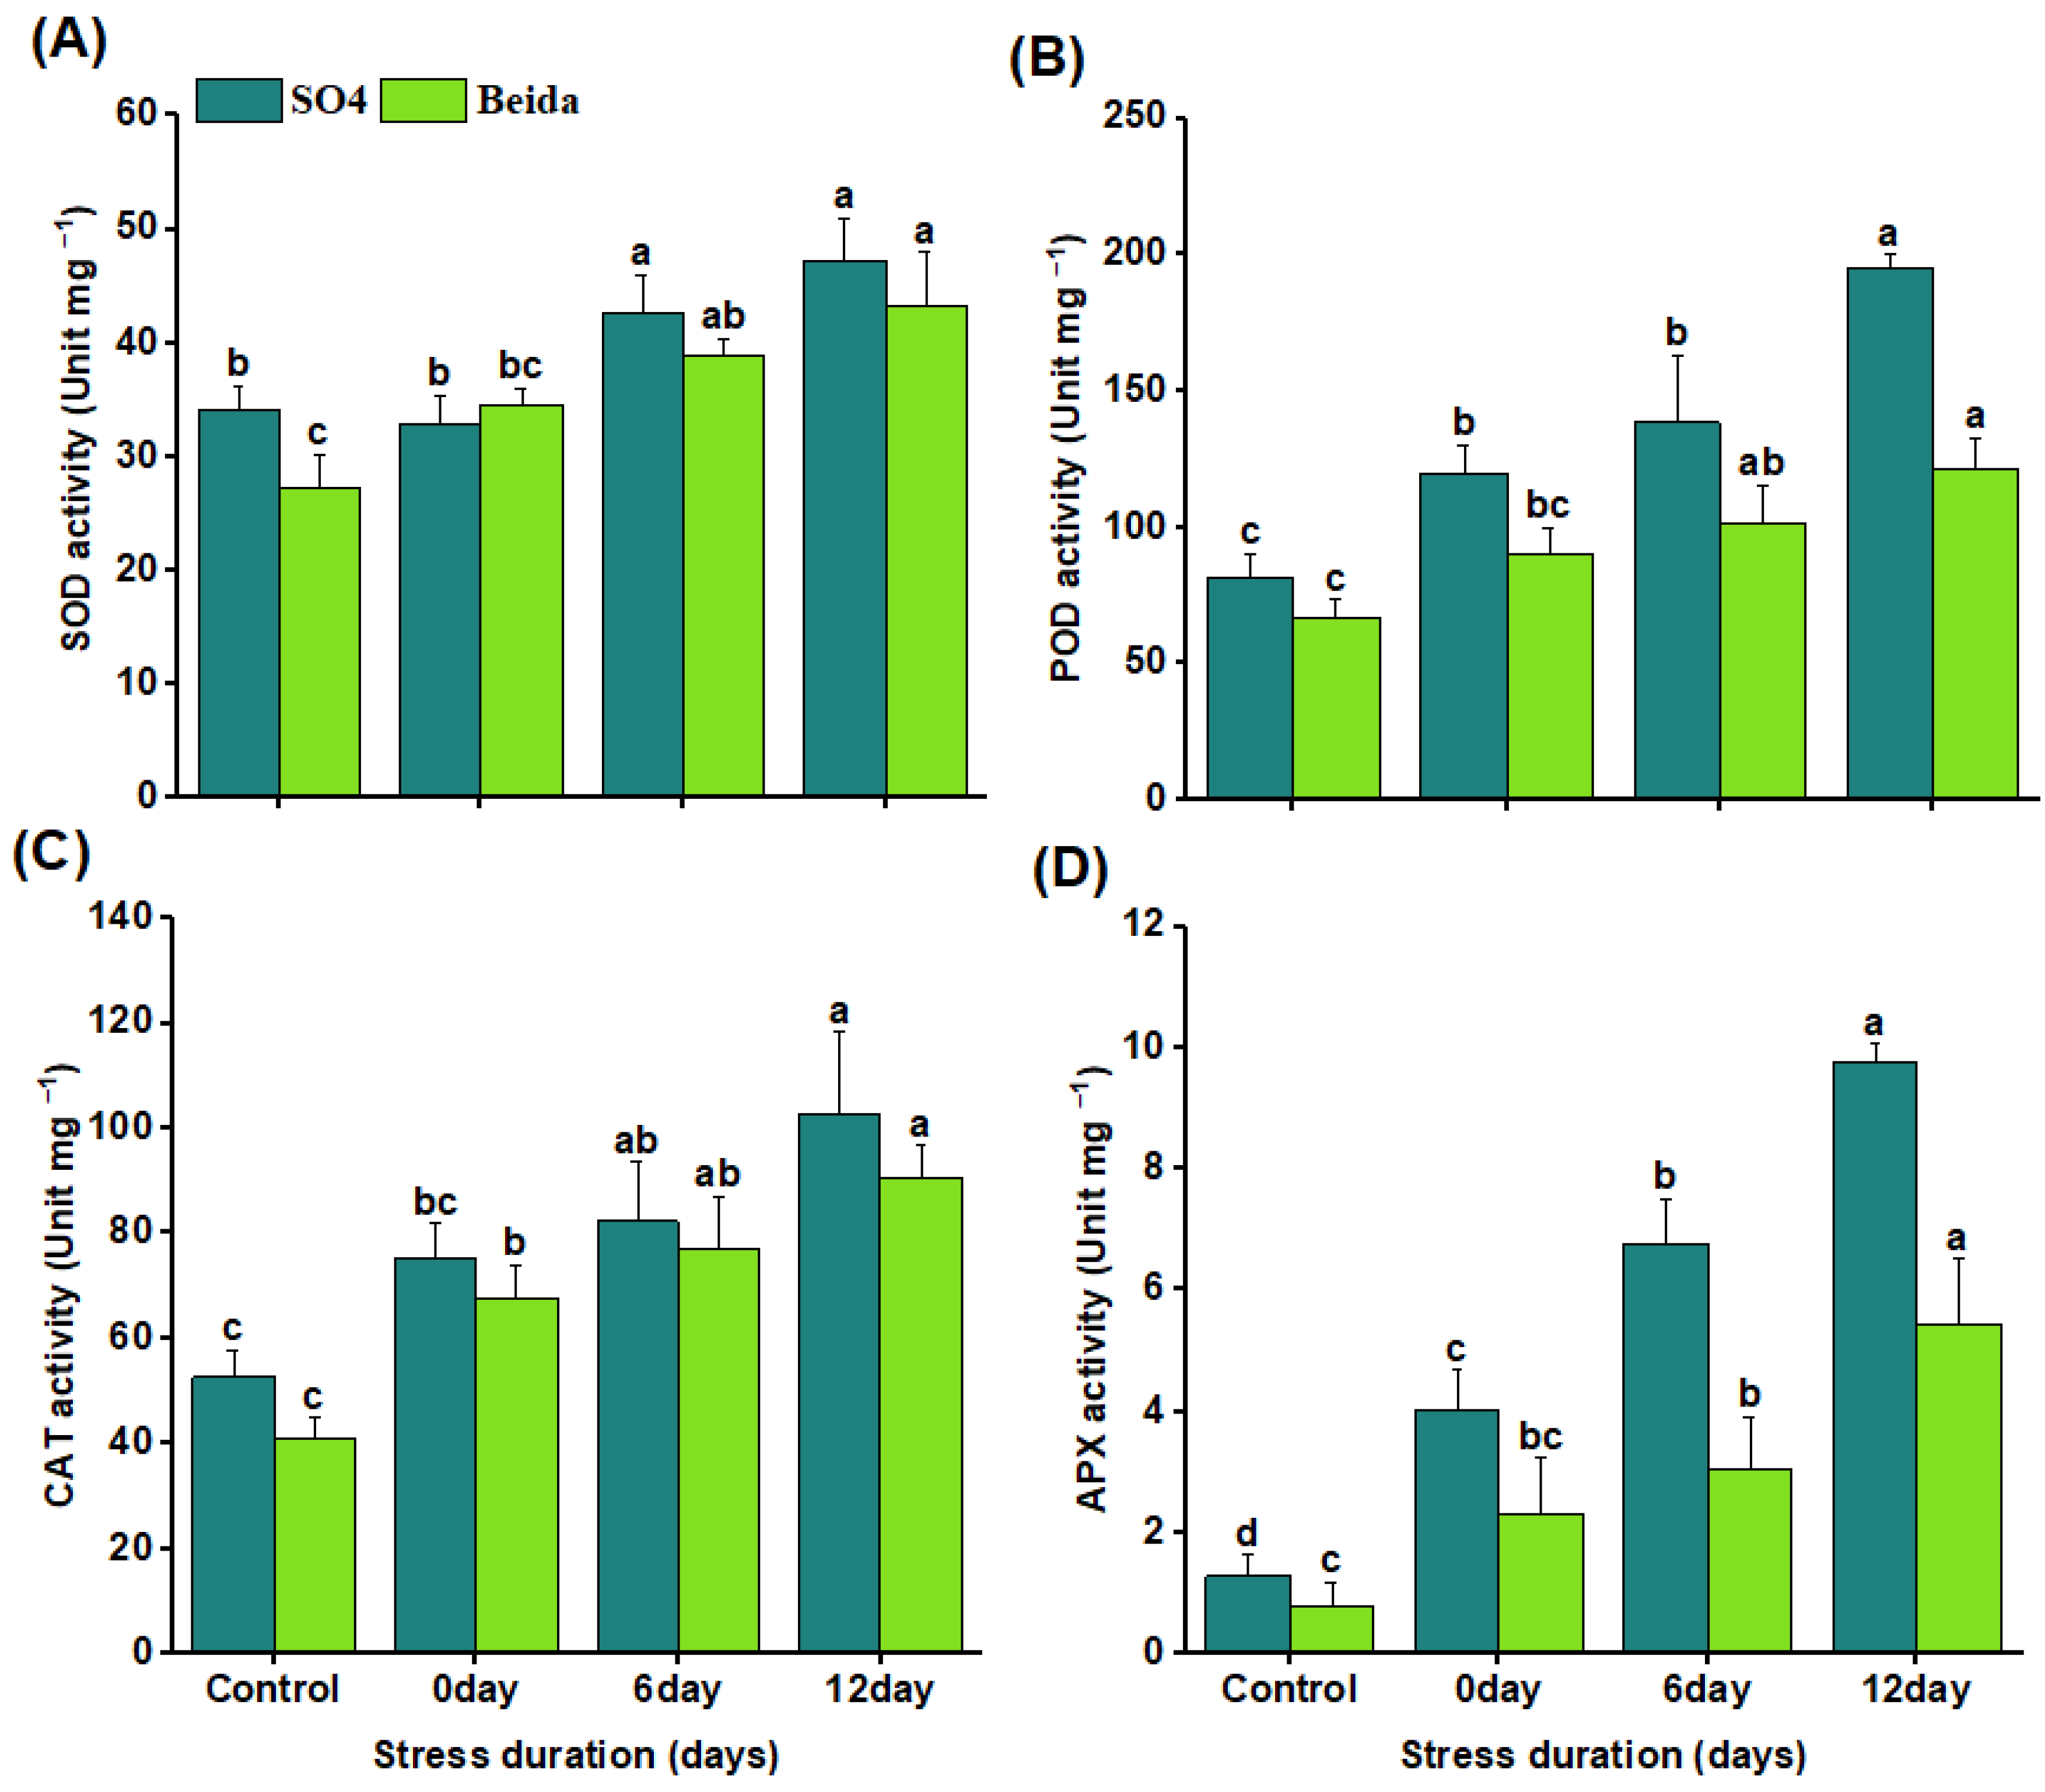
Figure 5.
Illustrates the root morphology, heatmap of root traits, and growth promotion genes of ‘SO4’, and ‘Beida’ grapevine rootstocks following 12 days of exposure to CK: control group, and salt stress (100 mmol/L NaCl). (A) SO4, and (B) Beida. (C) Root weight, (D) root length, (E) total number of roots, (F-G) root phenotypic traits of both rootstocks, and (H-I) expression of growth promotion genes related to root growth. The lowercase letters above the error bars display a significant difference between the treatments. Tukey’s test method was used to visualize the significant differences at p ≤ 0.05 value. Each sample contained three independent biological replications. Gene transcriptional profile level was measured between both seedling’s roots.
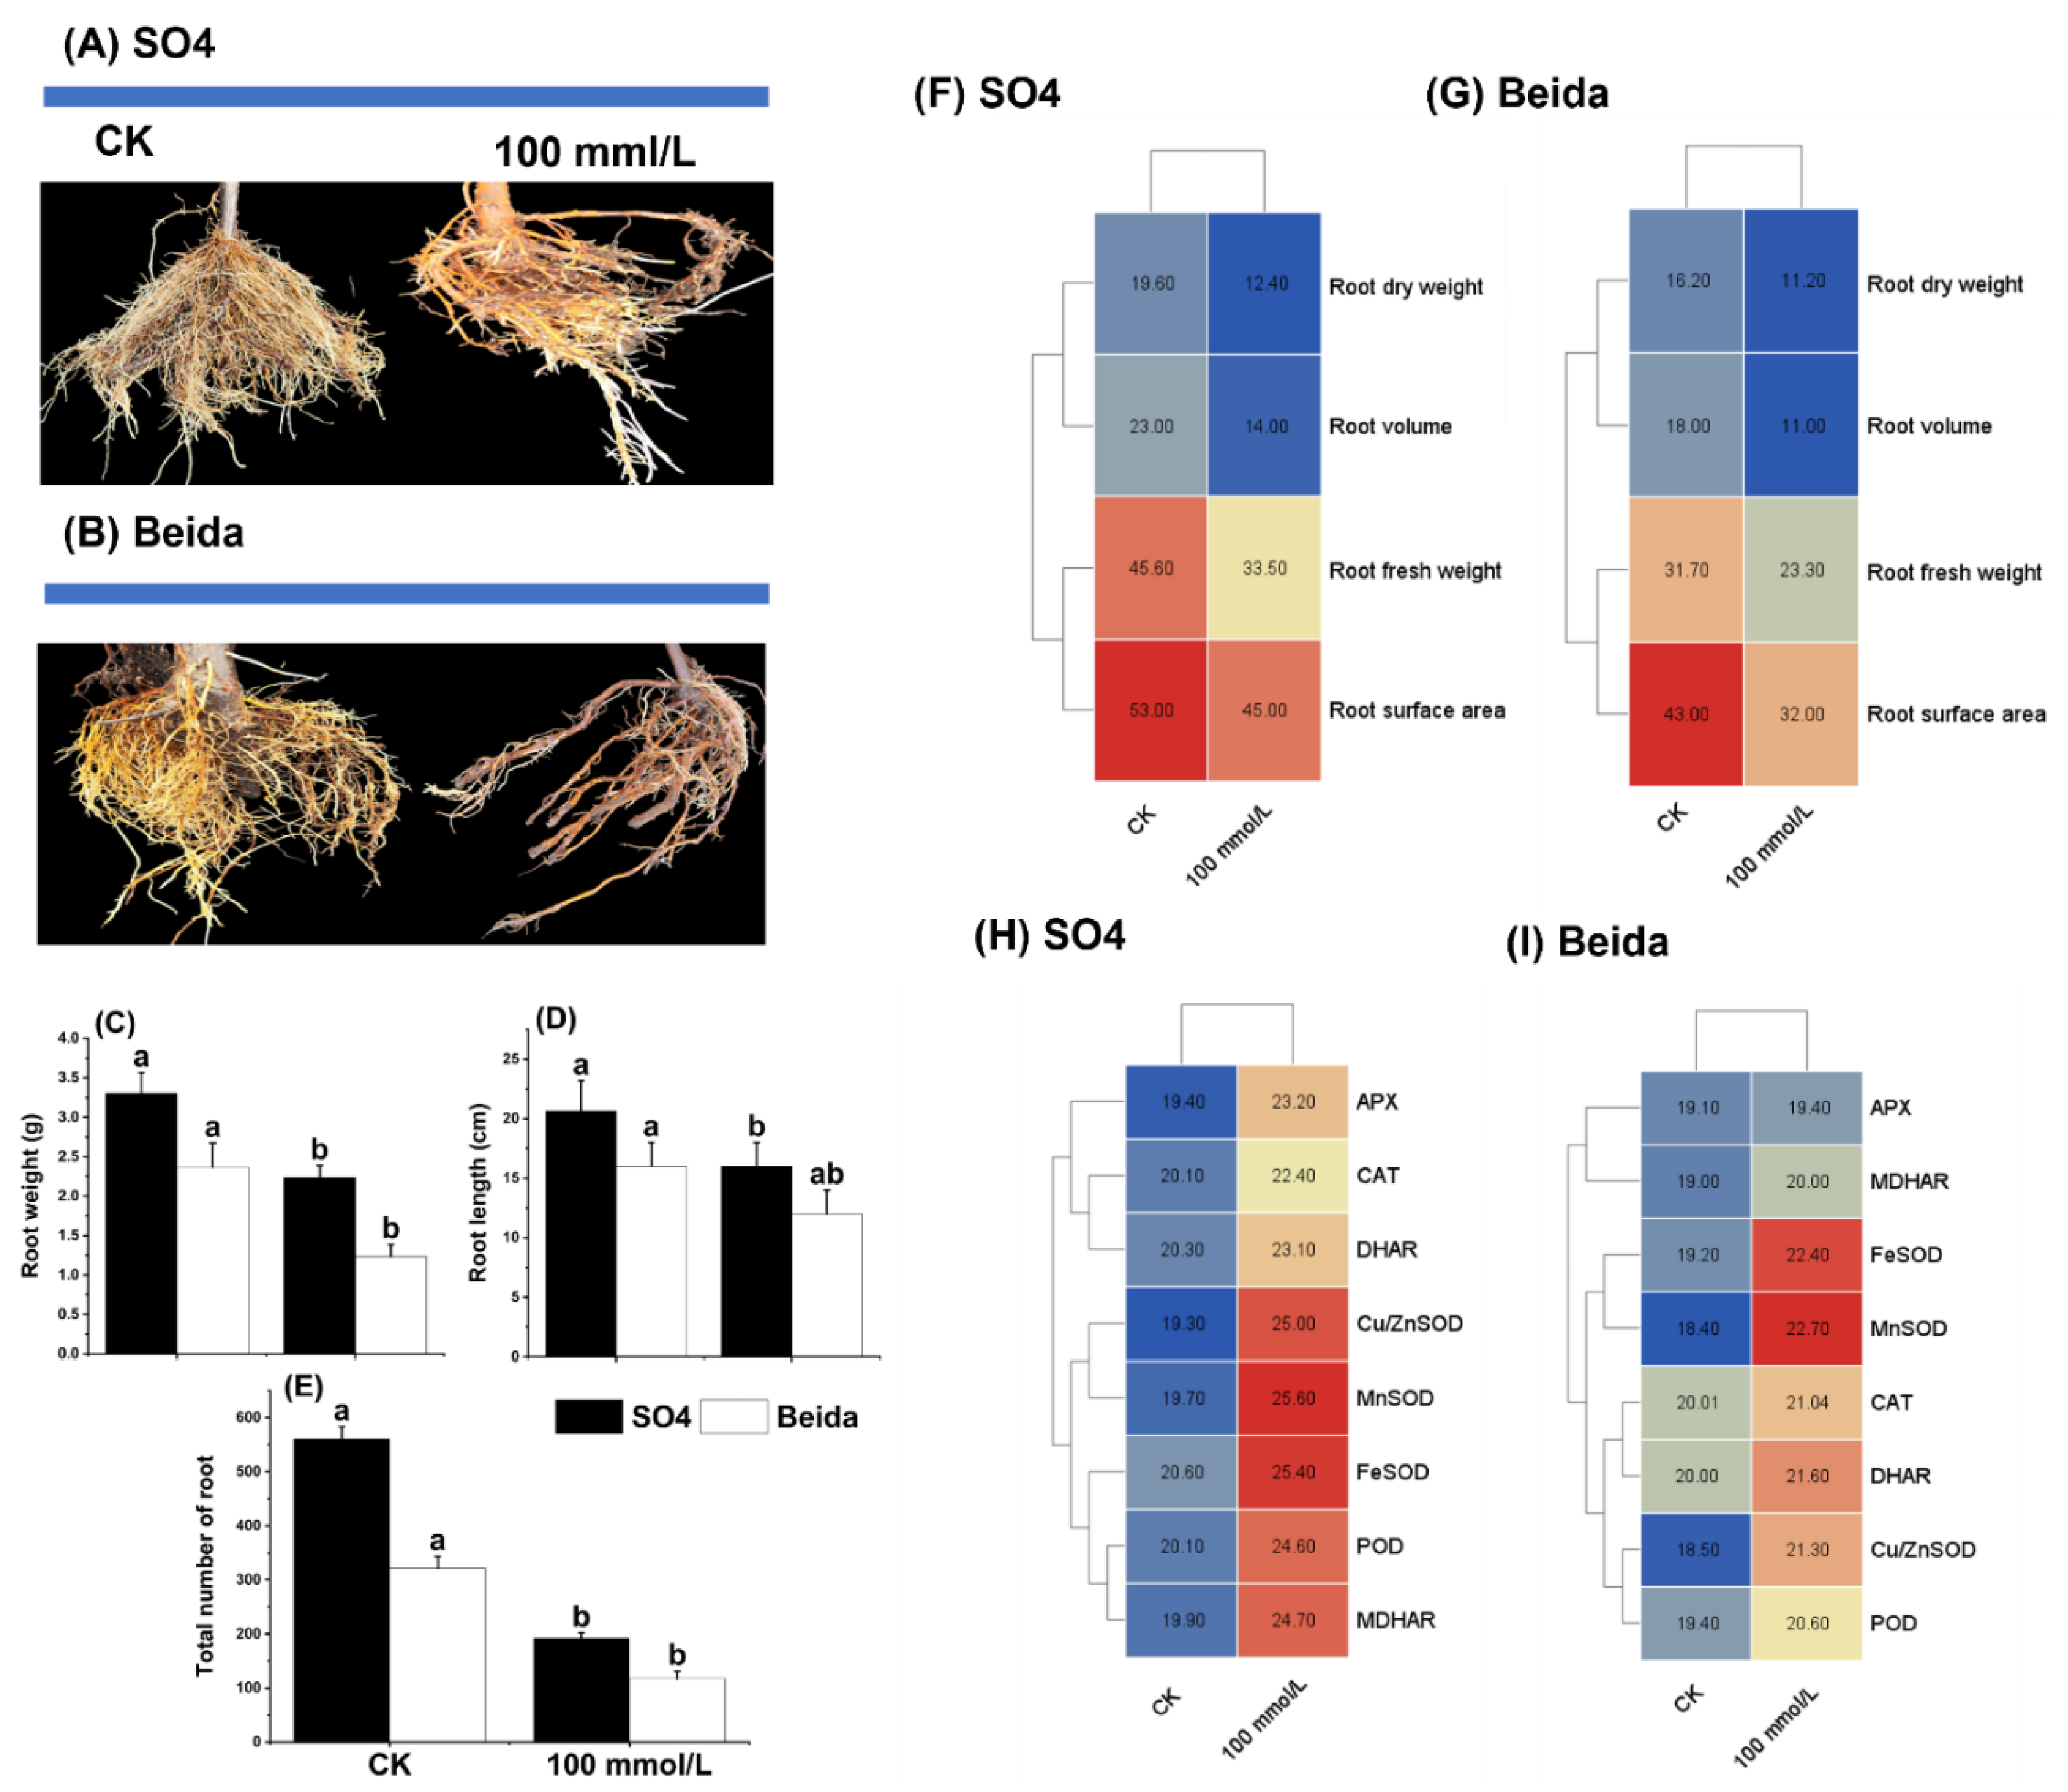
Figure 6.
Illustration of volcano plot of the differentially expressed genes in the treated groups of SO4 and Beida grapevine rootstocks after 0, 6, and 12 days of treatments. The red color indicates the upregulation of DEGs, and the blue color indicates the downregulation of DEGs. The x-axis indicates the log2-fold change (FC) values, while the y-axis indicates the potential value after -10 conversion. Note: the comparison groups are as follows: B vs D (0d_6d of NaCl), B vs F (0d_12d of NaCl), B vs H (0d_0d of NaCl), D vs F (6d_12d), D vs J (6d_6d of NaCl), J vs L (6d_12d of NaCl), F vs L (12d_12d of NaCl), H vs J (0d_6d of NaCl), and H vs L (0d_12d of NaCl).
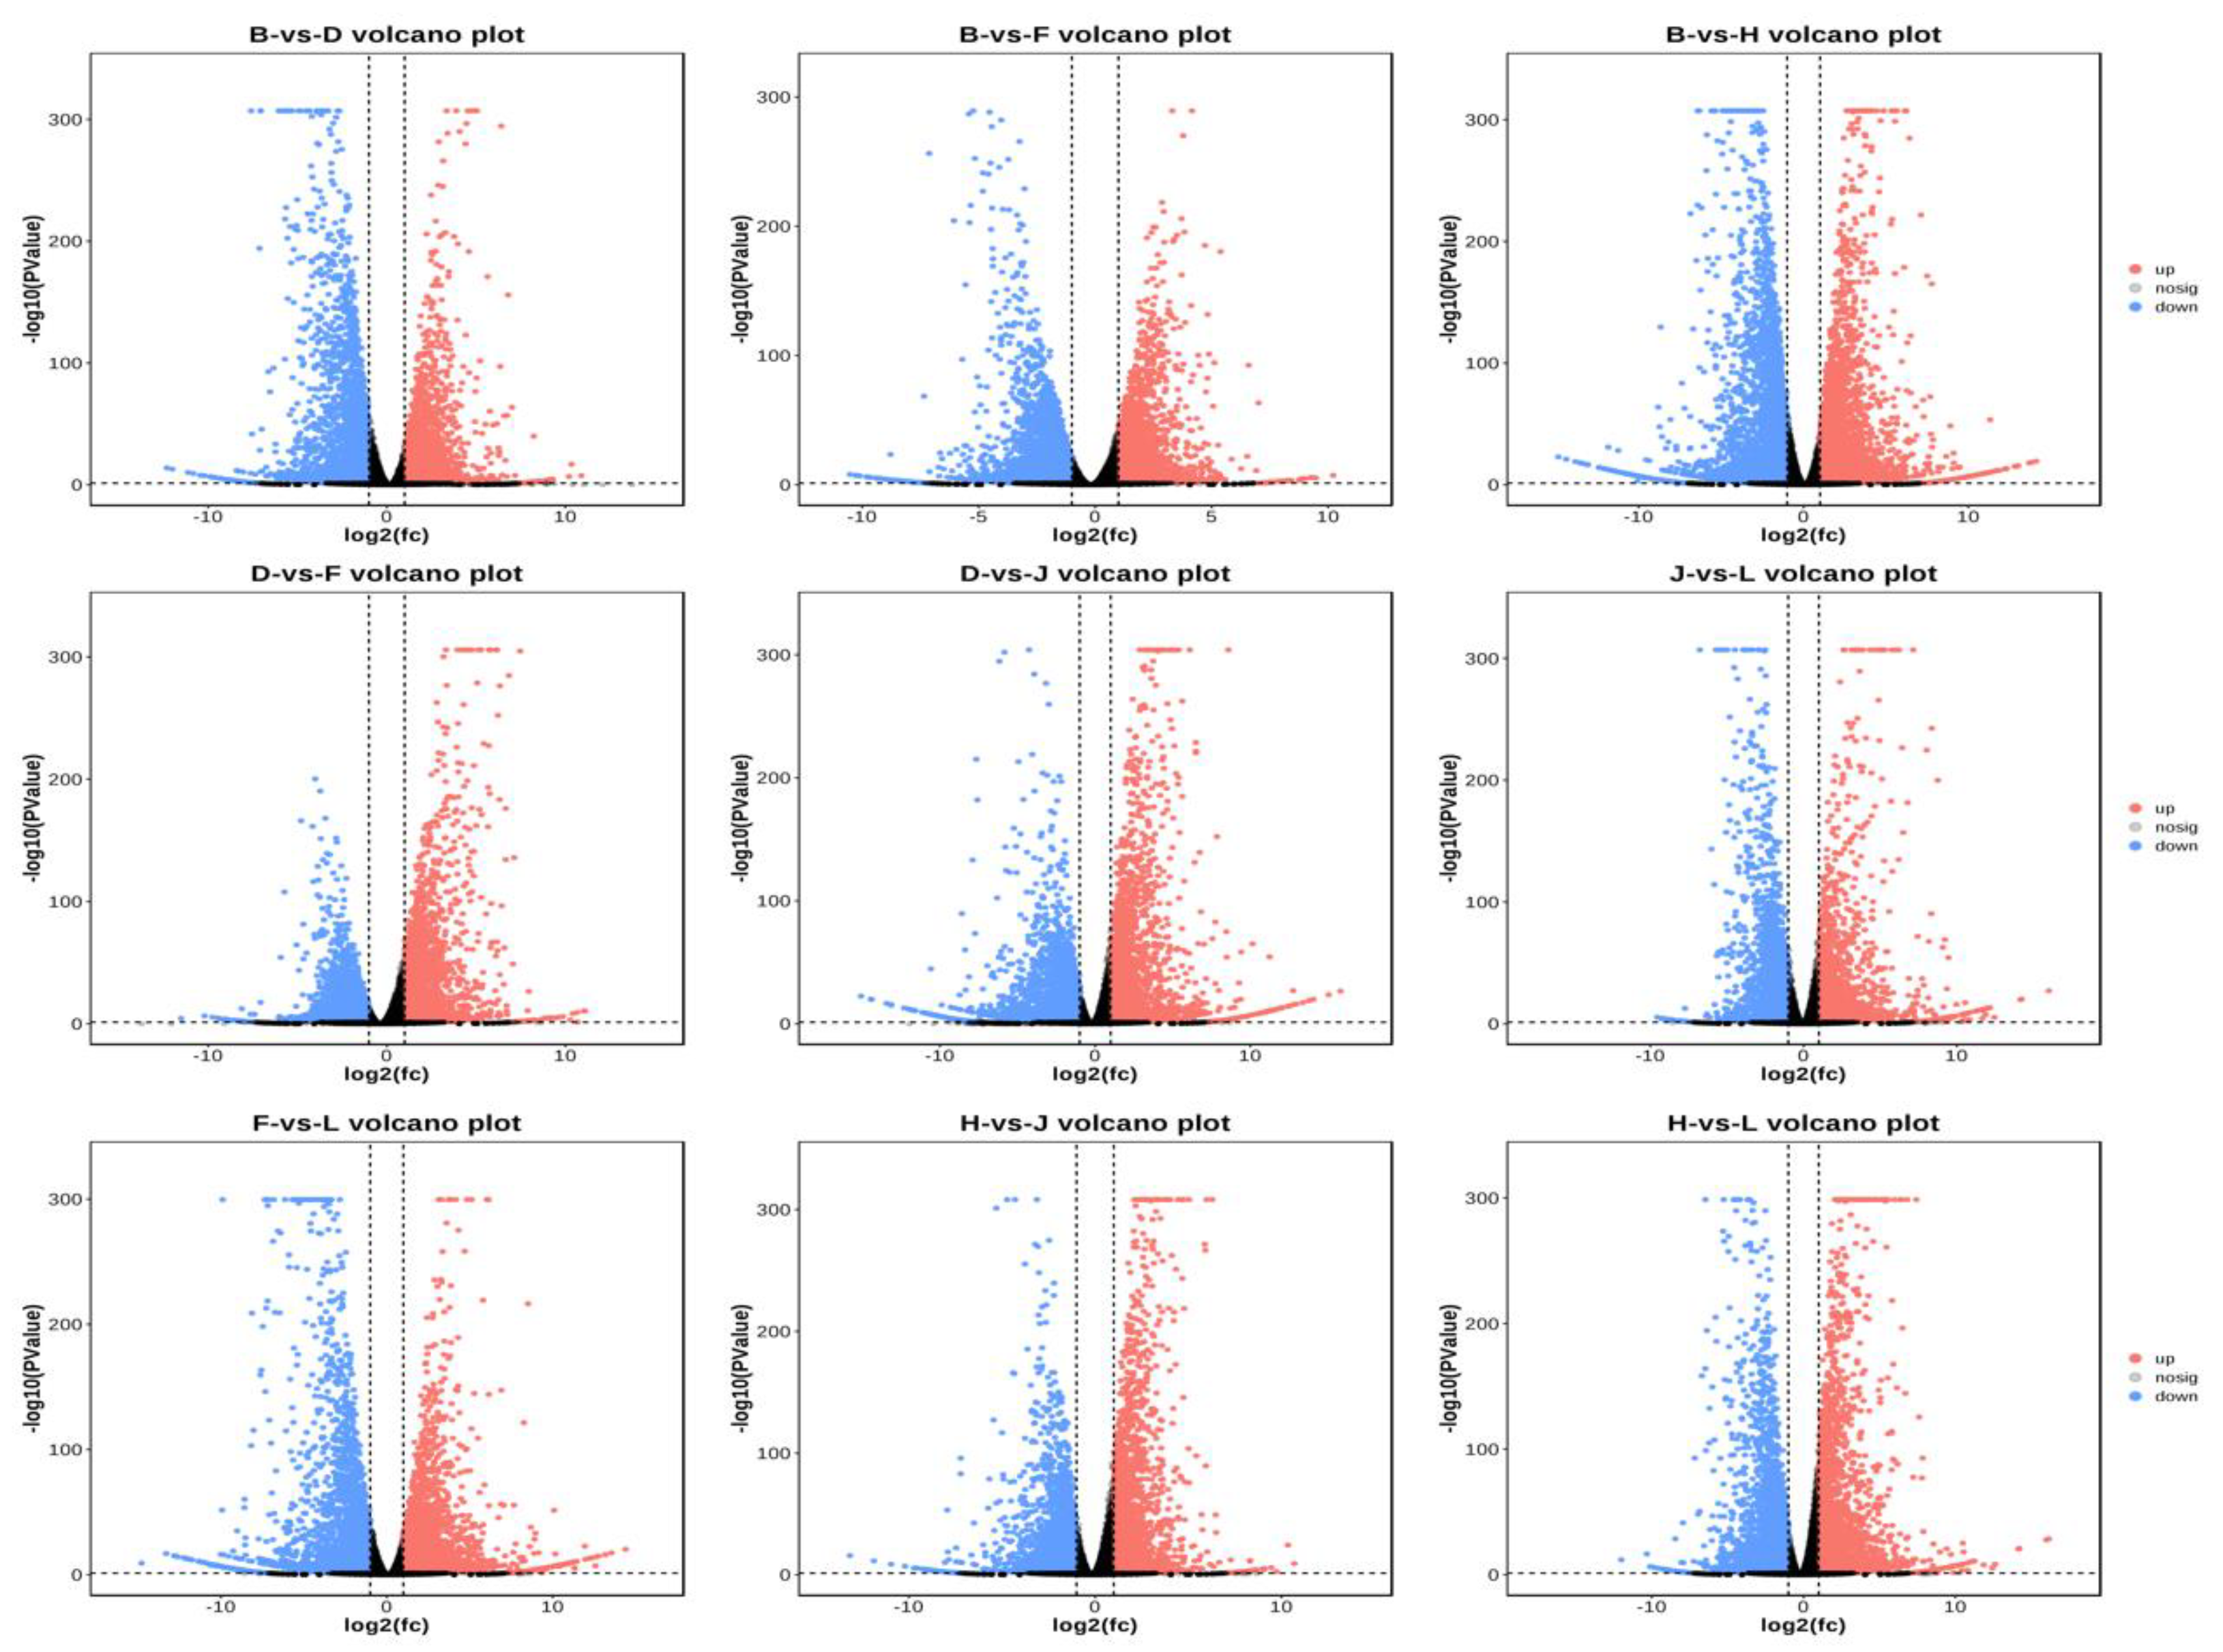
Figure 7.
Multivariate analysis between SO4 and Beida grapevine rootstocks under salt stress. A, B, and C: Venn diagram representing the overlapping and unique differentially expressed genes (DEGs) in salt stress treatments. D: The flower score plot represents all DEGs (in the center) among all the salt stress-treated samples and genes particularly displayed in petals at various time points. And, E: Kyoto Encyclopedia of Gene and Genomes (KEGG) analysis between 72 DEGs.
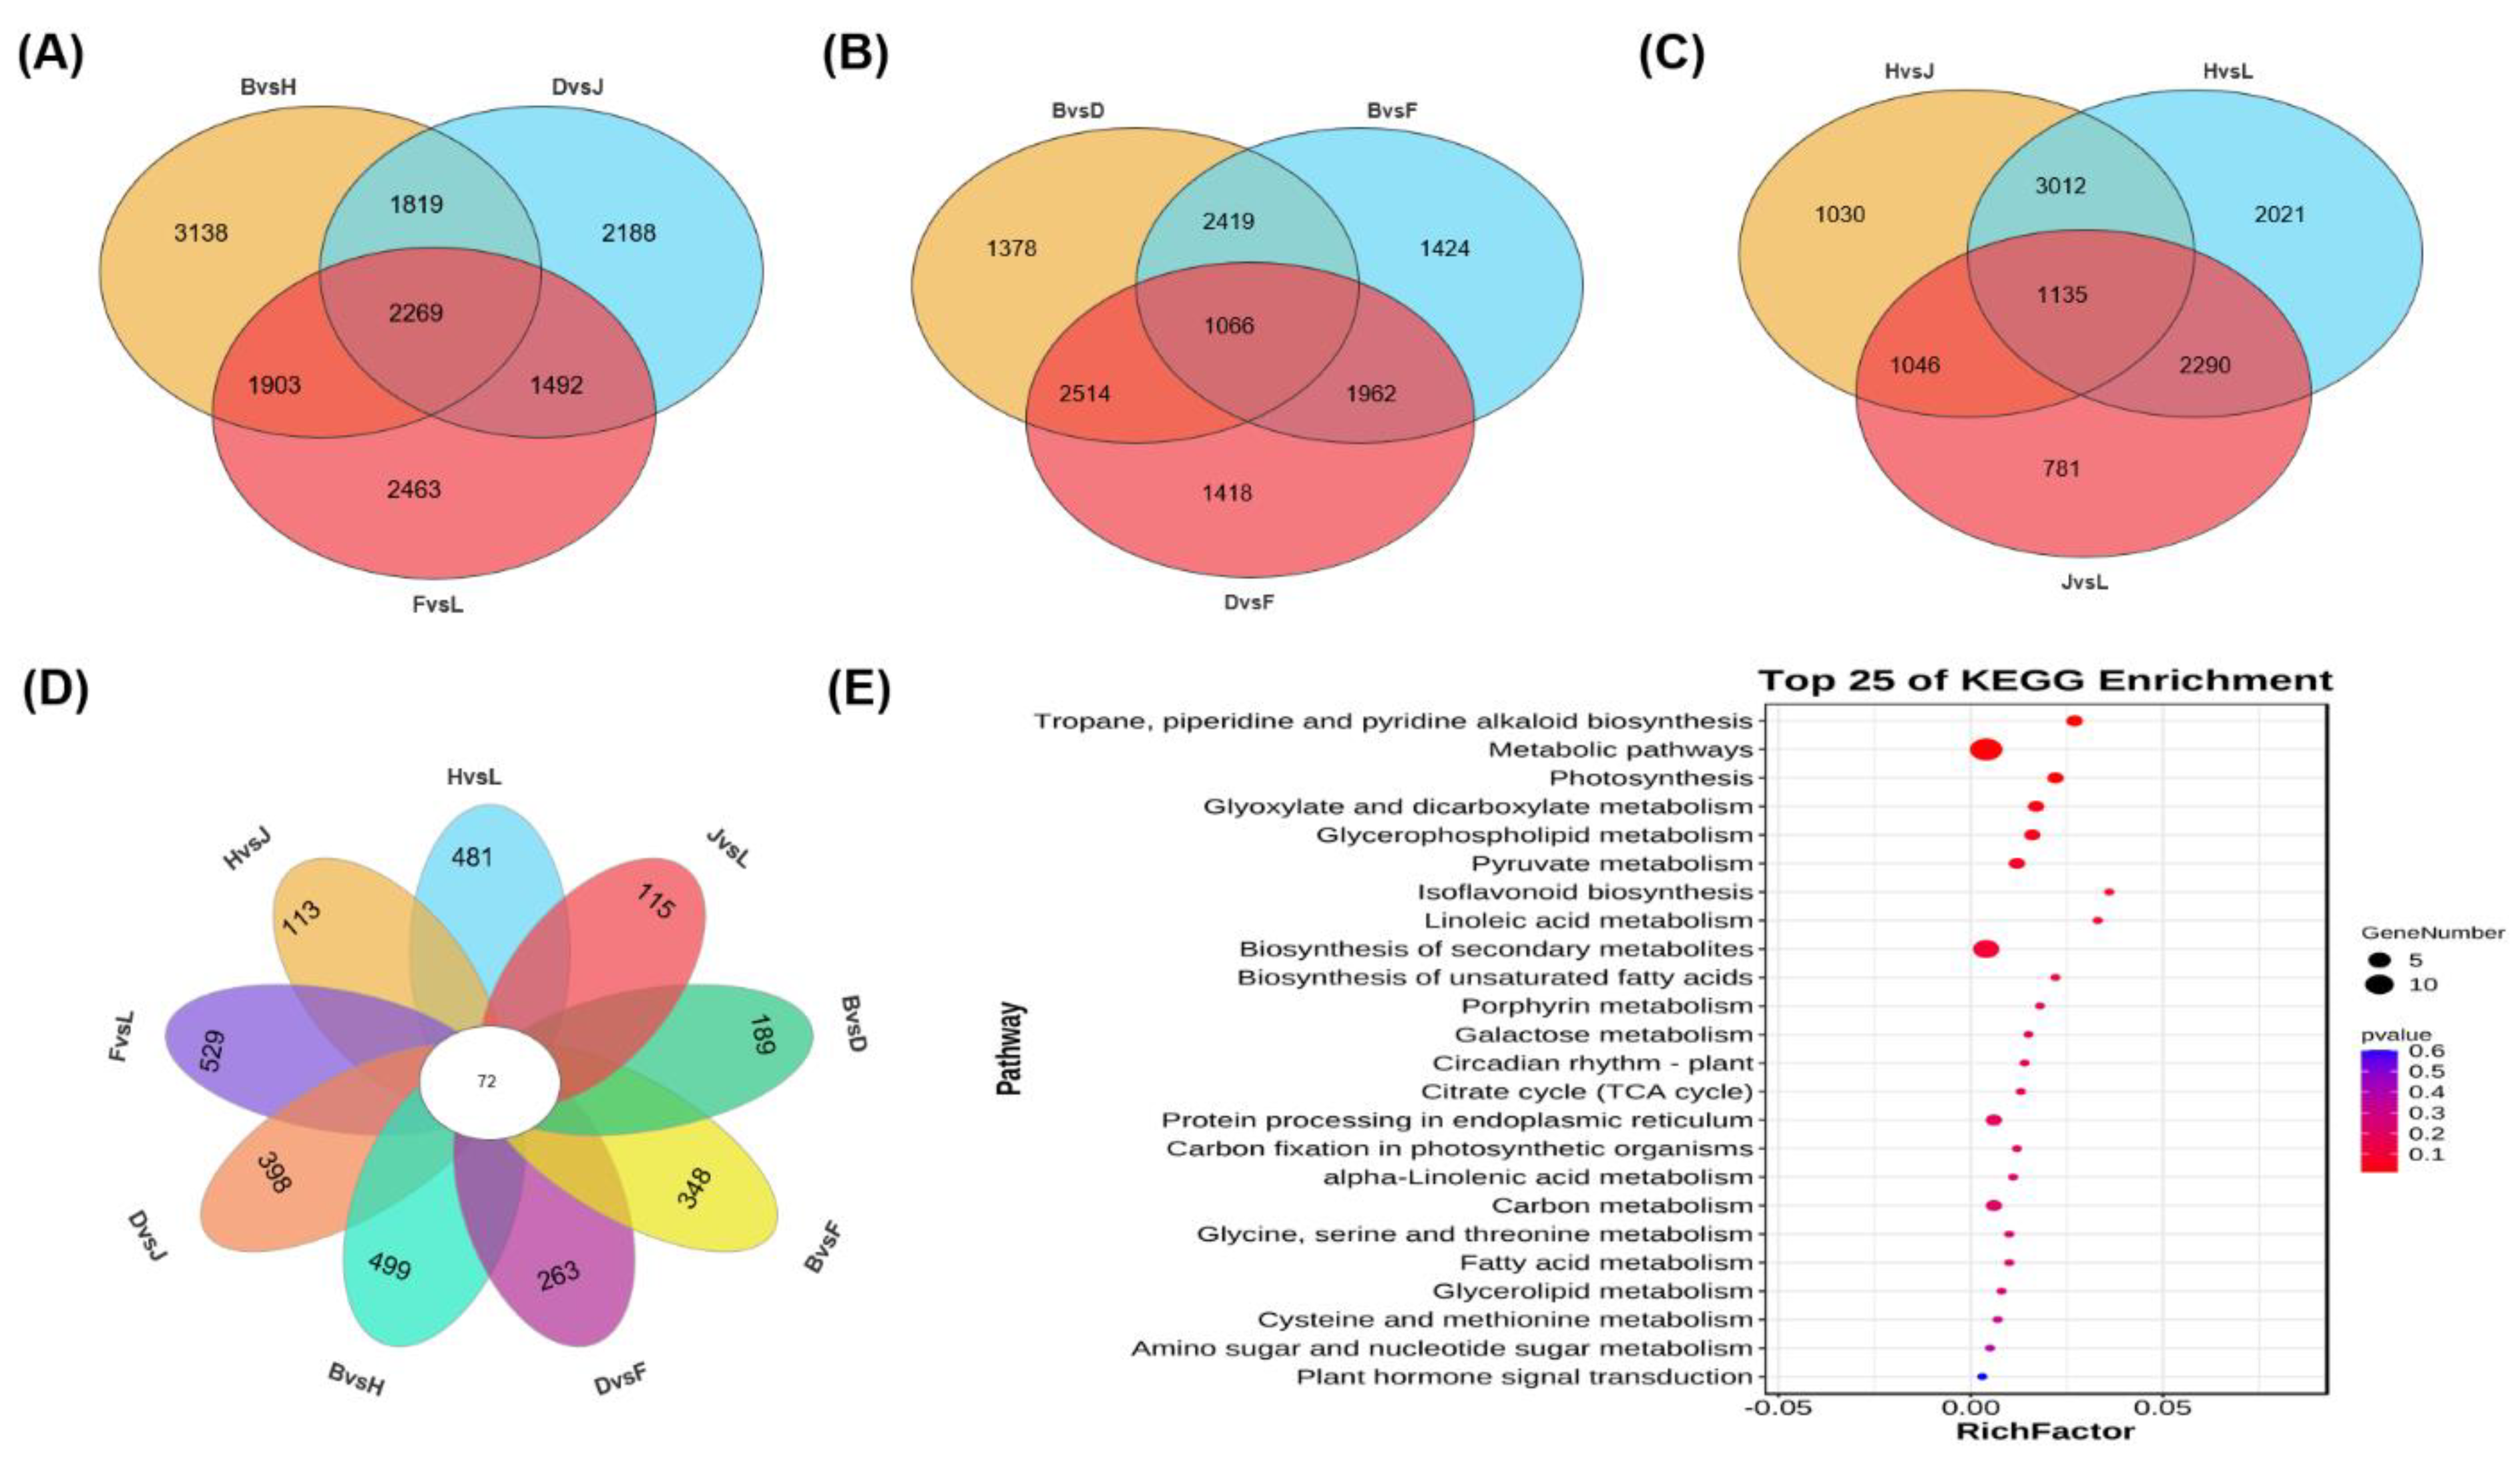
Figure 8.
Circle chart and enrichment analysis displaying the findings about 24 KO terms between 72 DEGs in both rootstock cultivars under salt stress. From outdoor to indoor, the first circle illustrates the distribution of enriched categories, with the coordinate axis displaying the number of genes outside the circle. The second circle represents the number of genes and p-values in the background genes. And, the third circle illustrates several differentially expressed genes (A). Enrichment analysis of 72 DEGs in both grapevine rootstocks was mainly attached to four metabolic pathways including metabolism, organismal system, genetic information processing, and environmental information processing (B). Note: specific values are shown below.
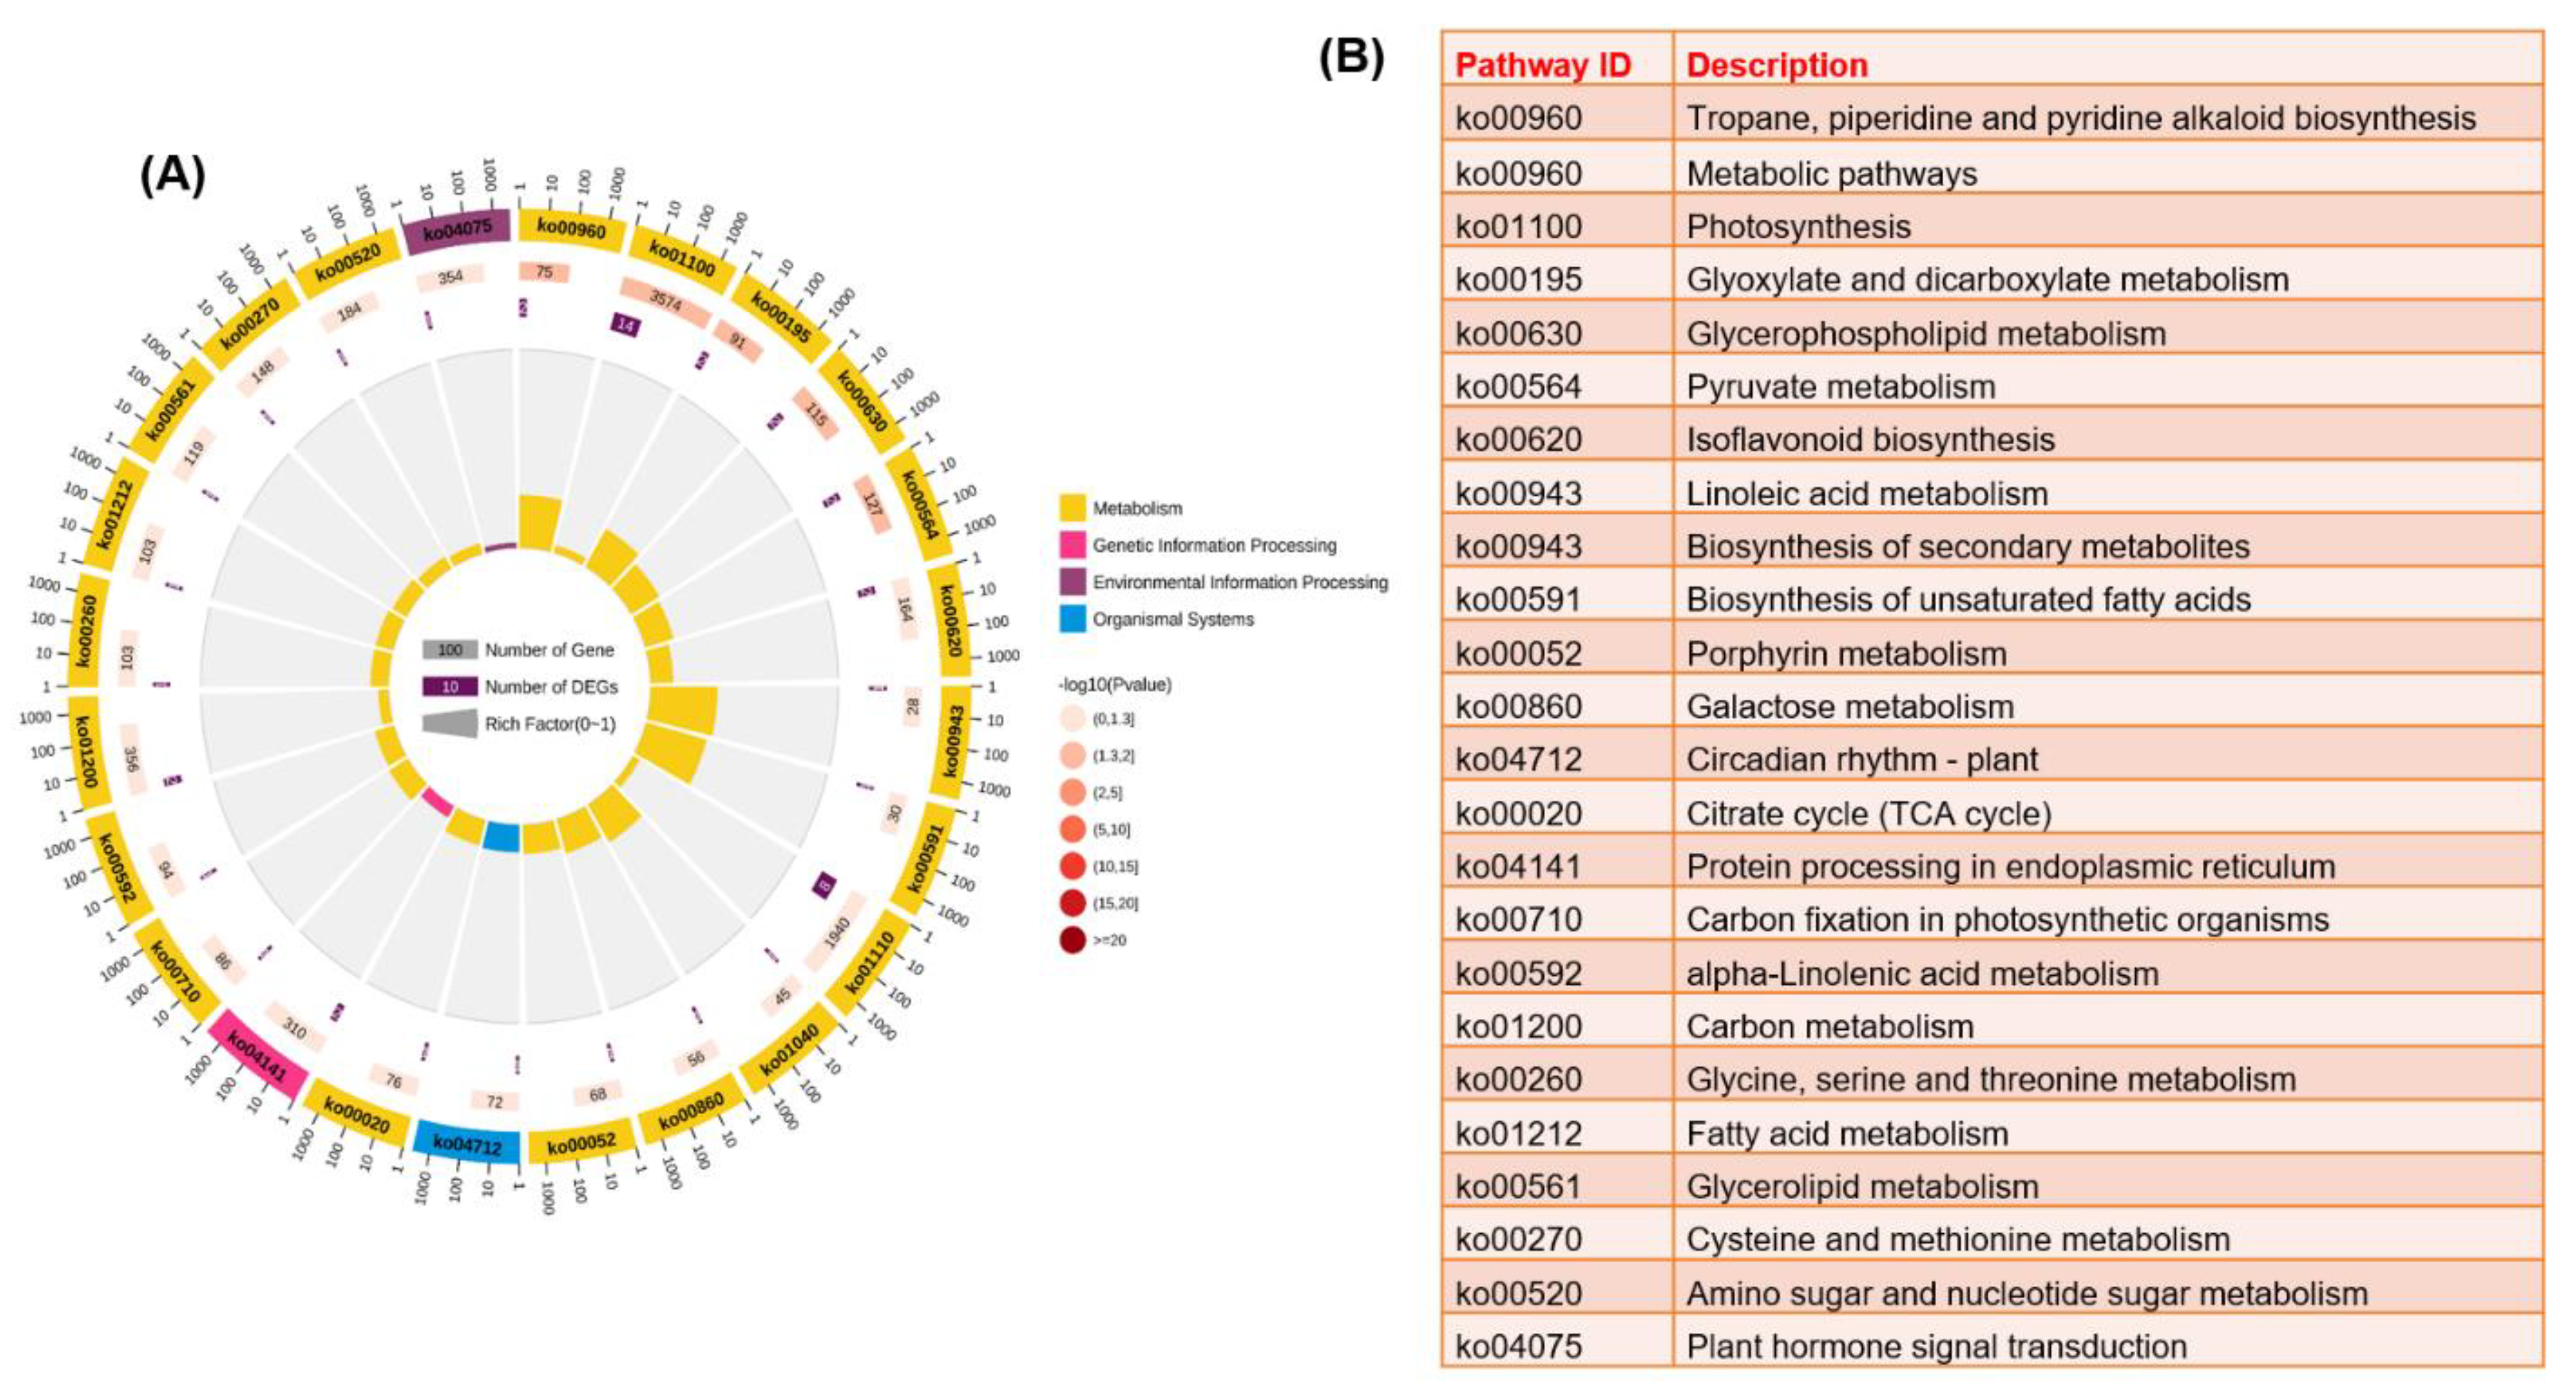
Figure 9.
Interpretation of coexpression and WGCNA analysis of salt stress responses of DEGs in SO4 and Beida grapevine rootstocks. (A) In a soft power curve, the ordinate on the left side shows the construction coefficient, while the right side shows the construction of the average connectivity between DEGs. (B) Gene cluster dendrograms and module colors. And, (C) Illustration of Eigengene adjacency heatmap summarizes the gene expression profile of each module, this figure was created by the WGCNA webtool package.
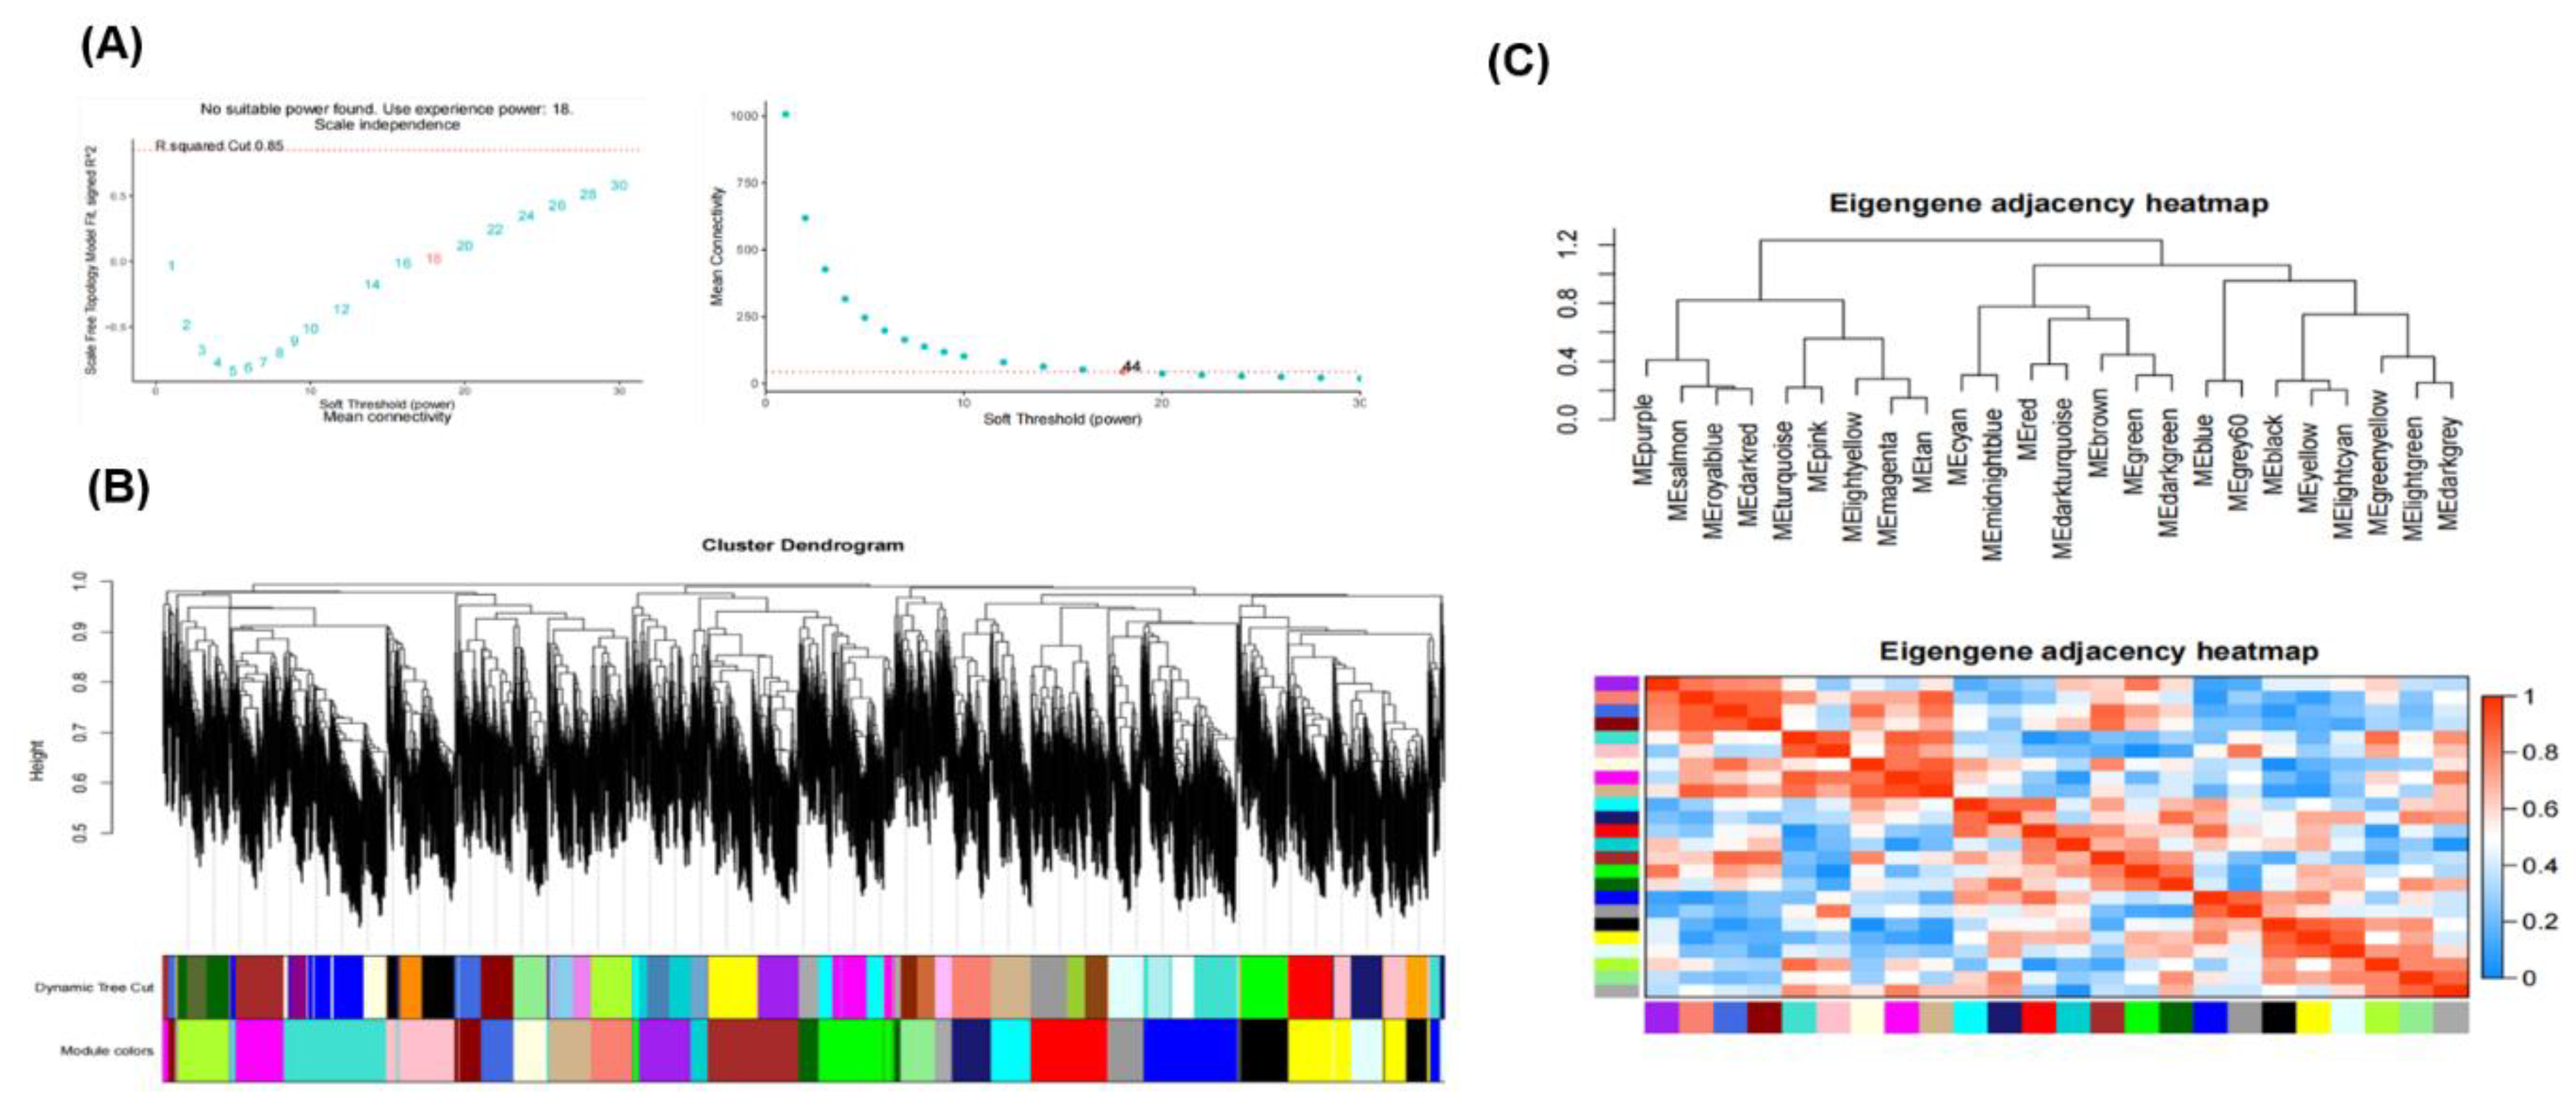
Figure 10.
Illustration of DEG trend in grapevine rootstocks in response to salt stress. (A) Represents cluster gene expression profiles from growth grapevine genotypes. The Y-axis shows the relative expression varies in genes, while the Y-axis shows the various levels of tolerance and susceptibility regulation. (B) Represents the KEGG enrichment pathways in different profile 0, profile 1, profile 2, profile 3, profile 4, and profile 5 in SO4 and Beida grapevine rootstocks.
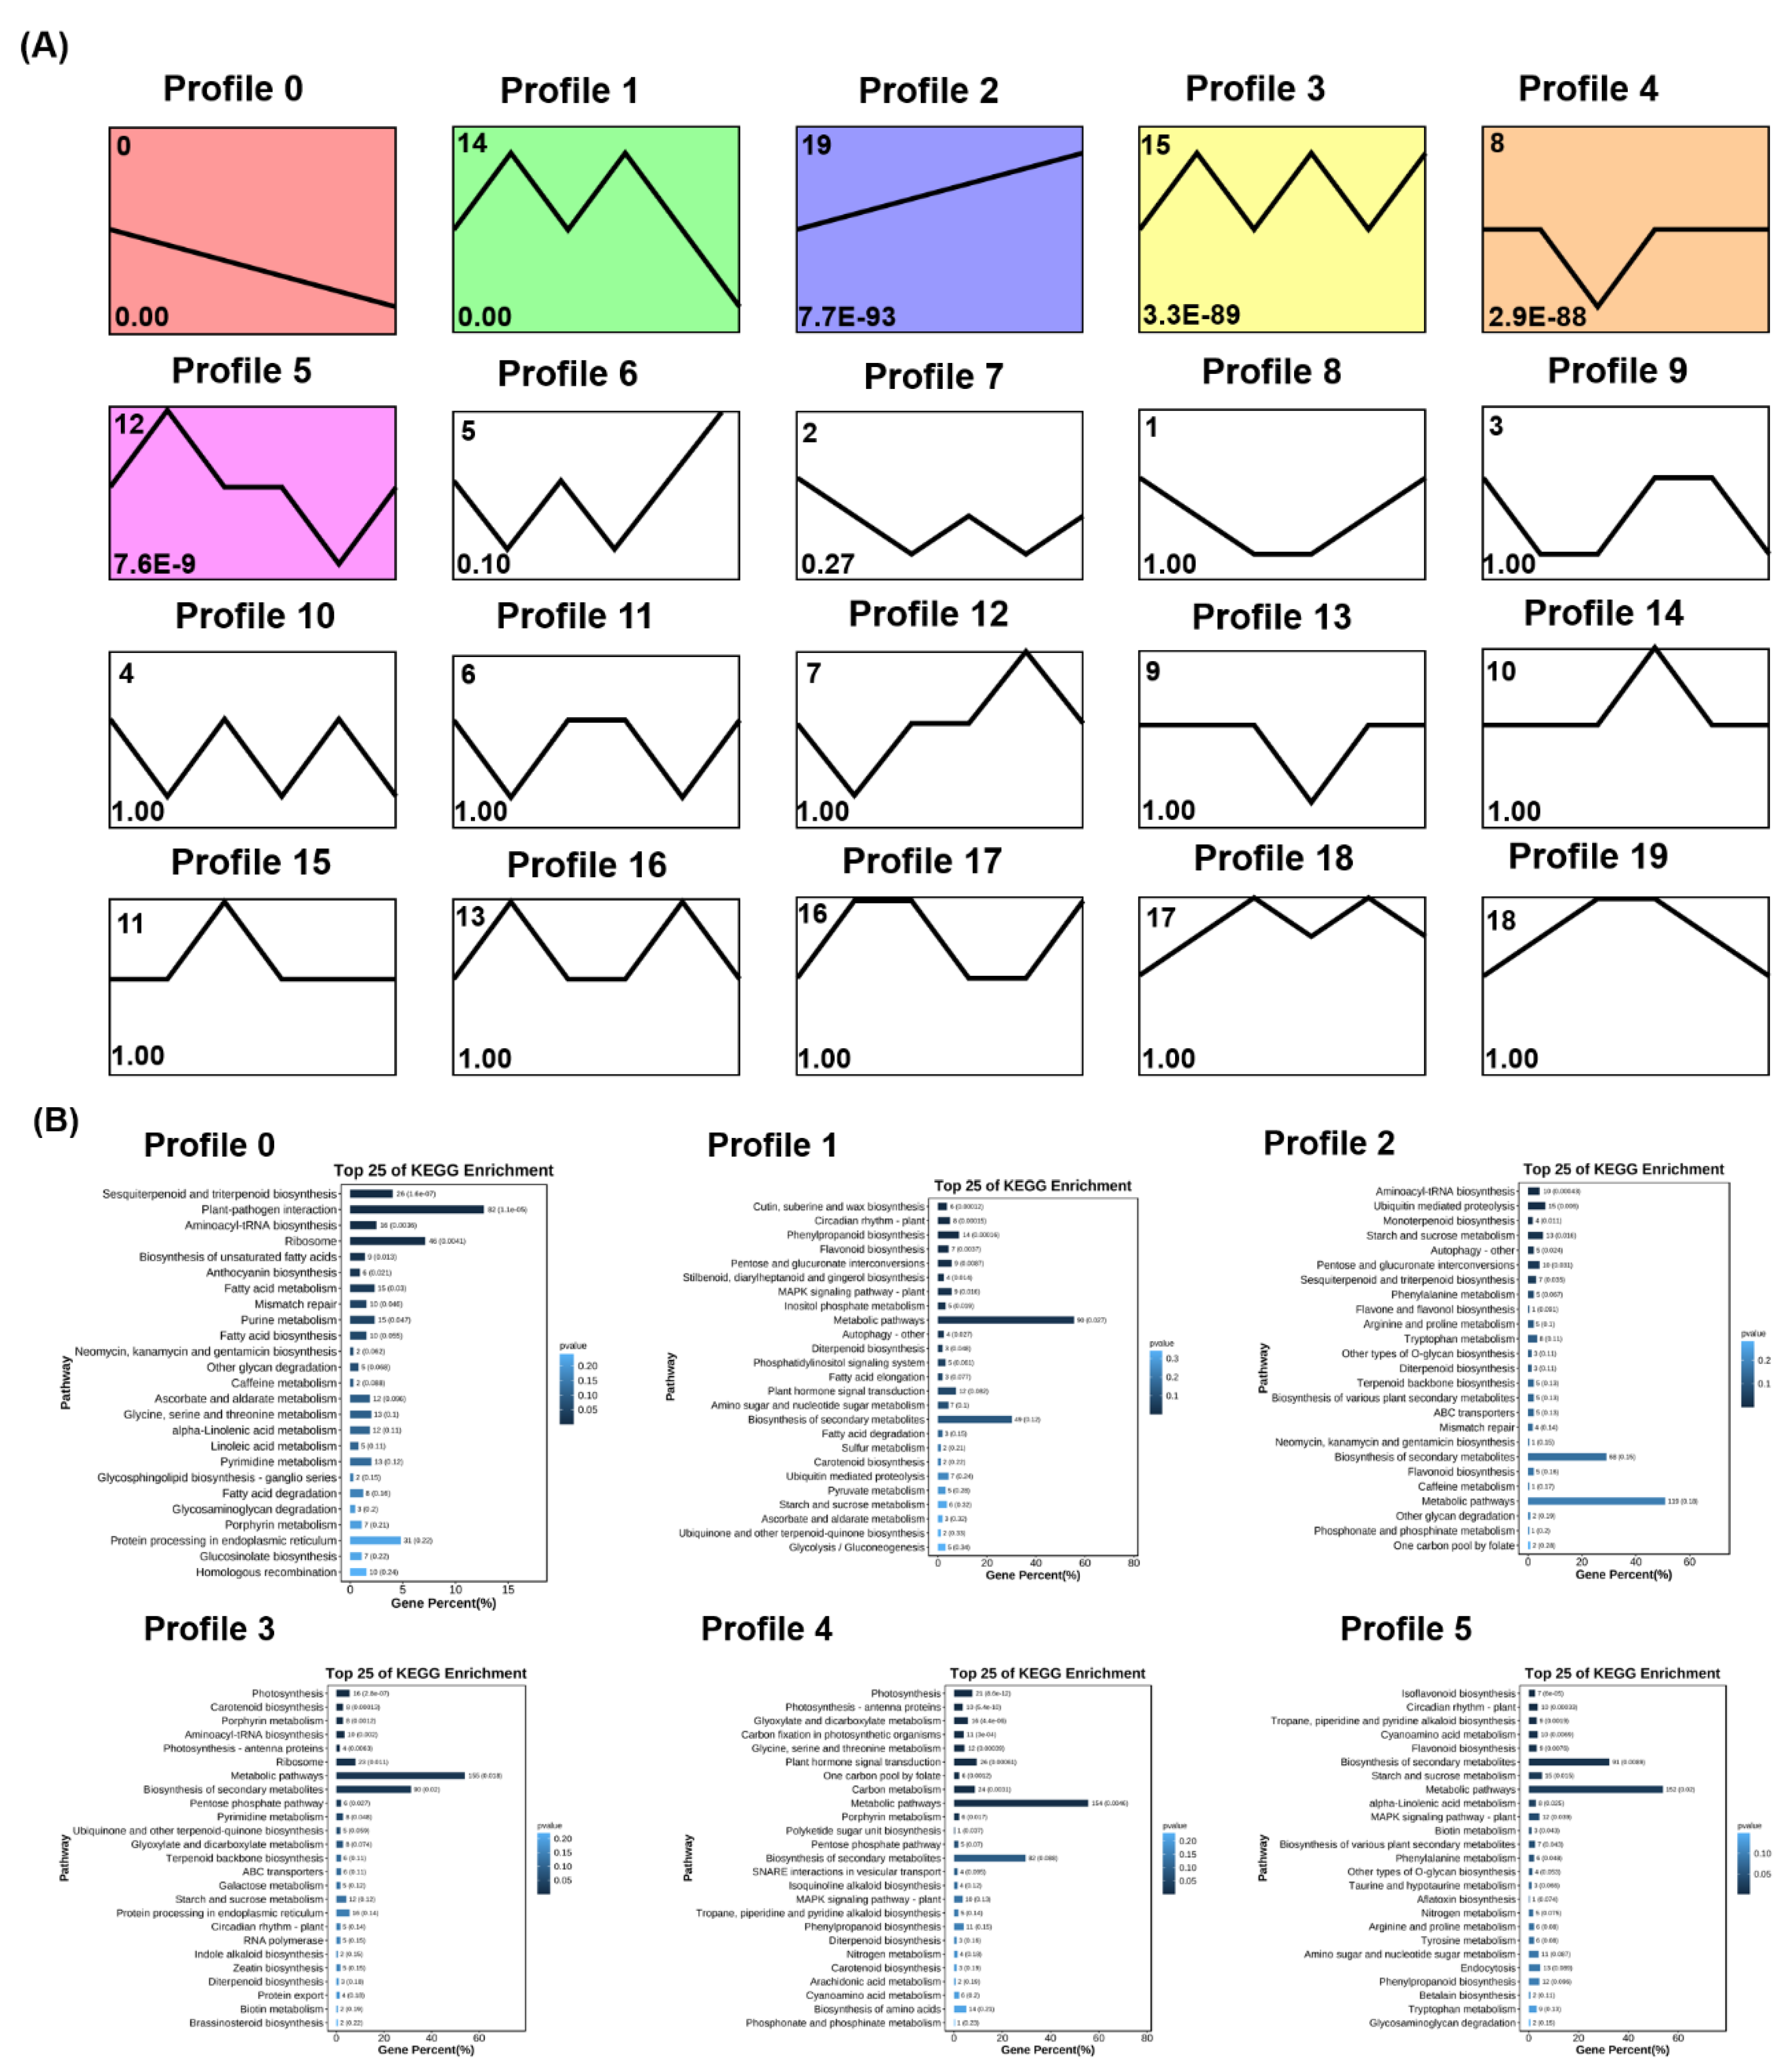
Disclaimer/Publisher’s Note: The statements, opinions and data contained in all publications are solely those of the individual author(s) and contributor(s) and not of MDPI and/or the editor(s). MDPI and/or the editor(s) disclaim responsibility for any injury to people or property resulting from any ideas, methods, instructions or products referred to in the content. |
© 2025 by the authors. Licensee MDPI, Basel, Switzerland. This article is an open access article distributed under the terms and conditions of the Creative Commons Attribution (CC BY) license (http://creativecommons.org/licenses/by/4.0/).
Copyright: This open access article is published under a Creative Commons CC BY 4.0 license, which permit the free download, distribution, and reuse, provided that the author and preprint are cited in any reuse.


