
Submitted:
10 June 2025
Posted:
11 June 2025
You are already at the latest version
Abstract
Addressing the challenge of identifying pivotal segments within the aviation network, exacer-bated by the escalating air traffic and airspace congestion, this study employs the FP-Growth algorithm to enhance the correlation analysis of the segment network's edges. This enhancement facilitates the construction and detailed examination of the segment network's correlation model. The methodology commences with the development of a segment correlation network model, leveraging relative hourly flight traffic data. Subsequently, a thorough analysis of the model network's topological characteristics is conducted. The findings reveal that the refined FP-Growth algorithm outperforms both the standard FP-Growth and Apriori algorithms in terms of efficiency and accuracy. Moreover, the application of degree centrality, pagerank, and eigenvector centrality successfully identifies influential segments, such as ENH-P373 and YIH-ENH, which play a crucial role in the operational efficiency and overall safety of the aviation network. This research provides a solid theoretical foundation for the precise identification and management of critical network segments.
Keywords:
Correlation analysis
; Improved FP-Growth algorithm
; Complex networks
1. Introduction
With the continuous growth of air traffic[1] , the increasing problem of airspace congestion and the frequent occurrence of flight delays, the safety and efficiency of the air transportation system are facing unprecedented challenges. In this context, how to ensure the safe and efficient operation of aircraft and reduce the negative impacts of delays is the challenge for current research. The problem of flight delays has always been a hot topic of research in the air transportation industry, and in recent years, scholars at home and abroad have conducted extensive research on the problem of delay propagation.
Although experts and scholars have made some progress in the theoretical study of flight delay, such as Zhang Zhaoning[2] proposed a large-area flight delay propagation model and analyzed the delay propagation mechanism; Li Shanmei[3] used convolutional neural network to improve the accuracy of flight delay prediction; and the flight time optimization model proposed by Li Ang[4] can help to improve the flight punctuality rate. However, in the process of practical application, it is still easy to generalize through the flight delay analysis network, which may be affected by the data quality, model generalization and so on, making the accuracy to be improved, and at the same time, the lack of considerations for the weather changes[5] , air traffic control[6] and so on, making the model more difficult to adapt to the new changes.
Aiming at the research status quo of the flight delay problem mentioned above, it is proposed to establish a segment network model, through which the segment network correlation analysis can characterize the interactions and dependencies between different segments, improve the safety and utilization of airspace, and provide decision-making support for strategic network optimization[7] . Considering the correlation between segments, flight delays within a single segment[8] may trigger a chain reaction, leading to changes in the overall air traffic operation. In addition the segment network correlation is selected from a wide range of nodes and connecting edges with significant differences. If all elements are analyzed equally, it not only increases the difficulty of data collection, but also is plagued by a variety of interfering factors[9] leading to a large deviation in the results. Therefore, in this paper, we consider the correlation analysis method in data mining[10] to identify the key navigation points and airway routes.
Currently, there has been some research in the field of algorithms in the field of data mining at home and abroad, and typical correlation analysis algorithms include Apriori algorithm[11] and FP-Growth algorithm[12] . Apriori algorithm identifies the frequent itemsets by iteratively scanning the dataset and generating the candidate sets, which is inefficient and only applicable to a small amount of data. Comparatively, FP-Growth algorithm can effectively mine frequent itemsets by constructing FP-Tree with only two dataset traversals, but the algorithm still consumes considerable time and storage resources in constructing the tree structure.
Aiming at the performance bottleneck of FP-Growth algorithm when dealing with large-scale data, an improvement method is proposed, i.e., “pruning + parallelization” strategy. Firstly, the pruning[13] technique is introduced to set the pruning rules to exclude those inefficient search paths and reduce the unnecessary computation. Combined with the parallel[14] computing framework, the optimized subproblems after pruning are allocated to multiple processors for parallel processing to improve the computing speed of the algorithm.
In this paper, we synthesize the results of scholars such as Wang Yu[15] , Zhang Hao Yu[16] , Guan Xiangmin[17] and other scholars in the field of airport operation and DM network modeling, and carry out an in-depth modeling and analysis of segment correlation. On this basis, in order to verify the applicability of the improved FP-Growth algorithm, a series of complex network metrics that can reflect the global characteristics of the network, such as Degree Centrality, PageRank, and Feature Vector Centrality, are selected. Meanwhile, the studies of scholars such as Xinglong Wang[18] , Fuyen Hu[19] analyzed the correlation of the network through the metrics of degree and degree distribution, path length and diameter of the network, which provided methodological guidance for the calculation of complex network parameter metrics.
In summary, the segment network correlation was constructed based on the relative hourly traffic data of the segments between airports and navigation stations in the central and southern regions, and the correlation was analyzed based on the complex network theory of the improved FP-Growth algorithm. By calculating and analyzing the characteristic indexes of the segment network correlation, the importance of key segments in the real network is effectively represented.
2. Correlation Analysis Based on FP-Growth Segments
2.1. Theory of FP-Growth Association Rules
The FP-Growth algorithm is an efficient frequent itemset mining method, whose core mechanism lies in iteratively constructing and recursively mining FP-Tree (Frequent Pattern Tree a tree-shaped data structure designed for storing frequent transactions). The algorithm realizes its function through two phases of data scanning: the first scanning of the itemsets that satisfy the minimum support threshold and generates a header table by descending order; subsequently, the items in the original dataset are reordered according to the header table and the FP-Tree is constructed in the second scanning; on the basis of FP-Tree, the items whose support is lower than the threshold are removed by recursive construction of the conditional pattern base and pruning, and all the frequent items are gradually mined. items, and gradually mining out all frequent item sets. For the formed FP-Tree, if a single path is presented, all possible frequent itemsets are directly enumerated; if the paths branch, the tree structure continues to be recursively invoked until a single path is formed. Eventually, association rules that satisfy the minimum confidence requirement are extracted from these frequent itemsets to provide decision support for market analysis, risk assessment and other fields. By this method, the candidate itemset generation and multiple database scans in the traditional algorithm are avoided, which significantly improves the mining efficiency.
In the framework of FP-Growth algorithm, association rule mining reveals the intrinsic connections between different itemsets in transactional data by identifying frequent itemsets in the dataset. To mine these rules effectively, two key thresholds need to be determined first: minimum support and minimum confidence. The minimum support threshold is used to initially screen the data to ensure that the selected itemsets occur at a predetermined frequency, while the minimum confidence threshold is used to assess the strength and reliability of the rules.
Support is a statistical measure of the frequency of occurrence of an item set in a transaction set, defined as the ratio of the number of transactions containing an item set A to the total number of transactions in the transaction set, i.e.
This metric provides a quantitative basis for evaluating the importance of an itemset, and by setting a minimum support threshold, noise and irrelevant information in the dataset can be effectively reduced, thus improving the efficiency and accuracy of association rule mining.
Confidence is a measure of the strength of the association between itemset A and itemset B in a transaction dataset, defined as the conditional probability of the simultaneous occurrence of itemset B in a transaction in which itemset A occurs, and is denoted by C. Its mathematical expression is:
where is the frequency of occurrence of both itemsets A and B and is the frequency of occurrence of itemset A.
To ensure the validity of the association rules and the generalization ability of the model, we pay special attention to those association rules with support greater than 0.3 and confidence greater than 0.5. A support lower than 0.3 may lead to an increase in the number of frequent itemsets and increase the risk of overfitting. Meanwhile, rules with confidence levels lower than 0.5 are usually regarded as weak associations, which are insufficient to indicate strong correlations among itemsets. In this paper, effective connecting edges are screened and generated to provide a solid foundation for in-depth analysis of the correlation between segments.
2.2. FP-Growth Algorithm Improvement Process
Although the FP-Growth algorithm shows significant effectiveness in the current research field, it may generate a large number of tree branches when dealing with large-scale datasets, which in turn affects the execution efficiency of the algorithm. To address this problem, this paper employs the pruning technique to optimize the search process and reduce the consumption of computational resources. Pruning, by eliminating branches with low contribution to the model, not only helps to simplify the model structure, but also enhances the prediction accuracy of the model. As shown in Figure 1, pruning realizes refining the structure of FP-Tree by identifying and merging sub-branches under the same parent branch, e.g., removing e{1} under f{1} and merging it into e{1} to form e{2}, which improves the computing speed without sacrificing the mining accuracy.
Aiming at the path optimization problem that may occur during the construction of FP-Tree by FP-Growth algorithm, a pruning step is introduced, and this key technique effectively simplifies the structure of the tree graph and lays the foundation for the subsequent association rule mining. In order to further improve the algorithm’s computational efficiency, especially its performance when dealing with large-scale datasets, the structure diagram shown in Figure 2 clearly demonstrates the execution flow of the parallel FP-Growth algorithm.
The data mining flow of the improved FP-Growth algorithm is shown in Figure 3.
In order to enhance the efficiency and performance of the FP-Growth algorithm, an improved method incorporating pruning and parallel computing is proposed. The implementation steps of the method are as follows:
① Initialize FP-Tree: by the first scanning of the database, the global frequent itemsets are identified and sorted in descending order according to the support threshold, and classified into the first group that satisfies the conditions and the second group that needs further filtering.
② Compressing frequent itemset data: after completing the pruning operation, the first set of itemsets is retained, while the frequent datasets in the second set of itemsets that exist only once are eliminated, thus reducing the redundancy of the data and the burden of the subsequent iterative computations.
③ Construct FP-Tree: the frequent itemsets obtained from the local processing are merged to form a global frequent itemset. Subsequently, a second scan of the database is performed and the FP-Tree is constructed starting from the empty set by utilizing the sorted frequent 1-item sets.
④ Generate conditional pattern base: based on the frequent item sets after parallel processing, generate association rules and calculate the corresponding edge weights to realize the parallelization of the algorithm so as to improve the running speed of the mining process.
⑤ Recursive Mining FP-Tree: In the item header table, items are combined with conditional pattern bases to form a new set of frequent items, and support and confidence are computed for all non-empty subsets. Eventually, association rules that satisfy the minimum support and confidence thresholds, which correspond to the weights of the connected edges in the network, are output.
- Table 2. Airline Network Factor.
where P (L) is the probability when the segment length is L; α is the positive coefficient controlling the growth rate. is the half-saturation constant, that is, when L reaches the changed value, P (L) reaches half of its maximum value. Through the above formula, the recovery probability of each section node can be calculated according to the le
3. Segment Network Correlation Construction and Analysis
The segment flight data are mainly from the 2023 China Civil Aviation Route Route Data, which are obtained by crawling through python software on the webpage http://www.carnoc.com/ . The June data were collected to mine and analyze the relative hourly traffic on the routes.
Relative hourly traffic is the number of flights on a particular segment in an hour and is used as a measure of how busy and loaded the air transportation system is. In this paper, the collected segment data are normalized in the following steps:
① Find the arithmetic mean ( Mathematical Expectation ) and standard deviation of each variable (indicator);
② Perform standardization:
where: is the normalized variable value; is the actual variable value.
③ Threshold filtering, where numbers greater than or equal to the mean are noted as 1 and less than the mean are noted as 0, results in a 0/1 two-state dataset.
3.1. Construct Segment Network Correlation Models
Constructing a topological model is a prerequisite for analyzing the correlation of the route network, the model G(V,E,W) consists of the correlation between the segments, segments, and the complex network in reality is usually described using graph theory. The node v in the model represents the segments interacting with a certain regional route network, and determines the set, whose number is m;The edge e represents the connectivity between segments and segments; the set is the set of edges, whose number is n(;) Theweight of the connected edges is the weight of the jth connected edge of the association rule mining based algorithm.
Taking the south-central region as an example, the improved FP-Growth algorithm is used for network construction. Firstly, the relative hourly flow data of the segments in the route information of China Civil Aviation Route in 2023 are collected; secondly, the dataset is preprocessed, including the frequency of counting items and filtering low-frequency items; then the frequent item set mining is performed to derive the correlation data table; then, the connecting edges that satisfy the minimum support threshold (greater than 0.3) and the minimum confidence threshold (greater than 0.5) are selected as the valid connecting edges, which are totaled to be 285 Finally, we construct the segment network correlation edges by taking the segment as the starting point (Source), the associated segment as the target, and the confidence as the weight.

Table 1.
Sector-Related Network Connectivity.
| Number | Source | Target | Weight |
| 1 | HOK-OBLIK | DAPRO-AKUBA | 0.8438 |
| 2 | DAPRO-AKUBA | IDUMA-GLN | 0.8350 |
| 3 | HOK-OBLIK | P61-ENH | 0.6875 |
| 4 | BIPOP-KD | AKUBA-LUMKO | 0.7174 |
| 5 | BIPOP-KD | P234-P373 | 0.6739 |
| ... | ... | ... | ... |
| 281 | IGOMO-ZK | P159-ZHJ | 0.5258 |
| 282 | AKUBA-LUMKO | FYG-ZHO | 0.53125 |
| 283 | ENH-P373 | P159-ZHJ | 0.5795 |
| 284 | P159-ZHJ | ENH-P373 | 0.5604 |
| 285 | HOK-OBLIK | P159-ZHJ | 0.5667 |
Using Gephi software, a directed graph of segment network correlation containing 180 nodes and 285 connected edges was drawn based on the connected edge relationship, as shown in Figure 4. The graph visualizes the correlation between segments and provides a visual perspective for further analysis of the interactions between segments.
3.2. Indicators of Correlation Topological Properties of the Segment Network
A series of topological metrics are further selected to achieve the quantification of the correlation complexity of the segment network and to map the complex interactivity of air traffic.
① Degree Centrality as a key indicator of the importance of a network node, has a value that is proportional to the number of connected edges of the node, reflecting the node’s degree of connectivity and potential influence in the network. The calculation formula is as follows:
where n denotes the total number of nodes in the network and denotes the degree of the node, i.e., the number of other nodes that are connected to node v. The higher the degree centrality, the more connected node v is in the network and the more significant it is in the segment network correlation.
Table 2.
Parameter List of Degree Centrality Indicators.
| serial number | numerical value | Corresponding nodes | rankings |
|---|---|---|---|
| 41 | 0.537313433 | YIH-ENH | 1 |
| 40 | 0.507462687 | ENH-P373 | 2 |
| 48 | 0.507462687 | GOSMA-LLC | 3 |
| 42 | 0.47761194 | P61-ENH | 4 |
| 47 | 0.358208955 | GOSMA-LKO | 5 |
| 45 | 0.298507463 | VIPAP-GLN | 6 |
| 46 | 0.298507463 | IDUMA-GLN | 7 |
| 43 | 0.268656716 | FYG-ZHO | 8 |
| 51 | 0.268656716 | GUGAM-LIN | 9 |
| 55 | 0.268656716 | HOK-OBLIK | 10 |
Figure 5.
Degree centrality node mapping graph.
② The importance of a node in the network PageRank depends not only on the number of its neighboring nodes but also on the importance of these neighboring nodes. In weighted networks, the importance assessment of PageRank is quantified by the following formula:
where d denotes the probability of randomly jumping to other nodes, and in this paper, we set the damping coefficient 0.85 to reflect the user’s random browsing behavior in the network. Where denotes the set of nodes connected to node v and denotes the size of the set of nodes connected to node u. By calculating the access probability of nodes to determine the importance in the network, the identified key segments are more important for understanding the network structure and optimizing the network performance.
Table 3.
Parameter List of PageRank Indicators.
| serial number | numerical value | Corresponding nodes | rankings |
|---|---|---|---|
| 41 | 0.051892546 | YIH-ENH | 1 |
| 40 | 0.050518788 | ENH-P373 | 2 |
| 48 | 0.046513524 | GOSMA-LLC | 3 |
| 42 | 0.04650554 | P61-ENH | 4 |
| 46 | 0.034805308 | IDUMA-GLN | 5 |
| 45 | 0.033696961 | VIPAP-GLN | 6 |
| 47 | 0.032517298 | GOSMA-LKO | 7 |
| 56 | 0.032175325 | WHA-HOK | 8 |
| 43 | 0.031745663 | FYG-ZHO | 9 |
| 51 | 0.030911148 | GUGAM-LIN | 10 |
Figure 6.
PageRank Node Mapping Graph.
③ Eigenvector Centrality has been applied to measure the importance of each node in the correlation of the segment network, a metric that takes into account not only the degree of the node (i.e., the number of directly connected neighbors), but also the importance of neighboring nodes. Its calculation is based on the following iterative formula:
ไhere, denotes the eigenvector centrality value of node i, denotes the weight of the edge pointing from node j to node i, λ is a constant of proportionality, and n is the total number of nodes in the network. After many iterations, the formula can be transformed into matrix form:
Here, A is the adjacency matrix of the network, and x is the eigenvector corresponding to the eigenvalue λ.
Eigenvector centrality reveals a key structural feature of segment network correlation, a metric that not only emphasizes the local connectivity patterns of the nodes, but also reflects the position and influence of the nodes in the overall network structure.
Table 4.
Parameter List of Eigenvector Centrality Indicators.
| serial number | numerical value | Corresponding nodes | rankings |
|---|---|---|---|
| 48 | 0.362698825 | GOSMA-LLC | 1 |
| 41 | 0.361836666 | YIH-ENH | 2 |
| 40 | 0.34975014 | ENH-P373 | 3 |
| 42 | 0.336310779 | P61-ENH | 4 |
| 47 | 0.279491837 | GOSMA-LKO | 5 |
| 97 | 0.252152445 | MABAG-NOMAR | 6 |
| 55 | 0.243061461 | HOK-OBLIK | 7 |
| 59 | 0.2344985 | HUY-TRN | 8 |
| 35 | 0.167105634 | IGPAR-DYG | 9 |
| 31 | 0.166197437 | DUBAG-NOPIN | 10 |
Figure 7.
Eigenvector Centrality Node Mapping Graph.
In summary, we draw on complex network theory and use a multidimensional analysis to explore the structural properties of the correlation of the segment network in the central and southern regions. By comprehensively considering the attributes of nodes themselves and neighboring nodes, and in-depth calculations and analyses have been carried out on the nodes of the segments. It is found that connecting edges occupy an important position in the network, especially playing a key role in maintaining the stability of the network structure and facilitating the flow of information.
Some specific segment nodes, such as GOSMA-LLC, YIH (Yichang)-ENH (Enshi Airport), ENH (Enshi Airport)-P373, and P61-ENH (Enshi Airport), have a significant impact on the operational efficiency and safety of the whole network due to their strategically important locations in the network. These nodes not only serve as navigational stations and flight mandatory reporting points, but also show high values on centrality and connectivity indicators in the network.
In Table 5, the degree centrality and web page ranking are both at a high level, and the overall structural connectivity is kept better. The mean value of eigenvector centrality is 0.0999, the overall value of the index is better, the information transmission within the network is smoother, and the operation status is basically stable.
4. Comparative Analysis of Examples
4.1. Algorithm Time Comparison
The improved FP-Growth algorithm proposed in this paper improves the algorithm by adding “parallel” and “pruning” steps. In order to verify the advantage of the algorithm in terms of response time, the response time of the improved algorithm is tested against other association mining algorithms based on python 3.12.2 experimental environment with different dataset sizes and compared with the simulation, and the results are shown in Figure 8.
We comparatively analyze the running time of three different frequent itemset mining algorithms-the traditional Apriori algorithm, the FP-Growth algorithm, and the improved FP-Growth algorithm-under different dataset sizes. The experimental results show that the running time of all algorithms tends to increase as the dataset size increases. At smaller dataset sizes (e.g., 100), the difference in runtime between these algorithms is not significant. However, as the dataset size grows, especially when the data size exceeds 600, the running time of the Apriori algorithm increases to 49.3 ms, whereas the running time of the FP-Growth algorithm and the improved FP-Growth algorithm is relatively low at 20.4 ms and 18.4 ms, respectively.
This phenomenon is attributed to the essential difference in design between the Apriori algorithm and the FP-Growth algorithm.The Apriori algorithm requires multiple scans of the dataset to generate the set of candidate items, while the FP-Growth algorithm requires only two traversals of the dataset to construct the FP-Tree, resulting in a reduction in the running time. Specifically, the average running time of the Apriori algorithm is 42.37 milliseconds, while the average running time of the FP-Growth algorithm is 19.65 milliseconds, and the improved FP-Growth algorithm further reduces it to 18.43 milliseconds. This indicates that the improved FP-Growth algorithm is 10% and 56.5% more efficient than the conventional FP-Growth and Apriori algorithms, respectively.
4.2. Node Performance Testing
In order to evaluate the performance of the optimized FP-Growth algorithm in depth, a set of controlled experiments was designed. In this experiment, data with a segment correlation support of 20% was selected for comparing the performance difference between the improved algorithm and the traditional algorithm. When the support is below 30%, a large number of datasets with weak correlations are generated, which puts a higher demand on the accuracy of the algorithm. In addition a large amount of data was randomly extracted from the relative hourly flight traffic data and three large-scale datasets were constructed, named B1, B2, and B3, respectively. Figure 11, Figure 12, Figure 13 and Figure 14 demonstrate the performance of the three different datasets as well as the 10 task nodes in executing the traditional Apriori algorithm, the traditional FP-Growth algorithm, and the improved FP Growth algorithm when comparing the time.
Figure 9.
Comparison of Three Sets of Data with 20% Support of Traditional Apriori Algorithm.
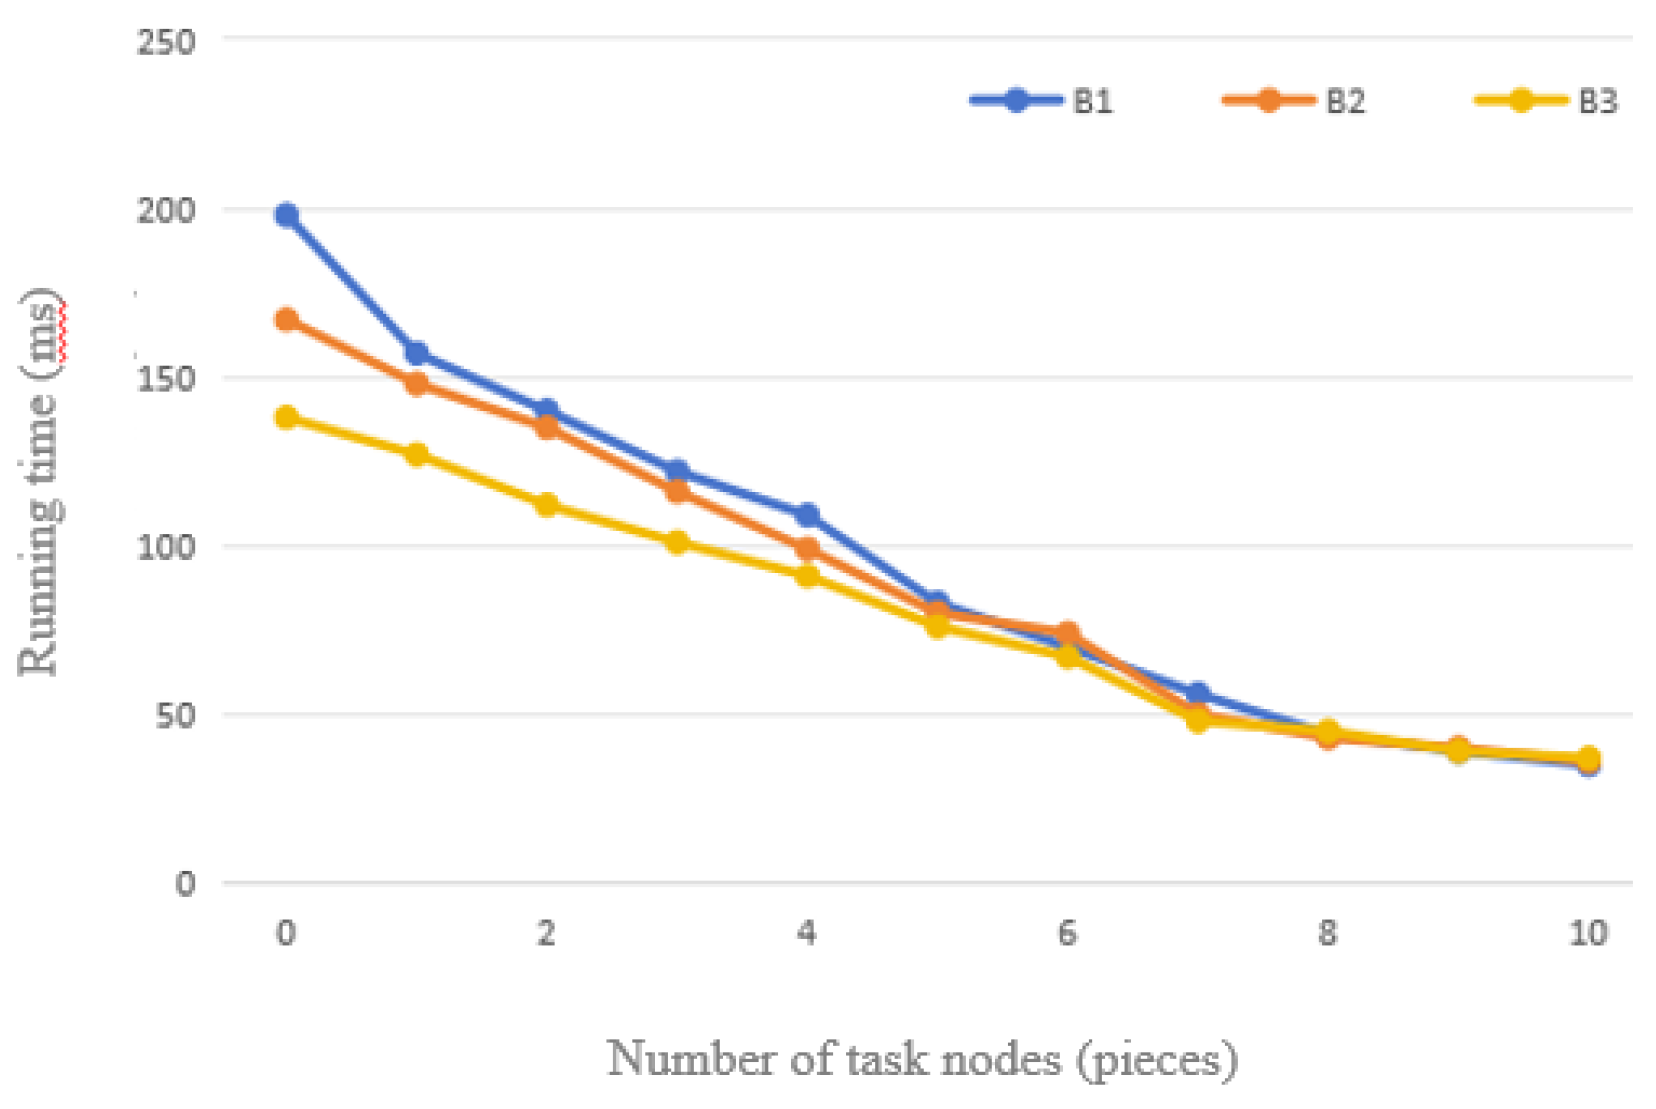
Figure 10.
Comparison of Three Sets of Data with 20% Support of Traditional FP-Growth Algorithm.
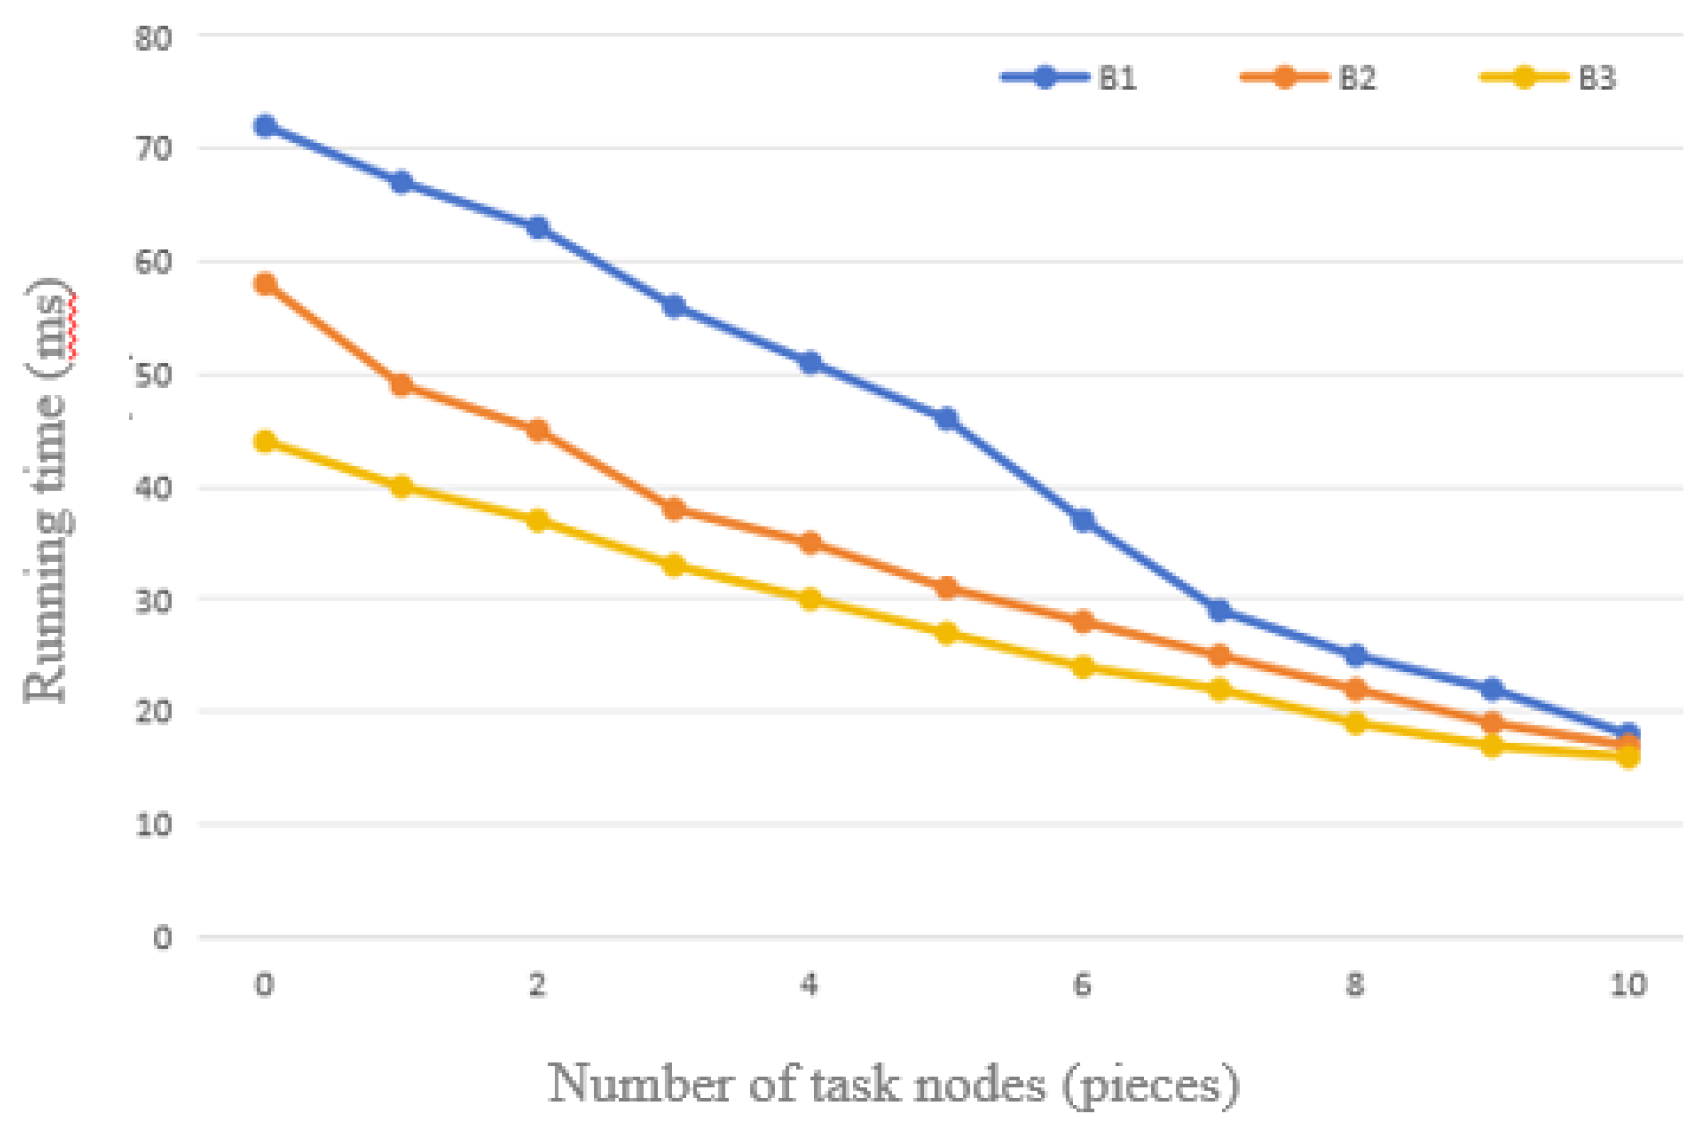
Figure 11.
Comparison of Three Sets of Data with 20% Support for the Improved FP-Growth Algorithm.
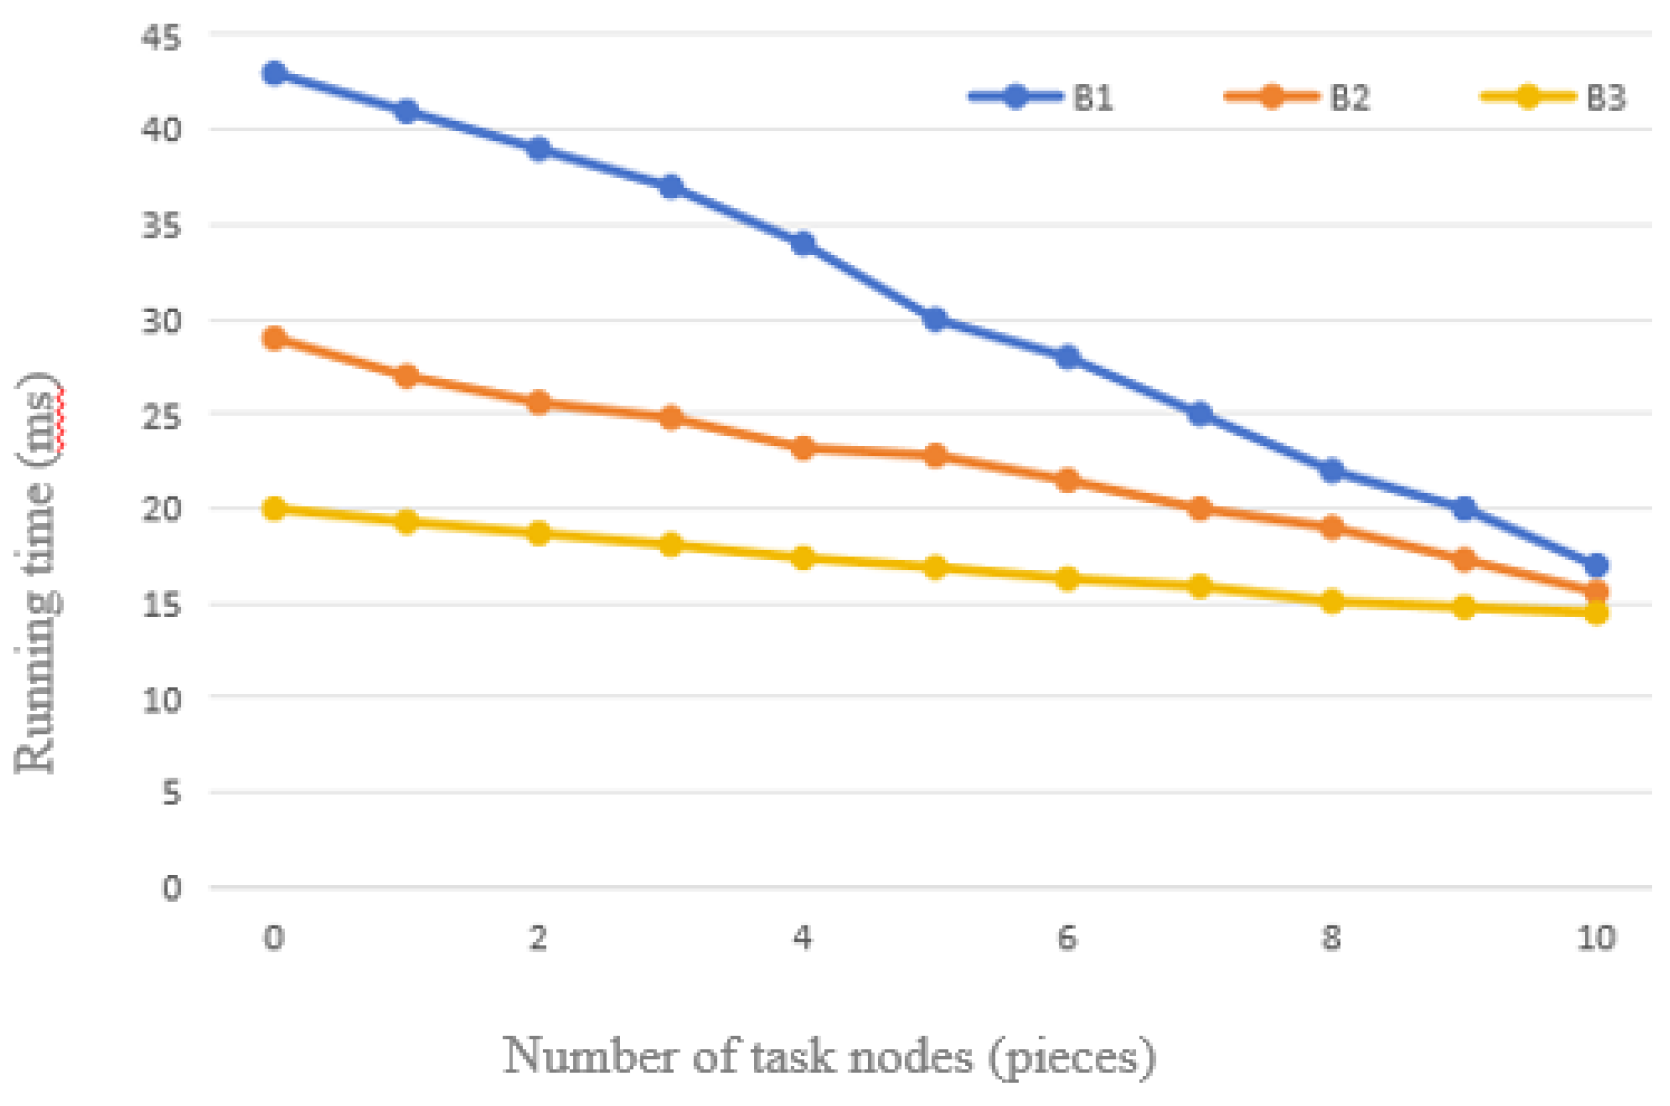
From the comparison charts of the above tests, a clear trend can be observed: with a fixed amount of data, the relative time required by the optimized FP-Growth algorithm shows a decreasing trend as the number of task nodes grows. The reason for this phenomenon is that although the increase in the number of nodes slightly increases the communication time, this increase is much smaller than the computational efficiency improvement brought about by the optimization of the algorithm. At the same time, the Apriori algorithm, which requires traversing the entire dataset, takes a correspondingly longer time to run as the amount of data increases.
4.3. Reality of Connecting the Edges
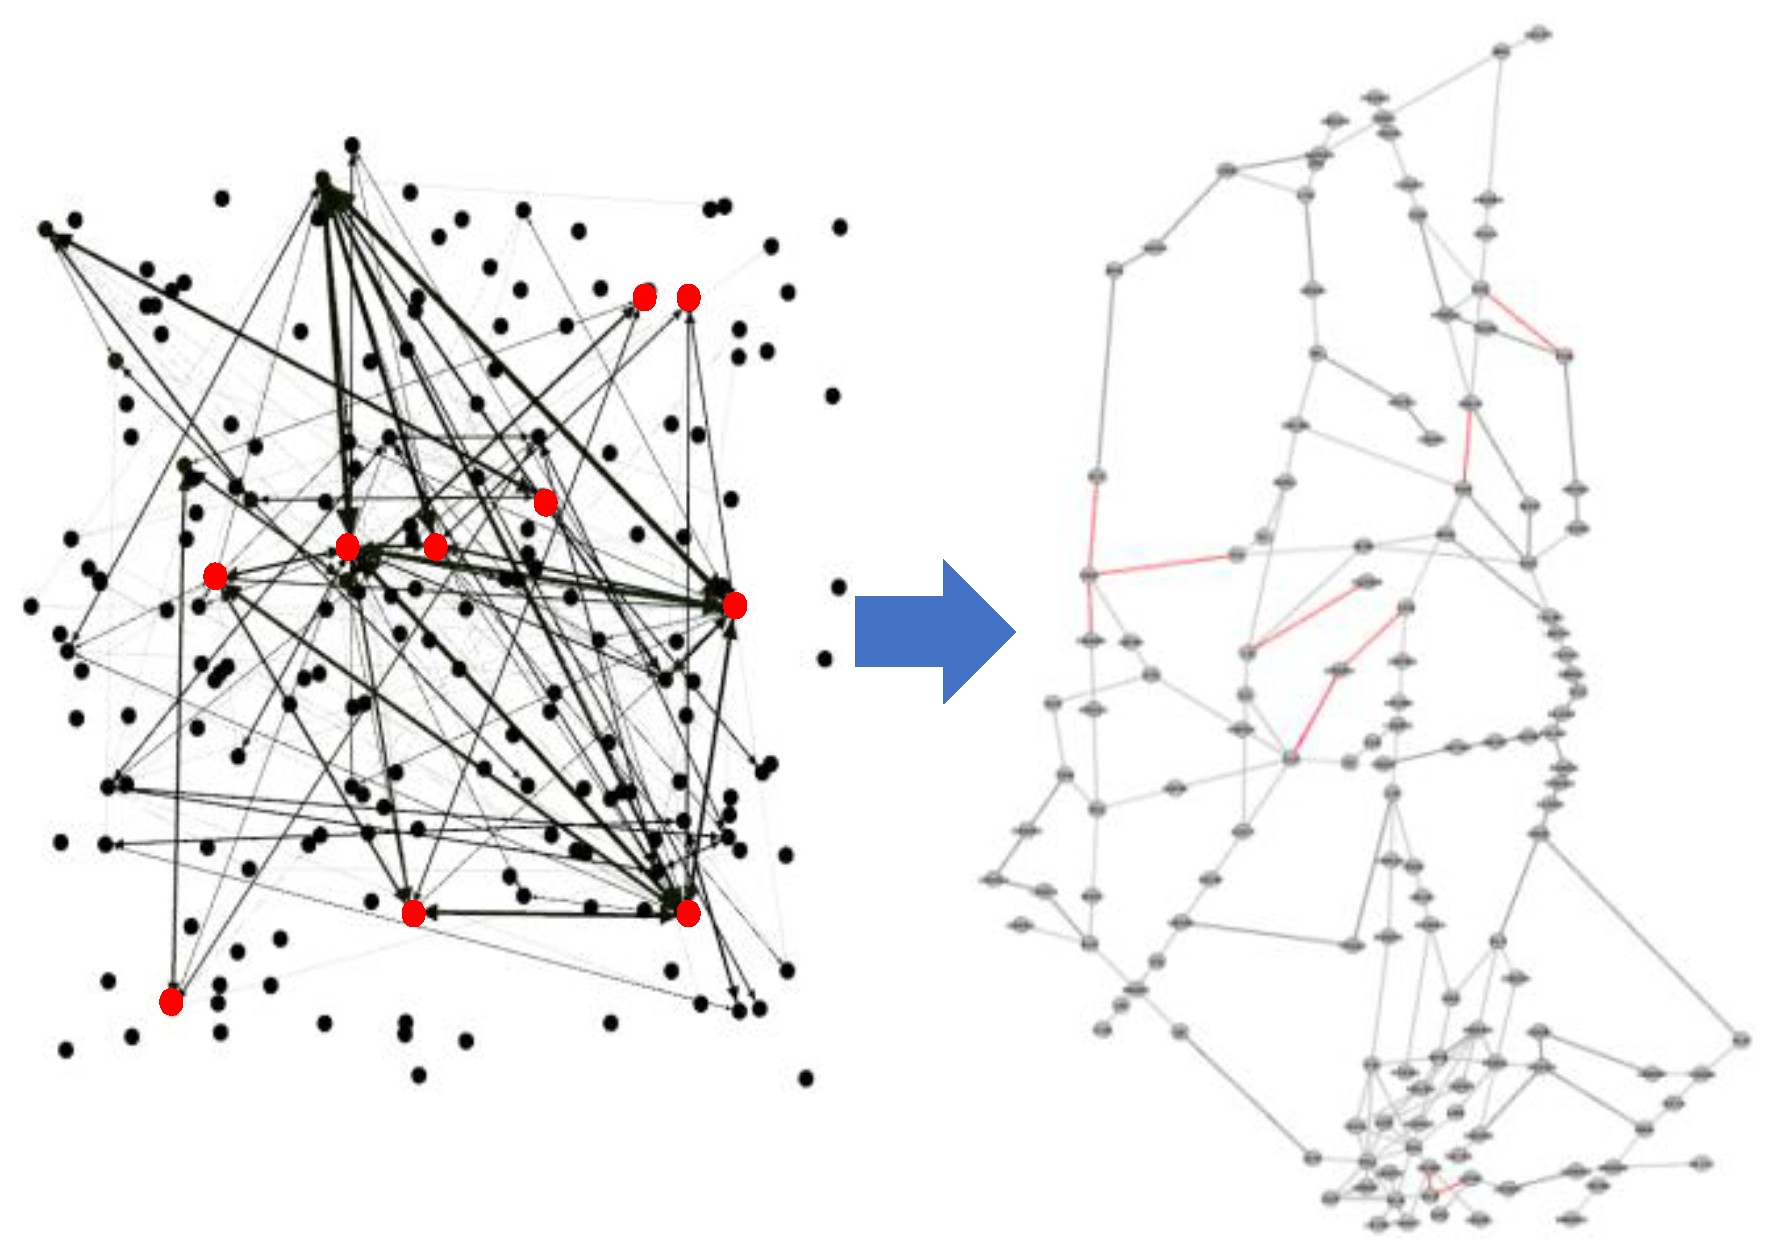
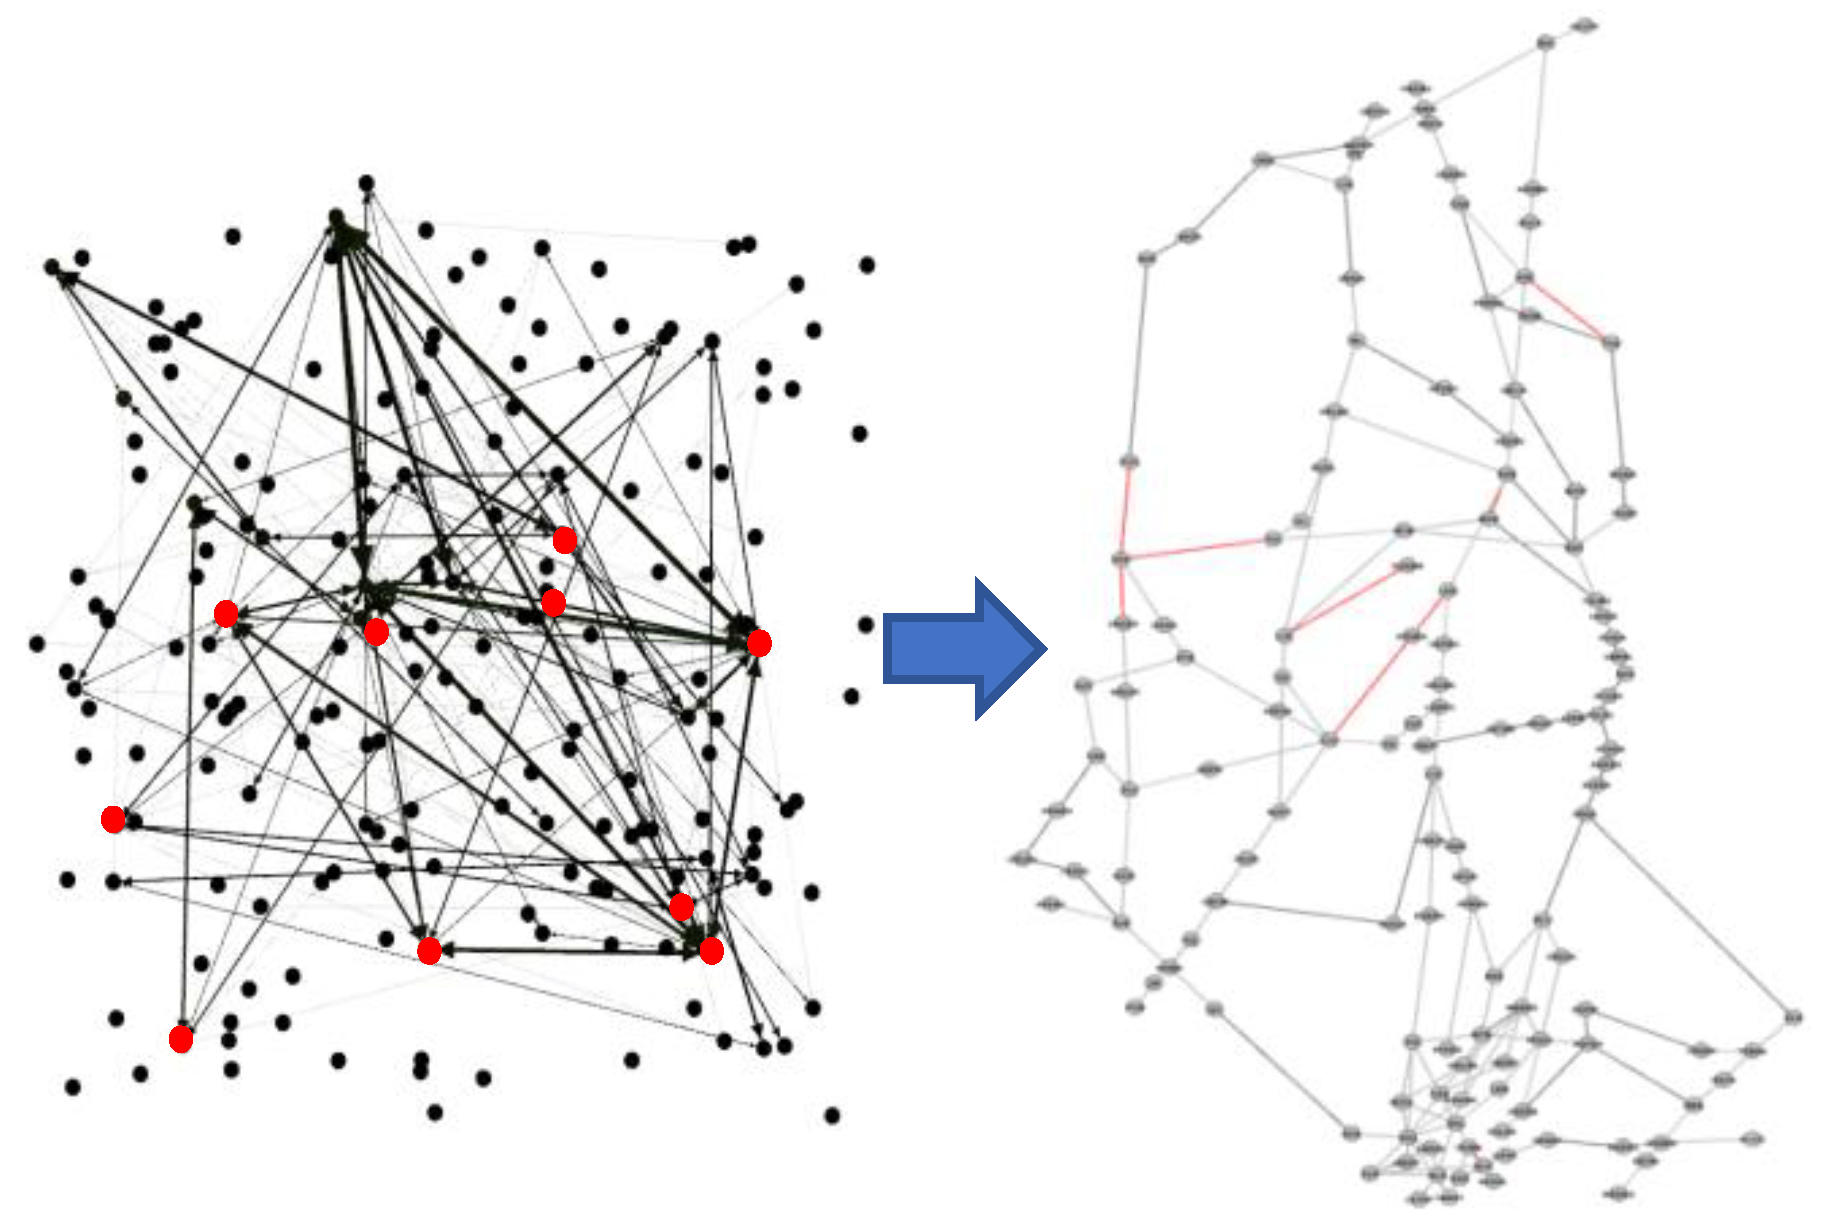
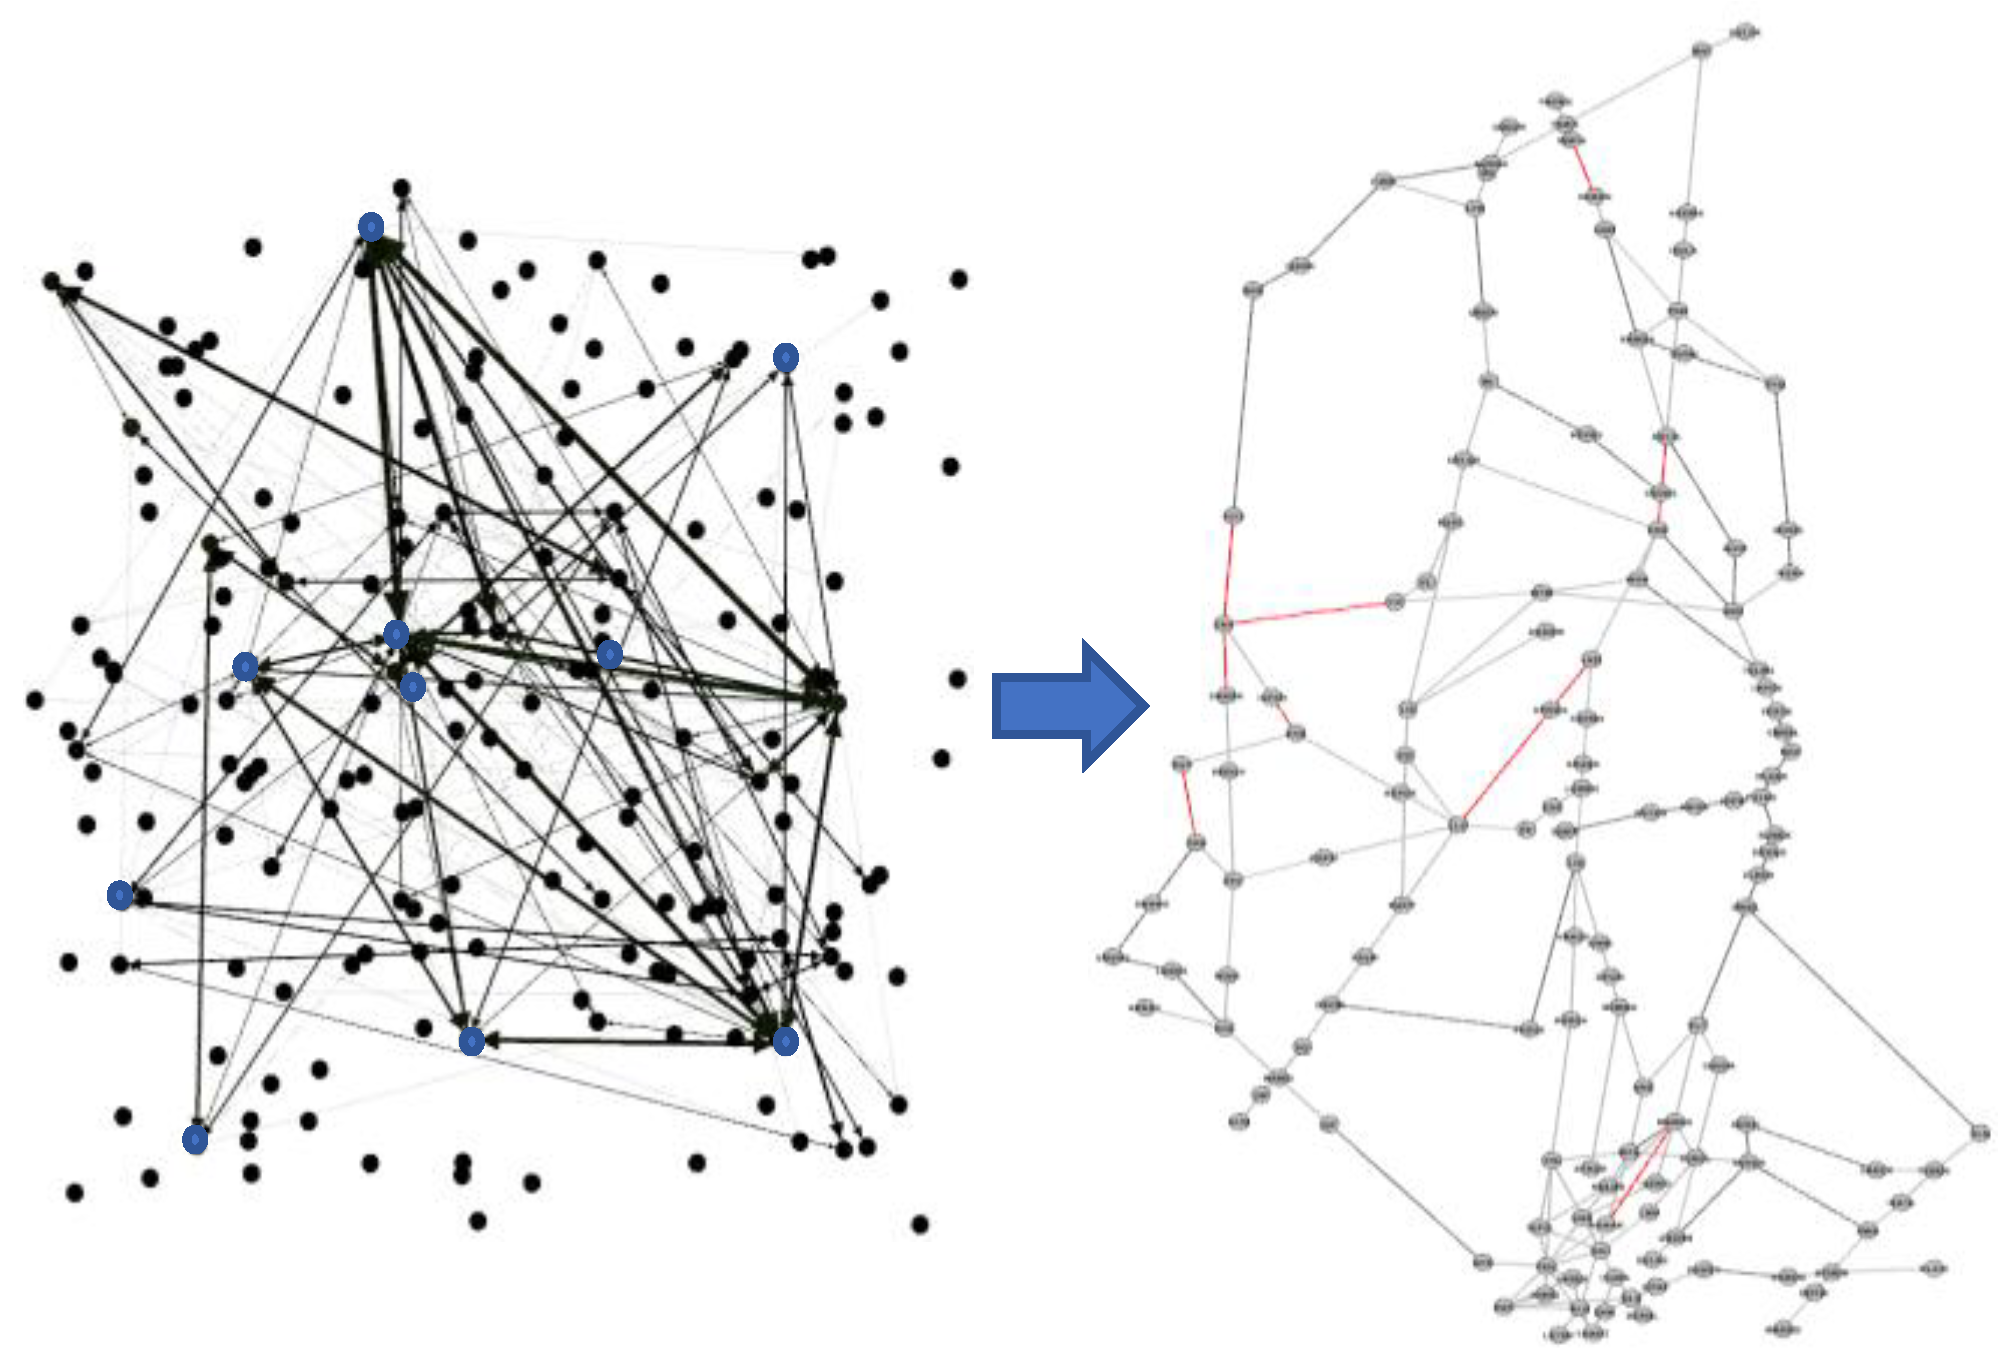
Based on the formula calculation of topological characteristic indexes, the nodes in the correlation of the segment network were accurately mined and analyzed, and mapped to the actual network connecting edges in the central and southern regions. By applying key network metrics such as degree centrality, eigenvector centrality and PageRank, key segment nodes in the network, which occupy a pivotal position in the network structure, are identified. Not only the connectivity and influence of the nodes are quantified, but also the complex interactions and information flow patterns among the segments are revealed.
Through an in-depth analysis of the regional air segment network in the central and southern regions, we successfully linked the theoretical calculations to the actual network structure, marked the key nodes searched by the algorithm, and mapped these nodes to specific network connecting edges. This process not only verifies the validity of the selected topological characterization metrics, but also provides an intuitive perspective for understanding the structural properties and functions of regional aviation networks.
Figure 12.
Critical Node Correspondence Network.
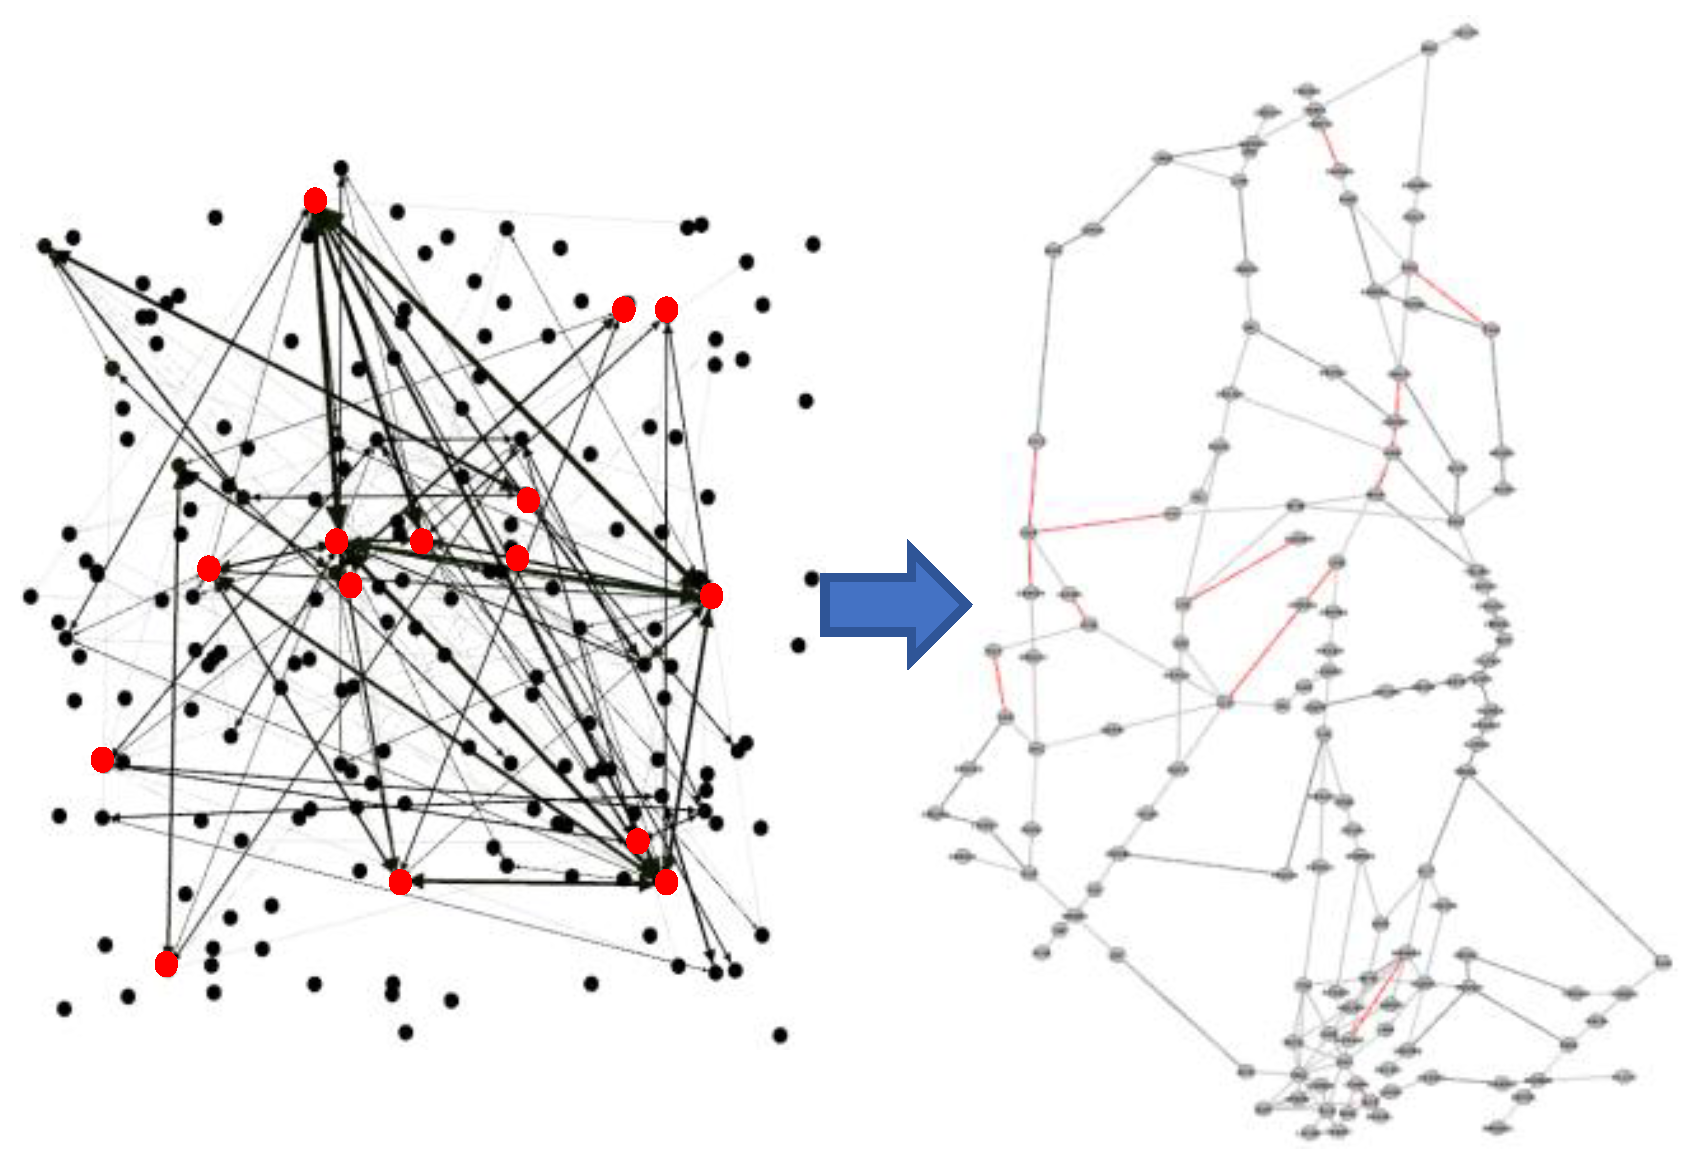
The importance of identifying real network connectivity edges through segment correlation analysis is manifested at several levels: first, it provides a key perspective for understanding the structural characteristics of the aviation network, revealing the connectivity patterns between airport nodes and the nature of the network topology; second, correlation analysis optimizes the network layout and reduces the operational costs; in addition, the analysis provides data support for airlines to develop effective risk management strategies in response to flight cancellations, delays, or other disruptions; also, it enhances airlines’ insights into market competition by identifying key segments, such as ENH (Enshi Airport)-P373 and YIH (Yichang)-ENH (Enshi Airport), which are notable contributors to the promotion of regional economic and tourism development.
As a key node, the strategic development and construction of Enshi Airport not only enhances the traffic capacity of Enshi and even the central and southern regions, but also strengthens the capacity of regional emergency rescue and national defense construction. This plays a key role in alleviating the contradiction between urban development and airport operation and serving local economic development. Through the analysis of these key connecting edges, this study not only provides a scientific basis for aviation network planning and management, but also contributes significant value to the sustainable development of air transportation system.
5. Conclusion
The aim of this study is to characterize segment correlations based on relative hourly flow data, with in-depth data mining and advantageous integration through an improved FP-Growth algorithm. The method quantifies the potential correlation between segments in the form of data. The key segments are identified through different complex network theory metrics correlation analysis and summarized in the real network of South Central region. Experiments show that the improved FP-Growth algorithm improves 10% and 56.5% in time running compared with the traditional FP-Growth algorithm and Apriori algorithm; combined with the topological characteristic metrics, it improves the connectivity and robustness of the segment correlation analysis. It provides a theoretical basis for the inefficient operation of multiple segments and the difficulty of identifying key segments in the airspace in real scenarios, and provides controllers with an intuitive grasp of key segments, which helps to improve the safety and efficiency of the air transportation system.
Although there are some limitations in the acquisition of segment data, and the selection of the number of segments and flight traffic data has not yet been comprehensively covered, the subsequent study will be committed to screening and analyzing the data of segments in a wider range of airspace, with a view to providing a more feasible and universally applicable network construction plan.
References
- Yu Shasha,Chen Xingyu. Key technological innovations and challenges in urban air transportation[J/OL]. Journal of Aviation,1-15[2024-07-05].
- ZHANG Zhaoning,ZHANG Jia. Propagation of large flight delays based on SEIR model[J]. Science, Technology and Engineering,2020,20(08):3356-3361.
- Li Shanmei,Zhou Xiangzhi. Airport departure flight delay prediction based on S2S-CNN-GRU[J]. Chinese Journal of Safety Science,2023,33(08):93-100. [CrossRef]
- LI Ang, ZHAI Wenpeng, AN Qi. Flight time optimization of North China airport cluster for on-time performance improvement[J]. Computer Simulation,2020,37(02):38-40.
- Sun Yue,Ding Jian. Stacking integrated prediction model of flight delays for severe weather[J/OL]. Big Data,1-18[2024-07-05].
- LIU Fei,YU Minjian,LI Jiawei,et al. Flight conflict critical point identification based on complex network theory[J]. Journal of Air Force Engineering University(Natural Science Edition),2019,20(04):19-25.
- Lin He. Impact of optimization and innovation of air transport system on enhancing aviation safety[J]. China Aviation Weekly, 2023,(29):76-78.
- XU Feng,YIN Jia-Nan,YANG Wen-Dong,et al. Reliability analysis of air-rail intermodal super network under flight delay perturbation[J/OL]. Complex Systems and Complexity Science,1-10[2024-07-05].
- Cai, Guan-Wen. On the analysis and solution of aviation communication and navigation interference factors[J]. China Aviation Weekly,2021,(03):58-59.
- WANG Shaopeng,NIU Chaoyu. Clustered frequent pattern mining for time-ordered transaction data[J/OL]. Journal of Software,1-20[2024-07-05].
- LIU Donghua,ZHAO Xing,ZHAO Jiangping. Dynamic association network analysis of tower crane accident causation based on improved Apriori algorithm[J]. Safety and Environmental Engineering,2023,30(06):106-112.
- Qiao Yangyang,Wang Lijuan. Simulation of parallel FP-Growth mining algorithm for data point locations[J]. Computer Simulation,2023,40(05):501-505.
- Xie Zhaoxian,Zou Xingmin,Zhang Wenjing. An efficient decision tree parameter pruning algorithm for large datasets[J]. Computer Engineering,2024,50(01):156-165.
- XU Xianze,TAN Shenghuang,LIU Jing et al. User location prediction based on parallel pattern mining and path matching[J]. Journal of Northeastern University (Natural Science Edition),2020,41(06):767-770+777.
- WANG Yu,WEN Guobing,LEI Di,et al. Optimization design of airport route network under two-layer planning model[J]. Transportation Science and Economy,2023,25(02):24-31.
- Zhang Haoyu. Research on flight delay propagation characteristics based on complex network theory [D]. Nanjing University of Aeronautics and Astronautics, 2018.
- Guan Xiangmin, Zhao Shuazhe. Research on airport risk communication network for aviation network[J/OL]. Journal of Beijing University of Aeronautics and Astronautics,1-14[2023-04-23].
- WANG Xinglong, ZHU Lina, SHI Zongbei. Modeling and correlation analysis of multilayer route aggregation network [J]. Science, Technology and Engineering, 2020, 20(3):1243-1249.
- HU Funian,YANG Weidan,CHEN Jun. Robustness assessment of power infophysical systems based on key nodes[J/OL]. Complex Systems and Complexity Science,1-9[2024-06-30].
Figure 1.
Pruning process.
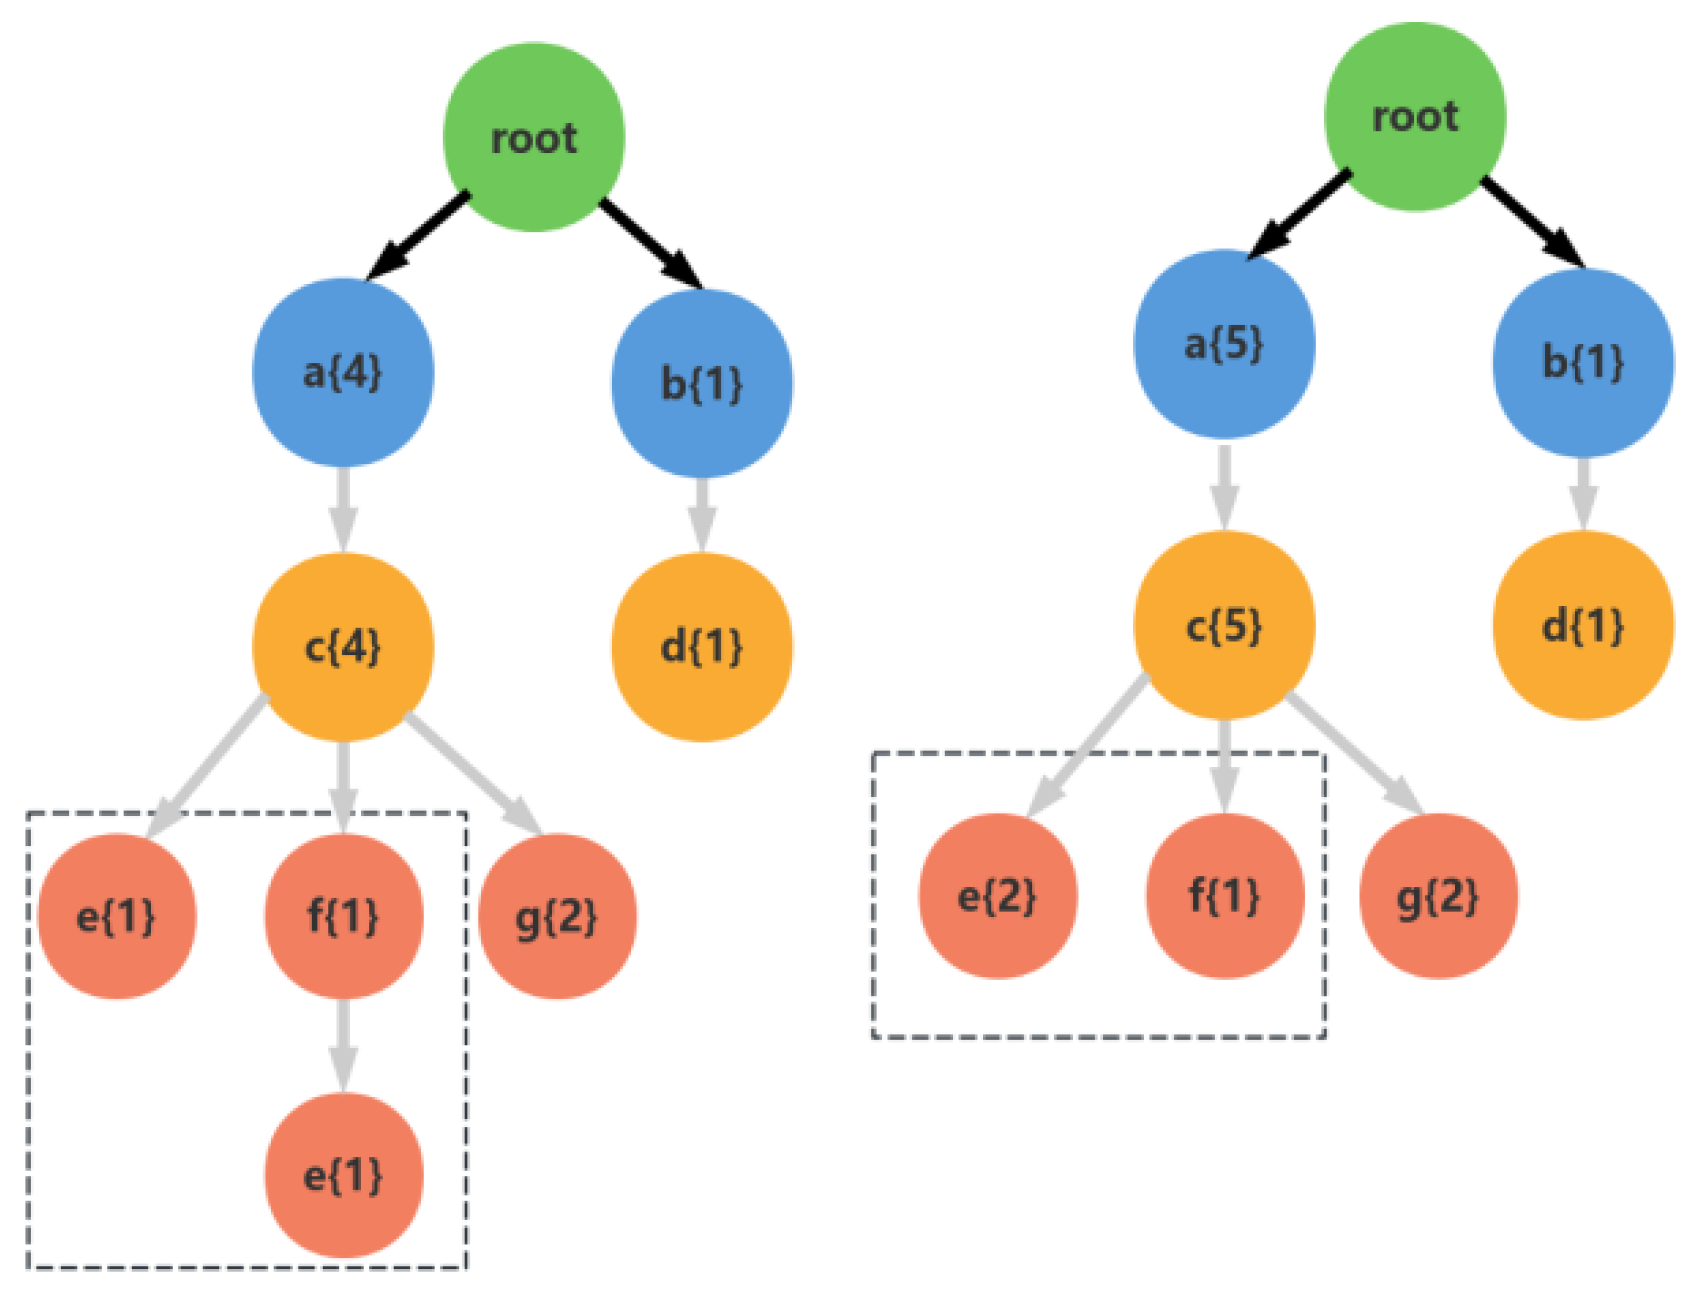
Figure 2.
Structure of the parallel method.
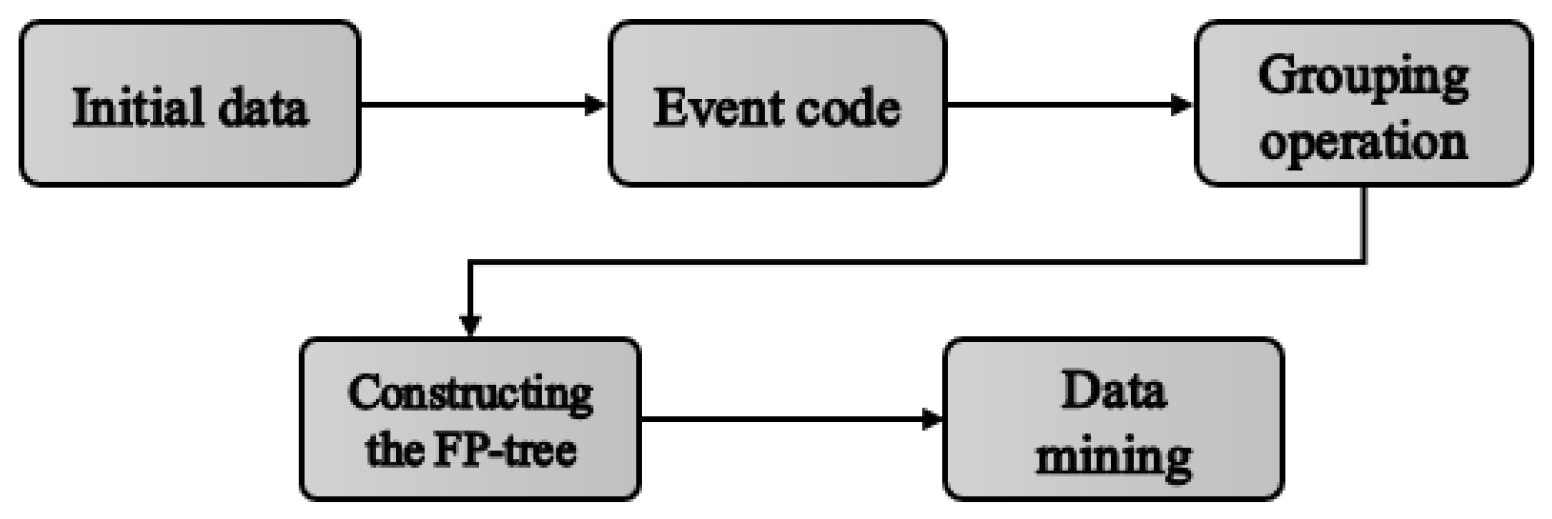
Figure 3.
Data mining process based on improved FP-Growth algorithm.
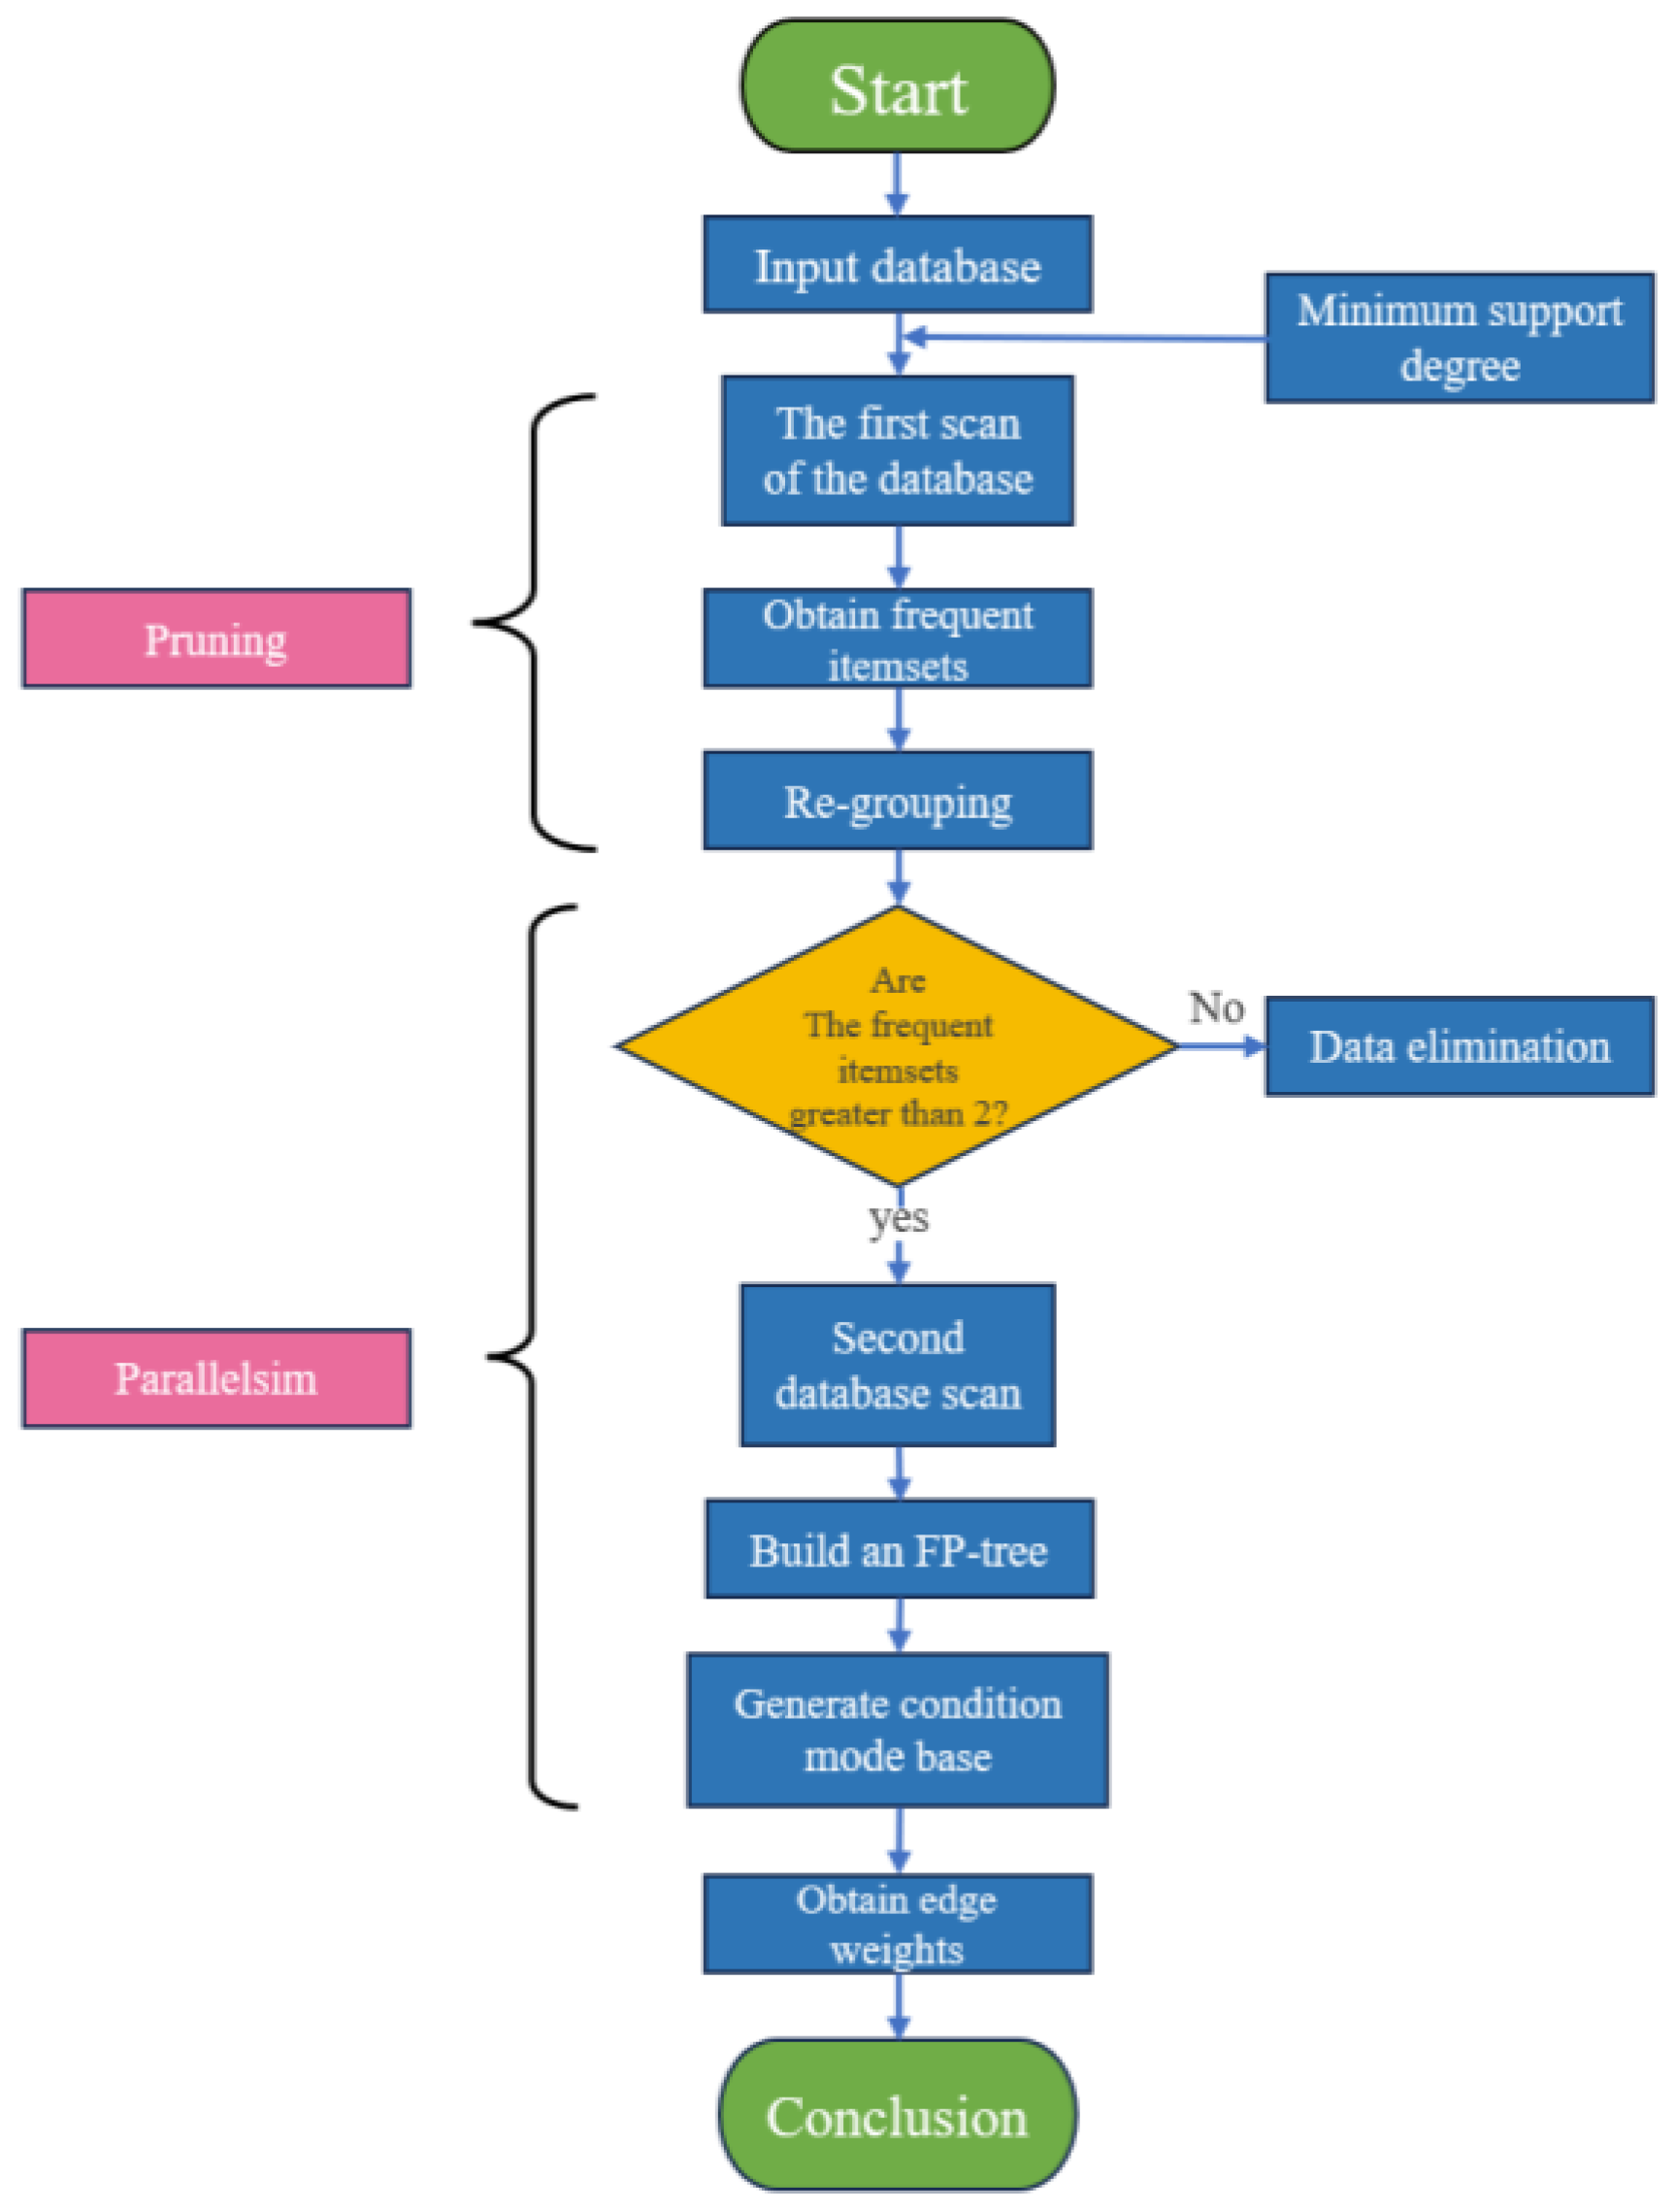
Figure 4.
Schematic diagram of segment network correlation.
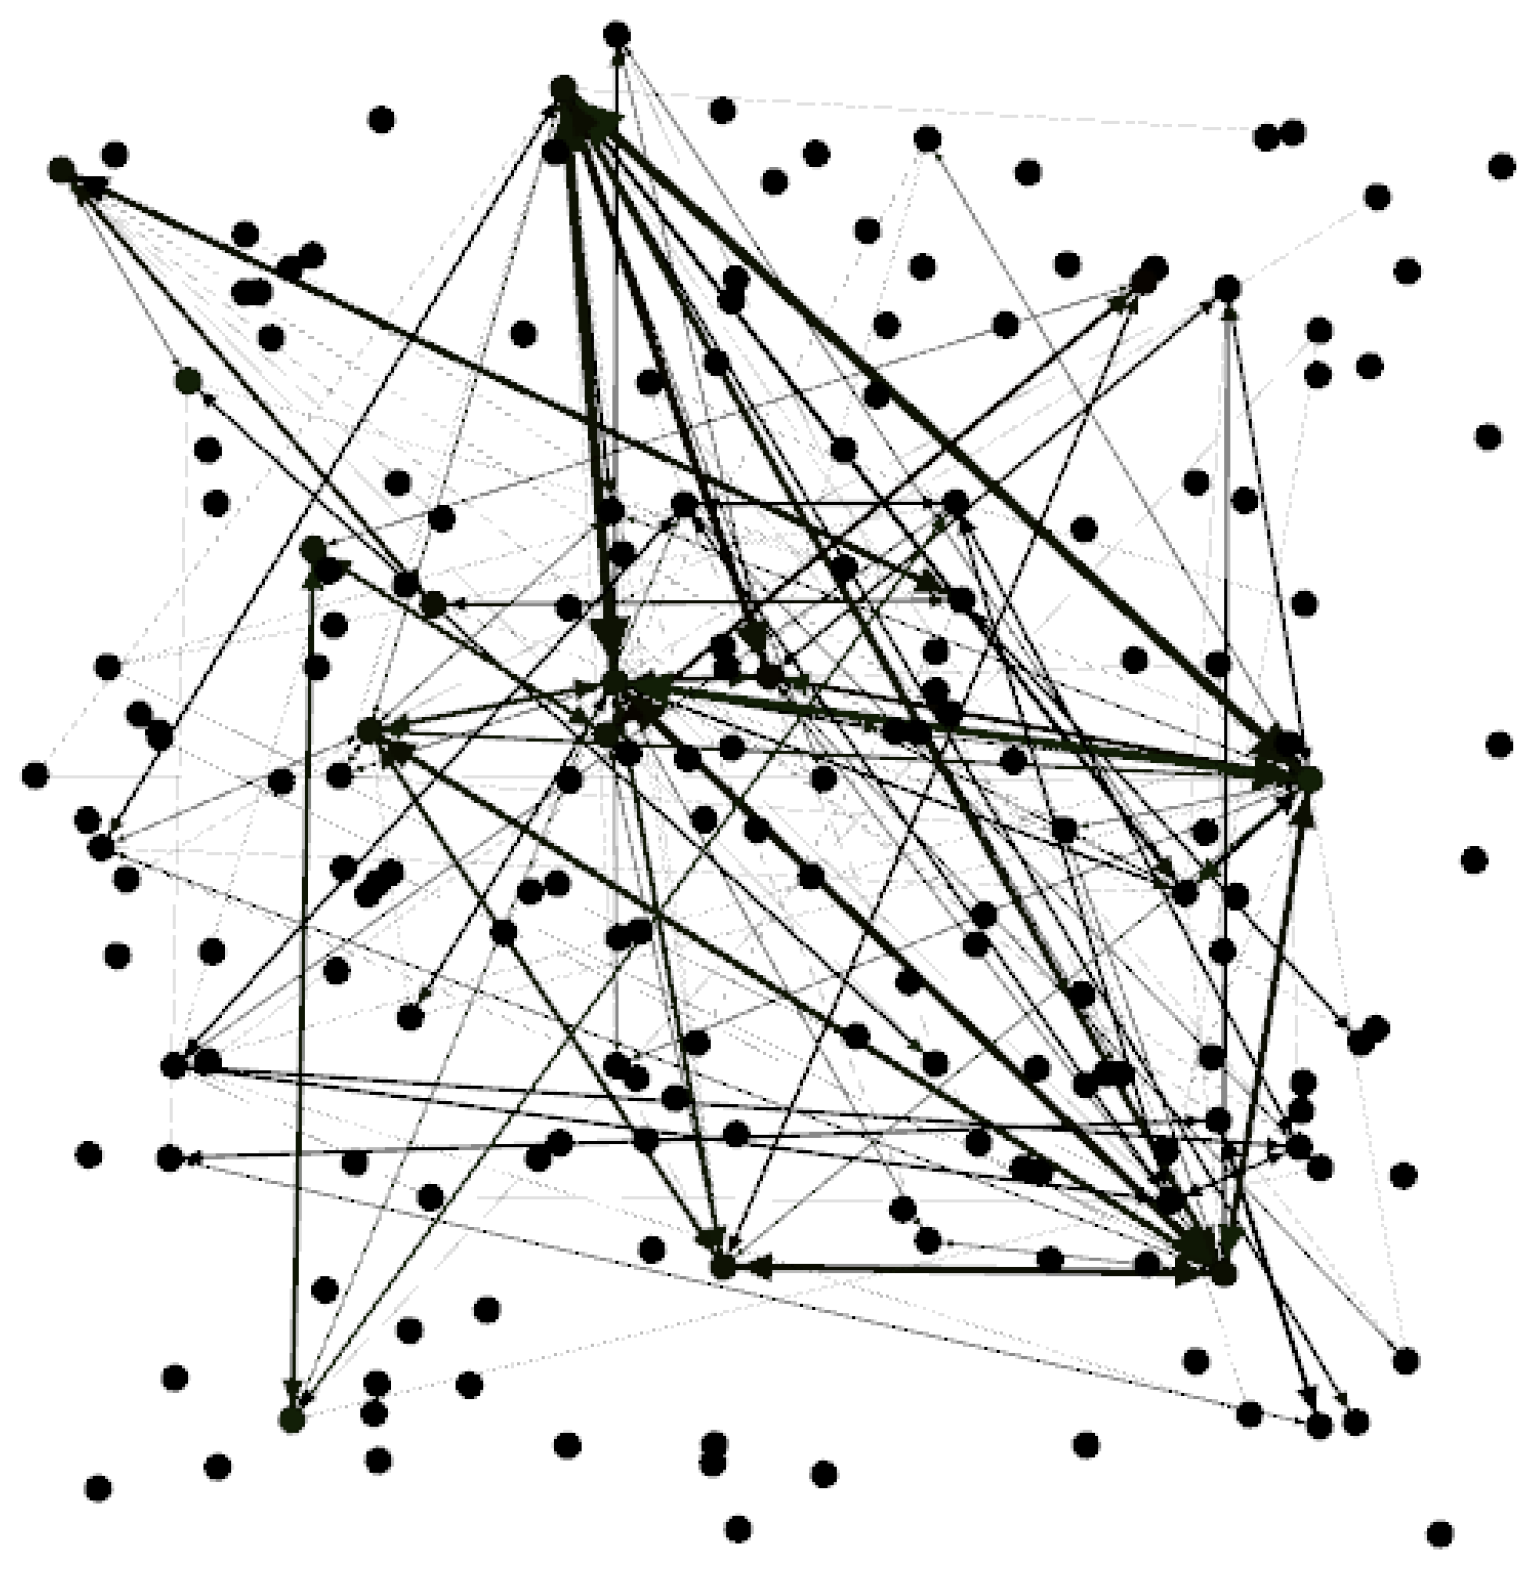
Figure 8.
Algorithm Time Comparison Graph.
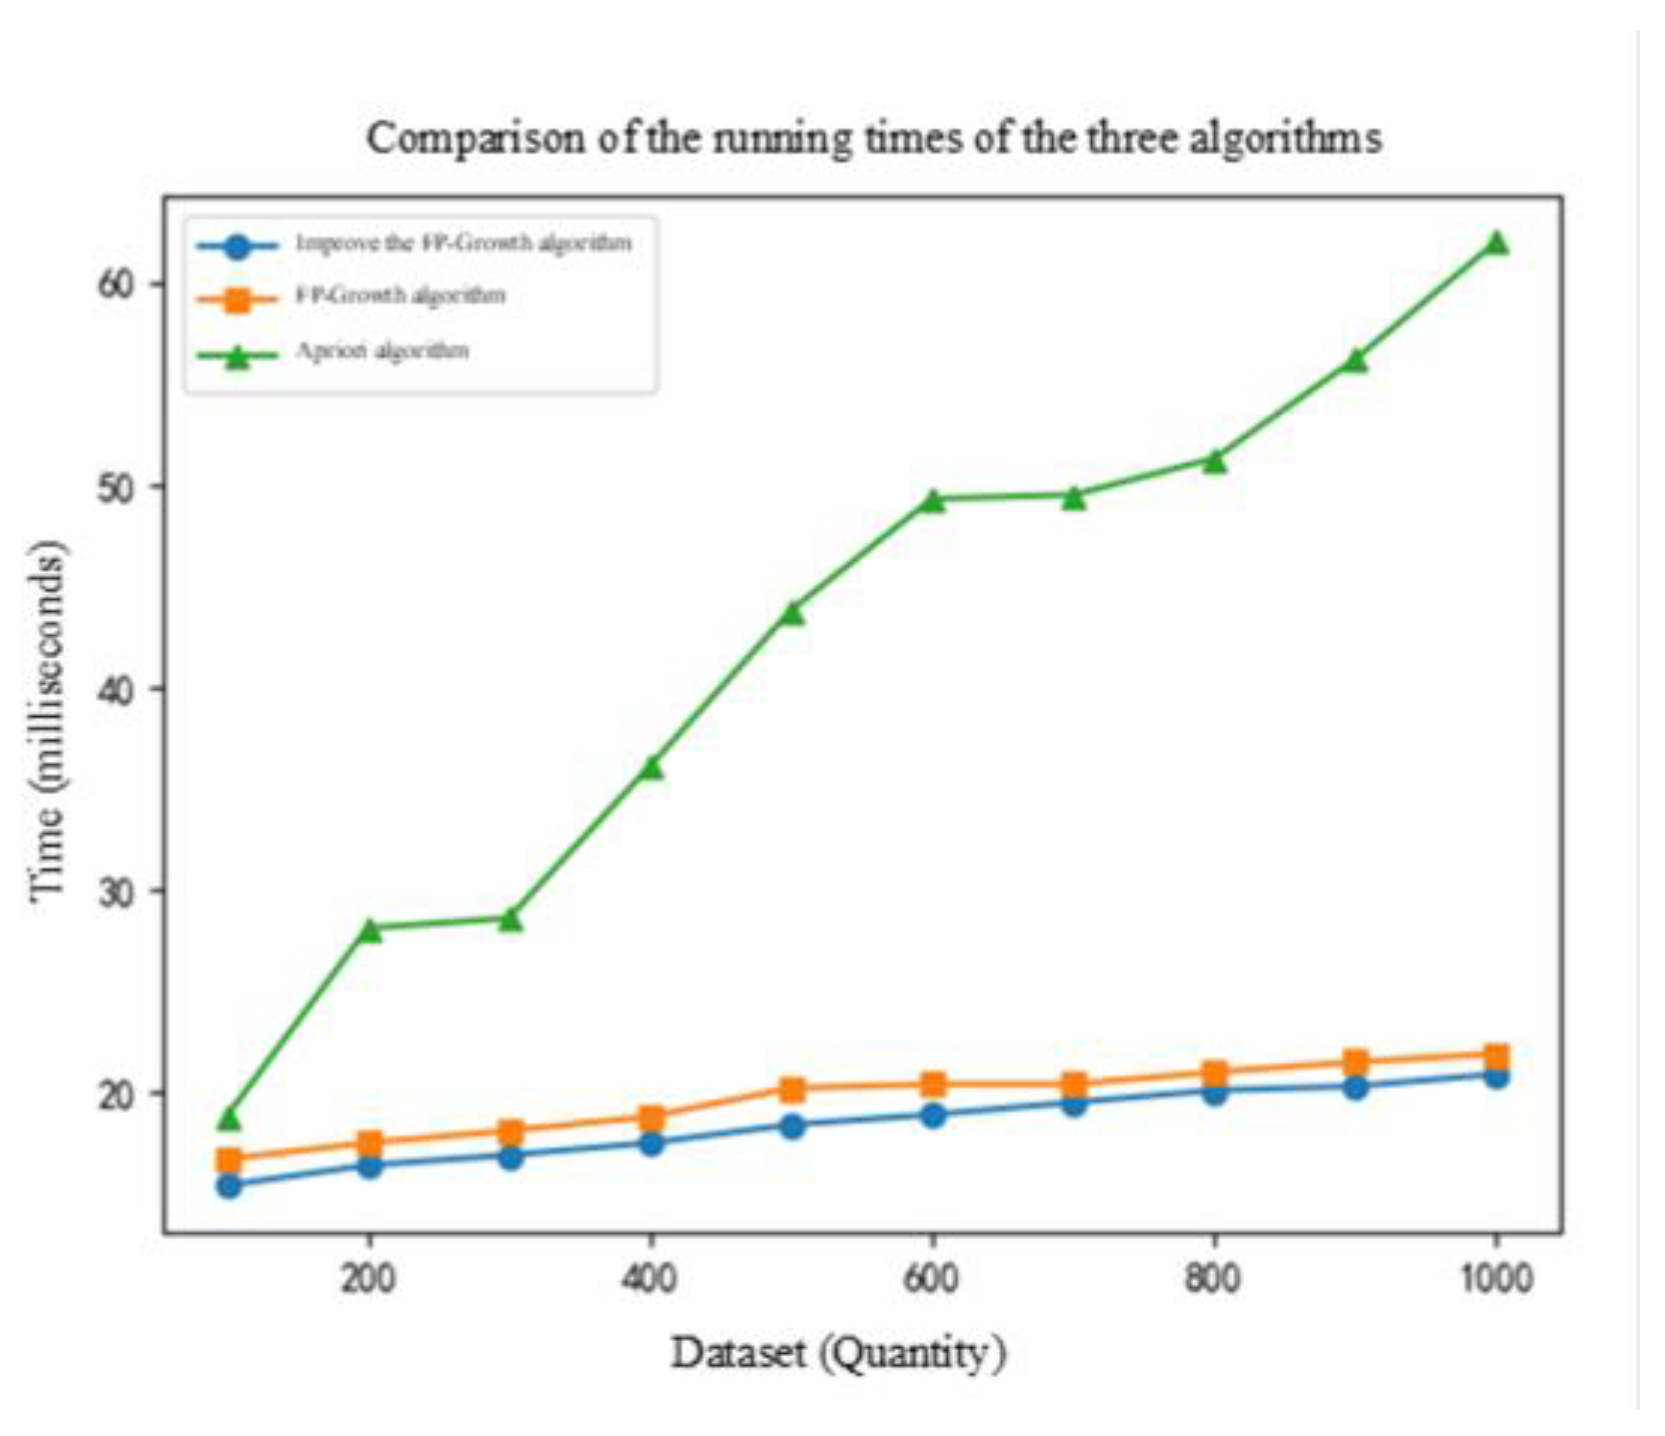
Table 5.
Statistics on network correlation parameters for key segments.
| Basic parameters | average value | maximum values | minimum value |
|---|---|---|---|
| Degree Centrality | 0.1251 | 0.5373 | 0.01493 |
| PageRank | 0.0147 | 0.0519 | 0.0022 |
| Eigenvector Centrality | 0.0999 | 0.3627 | 0.0001 |
Disclaimer/Publisher’s Note: The statements, opinions and data contained in all publications are solely those of the individual author(s) and contributor(s) and not of MDPI and/or the editor(s). MDPI and/or the editor(s) disclaim responsibility for any injury to people or property resulting from any ideas, methods, instructions or products referred to in the content. |
© 2025 by the authors. Licensee MDPI, Basel, Switzerland. This article is an open access article distributed under the terms and conditions of the Creative Commons Attribution (CC BY) license (http://creativecommons.org/licenses/by/4.0/).
Copyright: This open access article is published under a Creative Commons CC BY 4.0 license, which permit the free download, distribution, and reuse, provided that the author and preprint are cited in any reuse.


