1. Introduction
The transportation system is often considered the most critical infrastructure, as disruptions in its components caused by natural or man-made disasters significantly impact people’s health, safety, comfort, economic activities, and overall social well-being [
1]. Such failures lead to unexpected traffic congestion, reducing the overall performance of the transportation network to a catastrophic level [
2]. Therefore, pre- and post-disaster transportation network planning is essential to mitigate severe performance losses.
For effective pre- and post-disaster planning, the resilience of transportation networks must be assessed using vulnerability analysis. According to existing studies, e.g., Derrible and Kennedy [
3] and Taylor [
4], one of the main tasks of vulnerability analysis is to determine the critical components of a transport network (e.g., nodes and links), failures or degradations of which could significantly affect network performance. To identify these critical components, the impact of disruptive conditions must be evaluated. Recent studies assessed the vulnerability of transportation networks from different perspectives and evaluation methods. According to reviews by Mattson and Jenelius [
5], most recent studies have focused on enumerating, generating, and simulating disruptive scenarios. These studies evaluated network vulnerability by utilising different performance measures, such as origin–destination (O-D) connectivity [
6], travel time [
7], and network accessibility [
8].
While above studies highlight the importance of understanding network vulnerabilities and their impacts, they primarily focus on assessing the vulnerability of transportation networks to static and deterministic disruptions [
3]. These methods are typically scenario-specific, relying on pre-disaster occurrences or stochastic modeling approaches that evaluate road segment failure probabilities based on predefined disruption conditions and extensive data from past hazard events [
8,
9]. For instance, Postance et al. [
10] analysed landslide-induced disruptions in Scotland’s Road network, identifying 152 vulnerable segments and providing insights for mitigation. Wisetjindawat et al. [
11] used Monte Carlo simulations to evaluate Japan’s Tokai region’s road vulnerabilities to multihazard events. Lu et al. [
12] applied an accessibility-based approach to prioritize critical infrastructure in flood-prone Hillsborough County, Florida. Abenayake et al. [
13] analysed urban flooding impacts on Colombo’s transport network using network centrality measures. While these studies provide valuable insights, they rely on predefined hazard scenarios and extensive data inputs. Therefore, such approaches are limited in their applicability to unforeseen disruption scenarios or cases where data is sparse. There is a critical need for a holistic method to assess transportation network vulnerability regardless of specific disruption scenarios. This method should require minimal data while providing actionable insights into network vulnerabilities.
In this context, recent studies suggested on assessing vulnerability through a worst-case scenario approach, which helps identify critical components of the network that could cause the most severe disruptions in overall performance [
14,
15]. By doing so, it provides a robust framework for proactive decision-making and targeted investment in network resilience, ensuring that the system is better equipped to handle unexpected disruptions. The worst-case scenario approach focuses on analysing the most severe and unfavourable conditions that could impact a system or situation. By evaluating these extreme scenarios, analysts gain valuable insights into the potential magnitude of losses that may occur during unexpected disruptions. This understanding enables the development of targeted strategies to mitigate risks and minimize adverse impacts, ensuring greater preparedness and resilience in the face of unforeseen challenges [
16].
However, even though the aforementioned worst-case approach network vulnerability studies are well suited for assessing network vulnerability, there are certain limitations which require further study. For instance, these studies often adopt a stochastic modelling approach that can be computationally intensive for assessing network vulnerability in larger transportation networks [
11]. In fact, studies adopting a stochastic approach tend to be applied to overly simplified and often unrepresentative transport networks with few elements, whereas vulnerability analysis has been applied to large-scale transport networks [
17]. This hinders the practical applications of this approach. Although recent studies have highlighted the potential of network topological parameters in assessing network vulnerability, there remains a lack of sufficient research exploring their applicability in worst-case scenarios and adopting robust performance assessment methods [
15,
18]. In this context, a more comprehensive approach is needed to utilize topological parameters alongside their distinct network characteristics to evaluate network vulnerability under worst-case scenarios. These identified limitations are further discussed in
Section 2, which introduces the analytical framework of the study.
In addition to the above limitations, it is essential to understand how traffic flow changes when critical segments are disrupted to evaluate network performance. Generally, evaluating traffic flow changes under disruptive conditions at the network level presents significant challenges due to the complex interplay of various factors [
19]. While user-equilibrium (UE) models can predict traffic flows at the network level, they focus on stable or long-term traffic flows [
6]. However, traffic flow is affected by topological changes under disruptive conditions. Thus, assuming steady-state traffic conditions, as in UE models, is unrealistic under sudden disasters [
20]. Additionally, the lack of real-time data during such events complicates the assessment of traffic flow changes across the network, limiting the applicability of dynamic UE models. In this context, recent studies have focused on changes in network topological parameters to evaluate network changes caused by disruptions [
8]. Although studies have claimed a relationship between the topological parameters and traffic flow distribution [
21], limited attention has been paid to assessing the impact of traffic flow under disruptive conditions.
Lastly, most vulnerability assessment studies are predominantly focused on larger cities in developed countries, where sophisticated data and advanced methodologies are readily available [
22]. Consequently, there is a significant gap in research addressing emerging and medium-scale cities, particularly in Asia, where such studies are critically needed due to rapid urbanization and limited access to data and resources [
23]. These cities often develop transport networks in an ad hoc manner, leading to inefficiencies and sustainability challenges. The lack of vulnerability assessments in such contexts hinders effective planning [
24]. Therefore, it is essential to explore the specific vulnerabilities of transportation networks in medium-scale Asian cities and to develop a simplified simulation framework tailored to these contexts, providing practical insights to guide effective decision-making and planning processes.
Motivated by the aforementioned limitations, this paper proposes a method to evaluate transportation network vulnerability under worst-case scenarios. The main contribution of this study is threefold:
The proposed method is identified the network vulnerability under worst-case scenarios by targeting critical components derived from network topological parameters. To systematically characterize network performance changes under critical-link attacks, the study employs the complementary cumulative distribution function (CCDF) to analyze the empirical distribution of each topological parameter. The CCDF, which has been rarely utilized in previous studies, provides a novel approach for assessing transportation network performance.
The study proposed a straightforward modeling framework that uses topological parameters to assess the impact of critical-link attacks on traffic flow changes through multiple linear regression. To analyze traffic flow changes under disruptions, this study integrates critical-link attacks into the model and uses the CCDF to assess the network’s response to each attack. The findings reveal that disruptions to certain road segments cause significantly greater reductions in traffic volume than other critical-link attacks.
The proposed method is applied to a road network in Sri Lanka’s CMC area, serving as a case study to demonstrate its effectiveness in assessing network vulnerability and identifying critical links that influence traffic flow changes and explore pre- and post-disaster transportation planning. This analysis provides valuable insights, particularly within an Asian context. The study also highlights key findings and policy implications relevant to other Asian cities with similar characteristics, extending its applicability beyond Colombo to urban transportation planning in comparable settings.
The remainder of this paper is organised as follows:
Section 2 presents the analytical framework of the study. Characteristics of the case study area and data description are presented in
Section 3.
Section 4 presents the analysis and results. The discussion and conclusion are summarised in
Section 5, along with the limitations and future work.
2. Analytical Framework
This section describes the analytical framework of this study in three parts: I: Introduction of the topological parameters and their characteristics; II: Topological Transformation of the geometric network; and III: Implementation of the proposed critical link attack method.
2.1. Topological Parameters and their Characteristics
Topological measures have been widely used to capture various network characteristics in complex urban environments [
25,
26]. Recent studies highlight their applicability in assessing transportation network vulnerability, particularly when critical links are disrupted. These measures help evaluate system resilience, identify critical road segments, and assess network performance under disruptive conditions. For instance, Tu et al. [
27] the vulnerability of the Shanghai Freeway Network was evaluated, and indices were proposed to quantify topological vulnerability and identify critical roads. Similarly, Casali and Heinimann [
8] studied the network characteristics during flooding, highlighting the usefulness of topology metrics for evaluating infrastructure performance and risk identification. Collectively, these studies underscore the significance of topological parameters in evaluating transportation network performance and vulnerability, providing critical insights into their role in assessing impacts under various disruption scenarios.
This study employs four key topological parameters—street connectivity, closeness centrality, betweenness centrality, and eigenvector centrality—to assess transportation system vulnerability from each parameter’s perspective when critical links are disrupted. These parameters have been extensively used to capture the complex properties of topological networks [
28]. For instance, recent studies highlight the effectiveness of topological measures in assessing diverse network characteristics, such as traffic flow patterns [
25,
29], accessibility [
30], origin-destination trips distribution [
31], and urban development patterns [
26,
32], by utilizing topological representations of transportation networks. Such analyses are critical for understanding human activity distribution and transportation flow dynamics within urban transportation networks as interconnected and complex systems [
33]. Each topological parameter used in this study, along with its formula and characteristics, is described below.
2.1.1. Street Connectivity (SC)
The street connectivity (SC) known as the most fundamental and apparent measure as it follows very simplistic approach to interpreted the structural property of the transportation network [
34]. The SC of an individual segment is defined as the number of other nodes directly connected to a particular node or segment [
35]. Street Connectivity is primarily utilized to describe the scale-free property of the transportation network, as shown by Barabási and Albert [
36]. The SC of segment
i,
, can be calculated as follows [
35]:
where
is the element in the
i-th row and
j-th column of the adjacency matrix
A, and
N is the total number of segments of the network.
2.1.2. Betweenness Centrality (BC)
The betweenness centrality (BC) depicts the importance of segments within a network by measuring to what extent a particular segment is between the other segments in the network, which reflects the intermediary location of a segment [
37]. It captures the pass-by segments of the origin or destination trip distribution and is an excellent proxy for predicting traffic flow distribution in urban areas [
38]. The BC of segment
i,
, can be calculated as follows [
39]:
where
is the number of shortest paths between segments
j and
k and
is the number of shortest paths from
j to
k that pass through segment
i.
2.1.3. Closeness Centrality (CC)
The closeness centrality (CC) measures the shortest distance from a given node to all other nodes of the network which depicts the distance, (i.e., or how far) of a particular node or segment related to the other nodes or segment in the network [
38]. It captures the notion of the accessibility of a segment which is an excellent proxy for predicting the accessibility of a network [
39]. The CC of segment
i,
, can be calculated as follows [
38]:
where
denotes the distance between links
i and
j along the shortest path.
2.1.4. Eigenvector Centrality (EC)
The eigenvector centrality (EC) assesses the connectivity of a particular segment to the other surrounding segments on the network in their local and global group [
40]. It captures the importance of a connected segment as it captures the direct influence and influence over the segment in global terms by considering the entire topological network [
41]. The EC of segment
i,
, can be calculated as follows [
37]:
where
is the largest Eigenvalue of the adjacency matrix
A and
is the eigenvector centrality score for segment
j.
The above chosen topological parameters provide a comprehensive framework for assessing the vulnerability of transportation networks when critical links in the network are impacted by disruptive events in each topological parameter perspective. For instance, SC captures the direct connections of road segments, offering a straightforward metric for understanding the local scale-free properties of the network. BC, in contrast, highlights the criticality of segments that act as intermediaries in traffic flows, making it a robust indicator of the network’s vulnerability to disruptions in high-utilization links, (i.e., passed by road segmnets). The CC provides insight into the overall accessibility of road segments, which is crucial for evaluating the network’s efficiency and responsiveness to failures. Finally, EC assesses the global influence of segments, capturing the interdependence of key nodes in maintaining network cohesion. Together, these parameters address various dimensions of vulnerability, from local connectivity to global network influence, enabling a holistic evaluation.
2.2. Topological Transformation of Geometric Transportation Network
This study utilized the natural street topological transformation method proposed by Jiang and Claramunt [
42] to convert the geometric transportation network and traffic volume data into a topological representation. Natural street topologies were generated by considering the continuity of street segments and the angle change between two intermediate road segments [
43]. As shown in [
21], this transformation method can accurately represent human movement, traffic flow behaviour, and the hierarchical nature of urban transportation networks. The study employed the Axwoman Extension in ArcGIS, a method introduced by Jiang et al. [
44], to facilitate the topological transformation. In the Axwoman Extension, natural roads can be created by tracking the angle changes of each road segment.
In this study, we set the threshold for angle change at 20°, merging intermediate segments into a single segment if the angle change fell below this threshold, while segments with angle changes above the threshold remained separate. The rationale for using this threshold lies in its ability to merge segments with minimal angular deviations into unified paths, which represent natural routes perceived by road users, while maintaining the distinction of significantly curved or diverging segments. Thresholds lower than 20° may overgeneralize the network, losing critical local variations, while higher thresholds may result in overly fragmented representations, complicating analysis and interpretation. This threshold has been widely used in previous studies to represent continuous, intuitive paths of movement in transportation networks. For example, Jiang et al. [
29] and Jiang and Liu [
45] demonstrated that a 20° threshold effectively captures the continuity of human-perceived roadways while minimizing excessive segmentation of the network. Similarly, Lämmer et al. [
46] employed comparable thresholds to delineate natural road networks, emphasizing the alignment with human navigation patterns and spatial cognition.
For a more detailed explanation of the natural street topological transformation within the geometric network, readers are direct readers to refer the author’s earlier work [
47].
2.3. Critical-Link Attack Method
This study introduces a method for identifying network vulnerabilities under worst-case scenarios, emphasizing critical links based on their respective topological parameter aspects rather than their criticality as defined by overall network performance. By focusing on disruptions to each topological parameter in its specific context, this approach provides a nuanced assessment of network vulnerability. Such a perspective is crucial for evaluating the network’s resilience from different topological viewpoints, enabling a detailed understanding of how specific parameters influence network performance. Consequently, while some segments may significantly impact network functionality due to their topological significance, others might not, even if deemed critical from a specific topological perspective.
The method evaluates network vulnerability by simulating sequential disruptions to critical road segments identified through topological measures, proceeding iteratively in descending order of their significance. This approach captures worst-case vulnerabilities efficiently, distinguishing itself from earlier studies by Jenelius and Mattsson [
14] and Hosseini Nourzad and Pradhan [
15], which rely on more computationally intensive and probabilistic methods. Its simplicity and reliance on minimal data enhance its feasibility for large-scale networks, particularly in underdeveloped and developing regions with limited data availability.
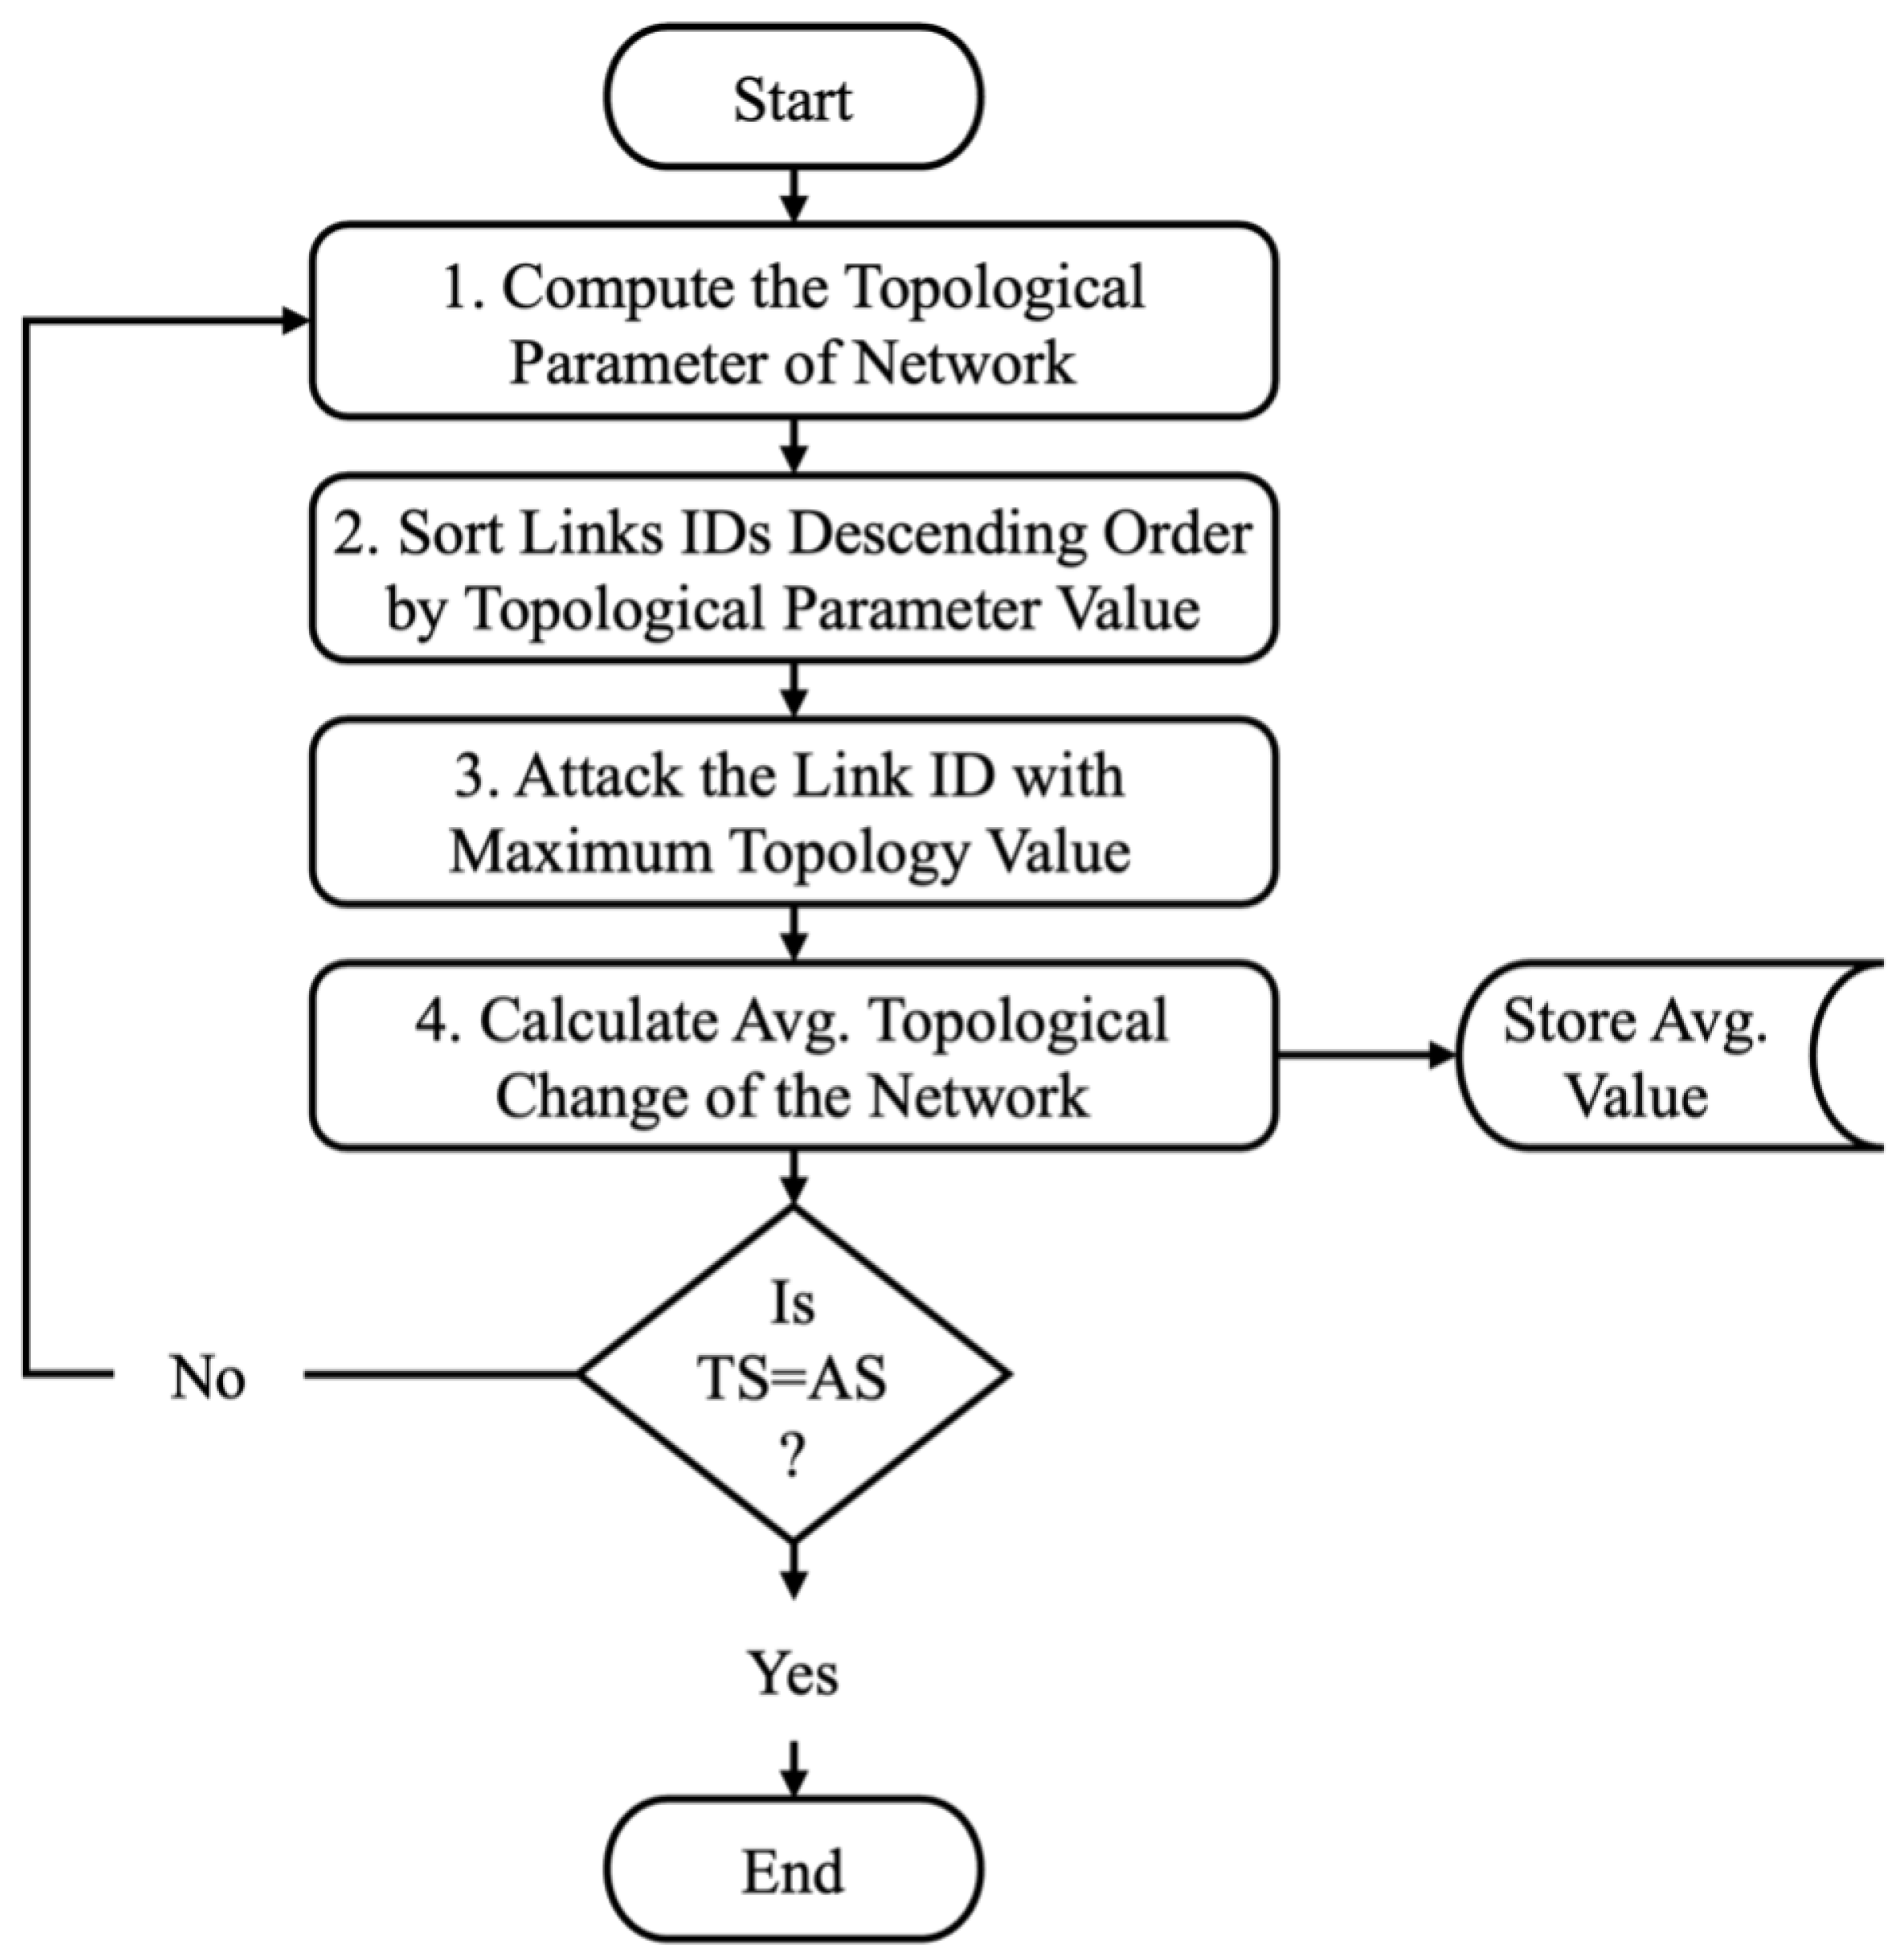
Figure 1 illustrates the flowchart of the proposed methodology, highlighting its practicality and applicability for assessing network vulnerabilities from multiple topological perspectives.
As shown in
Figure 1, the process begins by calculating each topological parameter under undisrupted conditions. The received topological values for each road segment are then sorted in descending order to identify the maximum value (critical link segment) for each parameter. The identified segments are subjected to attacks (or dropped from the network). Subsequently, the same topological parameters are recalculated to assess the effects of the attacked segment on network performance in terms of the respective topological parameter aspect. The process continues, with the values sorted again for each segment, and the maximum topology value captured to evaluate the network vulnerability after each attack iteration. This iterative process persists until all road segments (TS) have been attacked (i.e., Attacked Segments - AS), such that TS equals AS. This method captures the worst-case transportation network vulnerability scenario and holistically assesses the network vulnerability by considering all potential individual disruptions.
3. Case Study
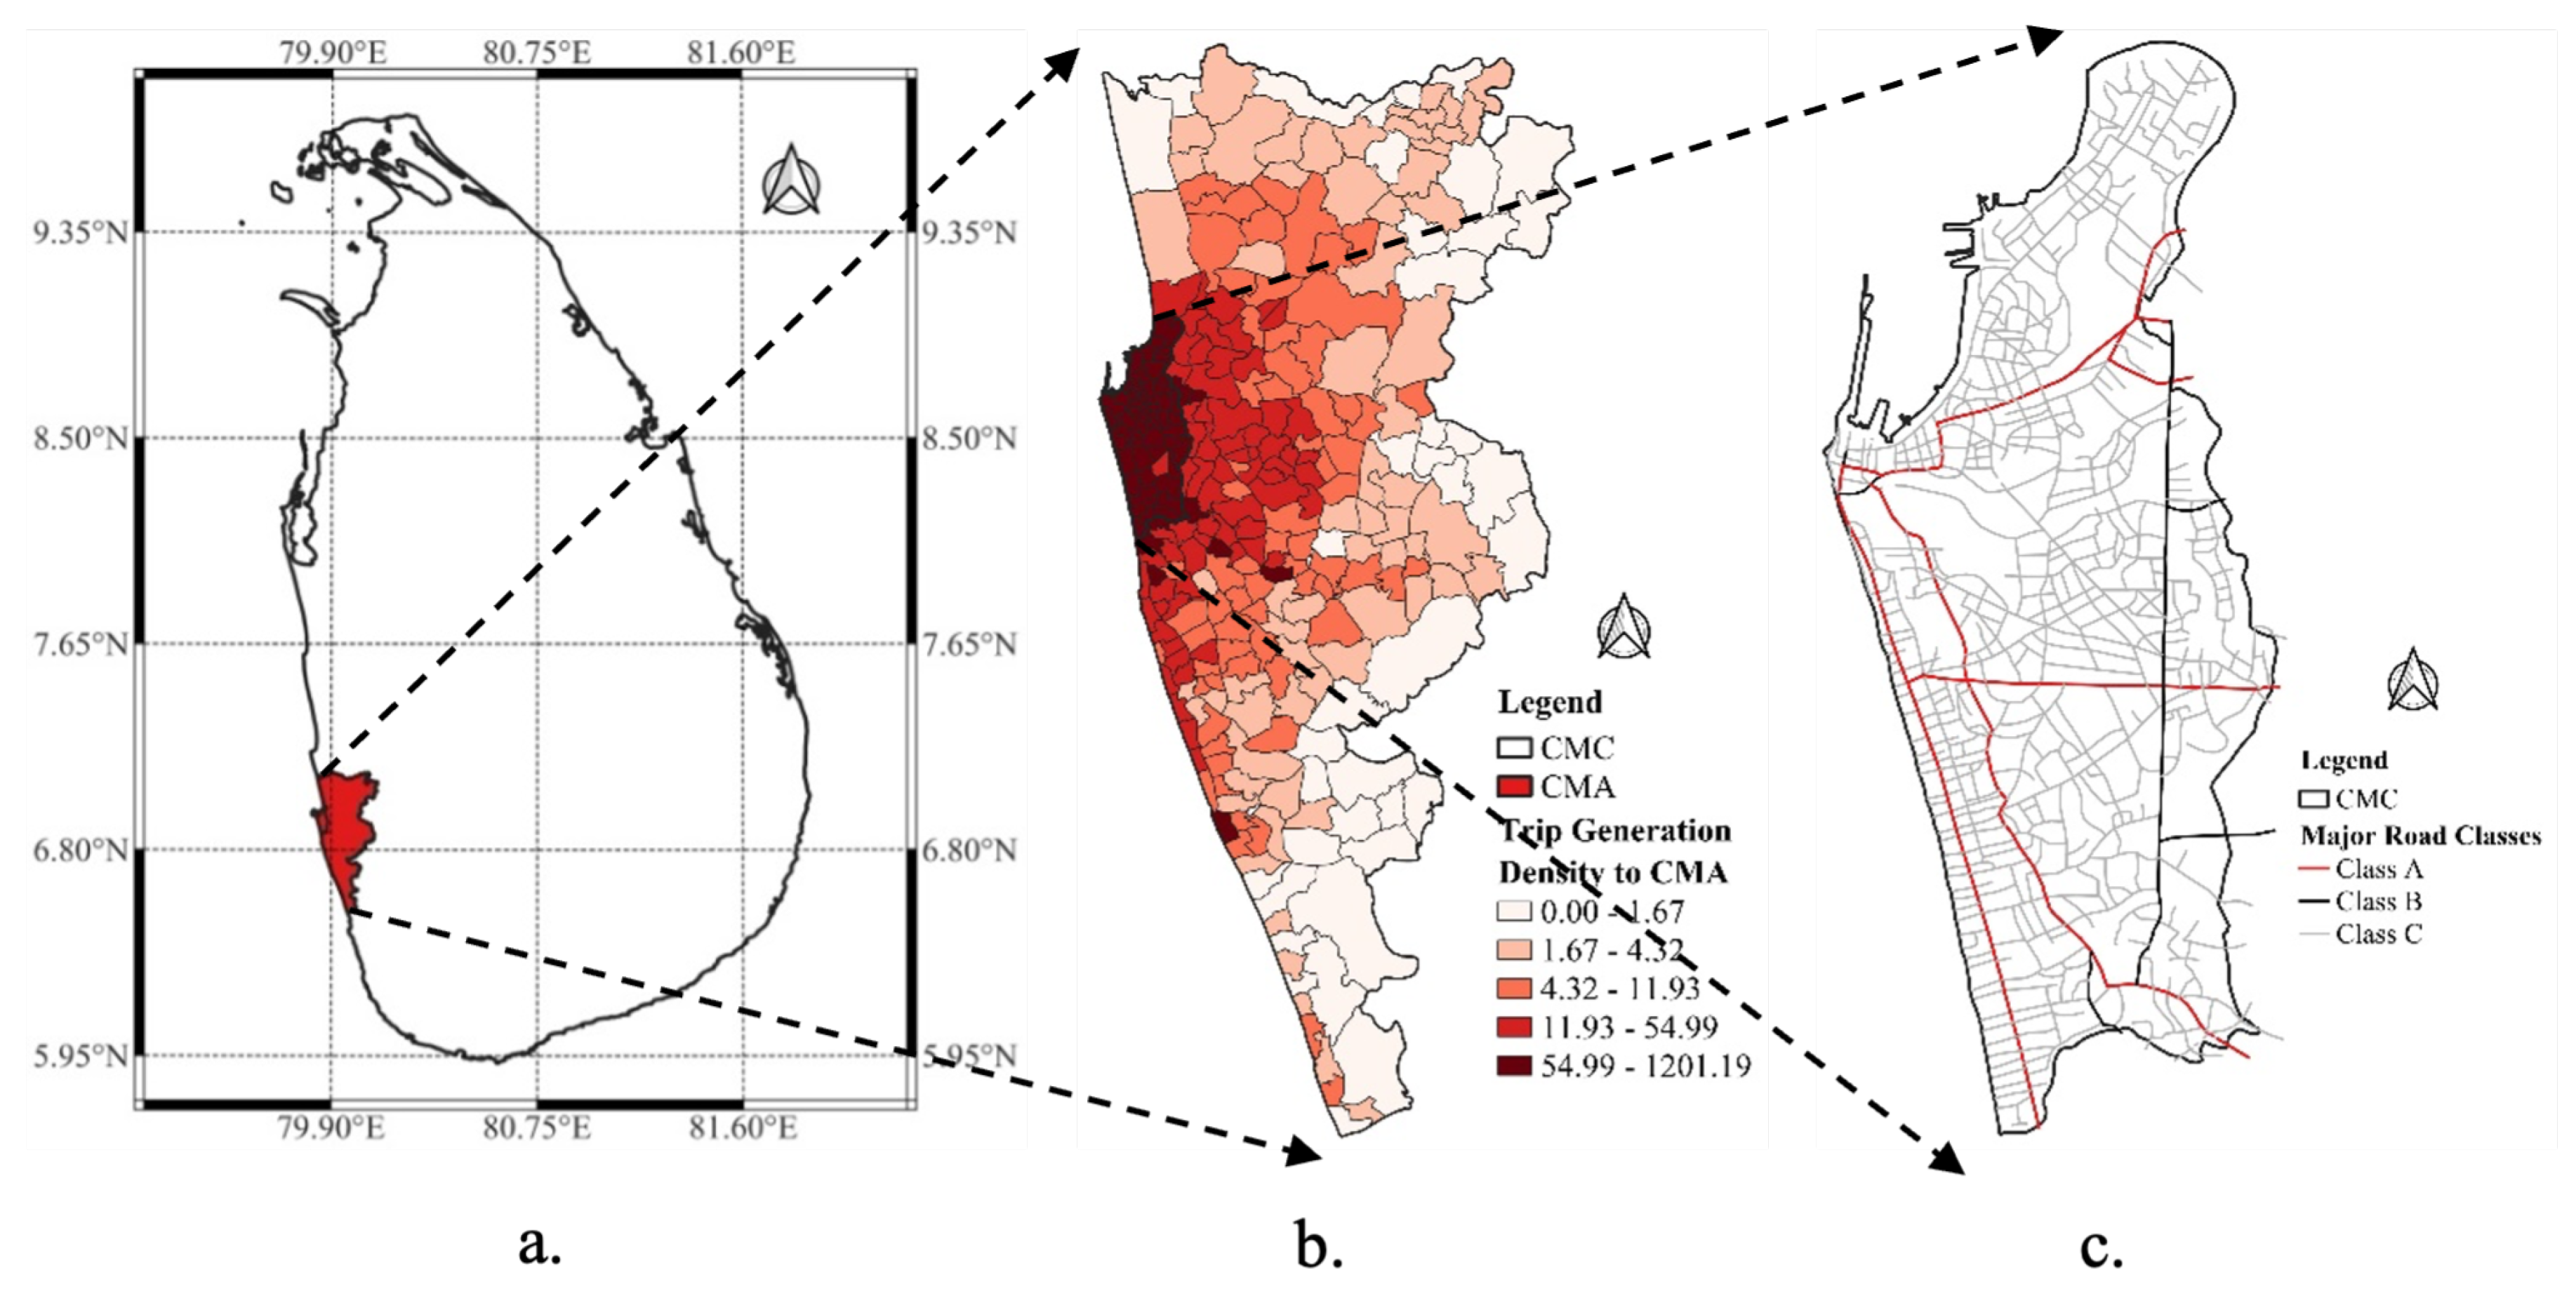
We selected the CMC area in Sri Lanka
as the case study due to its significance as a developing commercial capital in South Asia. The CMC area, encompassing Sri Lanka’s commercial and administrative capital as well as its largest city, is part of the Colombo Metropolitan Area (CMA), which contributes over 50% of the national GDP. According to a JICA Study [
48], the CMC area accounts for the highest trip generation in Sri Lanka. Therefore, a considerable number of trips are made within the CMC, as well as between the CMC and the surrounding Divisional Secretariat (DS) divisions, highlighting its commercial and transportation importance (see
Figure 2b).
Figure 2 depicts the spatial composition of the study area.
Despite the economic and social importance of the CMC area, it is highly prone to natural disasters and human-induced disruptions in its transportation network, significantly affecting commuters’ day-to-day activities [
49]. Colombo District, including the CMC area, is ranked as the most flood-vulnerable area in Sri Lanka for housing and urban development [
50]. On 10 November 2010, torrential rainfall exceeding 440 mm caused widespread flooding, affecting over 213,000 individuals and disrupting housing, infrastructure, electricity, and transportation [
51]. Such issues lead to sudden flash flood occurrences in urban road networks, eventually disrupting the functionality of the urban transportation network [
13]. Additionally, human-induced disruptions, such as road construction, traffic barricades, and demonstrations, frequently disrupt the transportation network. Hence, the outcome of this study enhances transportation network redundancy and robustness by identifying critical components and mitigating disruption impacts on performance and traffic flow.
3.1. Data Description and Sources
This study relied entirely on secondary data sources that are freely available and accessible for reproduction. To evaluate the vulnerability of the transportation network in the CMC, we utilised the geographical road network as the primary dataset, which was obtained from the Survey Department of Sri Lanka (SLSD) and then transformed into a topological network following the method described in this study. To analyse the impact of traffic flow, we obtained traffic volume data for the study area from the AADT database of the ’CoMTrans Urban Transport Master Plan-JICA’ [
48], which was utilised to develop a modelling framework assessing the impact of critical-link attacks on traffic flow changes.
4. Analysis and Discussion
This study analyzes transportation network vulnerability to critical-link attacks from two analytical aspects. I. Identifying the network performance changes under critical-link attacks and II. Capturing traffic flow changes under a critical link attack. A detailed discussion of each analytical aspect is provided below. Notably, although the study employed 323 critical-link attacks sequentially to disrupt the transportation network, three significant phases of critical-link attacks were selected based on the notable functional changes observed in each topological parameter to assess the vulnerability. To illustrate these changes, the CCDF of the topological parameters was calculated for the first 10%, 20%, and 30% of the disruption phases.
4.1. Identifying the Network Performance Changes Under Critical-Link Attacks
4.1.1. Applying CCDF to Assess Transportation Network Performance
To systematically characterise the network performance changes under critical link attacks, this study evaluated the empirical distribution functions of each topological parameter. Since the main focus of contemporary risk management studies is on the tail of the distribution function, this study utilised the CCDF, which is often used in reliability engineering to understand the likelihood of extreme events. The CCDF is particularly effective when dealing with heavy-tailed distributions or rare occurrences, making it an essential method for analysing scenarios where critical disruptions significantly impact the network.
The CCDF provides information on the tail of a distribution, indicating the probability that a random variable has a value greater than or equal to a given threshold. This capability helps quantify the likelihood of observing extreme evets, such as those associated with critical link disruptions in transportation networks. By examining the CCDF, researchers can identify vulnerabilities in the network, measure the resilience of specific links, and evaluate the probability of rare but impactful disruptions.
Mathematically, the CCDF defines the probability that the random variable
X is greater than or equal to a particular value
x, which is represented as
. Consequently, related to the cumulative distribution function, the CCDF can be expressed as follows:
where
is the probability that
X is less than or equal to
x.
One of the strengths of the CCDF is its ability to visualize and interpret the likelihood of extreme values in a way that highlights the critical points of failure in a system. In the context of this study, the CCDF was instrumental in identifying the segments of the transportation network most susceptible to critical link attacks. For instance, as the CCDF curves drop steeply at the tail under attack scenarios, it signals a significant loss of flow capacity and highlights the network’s reduced ability to redistribute traffic effectively.
By leveraging the CCDF, this study not only quantified the impacts of critical link disruptions but also revealed patterns of vulnerability that would have been less evident using traditional methods. These insights are vital for formulating strategies to enhance network resilience, such as reinforcing critical links, improving redundancy, and prioritizing maintenance in segments with higher probabilities of extreme events.
4.1.2. Identifying the Network Performance Changes Under Critical-Link Attacks
In this study, we used the Power law Package in Python to plot the distribution functions for each topological parameter, as described by Alstott et al. [
52]. The Y-axis represents the probability of the distribution, and the X-axis represents the value of each topological parameter. As the value of X increases, the probability of X being greater than or equal to that value decreases.
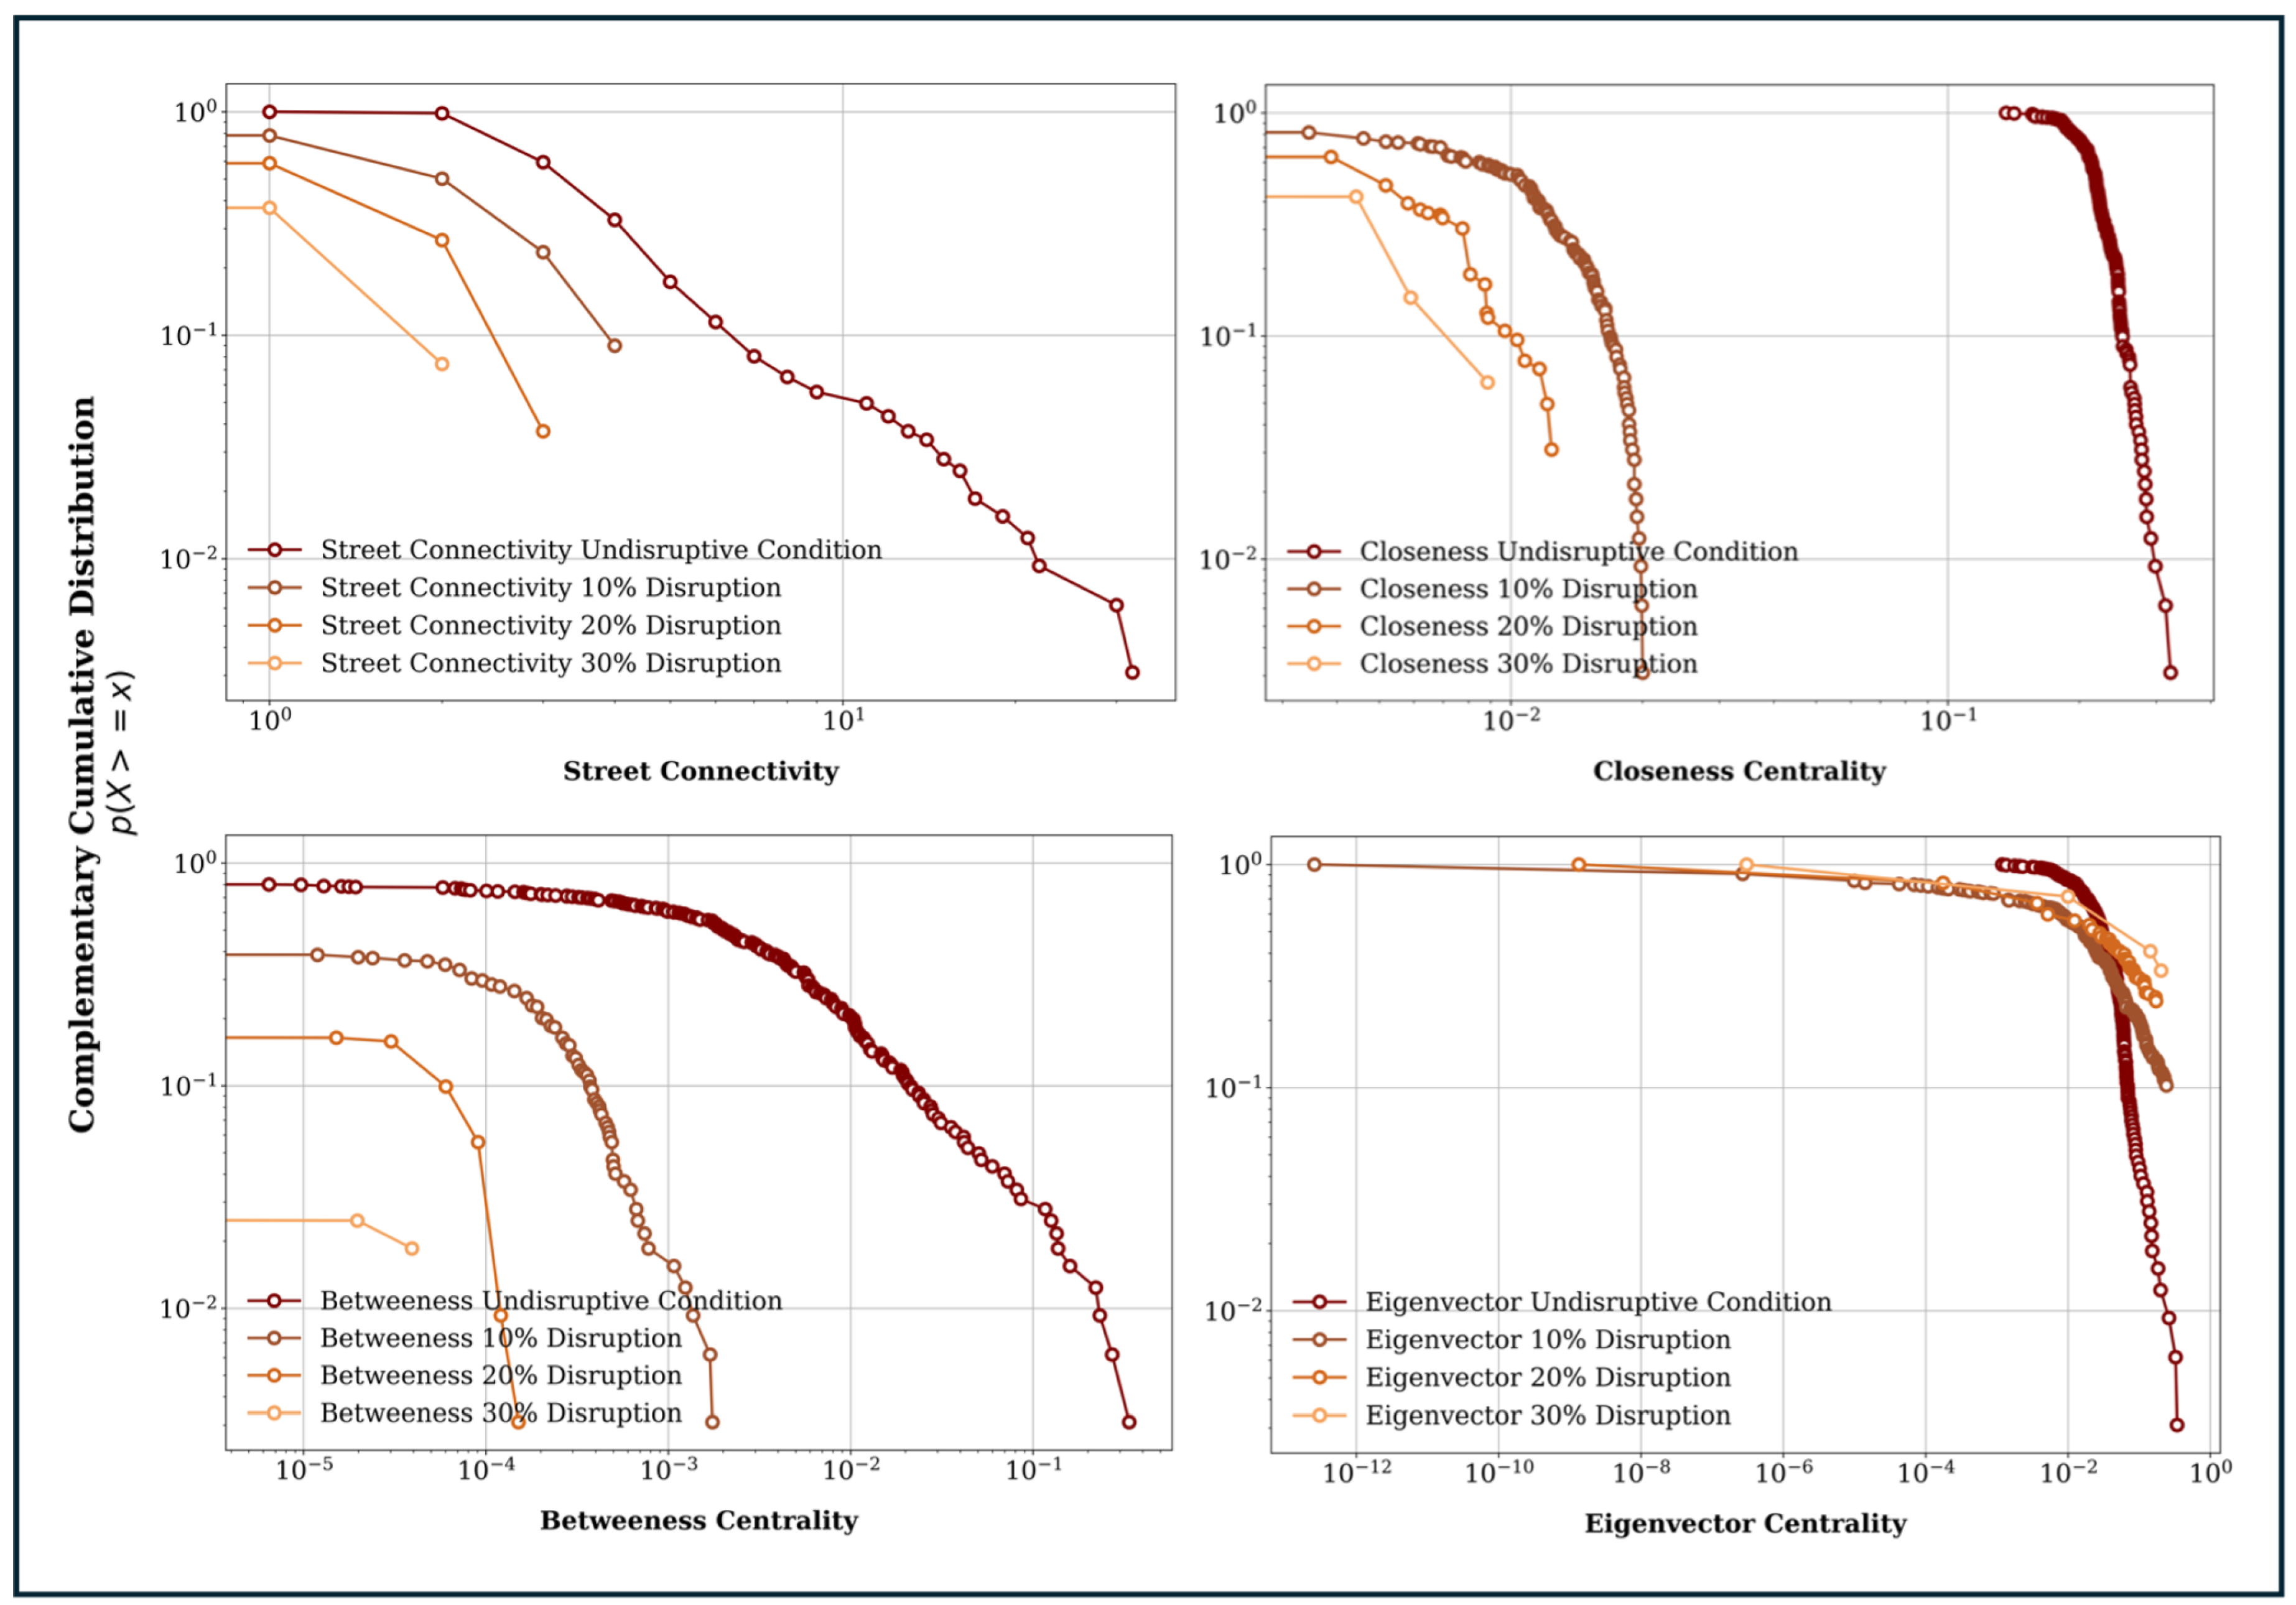
Figure 3 shows the CCDF of each topological parameter for undisruptive conditions and for the first 10%, 20%, and 30% of the critical link attacks. Note that we omitted the left side of the CCDF because the main focus was on the tail of the distribution function in the context of risk management studies.
As depicted in
Figure 3, under undisrupted conditions (dark red curve), the network maintains high values across all measures, reflecting robust connectivity, accessibility, and flow efficiency. Thus, the tail of each distribution function becomes heavier with critical links, characterised by a greater probability and very high criticality of each respective topological parameters. As a result, compared to the tail, the head of the undisturbed conditions exhibits a lower probability and criticality of each distribution function. However, as disruptions increase to 10%, 20%, and 30%, the CCDF curves exhibit steeper declines, indicating significant losses in network performance. This demonstrates that either the significance of the critical links needed to maintain greater network performance decreases when network critical segments are disrupted, or the failure of certain roads has a lesser impact on the network when the critical segments are attacked.
For instance, SC, at 10% disruption, the curve drops more sharply, showing reduced probabilities of retaining high connectivity. For example, at a connectivity value of 0.6, the CCDF falls to approximately 0.2. With 20% and 30% disruptions, the declines become even steeper, and the CCDF truncates earlier, reflecting severe fragmentation. At 30% disruption, connectivity values above 0.4 are nearly absent, highlighting the network’s fragility under escalating disruptions.
For CC, at 10% disruption, the CCDF drops notably, indicating increased travel distances and reduced accessibility, with values below 0.5 having probabilities under 0.2. At 20% disruption, the decline steepens further, as centrality values fall below 0.4 for most links. By 30% disruption, the CCDF approaches zero around 0.3, reflecting severe fragmentation where accessibility across the network collapses.
For BC, under 10% disruption, the curve drops earlier, with the CCDF falling below 0.2 at a betweenness value near 0.4, showing the loss of key flow-concentrating links. At 20% disruption, the drop is more pronounced, with the probability of high-centrality links declining sharply. By 30% disruption, betweenness centrality values approach zero around 0.3, highlighting the loss of critical pass-by segments that concentrate significant traffic flow within the OD trip distribution. This results in reduced flow efficiency as traffic reroutes through less central paths.
Finally, for EC, at 10% disruption, the curve begins to deviate at higher centrality values, showing a gradual loss of influential connections. At 20% disruption, this drop becomes sharper around centrality values of 0.4, reflecting compromised connectivity among influential nodes. By 30% disruption, the CCDF exhibits a steep decline, approaching zero at values around 0.3, signifying severe fragmentation where very few links retain influence.
The above results underscore that all centrality measures demonstrate a consistent trend: increasing disruptions lead to sharper declines in CCDF values, indicating reduced connectivity, accessibility, flow-concentrating links, and link influence within the network. The severity of these declines highlights the importance of critical links, whose removal causes cascading failures that fragment the network and significantly reduce its overall network performance and resilience. During disruptive situations, the tail of the distribution is damaged as critical links of the network are attacked. Consequently, all the distribution functions under disruption depict a lower tail with reduced probability and criticality for each topological parameter, as the most impacted segments are targeted during each disruption iteration. This clearly indicates that once the critical links of the network are attacked, the network becomes fragile and cannot maintain its performance across the considered topological parameters, further emphasizing the network’s growing vulnerability as disruptions escalate.
However, unlike the undisruptive condition, the head of each disruptive condition distinguishes a significant increase in the probability when the significance of critical link attacks increases. This clearly distinguishes the flow transition from the attacked road segments to the remaining road segments because the remaining road segments receive more attention when they disrupt the earlier critical link road segments from the transportation network. This increases the probability of the head of the distribution curve under disruptive conditions. It also shows that a few road segments still represented the tail of the distribution curve under disruptive conditions, but their criticalities were significantly lower than those under undisruptive conditions. This is because even during critical link attacks, a few road segments still receive relatively high attention in each considered topological parameter aspect. However, these trends gradually diminish with an increase in critical link attacks on the network, as the network cannot perform any functions once it becomes isolated when critical road segments are removed from the network.
4.2. Capture the Traffic Flow Change Under the Critical-Link Attacks
4.2.1. Development of a Modelling Framework to Estimate Traffic Volume
Prior to capturing traffic flow changes under critical link attacks, a modelling framework was developed to assess the impact of critical link attacks on traffic volume. Here, the traffic volume is considered the response variable, and the topological parameters utilised in this study are considered the explanatory variables. To obtain more reliable and precise model results, the CMA was considered for model development because it incorporates more road segments than the study area. The final dataset comprised a road network with 638 road segments, each including its respective traffic volume and topological parameter values.
For feature selection, we conducted a correlation coefficient assessment, and the explanatory variables greater than
were selected for model development. This approach has been commonly used in previous studies on feature selection in transportation research [
53]. This study employed a multiple linear regression model for model formulation. According to the correlation assessment results of each feature variable with traffic volume, there were distinct positive relationships, ranging from very to moderately to strongly positive correlations for SC
, BC
,
, and
. Among them, the SC and BC feature variables are distinguished by a strong positive correlation, and the EC variable is distinguished by a moderately strong positive correlation. However, CC showed a moderately positive correlation. Therefore, SC, BC, and EC were selected as feature variables by considering their greater correlation with traffic volume. Hence, the model comprising SC, BC, and EC explanatory variables was considered an acceptable model to assess traffic volume changes under critical-link attacks. Hence, the traffic volume of a given topological segment can be expressed as follows:
where
is the Traffic volume of road segment
i.
is the Street Connectivity of road segment
i.
is the Betweenness Centrality of road segment
i.
is the Eigenvector Centrality of road segment
i.
a,
b,
c and
d are Constant Values.
Considering the model comprising coefficient values, SC (coefficient: 64.220, ), BC (coefficient: 51.935, ), and EC (coefficient: 31.295, ) were all significant predictors of the dependent variable in the multiple linear regression model. Each of these variables had a positive influence on the dependent variable, with higher values associated with larger changes in the dependent variable. Thus, the SC and BC variables significantly influenced traffic volume prediction compared to the EC variable of the model. Additionally, the extremely low p-values for each independent variable indicated that the coefficient was statistically significant at an extremely high level (less than 0.01%). This suggests that each independent variable strongly influences the dependent variable in the model.
Subsequently, the selected variables were assessed for the presence of multicollinearity. Multicollinearity refers to the phenomenon in which two or more predictor variables in a regression model are highly correlated, making it difficult to distinguish the independent effects of each variable on the outcome variable [
54]. We used two methods to detect the presence of multicollinearity: the variance inflation factor (VIF) and tolerance. The VIF measures the extent to which the variance of a regression coefficient is inflated owing to multicollinearity with other predictor variables. A variance inflation factor (VIF) greater than 5 or 10 was considered indicative of multicollinearity. Conversely, tolerance is defined as the proportion of variance in a predictor variable that is not explained by other predictor variables in the model. Tolerance ranges from 0 to 1, with values closer to 0 indicating a high degree of multicollinearity and values closer to 1 indicating a low degree of multicollinearity.
Table 1 presents the results of multicollinearity assessments of the selected variables. It is evident that none of the selected variables exhibits multicollinearity, indicating their validity for use in model development. These results of the multicollinearity assessment align well with similar studies that reported the absence of multicollinearity among identified topological parameters, such as those by Jayasinghe et al. [
55] and Chen et al. [
26]. This consistency reinforces the reliability and robustness of the model parameters.
To test the goodness-of-fit of the proposed model, we used the coefficient of determination (
) and the mean absolute percentage error (
). Here,
is a statistical measure that represents the proportion of variance in the dependent variable explained by the independent variables in the regression model. It measures how well the regression line fits the observed data points. The
is a measure of the accuracy of a prediction model. This is calculated as the mean of the absolute percentage errors between the predicted and actual values. According to Lowry [
31],
and
together provide a sound understanding of a model’s predictability. The study initially utilised 80% of the randomly selected data for calibration (i.e. a random subset of the calibration data) and 20% for validation.
Table 2 presents the goodness-of-fit assessment of the proposed model. Considering the model performance, the explanatory variables of SC, BC, and EC produced acceptable goodness-of-fit values (
) and a lower mean absolute percent error (
). Hence, the model comprising SC, BC, and EC explanatory variables was considered an acceptable model to assess traffic volume changes under critical-link attacks.
4.2.2. Capture of the Traffic Flow Changes under Critical-Link Attacks
This study systematically characterized the traffic flow changes caused by critical link attacks for each considered topological parameter aspect. The traffic volume changes corresponding to each critical link attack in the network could be clearly identified. In this regard, this study evaluated the empirical distribution functions of traffic volume distribution under critical-link attacks for each topological parameter. Since the main focus needs to be on the tail of the distribution function, as it contains the response of the critical road segments which contain more traffic volume than the other road segments, this study employed the CCDF that was previously introduced.
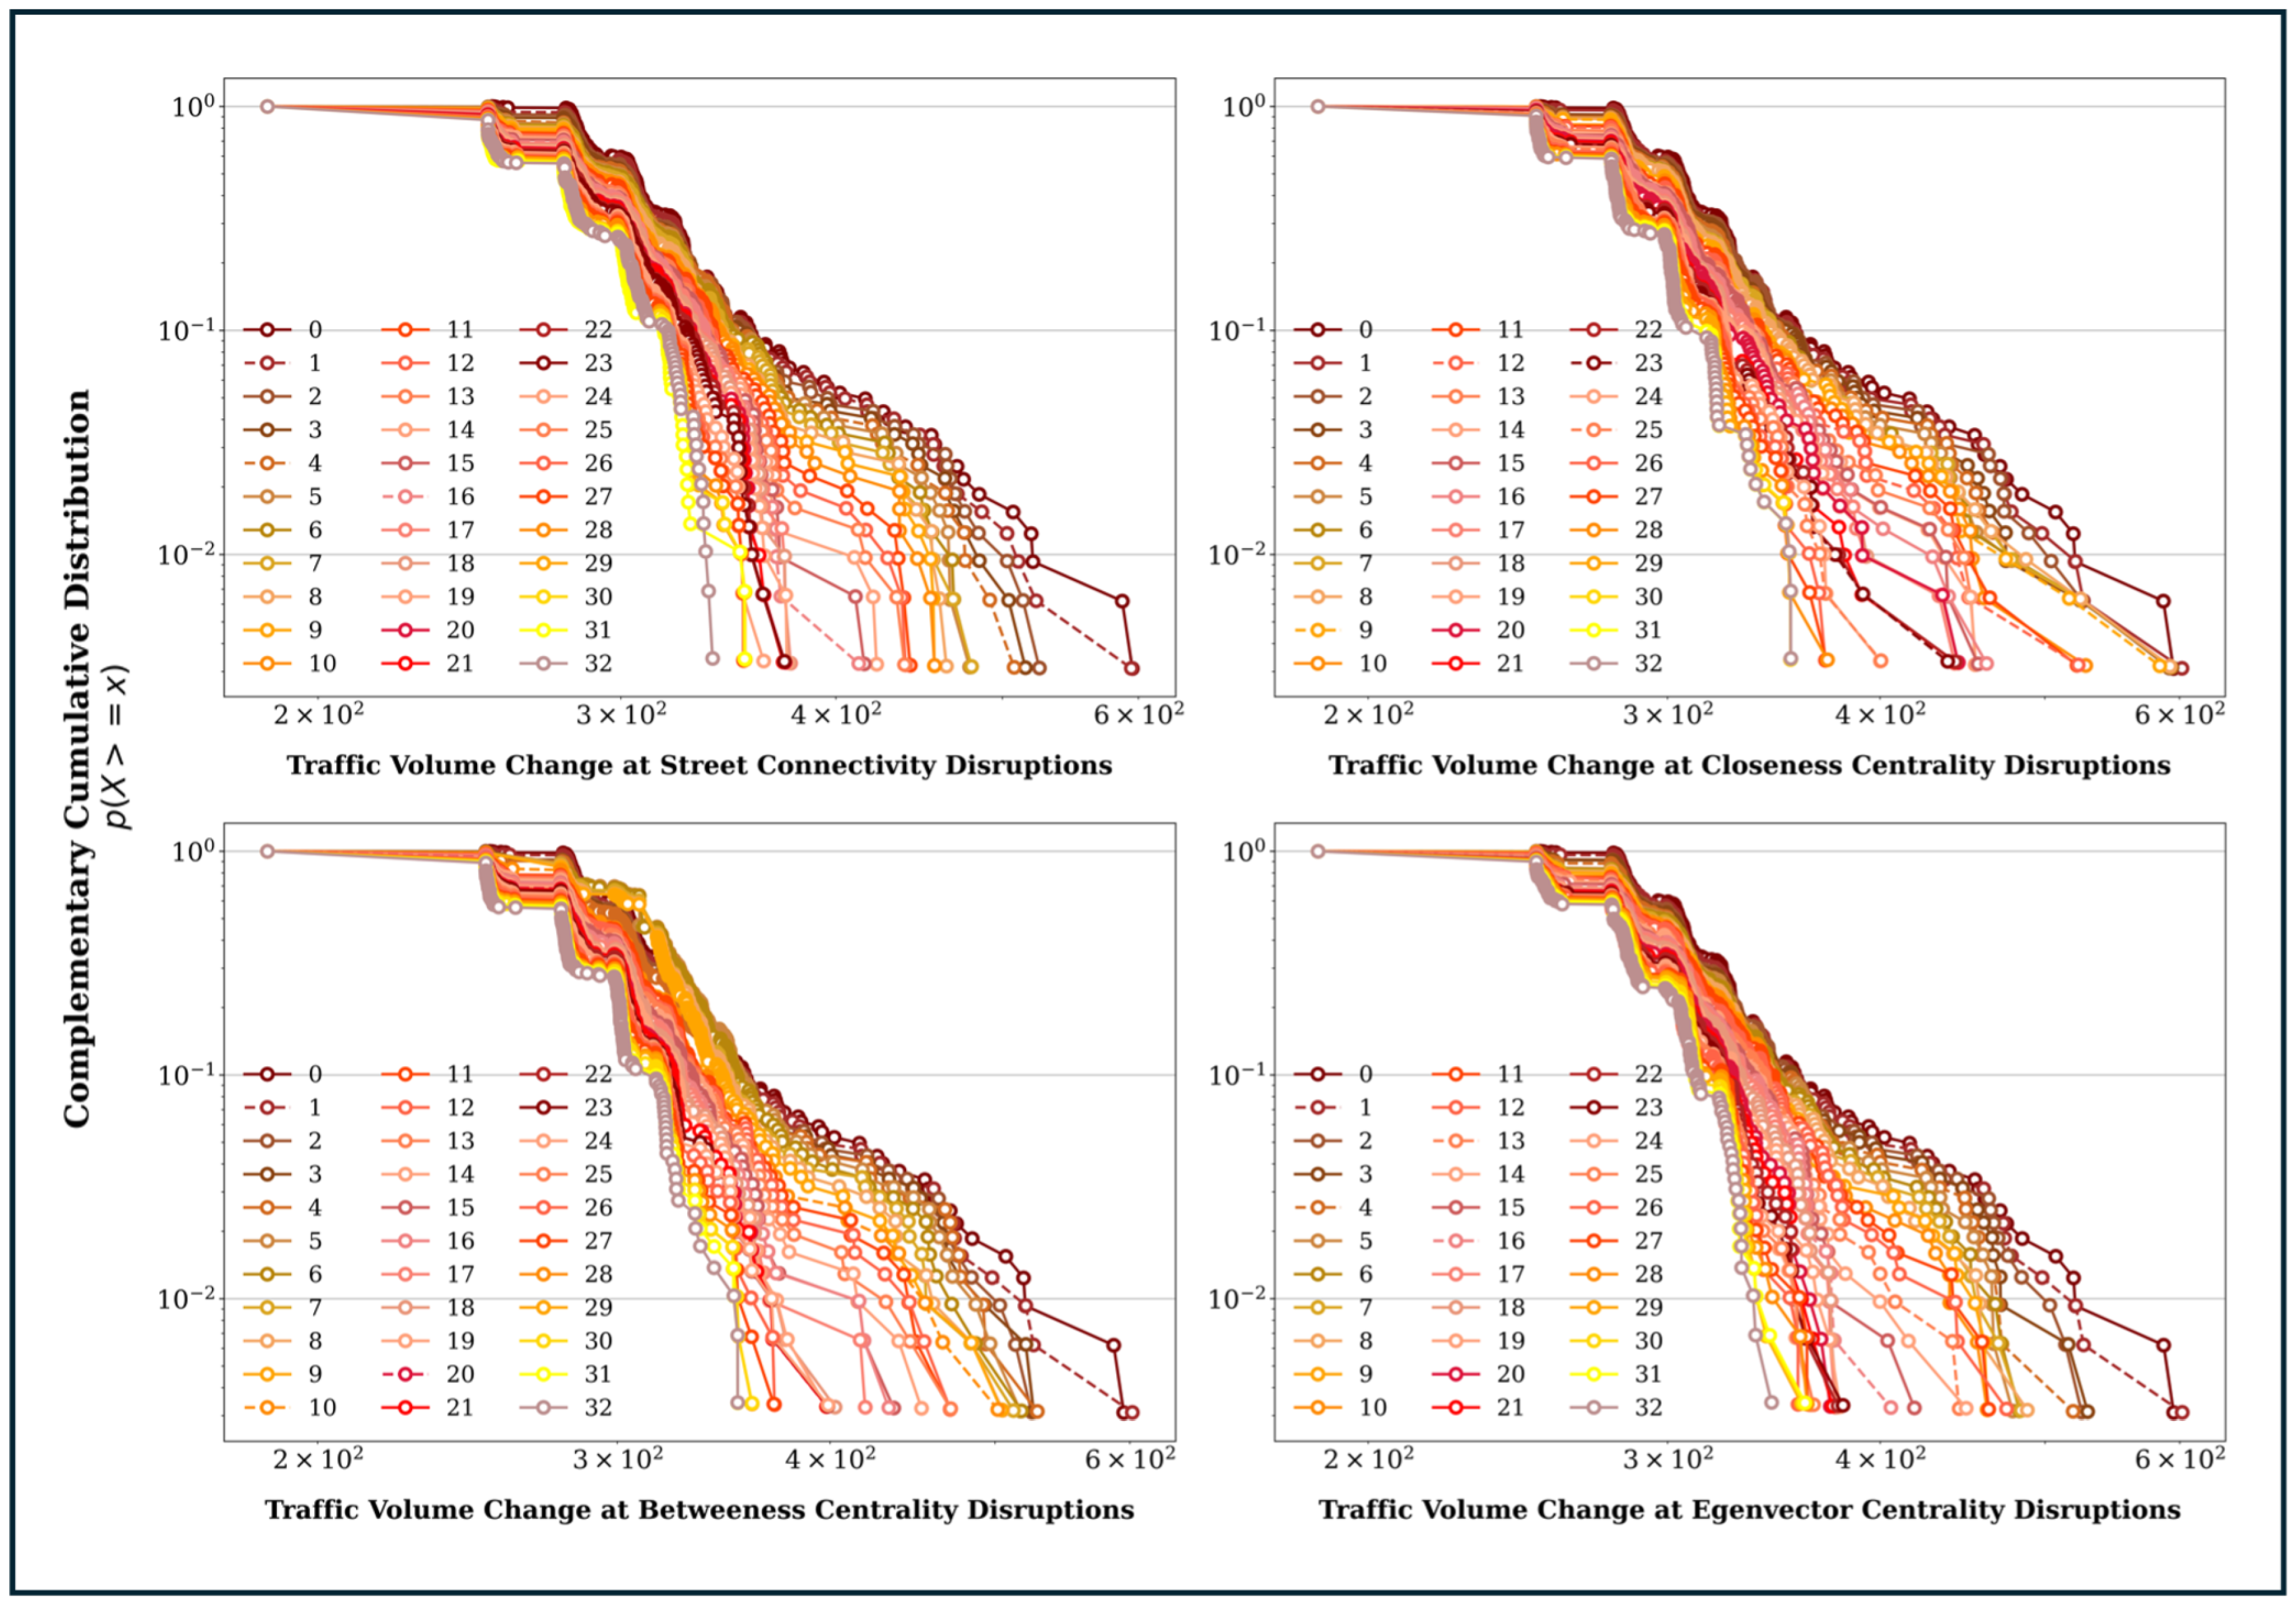
Figure 4 shows the CCDF of the traffic volume distribution under critical link attacks of each topological parameter for undisruptive conditions and for the first 10% of critical link attacks. To gain a more comprehensive understanding of the changes in traffic volume corresponding to each individual critical link attack, we individually calculated the first 10% of the attacks. These attacks comprised 32 individual critical-link attacks lying between the Undisputed Condition (0 state) and a 10% disruption (from 1 to 32) in the CCDF functions.
As depicted in
Figure 4, under the undisrupted condition (state 0), the CCDF curve exhibits a smoother decline, reflecting a well-distributed traffic flow across the network. However, as disruptions progress from 1 to 32, the curves drop more steeply, particularly at the tail, where critical links with higher traffic volumes are targeted. This sharp decline in the tail indicates the significant loss of flow capacity in key road segments, which play a crucial role in handling the highest traffic volumes. The tail of the distribution represents the critical network links of the network, which carry a greater traffic volume than the segments at the head. Therefore, all the distribution functions exhibit heavy-tailed behaviour with a greater probability and very high criticality of their respective traffic volumes. However, this tendency gradually decreases as each critical link segment carrying more traffic flow is attacked in each iteration. This results in a significant reduction in the traffic volume in the network. There are two major reasons for this: (I) there is no available segment to redirect the excess traffic once the critical link has been attacked or (II) the failure of certain roads has a lesser impact on the network when the critical segments are attacked.
Meanwhile, the increasing probability at the head of the distribution suggests that remaining road segments absorb displaced traffic, reflecting flow redistribution to less critical or alternative paths. The differences between curves highlight the network’s growing fragility under critical link attacks, as higher disruptions lead to congestion, bottlenecks, and eventual fragmentation. These patterns underscore the network’s reduced capacity to maintain traffic flow efficiency and resilience, particularly as critical links with high flow-concentrating importance are progressively removed.
Importantly, the study revealed that attack on certain critical road segments caused a significant drain of the traffic volume at the tail because there is no alternative segment available to transfer the excess traffic once the critical link has been attacked, the remaining segments are unable to cater to the increasing demand owing to lack of level of service, or no alternative paths exist after the particular critical segment has been attacked to complete the ride to the desired origin and destination point (refer to the dashed lines depicted in
Figure 4). Such critical links caused a significant drain of traffic volume from the network compared to other critical link attacks, as their jump had significant gaps from the initial position and position after the critical link attacks. The study identified that these jumps in certain critical segments were evident in all the topological parameters considered.
For instance, critical link attacks on SC resulted in significant traffic flow changes after disruptions to links 1, 4, and 16. This occurred because the network lost its highly connected road segments, leading to a significant impact on traffic volume. As a result, the network became scattered, and trips shifted towards locally connected segments for trip generation. Subsequently, critical road segments with high BC identify the key flow-concentrating links, which contain greater traffic flow. A critical link attack on these segments drastically reduces traffic volume by disrupting the shortest path that carries the most trips. This reduction is evident in the traffic volume changes observed in the critical link attacks on Segments 1, 10, and 20.
Similarly, initial disruptions to the highly globally connected EC segment 1 cause a significant decline in traffic volume, as these segments influence a larger number of trip movements by capturing both direct and indirect influences across the entire topological network. However, as the network begins to fracture, trips are redistributed to alternative segments, leading to a relatively lower impact on traffic volume, as the network’s functionality becomes more localized.
Meanwhile, disruptions in critical road segments with high CC have a significant impact on the decline in traffic volume. This occurs in several stages, starting with the loss of the shortest-path road segment that is closely connected to other segments, causing all connected clusters to lose their network accessibility. Shifts in network accessibility to alternative segments occur after each loss, further reducing traffic volume. Neighbouring segments are also affected as they lose accessibility due to the loss of the shortest-path road segment. This process is evident from the larger jumps observed during critical link attacks on segments 9, 12, 23, and 25. This process continues until the network becomes fragmented, with each segment isolated and no trips generated.
5. Conclusion and Future Work
This study aims to provide a comprehensive approach to assessing the vulnerability of transportation networks by evaluating both network performance and traffic volume under critical-link attacks, focusing on worst-case scenarios. Previous studies have often been limited by static and deterministic analyses, focusing solely on statistical characteristics or the impact of disruptions on traffic flow. In contrast, this research integrates both perspectives—network performance and traffic flow—under worst-case scenarios. Critical road segments, identified based on various topological parameters, were disrupted sequentially, and changes in performance were assessed using the CCDF. To assess the impact on traffic volume, a linear relationship between the AADT and topological parameters derived from natural street transformations was established, with the CCDF function applied to evaluate changes in traffic volume under critical-link attacks.
The findings demonstrate that the proposed approach effectively identifies critical components of the transportation network and evaluates the significance of damage under each topological perspective. This method is particularly valuable in scenarios where data or predefined disruption conditions are unavailable, making it highly applicable for general cases, including those in Asian cities. Unlike traditional scenario-specific methods, which rely on predefined conditions, the worst-case scenario analysis allows for a broader, more practical vulnerability assessment that can be applied in diverse contexts, offering insights into how disruptions to certain topological parameters can severely impact network performance and traffic flow.
By using the CCDF for each topological parameter, this study revealed how critical link attacks affect transportation network performance. The results indicate that, under normal conditions, the distributions have heavy tails, suggesting high probability and criticality. However, during attacks, the tail of the distribution is damaged as critical links of the network are attacked. Consequently, all the distribution functions under disruption depict a lower tail with reduced probability and criticality for each topological parameter, as the most impacted segments are targeted during each disruption iteration. Disruptions to these key segments can lead to severe consequences for network performance. By employing this approach, we highlight how analyzing critical link disruptions associated with each topological parameter allows for a detailed understanding of their individual influence on network vulnerability. This insight underscores the need to prioritize the strengthening of these segments to ensure a robust and resilient transportation system.
Furthermore, this study explains the impact on traffic flow when critical segments are attacked. It depicted that the critical link attacks lead to significant declines in traffic volume across all phases related to SC, CC, BC, and EC. Besides, the disruption of specific critical road segments results in a significant jump in traffic volume compared to other attacks on critical segments in the network. This phenomenon occurs either due to a lack of alternative segments to redirect traffic or because certain road failures have less impact on the network. This study identifies these critical road segments as those responsible for substantial declines in traffic volume, where no alternative paths are available after their disruption, resulting in a significant drain in traffic volume. By incorporating topological parameters into the evaluation, we provide valuable insights into how these parameters can be effectively utilized to assess network vulnerability, emphasizing the severe consequences that disruptions to certain parameters can have on overall network performance and traffic flow.
Accordingly, findings of this study underscore several critical policy implications aimed at mitigating transportation network vulnerabilities under critical-link attacks. Policymakers must prioritize identifying critical road segments that significantly influence network performance and traffic flow under various topological perspectives. Using tools like the CCDF, these critical links can be systematically evaluated to understand their impact on traffic volume and serviceability. Targeted investments should then be made to strengthen these critical segments, including infrastructure upgrades like road widening, bridge reinforcement, and intelligent traffic management systems, to preserve network functionality during disruptions. Moreover, the study highlights the necessity of enhancing route diversification and providing alternative paths, particularly since some critical link failures leave no viable alternative paths. Developing alternative routes and improving connectivity across less critical links can help alleviate congestion and ensure continuity of traffic flow. Together, these measures can enhance the resilience and adaptability of transportation networks in the face of evolving challenges.
5.1. Limitations and Future Works
Although this study contributes valuable insights into transportation network resilience, it has several limitations that should be acknowledged. First, the research primarily concentrates on topological parameters to evaluate transportation network vulnerability in the face of critical link attacks, neglecting essential physical components, such as route choice, link cost, travel time, and origin-destination trip distribution. Consequently, the findings of this study are limited to an assessment based solely on topological parameters. Second, this study assesses vulnerability using worst-case critical link attacks on a topologically transformed network but may oversimplify segmentation by ignoring road class, speed limits, or location. Future research should incorporate these factors for more nuanced results. Additionally, the framework lacks applicability for real-time resilience and traffic flow analysis. Third, this study relies on topological parameters to estimate traffic volume, excluding spatial factors like weather and proximity to traffic generators, which can bias results. While the approach effectively assesses network vulnerability in data-limited Asian cities, incorporating spatial variables in future research would enhance accuracy and applicability.
Author Contributions
Conceptualization, K.L.D.C.H.N. and T.K.; methodology, K.L.D.C.H.N. and T.K.; software, K.L.D.C.H.N.; validation, K.L.D.C.H.N. and T.K.; formal analysis, K.L.D.C.H.N.; investigation, K.L.D.C.H.N., T.K. and K.S.; data curation, K.L.D.C.H.N.; writing—original draft preparation, K.L.D.C.H.N.; writing—review and editing, K.L.D.C.H.N. and T.K.; visualization, K.L.D.C.H.N.; supervision, T.K. and K.S.; project administration, T.K. and K.S.; funding acquisition, K.S. All authors have read and agreed to the published version of the manuscript.
Funding
This research received no external funding.
Institutional Review Board Statement
Not applicable.
Informed Consent Statement
Not applicable.
Data Availability Statement
Details of all the data used in this research are provided in
Section 2.
Acknowledgments
Not applicable.
Conflicts of Interest
Regarding this paper and the research, the authors state that they have no conflicts of interest.
Abbreviations
The following abbreviations are used in this manuscript:
| CCDF |
Complementary Cumulative Distribution Function |
| CMC |
Colombo Municipal Council |
| UE |
User Equilibrium |
| SC |
Street Connectivity |
| BC |
Betweenness Centrality |
| CC |
Closeness Centrality |
| EC |
Eigenvector Centrality |
| TS |
Total Segments |
| AS |
Attacked Segments |
| CMA |
Colombo Metropolitan Area |
| GDP |
Gross Domestic Product |
| JICA |
Japan International Cooperation Agency |
| DS |
Divisional Secretariat |
| SLSD |
Survey Department of Sri Lanka |
| AADT |
Annual Average Daily Traffic |
| CDF |
Cumulative Distribution Function |
| VIF |
Variance Inflation Factor |
| MAPE |
Mean Absolute Percentage Error |
References
- Taylor, M.A.; D’Este, G.M. Transport network vulnerability: a method for diagnosis of critical locations in transport infrastructure systems. In Critical infrastructure: Reliability and vulnerability; Springer, 2007; pp. 9–30. [CrossRef]
- Bell, M.G.; Kanturska, U.; Schmöcker, J.D.; Fonzone, A. Attacker–defender models and road network vulnerability. Philosophical Transactions of the Royal Society A: Mathematical, Physical and Engineering Sciences 2008, 366, 1893–1906. [Google Scholar] [CrossRef]
- Derrible, S.; Kennedy, C. The complexity and robustness of metro networks. Physica A: Statistical Mechanics and its Applications 2010, 389, 3678–3691. [Google Scholar] [CrossRef]
- Taylor, M. Vulnerability analysis for transportation networks; Elsevier, 2017. [CrossRef]
- Mattsson, L.G.; Jenelius, E. Vulnerability and resilience of transport systems–A discussion of recent research. Transportation research part A: policy and practice 2015, 81, 16–34. [Google Scholar] [CrossRef]
- Starita, S.; Scaparra, M.P. Assessing road network vulnerability: A user equilibrium interdiction model. Journal of the Operational Research Society 2021, 72, 1648–1663. [Google Scholar] [CrossRef]
- Wisetjindawat, W.; Wilson, R.E.; Bullock, S.; De Villafranca, A.E.M. Modeling the impact of spatial correlations of road failures on travel times during adverse weather conditions. Transportation research record 2019, 2673, 157–168. [Google Scholar] [CrossRef]
- Casali, Y.; Heinimann, H.R. A topological characterization of flooding impacts on the Zurich road network. PLoS one 2019, 14, e0220338. [Google Scholar] [CrossRef]
- Kermanshah, A.; Derrible, S. A geographical and multi-criteria vulnerability assessment of transportation networks against extreme earthquakes. Reliability Engineering & System Safety 2016, 153, 39–49. [Google Scholar] [CrossRef]
- Postance, B.; Hillier, J.; Dijkstra, T.; Dixon, N. Extending natural hazard impacts: an assessment of landslide disruptions on a national road transportation network. Environmental Research Letters 2017, 12, 014010. [Google Scholar] [CrossRef]
- Wisetjindawat, W.; Kermanshah, A.; Derrible, S.; Fujita, M. Stochastic modeling of road system performance during multihazard events: Flash floods and earthquakes. Journal of infrastructure systems 2017, 23, 04017031. [Google Scholar] [CrossRef]
- Lu, Q.C.; Peng, Z.R.; Zhang, J. Identification and prioritization of critical transportation infrastructure: Case study of coastal flooding. Journal of Transportation Engineering 2015, 141, 04014082. [Google Scholar] [CrossRef]
- Abenayake, C.; Jayasinghe, A.; Kalpana, H.N.; Wijegunarathna, E.E.; Mahanama, P. An innovative approach to assess the impact of urban flooding: Modeling transportation system failure due to urban flooding. Applied geography 2022, 147, 102772. [Google Scholar] [CrossRef]
- Jenelius, E.; Mattsson, L.G. Road network vulnerability analysis of area-covering disruptions: A grid-based approach with case study. Transportation research part A: policy and practice 2012, 46, 746–760. [Google Scholar] [CrossRef]
- Hosseini Nourzad, S.H.; Pradhan, A. Vulnerability of infrastructure systems: Macroscopic analysis of critical disruptions on road networks. Journal of Infrastructure Systems 2016, 22, 04015014. [Google Scholar] [CrossRef]
- Jenelius, E.; Mattsson, L.G. Road network vulnerability analysis: Conceptualization, implementation and application. Computers, environment and urban systems 2015, 49, 136–147. [Google Scholar] [CrossRef]
- Jenelius, E.; Petersen, T.; Mattsson, L.G. Importance and exposure in road network vulnerability analysis. Transportation Research Part A: Policy and Practice 2006, 40, 537–560. [Google Scholar] [CrossRef]
- Gao, L.; Liu, X.; Liu, Y.; Wang, P.; Deng, M.; Zhu, Q.; Li, H. Measuring road network topology vulnerability by Ricci curvature. Physica A: Statistical Mechanics and Its Applications 2019, 527, 121071. [Google Scholar] [CrossRef]
- Hackl, J.; Adey, B.T. Estimation of traffic flow changes using networks in networks approaches. Applied Network Science 2019, 4, 28. [Google Scholar] [CrossRef]
- Lin, C.; Yu, Y.; Wu, D.; Gong, B. Traffic flow catastrophe border identification for urban high-density area based on cusp catastrophe theory: A case study under sudden fire disaster. Applied Sciences 2020, 10, 3197. [Google Scholar] [CrossRef]
- Jiang, B.; Huang, J.T. A new approach to detecting and designing living structure of urban environments. Computers, Environment and Urban Systems 2021, 88, 101646. [Google Scholar] [CrossRef]
- Gao, Y.; Zhu, J. Characteristics, Impacts and trends of urban transportation. Encyclopedia 2022, 2, 1168–1182. [Google Scholar] [CrossRef]
- Wan, C.; Yang, Z.; Zhang, D.; Yan, X.; Fan, S. Resilience in transportation systems: a systematic review and future directions. Transport reviews 2018, 38, 479–498. [Google Scholar] [CrossRef]
- Pucher, J. The urban transport crisis in emerging economies, 2018. [CrossRef]
- Tsiotas, D.; Polyzos, S. The topology of urban road networks and its role to urban mobility. Transportation research procedia 2017, 24, 482–490. [Google Scholar] [CrossRef]
- Chen, M.; Wu, F.; Yin, M.; Xu, J. Impact of road network topology on public transportation development. Wireless communications and mobile computing 2021, 2021, 6209592. [Google Scholar] [CrossRef]
- Tu, Y.; Yang, C.; Chen, X. Road network topology vulnerability analysis and application. In Proceedings of the Proceedings of the Institution of Civil Engineers-Transport. [CrossRef]
- Barthélemy, M. Spatial networks. Physics reports 2011, 499, 1–101. [Google Scholar] [CrossRef]
- Jiang, B.; Zhao, S.; Yin, J. Self-organized natural roads for predicting traffic flow: a sensitivity study. Journal of statistical mechanics: Theory and experiment 2008, 2008, P07008. [Google Scholar] [CrossRef]
- Porta, S.; Crucitti, P.; Latora, V. The network analysis of urban streets: a primal approach. Environment and Planning B: planning and design 2006, 33, 705–725. [Google Scholar] [CrossRef]
- Lowry, M. Spatial interpolation of traffic counts based on origin–destination centrality. Journal of Transport Geography 2014, 36, 98–105. [Google Scholar] [CrossRef]
- Lin, J.; Ban, Y. Complex network topology of transportation systems. Transport reviews 2013, 33, 658–685. [Google Scholar] [CrossRef]
- Boeing, G. Street network models and indicators for every urban area in the world. Geographical analysis 2022, 54, 519–535. [Google Scholar] [CrossRef]
- Hillier, B. Space is the machine: a configurational theory of architecture; Space Syntax, 2007.
- Jiang, B.; Liu, C. Street-based topological representations and analyses for predicting traffic flow in GIS. International Journal of Geographical Information Science 2009, 23, 1119–1137. [Google Scholar] [CrossRef]
- Barabási, A.L.; Albert, R. Emergence of scaling in random networks. science 1999, 286, 509–512. [Google Scholar] [CrossRef]
- Newman, M. Networks: An Introduction; Oxford University Press, 2010. [CrossRef]
- Porta, S.; Latora, V.; Wang, F.; Rueda, S.; Strano, E.; Scellato, S.; Cardillo, A.; Belli, E.; Cardenas, F.; Cormenzana, B.; et al. Street centrality and the location of economic activities in Barcelona. Urban studies 2012, 49, 1471–1488. [Google Scholar] [CrossRef]
- Turner, A. From axial to road-centre lines: a new representation for space syntax and a new model of route choice for transport network analysis. Environment and Planning B: planning and Design 2007, 34, 539–555. [Google Scholar] [CrossRef]
- Solá, L.; Romance, M.; Criado, R.; Flores, J.; García del Amo, A.; Boccaletti, S. Eigenvector centrality of nodes in multiplex networks. Chaos: An Interdisciplinary Journal of Nonlinear Science 2013, 23. [Google Scholar] [CrossRef]
- Freeman, L.C. Visualizing social networks. Journal of social structure 2000, 1, 4. [Google Scholar]
- Jiang, B.; Claramunt, C. Topological analysis of urban street networks. Environment and Planning B: Planning and design 2004, 31, 151–162. [Google Scholar] [CrossRef]
- Thomson, R.C. Bending the axial line: Smoothly continuous road centre-line segments as. In Proceedings of the Proceedings 4th International Space Syntax Symposium, London, UK. Citeseer; 2004. [Google Scholar]
- Jiang, B.; Claramunt, C.; Klarqvist, B. Integration of space syntax into GIS for modelling urban spaces. International Journal of Applied Earth Observation and Geoinformation 2000, 2, 161–171. [Google Scholar] [CrossRef]
- Jiang, B. Ranking spaces for predicting human movement in an urban environment. International Journal of Geographical Information Science 2009, 23, 823–837. [Google Scholar] [CrossRef]
- Lämmer, S.; Gehlsen, B.; Helbing, D. Scaling laws in the spatial structure of urban road networks. Physica A: Statistical Mechanics and its Applications 2006, 363, 89–95. [Google Scholar] [CrossRef]
- LDCHN, K.; KATO, T.; SANO, K. How Topology Changes Under Disruptive Conditions Affect Transportation System Resilience A Case Study of Colombo. Journal of the Eastern Asia Society for Transportation Studies 2024, 15, 435–454. [Google Scholar]
- JICA. Urban Transport System Development Project for Colombo Metropolitan Region and Suburbs - Final Report. Technical report, JICA, 2014. JICA.
- Malalgoda, C.; Amaratunga, D. A disaster resilient built environment in urban cities: The need to empower local governments. International Journal of Disaster Resilience in the Built Environment 2015, 6, 102–116. [Google Scholar] [CrossRef]
- Hewawasam, V.; Matsui, K. Equitable resilience in flood prone urban areas in Sri Lanka: A case study in Colombo Divisional Secretariat Division. Global Environmental Change 2020, 62, 102091. [Google Scholar] [CrossRef]
- Patankar, A.M. Colombo: exposure, vulnerability, and ability to respond to floods. World Bank Policy Research Working Paper 2017. [Google Scholar] [CrossRef]
- Alstott, J.; Bullmore, E.; Plenz, D. powerlaw: a Python package for analysis of heavy-tailed distributions. PloS one 2014, 9, e85777. [Google Scholar] [CrossRef] [PubMed]
- Yi, J.; Zhang, H.; Liu, H.; Zhong, G.; Li, G. Flight delay classification prediction based on stacking algorithm. Journal of Advanced Transportation 2021, 2021, 4292778. [Google Scholar] [CrossRef]
- Dormann, C.F.; Elith, J.; Bacher, S.; Buchmann, C.; Carl, G.; Carré, G.; Marquéz, J.R.G.; Gruber, B.; Lafourcade, B.; Leitão, P.J.; et al. Collinearity: a review of methods to deal with it and a simulation study evaluating their performance. Ecography 2013, 36, 27–46. [Google Scholar] [CrossRef]
- Jayasinghe, A.; Sano, K.; Abenayake, C.C.; Mahanama, P. A novel approach to model traffic on road segments of large-scale urban road networks. MethodsX 2019, 6, 1147–1163. [Google Scholar] [CrossRef]
|
Disclaimer/Publisher’s Note: The statements, opinions and data contained in all publications are solely those of the individual author(s) and contributor(s) and not of MDPI and/or the editor(s). MDPI and/or the editor(s) disclaim responsibility for any injury to people or property resulting from any ideas, methods, instructions or products referred to in the content. |
© 2025 by the authors. Licensee MDPI, Basel, Switzerland. This article is an open access article distributed under the terms and conditions of the Creative Commons Attribution (CC BY) license (http://creativecommons.org/licenses/by/4.0/).