
Submitted:
11 March 2025
Posted:
11 March 2025
You are already at the latest version
Abstract
We propose a vertiport location-allocation methodology for Urban Air Mobility (UAM) from the perspective of transportation network topology. The location allocation of vertiports within a transportation network is a crucial factor in determining the unique characteristics of UAM compared to existing transportation modes. However, as UAM is still in the pre-commercialization phase with significant uncertainties, there are limitations in applying location-allocation models that optimize objective functions such as maximizing service coverage or minimizing travel distance. Instead, vertiport location-allocation should be approached from a strategic perspective, taking into account public capital investments aimed at improving the transportation network by leveraging UAM’s distinct characteristics compared to existing urban transportation modes. Therefore, we present a methodology for evaluating the impact of vertiport location-allocation strategies on changes in transportation network topology. To analyze network topology, we use the Seoul Metropolitan railway network as the base network and construct scenarios where vertiports are allocated based on highly connected nodes and those prioritizing structurally vulnerable nodes. We then compare and analyze global network efficiency, algebraic connectivity, average shortest path length, local clustering coefficient, transitivity, degree assortativity and modularity. We confirm that while allocating vertiports based on network centrality improves connectivity compared to vulnerability-based allocation, the latter approach is superior in terms of network efficiency. Additionally, as the proportion of vertiports increases, the small-world property of the network rapidly increases, indicating that the vertiport network can fundamentally alter the structure of multimodal transportation systems. Regardless of whether centrality or vulnerability is prioritized, we observe that connectivity increase exponentially, while network efficiency changes linearly with the increase in vertiport proportion. Our findings highlight the necessity of a network-based approach to vertiport location-allocation in the early stages of UAM commercialization, and we expect our results to inform future research directions on vertiport allocation in multimodal transportation networks.
Keywords:
Urban Air Mobility (UAM)
; Vertiport Location-Allocation
; Transportation Network Topology
; Network Vulnerability
; Network Centrality
1. Introduction
We aim to propose a direction for the mid-to-long-term optimal allocation of vertiports during the initial commercialization phase of Urban Air Mobility (UAM) from a transportation network perspective. The high uncertainty surrounding the characteristics of UAM as a transportation mode, its concept of operations, and public acceptability poses a significant challenge in allocating an optimal vertiport location. This results in the limitation of localized solutions that fail to account for a broader strategic framework. Furthermore, the absence of long-term strategic planning for vertiport placement may lead to substantial opportunity costs, particularly in terms of planned UAM commercialization patterns and synergies with existing transportation systems. To address this issue, we seek to provide insights into the development of a global solution for vertiport allocation from a transportation network perspective as a first step toward resolving these challenges.
Traditional location models face difficulties in securing concrete variables required for UAM deployment. The optimal placement of transportation infrastructure is generally premised on maximizing service coverage and minimizing travel distance as objective functions [1,2,3,4,5,6,7,8,9,10,11,12]. To solve these objective functions, decision variables and constraints must be defined. From a transportation infrastructure perspective, decision variables should include characteristics of the mode and network, while constraints must encompass resource limitations, supply-demand balance, and the boundaries of decision variables. At present, UAM lacks the necessary data and realistic parameters to conduct such an analysis effectively.
Before developing a concrete location allocation model, a methodological framework for conceptual vertiport location optimization is required. Existing studies addressing vertiport location have primarily relied on scenario-based approaches that assume hypothetical UAM services, questionnaire-based methods such as Stated Preference (SP) surveys to estimate demand [13,14,15,16,17,18,19,20,21]. However, current research on vertiport placement is limited due to the absence of real-world operational data, making it difficult to accurately model real-world conditions [22,23,24,25,26]. Additionally, given the distinct characteristics of UAM compared to conventional transportation modes, no studies were found within the scope of this research that consider vertiport placement from a transportation network perspective. Therefore, it is crucial to develop a methodological framework for optimizing vertiport locations at a conceptual level.
At this stage, it is necessary to explore robust network-based vertiport siting methodologies that can accommodate future uncertainties while contributing to the strategic development of a resilient transportation network. The commercialization of UAM will serve as an inflection point in reshaping urban transportation paradigms, as it will significantly influence the structure of transportation networks [27]. Moreover, given the competitive nature of investments in vertiports for new transportation modes the rate of network transformation is accelerating [28,29,30,31,32]. The increasing uncertainty surrounding the commercialization of autonomous vehicles, user behavior toward UAM, and societal acceptance further complicates the prediction of competitive and cooperative dynamics between different modes of transport [33,34,35,36,37,38]. In this context, establishing a directional approach for optimizing vertiport placement from a network perspective is of paramount importance.
To enhance the synergy between UAM and existing urban transportation networks, it is necessary to develop a methodological framework for network-based vertiport allocation. Since UAM requires vertiports for takeoff and landing, the placement of vertiports within the transportation network will be a key determinant of UAM’s role within the broader system [39,40,41]. UAM operates as a high-speed, small-scale urban transport mode that requires dedicated stations while utilizing designated airspace and flight corridors, making it distinct from traditional terrestrial modes. Furthermore, UAM is expected to overcome the limitations of helicopter transport while achieving a higher passenger capacity. Consequently, how vertiports are positioned within transportation networks will play a crucial role in shaping the future development of UAM.
This study proposes a network science-based methodology for allocating optimal vertiport locations and applies it to the Urban railway network of the Seoul Metropolitan Area, South Korea. Section 2 reviews network methodologies for analyzing transportation structures, prior research on airport and infrastructure siting, and existing studies on vertiport placement. Section 3 details the proposed methodology, datasets, and case study procedures. Section 4 presents a comparative analysis of changes in network characteristics under different vertiport placement scenarios. Finally, Section 5 discusses the findings, academic contributions, and concluding remarks.
2. Literature Review
Research on the characteristics of transportation networks has been continuously conducted. Jia et al. (2019) analyzed the public transportation network of Xi’an, selecting and optimizing the locations of public transport hubs [37]. They identified an imbalance in the network due to the excessively high centrality of certain hub nodes and proposed optimal hub locations to address this limitation. Hammad et al. (2021) proposed a conceptual framework for the establishment and operation of global logistics energy hubs and evaluated the efficiency of energy supply chains by utilizing network centrality and connectivity indicators [35]. Hammad et al. (2019) demonstrated that logistics costs could be reduced by up to 30% and annual export volumes could increase by 15–20% when hubs were established in regions with high network centrality, thereby proving the potential for cost reduction and operational efficiency improvements in supply chains. Aydin, Seker, Özkan (2022) employed the WASPAS (Weighted Aggregated Sum Product Assessment) methodology, which assigns appropriate weights to network centrality measures (degree centrality, betweenness centrality, and closeness centrality) to evaluate their significance and determine the optimal locations for sustainable urban mobility hubs. In line with these studies on network characteristics, we examine optimal location strategies for UAM vertiports [32].
Vertiports, as infrastructures where small aircraft take off and land, can be compared to airport infrastructure. Therefore, we refer to studies on airport site location-allocation. Sennaroglu et al. (2018) utilized Analytic Hierarchy Process (AHP) to determine the optimal locations for military airports, setting nine primary criteria (e.g., climate, geographical features, infrastructure) and 33 sub-criteria for evaluation [42]. Zhang et al. (2019) applied a Multi-objective Genetic Algorithm to determine the optimal locations for general airports, designing a multi-objective optimization model that considers obstacle constraints and flight safety [39]. They claimed that the developed methodology provided safer and more economically viable site selections than existing methods and validated the model’s feasibility through data-driven simulations. Liao and Bao (2014) proposed an airport site selection method using triangular fuzzy numbers to address complex multi-attribute decision-making problems [2]. They established key criteria such as operational conditions, implementation conditions, and socio-economic factors, converting expert evaluations into a fuzzy decision matrix. The priority of each alternative was calculated using the concept of fuzzy dominance, and their case study confirmed that the proposed technique was both feasible and effective in evaluating multiple alternatives.
Zhao & Sun (2013) applied the Lattice Order Decision Making method to compare potential airport sites, constructing an evaluation system that integrates subjective judgment with objective data distribution by normalizing indicators [4]. Alves et al. (2020) developed the MESA (Metodologia de Escolha de Sítios Aeroportuários) framework for selecting regional airport locations in Brazil, integrating Geographic Information System (GIS) analysis with AHP [13]. Wang et al. (2016) proposed the PRIME-LS (Probabilistic Influence-based Mobility-aware Location Selection) technique, which considers probabilistic influences in the location selection of moving objects, introducing a novel minMax Radius distance measure to efficiently filter candidate sites [43]. Gao et al. (2009) addressed the Optimal Location Selection (OLS) problem in spatial databases by defining an optimization metric based on distances between spatial objects, refining and filtering candidate sites to enhance computational efficiency [44]. While previous studies have primarily focused on defining decision variables and decision-making methodologies, we recognize the limitations in directly applying these approaches to vertiport site selection at the initial stage of UAM commercialization. Instead, we emphasize the need for a strategic approach to vertiport allocation before developing detailed site selection models.
Various methodological studies on vertiport allocation have been conducted. Yoon et al. (2025) proposed a methodology for optimizing vertiport locations in the Seoul Urban railwaypolitan area by analyzing aviation restrictions and transportation accessibility using GIS data [23]. They highlighted that integrating UAM services with existing transportation infrastructure significantly enhances traffic efficiency and passenger satisfaction. Kotwicz Herniczek & German (2024) proposed a combinatorial optimization approach for vertiport placement in UAM services, aiming to maximize demand and minimize travel time [16]. They further analyzed demand sensitivity and regional characteristics in Atlanta, New York, San Francisco, and Seattle. Cohen analyzed how vertiports could function as urban transportation hubs, ensuring seamless integration with rail, road, and air networks while emphasizing the challenges of site selection and community acceptance in Urban railway areas [45]. Jiang et al. (2024) combined Simulation-Based Optimization (SBO) with a machine learning-based surrogate model to solve the vertiport location optimization problem, applying their methodology to the San Francisco Bay Area [15].
Kim & Park (2022) identified key factors affecting vertiport site selection—such as public acceptance and transportation network connectivity—through Focused Group Interviews (FGI) and AHP, deriving evaluation indicators based on expert input [31]. Chae et al. (2023) developed a local search algorithm to explore optimal vertiport locations in the Seoul Metropolitan railway area. Utilizing real transportation data, they applied a mode choice model to predict demand and adopted partial search techniques to reduce computational complexity in site selection [29]. Rahman et al. (2023) employed a GIS-based approach to optimize vertiport placement by integrating them with existing public transportation networks [28].
Within the scope of this study, we found that most existing research focuses on defining objective functions and establishing normative goals for optimization. However, our network topology-based approach presents a new perspective that could contribute academically by shifting the existing paradigm of vertiport allocation.
3. Methodology
3.1. Overall Research Landscape
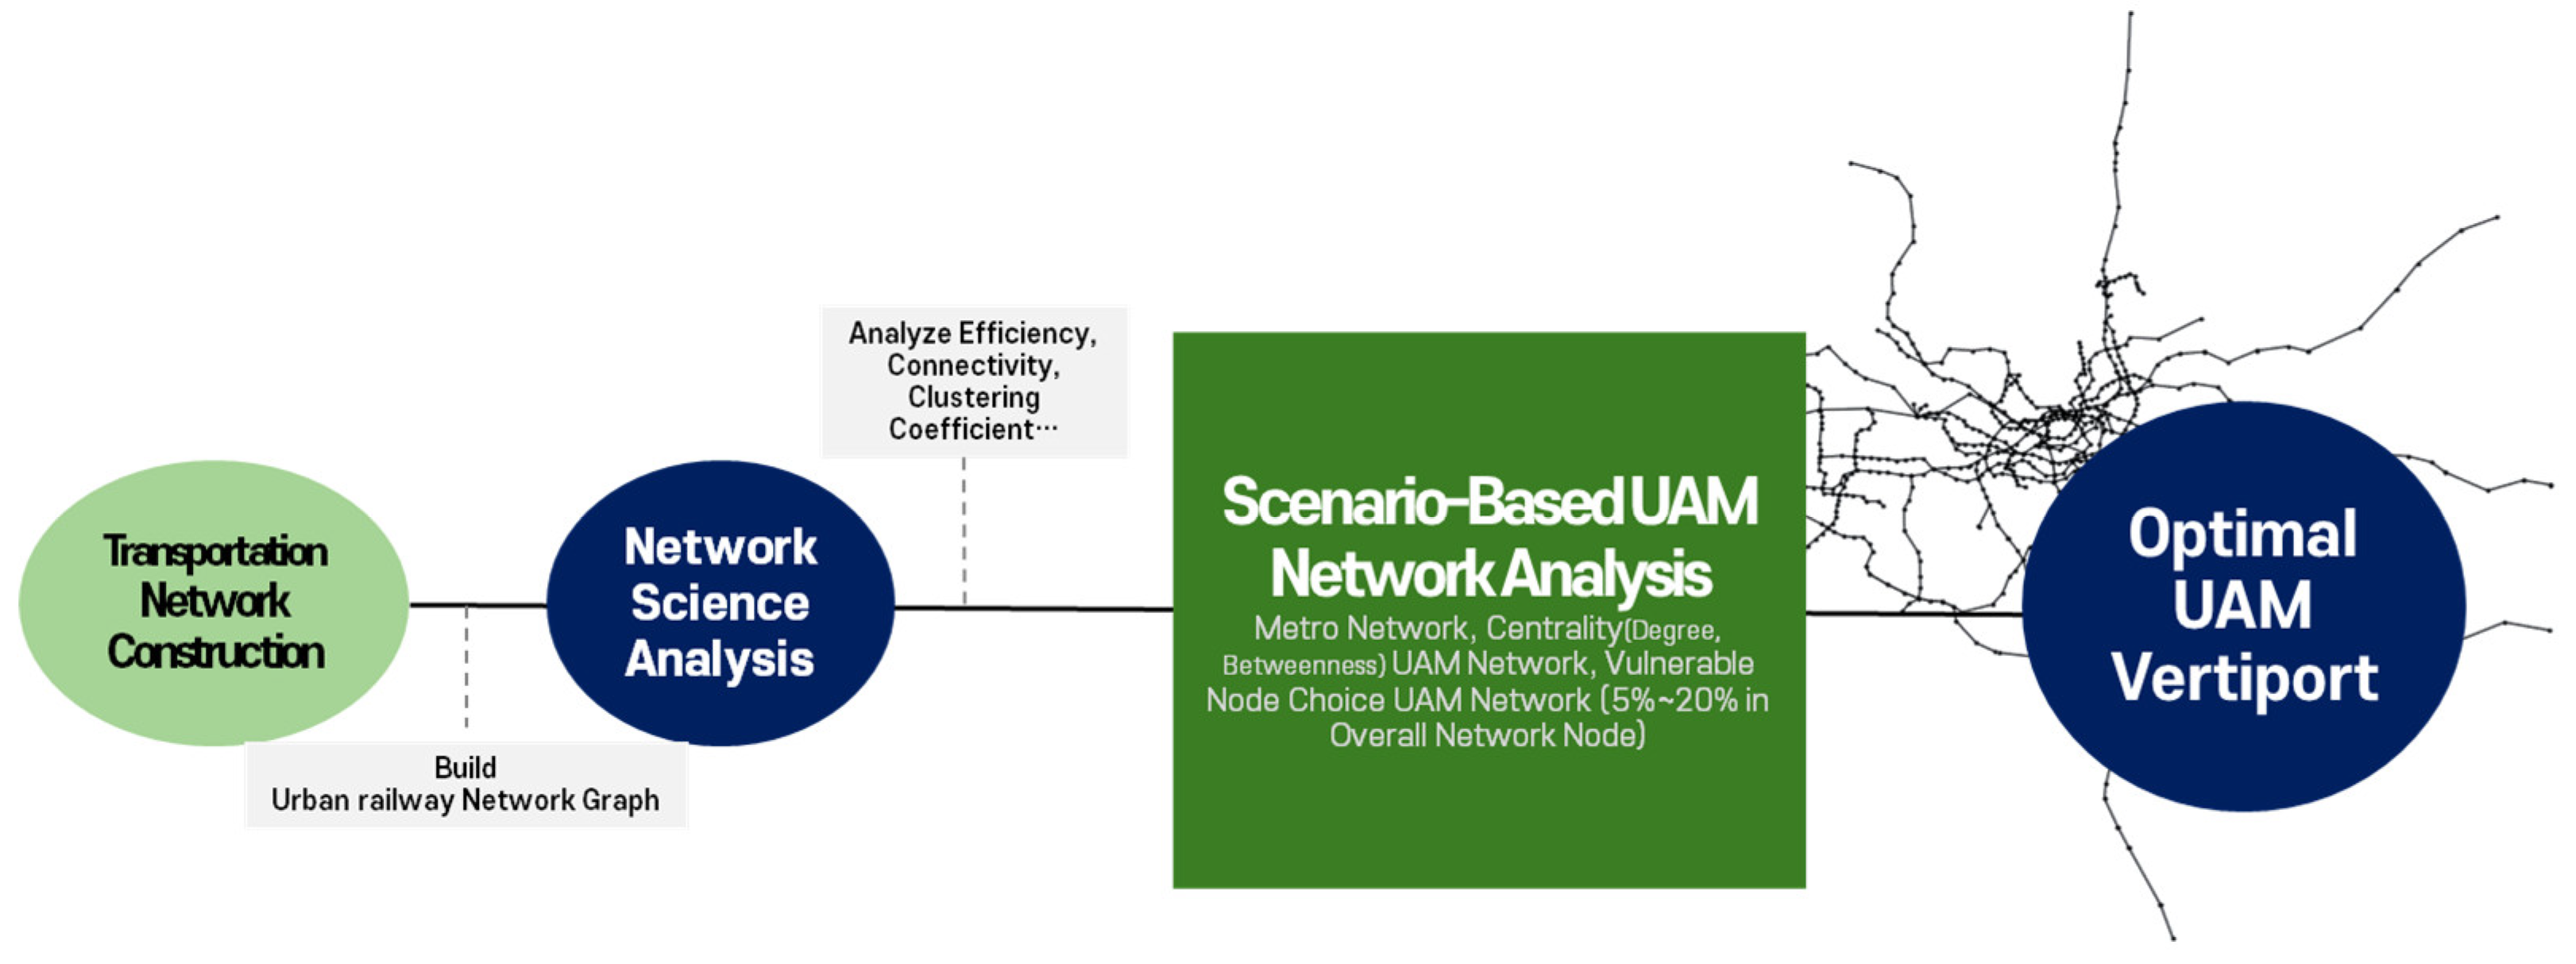
We propose a network topology-based methodology for the optimal allocation of vertiports’ locations. To evaluate the network, we establish global network efficiency, algebraic connectivity, and average shortest path length as key performance indicators, while average local clustering coefficient, transivity, degree assortativity, modularity are set as metrics to assess structural changes in the network.
Using the urban railway network of the Seoul Metropolitan Area as the baseline network, we formulate alternative strategies that prioritize nodes based on centrality and vulnerability, where higher indicator values correspond to higher priority for vertiport placement. Centrality is evaluated using degree centrality and betweenness centrality, while vulnerability is assessed using the metric proposed by Bozzo et al. (2015).
For the centrality- and vulnerability-based strategies, we conduct simulations at 5% increments up to 20% to examine changes in network characteristics. Since this study approaches vertiport allocation from a network perspective, a 20% upper bound is considered a realistic maximum and is deemed appropriate for analyzing variations in network indicators.
Figure 1.
Overall Research Landscape.
3.2. Network Topology Analysis Methodology
The network efficiency metric is a methodology for analyzing the link structure between nodes in a system and is widely utilized to quantitatively assess the characteristics of various complex networks [46]. The efficiency metric used in this study is defined as follows:
: Number of nodes
: Shortest path length between node i and j
The connectivity metric, which measures how effectively all nodes within the network remain connected, is based on Menger’s Theorem. [48] This metric evaluates the extent to which a network remains intact when specific nodes or edges are removed. Connectivity is expressed as follows:
- (1)
- Connectivity of Nodes
: Minimum set of nodes that must be removed to disconnect the network
: Set of all nodes in graph G
- (2)
- Connectivity of Edges
: Minimum set of edges that must be removed to disconnect the network
: Set of all edges in graph G
In Addition, It defined the average shortest path length as the mean of the shortest distances between all pairs of nodes in a network. A lower average shortest path length indicates a network structure that facilitates efficient information transmission and overall higher connectivity.
: Number of nodes
: Shortest path length between node i and j
Watts and Strogatz (1998) introduced the concept of the clustering coefficient, which quantifies the proportion of triangles formed within a network [49]. The clustering coefficient measures the extent to which a given node’s neighbors are interconnected, with higher values indicating a greater degree of local connectivity. This metric is particularly useful for assessing the local structural properties of a network:
: Number of triangles formed by the neighbors of node i
: Degree of node i
Fiedler (1973) introduced the concept of algebraic connectivity to assess the robustness of a network [50]. Algebraic connectivity is defined as the second smallest eigenvalue of the network’s Laplacian matrix. A lower algebraic connectivity value suggests a higher likelihood of network fragmentation, indicating a greater susceptibility to disconnection:
:
Newman (2002) introduced the concept of degree assortativity to quantitatively analyze the tendency of nodes with similar degree to form connections [51]. This measure enables the evaluation of whether a network exhibits homophily (high assortativity, where nodes of similar degree tend to connect) or heterophily (low assortativity, where nodes of different degrees are more likely to be connected):
: Degree of node i
: 1 If nodes i and j are connected, 0 otherwise
: Number of overall edges
Newman (2003) proposed the concept of transitivity, which measures the proportion of triangular structures at the global network level [52]. While transitivity is conceptually similar to the clustering coefficient, it is computed for the entire network rather than individual nodes. A high transitivity value indicates a greater prevalence of triangular formations, suggesting a strong overall clustering tendency within the network:
Newman (2006) introduced modularity as a quantitative measure of community structure in networks [53]. Modularity evaluates the extent to which a network is partitioned into distinct communities, where high modularity values indicate well-defined groups of nodes. This metric captures the balance between intra-community links (connections within the same community) and inter-community links (connections between different communities), with higher values implying stronger community structures characterized by dense internal connectivity and sparse external connections:
: Adjacency matrix indicating whether nodes i and j are connected
: Degree of node i and j
: Number of overall edges
: 1 If nodes i and j belongs to the same community, 0 otherwise
3.3. Node Centrality and Vulnerability Assessment Methodology Based on Network Topology
Freeman, Linton C. (2002) defined centrality as a metric that quantifies the importance of specific nodes within a network based on graph theory [54]. Centrality indicates the position and role of a node within the network and serves as a fundamental concept in network structure analysis. In particular, degree centrality and betweenness centrality were proposed as key centrality measures. Degree centrality measures the number of direct connections a node has, with a higher degree centrality indicating that the node is highly connected and serves as a key hub within the network. It is defined as follows:
: Node i, k
: 1 if nodes i and k are connected, otherwise 0
Betweenness centrality measures how often a node appears on the shortest paths between other nodes. A node with high betweenness centrality plays a crucial role in information transmission and acts as a key controller within the network. It is defined as follows
: Number of shortest paths between node s and node t
: Number of shortest paths between node s and node t that pass through node v
Bozzo et al. (2015) proposed a vulnerability metric that quantifies the vulnerability of a node by assessing the number of neighboring nodes it is connected to. A node is considered vulnerable if it has relatively fewer connections to the rest of the network compared to its immediate neighborhood. A positive vulnerability value indicates that the selected node is relatively isolated from its neighboring nodes [55]. The vulnerability metric is defined as follows:
: Selected set of nodes
: Neighboring nodes of T
4. Results
4.1. Base Network
To analyze the transportation network, we employed the urban rail network for the Seoul Metropolitan area in 2022 which is sourced from the Korean Transport Database (KTDB). KTDB is a data package that officially provides transportation networks, ODs, etc. for transportation demand analysis by the Korean government. We constructed a rail transit network graph by mapping out nodes and links of urban rail systems, taking into account their distinct types.
The network graph, constructed using nodes and links categorized by type, encompasses 834 nodes and 1,018 links specifically for urban rail systems. In comparison, the rail network, which incorporates interregional railway lines and differs from Urban railway systems, spans a more extensive configuration with 1,924 nodes and 2,058 links. Figure 2 shows the urban railway network which is structured as a vast interconnected system.

Table 1.
Number of Nodes & Links in Network Data sourced from KTDB.
| Category | Node | Link |
|---|---|---|
| Road Network | 153120 | 196850 |
| Road and Railway Network | 156354 | 338289 |
| Railway Network | 1924 | 2058 |
| Urban railway Network | 834 | 1018 |
Table2 presents the results of the network topology analysis for the base network. The given indices represent the values of the initial strategy (0%), in which vertiports have not been introduced, serving as the baseline for scenario-based evaluations of vertiport implementation. The network in the Seoul metropolitan area is found to be fragmented, with low connectivity strength and a homogeneous structure, resembling a tree-like random network while exhibiting a distinct community structure.
The base network’s Global Efficiency, which ranges from 0 to 1, is found to be close to 0, indicating long paths or high fragmentation within the network. The Algebraic Connectivity value is also close to 0, suggesting weak connectivity and a high risk of disconnection if edges are removed. Degree Assortativity is significantly greater than 0, implying that the network exhibits homophilic characteristics. The Local Clustering Coefficient is close to 0, suggesting a tree-like structure and a tendency toward a random network. Additionally, the Transitivity index indicates that the overall network does not have a high level of clustering.
In contrast, the Modularity index is close to 0.9, indicating that the overall network has a well-defined community structure. Table 1. Urban railway Network Topology Analysis Result
4.2. Scenario Evaluation Outcomes
The Global Efficiency increased in all three strategies—Betweenness, Degree Centrality, and Vulnerability—compared to the baseline network. Specifically, under the Betweenness-based strategy (hereafter referred to as the Betweenness Scenario), Global Efficiency increased from approximately 0.087 to 0.200. Under the Degree Centrality-based strategy (hereafter referred to as the Degree Scenario), it increased from 0.089 to 0.217, while under the Vulnerability-based strategy (hereafter referred to as the Vulnerability Scenario), it increased from 0.096 to 0.238 (Table 3).
The placement of vertiports based on the Vulnerability Scenario reduces path lengths and mitigates network fragmentation more effectively than the Betweenness and Degree scenarios, leading to a maximum 19% higher Global Efficiency. When vertiports are installed at 20% of urban railway stations, Global Efficiency improves by 292% compared to the baseline network, resulting in a fundamentally different network in terms of efficiency.
Thus, the network under the Vulnerability Scenario exhibits relatively higher efficiency than those under the Betweenness and the Degree Scenario. This suggests that prioritizing vertiport allocation at vulnerable nodes can shorten travel distances and address network fragmentation. In contrast, the Betweenness Scenario results in a network structure where central nodes are well-connected but with relatively lower efficiency. The Degree Scenario positions Global Efficiency between the other two strategies.
An analysis of the average shortest path length without assigning weights such as link distance revealed that, in the scenario where vertiports are installed at 5% of urban railway stations, the average shortest path length was 17.3005 for the Betweenness Scenario, 16.0882 for the Degree Scenario, and 15.8778 for the Vulnerability Scenario (Table 4). This ranking remained unchanged even with an increase in vertiport placement up to 20%.
Additionally, even with vertiports installed at just 5% of urban railway stations, the average shortest path length decreased by 28.5%. As vertiport placement increased, the shortest path length continued to decrease, aligning with intuitive expectations. Similar to the minimum Global Efficiency index, the Vulnerability Scenario proved to be the most advantageous strategy from the perspective of average shortest path length.
In the scenario where 5% of all stations are equipped with vertiports, the Algebraic Connectivity index is higher than that of the baseline network, with values of 0.00293 for the Betweenness Scenario, 0.00356 for the Degree Scenario, and 0.00326 for the Vulnerability Scenario (Table 5). Connectivity continues to increase as vertiport placement reach 20%, and the relative ranking among the scenarios remains unchanged.
The Degree Scenario exhibits a relatively higher Algebraic Connectivity among the three strategies. The Vulnerability Scenario falls between the Betweenness and the Degree Scenario in terms of connectivity. The fact that the Vulnerability Scenario ranks between the Degree and the Betweenness Scenario in terms of connectivity suggests that prioritizing vertiport placement based on vulnerability may lead to higher network connectivity than scenarios that allocate vertiports based solely on centrality measures.
The baseline network has a low Local Clustering Coefficient, making it closer to a tree-structured random network. When vertiports are installed, the Clustering Coefficient increases across all scenarios compared to the baseline network, indicating a significant impact of intentional vertiport placement.
Among the scenarios, the Betweenness Scenario exhibits the highest Clustering Coefficient, though the difference compared to the other scenarios is not substantial. Table 6 illustrates these changes in the Clustering Coefficient.
Table 7 presents the Transitivity index, which reflects the overall clustering of the network, in contrast to the Clustering Coefficient. In the scenario where 5% of all stations are equipped with vertiports, the Betweenness Scenario records the highest Transitivity value at 0.91335, followed by the Degree Scenario (0.89679) and the Vulnerability Scenario (0.87188).
Notably, these values represent a 380% increase from the baseline network’s Transitivity index of 0.18, indicating that vertiport installation enhances clustering across the entire network. This suggests that the network structure may transition into a small-world network, which aligns with the expectation that vertiport implementation leads to shorter average path lengths.
In the 20% vertiport installation scenario, Transitivity approaches 1, further reinforcing the small-world network characteristics, suggesting a stronger clustering effect as vertiport density increases.
The Modularity index, which evaluates the community structure of the network, is 0.879 in the baseline network. When vertiports are installed at 5% of all stations, the Modularity decreases to a range of 0.657–0.688, and as the installation rate increases to 20%, it further declines to 0.609–0.771 (Table 8). This indicates a sharp decrease in modularity as vertiport placement increases.
This trend suggests that while urban rail networks traditionally maintain strong community structures along individual lines, the installation of vertiports accelerates inter-community connections, diminishing the network’s tendency to form small, isolated groups. The rate of this change varies among the Betweenness, the Degree, and the Vulnerability scenario, highlighting differences in how each strategy impacts the network’s community structure.
Table 9 presents the results of the Degree Assortativity analysis. The findings indicate that even with only 5% of stations equipped with vertiports, homophilic connectivity (the tendency for nodes with similar degrees to connect) significantly increases compared to the baseline network. However, as vertiport placement continue to rise, Degree Assortativity gradually decreases.
Among the scenarios, the Betweenness Scenario exhibits a slower decline in Degree Assortativity compared to the other scenarios, whereas the Vulnerability Scenario shows a faster decrease in homophilic connectivity.
4.3. Comprehensive Analysis Findings
Figure 3 visually illustrates the changes in the network structure for each scenario as the proportion of vertiport placement increases. All scenarios exhibit distinct vertiport placement patterns.
In the Degree Scenario, the network is formed over the widest range, indicating a more evenly distributed connectivity pattern. The Vulnerability Scenario falls in an intermediate range among the three but displays more distinct connection lines compared to the other scenarios. The Betweenness Scenario shows the narrowest connectivity range, with broader inter-vertiport connections forming within this confined area.
These findings highlight that vertiport allocation strategies can significantly influence future network characteristics, demonstrating the importance of strategic planning in determining the overall network structure.
Figure 4 shows a comparative analysis of efficiency, connectivity, and average shortest path length. The results indicate that as the proportion of vertiport placement increases, all metrics show improvement: efficiency and connectivity indices increase, while the average shortest path length decreases.
From the perspective of efficiency and average shortest path length, the Vulnerability Scenario proves to be the most advantageous. In terms of connectivity, the Degree Scenario performs the best. Additionally, the Vulnerability Scenario demonstrates higher connectivity than the Betweenness Scenario.
These findings suggest that vulnerability should be a key consideration in developing vertiport allocation strategies, as it plays a crucial role in enhancing both efficiency and network integration.
The network structural metrics presented in Table 6, Table 7, Table 8 and Table 9 indicate that vertiport placement are expected to significantly reshape the existing network structure. Even when disregarding the unique characteristics of Urban Air Mobility (UAM)—which differ from conventional transportation modes—substantial changes are anticipated.
Therefore, we recognize that traditional methodologies for location allocation, such as objective function-based approaches, expert judgment, and multi-criteria evaluation techniques, have limitations at this stage due to the high uncertainty of UAM characteristics. This underscores the necessity of incorporating network structural changes into vertiport allocation strategies to ensure an effective and adaptive planning approach.
5. Discussion and Conclusions
We have determined that a network-oriented approach must be prioritized for vertiport location-allocation. The placement of vertiports, considering centrality and vulnerability, significantly influences both the clustering and scalability of the network. As the proportion of vertiports in the network increases, the small-world property of the network strengthens rapidly, confirming that the introduction of a vertiport network can fundamentally alter the structure of Seoul Metropolitan railway transportation system. Additionally, we estimate that the network undergoes significant structural transformations as vertiport placement increase. Furthermore, arbitrary allocation of vertiports introduces substantial uncertainty in the changes to clustering and scalability, reaffirming the necessity of a network-aware vertiport siting strategy. At this stage, before the construction of the first commercial vertiports, strategic decision-making regarding future network transformations is of paramount importance.
We argue that both centrality and vulnerability must be considered in vertiport allocation. Using the transportation network of the Seoul Metropolitan Area, we assessed strategies prioritizing either centrality or vulnerability by evaluating network efficiency, connectivity, and average shortest path length. The strategy of selecting nodes with high degree centrality outperformed the vulnerability-based approach in terms of network connectivity. However, from the perspective of network efficiency and average shortest path length, prioritizing nodes with high vulnerability indicators was found to be more advantageous. Since network efficiency is a crucial metric for identifying robust alternatives under future uncertainties, we verified that considering vulnerability is essential in vertiport location-allocation strategies to minimize potential losses and balance trade-offs among alternatives. Within the scope of our review, we found that previous studies have primarily focused on connectivity in vertiport site selection. Therefore, we anticipate that this study provides an academic contribution by revealing that neglecting vulnerability leads to suboptimal solutions in terms of network efficiency.
As the commercialization of UAM becomes more tangible, vertiport placement is expected to become a critical factor in urban mobility planning. In this context, we expect that this study will serve as a foundation for integrating UAM into multi-modal urban transportation systems, contributing to its successful establishment as a viable urban mobility solution.
Author Contributions
Conceptualization, K.H.S.; methodology, K.H.S. and H.L.; software, K.H.S. and H.L.; investigation, H.L.; resources, H.L.; formal analysis, K.H.S. and H.L.; data curation, H.L.; writing—original draft preparation, H.L. and K.H.S.; writing—review and editing, K.H.S. and H.L.; supervision, K.H.S.; project administration K.H.S. All authors have read and agreed to the published version of the manuscript.
Funding
This research was funded by Seoul National University of Science and Technology
Conflicts of Interest
The authors declare no conflict of interest
References
- Chen, S.; Zhuang, D. Evolution and evaluation of the Guangzhou Urban railway network topology based on an integration of complex network analysis and GIS. Sustainability 2020, 12, 538. [CrossRef]
- Liao, Y.; Bao, F. Research on airport site selection based on triangular fuzzy number. Applied Mechanics and Materials 2014, 505, 507-511. [CrossRef]
- Park, C.; Sohn, S.Y. An optimization approach for the placement of bicycle-sharing stations to reduce short car trips: An application to the city of Seoul. Transportation Research Part A: Policy and Practice 2017, 105, 154-166. [CrossRef]
- Zhao, S.; Sun, P. Scheme Comparison of New Airport Site Selection Based on Lattice Order Decision Making Method in the Integrated Transportation System. International Journal of online Engineering 2013, 9. [CrossRef]
- Mohring, H. Optimization and scale economies in urban bus transportation. The American Economic Review 1972, 62, 591-604.
- Mandl, C.E. Evaluation and optimization of urban public transportation networks. European Journal of Operational Research 1980, 5, 396-404. [CrossRef]
- Archetti, C.; Peirano, L.; Speranza, M.G. Optimization in multimodal freight transportation problems: A Survey. European Journal of Operational Research 2022, 299, 1-20. [CrossRef]
- Ríos-Mercado, R.Z.; Borraz-Sánchez, C. Optimization problems in natural gas transportation systems: A state-of-the-art review. Applied Energy 2015, 147, 536-555. [CrossRef]
- Zitrický, V.; Gašparík, J.; Pečený, L. The methodology of rating quality standards in the regional passenger transport. Transport problems 2015, 10. [CrossRef]
- Abramović, B.; Zitricky, V.; Biškup, V. Organisation of railway freight transport: case study CIM/SMGS between Slovakia and Ukraine. European transport research review 2016, 8, 1-13. [CrossRef]
- Bukvić, L.; Pašagić Škrinjar, J.; Abramović, B.; Zitrický, V. Route selection decision-making in an intermodal transport network using game theory. Sustainability 2021, 13, 4443. [CrossRef]
- Stopka, O.; Zitricky, V.; Abramović, B.; Marinov, M.V.; Ricci, S. Innovative technologies for sustainable passenger transport. Journal of advanced transportation 2019, 2019. [CrossRef]
- Alves, C.J.P.; da Silva, E.J.; Müller, C.; Borille, G.M.R.; Guterres, M.X.; Arraut, E.M.; Peres, M.S.; dos Santos, R.J. Towards an objective decision-making framework for regional airport site selection. Journal of Air Transport Management 2020, 89, 101888. [CrossRef]
- Chen, M.; Lu, H. Analysis of transportation network vulnerability and resilience within an urban agglomeration: Case study of the greater Bay Area, China. Sustainability 2020, 12, 7410. [CrossRef]
- Jiang, X.; Cao, S.; Mo, B.; Cao, J.; Yang, H.; Tang, Y.; Hansen, M.; Zhao, J.; Sengupta, R. Simulation-Based Optimization for Vertiport Location Selection: A Surrogate Model With Machine Learning Method. Transportation Research Record 2024, 03611981241277755. [CrossRef]
- Kotwicz Herniczek, M.T.; German, B.J. Scalable Combinatorial Vertiport Placement Method for an Urban Air Mobility Commuting Service. Transportation Research Record 2024, 2678, 1624-1641. [CrossRef]
- Liu, Y.; Wang, M.; Wang, Y. Location decision of emergency medical supply distribution centers under uncertain environment. International Journal of Fuzzy Systems 2024, 26, 1567-1603. [CrossRef]
- Bulková, Z.; Čamaj, J.; Šperka, A.; Jursová, S. Simulation of travel document purchase measures aimed at preventing the spread of COVID-19–Case study from Slovakia. Transportation Research Interdisciplinary Perspectives 2023, 20, 100853. [CrossRef]
- Čamaj, J.; Nedeliaková, E.; Šperka, A.; Ližbetinová, L. The planning of investment activities in field of railway transport with support of simulation tools. Transportation research procedia 2021, 53, 39-49. [CrossRef]
- Mašek, J.; Kolarovszki, P.; Čamaj, J. Application of RFID technology in railway transport services and logistics chains. Procedia Engineering 2016, 134, 231-236. [CrossRef]
- Gerhátová, Z.; Zitrický, V.; Klapita, V. Industry 4.0 implementation options in railway transport. Transportation Research Procedia 2021, 53, 23-30. [CrossRef]
- Wu, Q.; Li, Y.; Dan, P. Optimization of urban rail transit station spacing for minimizing passenger travel time. Journal of Rail Transport Planning & Management 2022, 22, 100317. [CrossRef]
- Yoon, D.; Jeong, M.; Lee, J.; Kim, S.; Yoon, Y. Integrating Urban Air Mobility with Highway Infrastructure: A Strategic Approach for Vertiport Location Selection in the Seoul Urban railwaypolitan Area. arXiv preprint arXiv:2502.00399 2025.
- Brunelli, M.; Ditta, C.C.; Postorino, M.N. New infrastructures for Urban Air Mobility systems: A systematic review on vertiport location and capacity. Journal of Air Transport Management 2023, 112, 102460. [CrossRef]
- Macias, J.E.; Khalife, C.; Slim, J.; Angeloudis, P. An integrated vertiport placement model considering vehicle sizing and queuing: A case study in London. Journal of Air Transport Management 2023, 113, 102486. [CrossRef]
- Tuncal, A. Operational Challenges and Prioritization of Potential Solutions for Integrating Vertiports into Airports. Türkiye İnsansız Hava Araçları Dergisi 2024, 6, 42-55. [CrossRef]
- Liu, J.; Lu, H.; Chen, M.; Wang, J.; Zhang, Y. Macro perspective research on transportation safety: An empirical analysis of network characteristics and vulnerability. Sustainability 2020, 12, 6267. [CrossRef]
- Rahman, B.; Bridgelall, R.; Habib, M.F.; Motuba, D. Integrating urban air mobility into a public transit system: a GIS-based approach to identify candidate locations for vertiports. Vehicles 2023, 5, 1803-1817. [CrossRef]
- Chae, M.; Kim, S.H.; Kim, S.H.; Kim, M.; Park, H.-T. Vertiport Locations Optimization in Discrete Search Space. In Proceedings of the 2023 IEEE/AIAA 42nd Digital Avionics Systems Conference (DASC), 2023; pp. 1-6.
- Koumoutsidi, A.; Pagoni, I.; Polydoropoulou, A. A new mobility era: Stakeholders’ insights regarding urban air mobility. Sustainability 2022, 14, 3128. [CrossRef]
- Kim, W.-J.; Park, J.-H. A study on the factors affecting UAM vertiport location selection. Journal of Urban Studies and Real Estate 2022, 13, 119-137. [CrossRef]
- Aydin, N.; Seker, S.; Özkan, B. Planning location of mobility hub for sustainable urban mobility. Sustainable Cities and Society 2022, 81, 103843. [CrossRef]
- Lazari, V.; Chassiakos, A. Multi-objective optimization of electric vehicle charging station deployment using genetic algorithms. Applied Sciences 2023, 13, 4867. [CrossRef]
- Rouhana, F.; Jawad, D. Transportation network resilience against failures: GIS-based assessment of network topology role. International journal of disaster resilience in the built environment 2021, 12, 357-370. [CrossRef]
- Hammad, M.A.; Elgazzar, S.; Sternad, M. A Conceptual Framework to Establish and Operate a Global Logistics Energy Hub. Sustainability 2021, 13, 10976. [CrossRef]
- Perera, P.; Hewage, K.; Sadiq, R. Electric vehicle recharging infrastructure planning and management in urban communities. Journal of Cleaner Production 2020, 250, 119559. [CrossRef]
- Jia, G.-L.; Ma, R.-G.; Hu, Z.-H. Urban transit network properties evaluation and optimization based on complex network theory. Sustainability 2019, 11, 2007. [CrossRef]
- Hong, J.; Tamakloe, R.; Lee, S.; Park, D. Exploring the topological characteristics of complex public transportation networks: Focus on variations in both single and integrated systems in the Seoul Urban railwaypolitan Area. Sustainability 2019, 11, 5404. [CrossRef]
- Zhang, H.; Sun, F.; Qian, J. An optimization based on general airport of complex condition. In Proceedings of the 2019 International Conference on Computer, Information and Telecommunication Systems (CITS), 2019; pp. 1-5.
- Lim, E.; Hwang, H. The selection of vertiport location for on-demand mobility and its application to Seoul Urban railway area. International Journal of Aeronautical and Space Sciences 2019, 20, 260-272.
- Akbarzadeh, M.; Memarmontazerin, S.; Derrible, S.; Salehi Reihani, S.F. The role of travel demand and network centrality on the connectivity and resilience of an urban street system. Transportation 2019, 46, 1127-1141. [CrossRef]
- Sennaroglu, B.; Celebi, G.V. A military airport location selection by AHP integrated PROMETHEE and VIKOR methods. Transportation Research Part D: Transport and Environment 2018, 59, 160-173. [CrossRef]
- Wang, M.; Li, H.; Cui, J.; Deng, K.; Bhowmick, S.S.; Dong, Z. Pinocchio: Probabilistic influence-based location selection over moving objects. IEEE Transactions on Knowledge and Data Engineering 2016, 28, 3068-3082. [CrossRef]
- Gao, Y.; Zheng, B.; Chen, G.; Li, Q. Optimal-location-selection query processing in spatial databases. IEEE transactions on knowledge and data engineering 2009, 21, 1162-1177. [CrossRef]
- Cohen, M.M. The vertiport as an urban design problem; 0148-7191; SAE Technical Paper: 1996.
- Latora, V.; Marchiori, M. Efficient behavior of small-world networks. Physical review letters 2001, 87, 198701. [CrossRef]
- Van Steen, M. Graph theory and complex networks. An introduction 2010, 144.
- Menger, K. Zur allgemeinen kurventheorie. Fundamenta Mathematicae 1927, 10, 96-115. [CrossRef]
- Watts, D.J.; Strogatz, S.H. Collective dynamics of ‘small-world’networks. nature 1998, 393, 440-442. [CrossRef]
- Fiedler, M. Algebraic connectivity of graphs. Czechoslovak mathematical journal 1973, 23, 298-305.
- Newman, M.E. Assortative mixing in networks. Physical review letters 2002, 89, 208701. [CrossRef]
- Newman, M.E. The structure and function of complex networks. SIAM review 2003, 45, 167-256.
- Newman, M.E. Modularity and community structure in networks. Proceedings of the national academy of sciences 2006, 103, 8577-8582.
- Freeman, L.C. Centrality in social networks: Conceptual clarification. Social network: critical concepts in sociology. Londres: Routledge 2002, 1, 238-263.
- Bozzo, E.; Franceschet, M.; Rinaldi, F. Vulnerability and power on networks. Network Science 2015, 3, 196-226.
Figure 2.
The urban railway network for Seoul Metropolitan area.
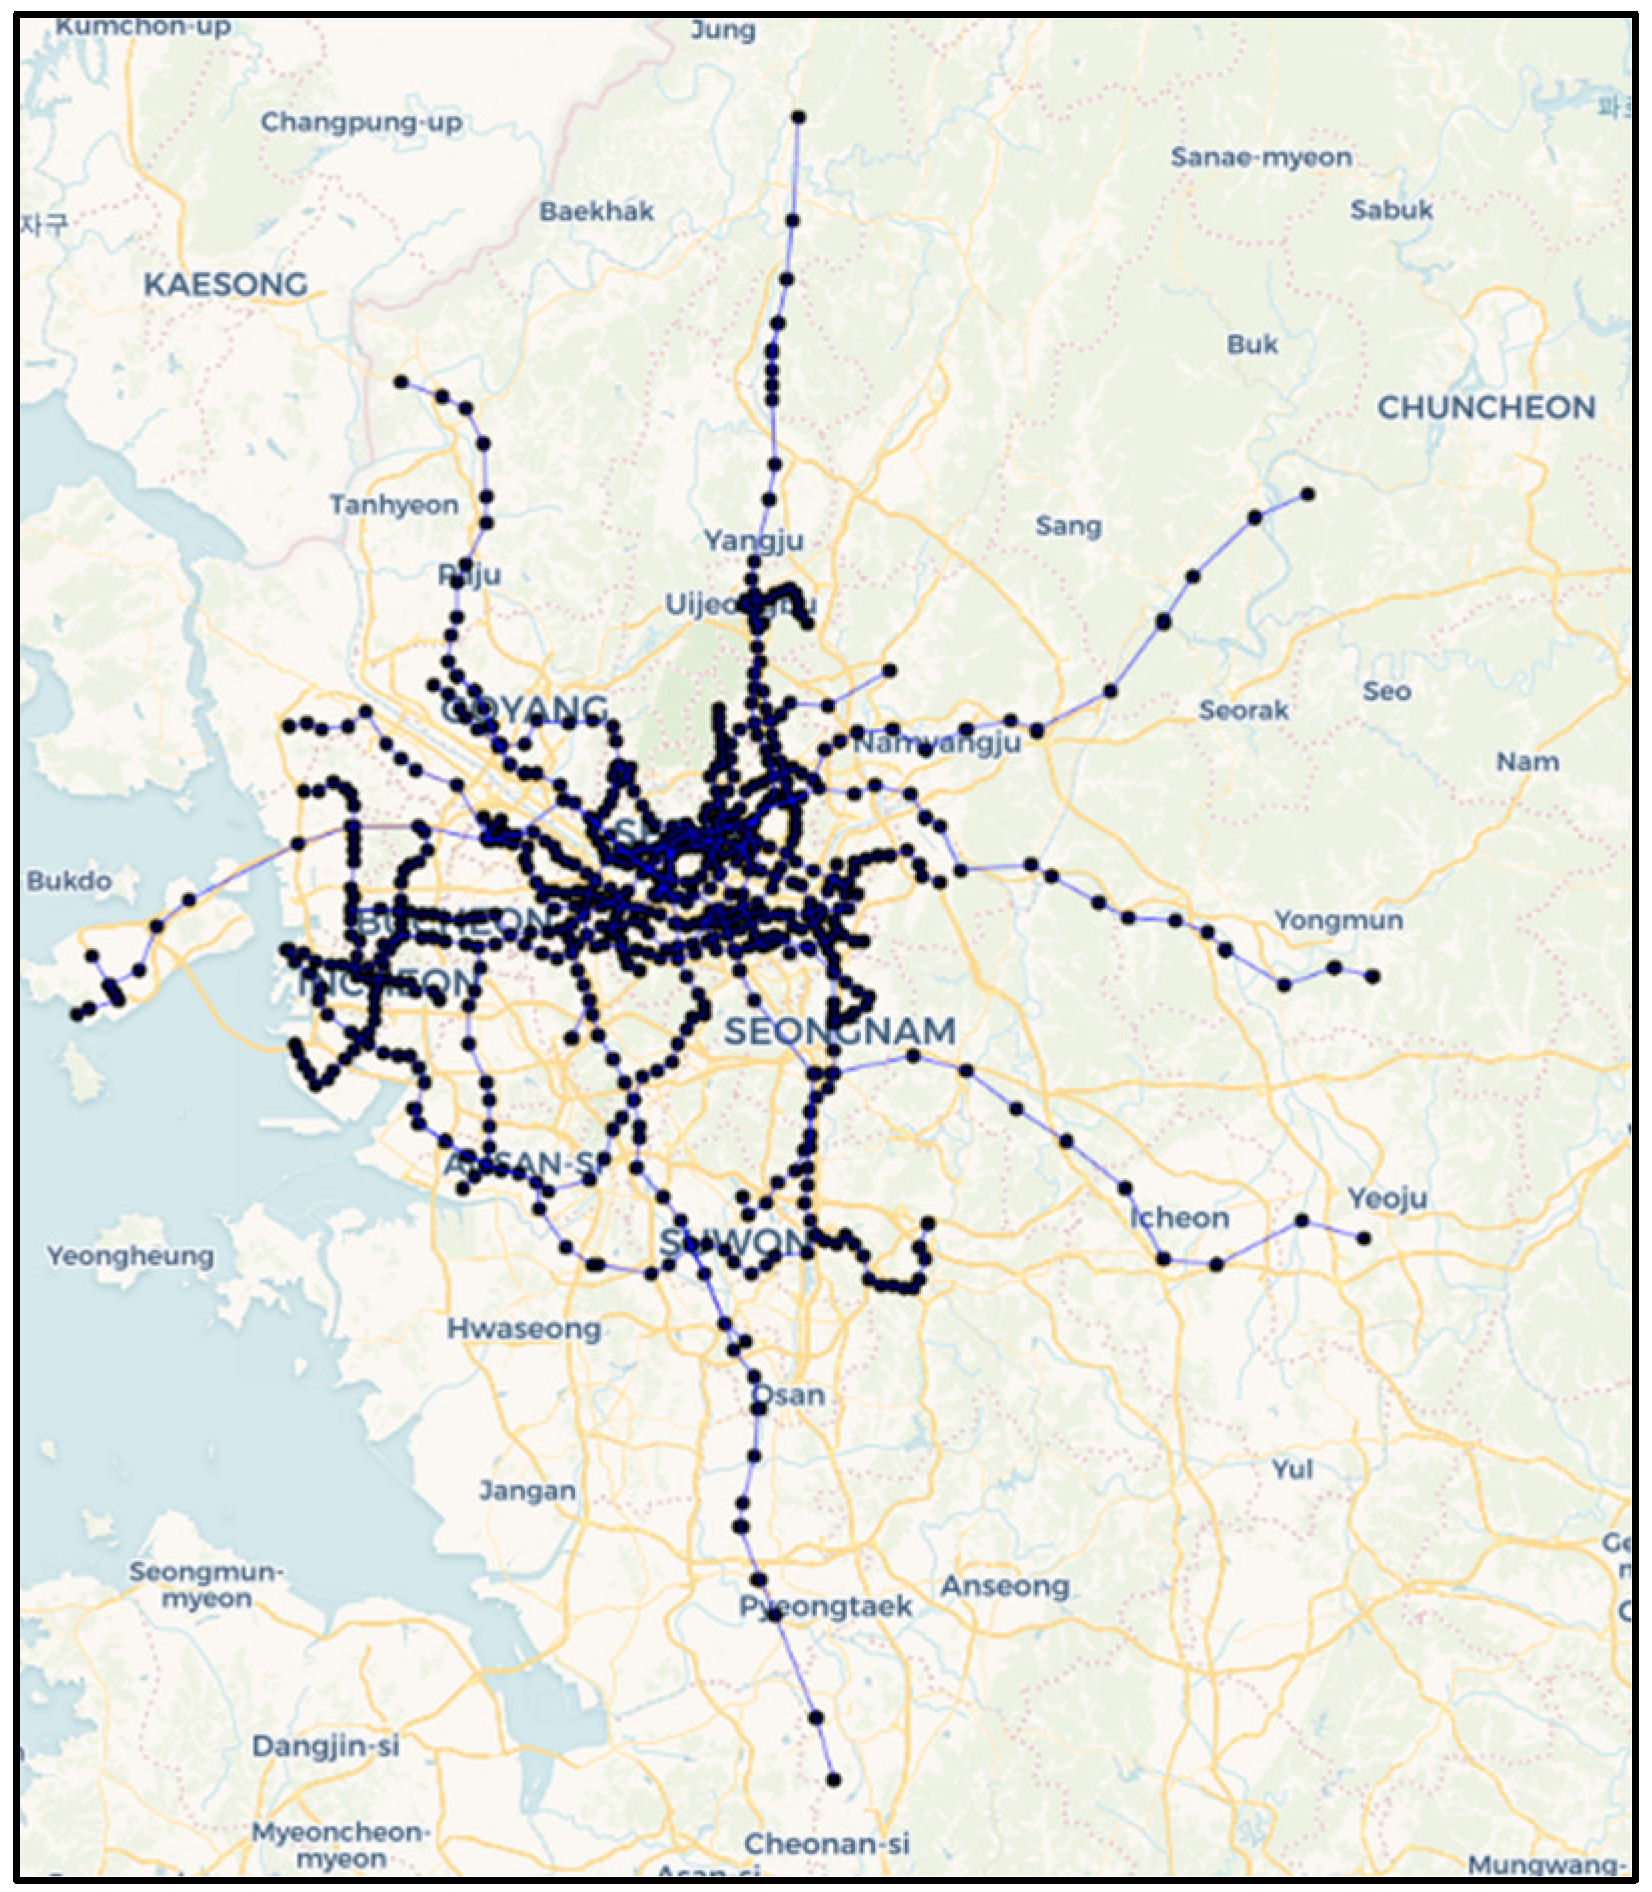
Figure 3.
Simulation(5%~20%) Networks by Each Scenario.
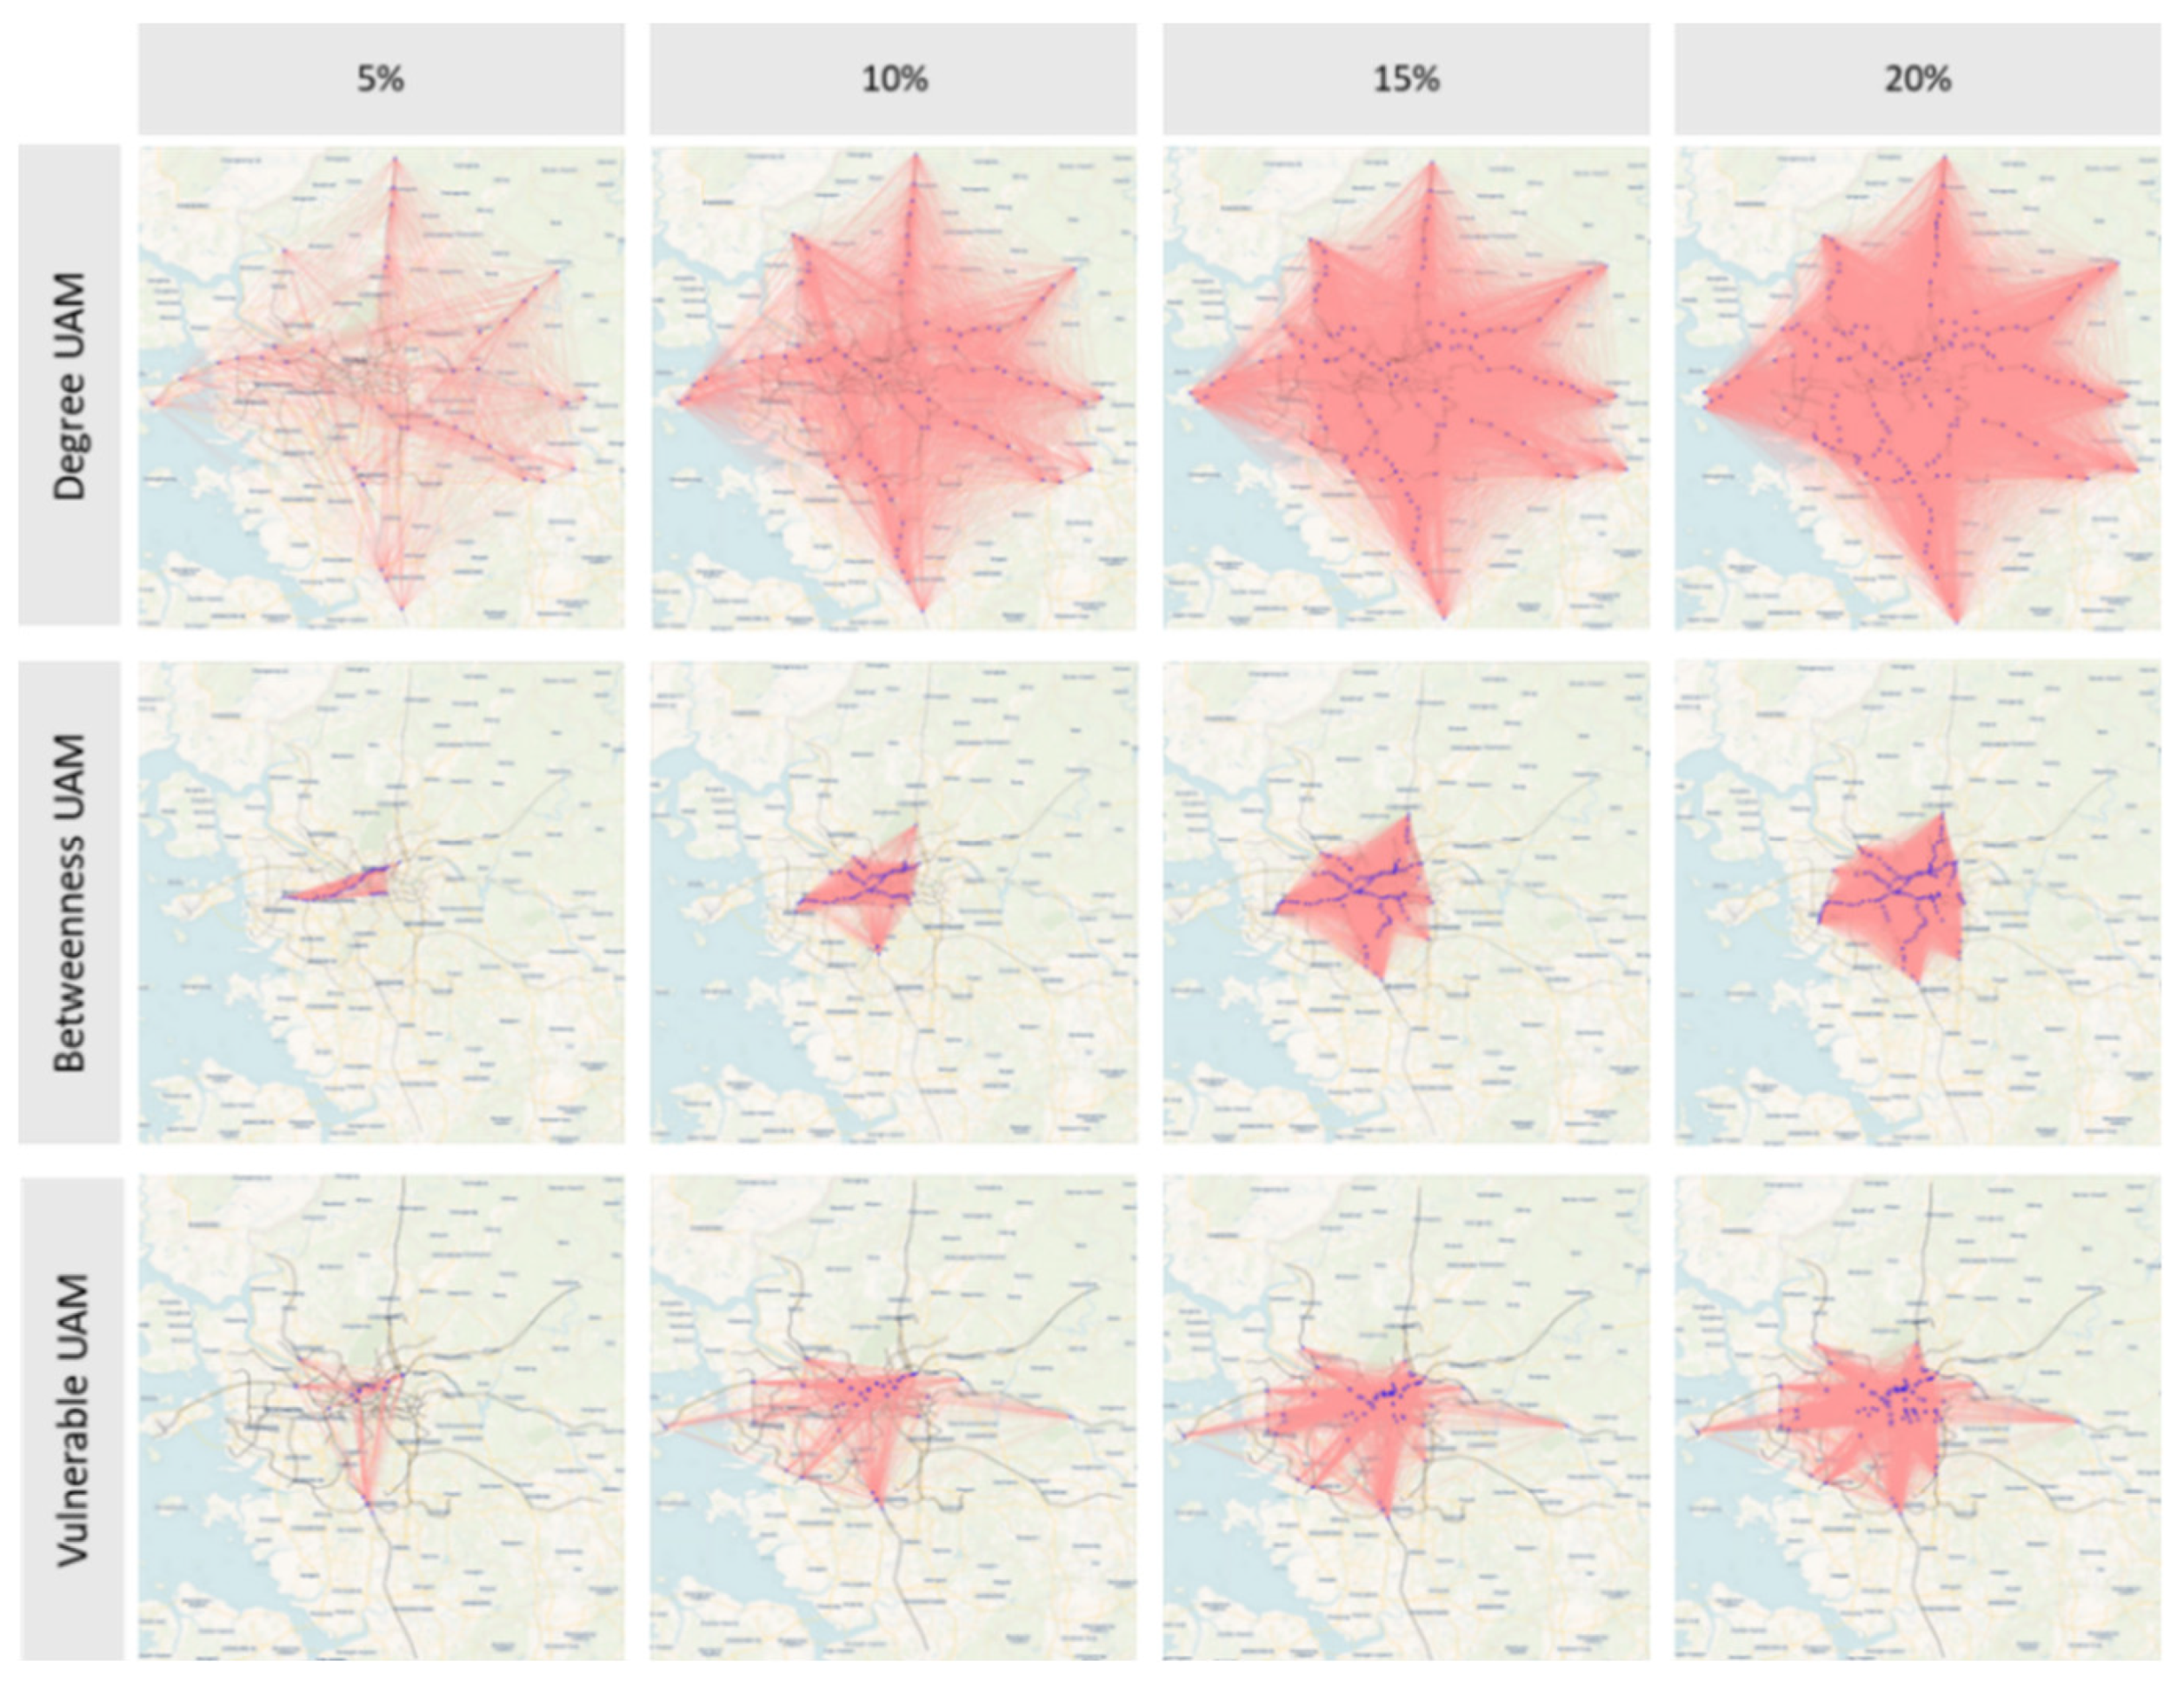
Figure 4.
Comparison of Key Network Performance Indicators.
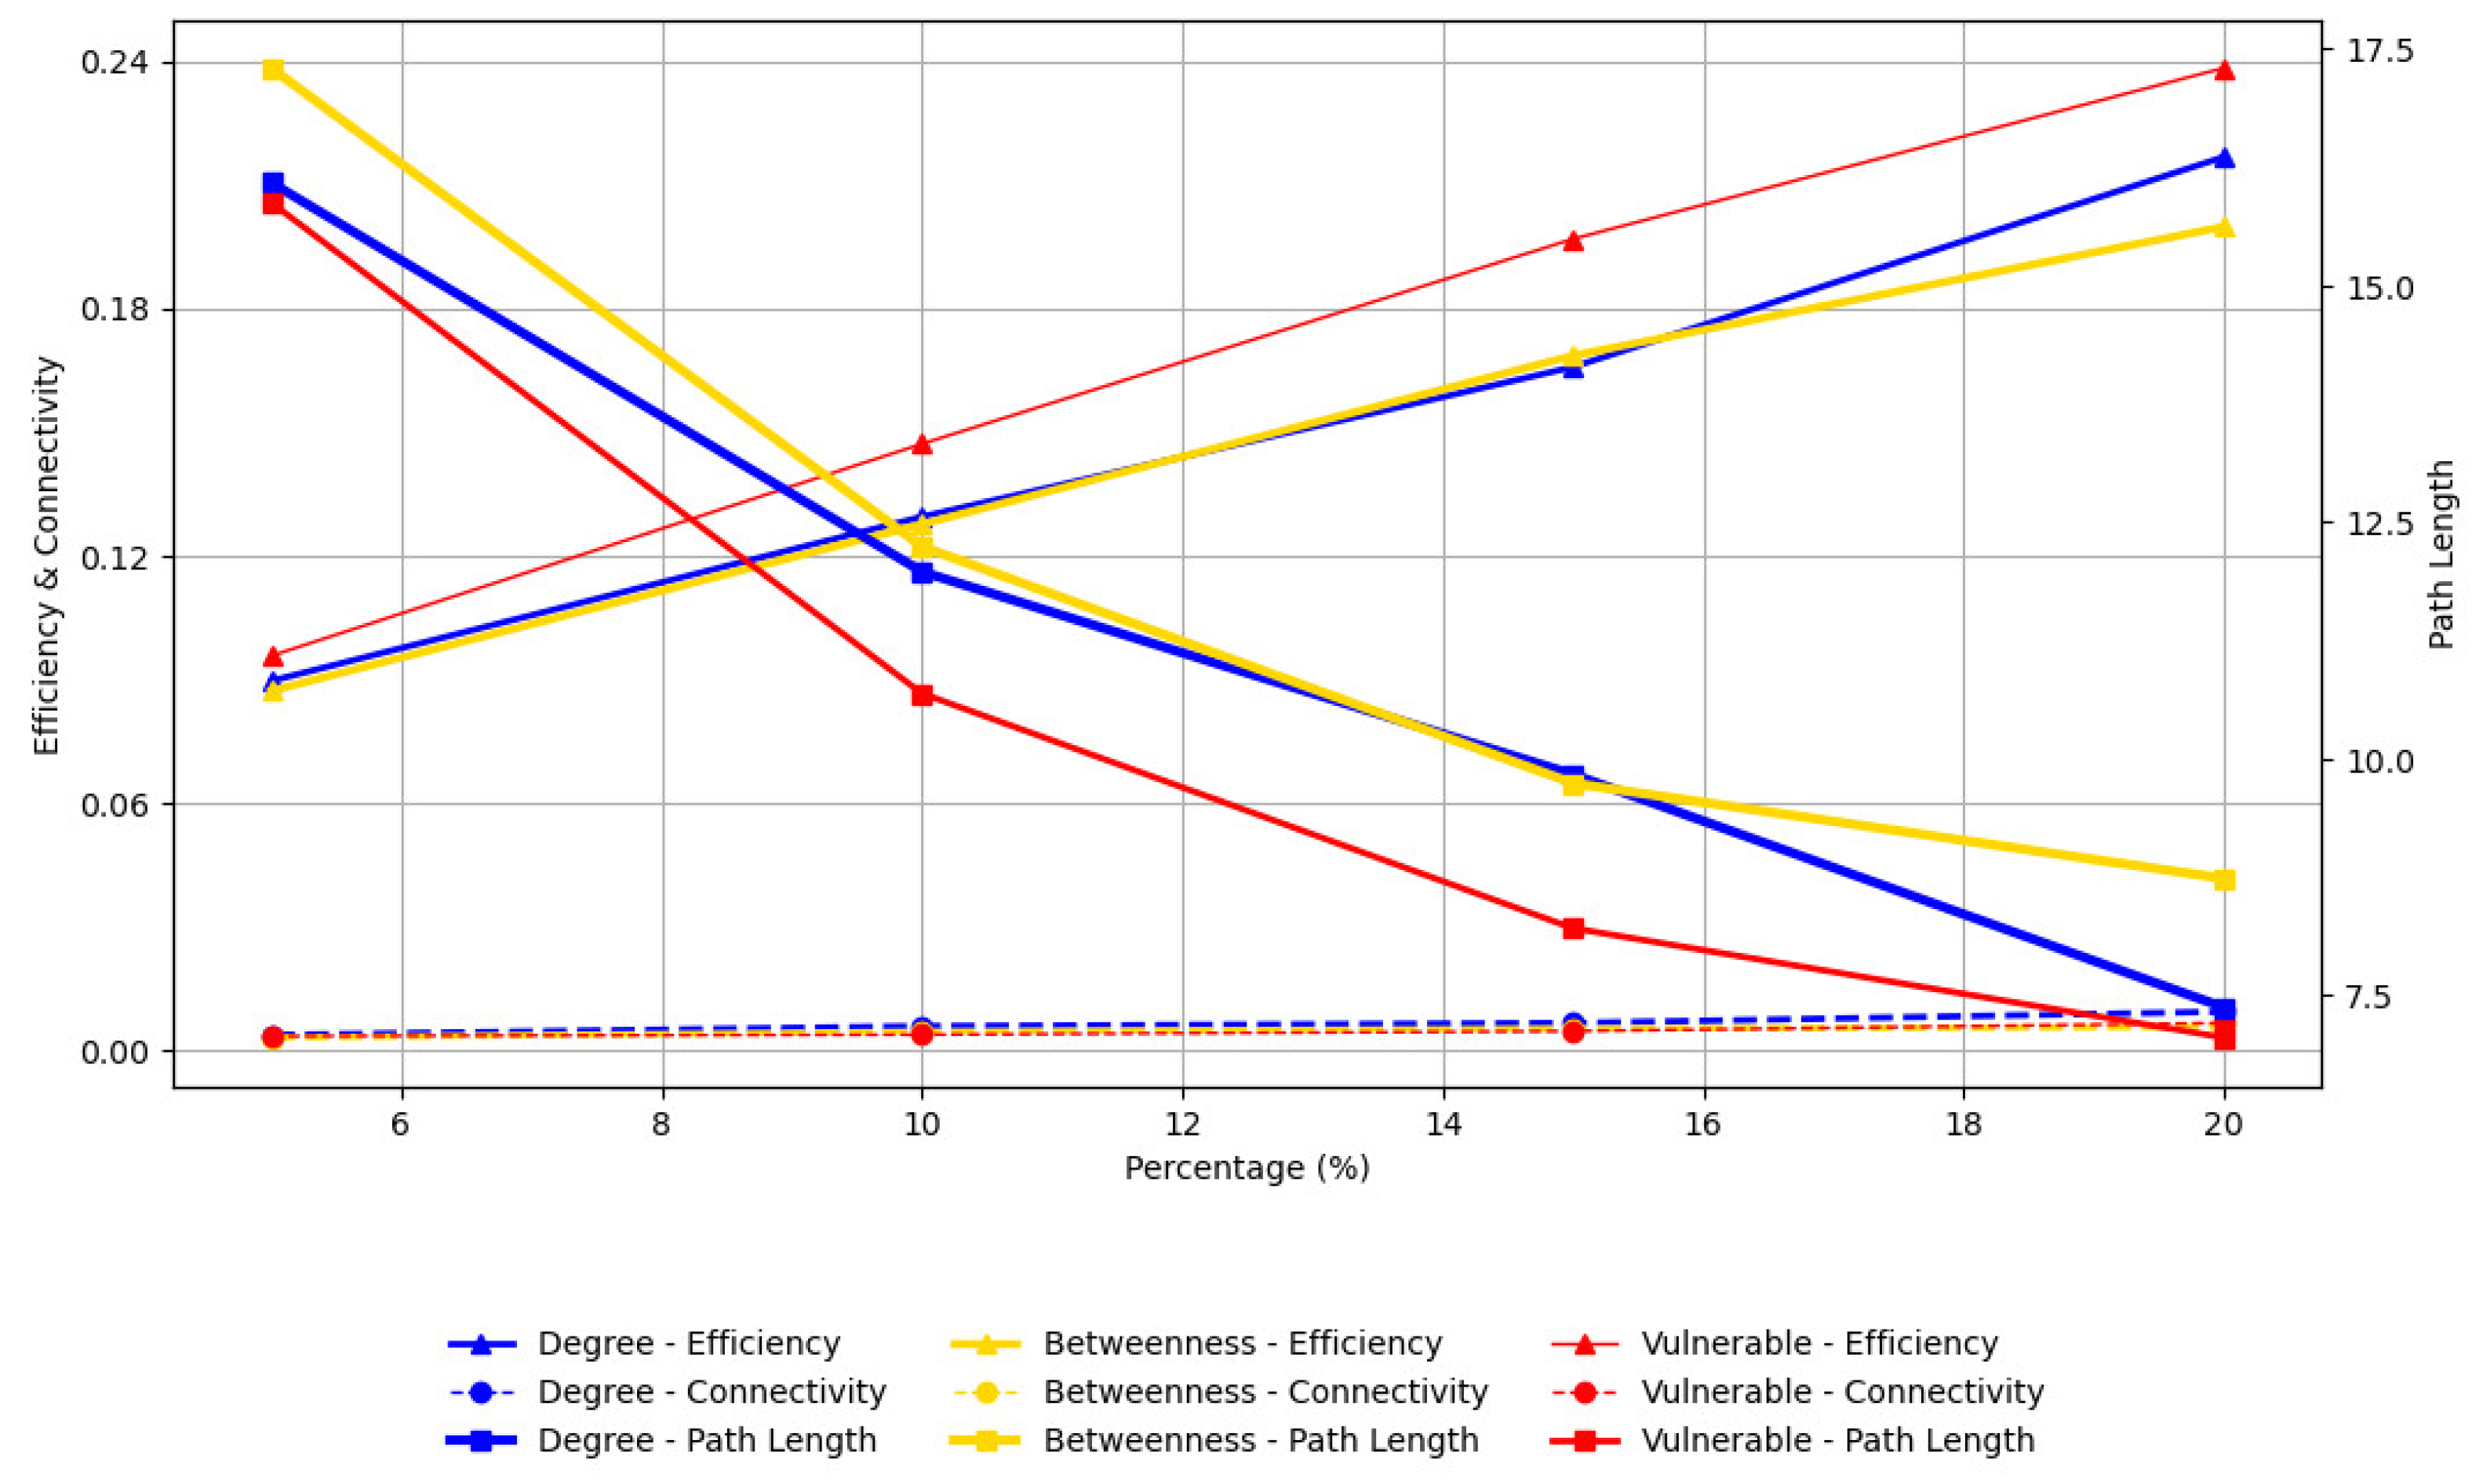
Table 2.
Network Topology Analysis Result for Seoul Metropolitan Railway Network.
| Group | Global Efficiency |
Average Shortest Path Length | Algebric Connectivity | Clustering Coefficient |
Degree Assortativity |
Transitivity | Modularity |
|---|---|---|---|---|---|---|---|
| Urban railway Network |
0.06080 | 24.20161 | 0.00212 | 0.05422 | 0.52806 | 0.18000 | 0.87862 |
Table 3.
Network Global Efficiency Results.
| Ratio | Betweenness UAM Network |
Degree UAM Network |
Vulnerable UAM Network |
|---|---|---|---|
| 5% | 0.08706 | 0.08948 | 0.09556 |
| 10% | 0.12753 | 0.12932 | 0.14703 |
| 15% | 0.16842 | 0.16566 | 0.19674 |
| 20% | 0.19971 | 0.21665 | 0.23825 |
Table 4.
Average Shortest Path Length Results.
| Ratio | Betweenness UAM Network |
Degree UAM Network |
Vulnerable UAM Network |
|---|---|---|---|
| 5% | 17.3005 | 16.0882 | 15.8778 |
| 10% | 12.2384 | 11.9723 | 10.6847 |
| 15% | 9.7350 | 9.8296 | 8.2023 |
| 20% | 8.7287 | 7.3651 | 7.0458 |
Table 5.
Network Algebraic Connectivity Results.
| Ratio | Betweenness UAM Network |
Degree UAM Network |
Vulnerable UAM Network |
|---|---|---|---|
| 5% | 0.00293 | 0.00356 | 0.00326 |
| 10% | 0.00440 | 0.00568 | 0.00362 |
| 15% | 0.00510 | 0.00645 | 0.00449 |
| 20% | 0.00550 | 0.00920 | 0.00646 |
Table 6.
Network Local Clustering Coefficient Results.
| Ratio | Betweenness UAM Network |
Degree UAM Network |
Vulnerable UAM Network |
|---|---|---|---|
| 5% | 0.05072 | 0.05081 | 0.04053 |
| 10% | 0.07646 | 0.07530 | 0.06419 |
| 15% | 0.10154 | 0.09937 | 0.09321 |
| 20% | 0.12815 | 0.12606 | 0.12512 |
Table 7.
Network Transitivity Results.
| Ratio | Betweenness UAM Network |
Degree UAM Network |
Vulnerable UAM Network |
|---|---|---|---|
| 5% | 0.91335 | 0.89679 | 0.87188 |
| 10% | 0.97169 | 0.96848 | 0.95549 |
| 15% | 0.98427 | 0.98409 | 0.97476 |
| 20% | 0.98920 | 0.98782 | 0.98188 |
Table 8.
Network Modularity Results.
| Ratio | Betweenness UAM Network |
Degree UAM Network |
Vulnerable UAM Network |
|---|---|---|---|
| 5% | 0.65703 | 0.68810 | 0.66245 |
| 10% | 0.31077 | 0.30245 | 0.28555 |
| 15% | 0.12937 | 0.14362 | 0.12440 |
| 20% | 0.07310 | 0.07711 | 0.06092 |
Table 9.
Network Degree Assortativity Results.
| Ratio | Betweenness UAM Network |
Degree UAM Network |
Vulnerable UAM Network |
|---|---|---|---|
| 5% | 0.94994 | 0.92884 | 0.89724 |
| 10% | 0.94004 | 0.93193 | 0.88948 |
| 15% | 0.92365 | 0.92317 | 0.85936 |
| 20% | 0.90299 | 0.89032 | 0.81274 |
Disclaimer/Publisher’s Note: The statements, opinions and data contained in all publications are solely those of the individual author(s) and contributor(s) and not of MDPI and/or the editor(s). MDPI and/or the editor(s) disclaim responsibility for any injury to people or property resulting from any ideas, methods, instructions or products referred to in the content. |
© 2025 by the authors. Licensee MDPI, Basel, Switzerland. This article is an open access article distributed under the terms and conditions of the Creative Commons Attribution (CC BY) license (http://creativecommons.org/licenses/by/4.0/).
Copyright: This open access article is published under a Creative Commons CC BY 4.0 license, which permit the free download, distribution, and reuse, provided that the author and preprint are cited in any reuse.


