Submitted:
06 June 2025
Posted:
09 June 2025
You are already at the latest version
Abstract
Purple corn (Zea mays L.), a traditional Andean crop valued for its high anthocyanin content and increasing relevance in the nutraceutical industry. However, its production is challenged by envirmental stress and the overuse of chemical fertilizers in Andean ecosystems. This study evaluated the effects of co-inoculation with Azospirillum brasilense (a plant growth-promoting rhizobacterium, PGPR) and Glomus iranicum var. tenuihypharum (an arbuscular mycorrhizal fungus, AMF) on growth and yield performance in five purple corn genotypes under highland field conditions in Ayacucho,Peru. A randomized complete block design with three replications was implemented across two locations to compare a control (no inoculation) with individual and combined microbial treatments. Results showed that combined inoculation significantly improved vegetive parameters, ear and yield-related traits in both locations, with increases of up to 60.8% in grain yield compared to the control. Statistically significant differences were observed among treatments and genotypes (Tukey, p < 0.05), with the Canaán location showing the highest overall performance between control and combined microbial treatments. These findings support the potential of PGPR-AMF consortia to sustainably enhance purple corn productivity and resilience, offering a viable alternative to reduce chemical inputs in Andean agriculture.
Keywords:
purple corn
; sustainable agriculture
; genotypes
; environment
; PGPR
; AMF
1. Introduction
The purple corn (Zea mays L.) is an ancient landrace cultivated in the Peruvian Andes since pre-Incan times, traditionally cultivated at altitudes between 2000 to 3000 meters above sea level [1]. It remains a staple in the Andean diet and is increasingly valued for its intense pigmentation, which is attributed to high concentrations of anthocyanins a subclass of flavonoids with potent antioxidant capacity [2,3]. Anthocyanins have been associated with various health benefits, including reduction of oxidative stress [4], cancer prevention [5], cardiovascular protection [6], anti-inflammatory effects [7,8], and mitigation of neurodegenerative conditions [9]. Additionally, purple corn has significant industrial applications such as a natural colorant [10,11,12] and a potential feedstock for bioethanol production [13].
Peru is one of the world’s leading producers and exporters of purple corn [14], with production increasing at an annual rate of 2.7% in yield and 2.4% in cultivated area [15]. National yields average 5.6 t/ha, with Lima, Ayacucho, Cajamarca, Áncash, Arequipa, and Huánuco contributing over 80% of the total output [15]. However, the intensified agricultural practices, particularly the excessive use of chemical fertilizers and agrochemicals, have raised environmental concerns, including soil degradation, eutrophication, and greenhouse gas emissions [1,16].
In response, sustainable alternatives such as microbial inoculants have emerged as promising tools to enhance plant growth while reducing environmental impacts. Among these, (i) plant growth-promoting rhizobacteria (PGPR), (ii) arbuscular mycorrhizal fungi (AMF), and (iii) nitrogen-fixing symbionts have demonstrated the capacity to increase biomass accumulation and nutrient uptake in cereals, including maize [16]. Azospirillum spp. a PGPR , contribute to fix atmospheric nitrogen, synthesize phytohormones such as Indole-3-acetic acid (IAA) and gibberellins, solubilize phosphorus, and promote various agronomic traits including yield, root and shoot development, and plant biomass [17,18,19,20,21]. Similarly, AMF such as Glomus spp. enhance phosphorus acquisition and water uptake, and contribute to improved stress tolerance [22,23,24].
Studies in maize have shown that Glomus spp. inoculation improves mineral nutrition and sugar content, attributed to the role of phosphorus in carbohydrate metabolism [23], it has also been associated with enhanced primary root growth [24], while Azospirillum spp. inoculation has promoted early maturation [25]. Notably, co-inoculation with both microbes has demonstrated synergistic interaction under field conditions, leading to enhanced agronomic yield and improved cost-benefit ratios under field conditions [26].
Despite growing evidence, few studies have assessed the effect of microbial consortia—specifically Azospirillum brasilense (hereafter Azospirillum) and Glomus iranicum var. tenuihypharum (hereafter Glomus) on new genotypes of purple corn under high-altitude Andean conditions. This represents a critical gap, limiting the development of sustainable production strategies for smallholder farmers in the region. Therefore, this study evaluates the effects of individual and combined inoculation with Azospirillum and Glomus on growth, development, and yield in five Peruvian purple corn genotypes, to contribute to the formulation of climate-resilient and environmentally responsible fertilization regimes for Andean agriculture.
2. Materials and Methods
2.1. Experimental Sites
The study was conducted during the 2023–2024 agricultural season in two highland locations in Ayacucho, Peru. The first site was the Canaán Agricultural Experiment Station (13°9′49.557″ S, 74°12′6.405″ W; 2735 meters above sea level), managed by the National Institute of Agrarian Innovation (INIA), located in the district of Andrés Avelino Cáceres Dorregaray, Huamanga province. The second experimental site was Iribamba experimental field (12°54′42.54″ S, 74°18′23.37″ W; 2336 meters above sea level), located in Luricocha district, Huanta province (Figure 1A–B).
Historical climatic data for the 2023–2024 season were obtained from the Hydrometeorological Network (Red Hidrometeorológica - OPEMAN), belonging to the Ayacucho Regional Government. Mean annual temperature and precipitation were 17.89 °C and 57.91 mm in Canaán, and 14.51 °C and 45.88 mm in Iribamba, respectively (Figure 2A–B).
2.2. Soil Characteristics
Before sowing, composite soil samples were collected at a 0–30 cm depth from both experimental sites and analyzed at the Soil, Water, and Foliar Laboratory (LABSAF) of the Canaán Agricultural Experiment Station—INIA. Soil parameters evaluated included texture [27], pH [28], electrical conductivity (EC) [29], organic matter content (OM) [27], total nitrogen (N) [30], available phosphorus (P) [27], available potassium (K) [31], and exchangeable cations for determining the cation exchange capacity (CEC) [27].
The soils at Canaán and Iribamba were classified as loam in texture and exhibited moderately alkaline pH values (7.80 in Canaán and 7.60 in Iribamba), which are known to limit the solubility and uptake of nutrients such as phosphorus, iron and zinc. Electrical conductivity values were 13.10 mS/m in Canaán and 83.1 mS/m in Iribamba, indicating non-saline conditions (Table 2).
Organic matter content was moderate (2.30% in Canaán and 1.80% in Iribamba), and available phosphorus was classified as medium (15.79 and 12.99 mg/kg, respectively). Available potassium levels were high in both sites (~380 mg/kg), whereas total nitrogen was low, particularly in Iribamba (0.09%), potentially limiting early vegetative growth. The Cation Exchange Capacity (CEC) values were high in both locations (46.48 and 43.77 cmol(+)/kg), with calcium dominating the exchange complex (37.93 and 35.54 cmol(+)/kg, respectively), followed by potassium and magnesium. However, the magnesium concentration was below optimal thresholds (6.10 and 3.79 cmol(+)/kg), resulting in unbalanced cation ratios (Table 2). According to agronomic benchmarks, a Ca:Mg:K ratio of approximately 13:2:1 is considered optimal for nutrient availability and soil structural stability [32].
2.3. Experimental Desing and Agronomic Management
A randomized complete block design (RCBD) was employed independently at each site, with five purple corn genotypes and four treatments: (T1) control (uninoculated), (T2) Azospirillum brasilense, (T3) Glomus iranicum var. tenuihypharum, and (T4) combined inoculation of both microorganisms. Each location comprised 20 plots (3.2 m width × 4.0 m length), arranged with 0.8 m inter-row and 0.5 m intra-row spacing. To minimize edge effects, blocks were separated by 1.5 m alleys, and plants located on the borders of each plot were excluded from all evaluations. Primary tillage was performed to 30 cm depth to optimize soil aeration and root development.
Fertilization included two applications of 75 kg Mallki® (fulvic/humic acids, micronutrients). At Iribamba, 50 kg of Terrasur® was applied and 25 kg of phosphate rock was incorporated at sowing, Fertilization strategies were tailored according to the results of a prior soil analysis. Pest management included four applications of Beta-Baytroide® (7 mL per 20 L), targeting Spodoptera frugiperda, combined with an adjuvant and a pH regulator to enhance adherence and efficacy.
2.4. Microbial Inoculation Procedures
Seeds were inoculated with Azospirillum brasilense provided by the Universidad Nacional San Cristóbal de Huamanga (UNSCH–FOCAM). A mixture of 400 g peat-based inoculant, 50 mL liquid inoculant (1 × 10⁸ CFU/g), and 25 mL arabic gum was prepared following Condori et al. [33] to enhance seed adhesion. Three seeds were placed per hill at uniform spacing. Sowing dates were November 28, 2023 (Canaán), and December 1, 2023 (Iribamba). Hilling was conducted on January 11 (Canaán, mechanical) and January 13 ,2024 (Iribamba, manual).
For AMF inoculation, Mycoup® (≥80 spores/g) was applied at V10 growth stage by localized root zone application. A solution of 22 g inoculant in 64 L dechlorinated water (0.34 g/L) was prepared and applied within the root zone (0–20 cm) using backpack sprayers to ensure uniform distribution.
2.5. Agronomic Parameters
Vegetative parameters included plant height (from collar to last stem node) and first ear height was evaluated at the milk grain stage from the plant collar to the ear-bearing node, measured with a wooden ruler. To conduct these measurements, 10 plants were randomly selected from each experimental unit, excluding those on the border. Stem diameter was measured at the second internode above the soil surface at physiological maturity at the plant using a digital caliper (n = 5).
Ear traits included ear length (flexible tape), ear diameter (digital caliper at mid-ear), and ear yield (mass of 10 uniform ears using OHAUS AX4202 balance, ±0.01 g). Yield-related traits: Husk yield was assessed from 6–10 de-kernelled ears, thousand-kernel weight (TKW) was determined using the same balance. Grain yield was calculated per plot (weighing total grain) and extrapolated to t/ha.
2.5. Statistical Analysis
A randomized complete block design (RCBD) was implemented independently at each location. The factors considered were site, microbial treatment, genotype, and genotype × site interaction. Homogeneity of variance was tested prior to performing a combined ANOVA. Significant differences (p < 0.05) were further explored using Tukey’s HSD test. All analyses were conducted using InfoStat v2008 [34].
3. Results
Vegetative Traits
The analysis of variance revealed highly significant effects (p < 0.05) of location, treatment nested within environment, and genotype-by-environment interaction (G×E) on plant height and ear height. Low coefficients of variation (CV = 2.7% for plant height; 2.69% for ear height) underscored the high consistency and precision of the dataset (Table S1,S6).
For plant height, significant differences were observed between the means of Canaán and Iribamba (Tukey's test, p < 0.05) (Table S2). Meanwhile for treatment and location effects, dual inoculation (T4) consistently outperformed other treatments across both locations. In Canaán, T4-treated plants reached an average height of 254.78 ± 8.13 cm, representing a 19.98% increase over the uninoculated control T1. In Iribamba, T4 also promoted superior growth (200.74 ± 2.13 cm), representing an 18.4% increase compared to T1 (Figure 3A, Table S3). Differences between genotypes was significative, particularly INIA 601 (223.75 ± 8.56) showed the best performance (Table S4). Among G×E interaction was highly significant in the ANOVA (p < 0.0001), INIA 601 exhibited the greatest phenotypic plasticity, achieving 256.2 ± 9.64 cm in Canaán and 191.76 ± 10.9 cm in Iribamba 33.6% difference (Figure 3B). Conversely, INIA 615 recorded the lowest values, particularly in Iribamba (169.64 ± 13.5 cm), highlighting differential genotype responsiveness to environmental (Table S5).
Ear height followed a similar trend (Table S6), between the means of Canaán (141.89 ± 4.92 cm) and Iribamba (116.13 ± 5.12 cm) locations significant differences were observed (Tukey's test, p < 0.05) (Table S7). For treatment and location effects, dual inoculation T4 significantly increasing ear insertion height by 19.3% in Canaán and 20.6% in Iribamba compared to controls (Figure 4A, Table S8). Differences between genotypes was significative, particularly INIA 601 (138.04 ± 8.51 cm) showed the best performance (Table S9). ANOVA revealed a significant G×E interaction (p < 0.0001). For INIA 601 attained the highest ear height in Canaán (158.2 ± 6.89 cm), while INIA 615 exhibited the lowest in Iribamba (106.22 ± 7.6 cm), indicating a 32.9% reduction (Figure 4B, Table S10)
Ear traits
ANOVA for Ear length was significantly influenced by treatment nested within environment and G×E interaction, though not by the main effects of genotype or location alone (Table S11). No different between locations was found (Table S12). The highest values were recorded under T4 treatment: 17.41 ± 0.13 cm in Canaán and 16.87 ± 0.28 cm in Iribamba with 26.5% and 23% increases, respectively, compared to controls (Figure 5A, Table S13). Differences between genotypes was significative, particularly Canteño (16.05) showed the best performance (Table S14). INIA 601 showed strong adaptation, particularly in Iribamba (16.68 ± 0.57 cm), while INIA 615 presented the shortest ears (14.54 ± 2.84 cm) at the same site, reflecting a 12.9% gap (Figure 5B, Table S15).
Ear diameter responded significantly to Environment/treatment and G×E interaction (Table S16). No different between locations was found (Table S17). In Canaán, T4 yielded the greatest diameter (51.16 ± 0.64 mm), surpassing the control by 10.8%. In Iribamba, the same treatment increased diameter by 13.1% over the control (Figure 6A, Table S17). Differences between genotypes was significative, particularly Canteño (48.64 ± 1.54 mm) showed the best performance (Table S19). Canteño stood out with a diameter of 50.68 ± 1.03 mm in Canaán, while Sintético MM registered the lowest (42.86 ± 2.49 mm) in Iribamba a 15.5% reduction (Figure 6B, Table S20).
Ear yield was significantly affected by genotype, treatment nested in the environment interaction, and G×E interaction (Table S21). Significant different between locations was found (Table S22). In Canaán, T4 (10,949.59 ± 970 kg/ha) increased ear yield by 36.4% compared to T1 control (8,026.22 ± 930 kg/ha), while in Iribamba, the increase reached 69.7% (T4: 9,313.45 ± 831 kg/ha; T1: 5,488.12 ± 662 kg/ha) (Figure 7A, Table S23). Genotypically, Canteño outperformed others in Canaán (11,312.71 ± 986 kg/ha), while its yield declined by 32% in Iribamba. Differences between genotypes was significative, particularly Canteño (9504.82 ± 1081 kg/ha) showed the best performance (Table S24). Sintético MM was most affected by environment, recording the lowest yield (5,968.39 ± 570 kg/ha) in Iribamba recorded the lowest yield in the genotype × environment interaction, representing a 47.3% decrease when compared to Canteño in Canaán. Sintético MM was particularly sensitive to environmental conditions while Canteño exhibited the highest yield but significant genotype-environment interaction (Figure 7B, Table S25).
Husk yield was significantly affected by environment and treatment nested in the environment interaction (Table S26). Significant different between locations was found (Table S27). In Canaán, dual inoculation (1,185.99 kg/ha) significantly increased husk yield by 58.2% compared to T1 (1,876.82 ± 60.9 kg/ha), and in Iribamba by 68.2% (Figure 8A, Table S28). Differences between genotypes was significative, particularly Canteño (1319.89 ± 172 kg/ha) showed the best performance (Table S29). Genotype analysis revealed Canteño as the highest-yielding line in Canaán (1,682.33 ± 118 kg/ha), whereas PMV 581 had the lowest in Iribamba (873.74 ± 140kg/ha)—a 48.1% decline (Figure 8B, Table S30).
Thousand kernel weight (TKW) was significantly affected by all main factors except the G×E interaction (Table S31). Differences between locations was significative (Table S32) showed the best performance (Table S32). T4 treatment in Canaán resulted in the highest TKW (617.38 ± 15 g), 9.2% higher than the control. In Iribamba, the difference was more pronounced between T4 (479.64 ± 29.6 g) and T1 (360.03 ± 33.9 g), a 33.2% increase (Figure 9A, Table S33). Genotypically, Canteño had the highest average TKW (534.24 g), while Sintético MM (475.10 g) had the lowest performance (Table S34). Although G×E interaction was not significant, Canteño showed notable variation: 639.81 ± 12.9 g in Canaán, while in 428.68 ± 56.9 g in Iribamba. PMV 581 showed the weakest adaptation, with only 379.48 ± 32.7 g in Iribamba (Figure 9 B, Table S35).
Grain yield followed the same trend. Although the environment alone did not show a significant main effect, dual inoculation markedly improved productivity in both locations (Table S36). Differences between locations was no significative (Table S32) showed the best performance (Table S37). In Canaán, T4 (9,072.77 ± 922 kg/ha) increased grain yield by 33.6% compared to T1 (6,840.23 ± 874 kg/ha), while in Iribamba the increase reached 69% (Figure 10A). Genotypically, Canteño had the highest average grain yield (8184.93 ± 936 Kg/ha), while Sintético MM (475.10 ± 281 Kg/ha) had the lowest performance (Table S39). G×E analysis showed Canteño as the most productive genotype in Canaán (9,630.38 ± 933 kg/ha), with a 30.1% decline in Iribamba. Sintético MM was again the least productive under Iribamba conditions (4,938.11 ± 452 kg/ha), representing a 48.8% drop relative to Canteño in Canaán (Figure 10B, Table S40).
4. Discussion
Dual Inoculation Enhances Crop Performance
The results of this study provide robust evidence supporting the effectiveness of microbial consortia—Azospirillum brasilense and Glomus iranicum var. tenuihypharum—in improving key agronomic traits in purple corn (Zea mays L.). Dual inoculation consistently enhanced plant height, ear traits, and grain yield across distinct environments, confirming the complementary mechanisms by which these microorganisms operate as synergistic bio-effectors enhancing crop physiological performance and yield potential. A. brasilense is known to promote nitrogen fixation. Additionally, it stimulates root development through the production of phytohormones such as IAA and nutrient absorption [35,36]. In parallel, Glomus spp. expand the rhizosphere through extraradical hyphae, improving phosphorus availability and improving water uptake [7,37,38,39,40].
In this study, the co-inoculated treatment (T4) led to plant height increases of 19.98% in Canaán and 18.4% in Iribamba, consistent with previous findings reporting yield improvements between 20% and 70% under field conditions using similar microbial consortia [41]. The synergistic interaction between PGPR and AMF appears to be particularly effective under field settings, likely due to their complementary functions in nutrient cycling, root development, and hormone regulation [42]. These findings reinforce the role of biofertilizers as viable low-input technologies in sustainable agriculture, particularly in marginal systems such as highland Andean agroecosystems [43].
Environmental Context Modulates Microbial Efficacy
The comparative performance between sites highlights the environmental dependency of microbial efficacy. Despite Canaán's higher elevation (2735 m a.s.l.)—which typically presents challenging conditions for microbial survival such as lower oxygen partial pressure and higher UV radiation—co-inoculation still elicited significant improvements in yield-related parameters. Interestingly, in Iribamba (2336 m a.s.l.), greater gains were observed in TKW (+33.2%) and grain yield (+69.7%) relative to the control, surpassing the increases seen in Canaán. These outcomes suggest that microbial inoculants may be particularly valuable under moderate abiotic stress conditions, where they contribute to resilience and yield stabilization.
This is consistent with the stress-gradient hypothesis, which posits that facilitative plant–microbe interactions become more significant under increasing abiotic stress [43]. Under such scenarios, PGPR-AMF consortia may activate transcriptional networks related to photoprotection, antioxidant metabolism, and hormonal crosstalk, aiding in plant under abiotic stress tolerance [32,44]. Recent transcriptomic studies in maize have revealed that microbial inoculation enhances the expression of genes involved in UV-B response, ROS scavenging, and nutrient transport under elevated stress conditions [45]. The superior performance observed in Canaán may thus reflect a more favorable balance between microbial colonization and stress signaling pathways in the host plant.
Genotype by Envirment Interacción and Phenotipic Plasticity
Yield component traits such as ear weight, husk weight, and thousand-kernel weight (TKW) exhibited strong genotype × environment (G×E) interactions, emphasizing the role of phenotypic plasticity in adaptive performance. Genotypes such as INIA 601 and Sintético MM displayed enhanced vegetative vigor in Canaán, while Canteño excelled in grain yield across both locations. These divergent patterns may reflect differences in resource-use efficiency and carbon allocation strategies among genotypes [46,47].
Canteño and INIA 615, for instance, demonstrated efficient assimilate partitioning to reproductive organs despite moderate vegetative growth. This supports previous findings suggesting that shorter plants can benefit from a favorable source-sink balance, leading to higher harvest index values and improved grain filling [48,49]. In breeding contexts, this physiological efficiency is critical for selecting cultivars adapted to resource-constrained environments, where maximizing reproductive output with minimal structural investment is advantageous [50].
The more pronounced microbial response in Iribamba further underscores the importance of integrating microbial management with genotype selection. Although G×E effects were not significant for TKW, Canteño displayed remarkable plasticity—recording 639.8 g in Canaán and 428.7 g in Iribamba—highlighting its adaptability and potential as a responsive genotype for dual inoculation strategies.
Agronomic and Ecological Implications
Collectively, these findings underline the potential of microbial inoculants to enhance crop productivity, particularly when deployed in combination with genotypes selected for specific environments. The consistent yield gains observed with dual inoculation, especially under suboptimal conditions, suggest that PGPR-AMF consortia can serve as key components of climate-resilient and input-efficient cropping systems.
Moreover, the observed 30% reduction in nitrogen fertilizer requirements, as reported by Condori et al. [33], reinforces the environmental and economic value of integrating microbial technologies into existing agronomic frameworks. Future research should prioritize the molecular characterization of genotype-microbe compatibility and explore long-term field validation under varying stress scenarios.
5. Conclusions
This study demonstrates that dual microbial inoculation with Azospirillum brasilense and Glomus iranicum var. tenuihypharum can significantly improve the agronomic performance and adaptability of purple corn in contrasting Andean environments. The observed increases in plant height, ear development, and grain yield across both sites provide compelling evidence of the synergistic effects of PGPR and AMF under field conditions.
Genotype × environment (G×E) interactions played a decisive role in modulating crop responses. Genotypes such as INIA 601 and Canteño exhibited high phenotypic plasticity, while PMV 581 showed reduced performance under Iribamba conditions , underscoring the importance of selecting site-adapted genotypes. These findings highlight the need to integrate local landraces and G×E-informed screening into breeding programs focused on resilience and climate adaptability.
The more pronounced effects of microbial inoculation in Iribamba suggest that microbial symbiosis becomes functionally more active under abiotic stress, consistent with the stress-gradient hypothesis. Enhanced nitrogen fixation, phosphorus solubilization, and stress-alleviating mechanisms (e.g., ACC deaminase activity) likely contributed to improved performance in marginal conditions.
At the physiological level, microbial co-inoculation appears to have optimized source–sink relationships, favoring reproductive allocation over structural biomass. This was particularly evident in genotypes like Canteño, which maintained high harvest index values under stress. The inverse relationship observed between plant height and grain yield in some genotypes suggests that shorter phenotypes may enhance partitioning efficiency, providing a target for ideotype design in low-input systems.
Futhermore, the variable efficacy of microbial treatments across altitudinal gradients confirms that the benefits of inoculation are context-dependent, shaped by both environmental parameters and host plant physiology. This highlights the importance of co-adapting microbial strategies with genotype selection in precision agriculture frameworks.
In summary, these results support the integration of microbial inoculants as a viable, ecologically optimal strategy to enhance yield, stability, and resource-use efficiency in smallholder Andean systems. Incorporating microbial responsiveness into genotype evaluation can accelerate the development of resilient cropping systems capable of withstanding the challenges of climate variability and soil degradation, contributing to food security and sustainable intensification in highland agroecosystems.
Supplementary Materials
The following supporting information can be downloaded at the website of this paper posted on Preprints.org.
Author Contributions
Conceptualization, E.R.Q.-M.; data curation, C.G.B.; formal analysis, C.G.B.; investigation, J. A.Q.-T and J.V.; methodology, B.R.H.; project administration, O.P. and L.D.-M.; supervision, D.M.; writing—original draft, E.R.Q.-M., D.M.; writing—review and editing, D.M. All authors have read and agreed to the published version of the manuscript.
Funding
Research on purple corn genotypes and their interaction with the bioinoculants Azospirillum sp. and Glomus iranicum was funded by the investment project 2361771: "Improving the availability, access, and use of quality seeds for potato, amylaceous maize, grain legumes, and cereals in the regions of Junín, Ayacucho, Cusco, and Puno (4 departments)", supported by Instituto Nacional de Innovación Agraria (INIA) Perú.
Data Availability Statement
The original contributions presented in the study are included in the article; further inquiries can be directed to the corresponding author.
Conflicts of Interest
The authors declare no conflicts of interest.
References
- Castellano-Hinojose, A.; Pérez-Tapia, V.; Bedmar, E.J.; Santillana, N. Purple corn-associated rhizobacteria with potential for plant growth promotion. J. Appl. Microbiol. 2018, 124, 1254–1264. [Google Scholar] [CrossRef] [PubMed]
- Medina, A.; Narro, L.; Cabrera, A. Cultivo de maíz morado (Zea mays L.) en zona altoandina de Perú: Adaptación e identificación de cultivares de alto rendimiento y contenido de antocianina. Sci. Agropecu. 2020, 11, 291–299. [Google Scholar] [CrossRef]
- Rabanal-Atalaya, M.; Medina-Hoyos, A. Análisis de antocianinas en el maíz morado (Zea mays L.) del Perú y sus propiedades antioxidantes. 2021, 39. [Google Scholar] [CrossRef]
- Suriano, S.; Balconi, C.; Valoti, P.; Redaelli, R. Comparison of total polyphenols, profile anthocyanins, color analysis, carotenoids and tocols in pigmented maize. LWT. 2021, 144, 111257. [Google Scholar] [CrossRef]
- Lao, F.; Sigurdson, G.T.; Giusti, M.M. Health benefits of purple corn (Zea mays L.) phenolic compounds. Compr. Rev. Food Sci. Food Saf. 2017, 16, 234–246. [Google Scholar] [CrossRef]
- Long, N.; Suzuki, S. , Sato, S.; Naiki-Ito, A.; Sakatani, K., Shirai, T.; Takahashi, S. Purple corn color inhibition of prostate carcinogenesis by targeting cell growth pathways. Cancer Sci. 2013, 104, 298–303. [Google Scholar] [CrossRef]
- Petroni, K.; Pilu, R.; Tonelli, C. Anthocyanins in corn: a wealth of genes for human health. Planta. 2014, 240, 901–911. [Google Scholar] [CrossRef] [PubMed]
- Zhang, Z.; Zheng, Y.; Zhang, J.; Wang, N.; Wang, Y.; Liu, W.; Xie, W. (2022). High-altitude genetic selection and genome-wide association analysis of yield-related traits in Elymus sibiricus L. using SLAF sequencing. Front. Plant Sci. 2022, 13, 874409. [Google Scholar] [CrossRef]
- Cristianini, M.; Guillén Sánchez, J.S. (2020). Extraction of bioactive compounds from purple corn using emerging technologies: A review. J. Food Sci. 2020, 85, 862–869. [Google Scholar] [CrossRef]
- Mattioli, R.; Francioso, A.; Mosca, L.; Silva, P. Anthocyanins: A Comprehensive Review of Their Chemical Properties and Health Effects on Cardiovascular and Neurodegenerative Diseases. Molecules 2020, 25, 3809. [Google Scholar] [CrossRef]
- Cruzado, G.M.; Voss, D.M.; del Carpio Jiménez, C.; Lao, F.; Jing, P.; Zhang, K.; Yucheng, Z.; Sydney, G.; Giusti, M.M. The amazing colors of peruvian biodiversity: Select peruvian plants for use as food colorants. An. Cient. 2022, 83, 1–17. [Google Scholar] [CrossRef]
- Cai, T.; Ge-Zhang, S.; Song, M. Anthocyanins in metabolites of purple corn. Front. Plant Sci. 2023, 14, 1154535. [Google Scholar] [CrossRef]
- Somavat, P.; Kumar, D.; Singh, V. Techno-economic feasibility analysis of blue and purple corn processing for anthocyanin extraction and ethanol production using modified dry grind process. Ind. Crops Prod. 2018, 115, 78–87. [Google Scholar] [CrossRef]
- MIDAGRI. Análisis de Mercado: 2015–2021. Maíz Morado; MIDAGRI: Lima, Peru, 2022; Gobierno del Perú. Available online: https://www.gob.pe/institucion/agromercado/informes-publicaciones/2624383-analisis-de-mercado-maiz-morado-2015-2021. [Google Scholar]
- Castellano-Hinojosa, A. Emission of greenhouse gases and microbial biodiversity in soils of agricultural interest. Effect of nitrogen fertilisation. Ph.D. Thesis, Granada University, Granada, España, 2019. [Google Scholar]
- Pérez-Montaño, F.; Alías-Villegas, C.; Bellogín, R.A.; Del Cerro, P.; Espuny, M.R.; Jiménez-Guerrero, I.; López-Baena, F.J.; Ollero, F.J.; Cubo, T. Plant growth promotion in cereal and leguminous agricultural important plants: From microorganism capacities to crop production. Microbiol. Res. 2014, 169, 325–336. [Google Scholar] [CrossRef] [PubMed]
- Pii, Y.; Mimmo, T.; Tomasi, N.; Terzano, R.; Cesco, S.; Crecchio, C. Microbial interactions in the rhizosphere: beneficial influences of plant growth-promoting rhizobacteria on nutrient acquisition process. A review. Biol. Fertil. Soils 2015, 51, 403–415. [Google Scholar] [CrossRef]
- Piccoli, P. , Lucangeli, C.D., Bottini, R., Schneider, G. Hydrolysis of [17, 17–2 H 2] gibberellin A 20-glucoside and [17, 17–2 H 2] gibberellin A 20-glucosyl ester by Azospirillum lipoferum cultured in a nitrogen-free biotin-based chemically-defined medium. Plant Growth Regul. 1997, 23, 179–182. [Google Scholar] [CrossRef]
- Sudhakar, P.; Chattopadhyay, G.N.; Gangwar, S.K.; Ghosh, J.K. Effect of foliar application of Azotobacter, Azospirillum and Beijerinckia on leaf yield and quality of mulberry (Morus alba). J. Agric. Sci. 2000, 134, 227–234. [Google Scholar] [CrossRef]
- Mehnaz, S.; Lazarovits, G. Inoculation effects of Pseudomonas putida, Gluconacetobacter azotocaptans, and Azospirillum lipoferum on corn plant growth under greenhouse conditions. Microb. Ecol. 2006, 51, 326–335. [Google Scholar] [CrossRef]
- Cassán, F.; Perrig, D.; Sgroy, V.; Masciarelli, O.; Penna, C.; Luna, V. Azospirillum brasilense Az39 and Bradyrhizobium japonicum E109, inoculated singly or in combination, promote seed germination and early seedling growth in corn (Zea mays L.) and soybean (Glycine max L.). Eur. J. Soil Biol. 2009, 45, 28–35. [Google Scholar] [CrossRef]
- Singh, A. Efecto de bacterias fijadoras de nitrógeno en el desarrollo de cultivos de maíz. Ed. Cient. Agraria 1999.
- Roveleda, M. Interacción de Glomus sp. con Zea mays en suelos tropicales [Tesis de licenciatura]. Univ. Nac. de Agricultura 2007.
- Gómez, L. Efecto de concentraciones de esporas de Glomus sp. en Zea mays L. “maíz”, en condiciones de invernadero. Bachelor's Thesis, Universidad Nacional de San Cristóbal de Huamanga, Ayacucho, Perú, 2014. Available online: https://repositorio.unsch.edu.pe/items/6c11eb59-ddde-49f9-8f09-943324c3604e. [Google Scholar]
- Gutiérrez, B. Biofertilización con hongos micorrízicos arbusculares y Azospirillum sp. en el rendimiento de maíz amiláceo (Zea mays L.) en Quinua a 3180 msnm—Ayacucho. Bachelor's Thesis, Universidad Nacional de San Cristóbal de Huamanga, Ayacucho, Perú, 2019. [Google Scholar]
- Luna, R. Influencia de Azospirillum en el crecimiento del maíz morado (Zea mays L.). Revista de Microbiología Aplicada 2012, 10, 45–52. [Google Scholar]
- NOM-021-RECNAT-2000; Norma Oficial Mexicana Que Establece Las Especificaciones de Fertilidad, Salinidad y Clasificación de Suelos. Estudios, Muestreo y Análisis: México, Mexico, 2002.
- USEPA METHOD 9045D; Soil and Waste pH 2004. U.S. Environmental Protection Agency: Washington, DC, USA, 2004.
- ISO 11265:1994; Soil Quality—Determination of the Specific Electrical Conductivity. International Organization for Standardization: Geneva, Switzerland, 1994.
- ISO 11261:1995; Soil Quality—Determination of Total Nitrogen—Modified Kjeldahl Method. International Organization for Standardization: Geneva, Switzerland, 1995.
- Bazán, R. Manual de Procedimientos de Los Análisis de Suelos y Agua Con Fines de Riego; Repositorio INIA: Lima, Peru, 2017; Volume 1. [Google Scholar]
- Kopittke, P.M.; Menzies, N.W. A review of the use of the basic cation saturation ratio and the "ideal" soil. Soil Science Society of America Journal, 2007, 71, 259–265. [Google Scholar] [CrossRef]
- Condori, T.; Alarcón, S.; Huasasquiche, L.; García-Blásquez, C.; Padilla-Castro, C.; Velásquez, J.; Solórzano, R. Inoculation with Azospirillum brasilense as a Strategy to Reduce Nitrogen Fertilization in Cultivating Purple Maize (Zea mays L.) in the Inter-Andean Valleys of Peru. Microorganisms 2024, 12, 2107. [Google Scholar] [CrossRef]
- InfoStat. InfoStat, versión 2008. Manual del Usuario; Grupo InfoStat, Facultad de Ciencias Agropecuarias, Universidad Nacional de Córdoba: Córdoba, Argentina, 2008; Editorial Brujas.
- Bashan, Y.; de-Bashan, L.E. How the plant growth-promoting bacterium Azospirillum promotes plant growth—A critical assessment. Adv. Agron. 2010, 108, 77–136. [Google Scholar] [CrossRef]
- Ganusova, E.E.; Banerjee, I.; Seats, T.; Alexandre, G. Indole-3-acetic acid (IAA) protects Azospirillum brasilense from indole-induced stress. Applied and Environmental Microbiology 2025, 91, e02384-24. [Google Scholar] [CrossRef]
- Olawuyi, O.J.; Odebode, A.C.; Babalola, B.J.; Afolayan, E.T.; Onu, C.P. Potentials of arbuscular mycorrhiza fungus in tolerating drought in maize (Zea mays L.). Am. J. Plant Sci. 2014, 5, 778–786. [Google Scholar] [CrossRef]
- Tian, H.; Jia, Z.; Liu, W.; Wei, X.; Wang, H.; Bao, G.; Li, J.; Zhou, Q. Effects of Arbuscular Mycorrhizal Fungi on Growth and Nutrient Accumulation of Oat under Drought Conditions. Agronomy 2023, 13, 2580. [Google Scholar] [CrossRef]
- Rouphael, Y. , et al. Arbuscular mycorrhizal fungi act as biostimulants in horticultural crops. Scientia Horticulturae 2015, 196, 91–108. [Google Scholar] [CrossRef]
- Mahanty, T.; Bhattacharjee, S.; Goswami, M.; Bhattacharyya, P.; Das, B.; Ghosh, A.; Tribedi, P. Biofertilizers: A potential approach for sustainable agriculture development. Environ. Sci. Pollut. Res. 2017, 24, 3315–3335. [Google Scholar] [CrossRef]
- Vejan, P.; Abdullah, R.; Khadiran, T.; Ismail, S.; Nasrulhaq Boyce, A. Role of Plant Growth Promoting Rhizobacteria in Agricultural Sustainability—A Review. Molecules 2016, 21, 573. [Google Scholar] [CrossRef]
- Barea, J.M.; Azcón-Aguilar, C. Interactions between Azospirillum and VA mycorrhiza and their effects on growth and nutrition of maize and ryegrass. Soil Biol. Biochem. 1983, 15, 705–709. [Google Scholar] [CrossRef]
- Muhammad, A.; Kong, X.; Zheng, S.; Bai, N.; Li, L.; Khan, M.H.U.; Fiaz, S.; Zhang, Z. Exploring plant-microbe interactions in adapting to abiotic stress under climate change: a review. Front. Plant Sci. 2024, 15, 1482739. [Google Scholar] [CrossRef] [PubMed]
- Dagher, D.; Taskos, D.; Mourouzidou, S.; Monokrousos, N. Microbial-Enhanced Abiotic Stress Tolerance in Grapevines: Molecular Mechanisms and Synergistic Effects of Arbuscular Mycorrhizal Fungi, Plant Growth-Promoting Rhizobacteria, and Endophytes. Horticulturae 2025, 11, 592. [Google Scholar] [CrossRef]
- Kaushal, M.; Wani, S.P. Plant-growth-promoting rhizobacteria: Drought stress alleviators to improve crop productivity in drylands. Ann. Microbiol. 2016, 66, 35–42. [Google Scholar] [CrossRef]
- Napier, J.D.; Heckman, R.W.; Juenger, T.E. Gene-by-environment interactions in plants: Molecular mechanisms, environmental drivers, and adaptive plasticity. Plant Cell 2023, 35, 109–124. [Google Scholar] [CrossRef] [PubMed]
- Arnold, B.J.; Lahner, B.; DaCosta, J.M.; Weisman, C.M.; Hollister, J.D.; Salt, D.E.; Bomblies, K.; Yant, L. Trait plasticity and trade-offs in genotype-by-environment interactions. Nat. Commun. 2019, 10, 4441. [Google Scholar]
- Gratani, L. Plant phenotypic plasticity in response to environmental factors. Adv. Bot. 2014, 2014, 1–17. [Google Scholar] [CrossRef]
- Elliott, J.W.; Beavis, W.D.; Fischer, R.A.; Hammer, G.L. Source–sink relationships in maize under variable environments. Field Crops Res. 2014, 161, 61–70. [Google Scholar]
- Youseif, S.H. Genetic diversity of plant growth-promoting rhizobacteria and their effects on the growth of maize plants under greenhouse conditions. Ann. Agric. Sci. 2018, 63, 25–35. [Google Scholar] [CrossRef]
Figure 1.
Location of the experimental areas. (a) Canaán Agrarian Experimental Station of the National Institute for Agrarian Innovation (INIA); (b) Iribamba research plot.
Figure 1.
Location of the experimental areas. (a) Canaán Agrarian Experimental Station of the National Institute for Agrarian Innovation (INIA); (b) Iribamba research plot.
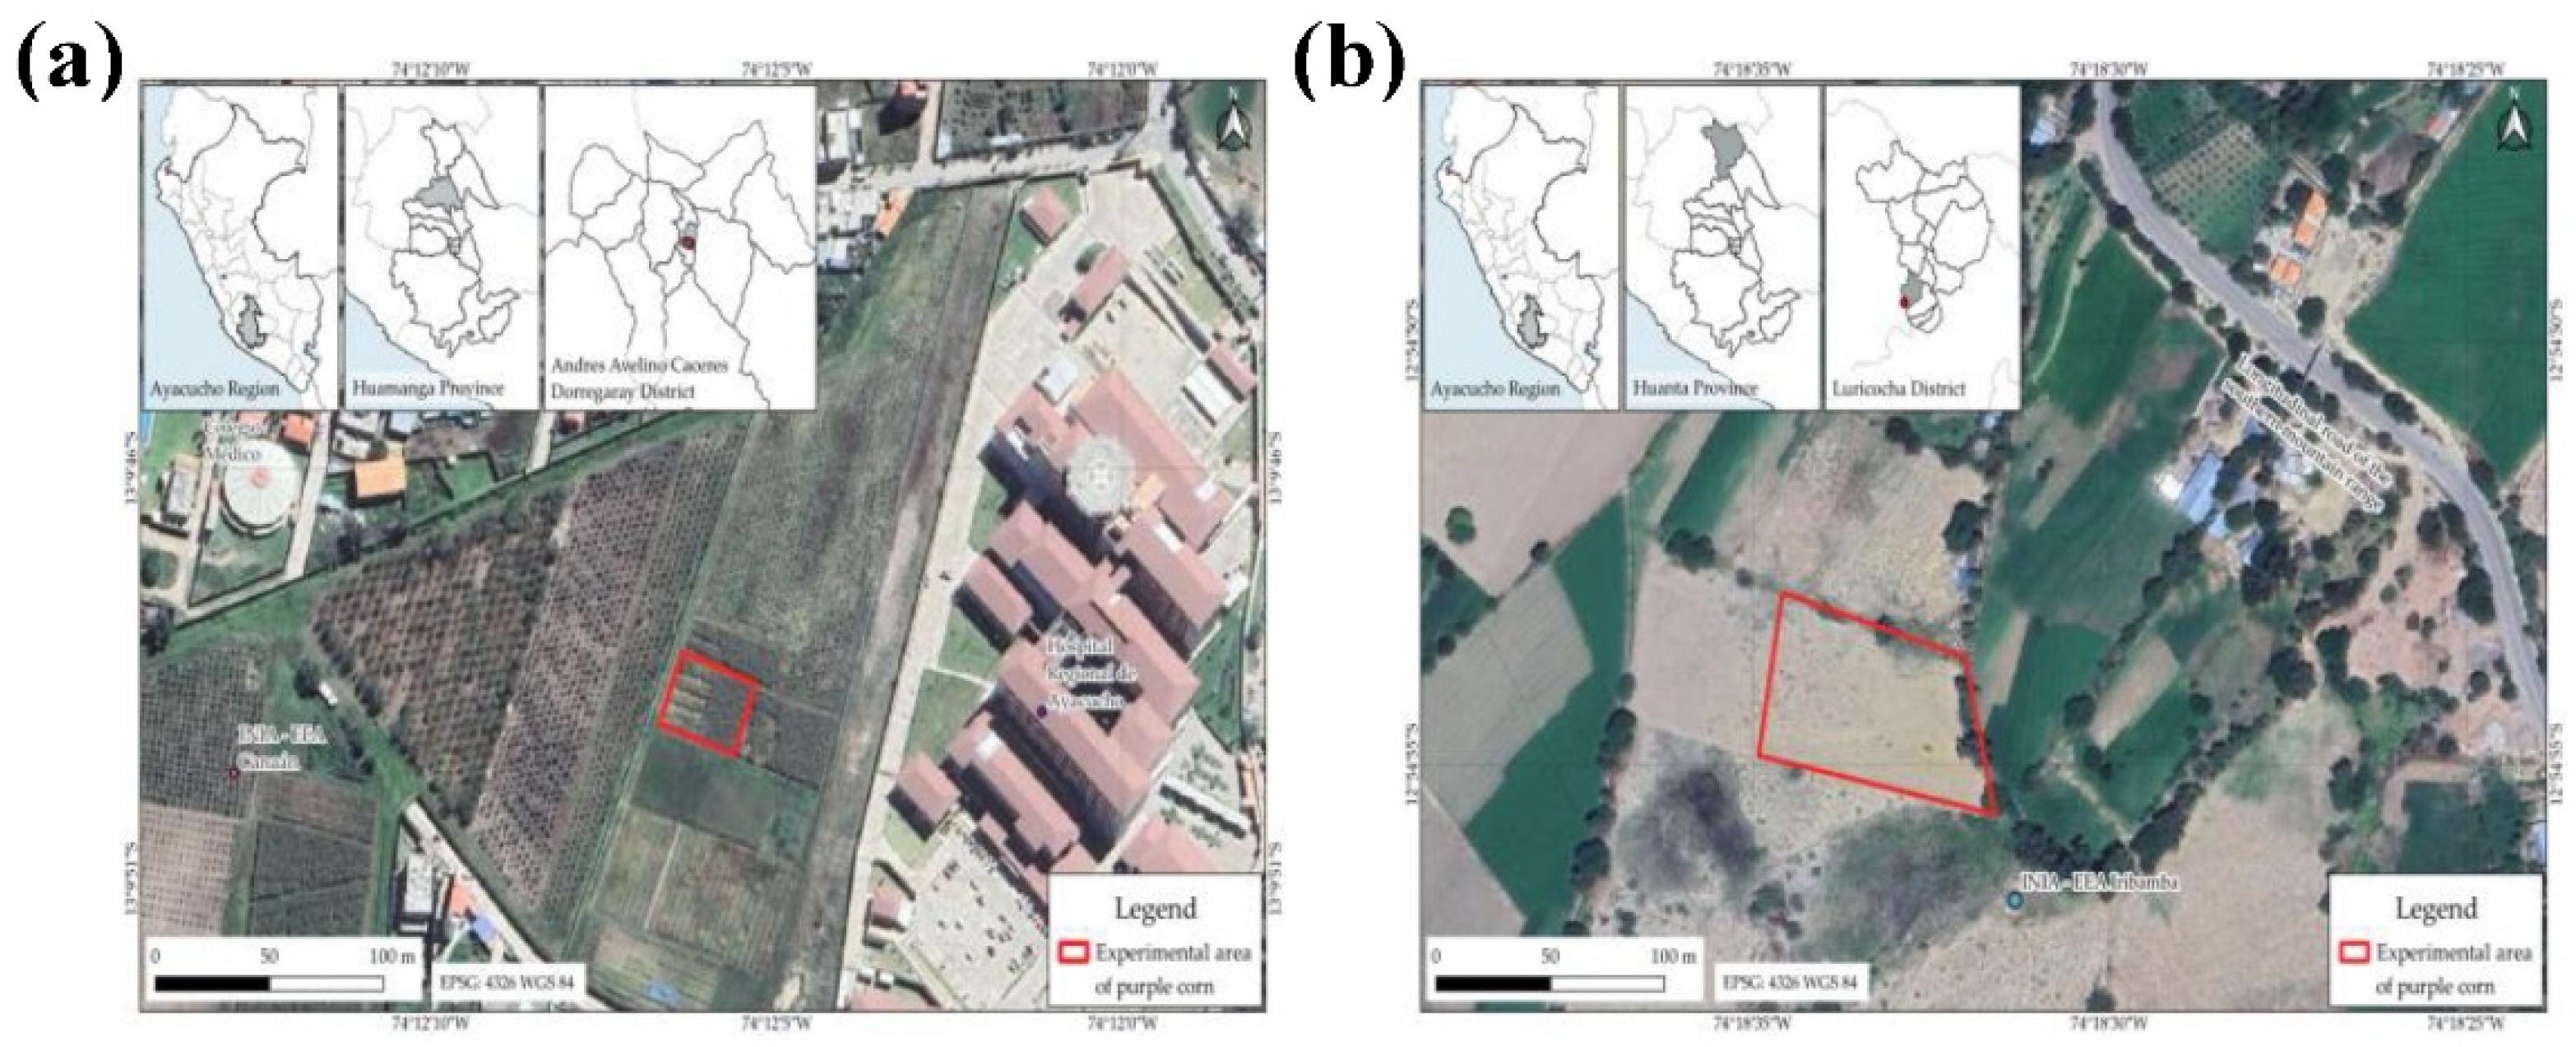
Figure 2.
Climate data of the experimental areas. (a) Canaán Agrarian Experimental Station of the National Institute for Agrarian Innovation (INIA); (b) Iribamba experimental field. Data were obtained from the INIA-Canaán Meteorological Station (13°9′ S; 74°13′ W), belonging to the Hydrometeorological Network (Red Hydrometeorological-OPEMAN).
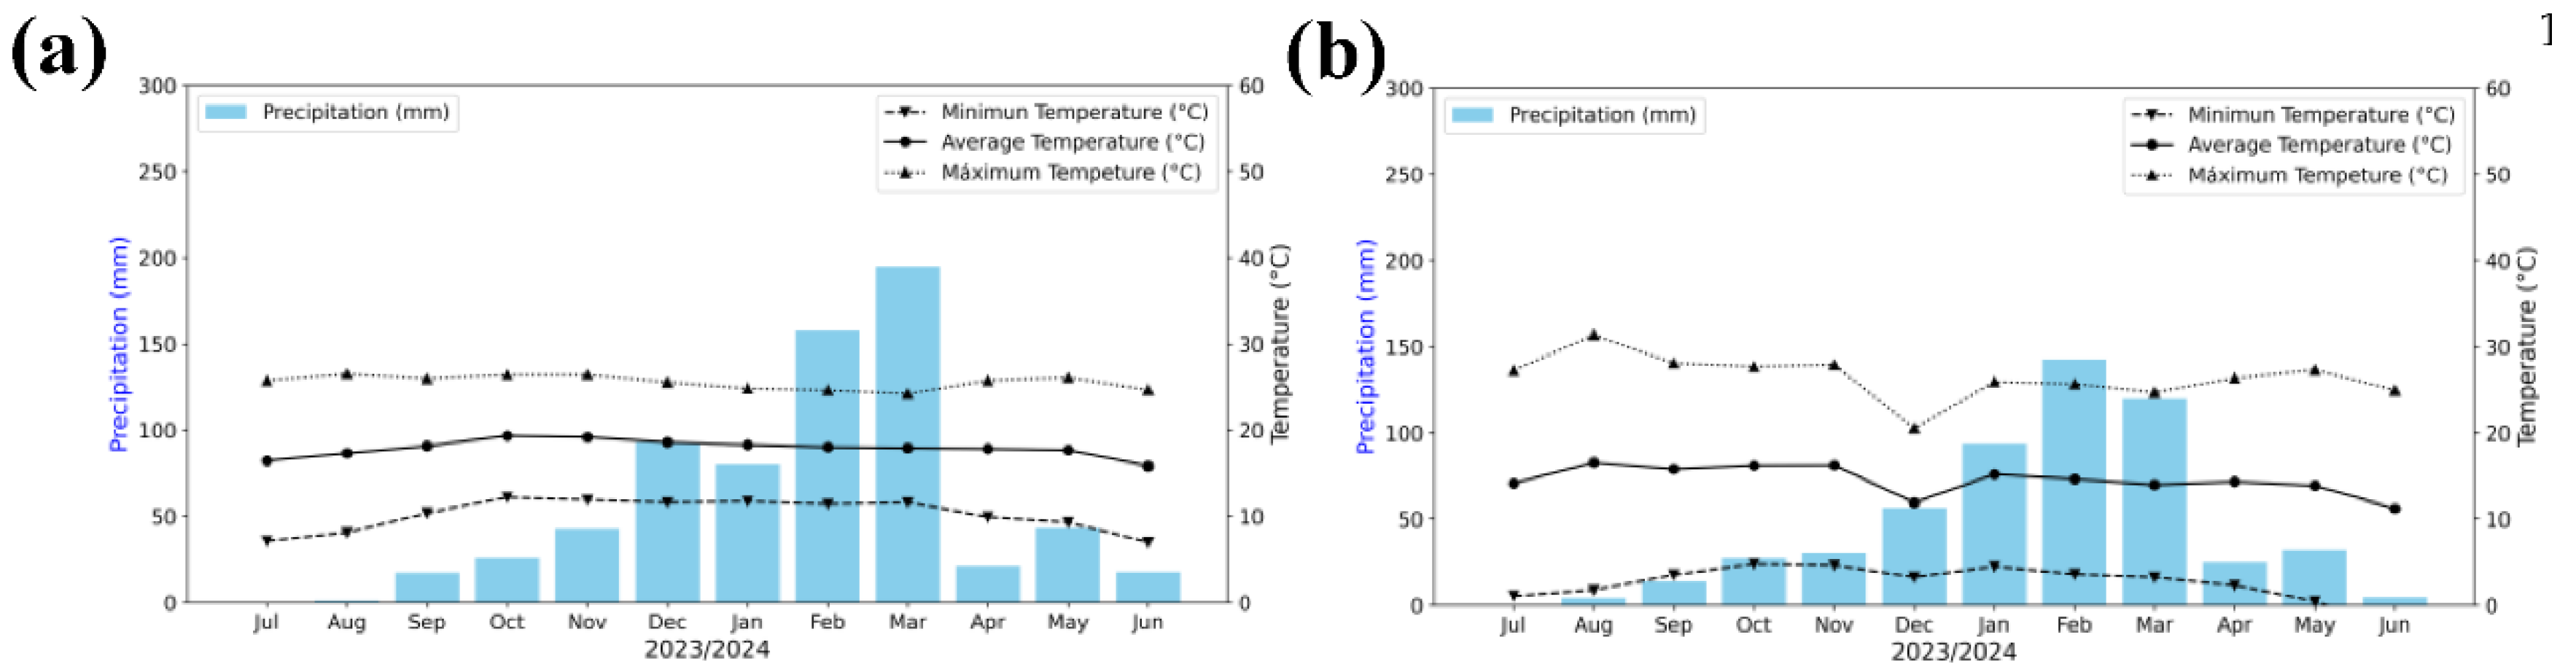
Figure 3.
Plant height. Significant differences in plant height among (A) treatments and (B) genotypes within each location. Boxes represent the interquartile range (IQR) with the median line; whiskers extend to 1.5×IQR; diamonds indicate means. Different letters denote significant differences between means (Tukey’s HSD test, α = 0.05).
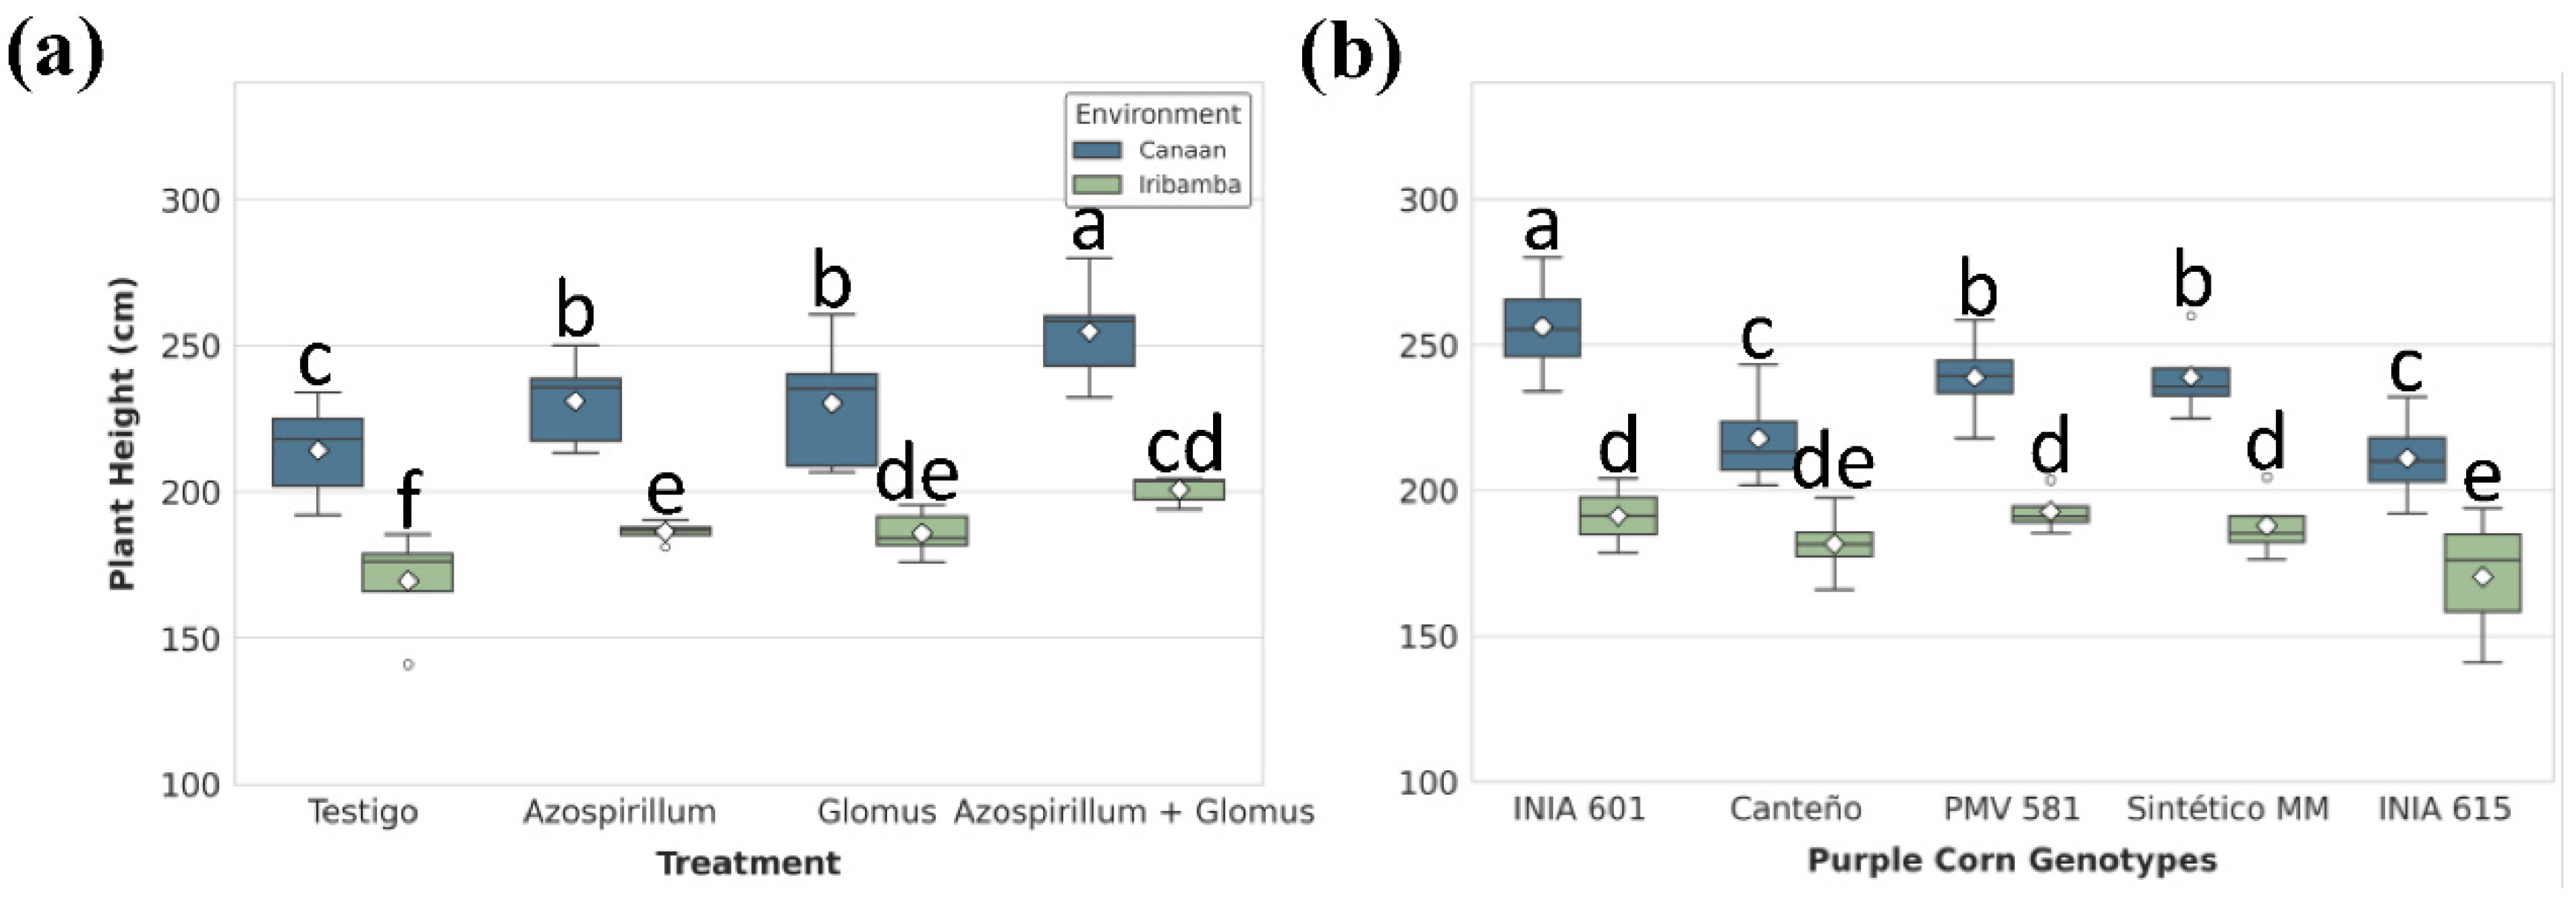
Figure 4.
Ear height. Significant differences in Ear height among (A) treatments and (B) genotypes within each location. Boxes represent the interquartile range (IQR) with the median line; whiskers extend to 1.5×IQR; diamonds indicate means. Different letters denote significant differences between means (Tukey’s HSD test, α = 0.05).
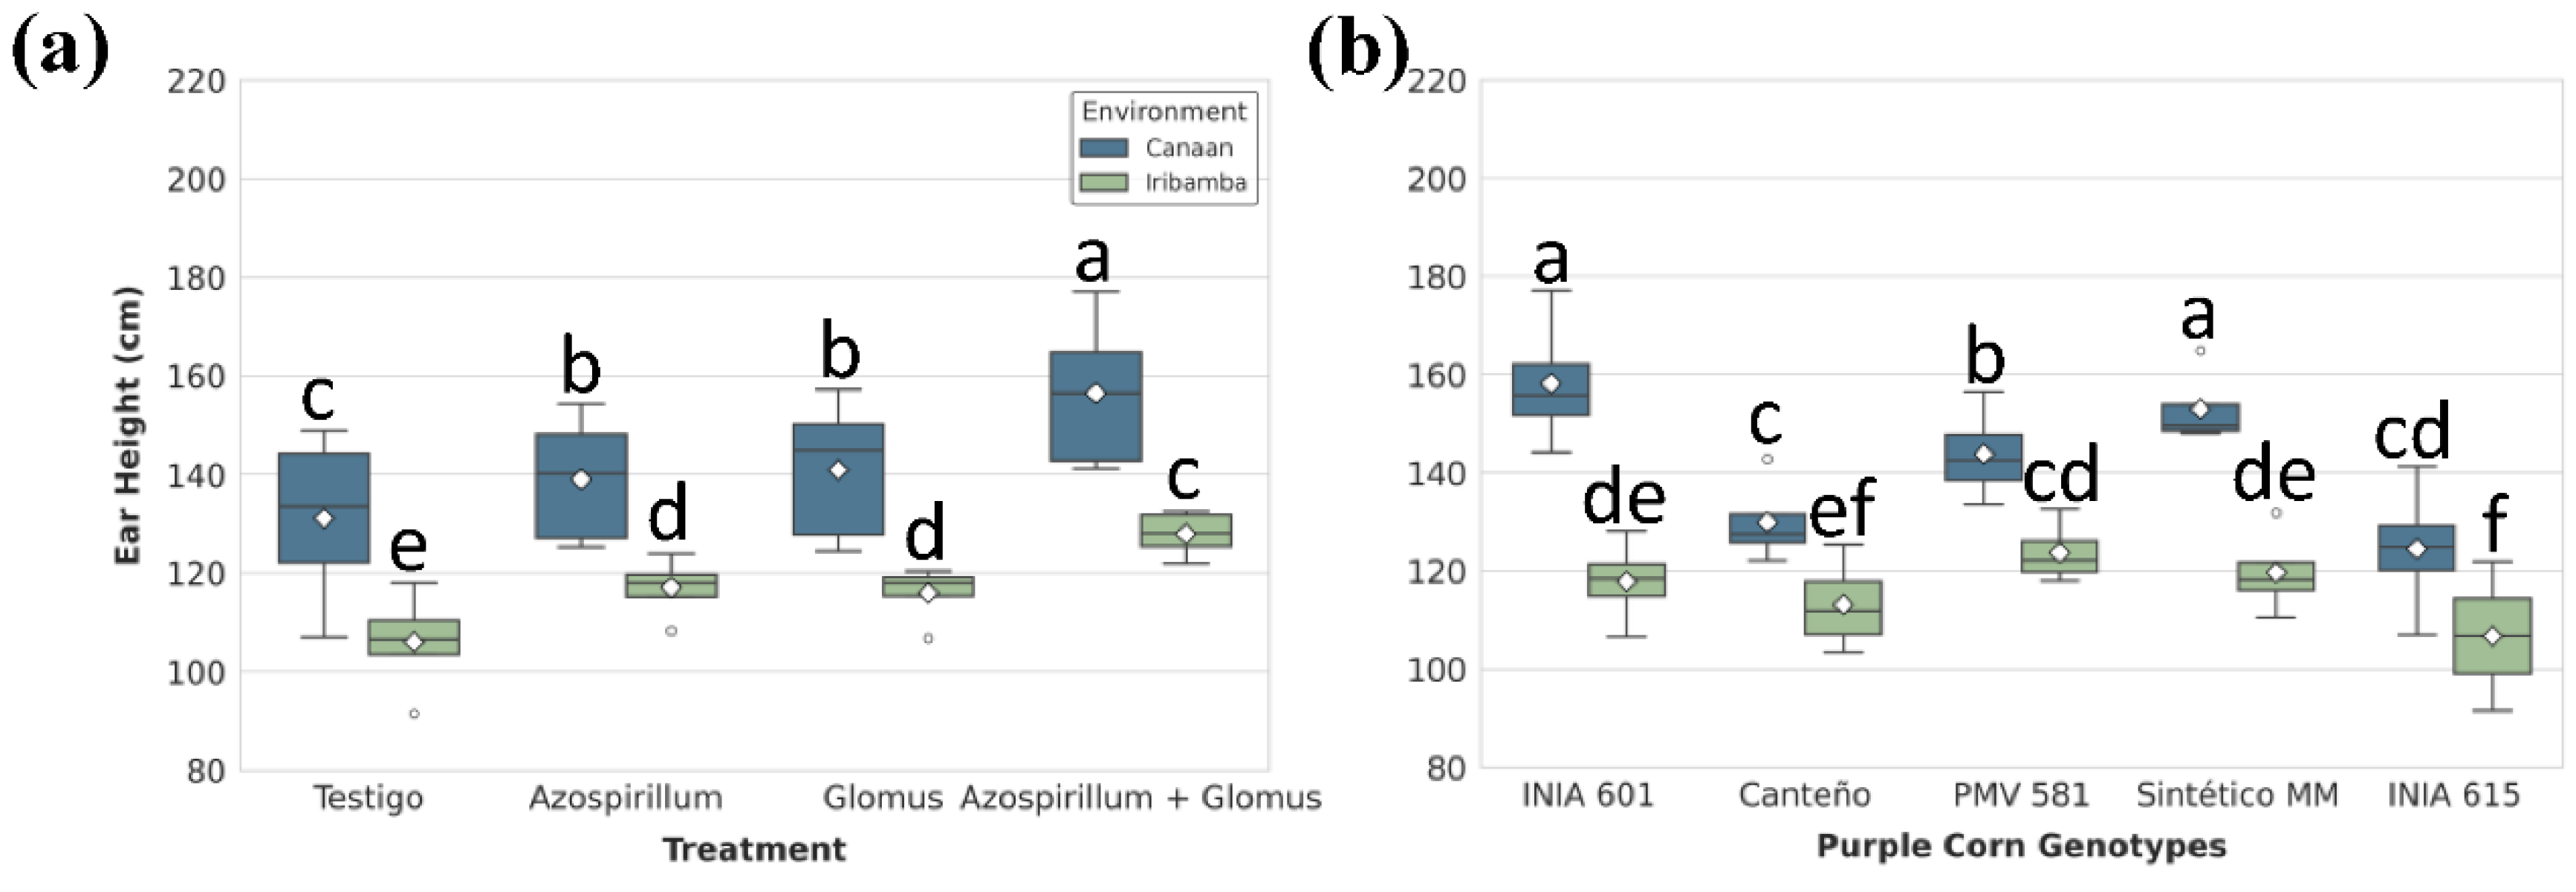
Figure 5.
Ear length. Significant differences in Ear length among (A) treatments and (B) genotypes within each location. Boxes represent the interquartile range (IQR) with the median line; whiskers extend to 1.5×IQR; diamonds indicate means. Different letters denote significant differences between means (Tukey’s HSD test, α = 0.05).
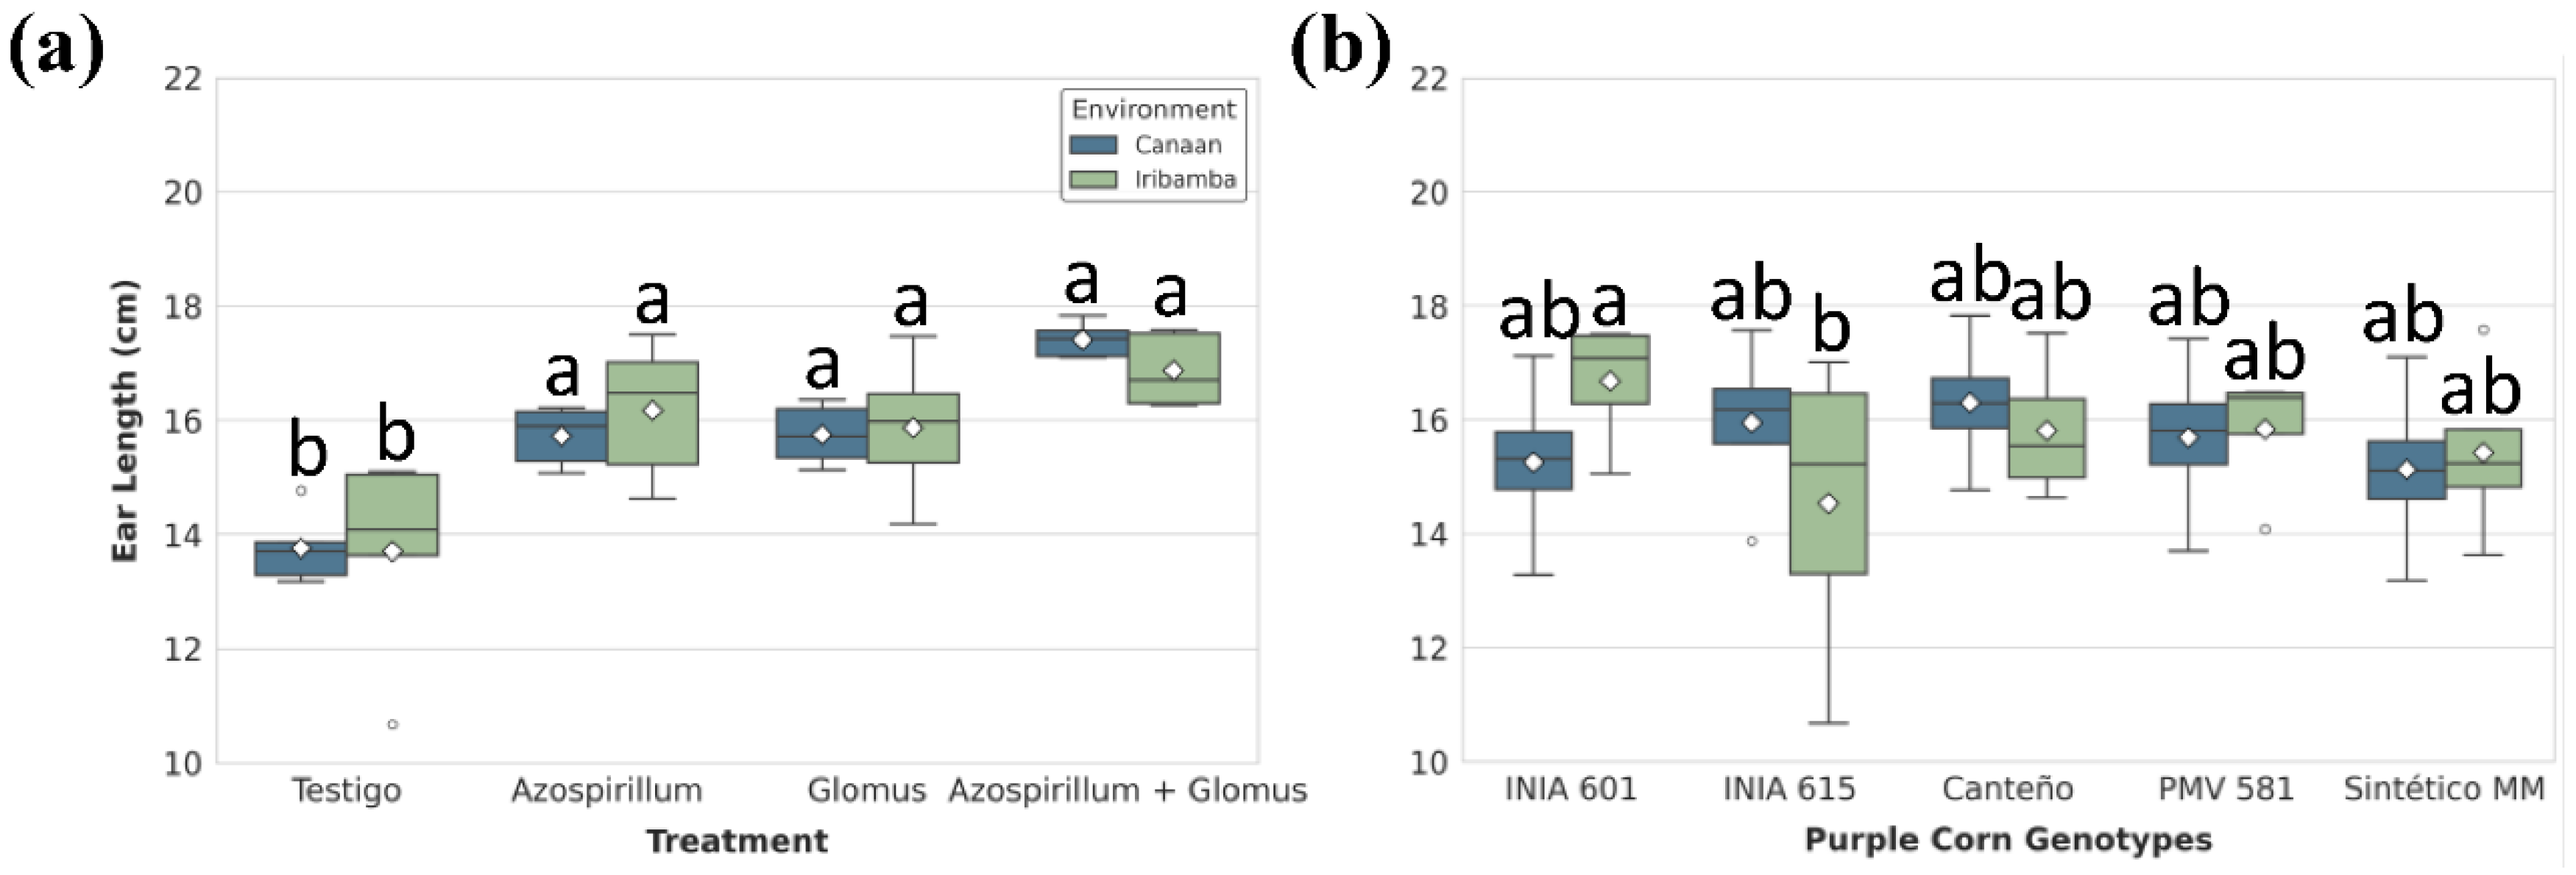
Figure 6.
Significant effects of (A) treatments and (B) genotype-by-environment interaction on ear diameter (mm). Box plots show the distribution (IQR, median, whiskers) and mean (diamond). Different lowercase letters above the boxes denote statistically significant differences between means and brackets show same group based on Tukey's HSD test (P<0.05).
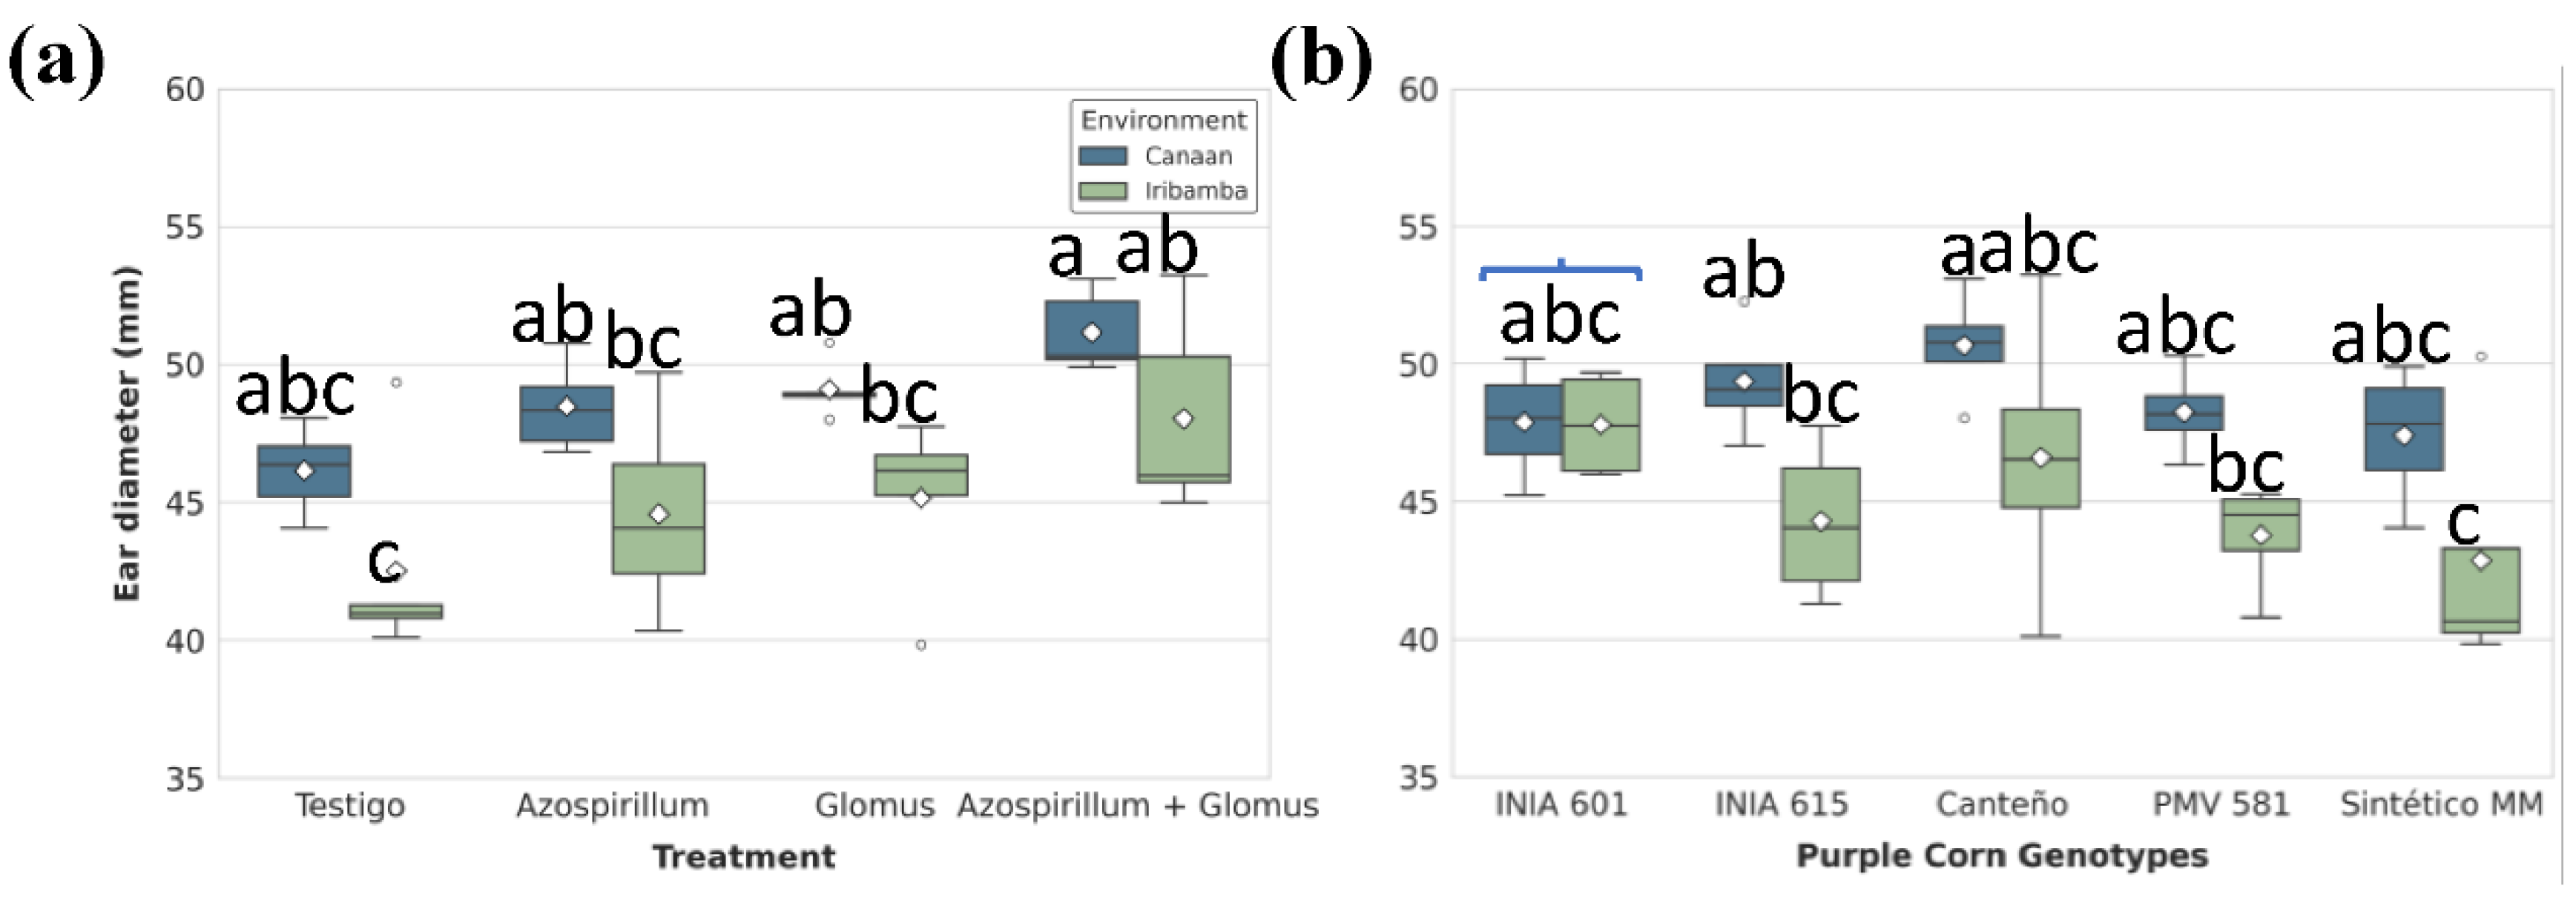
Figure 7.
Significant effects of (A) treatments and (B) genotype-by-environment interaction on Ear yield (kg/ha). Box plots show the distribution (IQR, median, whiskers) and mean (diamond). Different lowercase letters above the boxes denote statistically significant differences between means and brackets show same group based on Tukey's HSD test (P<0.05).
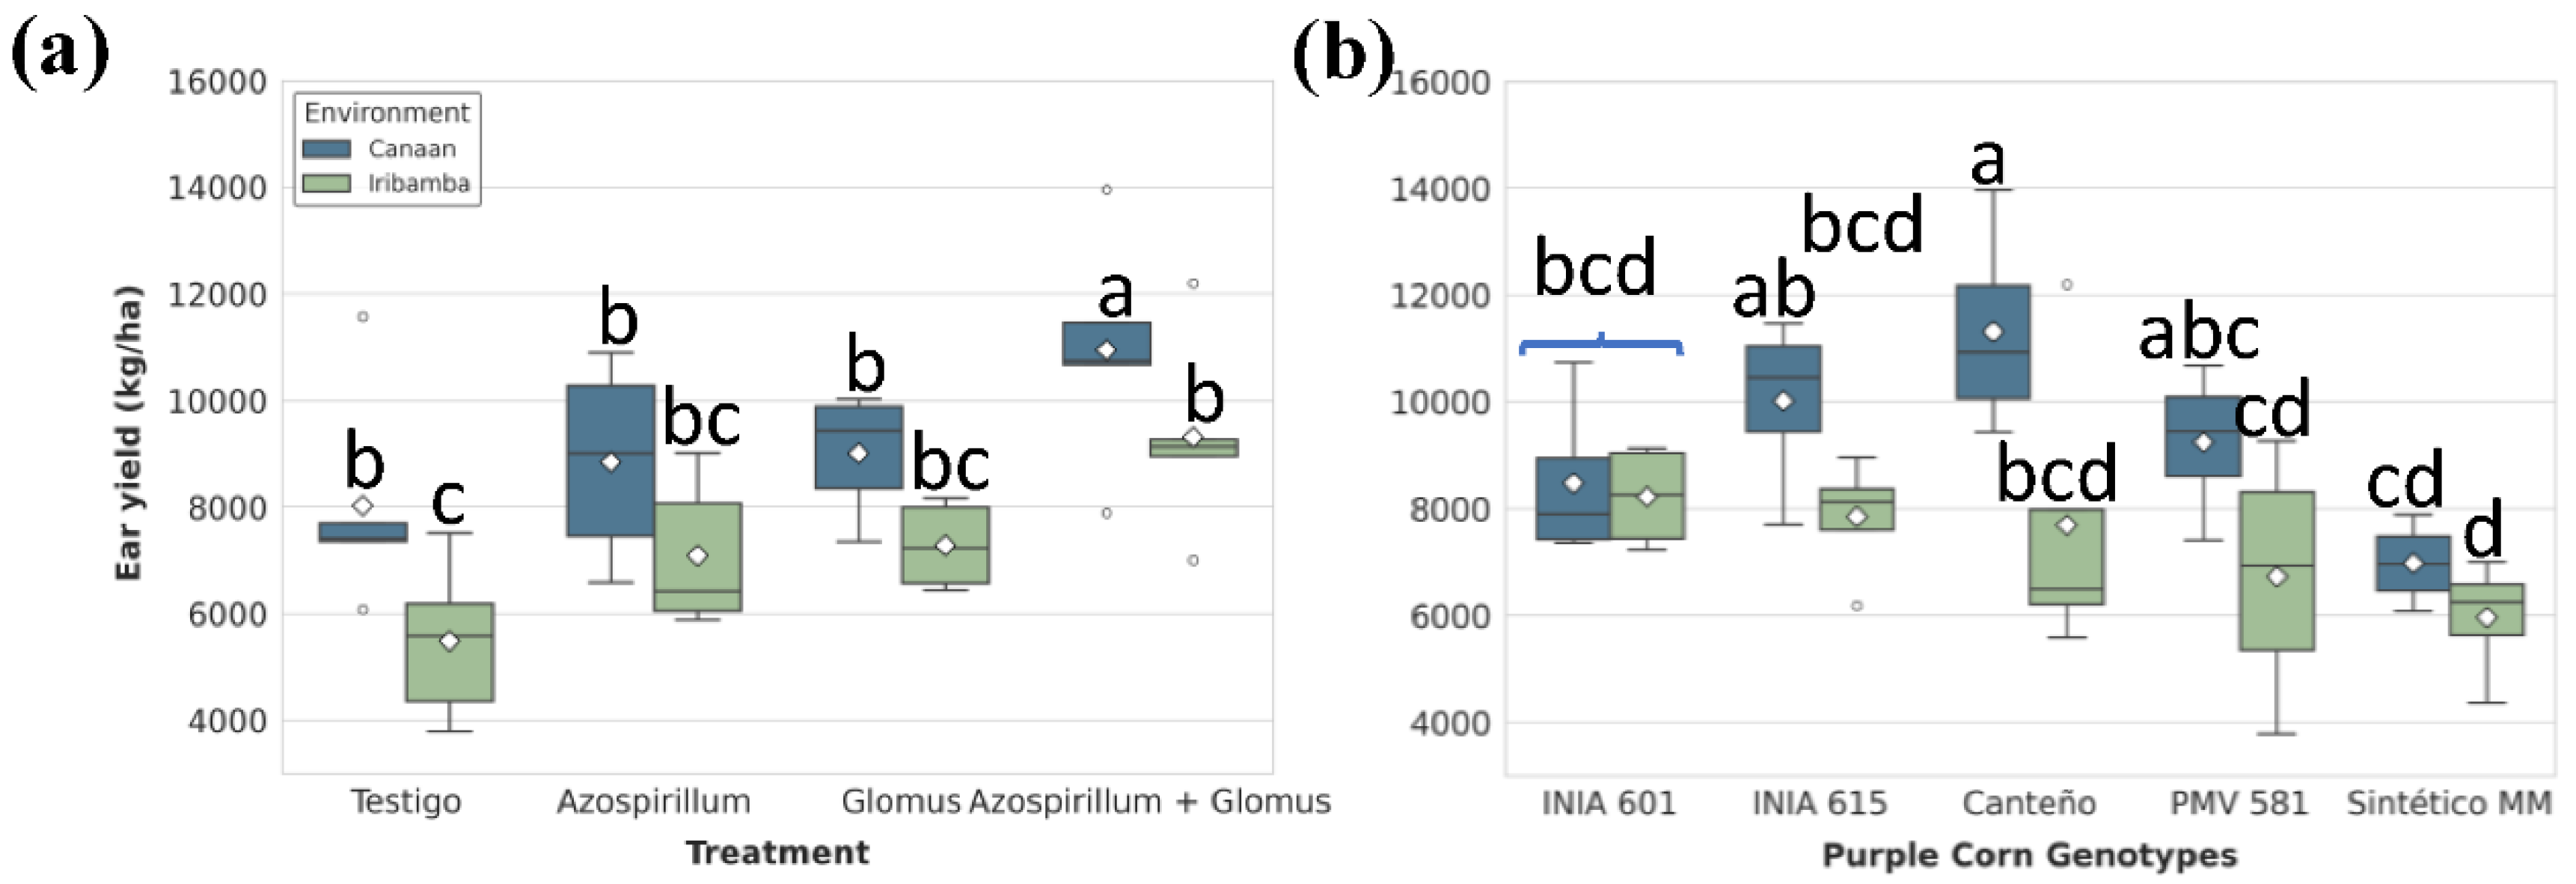
Figure 8.
Significant effects of (A) treatments and (B) genotype-by-environment interaction on husk yield (kg/ha). Box plots show the distribution (IQR, median, whiskers) and mean (diamond), with outliers (circles) indicated. Different lowercase letters above the boxes denote statistically significant differences between means based on Tukey's HSD test (P<0.05).
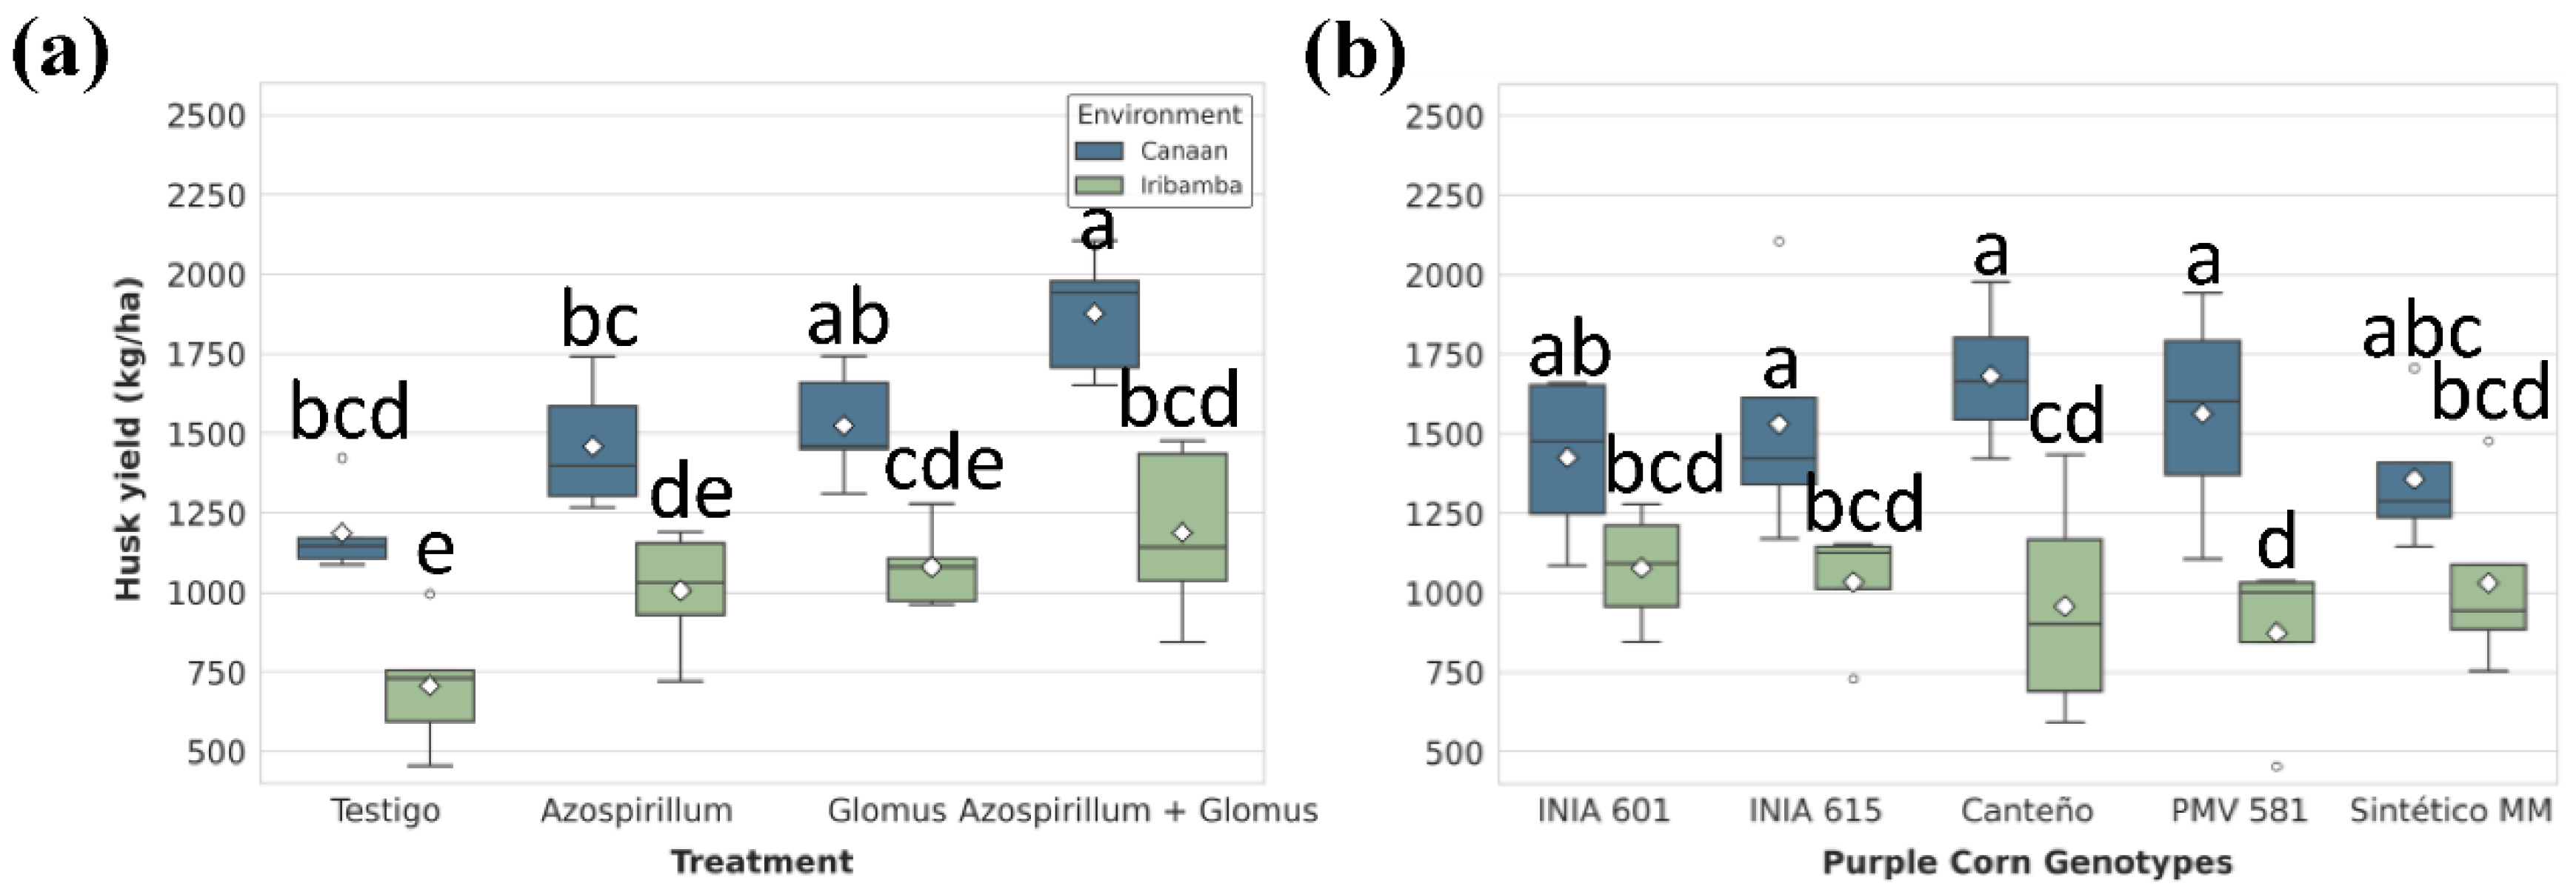
Figure 9.
Significant effects of (A) treatments and (B) genotype-by-environment interaction on thousand kernel weight (g). Box plots show the distribution (IQR, median, whiskers) and mean (diamond). Different lowercase letters above the boxes denote statistically significant differences between means based on Tukey's HSD test (P<0.05).
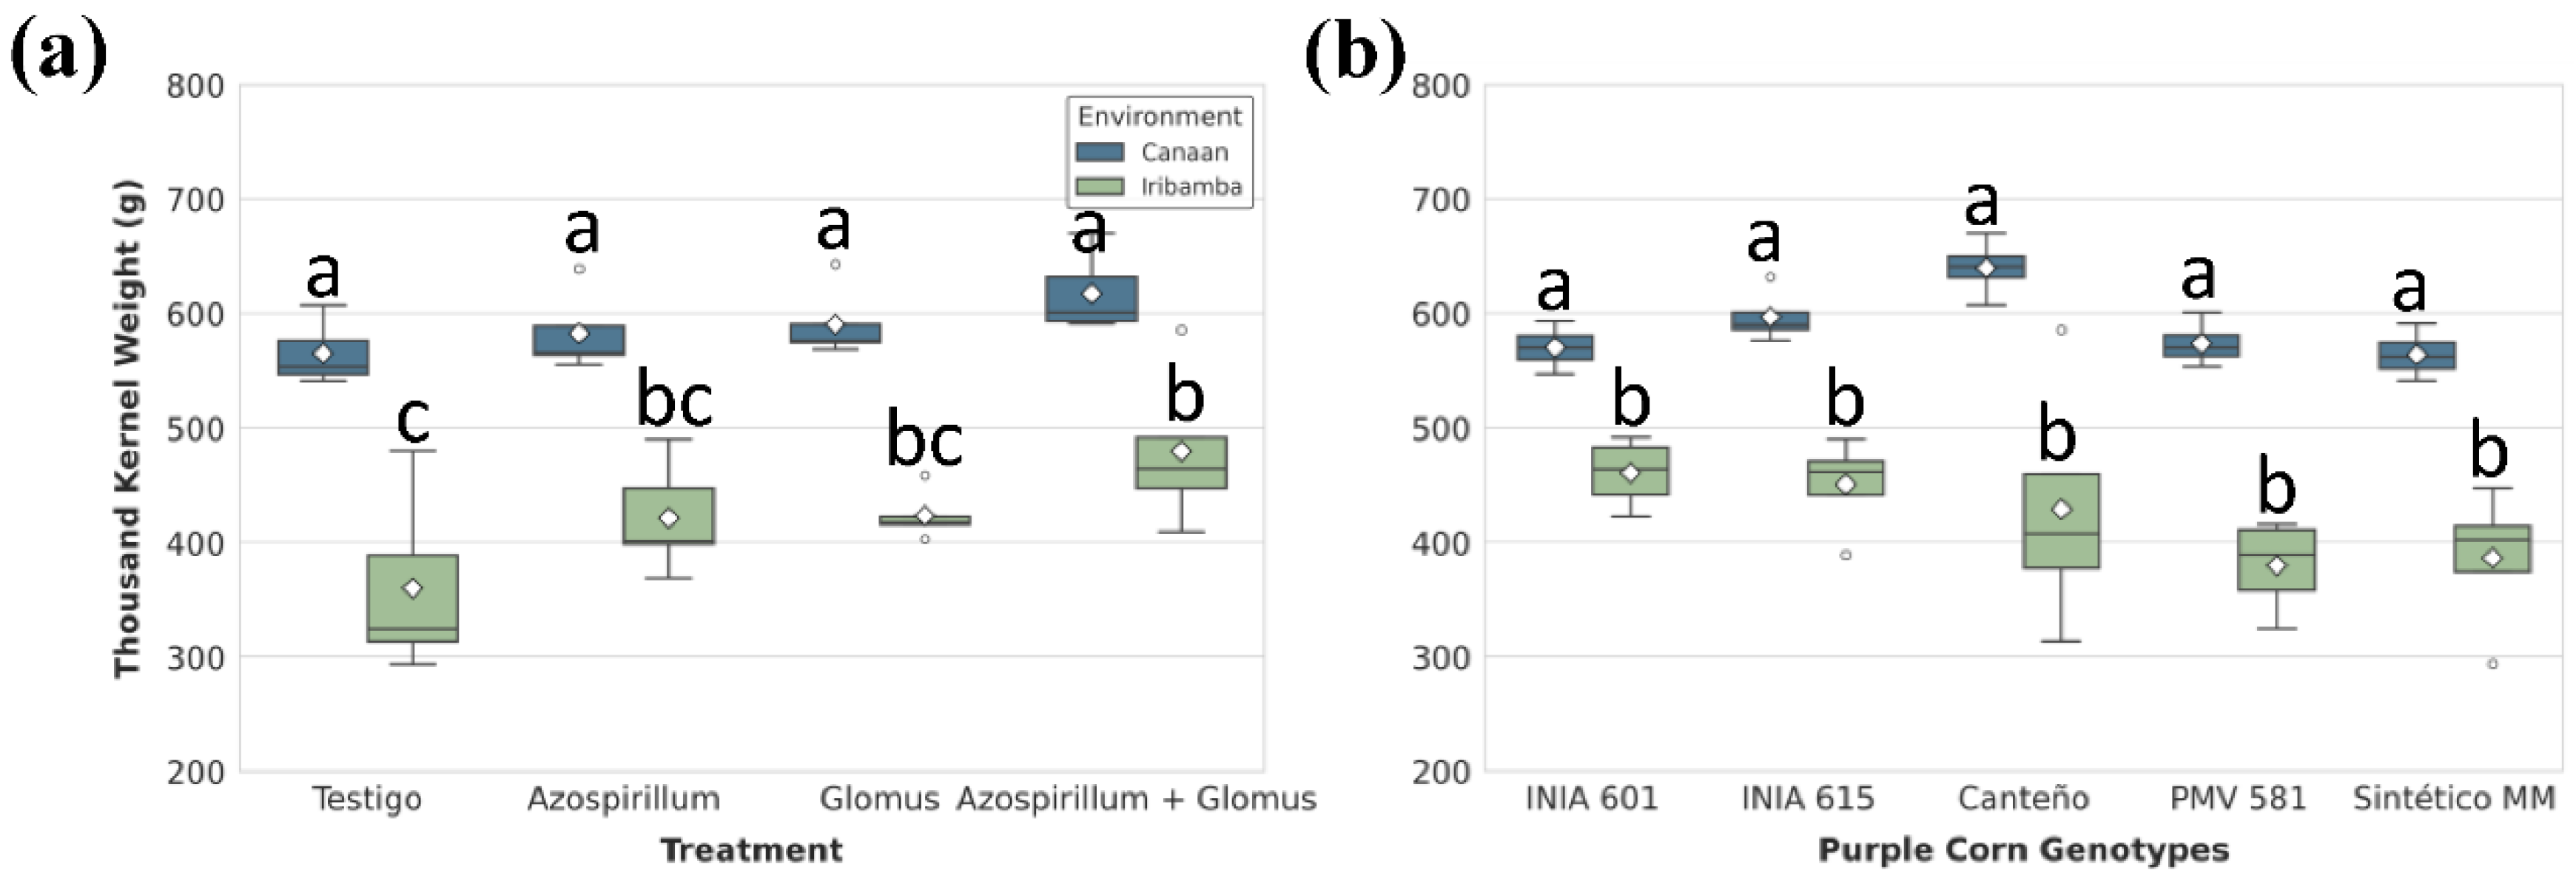
Figure 10.
Significant effects of (A) treatments and (B) genotype-by-environment interaction on grain yield (kg/ha). Box plots show the distribution (IQR, median, whiskers) and mean (diamond). Different lowercase letters above the boxes denote statistically significant differences between means, and brackets show same group based on Tukey's HSD test (P<0.05).
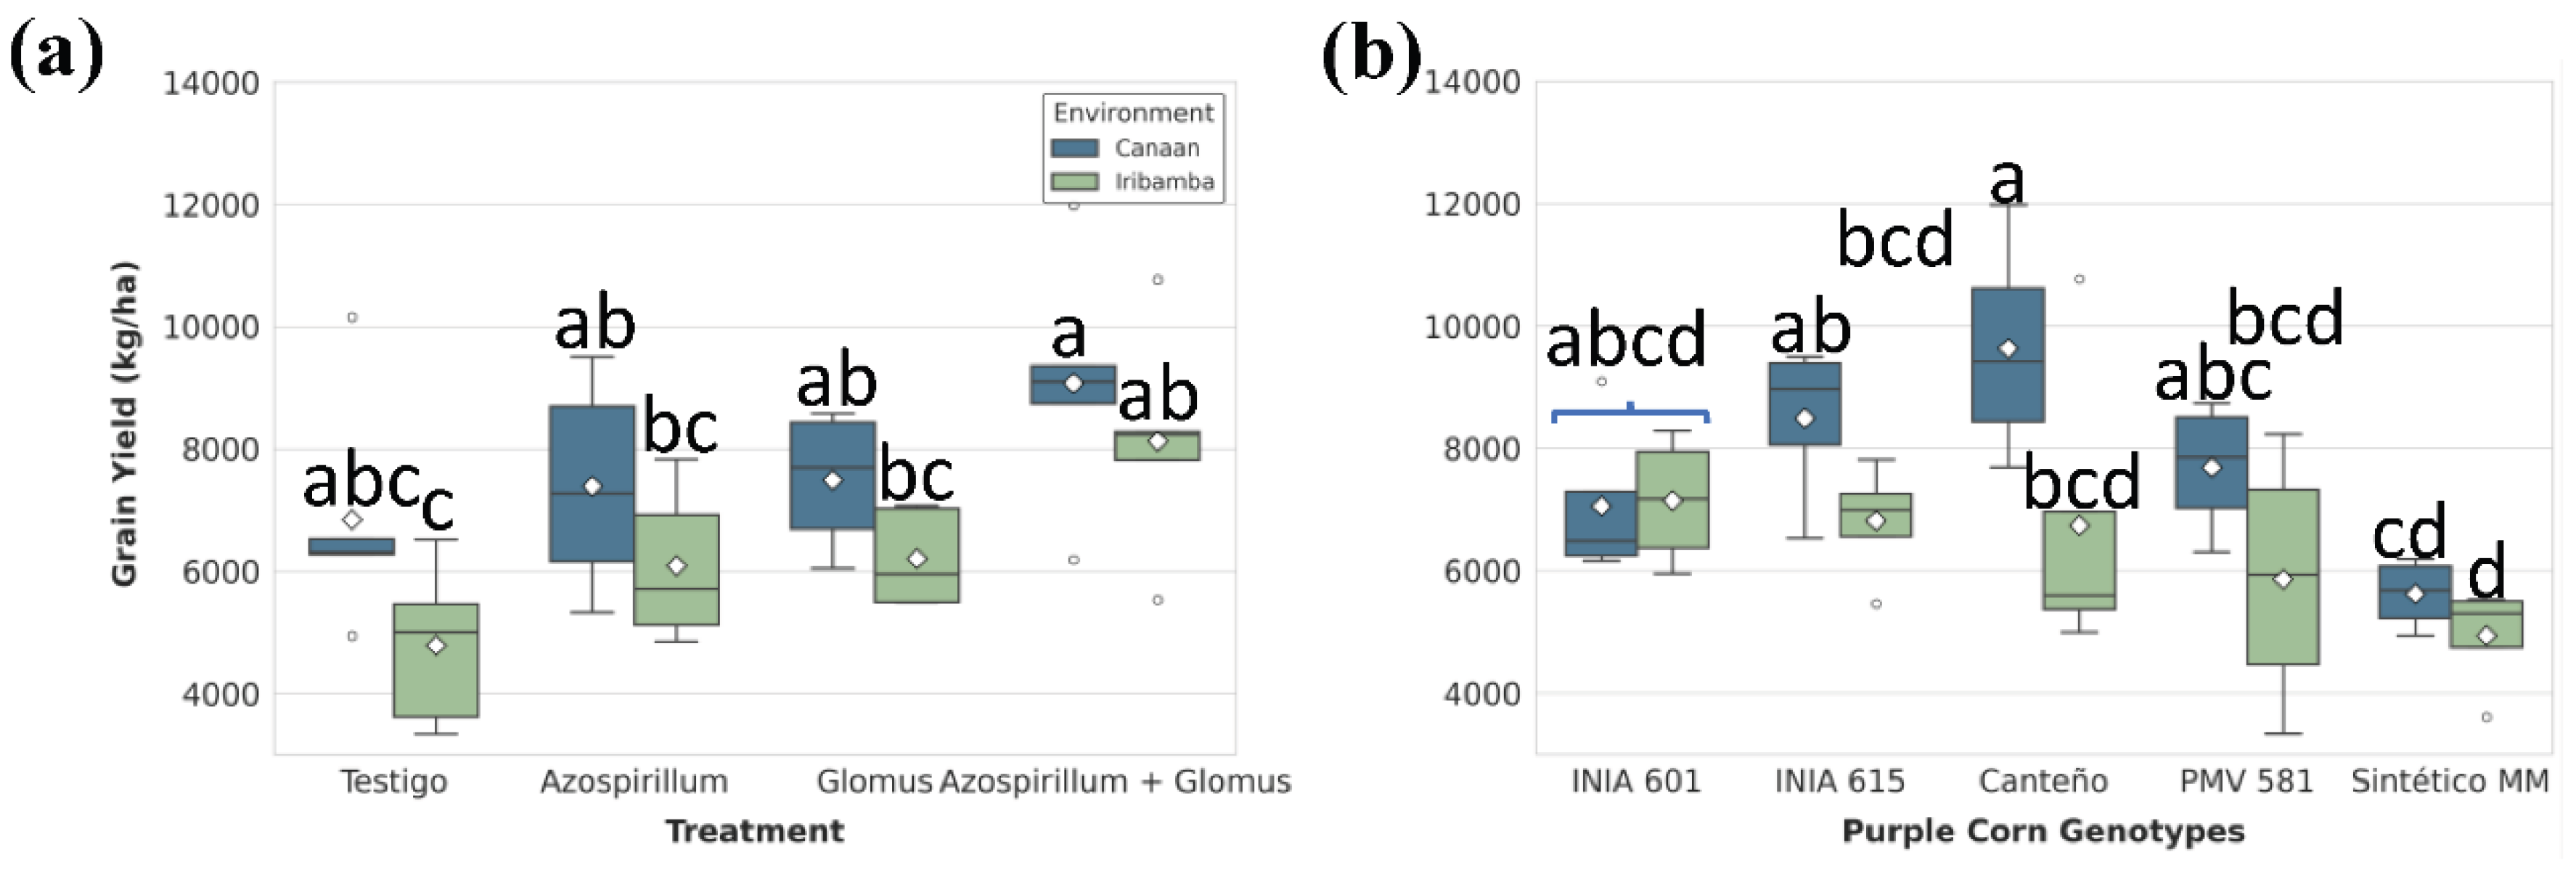

Table 2.
Physicochemical characterization of the soil in Canaán and Iribamba locations.
| Variable | Units | Canáan | Iribamba | Interpretation |
|---|---|---|---|---|
| pH | - | 7.80 | 7.6 | Moderately alkaline |
| Electrical Conductivity (EC) | mS/m | 13.10 | 83.1 | Normal |
| Carbonate (CO3) | % | 0.00 | 0.00 | Normal |
| Organic Matter (OM) | % | 2.30 | 1.8 | Normal |
| Aviable Phosphorus (P) | mg/kg | 15.79 | 12.99 | Medium |
| Aviable Potassion (K) | mg/kg | 380.26 | 380.99 | High |
| Total Nitrogen (Nt) | % | 0.12 | 0.09 | Poor |
| Texture | - | Fr | Fr | Franco |
| Cation Exchange Capacity (CEC) | Cmol(+)/kg | 46.48 | 43.77 | Very High |
| Ca++ | Cmol(+)/kg | 37.93 | 35.54 | Very High |
| Mg++ | Cmol(+)/kg | 6.10 | 3.79 | Low |
| K+ | Cmol(+)/kg | 1.99 | 1.82 | High |
| Na+ | Cmol(+)/kg | 0.46 | 2.62 | Normal |
Disclaimer/Publisher’s Note: The statements, opinions and data contained in all publications are solely those of the individual author(s) and contributor(s) and not of MDPI and/or the editor(s). MDPI and/or the editor(s) disclaim responsibility for any injury to people or property resulting from any ideas, methods, instructions or products referred to in the content. |
© 2025 by the authors. Licensee MDPI, Basel, Switzerland. This article is an open access article distributed under the terms and conditions of the Creative Commons Attribution (CC BY) license (http://creativecommons.org/licenses/by/4.0/).
Copyright: This open access article is published under a Creative Commons CC BY 4.0 license, which permit the free download, distribution, and reuse, provided that the author and preprint are cited in any reuse.


