
Submitted:
19 May 2025
Posted:
20 May 2025
You are already at the latest version
Abstract
Although many plant families are predominantly mycorrhizal, few symbiotic relation-ships between plants and arbuscular mycorrhizal fungi (AMF) have been thoroughly studied. Mycorrhized plants tend to exhibit greater tolerance to soil-borne pathogens and enhanced plant defence. Legumes, including common bean (Phaseolus vulgaris L.), are es-sential sources of protein globally. To improve common bean productivity, identifying ef-ficient native microsymbionts is crucial. This study aimed to identify native AMF associ-ated with common bean roots that could act as biostimulants and protect against soil diseases under varying environmental conditions. Agronomic trials were conducted at MBG-CSIC (Pontevedra, Spain) in 2021 and 2022, testing combinations of nitrogen fertili-zation, Burkholderia alba, Trichoderma harzianum, and a control. Traits such as nodulation, biomass, plant vigour, disease severity, nutrient content, and yield were evaluated. Four AMF species across three genera were identified. No consistent pattern was observed in AMF influence on agronomic traits. However, reduced mycorrhization in 2022 was asso-ciated with decreased nodulation, likely due to higher temperatures. Surprisingly, yields were higher in 2022 despite lower colonization. These findings suggest that intelligent use of AMF could reduce pesticide use, enhance sustainability, and promote healthier food systems. Continued research and conservation efforts are essential to optimize their bene-fits in legume production.
Keywords:
Agriculture
; biostimulants
; crop diseases
; environmental conditions
; legumes
; microbiota
; mycorrhizae
; plant breeding
1. Introduction
Soil is a non-renewable resource and acts as one of the vital life-supporting components of the biosphere. Beneficial microorganisms play a fundamental role, especially the arbuscular mycorrhizal fungi (AMF), nitrogen-fixing microorganisms and plant growth promoting rhizobacteria (PGPR) [1,2]. These influence not only the development and growth of plants, but also the contribution to the protection of the plant against soil pathogens [3]. Mycorrhizal fungi form a mutualistic relationship with the roots of many plant species. AMF formed primarily by fungi belonging to the phylum Glomeromycota, penetrate the root cells of most vascular plants, forming branching structures called arbuscules. These fungi enhance plant nutrient uptake, particularly phosphorus, and contribute to soil aggregation and stability. Relatively few of the mycorrhizal relationships between plant species and fungi have been examined to date, but 95% of the plant families are predominantly mycorrhizal either in the sense that most of their species associate beneficially with mycorrhizae or are absolutely dependent on mycorrhizae. Mycorrhized plants are often tolerant to diseases caused by microbial soil-borne pathogens and can assist in plant defence both above and belowground, since mycorrhizae have been found to excrete enzymes that are toxic to soil pathogens of crops. By facilitating nutrient uptake, enhancing plant resilience, and influencing ecosystem dynamics, mycorrhizae contribute significantly to plant health and agrosystems functions. The resident mycorrhizae benefit from a share of the sugars and carbon produced during photosynthesis, while the plant effectively accesses water and other nutrients, such as nitrogen and phosphorus, crucial to promote the plant grow under different agrosystems [4].
Today, as in the past, common global problems are arising, such as feeding a rapidly growing human population. The author [5] was perhaps the first to pose the problem of population growth at a rate greater than the human capacity to feed growing population. His predictions were not fulfilled due to the technological advances of the 19th and 20th centuries and the discovery of new resources. In the case of agriculture, persists currently the problem to provide secure and healthy food for the increasing human population that involve scientists to find innovative and effective tools to enhance sustainability while reducing the negative environmental impact due to agricultural production. Currently the need to feed a growing population favoured the use of synthetic chemical fertilizers; more than a quarter of the world current population depends on the use of these fertilizers to increase crops yield [6].
Legumes provide a rich source of proteins for human nutrition. The common bean (Phaseolus vulgaris L.) is among the three most important legumes worldwide along with soybean (Glycine max) and peanut (Arachis hypogaea) [7]. In Europe, a large area of snap and dry bean is cultivated producing 1500000 Mg in 2020 being 166000 Mg produced in Spain [8,9].
To increase common bean production is crucial to extend the identification of new competitive and efficient bean microsymbionts (µ-symbionts). Cultivation of legumes can safe huge amounts of environment polluting nitrogen fertilizers decreasing N2O emissions as well as protecting ground and surface water resources from toxicity while improving human health and soil fertility, contributing globally to the welfare of Mankind as a whole. In this context up to 20 rhizobial species including alpha- and beta-Proteobacteria have been described as bean µ-symbionts. The use of N-fixing bacteria is currently in use, especially in soybeans [10,11], with Bradyrhizobium being the most common genus [12]. However, there is not a generalized use of other N-fixing bacteria due to their specialization in the symbiotic association with legume species, being a priority the availability of promiscuous bacteria capable of nodulating roots of different legume species.
The use of biostimulants in crop production is a growing methodology [13,14,15,16]. There is also a trend towards the use of growth-promoting microbiota, including Trichoderma, mycorrhizae and even their combinations [17], but not including N-fixing bacteria. Mycorrhizal fungi - N2 fixing bacteria and / or phosphorus solubilizers, produce additive effects, of particular importance for the development of more yielding crops, of better phytosanitary quality and to increase the content of organic matter in the soil. These microorganisms basically work on the supply of nitrogen and phosphorus to the plant. Other important functions are more abundant root development and protective effect against fungal root diseases.
The initial purpose of this research was to study the effect of three factors (Nitrogen fertilization, inoculation with Trichoderma harzianum and inoculation with Burkholderia alba) on the agricultural performance of two common bean genotypes (Galaica and Matterhorn) in different years. During the development of the experiment, the opportunity arose to study the native AMF of the MBG-CSIC soils to assess their effect on the agricultural performance of bean plants and the possible interaction with the factors studied. Accordingly, the objective of this research was to identify the native AMF associated to the roots of common bean that could have an effect as biostimulants of crop grow with protective effect against soil diseases with the goal of a more sustainable production and to study the environmental factors that affect the root colonization.
2. Materials and Methods
Bean Genotypes
The Galaica and Matterhorn varieties of common bean, from the germplasm collection of the Biology of Agrosystems Group at the MBG-CSIC, were used in the field trials. Galaica, released in 2018 (plant variety 20170135, registered at the Spanish Office for Plant Varieties) belongs to the international market class ‘Favada’ [18] of the Andean genetic pool. It has indeterminate climbing habit (type IV, [19]), very large white seed and very late vegetative cycle. Matterhorn [20] is derived from the cross Alpine x 90012. It belongs to the ‘Great Northern’ international market class of the Mesoamerican genetic pool and was released in 1998. It has an upright type II growth habit [19], is disease- resistant and high-yielding with early to mid-season maturity and medium sized seeds (Figure 1).
Field Trials and Traits Evaluated
The agronomic trials were conducted in 2021 and 2022 at the experimental field of the MBG-CSIC (42°4′ N, 8°34′ W, 85 masl). The texture of the soil is sandy loam 62.0% sand, 26.6% silt and 11.4% clay, with pH 5.7 (H2O 1:2:5), organic matter content 4.1%, available P 140.8 ppm (Olsen method), assimilable K 156.4 ppm (ClNH displacement), and exchangeable Mg 51.1 ppm (ClNH displacement). The seeds of Galaica and Matterhorn genotypes were inoculated with Burkholderia alba sp. nov [21] a symbiotic nitrogen fixing bacteria and the beneficial fungus for the plants Trichoderma harzianum Rifai.
The experimental plot had 0.75 m2, the distance between rows was 0.50 m and between bean plants 0.10 m, 15 plants were grown in each plot, with two replications. Among the bean plots inoculated with bacteria, three rows of maize were planted as a barrier, since the bacteria is not able to propagate across the maize roots.
A control check and three single factors, and their combinations, were included in the experiments:
0: control check
Single factors:
N: nitrogen fertilization (40 kg ha−1)
T: Trichoderma harzianum
B: Burkholderia alba
Combined factors:
N-T
N-B
T-B
N-T-B
The proportion of mycorrhization (MP, %) was determined in the plots that presented mycorrhized plants.
The following agricultural traits were determined, based on a plot average:
Number of nodules (NN)
Fresh weight of nodules (FWN) (g)
Dry weight of aerial part (DWA) (g)
Dry weight of root (DWR) (g)
Plant vigour (PV) (1-5)
Plant with fungi (PF) (%)
Disease severity at flowering (DSF) (%)
Disease severity in pod (DSP) (%)
Leaf nitrogen content (LNC) (mg N/g leaf)
Leaf phosphorus content (LPC) (mg P/g leaf)
Pods/plant (PP)
Seeds/pod (SP)
Plant yield (PY) (g)
100 seeds weight (SW) (g)
Seed water absorption (WA) (%)
Seed tegument proportion (TP) (%)
Yield (Y) (kg/ha)
Daily environmental conditions were recorded by the meteorological station at the MBG-CSIC (connected to the AEMET – Spanish National Meteorological Agency):
Rainfall (R)
Maximum temperature (MT)
Growing Degree-Days (GDD)
GDD or heat units were calculated as follows: GGD= ∑(MT-BT), where BT is the base temperature, in the case of the common bean it is 10ºC. GDD frequently is used to describe the timing of biological processes and to estimate the growth and development of crops during the growing season, in this case May-September, additionally, it can be used retrospectively to calculate the current growth stage of a crop [22].
Samples of fine roots of five bean plants were collected from each plot at the MBG-CSIC, placed in bags, preserved on 70 % ethanol and sent to the EFA-DEPO for the identification of native AMF and the assessment of the percentage of colonized roots.
Molecular Methodology
Identification of natural AMF species was made by amplification and sequencing of the partial small subunit (SSU) ribosomal RNA gene. All PCR experiments were realized using ADN preparations consisting of pooled roots of each plot, DNA extractions from 32 root samples were carried out in 2021 and 2022. For each sample, fresh root was placed in a PCR tube and total DNA was extracted using the E.Z.N.A® Fungal DNA Mini Kit (Omega Bio-tek, Inc.). All samples were analysed by triplicate.
The partial small subunit (SSU) ribosomal RNA gene was amplified using nested PCR [23] with the universal primers NS1 and NS4 in the first round and AML1 and AML2 in the second.
In the first reaction one µL of the DNA template was introduced into a microcentrifuge tube containing one PuReTaqM Ready-To-Go™ PCR Bead (GE Healthcare) and 0.5 µL of each primer (10 µM), and made up with sterile water to a final volume of 25 µL. SSU amplification reactions were performed in a PCR thermocycler (Biometra) under the following conditions: one cycle at 94°C for 3 min followed by 30 cycles at 94°C for 30 s, 40ºC for 1 min, 72°C for 1 min; and a final cycle at 72°C for 10 min. The first PCR product was used in a second PCR reaction using the primers AML1 and AML2 with the following conditions: initial denaturation at 3 min for 94ºC, 30 cycles of 1 min at 94°C, 1 min at 50ºC and 1 min at 72ºC followed by a final extension of 10 min at 72ºc [24] (Lee et al., 2008). The PCR products were electrophoresed in a 2% agarose gel (w/v) in 0.5 X TBE at 120 volts. In each assay, a 100 bp standard ladder (marker XIV, Roche Diagnostics) was also run. The gels were stained with GelRed™ (Biotium Inc., California), and examined under a UV transilluminator.
Products of PCR obtained by AML1 and AML2 primers were purified by using High Pure PCR Product Purification Kit (Roche Applied Science). Sequencing reactions were conducted using the BigDye® Terminator v3.1 Cycle Sequencing Kit (Applied Biosystems) in a thermocycler under the following conditions: 96 ºC for 1 min, 25 cycles at 96 ºC for 10 sec, 50 ºC for 5 s, and 60ºC for 4 min. The products from sequencing reactions were precipitated in absolute ethanol, then denaturized by using the Template Suppression Reagent (Applied Biosystems) at 94 ºC for 3 min and loaded in an ABIPrismTM 3500 Genetic Analyzer (Applied Biosystems). The sequences were analysed with the program Sequencing Analysis 5.1.
The sequences generated in this study were compared with related sequences from NCBI’s GenBank sequence database using the megablast algorithm in the BLASTn program [25]. For phylogenetic analysis highly, similar sequences (percentage of sequence identity of 99-100%) were added to the alignments. All sequences were assembled, trimmed to ensure that all had the same start and end points, added to the corresponding outgroup, carefully checked visually using BioEdit v. 7.0.9 software [26], and aligned using the multisequence alignment ClustalW program (with manual adjustment) [27] included in the BioEdit software.
Percentage of Colonization by Mycorrhiza-Forming Fungi
To estimate colonization by mycorrhiza-forming fungi, the clarification and staining method proposed by Phillips and Hayman [28] was used, but without phenol. Roots were clarified in 10% KOH in water (w/v) and kept in a water bath at 90°C for about 1 hour. Clarification was completed by treating the roots with 10 volume hydrogen peroxide for about two hours. After removal of the hydrogen peroxide, the roots were immersed in 0.1 N HCl for a few min at room temperature. Finally, they were stained with 0.05 % trypan blue in lactoglycerol in a water bath at 90°C for 5 min.
To quantify the percentage of root colonized by mycorrhiza-forming fungi, the root/reticulum intersection method established by [29] was used. Each stained root sample was placed on a plate with a grid of 1.23 x 1.23 cm cells grid. The plate was placed under a stereomicroscope and points of intersection between the root and the lattice were observed, recording at each point the presence or absence of any of the characteristic structures of the fungus (arbuscules, hyphae and vesicles). The percentage of intersections showing mycorrhization with respect to the total number of intersections counted is considered as the percentage of colonized root. A minimum of 100 intersection points per sample were observed to achieve an accuracy of ±3% [30].
3. Results
The native AMF identified in the plant roots in the years of the experiments (2021 and 2022) are displayed in the Table 1.
The genetic differences between Galaica and Matterhorn genotypes are considerable, since they belong to different gene pools, as already mentioned. Galaica, as a germplasm belonging to the Andean gene pool, has a type IV indeterminate climbing and very aggressive growth habit, therefore its biological cycle is very long. On the other hand, Matterhorn, from the Mesoamerican gene pool, has a type II determinate erect growth habit, and its biological cycle is short. In the experiment of 2021, the beginning of flowering was at 48 days after sown on average in Matterhorn and 65 days in Galaica. In 2022, the beginning of flowering of Matterhorn was 45 days and 71 days in Galaica (data not displayed).
The Table 2 displays the experimental design of the study, including the different factors, the mycorrhizal fungi identified in each experimental plot and the agricultural performance of the two bean genotypes studied in 2021. The percentage of root colonized by mycorrhiza-forming fungi reached a high value of 53.5 % on average. Glomus sp. displayed three values over 70 % in the bean genotype Matterhorn, Acaulospora sp. showed two scores over 70 % in Matterhorn and Galaica, and R. clarus scored more than 70 % in Galaica. The percentage of mycorrhization refers to native mycorrhizae in general, not only to the identified species, since there may be other species that we have not detected.
There was a notable difference in grain size between the bean genotypes studied due to their wide genetic differences. The Andean pool is characterized by large or extra-large grain, in the case of Galaica, as displayed in Table 2, the mean grain weight was 80.8 g 100 seeds-1, ranging from 70.5 to 97.8 g 100 seeds-1. In contrast, Matterhorn showed the characteristic medium grain size of the Mesoamerican pool, with a mean of 27.9 g 100 seeds-1, and a range of variation from 21.8 to 38.6 g 100 seeds-1.
The range of variation of the number of nodules was 4-357 per plant, with a mean of 84.8. In general, Matterhorn had more nodules per plant than Galaica; the plots inoculated with B. alba alone o combined with other factors, displayed a high number of nodules, highlighting the combination of N-B factors in Galaica with 357 nodules in a plot with the native mycorrhizae Glomus. However, the highest value of dry weight of nodules 1.58 corresponded to Matterhorn, with N-B treatment and presence of F. mosseae.

Table 2.
Experimental design of the study, including the different factors in 2021, and agricultural performance of the bean genotypes.
Table 2.
Experimental design of the study, including the different factors in 2021, and agricultural performance of the bean genotypes.
| Plot | Rep | Factors | Bean genotypes | Mycorrhizal fungi | MP (%) | NN | FWN | DWA | DWR | PV | PF | DSF | DSP |
|---|---|---|---|---|---|---|---|---|---|---|---|---|---|
| 2021:3E-01 | 1 | T | MATTERHORN | Glomus sp. | 76 | 59 | 1.97 | 24.1 | 2.7 | 3 | 26.9 | 16.7 | 26.2 |
| 2921:3E-02 | 2 | T | MATTERHORN | Glomus sp. | 77 | 60 | 1.65 | 10.2 | 1.3 | 3 | 10.4 | 4.8 | 35.7 |
| 2021:3E-03 | 1 | T | GALAICA | Acaulospora sp. | 76 | 12 | 0.22 | 29.6 | 1.9 | 3 | 23.1 | 14.3 | 23.8 |
| 2021:3E-04 | 2 | T | GALAICA | Glomus sp. | 60 | 9 | 0.51 | 25.0 | 1.4 | 3 | 32.1 | 9.5 | 21.4 |
| 2021:3E-05 | 1 | T-N | MATTERHORN | Glomus sp. | 39 | 24 | 0.14 | 16.8 | 2.1 | 4 | 47.1 | 21.4 | 35.7 |
| 2021:3E-06 | 2 | T-N | MATTERHORN | Rhizophagus clarus | 46 | 140 | 5.15 | 21.1 | 4.5 | 4 | 33.3 | 33.3 | 42.9 |
| 2021:3E-07 | 1 | T-N | GALAICA | Rhizophagus clarus | 38 | 111 | 5.36 | 39.6 | 3.2 | 3 | 22.2 | 28.6 | 31.0 |
| 2021:3E-08 | 2 | T-N | GALAICA | Rhizophagus clarus | 24 | 18 | 0.71 | 26.2 | 2.6 | 3 | 23.1 | 21.4 | 31.0 |
| 2021:3E-09 | 1 | T-B | MATTERHORN | Glomus sp. | 58 | 127 | 4.26 | 13.8 | 1.8 | 3 | 29.2 | 11.9 | 19.1 |
| 2021:3E-10 | 2 | T-B | MATTERHORN | Gigaspora margarita | 44 | 121 | 2.43 | 14.5 | 1.9 | 3 | 14.3 | 4.8 | 9.5 |
| 2021:3E-11 | 1 | T-B | GALAICA | Rhizophagus clarus | 63 | 92 | 2.08 | 38.2 | 1.5 | 3 | 17.2 | 14.3 | 23.8 |
| 2021:3E-12 | 2 | T-B | GALAICA | Glomus sp. | 68 | 99 | 3.73 | 28.6 | 2.4 | 3 | 3.7 | 14.3 | 16.7 |
| 2021:3E-13 | 1 | T-N-B | MATTERHORN | Rhizophagus clarus | 56 | 91 | 1.70 | 17.8 | 1.5 | 5 | 42.9 | 7.1 | 47.6 |
| 2021:3E-14 | 2 | T-N-B | MATTERHORN | Paraglomus occultum | 30 | 113 | 3.13 | 37.0 | 4.2 | 5 | 33.3 | 7.1 | 47.6 |
| 2021:3E-15 | 1 | T-N-B | GALAICA | Rhizophagus clarus | 64 | 17 | 0.67 | 35.5 | 4.6 | 5 | 12.5 | 14.3 | 21.4 |
| 2021:3E-16 | 2 | T-N-B | GALAICA | Rhizophagus clarus | 50 | 4 | 0.08 | 45.4 | 2.4 | 5 | 10.7 | 14.3 | 11.9 |
| 2021:3E-17 | 1 | 0 | MATTERHORN | Acaulospora sp. | 70 | 9 | 0.09 | 27.5 | 2.7 | 2 | 44.0 | 9.5 | 88.1 |
| 2021:3E-18 | 2 | 0 | MATTERHORN | Glomus sp. | 74 | 104 | 3.86 | 23.1 | 2.4 | 3 | 18.5 | 4.8 | 92.9 |
| 2021:3E-19 | 1 | 0 | GALAICA | Rhizophagus clarus | 72 | 64 | 1.30 | 29.2 | 0.8 | 3 | 34.6 | 21.4 | 40.5 |
| 2021:3E-20 | 2 | 0 | GALAICA | Acaulospora spinosa | 64 | 29 | 1.13 | 24.9 | 0.2 | 3 | 19.2 | 23.8 | 40.5 |
| 2021:3E-21 | 1 | N | MATTERHORN | Rhizophagus clarus | 57 | 146 | 5.42 | 33.7 | 3.9 | 4 | 32.0 | 9.5 | 100.0 |
| 2021:3E-22 | 2 | N | MATTERHORN | Rhizophagus clarus | 50 | 15 | 0.79 | 38.2 | 4.8 | 4 | 37.5 | 14.3 | 100.0 |
| 2021:3E-23 | 1 | N | GALAICA | Rhizophagus clarus | 61 | 10 | 0.15 | 30.3 | 2.2 | 3 | 22.2 | 35.7 | 54.8 |
| 2021:3E-24 | 2 | N | GALAICA | Rhizophagus clarus | 50 | 12 | 0.24 | 30.0 | 3.2 | 3 | 20.0 | 28.6 | 47.6 |
| 2021:3E-25 | 1 | B | MATTERHORN | Glomus sp. | 28 | 106 | 1.90 | 12.0 | 1.9 | 2 | 14.8 | 35.7 | 73.8 |
| 2021:3E-26 | 2 | B | MATTERHORN | Gigaspora sp. | 22 | 66 | 2.47 | 9.1 | 2.0 | 2 | 25.0 | 16.7 | 81.0 |
| 2021:3E-27 | 1 | B | GALAICA | Glomus sp. | 56 | 62 | 1.08 | 33.1 | 1.6 | 3 | 6.7 | 31.0 | 47.6 |
| 2021:3E-28 | 2 | B | GALAICA | Glomus sp. | 42 | 218 | 4.72 | 25.5 | 2.3 | 3 | 10.0 | 21.4 | 42.9 |
| 2021:3E-29 | 1 | N-B | MATTERHORN | Funneliformis mosseae | 36 | 276 | 7.38 | 58.4 | 7.5 | 4 | 25.0 | 11.9 | 97.6 |
| 2021:3E-30 | 2 | N-B | MATTERHORN | Glomus sp. | 28 | 65 | 1.19 | 18.5 | 1.6 | 4 | 41.4 | 14.3 | 97.6 |
| 2021:3E-31 | 1 | N-B | GALAICA | Glomus sp. | 69 | 357 | 4.88 | 21.4 | 1.3 | 5 | 10.0 | 14.3 | 40.5 |
| 2021:3E-32 | 2 | N-B | GALAICA | Rhizophagus clarus | 65 | 77 | 3.46 | 52.8 | 2.8 | 5 | 6.9 | 14.3 | 42.9 |
| Mean | 53.5 | 84.8 | 2.308 | 27.84 | 2.54 | 3.5 | 23.43 | 17.04 | 47.92 | ||||
| Minimum | 22 | 4 | 0.08 | 9.1 | 0.2 | 2 | 3.7 | 4.8 | 9.5 | ||||
| Maximum | 77 | 357 | 7.38 | 58.4 | 7.5 | 5 | 47.1 | 35.7 | 100.0 | ||||
| Standard deviation | 16.5 | 80.1 | 1.971 | 11.62 | 1.41 | 0.9 | 11.93 | 8.95 | 28.14 |
Table 2.
Experimental design of the study, including the different factors in 2021, and agricultural performance of the bean genotypes (continuation).
Table 2.
Experimental design of the study, including the different factors in 2021, and agricultural performance of the bean genotypes (continuation).
| Plot | Rep | Factors | Bean genotypes | Mycorrhizal fungi | LNC | LPC | PP | SP | PY | SWa | WA | TP | Y |
|---|---|---|---|---|---|---|---|---|---|---|---|---|---|
| 2021:3E-01 | 1 | T | MATTERHORN | Glomus sp. | 54.9 | 3.62 | 20.3 | 4.4 | 23.8 | 29.7 | 122.5 | 13.9 | 1189 |
| 2921:3E-02 | 2 | T | MATTERHORN | Glomus sp. | 56.6 | 4.04 | 13.8 | 4.8 | 21.8 | 27.4 | 91.0 | 14.1 | 1091 |
| 2021:3E-03 | 1 | T | GALAICA | Acaulospora sp. | 41.0 | 2.79 | 9.5 | 3.2 | 19.1 | 97.8 | 124.3 | 19.8 | 954 |
| 2021:3E-04 | 2 | T | GALAICA | Glomus sp. | 36.3 | 2.59 | 16.3 | 3.6 | 35.9 | 85.1 | 94.2 | 19.0 | 1794 |
| 2021:3E-05 | 1 | T-N | MATTERHORN | Glomus sp. | 61.2 | 3.08 | 28.9 | 4.8 | 33.7 | 28.9 | 140.7 | 13.0 | 1683 |
| 2021:3E-06 | 2 | T-N | MATTERHORN | Rhizophagus clarus | 59.7 | 2.24 | 38.3 | 4.6 | 48.3 | 30.7 | 126.0 | 13.8 | 2414 |
| 2021:3E-07 | 1 | T-N | GALAICA | Rhizophagus clarus | 50.6 | 3.62 | 17.2 | 3.6 | 32.1 | 77.6 | 133.4 | 20.8 | 1606 |
| 2021:3E-08 | 2 | T-N | GALAICA | Rhizophagus clarus | 28.4 | 2.65 | 15.1 | 3.4 | 28.9 | 80.2 | 126.7 | 19.2 | 1445 |
| 2021:3E-09 | 1 | T-B | MATTERHORN | Glomus sp. | 53.4 | 3.52 | 20.3 | 5.6 | 26.8 | 34.4 | 87.3 | 13.5 | 1339 |
| 2021:3E-10 | 2 | T-B | MATTERHORN | Gigaspora margarita | 47.9 | 3.22 | 19.6 | 5.4 | 30.3 | 38.6 | 90.4 | 14.8 | 1516 |
| 2021:3E-11 | 1 | T-B | GALAICA | Rhizophagus clarus | 31.8 | 2.80 | 9.9 | 3.2 | 18.8 | 80.2 | 123.6 | 21.3 | 939 |
| 2021:3E-12 | 2 | T-B | GALAICA | Glomus sp. | 45.7 | 3.06 | 13.0 | 3.0 | 26.1 | 86.5 | 128.4 | 21.2 | 1303 |
| 2021:3E-13 | 1 | T-N-B | MATTERHORN | Rhizophagus clarus | 51.3 | 3.43 | 27.0 | 5.2 | 34.8 | 26.8 | 145.4 | 13.9 | 1740 |
| 2021:3E-14 | 2 | T-N-B | MATTERHORN | Paraglomus occultum | 46.5 | 2.80 | 25.2 | 5.6 | 31.5 | 28.9 | 139.0 | 13.8 | 1576 |
| 2021:3E-15 | 1 | T-N-B | GALAICA | Rhizophagus clarus | 36.2 | 2.94 | 15.9 | 3.2 | 26.4 | 78.0 | 132.8 | 20.0 | 1322 |
| 2021:3E-16 | 2 | T-N-B | GALAICA | Rhizophagus clarus | 27.8 | 2.89 | 19.6 | 3.2 | 50.4 | 86.4 | 130.6 | 18.9 | 2521 |
| 2021:3E-17 | 1 | 0 | MATTERHORN | Acaulospora sp. | 27.6 | 1.93 | 12.2 | 4.0 | 14.1 | 26.2 | 124.5 | 14.8 | 706 |
| 2021:3E-18 | 2 | 0 | MATTERHORN | Glomus sp. | 51.5 | 3.47 | 14.1 | 5.2 | 18.6 | 25.8 | 124.9 | 15.9 | 928 |
| 2021:3E-19 | 1 | 0 | GALAICA | Rhizophagus clarus | 29.5 | 2.33 | 10.6 | 2.6 | 14.5 | 78.0 | 132.2 | 20.6 | 724 |
| 2021:3E-20 | 2 | 0 | GALAICA | Acaulospora spinosa | 35.7 | 2.25 | 10.7 | 2.6 | 18.3 | 83.2 | 131.9 | 21.2 | 915 |
| 2021:3E-21 | 1 | N | MATTERHORN | Rhizophagus clarus | 41.3 | 2.20 | 16.5 | 4.4 | 16.8 | 25.3 | 125.5 | 16.4 | 839 |
| 2021:3E-22 | 2 | N | MATTERHORN | Rhizophagus clarus | 47.7 | 3.12 | 22.2 | 5.2 | 21.2 | 24.3 | 60.3 | 30.2 | 1061 |
| 2021:3E-23 | 1 | N | GALAICA | Rhizophagus clarus | 34.3 | 2.44 | 5.3 | 2.6 | 5.7 | 72.5 | 141.5 | 22.4 | 286 |
| 2021:3E-24 | 2 | N | GALAICA | Rhizophagus clarus | 38.1 | 2.49 | 6.3 | 2.2 | 9.4 | 81.7 | 136.1 | 21.5 | 472 |
| 2021:3E-25 | 1 | B | MATTERHORN | Glomus sp. | 44.9 | 3.74 | 6.9 | 5.2 | 7.6 | 25.6 | 109.2 | 15.7 | 378 |
| 2021:3E-26 | 2 | B | MATTERHORN | Gigaspora sp. | 54.4 | 4.50 | 13.0 | 5.0 | 17.0 | 28.7 | 106.3 | 22.8 | 851 |
| 2021:3E-27 | 1 | B | GALAICA | Glomus sp. | 34.3 | 2.78 | 4.9 | 2.2 | 5.7 | 70.5 | 142.7 | 22.3 | 283 |
| 2021:3E-28 | 2 | B | GALAICA | Glomus sp. | 31.5 | 1.86 | 8.9 | 3.0 | 16.7 | 80.9 | 129.7 | 21.2 | 835 |
| 2021:3E-29 | 1 | N-B | MATTERHORN | Funneliformis mosseae | 42.7 | 2.87 | 17.9 | 5.4 | 17.0 | 22.9 | 145.7 | 15.9 | 851 |
| 2021:3E-30 | 2 | N-B | MATTERHORN | Glomus sp. | 53.1 | 2.96 | 18.8 | 5.4 | 20.8 | 21.8 | 161.2 | 15.8 | 1038 |
| 2021:3E-31 | 1 | N-B | GALAICA | Glomus sp. | 36.0 | 3.05 | 9.8 | 2.8 | 13.0 | 76.9 | 131.6 | 22.3 | 650 |
| 2021:3E-32 | 2 | N-B | GALAICA | Rhizophagus clarus | 29.0 | 2.20 | 14.4 | 2.8 | 20.3 | 77.1 | 134.9 | 19.2 | 1013 |
| Mean | 42.52 | 2.922 | 15.70 | 3.98 | 22.66 | 124.20 | 18.41 | 1133.2 | |||||
| Minimum | 27.6 | 1.86 | 4.9 | 2.2 | 5.7 | 60.29 | 13 | 283 | |||||
| Maximum | 61.2 | 4.50 | 38.3 | 5.6 | 50.4 | 161.2 | 30.2 | 2521 | |||||
| Standard deviation | 10.22 | 0.611 | 7.34 | 1.14 | 10.78 | 20.66 | 3.90 | 538.9 |
a: the mean, maximum, minimum and standard deviation for Seed Weight are not displayed since Galaica and Matterhorn belong to different genetic pools and their seed size are very different.
Regarding the dry weight of the vegetative parts of the plants, aerial and root, the highest values, respectively, were 58.4 g and 7.5 g, both in Matterhorn, N-B treatment and F. mosseae. Plant vigour, visually estimated, generally presents the highest values in Galaica, with several mycorrhizae being present, especially R. clarus, and the N-B and also N-T-B factors.
The incidence of fungal diseases in the bean crop, was estimated visually using the proportion of plants with fungi, the disease severity at flowering and the disease severity in pod. Phytopathological analyses were carried out at the EFA-DEPO, identifying Fusarium solani, F. oxysporum, F. proliferatum, Alternaria sp. and Albifimbria verrucaria. The least affected plot was the one with Matterhorn genotype with T-B treatment and G. margarita, displaying 14.3% of plants with fungi and the minimum severity values in flowering (4.8%) and in pod (9.5%).
The nitrogen and phosphorus content in plant leaves are important variables from the point of view of plant physiology and crop growth. The highest values of both elements were found in the Matterhorn genotype. The maximum values of Nitrogen content have been 61.2 (mgN/gleaf) (N-T treatment and Glomus), 59.7 (mgN/gleaf) (N-T and R. clarus, and 56.6 (mgN/gleaf) (T and Glomus). Regarding the Phosphorus content, the highest values were 4.50 (mgP/gleaf) (B treatment and Gigaspora), 4.04 (mgP/gleaf) (T and Glomus) and 3.74 (mgP/gleaf) (B and Glomus).
The quality of the bean grain was assessed upon two traits: water absorption (%) and tegument proportion (%). The more water the grain absorbs, the better the cooking process will go, and the more product will be obtained for consumption. Both bean genotypes showed good results in several experimental plots. Matterhorn has presented values of 161.2 % (with Glomus sp. and N-B treatment), 145.4 % (with R. clarus and N-T-B), 140.7 % (with Glomus sp. and N-T) and 139.0 % (with P. occultum and N-T-B). Galaica has had its maximum water absorption values of 142.7 % (with Glomus sp. and B) and 141.5 % (with R. clarus and N). The proportion of grain tegument after soaking and before cooking is an important aspect for its consumption, because it indicates the palatability of the product, and reduced values of the proportion of tegument are preferred. Matterhorn has presented the best values of proportion of tegument in grains from several plots: 13.0 % (with Glomus sp. and N-T treatment), 13.5 % (with Glomus sp. and T-B), 13.8 % (with R. clarus and N-T and also with P. occultum and N-T-B) and 13.9 % (with Glomus sp. and T, and also with R. clarus and N-T-B). In the case of Galaica, the best value was 18.9 % (with R. clarus and N-T-B treatment).
The productivity of the two bean genotypes studied was estimated using three traits: pods per plant, production per plant and crop yield. The highest number of pods per plant corresponded to Matterhorn with 38.3 (N-T treatment and R. clarus). The average for Matterhorn was 19.7 pods/plant and for Galaica was 11.7 pods/plant, with the late genotype having the highest score of 19.6 pods/plant with N-T-B treatment and R. clarus. Productivity of grain per plant reached the value of 50.4 g in Galaica (N-T-B treatment and R. clarus) while in the case of Matterhorn it has reached a maximum of 48.3 g/plant with a N-T treatment and R. clarus). This is a very variable character, with a minimum of 5.7 g/plant in Galaica, with N treatment and R. clarus. Crop yield is one of the most important agricultural traits, as it is related, on the one hand, to the fitness of the plants, and on the other hand, to the economic relevance of the crop. The average yield was 1133.2 kg/ha, with a small difference between Matterhorn (1199.9 kg/ha) and Galaica (1066.5 kg/ha). Relevant yield values were obtained in Galaica with 2521 kg/ha (N-T-B treatment and R. clarus) and Matterhorn scoring 2414 kg/ha (N-T treatment and R. clarus).
The Table 3 shows the experimental design of the experiment, including the different factors, the mycorrhizal fungi identified in each experimental plot and the agricultural performance of the two bean genotypes studied in 2022. The percentage of root colonized by AMF showed low values, compared to the year 2021, with an average of 22.0 % and a maximum percentage of 45 % in P. ocultum with Matterhorn. There were three values of 30 % in R. clarus/Glomus sp. with Matterhorn, R. irregularis with Galaica and Gigaspora sp. with Matterhorn, and close values were scored by R. clarus/Glomus sp. in Matterhorn and Galaica, and Rhizophagus sp. in Galaica. As in 2021, there was a notable difference in grain size between the bean genotypes studied, in the case of Galaica, the mean grain weight was 86.5 g 100 seeds-1, ranging from 69.8 to 99.0 g 100 seeds-1. Matterhorn has a mean seed weight of 32.6 g 100 seeds-1, and a range of variation from 17.3 to 40.0 g 100 seeds-1.
Table 3.
Experimental design of the study, including the different factors in 2022, and agricultural performance of the bean genotypes.
Table 3.
Experimental design of the study, including the different factors in 2022, and agricultural performance of the bean genotypes.
| Plot | Rep | Factors | Bean genotypes | Mycorrhizal fungi | MP (%) | NN | FWN | DWA | DWR | PP | SP | PY | SWa | WA | TP | Y |
|---|---|---|---|---|---|---|---|---|---|---|---|---|---|---|---|---|
| 2022:2E-01 | 1 | T | MATTERHORN | Paraglomus occultum | 24 | 8 | 0.01 | 20.1 | 0.47 | 19.0 | 5.2 | 12.1 | 36.7 | 126.4 | 8.9 | 606 |
| 2022:2E-02 | 2 | T | MATTERHORN | Paraglomus occultum | 45 | 16 | 0.75 | 19.6 | 0.80 | 26.0 | 5.6 | 13.5 | 31.5 | 120.3 | 11.9 | 677 |
| 2022:2E-03 | 1 | T | GALAICA | Rhizophagus clarus | 22 | 29 | 0.52 | 55.7 | 1.91 | 11.0 | 1.2 | 20.9 | 82.5 | 126.4 | 9.6 | 1043 |
| 2022:2E-04 | 2 | T | GALAICA | Glomus sp. | 24 | 57 | 1.37 | 23.5 | 0.84 | 15.0 | 1.4 | 33.6 | 90.9 | 119.3 | 9.3 | 1680 |
| 2022:2E-05 | 1 | B-T | MATTERHORN | Rhizophagus clarus / Glomus sp. | 30 | 0 | 15.5 | 1.03 | 36.0 | 4.4 | 17.8 | 31.5 | 115.9 | 10.2 | 889 | |
| 2022:2E-06 | 2 | B-T | MATTERHORN | Glomus sp. | 25 | 133 | 0.13 | 9.5 | 1.48 | 24.0 | 4.2 | 5.0 | 24.5 | 158.4 | 252 | |
| 2022:2E-07 | 1 | B-T | GALAICA | |||||||||||||
| 2022:2E-08 | 2 | B-T | GALAICA | Glomus sp. | 15 | 64 | 1.08 | 9.1 | 0.87 | 58.0 | 2.2 | 85.5 | 116.5 | 8.1 | ||
| 2022:2E-09 | 1 | N-T | MATTERHORN | Rhizophagus sp. | 20 | 13 | 0.02 | 27.6 | 2.24 | 24.0 | 4 | 16.2 | 40.0 | 102.8 | 9.7 | 811 |
| 2022:2E-10 | 2 | N-T | MATTERHORN | Glomus sp. | 16 | 2 | 0.01 | 21.0 | 1.57 | 32.0 | 5.2 | 21.7 | 38.9 | 104.6 | 1084 | |
| 2022:2E-11 | 1 | N-T | GALAICA | Glomus sp. | 20 | 6 | 0.19 | 28.4 | 2.70 | 15.0 | 2.4 | 95.6 | 116.8 | 10.5 | ||
| 2022:2E-12 | 2 | N-T | GALAICA | Glomus sp. | 21 | 68 | 1.31 | 106.1 | 2.53 | 14.0 | 2.2 | 50.7 | 76.0 | 117.2 | 8.7 | 2534 |
| 2022:2E-13 | 1 | N-B-T | MATTERHORN | Gigaspora margarita / Glomus sp. | 15 | 16 | 0.02 | 13.2 | 0.39 | 28.0 | 5.6 | 18.0 | 34.5 | 102.0 | 8.6 | 901 |
| 2022:2E-14 | 2 | N-B-T | MATTERHORN | Rhizophagus sp. | 25 | 20 | 0.53 | 37.1 | 3.19 | 33.0 | 4.6 | 20.9 | 36.2 | 105.0 | 10.0 | 1047 |
| 2022:2E-15 | 1 | N-B-T | GALAICA | Rhizophagus clarus / Glomus sp. | 18 | 11 | 0.02 | 40.2 | 1.64 | 28.0 | 2 | 26.9 | 84.3 | 116.4 | 8.5 | 1344 |
| 2022:2E-16 | 2 | N-B-T | GALAICA | Rhizophagus clarus / Scuttelospora sp. | 22 | 7 | 0.02 | 64.1 | 1.93 | 18.0 | 2.8 | 73.0 | 69.8 | 128.4 | 10.8 | 3650 |
| 2022:2E-17 | 1 | 0 | MATTERHORN | Glomus sp. | 20 | 14 | 0.00 | 17.7 | 0.68 | 30.0 | 4.2 | 10.9 | 29.4 | 109.9 | 9.7 | 546 |
| 2022:2E-18 | 2 | 0 | MATTERHORN | Glomus sp. | 22 | 11 | 0.03 | 24.1 | 1.09 | 23.0 | 4.2 | 6.6 | 17.3 | 160.1 | 332 | |
| 2022:2E-19 | 1 | 0 | GALAICA | Rhizophagus irregularis | 30 | 0 | 30.2 | 5.0 | 1.6 | 36.2 | 96.8 | 114.0 | 8.3 | 1811 | ||
| 2022:2E-20 | 2 | 0 | GALAICA | 0 | 4 | 0.00 | 7.7 | 16.0 | 2.6 | 42.1 | 96.6 | 121.6 | 8.4 | 2105 | ||
| 2022:2E-21 | 1 | B | MATTERHORN | Rhizophagus clarus / Gigaspora margarita | 22 | 13 | 0.02 | 19.8 | 1.26 | 29.0 | 4.2 | |||||
| 2022:2E-22 | 2 | B | MATTERHORN | 0 | 0 | 14.3 | 1.25 | 25.0 | 3.8 | |||||||
| 2022:2E-23 | 1 | B | GALAICA | Glomus sp. | 22 | 6 | 0.02 | 17.8 | 0.91 | 8.0 | 1.4 | 99.0 | 11.4 | 10.4 | ||
| 2022:2E-24 | 2 | B | GALAICA | |||||||||||||
| 2022:2E-25 | 1 | N | MATTERHORN | Rhizophagus clarus | 25 | 10 | 0.03 | 51.3 | 2.23 | 28.0 | 4.6 | 5.6 | 37.1 | 119.1 | 7.7 | 282 |
| 2022:2E-26 | 2 | N | MATTERHORN | Scutellospora sp. / Gigaspora sp. | 22 | 7 | 47.7 | 2.37 | 50.0 | 3.8 | 23.1 | 35.6 | 109.0 | 9.7 | 1154 | |
| 2022:2E-27 | 1 | N | GALAICA | Gigaspora margarita | 20 | 20 | 0.10 | 19.2 | 0.99 | 16.0 | 2 | 43.4 | 84.8 | 115.4 | 8.2 | 2169 |
| 2022:2E-28 | 2 | N | GALAICA | Glomus sp. | 25 | 6 | 0.05 | 29.6 | 2.19 | 33.0 | 2.4 | 69.0 | 90.0 | 122.8 | 8.7 | 3452 |
| 2022:2E-29 | 1 | N-B | MATTERHORN | Gigaspora sp. | 30 | 14 | 0.01 | 21.6 | 1.83 | 21.0 | 5.4 | 8.7 | 31.7 | 122.4 | 10.1 | 434 |
| 2022:2E-30 | 2 | N-B | MATTERHORN | Rhizophagus clarus / Glomus sp. | 28 | 25 | 0.02 | 35.6 | 1.94 | 24.0 | 4.4 | 8.6 | 30.8 | 114.3 | 8.4 | 430 |
| 2022:2E-31 | 1 | N-B | GALAICA | Rhizophagus sp. | 26 | 5 | 0.04 | 24.0 | 0.98 | 20.0 | 2.4 | 17.2 | 78.3 | 113.3 | 9.5 | 861 |
| 2022:2E-32 | 2 | N-B | GALAICA | Rhizophagus clarus / Glomus sp. | 26 | 175 | 2.67 | 23.8 | 1.18 | 30.0 | 2.8 | 68.4 | 81.2 | 121.6 | 9.7 | 3419 |
| Mean | 22.0 | 25.3 | 0.345 | 29.17 | 1.516 | 24.63 | 3.43 | 26.81 | 115.40 | 9.35 | 1340.4 | |||||
| Minimum | 0 | 0 | 0.00 | 7.7 | 0.39 | 5.0 | 1.2 | 5.0 | 11.4 | 7.7 | 252 | |||||
| Maximum | 45 | 175 | 2.67 | 106.1 | 3.19 | 58.0 | 5.6 | 73.0 | 160.1 | 11.9 | 3650 | |||||
| Standard deviation | 8.2 | 39.5 | 0.631 | 20.07 | 0.723 | 11.15 | 1.38 | 20.38 | 24.31 | 1.01 | 1018.8 |
a: the mean, maximum, minimum and standard deviation for Seed Weight are not displayed since Galaica and Matterhorn belong to different genetic pools and their seed size are very different.
The range of variation of the number of nodules per plant was 0-175, with a mean of 25.3. Galaica had more nodules per plant (average 32.7) than Matterhorn (average 18.9). Two plots with Glomus sp. and Rhizophagus clarus/Glomus sp. inoculated with B. alba had 133 and 175 nodules per plant, respectively. It is noteworthy that two plots with R. clarus/Glomus sp. and R. irregularis, both inoculated with B. alba, did not have any nodules. Regarding the dry weight of the vegetative parts of the plants, aerial and root, the highest values, respectively, were 106.1 g (Galaica, Glomus sp., N-T treatment) and 3.19 g (Matterhorn, Rhizophagus sp., N-T-B).
In 2022 the quality of the bean grain was assessed again upon water absorption (%) and tegument proportion (%). Matterhorn has presented values of 160.1 % (with Glomus sp. and 0 treatment), 158.4 % (with Glomus sp. and T-B) and 126.4 % (with R. clarus and T). Maximum values of Galaica were 128.4 % (with S. clarus / Scuttelospora sp. and N-T-B) and 126.4 % (with R. clarus and T). Matterhorn presented good values of proportion of tegument in grains from several plots: 7.7 % (with R. clarus and N) and 8.4 % (with R. clarus / Glomus sp. and N-B). Galaica had also good scores of 8.1 (with Glomus sp. and T-B), 8.2 % (with G. margarita and N), 8.3 % (with R. irregularis and 0 treatment) and 8.4 % (no mycorrhizae and 0).
The productivity of the two bean genotypes studied was estimated by means of pods per plant, production per plant and crop yield. The highest number of pods per plant corresponded to Galaica with 58.0 (with Glomus sp. and T-B) while Matterhorn had a maximum of 50.0 (with Scutellospora sp. / Gigaspora sp. and N treatment). Productivity of grain per plant reached the highest values in Galaica: 73.0 4 g (with R. clarus and N-T-B treatment), 69.0 g (with Glomus sp. and N) and 68.4 g (with R. clarus and N-B). The productivity of Matterhorn was very low, with a maximum of 23.1 g (with Scutellospora sp. / Gigaspora sp. and N). It was again a very variable character, with low values under 10 g/plant in five plots of Matterhorn, four of them with Glomus sp. The average crop yield was 1384.6 kg/ha, higher than the 2021 yield, with relevant values obtained in Galaica: 3650 kg/ha (with R. clarus and N-T-B treatment), 3452 kg/ha (with Glomus sp. and N) and 3419 kg/ha (with R. clarus and N-B).
According to the meteorological data, the differences in seasonal rainfall May-September were not relevant (2021: 314.1 mm; 2022: 271.4 mm), and additionally, all the plots were drip irrigated (37.5 mm/week). The seasonal temperatures in May-September in 2021 and 2022 was quite different (Table 4). Flowering of the bean plants was in July-August, and the higher temperature in 2022 than in 2021 could have affect the growing of the plants and the mycorrhizal colonization of the plant roots.
4. Discussion
Bio-based agronomic practices in primary production can positively impact ecological functions and economic sustainability while supporting the United Nations Sustainable Development Goals (UN SDGs). By preserving natural resources, enhancing ecosystem functions, and reducing crop management costs and environmental impacts, these practices are valuable strategies for combating malnutrition and ensuring future food security. Additionally, bio-based practices should conserve natural resources, support ecosystem functions, and reduce both crop management costs and the environmental impact of agricultural production [31].
The intensive agriculture model focused on synthetic inputs and natural resources to reduce production constraints and manage environmental variability is gradually being replaced by an alternative model based on agroecological technologies. This approach emphasizes biodiversity management within agroecosystems to enhance supporting and regulatory ecosystem services, improving resource-use efficiency and reducing the environmental impacts of conventional agriculture. Within this biodiversity, soil microorganisms, primarily bacteria and fungi, engage in complex interactions with terrestrial plants. As a result, plants can no longer be viewed as isolated entities; instead, their intricate interactions with mutualistic symbionts allow them to derive multiple benefits. Soil microorganisms are widely acknowledged for their essential roles in nutrient cycling and in facilitating critical plant functions, including nutrition, growth and stress resistance [32].
The AMF constitute a promising microbiological input for the development of sustainable agriculture; their role in the functioning of ecosystems and their potential as biological fertilizers are perhaps sufficient reasons to consider them as one of the important components in modern agroecology. Every day there is more needed to adopt agricultural development strategies to ensure stable food production that is consistent with environmental quality. The objectives pursued are food security, eradicating poverty and conserve and protect the environment and natural resources. The use of AMF fits very well into the multiple objectives pursued by sustainable agriculture. At an environmental level, they contribute to increased crop productivity, regeneration of degraded plant communities and maintenance of the ecosystem balance. At an economic level, they contribute to the efficient use of fertilizers, and at a social level they contribute to integrated rural development, with the use of natural resources (development of native inoculum) at a local scale, thus favouring the establishment of agroecosystems of sustained production.
The Glomeromycota phylum is the most commonly used arbuscular mycorrhizal fungi (AMF) in agricultural practices, functioning as a photosynthetic enhancer [33]. In the experiments, four AMF families were found: Acaulosporaceae, Gigasporaceae, Glomeraceae and Paraglomeraceae. Most evidence suggests that Glomeromycota rely on land plants for carbon and energy. However, recent circumstantial evidence indicates that some species may be capable of independent existence. Arbuscular mycorrhizal species are terrestrial and widely distributed in soils worldwide, where they form symbiotic relationships with the roots of most plant species [34].
AMF application has shown promising results in alleviating drought stress and has also positively influenced the nutritional value and chemical composition of pods and seeds of common bean. However, these benefits vary depending on the irrigation regime and the timing of pod and seed harvest [16]. In the experiments, the effect of AMF on two genotypes of common bean, Galaica and Matterhorn, was studied in combination with three agricultural factors: nitrogen fertilization, inoculation with T. harzianum and inoculation with B. alba, together with their combinations and a check control.
The variability of native mycorrhizae found in the trials can be considered remarkable, with four species and three genera in each of the two years of evaluation. The proportion of mycorrhization in 2021 showed very high values, which is considered positive for crop growth. It is noteworthy that the genus Glomus showed some values higher than 70% that year, as did Acaulospora and R. clarus. Razakatiana et al. [32] reported scores of mycorrhization of 62.5 % with Acaulospora, that increases up to 80.0 % when co-inoculated with a cocktail of 10 Rhizobium spp. strains while regarding Glomus, they reported 30.0 % of mycorrhization that grows up to 95 % in association with the Rhizobium cocktail.
A decrease in the proportion of mycorrhization was observed in the second year of experimentation, which did not correspond to the productivity of the bean plants, since yields were higher in 2022 than in 2021. In 2022 the maximum score of mycorrhization was achieved by Paraglomus occultum (45 %), in this case not associated with the rhizobacteria B. alba. The AMF Acaulospora sp. was not detected in roots this year. The reasons for the reduction in the quantitative reduction of mycorrhization in 2022, compared to 2021, could be of an environmental nature, particularly due to the temperature differences between both years.
Temperature variations can markedly affect AMF colonization in legumes. A meta-analysis revealed that increased temperatures generally enhance AM fungal colonization and plant biomass, while decreased temperatures can limit these benefits. However, the response can vary depending on the plant species and environmental conditions [35].
According to Mather et al. [36], high temperature stress decreased root colonization in plants. In studies involving non-leguminous plants, such as maize, high-temperature stress led to a significant reduction in AMF colonization, dropping from approximately 75–80% under normal conditions to about 40–45% under heat stress. While this study focused on maize, it suggests that elevated temperatures can adversely affect AMF colonization, which may have implications for legumes as well. Table 4 shows that the maximum temperatures in 2022 were higher than in 2021, that could produce some heat stress in the bean plants. Soudzilovskaia et al. [37] found a relationship between mean temperature of the warmest month at a site and percent AMF colonization with an optimum occurring at a mean monthly temperature of 19.5 °C. In the experiments here reported the mean monthly temperature in 2021 was 18.4ºC in July and 19.5ºC in August, while in 2022 it was 22.3 ºC in July and 21.5 ºC in August, during the flowering period of the bean plants, that means that temperatures in 2021 were more adequate for the mycorrhization process.
Gao et al. [38] found that elevated temperature significantly decreased G. mosseae colonization rate in the roots by 49.5% (under Cd exposure) and Nazari et al. [39] reported that when the temperature is above 30°C, fungal activity decreases due to plant growth disturbances. In our experiments, there were 27 days over 30ºC in 22 during the flowering time (July-August) and only 8 in the same period in 2021. The above mentioned could explain why the proportion of mycorrhization in 2022 was lower than in 2021 since temperature plays a pivotal role in the establishment and efficiency of AMF colonization in legume crops. Both excessively high and low temperatures can disrupt the symbiotic relationships, potentially leading to reduced plant growth. Understanding these temperature effects is crucial for optimizing legume cultivation, especially in the context of climate change and its impact on agricultural systems.
The experimental results were grouped into several areas: nodulation, plant growth and vigour, presence of diseases, physiological nitrogen and phosphorus content, and crop productivity. The influence of the different mycorrhizae identified on the agronomic behaviour of the bean genotypes does not seem to follow a pattern in the experiments.
In nodulation, the effect of Glomus has been notable, in terms of the number of nodules and their fresh weight, and in the most positive cases, combined with the presence of B. alba. F. mosseae, also with B. alba, has also offered good results. In the nodulation, a relationship has been detected between low mycorrhization in 2022 and the reduction in the number of nodules per plant and their weight in this year. Species within the genus Glomus are typically generalist symbionts found across diverse habitats, indicating a tolerance to a range of environmental stresses; they also exhibit significant functional diversity, with different isolates contributing to substantial variations in plant growth responses [40]. The dual inoculation is likely to produce synergistic effects in severely nutrient-depleted soils. This hypothesis is supported by the fact that the main mechanism by which inoculation with AM fungi acts on plant functions seems to be improved phosphatase activity, particularly that of acid phosphatases responsible for organic P hydrolysis and involved in supplying the high P requirements of N2 fixing nodules [32]
Razakatiana et al. [32], in low fertility tropical soil, studied the effect of Acaulospora sp. and Glomus sp. along with a cocktail of 10 Rhizobium spp. strains. They identified a positive effect of this co-infection on plant growth and on the total N content of the plants, along with a synergistic effect on the total P content, the number of nodules and the mycorrhizal rate of the plants. Tajini and Drevon [41,42] in a controlled co-inoculation experiment found that low phosphorus content improves mycorrhizal colonization. In this case, colonization by native mycorrhizae is important despite the high phosphorus content in the soil, which represents one of the significant contributions of this research
In the study of aerial and subaerial growth of plant and vigour, the effect of R. clarus has been positive, associated with the presence of the combination of Nitrogen and B. alba. The species F. mosseae, combined with B. alba and Nitrogen, has also provided good results.
Regarding the incidence of diseases, there are several combinations that could be the most suitable for crop protection. Glomus, together with T. harzianum, G. margarita associated with T. harzianum and B. alba, and R. clarus, with Nitrogen, T. harzianum and B. alba. According to these results, the presence of T. harzianum seems relevant for the bean crop health, in some cases in a consortium with B. alba. AMF are capable of promoting plant growth and effectively suppress several plant diseases. The interaction of these microorganisms in the plant rhizosphere affects plant growth and microbial community composition [43].
With regard to leaf nitrogen content, Glomus seems to play a relevant role, with T. harzianum, and there are also positive results of the effect of R. clarus with T. harzianum. In terms of phosphorus content, Glomus also stands out, both with B. alba or with T. harzianum, while Gigaspora was also playing a positive role with B. alba. The results agree with Razakatiana et al. [32] in their experiment of co-inoculation with Rhizobium spp., Glomus sp. and Acaulospora sp.
Crop productivity was estimated on the basis of grain weight, number of pods per plant, productivity per plant and crop yield. Glomus had an effect on grain weight, with the association of T. harzianum and B. alba, and also R. clarus, with T. harzianum and Nitrogen. Acaulospora and G. margarita, both with T. harzianum also had an effect on increasing grain weight. The number of pods per plant increased due to the effect of R. clarus, with the presence of T. harzianum and nitrogen fertilization. Glomus also stands out, in association with the same factors. Productivity per plant was favoured by R. clarus, associated with T. harzianum and Nitrogen. Glomus, associated with T. harzianum, was also highlighted. The crop yield, in both bean genotypes, had outstanding values with respect to productivity in the humid temperate zone in which the experiment was carried out. R. clarus, combined with T. harzianum and Nitrogen, has led to yield values above 2000 kg/ha. Glomus, combined with T. harzianum, has also given an adequate yield.
The interaction of rhizosphere microorganisms, such as AMF, fungi of the genus Trichoderma and bacteria of the genus Rhizobium and similar (as could be B. alba) are usually classified as biological control agents (BCA). Nitrogen fixers and plant growth promoting microorganisms (PGPM), depend on different factors to express their potential beneficial effects; however, the interactions between microorganisms are complex and synergistic effects may occur that enhance the benefits for the plant [32] or, on the contrary, antagonistic effects or, simply, that no effect occurs [44].
It is difficult to predict the outcome of interactions between plants and beneficial soil microorganisms and, even more so, between species of microorganisms. However, the microbial communities associated with the root plant system are considered to play a key role in the development of sustainable agricultural practices. There is information regarding the positive synergistic effect of AMF together with Rhizobium spp. [32] but there are no references available regarding the role that B. alba may play, either individually or in association with AMF. The response of plants to inoculation depends on the functional compatibilities in the physiology and biochemistry of the interaction between the microbial components; thus, it gives different answers, depending on the combination of microorganisms [45].
In conclusion, an intelligent use of AMF would have the effect of reducing the use of pesticides in the production of legumes that means cheaper and more sustainable agricultural production and healthier food production, although environmental factor could affect quantitatively the mycorrhization process. By harnessing their potential through research and conservation efforts, it should be possible to improve agricultural productivity, mitigate environmental degradation, and enhance global sustainability.
Author Contributions
Conceptualization, A.P.R, O.A, and A.M.R..; Methodology, A.P.R, O.A, L.T.H. and A.M.R.; Formal Analysis, A.P.R., O.A., L.T.H. and A.M.R.; Investigation, L.T.H., A.M.R., and A.P.R.; X.X.; Resources, A.M.R.; Writing – Original Draft Preparation, A.P.R., O.A., and A.M.R.; Writing – Review & Editing, A.P.R. and A.M.R.; Visualization, A.P.R. and A.M.R.; Supervision, A.M.R.; Project Administration, A.M.R.; Funding Acquisition, A.M.R.
Funding
This research was funded by the Government of Spain project PID2021-124007OB-100 and IN607A2021/03 project by the Xunta de Galicia (Spain).
Acknowledgments
The authors would like to thank the support provided by the Diputacion de Pontevedra (Spain), for the use of the MBG-CSIC experimental farm, Prof PA Casquero for the contribution of Trichoderma strains, Dr MJ Sainz for critical review of the experimental data and Mrs. DB Lago responsible of the meteorological station at the MBG-CSIC.
Conflicts of Interest
The authors declare no conflict of interest.
References
- Azcón-Aguilar, C.; Jaizme-Vega, M.C.; Calvet, C. The contribution of arbuscular mycorrhizal fungi to the control of soil-borne plant pathogens. In Mycorrhiza technology in agriculture: From genes to bioproducts; Gianinazzi S., Schüepp H., Barea J.M., Haselwandter, K., Eds.; Springer-Verlag; Birkhäuser: Basel; Switzerland, 2002; pp 187–198.
- Zhang, J.; Zhao, R.; Li, X.; Zhang, J. Potential of arbuscular mycorrizal fungi for soil health: A review. Pedosphere 2024, 34, 279–288. [Google Scholar] [CrossRef]
- Siqueira, J.O.; Saggin Junior, O.J. The importance of mycorrhizae association in natural low-fertility soils. In International Symposium on environmental stress: Maize in perspective; Embrapa-CNPMS/México, CIMMYT/UNDP: Sete Lagoas, 1995; pp. 239–280. [Google Scholar]
- Smith, S.E.; Read, D.J. Mycorrhizal Symbiosis, 3rd edi.; Academic Press: New York, USA, 2008. [Google Scholar]
- Malthus, T. An Essay on the Principle of Population; Cambridge University Press: Paul’s. Church-Yard. London, UK, 1806. [Google Scholar]
- Erisman, J.W.; Galloway, J.; Dise, N.; Bleeker, A.; Grizzetti, B.; Leach, A.; Vries, W. Nitrogen; too much of a vital resource. 2015. [CrossRef]
- De Ron, A.M.; Papa, R.; Bitocchi, E.; González, A.M.; Debouck, D.G.; Brick, M.A.; Fourie, D.; Marsolais, F.; Beaver, J.; Geffroy, V.; McClean, P.; Santalla, M.; Lozano, R.; Yuste-Lisbona, F.J.; Casquero, P.A. Common Bean. In Grain Legumes; De Ron, A.M., Ed.; Series: Handbook of Plant Breeding; Springer Science+Business Media: New York, USA, 2015; pp. 1–36. [Google Scholar]
- FAO. 2020. https://www.fao.org/news/archive/news-by-date/2020/es/.
- MAPA. 2020. https://www.mapa.gob.es/es/estadistica/temas/estadisticas-agrarias.
- Van Jaarsveld, C.M.; Smit, M.A.; Krüger, G.H.J. Interaction amongst soybean [Glycine max (L.) Merrill] genotype; soil type and inoculant strain with regard to N2 fixation. J. Agron. Crop Sci. 2002, 188, 206–211. [Google Scholar] [CrossRef]
- Zhang, H.; Charles, T.; Driscoll, B.; Prithiviraj, B.; Smith, D. Low temperature-tolerant Bradyrhizobium japonicum strains allowing improved soybean yield in short-season areas. Agron. J. 2002, 944, 870–875. [Google Scholar] [CrossRef]
- Obando, M.; Correa-Galeote, D.; Castellano-Hinojosa, A.; Gualpa, J.; Hidalgo, A.; De Dios Alché, J.; Bedmar, E.J.; Cassán, F. Analysis of the denitrification pathway and greenhouse gases emissioins in Bradyrhizobium sp. strains used as biofertilizers in South America. J. Appl. Microbiol. 2019, 127, 739–749. [Google Scholar] [CrossRef]
- Kocira, A.; Lamorska, J.; Kornas, R.; Nowosad, N.; Tomaszewska, M.; Leszczynska, D.; Kozlowicz, K.; Tabor, S. Changes in biochemistry and yield in response to biostimulants applied in bean (Phaseolus vulgaris L.). Agron. 2020, 10, 189. [Google Scholar] [CrossRef]
- Lucini, L.; Rouphael, Y.; Cardarelli, M.; Bonini, P.; Baffi, C.; Colla, G. A vegetal biopolymer-based biostimulant promoted root growth in melon while triggering brassinosteroids and stress-related compounds. Front. Plant Sci. 2018, 9, 472. [Google Scholar] [CrossRef]
- du Jardin, P. Plant biostimulants: Definition; concept; main categories and regulation. Sci. Hortic. 2015, 196, 3–14. [Google Scholar] [CrossRef]
- Petropoulos, S.A.; Fernandes, Â.; Plexida, S.; Chrysargyris, A.; Tzortzakis, N.; Barreira, J.C.M.; Barros, L.; Ferreira, I.C.F.R. Biostimulants application alleviates water stress effects on yield and chemical composition of greenhouse green bean (Phaseolus vulgaris L.). Agron. 2020, 10, 181. [Google Scholar] [CrossRef]
- Colla, G.; Rouphael, Y.; Di Mattia, E.; El-Nakhel, C.; Cardarelli, M. Co-inoculation of Glomus intraradices and Trichoderma atroviride acts as a biostimulant to promote growth; yield and nutrient uptake of vegetable crops. J Sci Food Agric. 2015, 95, 1706–1715. [Google Scholar] [CrossRef]
- Santalla, M.; De Ron, A.M.; Voysest, O. European bean market classes. In Catalogue of bean genetic resources; Amurrio, M., Santalla, M., De Ron, A.M., Eds.; Fundación Pedro Barrié de la Maza / PHASELIEU-FAIR3463 / MBG-CSIC: Pontevedra, Spain, 2001; pp. 77–94. [Google Scholar]
- Hidalgo, R. Catálogo de germoplasma de frijol común Phaseolus vulgaris L.; Centro Internacional de Agricultura Tropical (CIAT): Cali, CO, 1984; p. 317. [Google Scholar]
- Kelly, J.D.; Hosfield, G.L.; Varner, G.V.; Uebersax, M.A.; Taylor, J. Registration of ‘Matterhorn’ great northern bean. Crop Sci. 1999, 39, 588–589. [Google Scholar] [CrossRef]
- Lee, J.W.; Kim, Y.E.; Park, S.J. Burkholderia alba sp. nov., isolated from a soil sample on Halla mountain in Jeju island. J. Microbiol. 2018, 56, 312–316. [Google Scholar] [CrossRef] [PubMed]
- McMaster, G.S.; Wilhelm, W.W. Growing degree-days: One equation; two interpretations. Agric. For. Meteorol. 1997, 87, 291–300. [Google Scholar] [CrossRef]
- Van Tuinen, D.; Jacquot, E.; Zhao, B.; Gollotte, A.; Gianinazzi-Pearson, V. Characterisation of root colonization profiles by a microcosm community of arbuscular mycorrhizal fungi using 25S rDNA-targeted nested PCR. Mol. Ecol. 1998, 7, 879–887. [Google Scholar] [CrossRef] [PubMed]
- Lee, J.; Lee, S.; Young, J.P. Improved PCR primers for the detection and identification of arbuscular mycorrhizal fungi. FEMS Microbiol. Ecol. 2008, 65, 339–349. [Google Scholar] [CrossRef]
- Altschul, S.F.; Madden, T.L.; Schäffer, A.A.; Zhang, J.; Zhang, Z.; Miller, W.; Lipman, D.J. Gapped BLAST and PSI-BLAST: A new generation of protein database search programs. Nucleic Acids Res. 1997, 25, 3389–3402. [Google Scholar] [CrossRef]
- Hall, T.A. BioEdit: A User-Friendly Biological Sequence Alignment Editor and Analysis Program for Windows 95/98/NT. Nucleic Acids Symposium Series 1999, 41, 95–98. [Google Scholar]
- Thompson, J.D.; Higgins, D.G.; Gibson, T.J. CLUSTAL W: Improving the sensitivity of progressive multiple sequence alignment through sequence weighting; position-specific gap penalties and weight matrix choice. Nucleic Acids Res. 1994, 22, 4673–4680. [Google Scholar] [CrossRef]
- Phillips, J.M.; Hayman, D.A. Improved Procedures for Clearing Roots and Staining Parasitic and Vesicular-Arbuscular Mycorrhizal Fungi for Rapid Assessment of Infection. Trans. British Mycol. Soc. 1970, 55, 158–161. [Google Scholar] [CrossRef]
- Ambler, J.R.; Young, J.L. Techniques for Determining Root Length Infected by Vesicular-arbuscular Mycorrhizae. Soil Sci. Soc. Am. J. 1977, 41, 551–556. [Google Scholar] [CrossRef]
- Giovannetti, M.; Mosse, B. An Evaluation of Techniques for Measuring Vesicular Arbuscular Mycorrhizal Infection in Roots. New Phytol. 1980, 84, 489–500. [Google Scholar] [CrossRef]
- Karavidas, I.; Ntatsi, G.; Vougeleka, V.; Karkanis, A.; Ntanasi, T.; Saitanis, C.; Agathokleous, E.; Ropokis, A.; Sabatino, L.; Tran, F. Agronomic practices to increase the yield and quality of common bean (Phaseolus vulgaris L.): A systematic review. Agron. 2022, 12, 271. [Google Scholar] [CrossRef]
- Razakatiana, A.T.E.; Trap, J.; Baohanta, R.H.; Raherimandimby, M.; Le Roux, C.; Duponnois, R.; Ramanankierana, H.; Becquer, T. Benefits of dual inoculation with arbuscular mycorrhizal fungi and rhizobia on Phaseolus vulgaris planted in a low-fertility tropical soil. Pedobiology – J. Soil Ecol. 2020, 83, 150685. [Google Scholar] [CrossRef]
- Bağdatli, M.C.; Erdoğan, O. Effects of different irrigation levels and arbuscular mycorrhizal fungi (AMF); photosynthesis activator; traditional fertilizer on yield and growth parameters of dry bean (Phaseolus vulgaris L.) in arid climatic conditions. Commun. Soil Sci. Plant Anal. 2019, 50, 527–537. [Google Scholar] [CrossRef]
- Hibbett, D.S.; Binder, M.; Bischoff, J.F.; Blackwell, M.; Cannon, P.F.; Eriksson, O.E.; Huhndorf, S.; James, T.; Kirk, P.M.; Lücking, R.; Thorsten Lumbsch, H.; Lutzoni, F.; Matheny, P.B.; McLaughlin, D.J.; Powell, M.J.; Redhead, S.; Schoch, C.L.; Spatafora, J.W.; Stalpers, J.A.; Vilgalys, R.; Aime, M.C.; Aptroot, A.; Bauer, R.; Begerow, D.; Benny, G.L.; Castlebury, L.A.; Crous, P.W.; Dai, Y.C.; Gams, W.; Geiser, D.M.; Griffith, G.W.; Gueidan, C.; Hawksworth, D.L.; Hestmark, G.; Hosaka, K.; Humber, R.A.; Hyde, K.D.; Ironside, J.E.; Kõljalg, U.; Kurtzman, C.P.; Larsson, K.H.; Lichtwardt, R.; Longcore, J.; Miadlikowska, J.; Miller, A.; Moncalvo, J.M.; Mozley-Standridge, S.; Oberwinkler, F.; Parmasto, E.; Reeb, V.; Rogers, J.D.; Roux, C.; Ryvarden, L.; Sampaio, J.P.; Schüssler, A.; Sugiyama, J.; Thorn, R.G.; Tibell, L.; Untereiner, W.A.; Walker, C.; Wang, Z.; Weir, A.; Weiss, M.; White, M.M.; Winka, K.; Yao, Y.J.; Zhang, N. A higher-level phylogenetic classification of the Fungi. Mycol. Res. 2007, 111, 509–547. [Google Scholar] [CrossRef] [PubMed]
- Duarte, A.G.; Maherali, H. A meta-analysis of the effects of climate change on the mutualism between plants and arbuscular mycorrhizal fungi. Ecol. Evol. 2022, 12, e8518. [Google Scholar] [CrossRef] [PubMed]
- Mather, S.; Agnihotri, R.; Sharma, M.P.; Reddy, V.R.; Jajoo, A. Effect of High-Temperature Stress on Plant Physiological Traits and Mycorrhizal Symbiosis in Maize Plants. J. Fungi 2021, 7, 867. [Google Scholar] [CrossRef]
- Soudzilovskaia, N.A.; Douma, J.C.; Akhmetzhanova, A.A.; Bodegom, P.M.; Cornwell, W.K.; Moens, E.J.; Treseder, K.K.; Tibbett, M.; Wang, Y.P.; Cornelissen, J.H. Global patterns of plant root colonization intensity by mycorrhizal fungi explained by climate and soil chemistry. Glob. Ecol. Biogeogr. 2015, 24, 371–382. [Google Scholar] [CrossRef]
- Gao, Y.; Jia, X.; Zhao, Y.; Zhao, J.; Ding, X.; Zhang, C.; Feng, X. Effect of arbuscular mycorrhizal fungi (Glomus mosseae) and elevated air temperature on Cd migration in the rhizosphere soil of alfalfa. Ecotoxicol. Environ. Saf. 2022, 248, 114342. [Google Scholar] [CrossRef]
- Nazari, M.; Hemati, A.; Backer, R.; Lajayer, B.A.; Astatkie, T. The role of arbuscular mycorrhizal fungi (AMF) in rhizosphere soil and plant growth regulation. In The Role of Growth Regulators and Phytohormones in Overcoming Environmental Stress; Sharma, A., Pandey, S., Bhardwaj, R., Zheng, B., Tripathi, D.K., Eds.; Academic Press: Cambridge, MA, USA, 2023; pp. 101–111. [Google Scholar]
- Rodrigues, K.M.; Rodrigues, B.F. Glomus. In Beneficial microbes in agro-ecology. Bacteria and fungi; Amaresan, N., Senthil Kumar, M., Annapurna, K., Kumar, K., Sankaranarayanan, A., Eds.; Academic Press; Elsevier; 2020; pp. 561–569.
- Tajini, F.; Drevon, J.J. Effect of arbuscular mycorrhizas on P use efficiency for growth and N2 fixation in common bean (Phaseolus vulgaris L). Sci. Res. Essays 2012, 7, 1681–1689. [Google Scholar]
- Tajini, F.; Drevon, J.J. Phosphorous use efficiency in common bean (Phaseolus vulgaris L.) as related to compatibility of association among arbuscular mycorrhizal fungi and rhizobia. Afr. J. Biotech. 2012, 11, 12173–12182. [Google Scholar]
- Neeraj, K.S. Organic amendments to soil inoculated arbuscular mycorrhizal fungi and Pseudomonas fluorescens treatments reduce the development of root-rot disease and enhance the yield of Phaseolus vulgaris L. Eur. J. Soil Biol. 2011, 47, 288–295. [Google Scholar] [CrossRef]
- Bonfante, P.; Genre, A. Mechanisms underlying beneficial plant–fungus interactions in mycorrhizal symbiosis. Nat. Commun. 2010, 1, 48. [Google Scholar] [CrossRef] [PubMed]
- Vazquez, P.; Holguin, G.; Puente, M.E.; Lopez-Cortes, A.; Bashan, Y. Phosphate-solubilizing microorganisms associated with the rhizosphere of mangroves in a semiarid coastal lagoon. Biol. Fertil. Soils 2000, 30, 460–468. [Google Scholar] [CrossRef]
Figure 1.
Seeds of Galaica (left) and Matterhorn (right) bean genotypes.
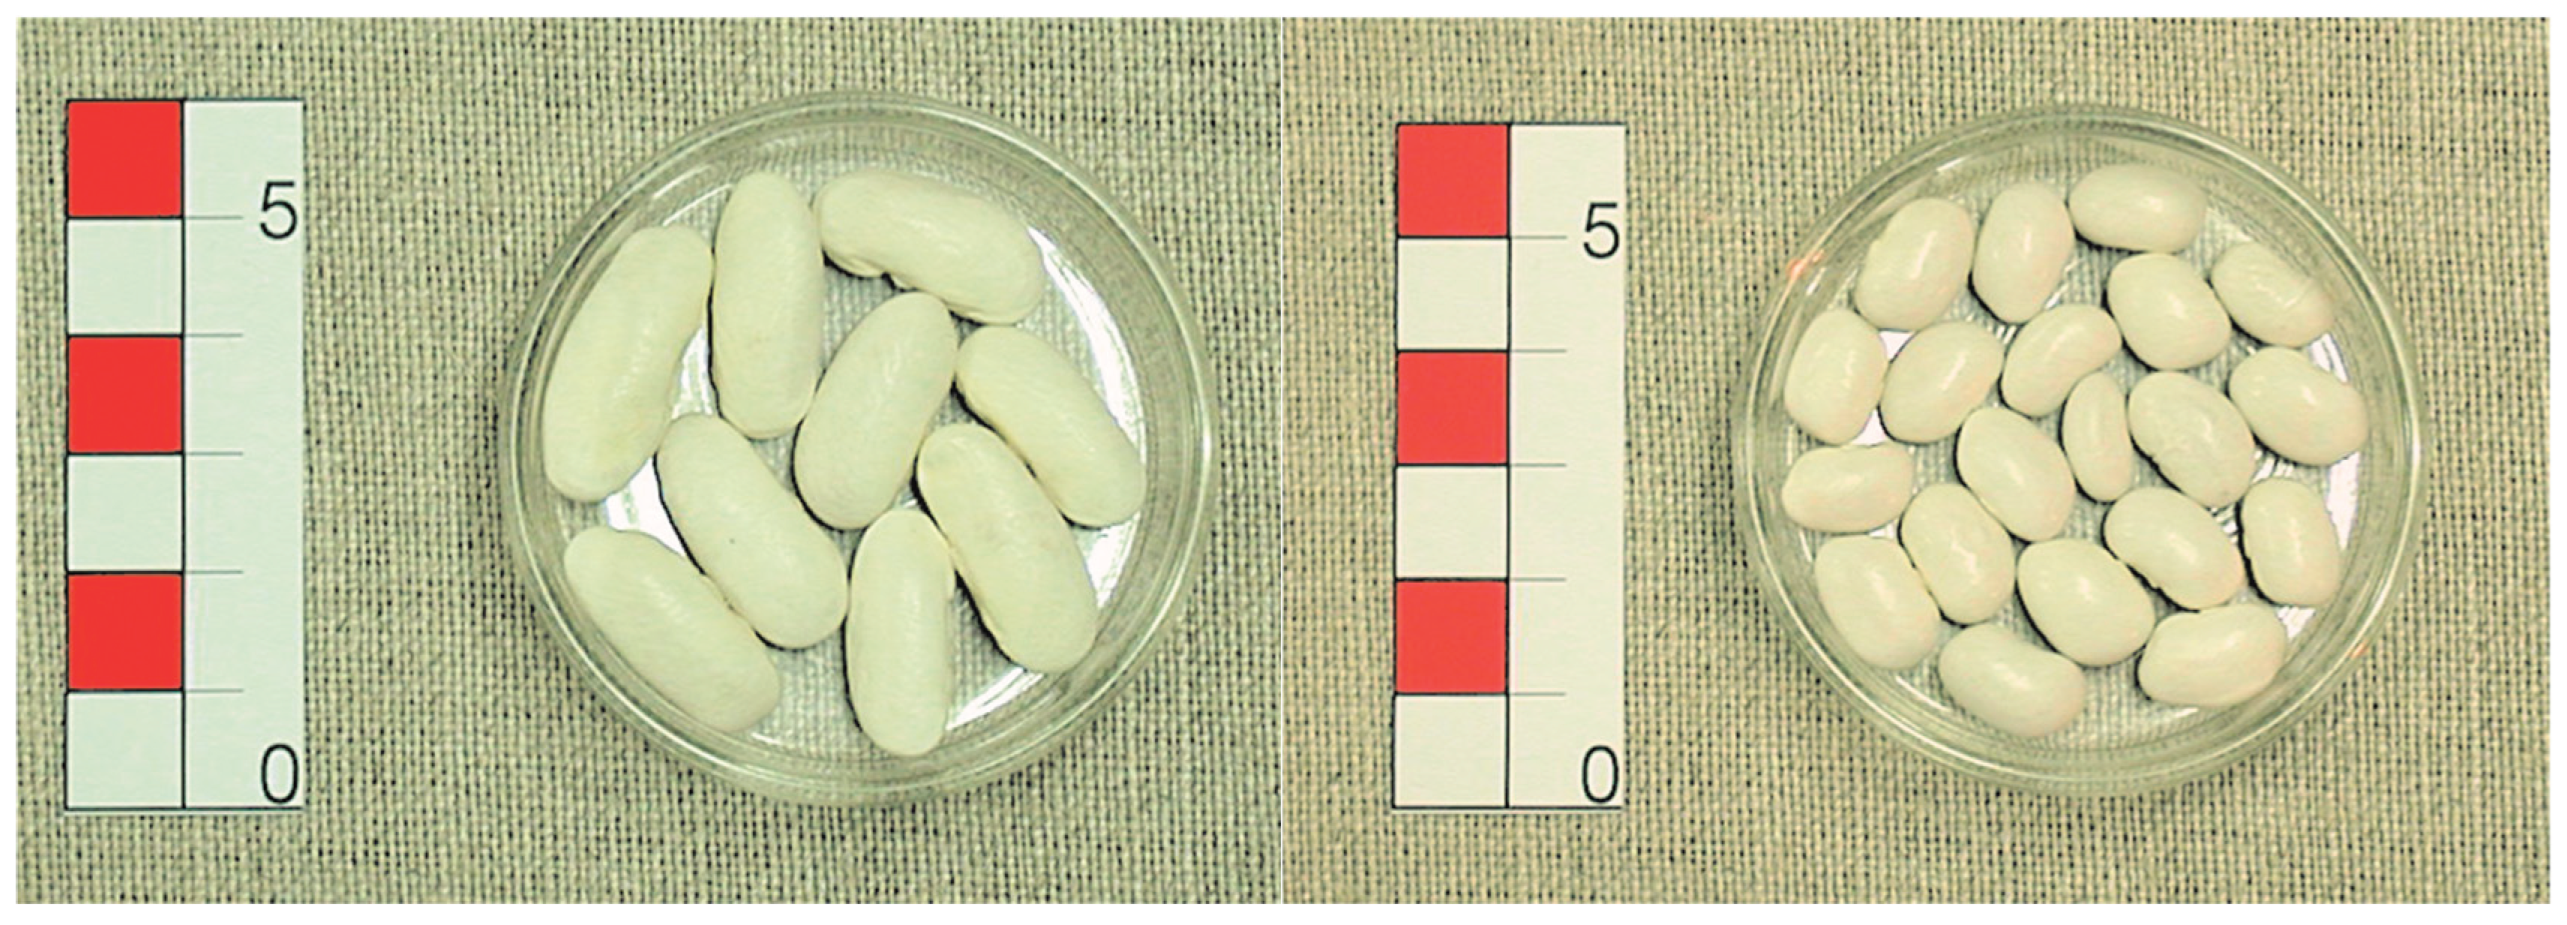
Table 1.
Summary of the native AMF identified in the bean plant roots in 2021 and 2022.
| Genus / species | Phylum / family | Year | |
| 2021 | 2022 | ||
| Acaulospora sp. | Glomeromycota / Acaulosporaceae | x | |
| Acaulospora spinosa | Glomeromycota / Acaulosporaceae | x | |
| Funneliformis mosseae | Glomeromycota / Glomeraceae | x | |
| Gigaspora margarita | Glomeromycota / Gigasporaceae | x | x |
| Gigaspora sp. | Glomeromycota / Gigasporaceae | x | x |
| Glomus sp. | Glomeromycota / Glomeraceae | x | x |
| Paraglomus occultum | Glomeromycota / Paraglomeraceae | x | x |
| Rhizophagus sp. | Glomeromycota / Glomeraceae | x | |
| Rhizophagus clarus | Glomeromycota / Glomeraceae | x | x |
| Rhizophagus irregularis | Glomeromycota / Glomeraceae | x | |
| Scuttelospora sp. | Glomeromycota / Gigasporaceae | x | x |
Table 4.
Seasonal temperatures in May-September in 2021 and 2022.
| Month | Growing Degree-Days | Days with TMAX≥30ºC | ||
| 2021 | 2022 | 2021 | 2022 | |
| May | 69.5 | 69.0 | 0 | 2 |
| June | 232.5 | 228.5 | 5 | 2 |
| July | 260.5 | 363.5 | 4 | 13 |
| August | 293.0 | 356.5 | 4 | 14 |
| September | 273.5 | 273.0 | 1 | 2 |
| TOTAL | 1129.0 | 1290.5 | 14 | 33 |
Disclaimer/Publisher’s Note: The statements, opinions and data contained in all publications are solely those of the individual author(s) and contributor(s) and not of MDPI and/or the editor(s). MDPI and/or the editor(s) disclaim responsibility for any injury to people or property resulting from any ideas, methods, instructions or products referred to in the content. |
© 2025 by the authors. Licensee MDPI, Basel, Switzerland. This article is an open access article distributed under the terms and conditions of the Creative Commons Attribution (CC BY) license (http://creativecommons.org/licenses/by/4.0/).
Copyright: This open access article is published under a Creative Commons CC BY 4.0 license, which permit the free download, distribution, and reuse, provided that the author and preprint are cited in any reuse.


