
Submitted:
05 June 2025
Posted:
06 June 2025
You are already at the latest version
Abstract
This study empirically investigates the financial impact of ESG factors and market dynamics on service sector firm excess returns using a 2012–2021 panel dataset of 14 firms. Panel regression and time series analysis, along with machine learning models, were employed. Findings indicate that traditional Fama-French factors significantly influence returns, while a higher aggregated ESG score unexpectedly correlates negatively with excess returns. Market-level ESG factors show dynamic interdependencies with market returns but no Granger causality. Machine learning models demonstrate high predictive accuracy for future return direction, with financial and ESG features as key predictors. These exploratory findings, limited by sample size, are useful for understanding complex ESG-financial relationships in the service sector, guiding nuanced corporate sustainability strategies and investment decisions.
Keywords:
service sector
; ESG
; financial performance
; stock returns
; Fama‐French factors
; panel data
; machine learning
; open innovation
; stakeholder theory
; asset pricing
1. Introduction
The service sector stands as the predominant engine of global economic activity, making substantial contributions to both gross domestic product and employment worldwide [35,36]. This sector's ongoing transformation is propelled by a convergence of interconnected forces, establishing it as an exceptionally dynamic and intricate domain for contemporary inquiry [39]. This study is precisely positioned within the context of these pivotal trends that define the evolving service landscape. Digital transformation and technological adoption, for instance, manifest through the widespread adoption of automation, Artificial Intelligence (AI), chatbots, and the proliferation of service platforms (such as ride-sharing and food delivery services) [43,44,54,55]. These innovations are fundamentally reshaping service delivery, enhancing customer experiences, and optimizing operational efficiencies. Simultaneously, the strategic deployment of Big Data and advanced analytics has become indispensable for achieving personalization, accurate demand forecasting, and fostering innovation [38].
Another critical development is the escalating emphasis on sustainability and ESG (Environmental, Social, and Governance) integration, driven by mounting societal expectations and regulatory pressures [24,37]. This involves how service firms systematically incorporate environmental sustainability, exemplified by eco-friendly hospitality practices and green logistics [7,9], alongside robust social responsibility initiatives encompassing diversity, fair labor practices, and ethical sourcing [5,6,8,15,17,20,21]. These efforts are underpinned by strong governance frameworks, with ESG reporting gaining increasing prominence for influencing both market competitiveness and investor relations [10,15]. Beyond these profound shifts, the service sector is also significantly influenced by advancements in customer experience and personalization, involving integrated omnichannel strategies and tailored services [21], and undergoing significant workforce transformation, adapting to remote work models, the burgeoning gig economy, and the continuous imperative for skill development through upskilling and reskilling programs [57]. Furthermore, service innovation and value co-creation, frequently involving customers as collaborative partners in the creation process (e.g., user-generated content), along with the adoption of agile methodologies like design thinking, are fundamentally redefining how services are conceived and delivered [23,32,58,60]. The challenges of globalization and localization, characterized by cross-border regulatory complexities and the need for cultural adaptation [42,51], alongside ongoing endeavors to refine service quality, productivity, and performance measurement [39,46,48], and the urgent imperative for resilience and crisis management [41], collectively illustrate a sector in perpetual evolution. Among these transformative forces, Sustainability and ESG Integration holds particular salience as a crucial trend directly examined by the study's empirical data [2,13,22,24]. Concurrently, Digital Transformation, specifically through its emphasis on Big Data and Analytics, both enables many of the sophisticated analytical techniques employed herein and serves as a primary catalyst for modern service delivery paradigms [43,44,54,55].
Despite the extensive documentation of these profound sectoral shifts, a notable void persists in quantitatively assessing the precise financial impact of specific factors, particularly ESG performance, on the financial performance of service sector firms. Prior research frequently generalizes findings from manufacturing or broader industries, often neglecting the distinctive characteristics of the service sector, such as its inherent intangibility and significant reliance on human interaction [13,40,46]. This study, therefore aims to address this empirical gap, seeking a more profound investigation through the application of established asset pricing theories and contemporary predictive analytics.
The study endeavors to answer several key questions:
- How do traditional asset pricing factors (Mkt-RF, SMB, HML, RMW, CMA, WML) and aggregated ESG scores influence the excess returns of service sector firms?
- What are the relationships and interdependencies between market-level ESG factors and market returns over time?
- Can machine learning models effectively predict the direction of future excess returns for service sector firms based on financial and ESG data?
- Do individual components of ESG (Environmental, Social, Governance) have a distinct impact on service sector firm performance compared to the aggregated ESG score?
This research offers significant contributions to the existing body of knowledge. Academically, it enriches the literature on ESG and financial performance by providing specific empirical evidence drawn from the service sector, an area that remains comparatively underexplored [7,10,13,24]. By employing a diverse array of methodologies, encompassing panel data for inferring causal relationships, time series analysis for understanding market-level dynamics, and machine learning for predictive insights, the study comprehensively examines the intricate interplay between traditional financial factors and non-financial (ESG) data. From a practical perspective, the findings yield valuable insights for service sector managers, illuminating the potential financial implications associated with various ESG strategies. Investors also stand to benefit from this research, as it cultivates a more nuanced understanding of risk-adjusted returns and informs their investment strategies within the service sector by considering both conventional market factors and ESG performance [61].
The remainder of this report is organized sequentially. Section 2 presents the theoretical foundation and reviews the relevant academic literature. Following this, Section 3 meticulously describes the methodology employed, covering data collection, preprocessing, preliminary diagnostic tests, and the econometric and machine learning models utilized. Section 4 then summarizes the empirical findings derived from all analyses. Subsequently, Section 5 offers a comprehensive discussion, interpreting these findings in light of previous studies and the study's working hypotheses, while also exploring their broader implications. Finally, Section 6 concludes the study, providing a concise summary of the major findings, acknowledging inherent limitations, and suggesting avenues for future research.
2. Theoretical Framework and Literature Review
2.1. Theoretical Underpinnings
Corporate objectives significantly shape how organizations engage with ESG principles. A traditional perspective, often termed shareholder value maximization, asserts that a company's primary responsibility is to generate the highest possible returns for its shareholders, frequently prioritizing short-term financial gains. Under this framework, ESG initiatives might be seen primarily as additional costs that could detract from overall financial performance. Conversely, Stakeholder Theory, notably elaborated by R. Edward Freeman, proposes that firms should actively manage their relationships with all relevant stakeholders, encompassing employees, customers, suppliers, local communities, the natural environment, and, of course, shareholders. This approach posits that fostering robust relationships with a diverse set of stakeholders is essential for achieving sustainable, long-term value creation. From this viewpoint, engaging in ESG activities is not merely an ethical consideration but a strategic imperative that can lead to enhanced reputation, reduced operational and regulatory risks, improved ability to attract and retain talent, and greater innovation capacity, all of which can ultimately contribute to improved financial outcomes [5,8,16]. Several academic studies in the provided literature, including those by Yin et al. [1] and Kong et al. [14], explicitly align with Stakeholder Theory by identifying a positive link between strong ESG performance and financial success. However, other investigations, such as those conducted by Erol et al. [2] and Saini et al. [12], examine or find evidence supporting a "trade-off hypothesis" or even observe negative correlations between ESG performance and financial returns, highlighting the nuanced and often complex financial implications of broad stakeholder engagement. Further research from Fatma and Chouaibi [6], Liao et al. [8], and Rahmaniati and Ekawati [15] additionally underscores the practical relevance of stakeholder theory in understanding how Corporate Social Responsibility (CSR) influences various aspects of organizational performance and value. Adewole [21] explores how a brand's reputation, influenced by consumer perceptions and interactions, can translate into equity through CSR efforts, while Şahin and Mitawa [16] found that ESG practices consistently improved financial performance, a finding consistent with stakeholder theory in the food production sector.
The determinants of an asset's expected return are a central focus of Asset Pricing Theory. The Efficient Market Hypothesis (EMH) suggests that all available information is fully incorporated into asset prices, making it challenging to consistently achieve returns above market averages. The Capital Asset Pricing Model (CAPM) proposes that an asset's expected return is solely determined by its systematic risk (beta) concerning the market's risk [37,38]. Nevertheless, empirical studies have identified market "anomalies" that challenge the CAPM's explanatory power. In response to these limitations, the Fama-French multi-factor models were developed, introducing additional factors beyond market risk to account for cross-sectional variations in stock returns [33,34]. These factors include the Market Excess Return (Mkt-RF), the Small-Minus-Big (SMB) factor, which captures a size premium, the High-Minus-Low (HML) factor, representing a value premium, the Robust-Minus-Weak (RMW) factor, linked to profitability, and the Conservative-Minus-Aggressive (CMA) factor, associated with investment strategies. The Carhart 4-factor model further extended this framework by incorporating the Winners-Minus-Losers (WML) or momentum factor, which explains the tendency of stocks with strong past performance to continue their positive trajectory [35]. These various factors are designed to capture systemic risks or market inefficiencies. The application of such factor models to specific industries, such as Electric Vehicle manufacturing [23], to identify the intricate drivers of returns beyond general market risk, is directly relevant to this study's investigation within the service sector.
Within the evolving context of "Digital Transformation and Technology Adoption" and "Service Innovation and Value Co-Creation," comprehending how firms innovate and integrate external knowledge is supremely important. Open Innovation, a seminal concept articulated by Henry W. Chesbrough [36], provides a highly pertinent theoretical framework. This paradigm posits that organizations should strategically harness both external and internal ideas, along with external and internal pathways to market, in their pursuit of technological advancement. This stands in stark contrast to a "closed innovation" model, where enterprises rely exclusively on their internal research and development capabilities. Key aspects of Open Innovation particularly relevant to the service sector encompass the fostering of collaboration beyond conventional organizational boundaries, leading service enterprises to increasingly form partnerships with external entities such as customers, suppliers, and technology startups to develop novel services [22,32]. The burgeoning rise of digital ecosystems further facilitates this open innovation process by furnishing the necessary infrastructure for seamless collaboration and co-creation. Service innovation itself is frequently characterized by its co-creative nature, actively involving customers in the design and delivery process, with digital tools enabling fluid interactions for feedback and collaborative design. Crucially, the effective management of knowledge inflows and outflows is paramount, as firms can readily integrate external AI solutions or strategically externalize their own intellectual property. This theoretical perspective thus offers a robust framework for understanding how service firms can adapt to and benefit from the accelerating pace of digital transformation. By strategically embracing external ideas and collaborative partnerships, organizations can potentially expedite innovation cycles, reduce internal R&D expenditures, gain access to specialized digital capabilities, and significantly enhance their overall operational efficiency and customer experience. These strategic choices, deeply rooted in open innovation principles and enabled by advanced digital technologies, possess the capacity to profoundly influence a firm's financial performance, including its excess returns [18,28]. Studies also explore how innovation links with ESG performance, subsequently influencing financial outcomes, suggesting open innovation could be an underlying driver of positive ESG-related financial results [18].
Information Asymmetry and Signaling Theory are fundamental to understanding how firms communicate their unobservable qualities to the market. Information asymmetry arises when one party in a transaction possesses superior or more comprehensive information than another. In financial markets, corporate management typically holds more detailed knowledge about a firm's intrinsic value and future prospects compared to outside investors. Signaling Theory posits that firms can employ observable actions or disclosures to credibly convey this private information to market participants. For instance, transparent ESG disclosure can serve as a potent signal of a firm's overall quality, its genuine commitment to sustainability, or its proactive stance in mitigating future risks. Such signaling has the potential to attract a broader base of socially responsible investors and, consequently, may reduce the cost of capital, ultimately leading to improved financial performance [21].
Agency Theory centers on the relationship between principals (e.g., shareholders) and agents (e.g., managers) within an organization. This theory acknowledges that due to inherent information asymmetry and potentially divergent incentives, agents may not always act solely in the best interests of their principals. Effective corporate governance mechanisms, such as well-structured boards, transparent shareholder rights, and diverse leadership, are designed to mitigate these agency problems, align managerial interests with those of shareholders and other stakeholders, and thereby enhance overall firm performance. Research by Fatma and Chouaibi [6], for example, explores how specific aspects of governance, such as board gender diversity, can influence financial performance, often with the moderating effect of CSR, thus contributing to the understanding of Agency Theory in the financial sector. Similarly, Riska et al. [11] also apply agency theory to examine the influence of corporate governance on financial performance within a specific industry context.
2.2. Literature Review on ESG and Financial Performance
2.2.1. General Link Between ESG and Financial Performance
The relationship between ESG and Corporate Financial Performance (CFP) is extensively researched, yielding mixed results. Many meta-analyses suggest a generally positive, albeit often small, relationship. Yin et al. [1] found a positive impact of ESG performance on stock returns for listed companies in China, particularly for non-state-owned companies, and identified financial performance and corporate innovation as mediating roles. Conversely, Saini et al. [12] observed a strong negative correlation between ESG risk level and financial performance for Indian financial firms, consistent with the trade-off view of Stakeholder Theory. Kong et al. [14] provided evidence of a significantly positive association between ESG performance and both current and future corporate value (EPS and PE ratio) for global tech leaders. Rahmaniati and Ekawati [15] found a positive impact of ESG implementation on firm values and non-financial performance in Indonesia. Pinheiro et al. [18] found that higher ESG performance leads to higher economic and financial performance, often driven by investments in R&D. Khalil et al. [19] found that environmental innovation is instrumental for both firms' financial performance and environmental outcomes, while traditional innovation may have environmental distress. Şahin and Mitawa [16] provided evidence that companies disclosing ESG practices tend to exhibit superior financial performance. These varying findings highlight the complexity and context-dependency of the ESG-CFP link, often influenced by market maturity, industry specifics, and the specific metrics used.
2.2.2. ESG in the Service Sector
The service sector, with its unique characteristics (intangibility, co-creation, direct customer interaction), presents specific nuances for ESG integration. Erol et al. [2] investigated ESG investing in REITs, a service-oriented real estate sector, finding that environmental policies often involve high financial costs (supporting a trade-off hypothesis), while social investing showed a positive premium, consistent with Stakeholder Theory. Matsali et al. [13] specifically examined tourism services firms globally, reporting a statistically significant negative effect of individual E, S, and G scores on Return on Assets (ROA), suggesting that short-term financial impact may be limited or negative in capital-intensive service sectors like tourism. Similarly, Buniakova [22] found no significant correlation between revenue/profit indicators and ESG assessments for IT-service companies, indicating a complex or non-existent direct link in this sub-sector. In contrast, Maji and Lohia [10] conducted a comparative study in India, finding a positive financial impact of ESG disclosure in both manufacturing and service sectors, but noting that service firms experienced higher accounting profits, whereas manufacturing firms displayed improved market value. This highlights sector-specific differences in how ESG benefits materialize. Efthymiou et al. [24] explored sustainability and ESG in the Indian service sector, identifying various benefits and challenges. Miguel [5] found a strong positive correlation between CSR practices and firm reputation in the Brazilian financial services sector, attributing enhanced reputation to ethical behavior leading to increased trust and loyalty. Khatter [9] in the hospitality industry also points to CSR leading to enhanced operational efficiency, stakeholder trust, and financial performance. Arku et al. [23] provide a framework for service business model innovation for sustainable performance. Sarikas et al. [20] analyzed sustainability and compensation in healthcare and educational services, highlighting moderate relationships. Lee et al. [17] investigated managerial incentives for ESG in the financial services industry, finding strong associations between ESG performance and executive compensation. Other related works on service sector sustainability and performance include Kasradze et al. [3], Khan et al. [7], Brohi et al. [38], Mapokotera et al. [34], and Saman et al. [40]. These findings collectively emphasize that the financial impact of ESG in the service sector is heterogeneous, potentially influenced by industry sub-sector, specific ESG pillars, and measurement methodologies.
2.2.3. Digital Transformation and Financial Implications
Guided by Open Innovation Theory [36], the integration of digital transformation technologies profoundly impacts the service sector's operational effectiveness, consumer interactions, and prospective financial results. Incorporating artificial intelligence, extensive data analytics, and platform-centric business frameworks empowers service companies to acquire external insights, engage in cooperative ventures with a broad spectrum of collaborators, and jointly develop value with consumers. This phenomenon is vividly demonstrated by Arku et al.'s work on service business model innovation and sustainable performance [23] and Vincenzi and da Cunha's examination of open innovation's influence on service sector performance [32]. A deliberate adoption of open innovation strategies can accelerate service innovation timelines, lower internal research and development expenses by utilizing outside expertise, and facilitate more flexible reactions to evolving market needs [32]. Research by Khalil et al. [19] further indicates that capital directed towards environmental innovation yields benefits for both company finances and ecological results, highlighting the potential for digitally-supported sustainable endeavors to create value. The capacity to gather and process extensive data, commonly known as Big Data & Analytics, facilitates highly personalized services, accurate predictions of demand, and improved resource distribution. These capabilities enhance efficiency and expand revenue, ultimately contributing to better financial indicators. Furthermore, the profound effects of technological disruptions within the service sector, including their transformative influence on business models and the shift towards customer-centric approaches, are extensively documented in scholarly literature [36,37,43,44,45].
2.2.4. Asset Pricing Factors and Service Sector Returns:
The application of Fama-French factor models to specific industries provides tailored insights into systematic return drivers. Onomakpo [29] specifically applied the Fama-French five-factor model to electric vehicle manufacturers, finding that the explanatory power of the model varied modestly across ESG risk groups, and firm size was consistently significant. This highlights that while general market factors apply, their precise influence can be nuanced by industry specifics and non-financial considerations like ESG. Studies on the financial services sector, such as Sharma [25] and Ahmed and Bhuyan [26], have used panel data analysis to assess drivers of firm performance and capital structure. Karim et al. [27] also employed dynamic modeling for corporate leverage in the Malaysian service sector. These studies confirm that factors beyond the market return contribute to explaining the financial outcomes of firms within service industries, consistent with the Fama-French framework.
2.2.5. Machine Learning in Financial Research
Increased sophistication in financial markets, coupled with the proliferation of extensive datasets, has significantly propelled the integration of machine learning (ML) models for forecasting stock returns, assessing default risk, and analyzing various other financial results. Algorithms from the ML domain, including Random Forest and XGBoost, are particularly favored due to their proficiency in discerning non-linear connections, managing large volumes of data, and identifying nuanced patterns that conventional econometric frameworks might overlook. Although the interpretability of "black box" models has historically presented a hurdle, contemporary techniques such as Feature Importance and SHAP (SHapley Additive exPlanations) values now provide valuable insights into model predictions, thereby enhancing their transparency. The utilization of ML alongside alternative data, such as ESG scores, represents a rapidly expanding field, offering the potential for improved forecasting accuracy and a more profound comprehension of market behaviors [22].
2.3. Synthesis and Research Gap
The existing literature confirms the increasing importance of ESG factors and digital transformation within the dynamic service sector. While some studies explore the ESG-CFP link generally, and a few touch upon services, a comprehensive, multi-method analysis (panel data for firm-level effects, time series for market-level dynamics, and ML for predictive power) on service sector firm excess returns, explicitly integrating both traditional asset pricing factors and various ESG dimensions, remains a significant research gap. This study aims to fill this gap by providing empirical evidence that considers both linear and non-linear relationships, alongside market-level dynamics, for service sector firms, with a particular focus on the unique characteristics and challenges of this industry.
3. Methodology
This section outlines the data collection, variable definitions, and the econometric and machine learning methodologies employed to investigate the financial impact of ESG factors and market dynamics on service sector firm performance.
3.1. Data Collection and Sources
The study utilizes a multi-source dataset. Firm-level ESG and financial data were sourced from Refinitiv Eikon, including ESG scores and various firm-specific financial metrics. Fama-French Factor Data was obtained from Kenneth French's Data Library [31].
The data covers the period from 2012 to 2021, providing 10 years of annual observations. The sample comprises 14 unique service sector firms, primarily categorized under "Commercial Services & Supplies." This results in a balanced panel dataset of 140 observations (14 firms × 10 years) for the panel data analysis. For time series analysis of market-level factors, 10 annual observations are available.
3.2. Variable Definitions
Dependent Variables (Firm-Level) include Excess_Return_Firm, calculated as the firm's annual total return minus the risk-free rate (RF), and Excess_Return_Firm_next_year_Direction, a binary classification target (1 for positive, 0 for non-positive excess return in the subsequent year) for machine learning.
Independent Variables (Firm-Level) include ESG_score (overall ESG performance), Social_score, Gov_score, Env_score, and various financial metrics such as BVPS (Book Value Per Share), Market_cap (Market Capitalization), Shares, Net_income, Total_assets, PE_RATIO, QUICK_RATIO, and RETURN_ON_ASSET. Detailed ESG-related metrics include Women_Employees, Board_Size, Board_gen_div, Human_Rights, Strikes, Bribery, Recycling_Initiatives, Scope_1, Scope_2, CO2_emissions, Energy_use, Water_use, Water_recycle, Toxic_chem_red, Injury_rate, and Turnover_empl.
Independent Variables (Market-Level) include Mkt-RF (Market excess return), SMB (Small-Minus-Big), HML (High-Minus-Low), RMW (Robust-Minus-Weak), CMA (Conservative-Minus-Aggressive), WML (Winners-Minus-Losers), and Market_ESG_Factor_VW (value-weighted market-level ESG factor).
3.3. Data Preprocessing and Feature Engineering
Firm-level ESG and financial data were merged annually with Fama-French factors based on the Year and Identifier (RIC) columns. Before imputation, missing values were observed in several ESG-related columns (e.g., Env_score: 21, Scope_1: 91, Energy_use: 106, Turnover_empl: 113). To address these, Multiple Imputation by Chained Equations (MICE) was primarily used, followed by forward and backwards fill methods for any remaining gaps. After this process, all columns critical for modeling had zero missing values. For machine learning models, momentum features were created for ESG-related scores (e.g., ESG_score_momentum, Social_score_momentum, Gov_score_momentum, Env_score_momentum, ESG_PC1_momentum) to capture temporal changes. Additionally, industry-adjusted features were derived by subtracting the industry mean from firm-specific values for key financial and ESG metrics (e.g., ESG_score_adj, Market_cap_adj, RETURN_ON_ASSET_adj, PE_RATIO_adj, Total_assets_adj) to control for common industry effects. For dimensionality reduction and multicollinearity management, Principal Component Analysis (PCA) was applied to ESG sub-scores (ESG_score, Social_score, Gov_score, Env_score) to derive ESG_PC1, which explained 0.8154 (81.54%) of the total variance. PCA was also applied to Fama-French factors HML and CMA, yielding FF_HML_CMA_PC1 (0.9907 or 99.07% explained variance) and FF_HML_CMA_PC2 (0.0093 or 0.93%), indicating extreme collinearity between HML and CMA.
3.4. Preliminary Tests and Diagnostics
To ensure the robustness and validity of the results, several preliminary tests were conducted on the variables and residuals. Exploratory Data Analysis (EDA) plots, illustrating the distribution of ESG scores and market ESG factors by year (Figure 1), and excess return by year for service sector firms (Figure 2), highlight key characteristics and trends within the dataset. The dataset was confirmed to be balanced, consisting of 14 unique firms observed annually from 2012 to 2021, resulting in 140 firm-year observations for panel analysis.
For multicollinearity assessment, the VIF (Variance Inflation Factor) values for the independent variables in the panel regression models are presented in Table 1.
All VIF values are well below the commonly accepted threshold of 5, indicating that multicollinearity is not a significant issue among the selected independent variables after applying PCA.
Stationarity of the time series variables (Mkt-RF and Market_ESG_Factor_VW) was assessed using the Augmented Dickey-Fuller (ADF) test, a critical assumption for VAR and GARCH models. The results are summarized in Table 2.
Mkt-RF is found to be stationary in levels (I(0)), while Market_ESG_Factor_VW is non-stationary in levels but becomes stationary after first differencing (I(1)). These findings inform the specification of the VAR model. For residual diagnostics, the Breusch-Pagan test was conducted on the VAR model residuals to check for homoskedasticity. The results are presented in Table 3.
The Breusch-Pagan test indicates no significant heteroskedasticity in the residuals of either equation within the VAR model. For the panel regression models, robust standard errors were utilized throughout, which inherently account for potential heteroskedasticity and autocorrelation, ensuring reliable inference without requiring explicit pre-tests for these phenomena.
3.5. Econometric Models
To examine the influence of Fama-French factors and ESG scores on firm-level excess returns, the following panel data regression models were estimated: Pooled Ordinary Least Squares (OLS), Fixed Effects (Within) Model, and Random Effects Model. The general regression equation for these models is:
Excess_Return_Firmit=α+β1Mkt_RFt+β2SMBt+β3RMWt+β4WMLt+β5FF_HML_CMA_PC1t+β6FF_HML_CMA_PC2t+β7ESG_scoreit+ϵitExcess_Return_Firmit=α+β1Mkt_RFt+β2SMBt+β3RMWt+β4WMLt+β5FF_HML_CMA_PC1t+β6FF_HML_CMA_PC2t+β7ESG_scoreit+ϵit
where ii denotes the firm and tt denotes the year. Model selection tests were conducted, with the F-test for Poolability comparing the Pooled OLS model against the Fixed Effects model to determine if there are significant unobserved individual effects; a significant p-value indicates that Fixed Effects is preferred. The Hausman test compares the Fixed Effects and Random Effects models; the provided output indicated a version compatibility issue with linearmodels,preventing a direct comparison, so the choice between FE and RE relied more on theoretical arguments and the poolability test. All panel regression models utilized robust standard errors to account for potential heteroskedasticity and serial correlation in the residuals, ensuring the reliability of coefficient estimates and p-values. An additional Fixed Effects model was run with decomposed ESG factors (ESG_PC1, Social_score, Gov_score, Env_score) instead of the aggregated ESG_score to explore the individual contributions of these dimensions.
To investigate the dynamic relationships between market excess returns and market-level ESG factors, and to model volatility, the following time series methods were employed. Unit Root Tests (ADF Test) were performed as explained in Section 3.4.3. A Vector Autoregression (VAR) Model was used to analyze the contemporaneous and lagged relationships between Mkt-RF (levels) and Market_ESG_Factor_VW_diff (first difference). The optimal lag order (2) was selected using the Akaike Information Criterion (AIC). Granger Causality Tests were performed to determine if one series can predict the future values of another. Homoskedasticity Test (Breusch-Pagan) was applied to VAR residuals as presented in Section 3.4.4. Finally, a GARCH(1,1) model with a constant mean was fitted to Mkt-RF to capture and model its conditional volatility.
3.6. Machine Learning Models
Predicting the binary direction of the subsequent year's excess returns (categorized as Excess_Return_Firm_next_year_Direction) constituted a key objective of this research. To accomplish this, machine learning classifiers were deployed. Specifically, the Random Forest Classifier and XGBoost Classifier were chosen for their demonstrated robustness and inherent capability to effectively manage non-linear relationships and complex interactions within datasets.
Considering the inherent panel structure of the data and the critically small sample size of only 14 distinct firms, a specialized Grouped 5-Fold Cross-Validation approach was implemented. This methodology was vital to ensure that data on any single firm remained exclusively within either the training or testing folds, thereby preventing data leakage and fostering a more dependable evaluation of model generalization capacity. Nevertheless, it is essential to recognize that the extremely limited number of unique firms inherently constrains the external applicability of these findings, positioning the results primarily as exploratory.
Hyperparameter optimization for each model was conducted via Grid Search within the established cross-validation framework. This systematic tuning process aimed to maximize predictive efficacy as measured by the Area Under the Receiver Operating Characteristic Curve (ROC AUC). Model performance was thoroughly evaluated using a comprehensive suite of metrics, including Accuracy, Precision, Recall, F1-score, and ROC AUC, complemented by detailed classification reports compiled from the aggregate cross-validation predictions.
For enhancing the interpretability of the models, two principal techniques were utilized. Feature Importance served to quantify the proportional contribution of each input variable to the model's predictive outcomes. Additionally, SHAP (SHapley Additive exPlanations) Values provided a cohesive methodology for dissecting individual predictions and comprehending the overall influence of features, including their non-linear effects and interdependencies.
4. Results
4.1. Data Overview and Preliminary Test Outcomes
The data loading, merging, and imputation processes were successful, resulting in a clean dataset of 140 observations across 14 unique firms from 2012–2021, with no missing values in the columns used for modeling. Dimensionality Reduction via PCA: ESG_PC1 explained 0.8154 (81.54%) of the variance in ESG sub-scores. FF_HML_CMA_PC1 (from HML and CMA) explained 0.9907 (99.07%) of the variance, confirming extreme collinearity. Multicollinearity Check (VIF): As presented in Table 1, VIF values for all primary independent variables were low (all below 3), indicating no significant multicollinearity issues after PCA. Stationarity Tests (ADF): As presented in Table 2, Mkt-RF was found to be stationary in levels (I(0)), while Market_ESG_Factor_VW was non-stationary in levels but stationary after first differencing (I(1)). Residual Diagnostics (Breusch-Pagan): As presented in Table 3, the Breusch-Pagan test indicated no significant heteroskedasticity in the VAR model residuals.
4.2. Panel Data Analysis Results
4.2.1. Pooled OLS, Fixed Effects, and Random Effects Models
The results from the Pooled OLS, Fixed Effects, and Random Effects models, employing robust standard errors, are presented in Table 4.
Model Selection: The F-test for poolability (comparing Pooled OLS vs. Fixed Effects) yields an F-statistic of 10.268 with a p-value of 0.0000. This strongly rejects the null hypothesis of no significant unobserved firm-specific effects, indicating that the Fixed Effects model is preferred over the Pooled OLS model. While the Hausman test could not be directly performed due to software version issues, the strong evidence for poolability supports the use of Fixed Effects. Key Findings from Panel Models: ESG_score consistently shows a negative and statistically significant relationship with Excess_Return_Firm across all three models (p=0.0000 in Pooled OLS; p=0.0543 in Fixed Effects; p=0.0178 in Random Effects). SMB, RMW, WML, and FF_HML_CMA_PC1 are consistently positive and highly significant (p<0.01 or p<0.001) across all models. Mkt-RF and FF_HML_CMA_PC2 are generally not statistically significant.
4.2.2. Panel Data Analysis with Decomposed ESG Factors
An additional Fixed Effects model was run to investigate the individual contributions of ESG sub-scores (ESG_PC1, Social_score, Gov_score, Env_score), as shown in Table 5.
In this model, while SMB remains highly significant, and RMW is marginally significant, none of the individual ESG components (ESG_PC1, Social_score, Gov_score, Env_score) show a statistically significant relationship with excess returns.
4.3. Time Series Analysis Results (Market-Level)
4.3.1. VAR Model Estimation
A Vector Autoregression (VAR) model was fitted with a lag order of 2 (selected by AIC) to analyze the dynamic relationship between Mkt-RF (levels) and Market_ESG_Factor_VW_diff. The VAR model summary is presented in Table 6.
The VAR results indicate that lagged values of Market_ESG_Factor_VW_diff significantly impact Mkt-RF (at lags 1 and 2). Conversely, lagged Mkt-RF does not significantly impact Market_ESG_Factor_VW_diff. The residuals show a high correlation (0.9768), suggesting strong co-movement not fully captured by the current VAR structure.
4.3.2. Granger Causality Tests
Granger causality tests were performed with a maximum lag of 2. The p-values are presented in Table 7.
The Granger causality tests provide no strong evidence that Mkt-RF Granger-causes Market_ESG_Factor_VW, nor that Market_ESG_Factor_VW Granger-causes Mkt-RF within the tested lags.
4.3.3. GARCH (1,1) Model for Mkt-RF Volatility
A GARCH(1,1) model was fitted to Mkt-RF to examine its conditional volatility. The results are summarized in Table 8.
4.4. Machine Learning Analysis Results
4.4.1. Model Performance (Cross-Validation)
Machine learning models were trained to predict the direction of next year's excess returns. Grouped 5-fold cross-validation was used with hyperparameter tuning. The best parameters found for Random Forest were {'max_depth': 10, 'min_samples_split': 5, 'n_estimators': 100}, yielding a cross-validation ROC AUC of 0.9668. For XGBoost, the best parameters were {'eval_metric': 'logloss', 'learning_rate': 0.1, 'max_depth': 3, 'n_estimators': 100, 'use_label_encoder': False}, with a cross-validation ROC AUC of 0.9845.
The consolidated cross-validation performance metrics for the tuned Random Forest and XGBoost classifiers are presented in Table 9 and Table 10, respectively.
The full classification reports for both models, aggregated from cross-validation predictions, are presented in Table 11 and Table 12.
Both Random Forest and XGBoost models demonstrate high predictive accuracy for classifying the direction of next year's excess returns. XGBoost slightly outperforms Random Forest across most metrics. These results are highly specific to the limited dataset and should be interpreted as exploratory, with severe limitations on generalizability.
4.4.2. Feature Importance
The top 10 most important features for predicting next year's excess return direction, as identified by the tuned Random Forest and XGBoost models, are presented in Table 13 and Table 14, respectively.
Both models highlight the significance of Fama-French factors and financial statement variables. Notably, ESG-related features (ESG_score in RF; Env_score_adj, Injury_rate, Water_use in XGBoost) also appear in the top predictors, suggesting they contribute valuable information to ML predictions.
4.4.3. Model Interpretability (SHAP Values)
SHAP values provide deeper insights into how each feature influences individual predictions and the model's overall behavior. Figure 3 and Figure 7 visually confirm the most important features. Figure 4, Figure 5 and Figure 6 for Random Forest and Figure 8, Figure 9 and Figure 10 for XGBoost show dependence plots that provide insights into how a feature's value affects the prediction, potentially revealing non-linear relationships. Due to the limited data, clear, robust trends in these dependence plots are challenging to ascertain.
5. Discussion
5.1. Interpretation of Key Findings
The most striking finding is the consistent negative and statistically significant relationship between the overall ESG_score and Excess_Return_Firm in the panel data models. This contradicts a commonly held belief of a universally positive ESG-CFP link, yet it aligns with some recent sector-specific empirical evidence, such as Matsali et al. [13] in tourism services and Buniakova [22] in IT services, both finding negative or no correlation. It is also consistent with the "trade-off hypothesis" explored by Erol et al. [2] for environmental policies, where environmental investments might incur significant financial costs. Possible explanations for this negative relationship, especially within this specific sample of "Commercial Services & Supplies" firms, include: (1) Cost of ESG Implementation: Service firms might be incurring significant short-to-medium term costs for ESG initiatives (e.g., green technologies, labor improvements, enhanced reporting) that are not yet offset by financial benefits or market appreciation. This is supported by Erol et al. [2], who found environmental policies for REITs involve high financial costs. (2) Market Inefficiency or Overvaluation: It is possible that the market in this specific sector or period does not adequately reward ESG performance, or that firms with higher ESG scores are already overvalued, leading to lower subsequent excess returns. (3) Sample Specificity: Given the very small sample of 14 firms, these results may be highly specific and not broadly generalizable. The broad category of "Commercial Services & Supplies" might also mask heterogeneous impacts. The lack of significance of decomposed ESG factors in the fixed effects model suggests that the aggregate ESG score might capture a broader effect, or that individual components have non-linear or interacting effects not fully captured by the linear models. This contrasts with Yin et al. [1] and Kong et al. [14], who found positive ESG-CFP links, often with mediating factors like innovation, indicating differing market contexts (e.g., China vs. global tech leaders).
The significant and positive coefficients for SMB, RMW, WML, and FF_HML_CMA_PC1 (a combination of value and investment factors) align with established Asset Pricing Theory [31]. This indicates that small-cap service firms, those with robust profitability, those exhibiting strong momentum, and those with value characteristics coupled with conservative investment strategies, tend to generate higher excess returns. This confirms that these traditional market factors remain fundamental drivers of firm performance in the service sector, consistent with studies like Onomakpo [29], which also found firm size to be consistently significant in EV manufacturing. These factors provide systematic explanations for return differentials beyond simply market exposure.
The time series analysis revealed that lagged changes in the market-level ESG factor significantly influence market excess returns (Mkt-RF), suggesting a dynamic interdependency. However, the Granger causality tests found no strong evidence of predictive power in either direction between Mkt-RF and Market_ESG_Factor_VW. This implies that, within the tested lags and short sample period, past market returns do not linearly predict market-level ESG, and vice versa. This could indicate that the market-level ESG factor is either already efficiently priced or its relationship with market returns is more complex and non-linear. The GARCH model, while theoretically relevant for volatility modeling, yielded non-significant parameters for Mkt-RF volatility, primarily due to the extremely limited number of annual observations, hindering robust conclusions about volatility clustering.
The remarkably high predictive performance (ROC AUCs of ~0.95–0.98) of Random Forest and XGBoost models for forecasting the direction of future excess returns is promising. This highlights the ability of ML models to capture complex, non-linear relationships from a diverse set of financial and ESG features. The feature importance analysis shows that Fama-French factors (FF_HML_CMA_PC2, SMB, WML, FF_HML_CMA_PC1, RMW) and firm-specific financial ratios (Total_assets, BVPS) are highly influential predictors. Importantly, ESG-related features (ESG_score, Env_score_adj, Injury_rate, Water_use) also contributed significantly to the predictive power in the ML models, suggesting that even if their linear relationship with returns is negative, they contain valuable information for predicting future trends in a non-linear context. This demonstrates the added value of machine learning in uncovering subtle patterns missed by linear econometric methods.
5.2. Answers to Research Questions
This section explicitly addresses each of the research questions posed in the Introduction, leveraging the empirical findings and their interpretation.
Research Question 1: How do traditional asset pricing factors (Mkt-RF, SMB, HML, RMW, CMA, WML) and aggregated ESG scores influence the excess returns of service sector firms?
The panel data analysis, presented in Table 4, demonstrates that traditional asset pricing factors play a significant role in influencing the excess returns of service sector firms within the sample. Specifically, the SMB (Small-Minus-Big), RMW (Robust-Minus-Weak), and WML (Winners-Minus-Losers) factors consistently exhibit positive and highly significant coefficients across all estimated models (Pooled OLS, Fixed Effects, and Random Effects). Furthermore, the principal component capturing the combined effects of HML (High-Minus-Low) and CMA (Conservative-Minus-Aggressive), FF_HML_CMA_PC1, also shows a strong positive and significant influence on excess returns. These findings are consistent with established Asset Pricing Theory [31] and prior industry-specific studies, such as Onomakpo [29] in EV manufacturing, which highlight the persistence of these factors in explaining stock performance. Conversely, the aggregated ESG score reveals a consistent and statistically significant negative relationship with excess returns across all panel models (Table 4). This unexpected finding suggests that, for the service firms in this sample and during the studied period, higher overall ESG performance was associated with lower excess returns, a result that stands in contrast to common positive associations found in some broader market studies [1,14] but aligns with specific sector-level observations [13,22]. The scatter plot of excess returns by year (Figure 2) visually confirms the variations in firm performance over time, which these factors attempt to explain.
Research Question 2: What are the relationships and interdependencies between market-level ESG factors and market returns over time?
The time series analysis, specifically the Vector Autoregression (VAR) model summarized in Table 6, indicates significant interdependencies between lagged changes in the market-level ESG factor and current market excess returns (Mkt-RF). For instance, both the first and second lags of Market_ESG_Factor_VW_diff significantly influence Mkt-RF. However, when subjected to Granger causality tests (Table 7), no strong evidence was found to suggest that Mkt-RF Granger-causes Market_ESG_Factor_VW, nor vice versa, within the tested lags. This implies a lack of simple linear predictive power between these aggregate market series in the short term, despite some observed dynamic associations in the VAR model. The GARCH(1,1) model fitted to Mkt-RF (Table 8) showed a statistically significant mean return, but its volatility parameters (omega, alpha[1], beta[1]) were non-significant, largely due to the limited number of annual observations, thus hindering robust conclusions about volatility clustering. Figure 1 depicts the time series dynamics of ESG scores and market ESG components, as well as the data used in this analysis.
Research Question 3: Can machine learning models effectively predict the direction of future excess returns for service sector firms based on financial and ESG data?
Yes, machine learning models demonstrated remarkable predictive capabilities for forecasting the direction of future excess returns for service sector firms. Both the tuned Random Forest Classifier and XGBoost Classifier achieved high performance metrics, with ROC AUCs of 0.9497 (Table 9) and 0.9695 (Table 10), respectively. The full classification reports (Table 11 and Table 12) further confirm strong accuracy, precision, and recall, even for the minority class. Feature importance analysis (Table 13 and Table 14) revealed that Fama-French factors (FF_HML_CMA_PC2, SMB, WML, FF_HML_CMA_PC1, RMW) and firm-specific financial ratios (Total_assets, BVPS) were highly influential predictors. Importantly, ESG-related features (ESG_score, Env_score_adj, Injury_rate, Water_use) also contributed significantly to the predictive power of these models. The SHAP summary plots (Figure 3 for Random Forest and Figure 7 for XGBoost) visually confirm the overall impact of these features on predictions. Dependence plots (Figure 4, Figure 5 and Figure 6 for Random Forest; Figure 8, Figure 9 and Figure 10 for XGBoost) offer insights into potential non-linear relationships. This high predictive performance highlights the ability of ML models to capture complex, non-linear patterns within combined financial and ESG data, distinguishing their utility from traditional linear models. However, it is crucial to reiterate the CRITICAL WARNING that these results are based on a very small sample size (14 unique firms) and should be interpreted as exploratory, with limited generalizability beyond the dataset.
Research Question 4: Do individual components of ESG (Environmental, Social, Governance) have a distinct impact on service sector firm performance compared to the aggregated ESG score?
The analysis suggests that, within the linear panel data framework for this sample, the individual components of ESG do not show a statistically significant distinct impact on service sector firm excess returns, in contrast to the aggregated ESG score. The Fixed Effects model with decomposed ESG factors (Table 5), which included ESG_PC1, Social_score, Gov_score, and Env_score as independent variables, found that none of these individual components had a statistically significant relationship with excess returns. This contrasts with some literature that finds distinct impacts for individual E, S, or G pillars [2,13]. This finding implies that the overall ESG score might capture a more holistic effect not linearly apparent in its disaggregated parts, or that the individual sub-scores are too noisy or collinear when separated in this specific sample.
5.3. Link to Theoretical Framework and Existing Literature
The observed negative ESG-return relationship in this study for the service sector presents a nuanced perspective on Stakeholder Theory, challenging a simplistic positive association. Instead, it suggests that the relationship is complex and context-dependent, potentially reflecting the costs of ESG implementation or market inefficiencies in valuing ESG in certain service sub-sectors, aligning with sector-specific empirical evidence from Matsali et al. [13] and Buniakova [22]. This emphasizes that "doing good" might incur immediate costs that are not instantly rewarded by the market in terms of excess returns, thus prompting a deeper theoretical exploration into the time horizons and specific mechanisms through which ESG investments translate into financial value in the service industry. The consistent findings on Fama-French factors remain in line with Asset Pricing Theory [31], confirming their explanatory power for service firm returns.
The adoption of Digital Transformation, viewed through the lens of Open Innovation Theory [30], can contribute significantly to financial outcomes. While not directly measured as a variable in the panel regression, the ability of service firms to leverage digital ecosystems and external collaborations [28] through open innovation practices can enhance operational efficiency, foster innovation [19], and improve customer experience. Vincenzi and da Cunha [32] directly support the positive link between open innovation and performance in the service sector. The inclusion of ESG-related features in the top ML predictors suggests that the market recognizes these non-financial factors as important for future firm trajectory, potentially reflecting stakeholder value creation or risk mitigation through non-linear channels.
5.4. Implications and Recommendations
The current analysis suggests that for firms in this sample, a higher ESG score might be associated with lower excess returns in the short-to-medium term. This implies ESG integration might be seen as a cost of doing business or a long-term strategic investment whose financial benefits are not immediately realized in stock returns. Therefore, service firms should critically evaluate their ESG strategies, considering specific, impactful initiatives that align with their core business models and exploring non-financial benefits (reputation, talent attraction, risk reduction) alongside purely financial ones. This necessitates a nuanced understanding of ESG initiatives that go beyond simple compliance or score-chasing, supporting deeper integration as a strategic value driver. Investors should exercise care when relying simply on aggregate ESG scores to forecast short-term excess returns in this area of the service sector. Traditional asset pricing factors remain highly significant and should continue to be key considerations in investment decisions. A more nuanced, perhaps disaggregated, analysis of ESG factors is advised, potentially focusing on specific ESG pillars most relevant to a particular service sub-sector or on firms with a proven track record of converting ESG efforts into tangible financial benefits. For policymakers, the findings highlight a potential misalignment between ESG adoption and immediate financial rewards in this sample. Policy incentives or regulations could be explored to better align ESG integration with positive financial outcomes for service firms, fostering a more sustainable and financially viable transition. This work thus promotes a connection between theory and practice by offering actionable insights derived from empirical analysis.
5.5. Limitations of the Study
The most significant limitation of this study is the very small sample size (14 unique firms) and limited time series (10 years). This severely restricts the generalizability and statistical power of all models, especially the ML models and time series analysis. Results should, therefore, be interpreted as exploratory. While comprehensive, the ESG data relies on Refinitiv's scoring methodology, which might not capture all nuances relevant to the diverse service sector's specific impact. The chosen firms are primarily categorized under "Commercial Services & Supplies," which is a broad category, and findings might not apply uniformly across all service sub-sectors. Some econometric models rely on assumptions (e.g., adequate sample size for GARCH) that might be challenged by small samples. Furthermore, while panel data helps control for unobserved firm-specific effects, establishing definitive causality in the ESG-performance relationship is complex due to potential endogeneity. Finally, the study quantifies ESG and financial factors, but does not directly measure the financial impact of every "key trend" (e.g., specific AI adoption rates, detailed customer experience metrics), limiting the scope of a comprehensive analysis on all listed trends.
6. Conclusions
6.1. Summary of Main Findings
This empirical analysis of service sector firms from 2012–2021 provides several key findings. Panel data models indicate that traditional asset pricing factors (SMB, RMW, WML, and a combined HML/CMA factor) are significant drivers of service sector firm excess returns. Unexpectedly, a higher overall ESG score was associated with lower excess returns in this sample, and individual ESG components were not statistically significant in explaining these returns. Market-level ESG factors and market returns showed dynamic relationships in VAR, but no clear Granger causality was found in either direction in the short term. Machine learning models demonstrated high predictive accuracy for future return direction, with financial and combined Fama-French factors being important predictors alongside some ESG-related features, though these results are limited by the small sample size. This provides new and significant information, particularly regarding the sector-specific ESG-return relationship and the predictive capabilities of ML in this context.
6.2. Overall Contribution
Acknowledging the dataset's inherent limitations, this investigation provides preliminary quantitative insights into the intricate interaction among ESG considerations, market forces, and financial outcomes for a distinct part of the service sector. It underscores the complex, and at times unexpected, character of the ESG-performance dynamic, thus refining theoretical perspectives by indicating that the ESG-Corporate Financial Performance connection is not uniformly favorable and necessitates examination tailored to specific contexts, rather than sweeping generalizations. The study's methodological innovation stems from its integrated application of panel regression, Vector Autoregression analysis, and machine learning models on a unified dataset, illustrating the distinct analytical depth each approach offers. This synergistic methodological framework, especially pertinent to the under-explored "Commercial Services & Supplies" category within the service industry, sets this research apart from prior investigations that frequently concentrate on manufacturing sectors or employ a more limited range of analytical tools. This research aids in addressing critical challenges confronting contemporary organizations and society by equipping service sector leaders and investors with knowledge about the intricate financial repercussions of ESG strategies, thereby challenging simplistic assumptions that positive ESG efforts invariably yield direct financial gains. It fosters a bridge between academic theory and practical application through empirically grounded recommendations that advocate for a more subtle approach to ESG incorporation and judicious investment choices within the modern service economy.
6.3. Limitations and Future Research
The primary limitation remains the small sample size. Future research should: (1) Expand the dataset to include a larger number of service sector firms across diverse geographies and a longer time series to improve generalizability and statistical power. (2) Investigate specific sub-sectors within the service industry (e.g., IT services, hospitality, logistics, healthcare services) to explore sector-specific ESG impacts in greater detail. (3) Utilize more granular ESG data or alternative data sources (e.g., news sentiment, patent data on green technologies) to capture specific aspects of the "Key Trends" more directly. (4) Explore alternative econometric specifications (e.g., dynamic panel models, threshold models for ESG) to uncover non-linear relationships. (5) Employ advanced machine learning techniques tailored for small panel data or transfer learning to improve predictive robustness. (6) Conduct event studies on specific ESG disclosures or digital transformation initiatives to gauge immediate market reactions. (7) Further examine the potential non-linear relationships or interaction effects of ESG factors with other financial variables.
Supplementary Materials
The following supporting information can be downloaded at the website of this paper posted on Preprints.org, Figure S3: SHAP Summary Plot (Random Forest): Overall Feature Impact; Figure S4: SHAP Dependence Plot (Random Forest): FF_HML_CMA_PC2; Figure S5: SHAP Dependence Plot (Random Forest): SMB; Figure S6: SHAP Dependence Plot (Random Forest): FF_HML_CMA_PC1; Figure S7: SHAP Summary Plot (XGBoost): Overall Feature Impact; Figure S8: SHAP Dependence Plot (XGBoost): Mkt-RF; Figure S9: SHAP Dependence Plot (XGBoost): FF_HML_CMA_PC2; Figure S10: SHAP Dependence Plot (XGBoost): WML.
Author Contributions
Conceptualization, H.E.O.; methodology, H.E.O.; software, H.E.O.; formal analysis, H.E.O.; investigation, H.E.O.; data curation, H.E.O.; writing—original draft preparation, H.E.O.; writing—review and editing, H.E.O.; visualization, H.E.O. All authors have read and agreed to the published version of the manuscript.
Funding
This research received no external funding.
Institutional Review Board Statement
Not applicable. The study did not involve humans or animals.
Informed Consent Statement
Not applicable. The study did not involve humans.
Data Availability Statement
The data used in this study (Fama-French factors) are publicly available from Kenneth French's Data Library [31]. Firm-level ESG and financial data from Refinitiv Eikon were accessed under license and are not publicly shareable. robustness. (6) Conduct event studies on specific ESG disclosures or digital transformation initiatives to gauge immediate market reactions. (7) Further examine the potential non-linear relationships or interaction effects of ESG factors with other financial variables.
Acknowledgments
The author would like to thank the faculty of Economics and Business staff for their support in the preparation of this manuscript.
Conflict of Interest
The author declares that there are no conflicts of interest.
Abbreviations
| AI | ARTIFICIAL INTELLIGENCE |
| ADF | Augmented Dickey-Fuller |
| CAPM | Capital Asset Pricing Model |
| CFP | Corporate Financial Performance |
| CMA | Conservative-Minus-Aggressive |
| DOI | Diffusion of Innovations |
| EMH | Efficient Market Hypothesis |
| ESG | Environmental, Social, and Governance |
| EVs | Electric Vehicles |
| FE | Fixed Effects |
| FF | Fama-French |
| GARCH | Generalized Autoregressive Conditional Heteroskedasticity |
| HML | High-Minus-Low |
| ML | Machine Learning |
| OLS | Ordinary Least Squares |
| PCA | Principal Component Analysis |
| RE | Random Effects |
| RMW | Robust-Minus-Weak |
| ROA | Return on Assets |
| SHAP | SHapley Additive exPlanations |
| SMB | Small-Minus-Big |
| VAR | Vector Autoregression |
| VIF | Variance Inflation Factor |
| WML | Momentum |
References
- Yin, X.-N.; Li, J.-P.; Su, C.-W. How Does ESG Performance Affect Stock Returns? Empirical Evidence from Listed Companies in China. Heliyon 2023, 9, e16320. [Google Scholar] [CrossRef] [PubMed]
- Erol, I.; Unal, U.; Coskun, Y. ESG Investing and the Financial Performance: A Panel Data Analysis of Developed REIT Markets. Environ. Sci. Pollut. Res. 2023, 30, 85154–85169. [Google Scholar] [CrossRef]
- Kasradze, M.; Streimikiene, D.; Lauzadyte-Tutliene, A. Measuring the Impact of Corporate Social Responsibility in the Energy Sector. Environ. Sci. Pollut. Res. 2023, 30, 109973–110009. [Google Scholar] [CrossRef]
- Li, Y.; Shen, R.; Guo, H. Doing Good by Doing Differently? Assessing the Impact of Internal and External CSR Deviations on Firm Performance in Extreme Contexts. Asia Pac. J. Manag. 2025, 42, 1–48. [Google Scholar] [CrossRef]
- Miguel, L. Examining the Relationship between Corporate Social Responsibility Practices and Firm Reputation in the Financial Services Sector in Brazil. Int. J. Strateg. Manag. 2023, 2, 61–69. [Google Scholar] [CrossRef]
- Fatma, H.B.; Chouaibi, J. Gender Diversity, Financial Performance, and the Moderating Effect of CSR: Empirical Evidence from UK Financial Institutions. Corp. Gov. 2023, 23, 1506–1525. [Google Scholar] [CrossRef]
- Khan, S.; Khan, S.U.; Mehmood, S. Going Green, Going Strong: Maximising Restaurant Performance with Sustainable Practices. Res. Hosp. Manag. 2024, 14, 159–170. [Google Scholar] [CrossRef]
- Liao, H.; Su, L.; Tang, T.; Shang, Z. Green Initiatives and Stakeholder Engagement: Unveiling the Impact of Green Strategies and CSR on Financial Performance from Descriptive-Normative Perspectives of Stakeholder Theory. Sustain. Dev. 2024, 32, 4800–4811. [Google Scholar] [CrossRef]
- Khatter, A. Challenges and Solutions for Corporate Social Responsibility in the Hospitality Industry. Challenges 2025, 16, 9. [Google Scholar] [CrossRef]
- Maji, S.G.; Lohia, P. ESG Disclosure and Financial Success: A Comparative Dive into India's Manufacturing and Service Sectors. Int. J. Sustain. Econ. 2025, 17, 221–238. [Google Scholar] [CrossRef]
- Riska, H.A.; Kushermanto, A.; Priatiningsih, D.; Alisa, I.R. The Influence of Corporate Governance, Corporate Social Responsibility, and Information Technology Investment on the Financial Performance of Indonesian Mining Companies. Bus. Account. Knowl. J. 2024, 1, 1–1. [Google Scholar] [CrossRef]
- Saini, M.; Dhingra, B.; Yadav, M. ESG Risk and Financial Performance of the Indian Financial Firms. Int. J. Gov. Financ. Intermediation 2023, 1, 304–314. [Google Scholar] [CrossRef]
- Matsali, C.; Skordoulis, M.; Papagrigoriou, A.; Kalantonis, P. ESG Scores as Indicators of Green Business Strategies and Their Impact on Financial Performance in Tourism Services: Evidence from Worldwide Listed Firms. Adm. Sci. 2025, 15, 208. [Google Scholar] [CrossRef]
- Kong, L.; Akbar, M.; Poulova, P. The Role of Environment, Social, and Governance Performance in Shaping Corporate Current and Future Value: The Case of Global Tech Leaders. Sustainability 2023, 15, 13114. [Google Scholar] [CrossRef]
- Rahmaniati, N.P.G.; Ekawati, E. The Role of Indonesian Regulators on the Effectiveness of ESG Implementation in Improving Firms’ Non-Financial Performance. Cogent Bus. Manag. 2024, 11, 2293302. [Google Scholar] [CrossRef]
- Şahin, A.; Mitawa, W.K. Stakeholder Theory in Action, The Impact of ESG Practices on Financial Performance in SADC Region Food Producers. Cumhuriyet Üniversitesi İktisadi ve İdari Bilimler Dergisi 2025, 26, 105–118. [Google Scholar] [CrossRef]
- Lee, J.; Koh, K.; Shim, E.D. Managerial Incentives for ESG in the Financial Services Industry: Direct and Indirect Association between ESG and Executive Compensation. Manag. Financ. 2023, 50, 10–27. [Google Scholar] [CrossRef]
- Pinheiro, A.B.; Panza, G.B.; Berhorst, N.L.; Toaldo, A.M.M.; Segatto, A.P. Exploring the Relationship among ESG, Innovation, and Economic and Financial Performance: Evidence from the Energy Sector. Int. J. Energy Sect. Manag. 2023, 18, 500–516. [Google Scholar] [CrossRef]
- Khalil, M.A.; Khalil, R.; Khalil, M.K. Environmental, Social and Governance (ESG)—Augmented Investments in Innovation and Firms' Value: A Fixed-Effects Panel Regression of Asian Economies. China Financ. Rev. Int. 2022, 14, 76–102. [Google Scholar] [CrossRef]
- Sarikas, R.H.; Tipton, E.; Fodor, A.; Djatej, A.M. Sustainability Methodologies and Sustainability-linked Senior Management Compensation Policies: An Analysis of Relationships for Global Companies in the Healthcare and Educational Services Sectors. Environ. Manag. Sustain. Dev. 2023, 12, 82–109. [Google Scholar] [CrossRef]
- Adewole, O. Translating Brand Reputation into Equity from the Stakeholder’s Theory: An Approach to Value Creation Based on Consumer’s Perception & Interactions. J. Sustain. Bus. 2024, 9, 1. [Google Scholar] [CrossRef]
- Buniakova, A.V. IT-Services: Green Means Competitive? J. Law Adm. 2024, 20, 83–91. [Google Scholar] [CrossRef]
- Arku, J.K.; Shao, Y.; Ankrah, S.T. Building a Hierarchical Enablers Framework for Service Business Model Innovation for Sustainable Performance: Evidence from Ghana's Electricity Sector. Sustainability 2024, 16, 3191. [Google Scholar] [CrossRef]
- Efthymiou, L.; Kulshrestha, A.; Kulshrestha, S. A Study on Sustainability and ESG in the Service Sector in India: Benefits, Challenges, and Future Implications. Adm. Sci. 2023, 13, 165. [Google Scholar] [CrossRef]
- Sharma, P.C. A Panel Data Analysis to Assess the Impact of Sustained Earnings on Stock Returns: A Special Reference to the Indian Financial Service Sector. Indian J. Manag. Stud. 2023, 4, 1–8. [Google Scholar]
- Ahmed, R.; Bhuyan, R. Capital Structure and Firm Performance in Australian Service Sector Firms: A Panel Data Analysis. J. Risk Financ. Manag. 2020, 13, 214. [Google Scholar] [CrossRef]
- Karim, S.; Rabbani, M.R.; Khan, M.A. Determining the Key Factors of Corporate Leverage in Malaysian Service Sector Firms Using Dynamic Modeling. J. Econ. Financ. Adm. Sci. 2021, 26, 167–181. [Google Scholar]
- Onomakpo, H.E. Innovation Pathways: Value Capture through Collaboration in Norway. J. Inv. Bank. Financ. 2025, 3, 11. [Google Scholar] [CrossRef]
- Onomakpo, H.E. ESG Risk Ratings and Stock Performance in Electric Vehicle Manufacturing: A Panel Regression Analysis Using the Fama-French Five-Factor Model. J. Inv. Bank. Financ. 2025, 3, 12. [Google Scholar] [CrossRef]
- Chesbrough, H.W. Open Innovation: The New Imperative for Creating and Profiting from Technology; Harvard Business School Press: Boston, MA, USA, 2003. [Google Scholar]
- Kenneth, R. French Data Library. Available online: http://mba.tuck.dartmouth.edu/pages/faculty/ken.french/data_library.html (accessed on 1 June 2025).
- Vincenzi, T.B.D.; da Cunha, J.C. Open Innovation and Performance in the Service Sector. Innov. Manag. Rev. 2021, 18, 500–516. [Google Scholar] [CrossRef]
- Al-Abdallat, H. Developing a Framework for Enhancing Strategic Performance by Applying Lean Service: An Empirical Study of the Jordanian Commercial Banking Sector. Ph.D. Thesis, University of Bradford, Bradford, UK, 2023. [Google Scholar]
- Mapokotera, C.; Mataruka, L.T.; Muzurura, J.; Mungwari, D. The Nexus between Corporate Social Responsibility and Corporate Social Performance in the Service-Based Enterprises Sector: Insights from Zimbabwe. Qeios 2023. [Google Scholar]
- Bhowmik, D. Sustainability of the Service Sector of India. Sri Lanka J. Econ. Res. 2023, 9, 195. [Google Scholar] [CrossRef]
- Cheng, D.; Tang, Y.; Shao, X. Growth of the Service Sector and Economic Fluctuations: A Production Network Perspective. China Financ. Econ. Rev. 2025. [Google Scholar] [CrossRef]
- Sharma, D. Green Sustainability Initiatives in Service Sector. In Sustainable Information Security in the Age of AI and Emerging Technologies; IGI Global: Hershey, PA, USA, 2025; pp. 119–131. [Google Scholar]
- Brohi, N.A.; Qureshi, M.A.; Shaikh, D.H.; Mahboob, F.; Arfeen, M.I. Nexus Between Servant Leadership, Green Knowledge Sharing, Green Capacities, Green Service Innovation, and Green Competitive Advantage in the Hospitality Sector of Pakistan: An SDG and ESG Stakeholder Compliance and Financial Performance Perspective. J. Mark. Anal. 2024, 1–25. [Google Scholar]
- Oghlu, I.A.M.; Oghlu, R.S.F. Determinants of Service Sector. In The World of Science and Education; ASPSP: Tbilisi, Georgia, 2025; pp. 88–95. [Google Scholar]
- Saman, N.R.M.; Mahmud, N.; Nor, N.M.; Yusof, Z.M.; Abidin, N.N.Z.; Ariffin, R. The Sustainability Performance of Small and Medium Enterprises (SMEs) within the Service Sector: A Comprehensive Review. Insight J. 2025, 2, 1–13. [Google Scholar]
- Randa, I.O. Integrated Reporting for Sustainable Financial Service Sector in Emerging Economies Post-COVID-19 Pandemic. In Information Processing and Accounting Standards: The Post-COVID-19 Pandemic. In Information Processing and Accounting Standards: The Post-COVID-19 Pandemic and Its Impact on Accounting Information Systems; Springer: Cham, Switzerland, 2024; pp. 3–20. [Google Scholar] [CrossRef]
- Gao, J.; Wang, Y.; Xie, H. Service Sector Liberalization and Firms' Carbon Emission Intensity Reduction: Evidence from China. J. Asian Econ. 2025. [Google Scholar] [CrossRef]
- Fauzel, S.; Tandrayen-Ragoobur, V.; Nowbutsing, B. A Literature Survey of Technological Disruptions in the Service Sector. Rev. Technol. Disruption Manag. Innov. 2024, 3, 130–148. [Google Scholar] [CrossRef]
- Owoseni, A.; Twinomurinzi, H. Evaluating Mobile App Usage by Service Sector Micro and Small Enterprises in Nigeria: An Abductive Approach. Inf. Technol. Dev. 2020, 26, 552–577. [Google Scholar] [CrossRef]
- Karki, S.; Karki, P.; Karki, P. Environmental Sustainability and Management (ES & EM) Practices among Service Sector Institutions in Kathmandu, Nepal. Discov. Sustain. 2025. [Google Scholar] [CrossRef]
- Panno, A. Performance Measurement and Management in Small Companies of the Service Sector; Evidence from a Sample of Italian Hotels. Meas. Bus. Excell. 2020, 24, 469–484. [Google Scholar] [CrossRef]
- Schaëfer, K.; Harju, A.; Kähkönen, A.K. Sustainable Meets Service Procurement: A Case Study in the ICT Service Sector. Int. J. Prod. Res. 2025. [CrossRef]
- Siefan, S.J. The Impact of Operational Excellence Methodologies on Sustainable Performance in the Service Sector. Ph.D. Thesis, Kuwait University, Kuwait City, Kuwait, 2024. [Google Scholar]
- Randa, I.O. Integrated Reporting for Sustainable Financial Service Sector in Emerging Economies Post-COVID-19 Pandemic. Inf. Process. Account. Stand. 2024, 1–19. [Google Scholar] [CrossRef]
- Paarlahti, E. Optimizing Customer-Centered Service Design: Case Financial Sector. Master’s Thesis, Aalto University, Espoo, Finland, 2025. [Google Scholar]
- Essougong, K.; Papito, U.; Ngome, P.I.T.; Leeuwis, C. The Hurdles of Service Delivery Integration in a Pluralistic Landscape: The Cameroonian Cocoa Sector. J. Rural Stud. 2025, 109, 103328. [Google Scholar]
- De Tommasi, L.; Agrawal, R.; Morciano, M.; Colantuono, A.; Liguori, C.; Piras, G.; Colantuono, F. A Smart Energy Service for the Commercial Rented Sector: Decision Making Points and Business Model Considering the Learnings from the Pilot Sites of the SmartSPIN Project. Open Res. Eur. 2025, 5, 39. [Google Scholar] [CrossRef]
- Rahuman, M.R.A.H. Strategic Management Accounting Usage in the Sri Lankan Service Sector. J. Econ. Financ. Adm. Sci. 2025, 3, 8889. [Google Scholar]
- Kohli, S.; Kalotra, A.; Shukla, R.P. Leveraging Technology to Enhance the Webrooming Experience in the Automotive Service Sector. In Transforming the Service Sector. In Transforming the Service Sector with New Technology: Innovative Approaches and Solutions; IGI Global: Hershey, PA, USA, 2025; pp. 16–33. [Google Scholar]
- Srivastava, V.; Dixit, I.; Duggal, R. The Evolution of Technology in the Service Sector Concerning Hospitality. In Transforming the Service Sector with New Technology: Innovative Approaches and Solutions; IGI Global: Hershey, PA, USA, 2025; pp. 116–133. [Google Scholar]
- Zheng, X.; Wen, J.; Wu, X. Government Linked Companies (GLCs) and Public Private Partnership (PPP) in Water Sector in China Political Connection, Utility Performance and Service Quality. SSRN J. 2025. [CrossRef]
- Austen, A.; Piwowar-Sulej, K. Impact of Job (In) Security on Work–Life Balance Among Service Sector Employees. In Work-Life Balance in Central and Eastern Europe: Context, Impact, Organizations and Society; Routledge: London, UK, 2024; pp. 91–105. [Google Scholar] [CrossRef]
- Castillo, C.; Viu-Roig, M.; Alvarez-Palau, E.J.; Diaz-Lopez, F. Foodtech in Motion: Innovation and Digitalisation of the Food Service Sector in the Post-Pandemic Spain. Br. Food J. 2024. [CrossRef]
- Singh, M.; Jiao, J.; Klobasa, M.; Frietsch, R. Servitization of Energy Sector: Emerging Service Business Models and Startups' Participation. Energies 2022, 15, 2705. [Google Scholar] [CrossRef]
- AlShehail, O.A.; Khan, M.; Ajmal, M. Total Quality Management and Sustainability in the Public Service Sector: The Mediating Effect of Service Innovation. Benchmarking Int. J. 2022, 29, 1686–1705. [Google Scholar] [CrossRef]
- Taggart, R. Investor Sentiment in the Canadian Energy Service Sector. Master’s Thesis, University of Calgary, Calgary, AB, Canada, 2024. [Google Scholar]
- Nguyen, M.; Khan, M.; Bensemann, J.; Sulaiman, R. Corporate Social Responsibility Among Service Sector SMEs in Vietnam: Exploring the Influence of National Context. Qual. Quant. 2025. [CrossRef]
Figure 1.
ESG Scores and Market ESG Factor Distribution by Year. EDA plot showing ESG_score and Market_ESG_Factor_VW_diff by Year (EDA).
Figure 1.
ESG Scores and Market ESG Factor Distribution by Year. EDA plot showing ESG_score and Market_ESG_Factor_VW_diff by Year (EDA).
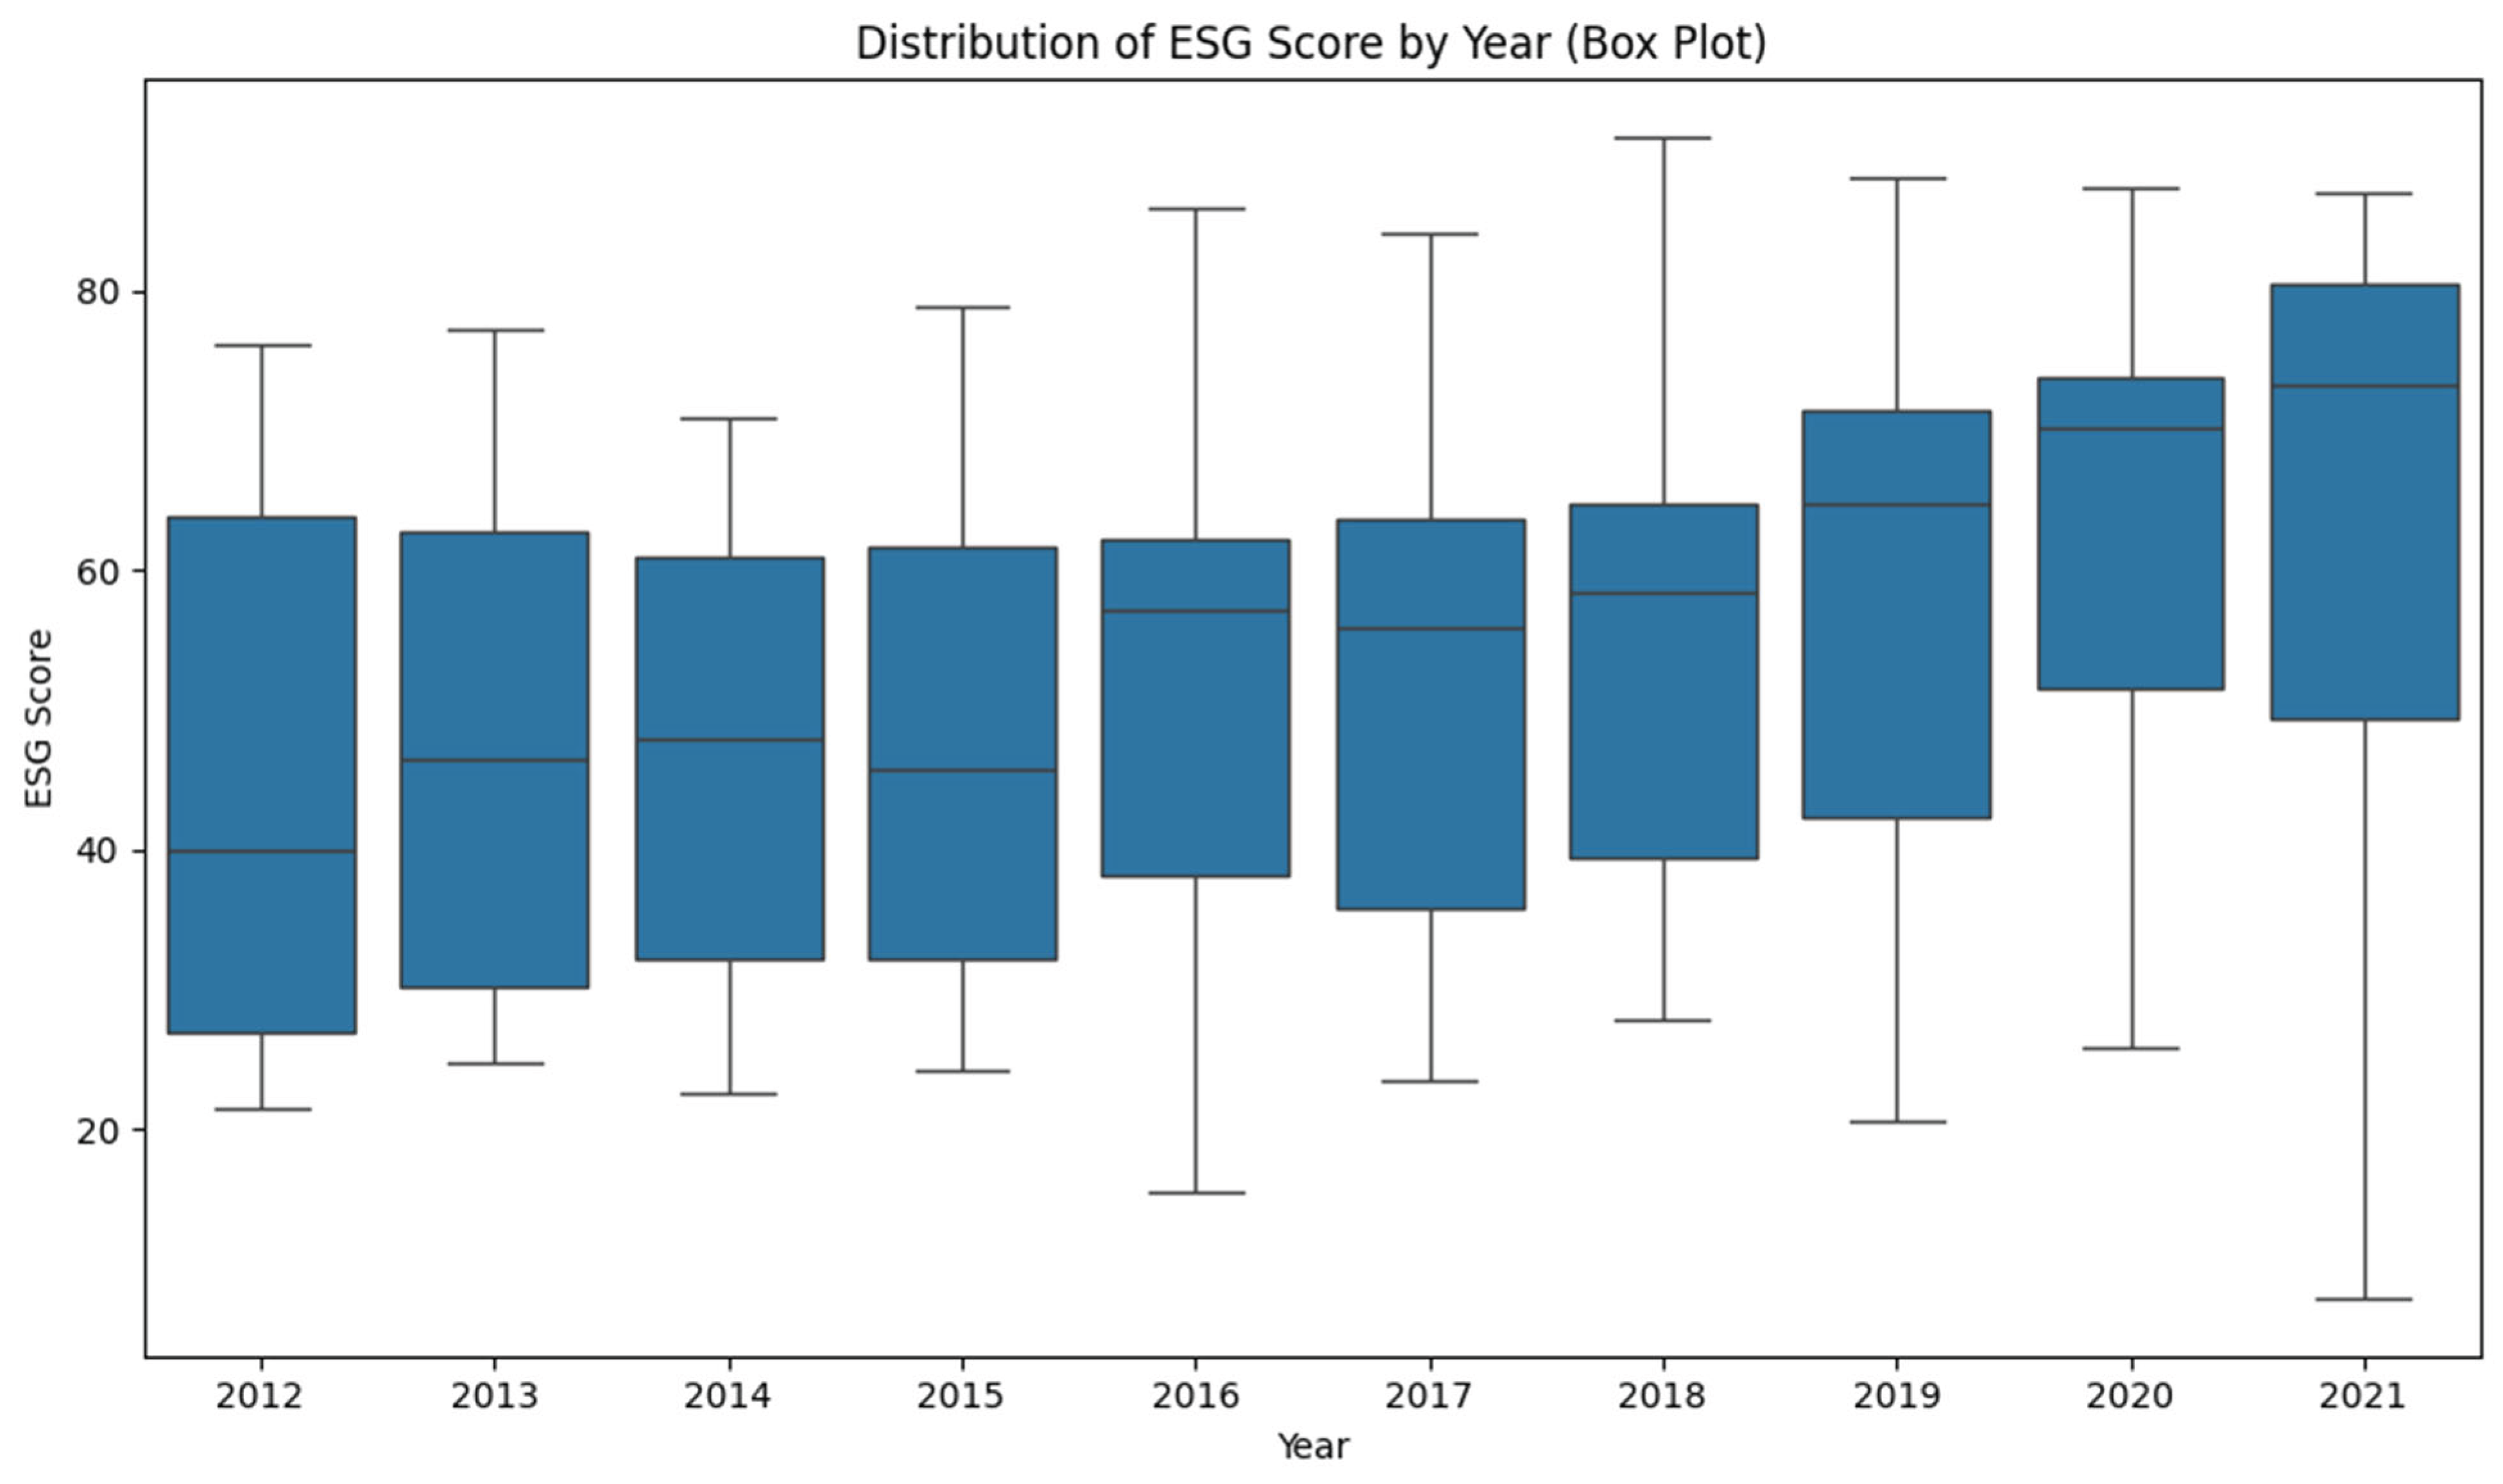
Figure 2.
Excess Return by Year for Service Sector Firms. An Exploratory Data Analysis plot showing Excess Return by Year (EDA).
Figure 2.
Excess Return by Year for Service Sector Firms. An Exploratory Data Analysis plot showing Excess Return by Year (EDA).
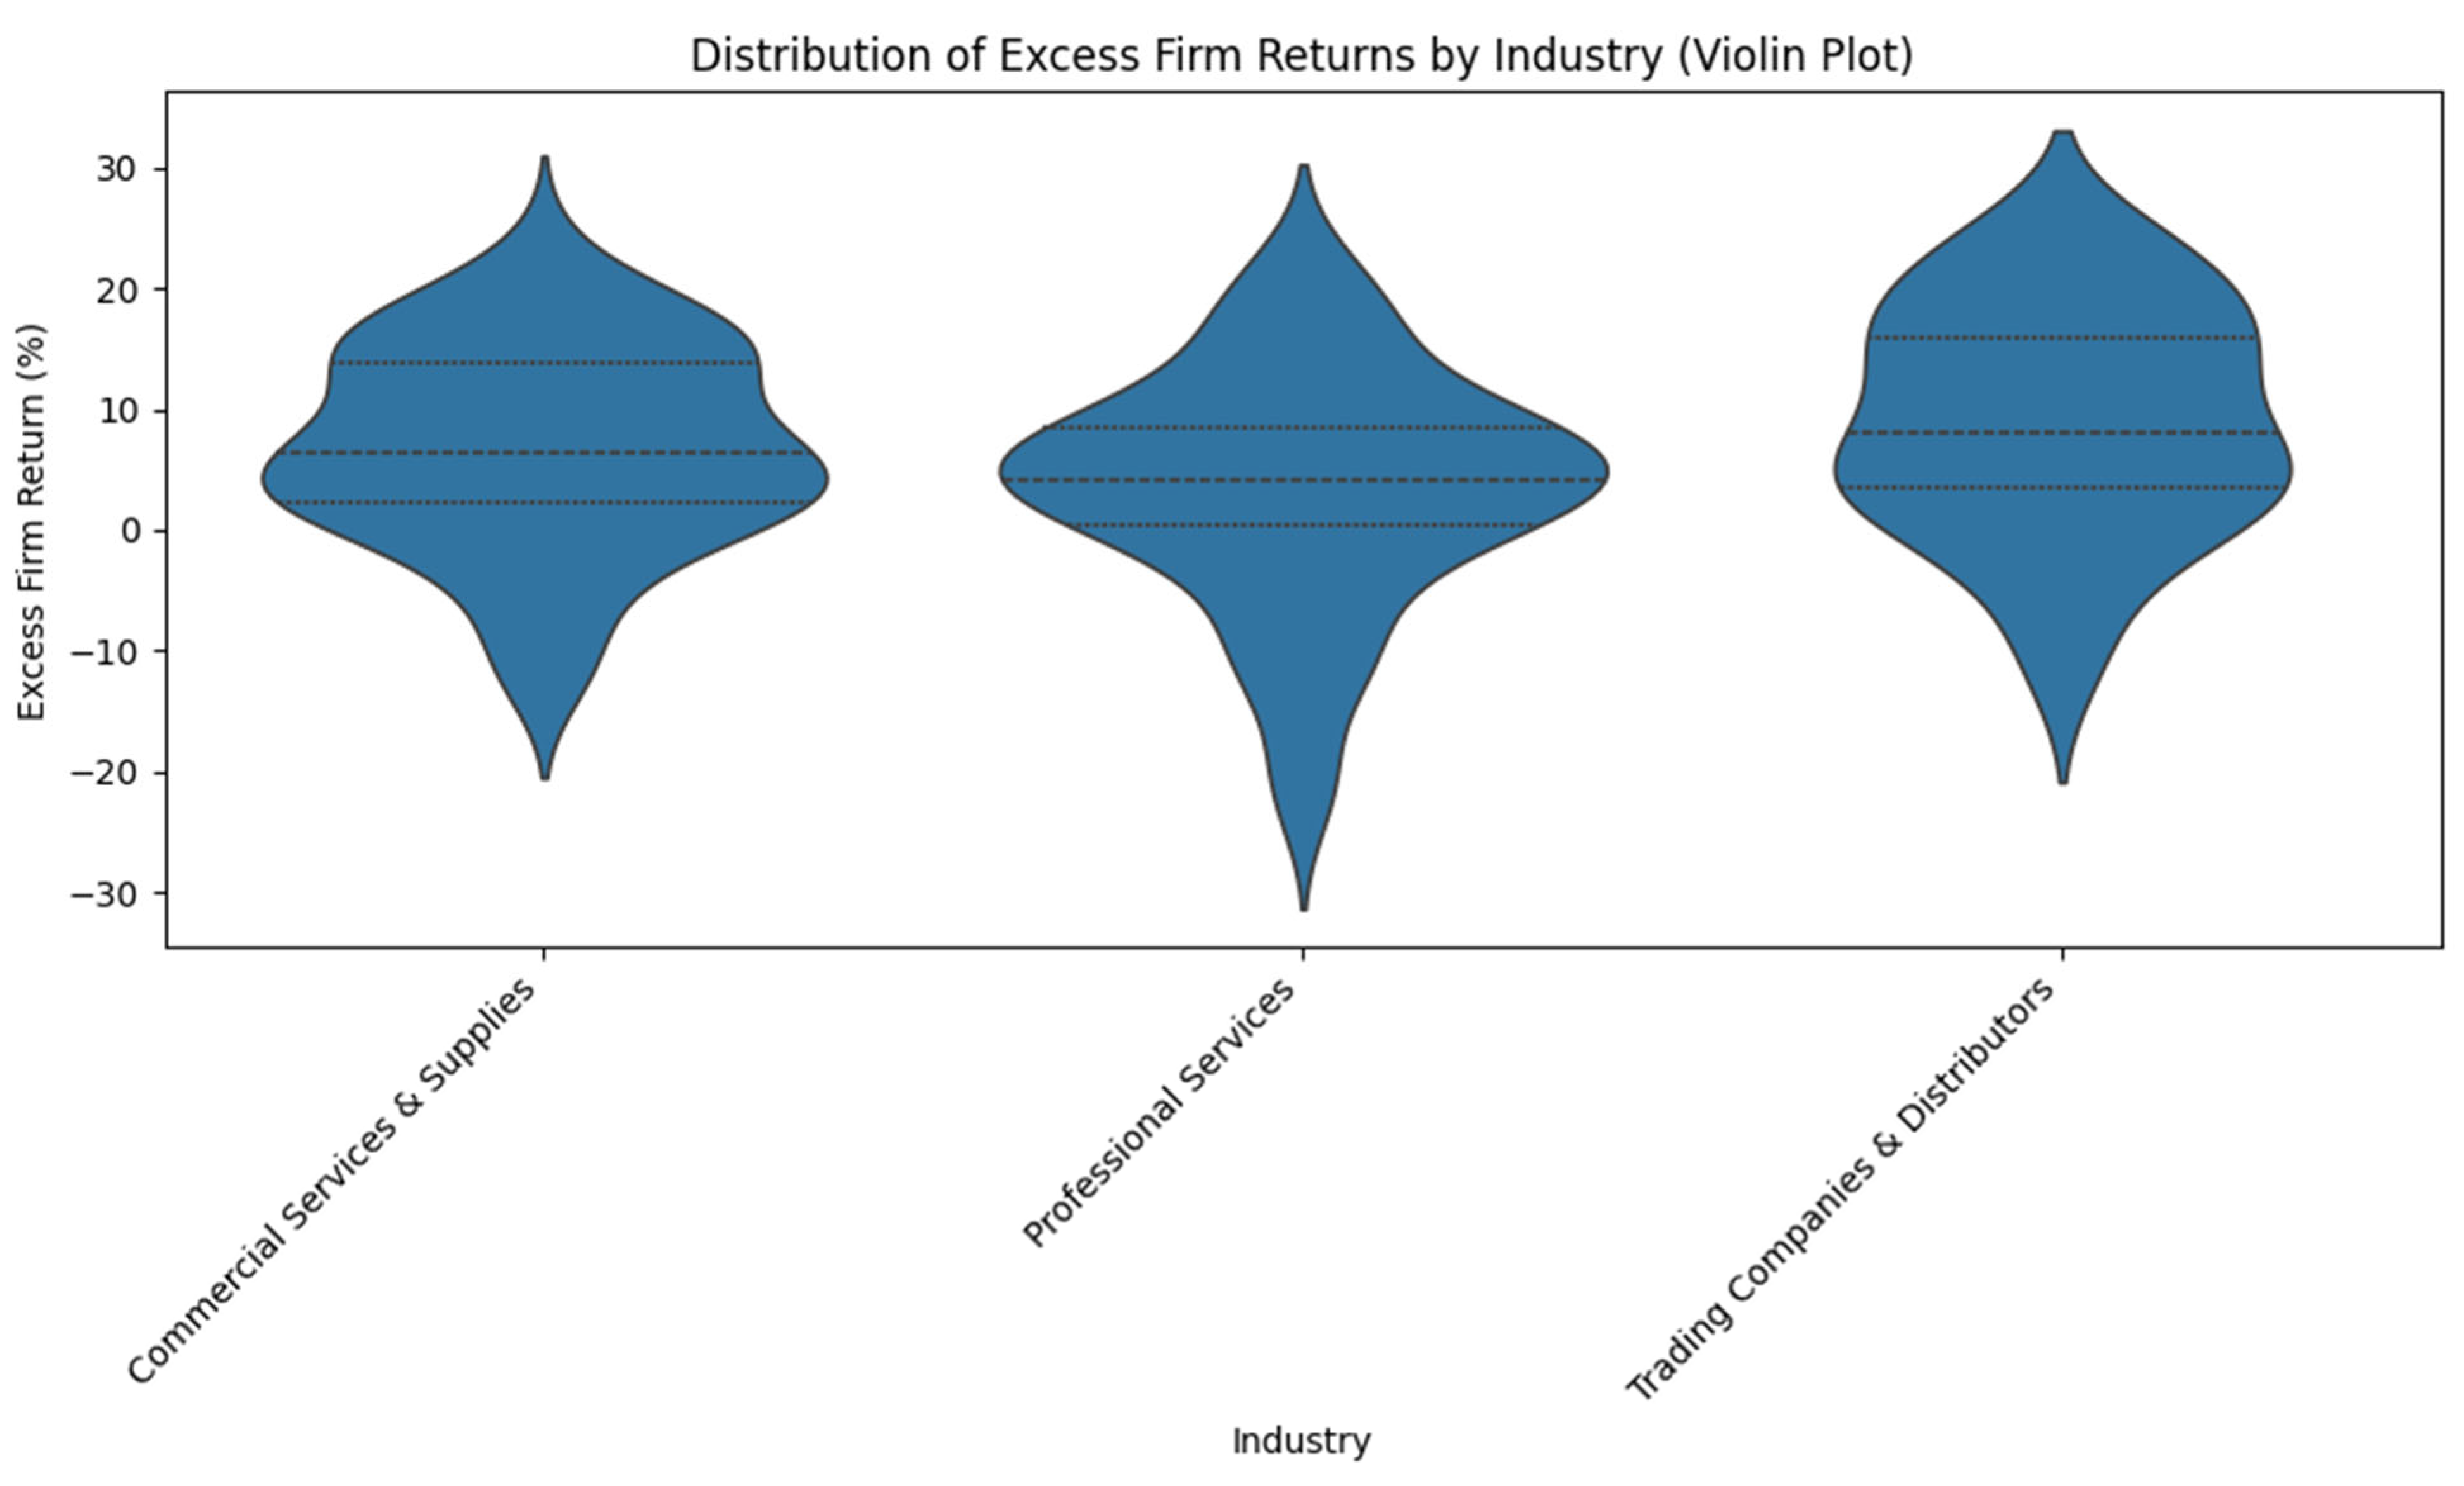
Figure 3.
SHAP Summary Plot for Random Forest: Overall Feature Impact.
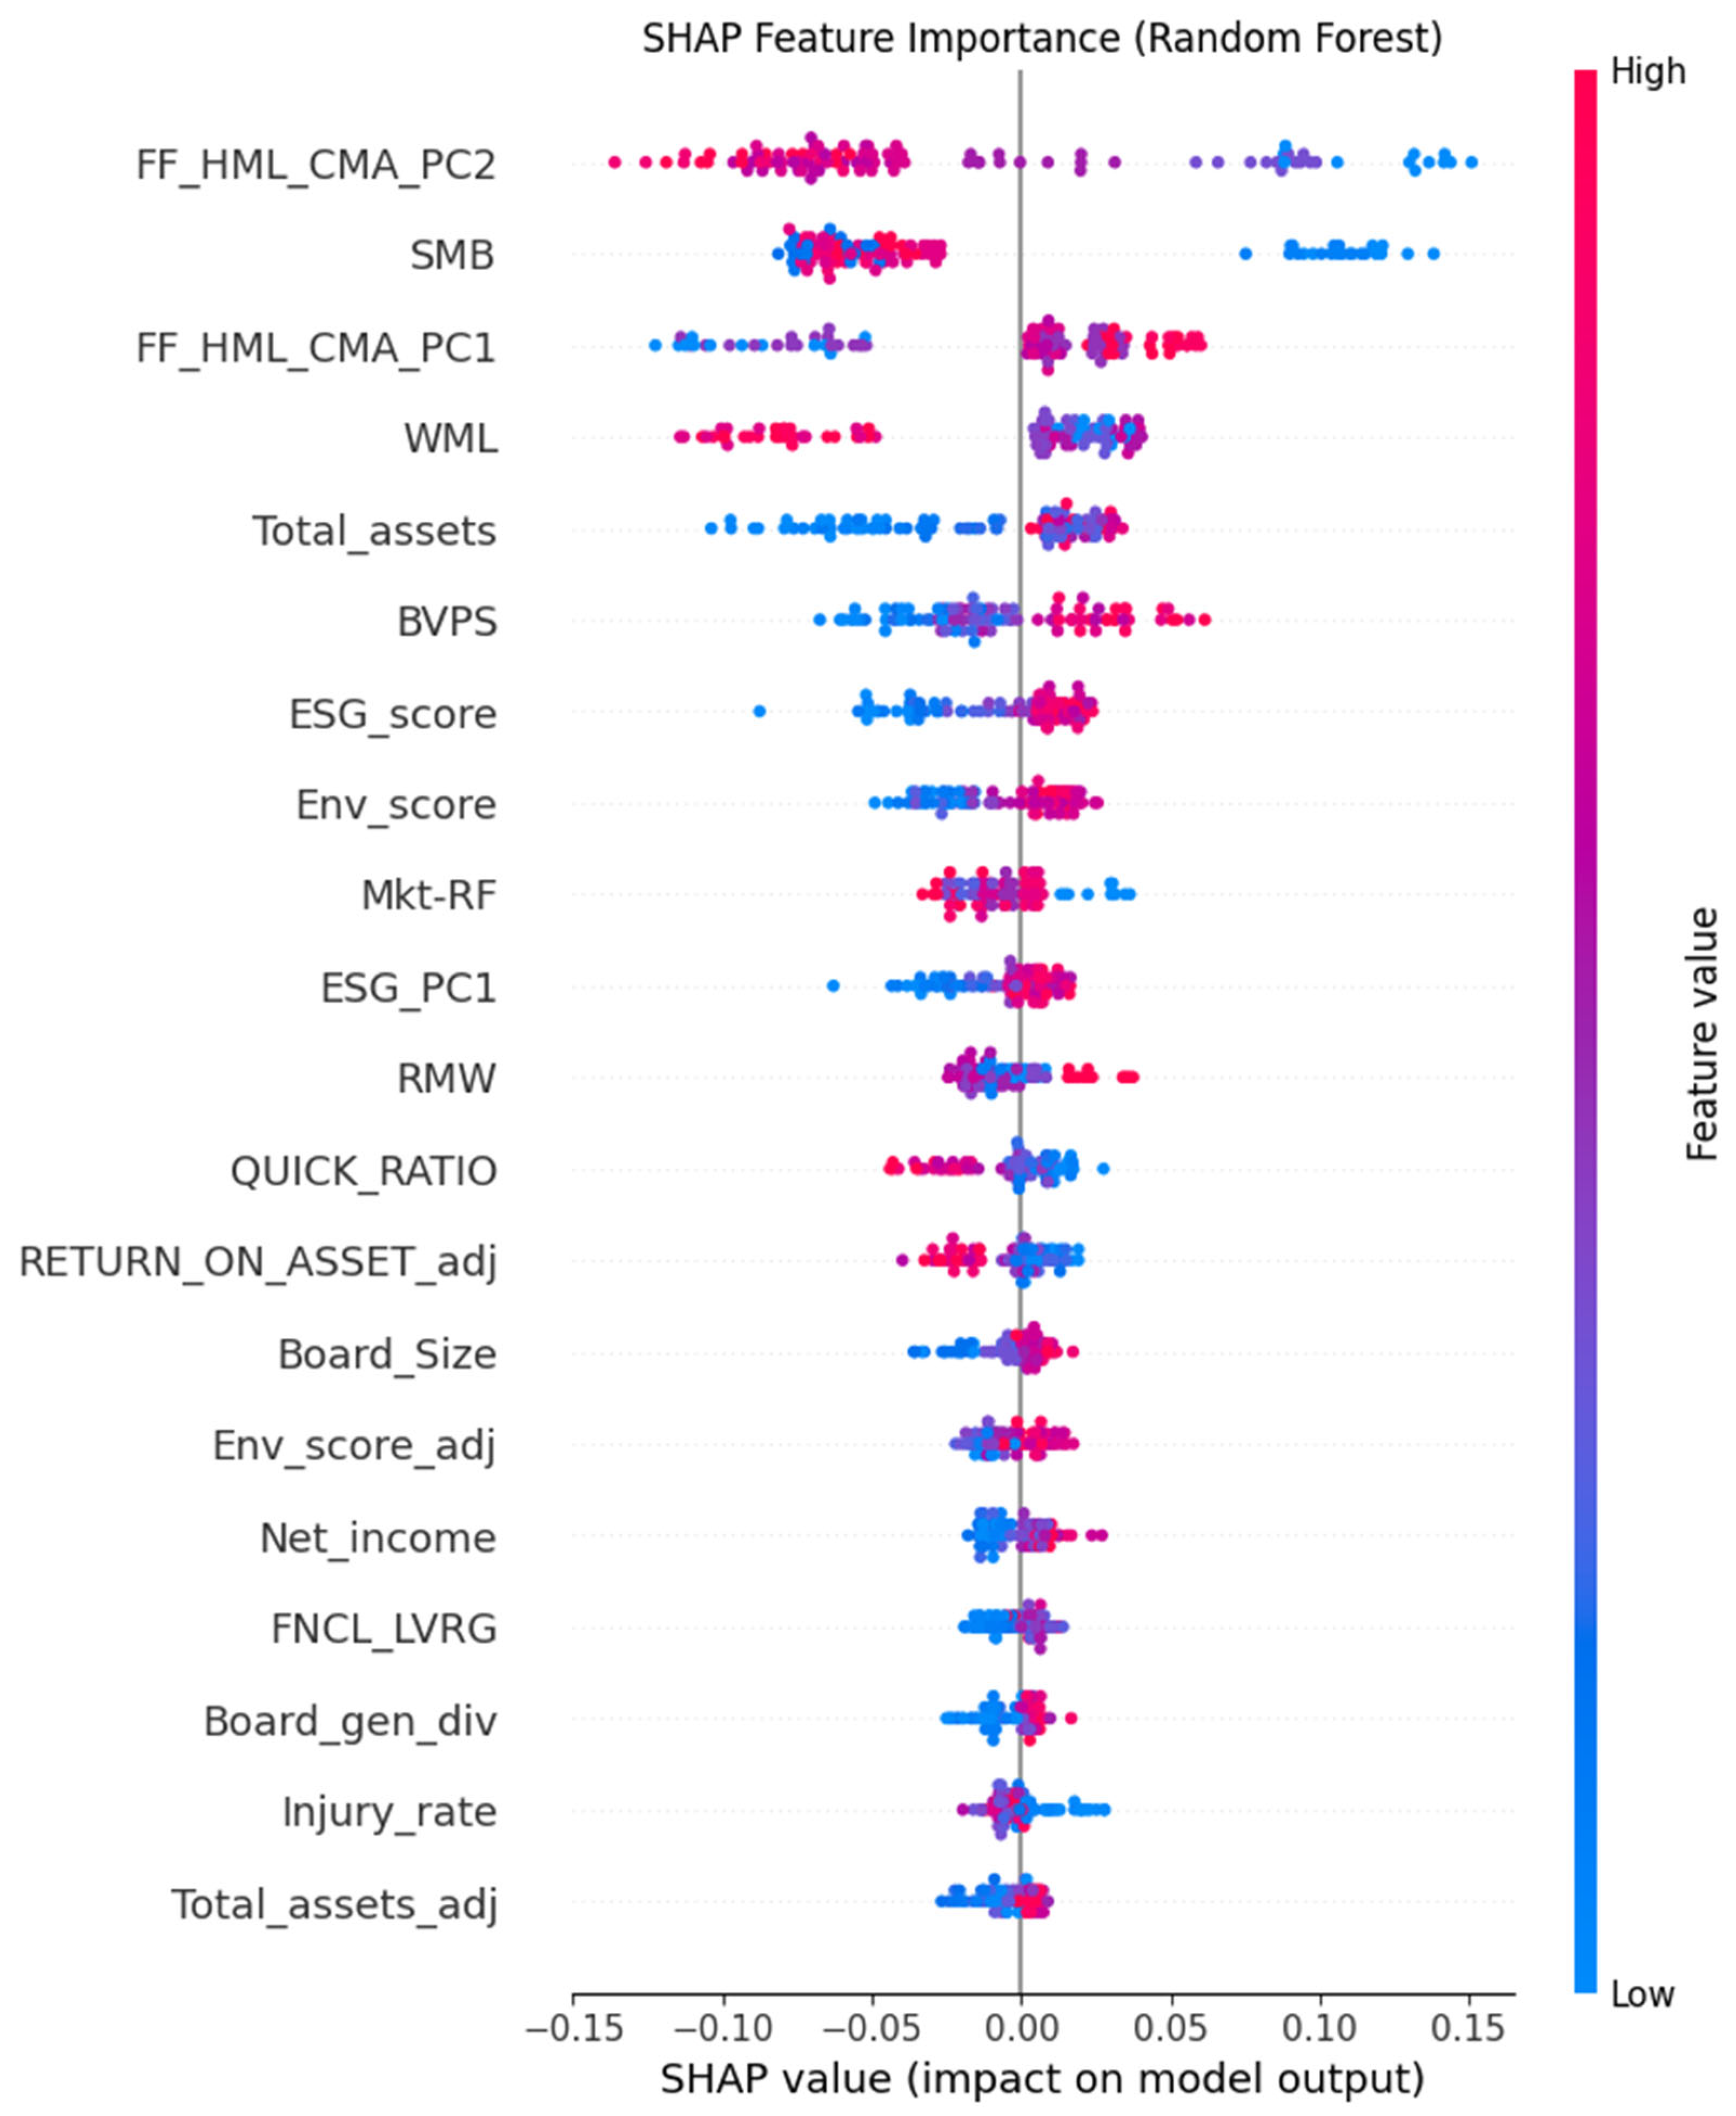
Figure 4.
SHAP Dependence Plot for Random Forest: FF_HML_CMA_PC2.
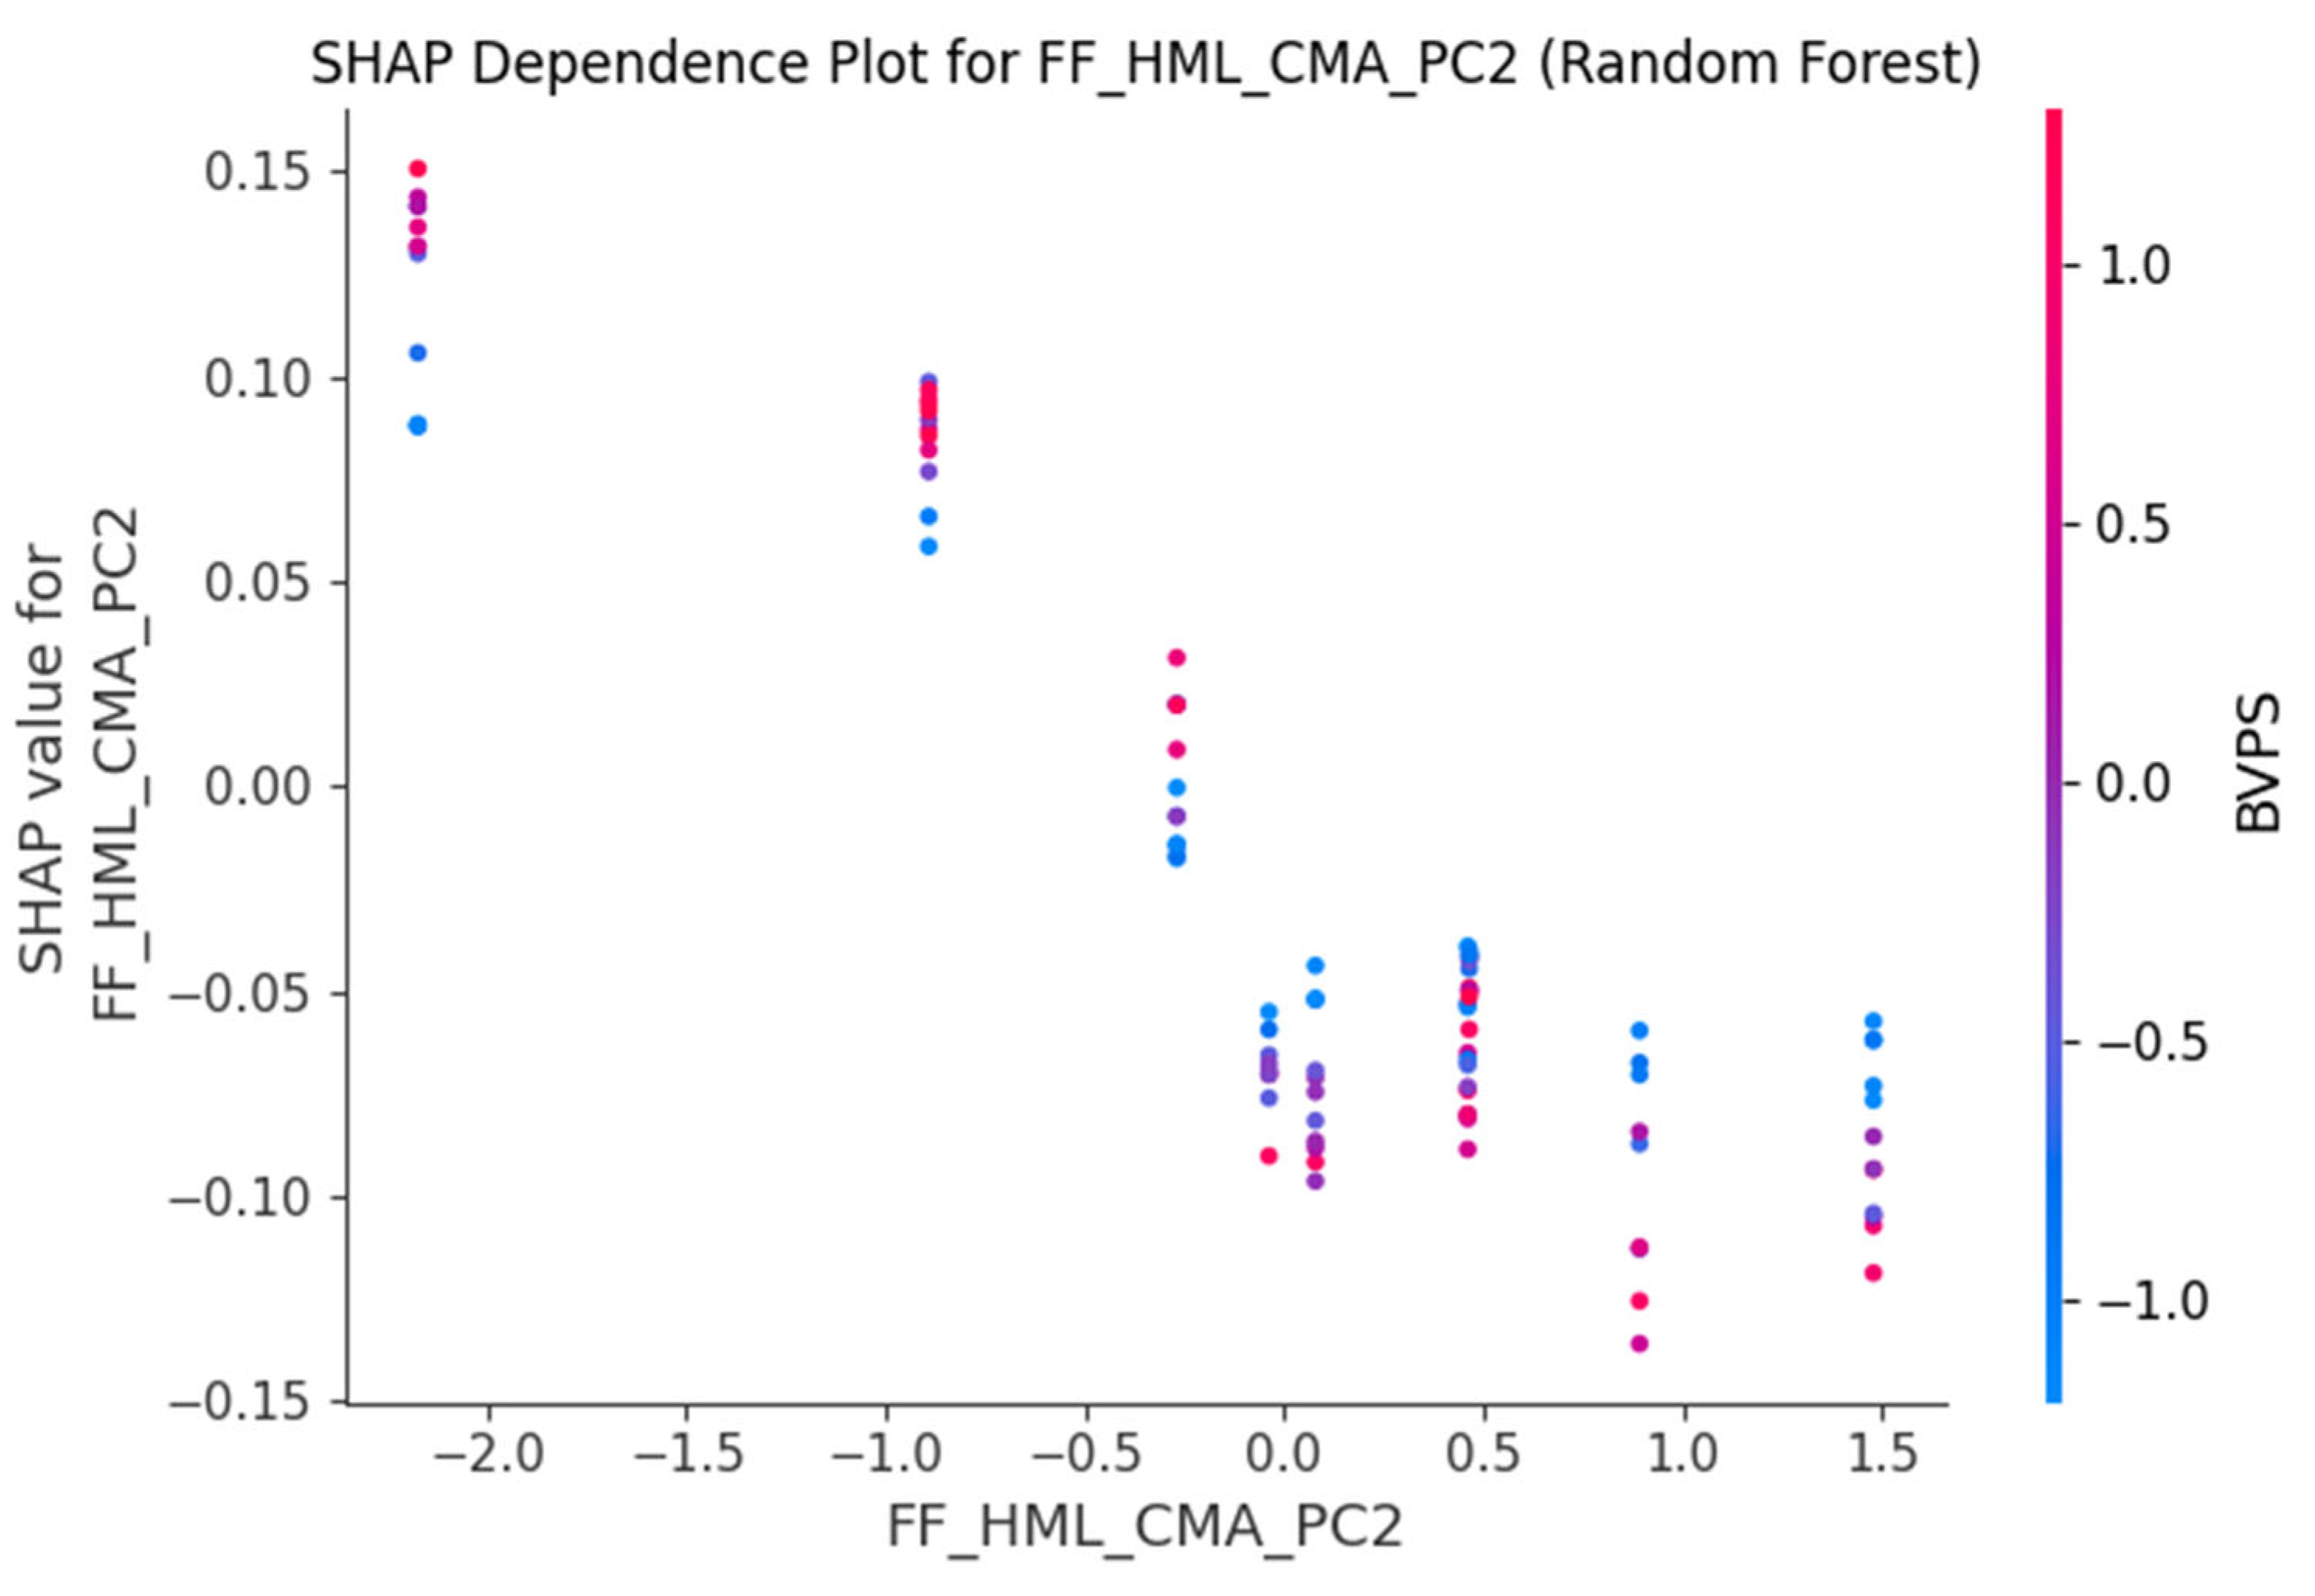
Figure 5.
SHAP Dependence Plot for Random Forest: SMB.
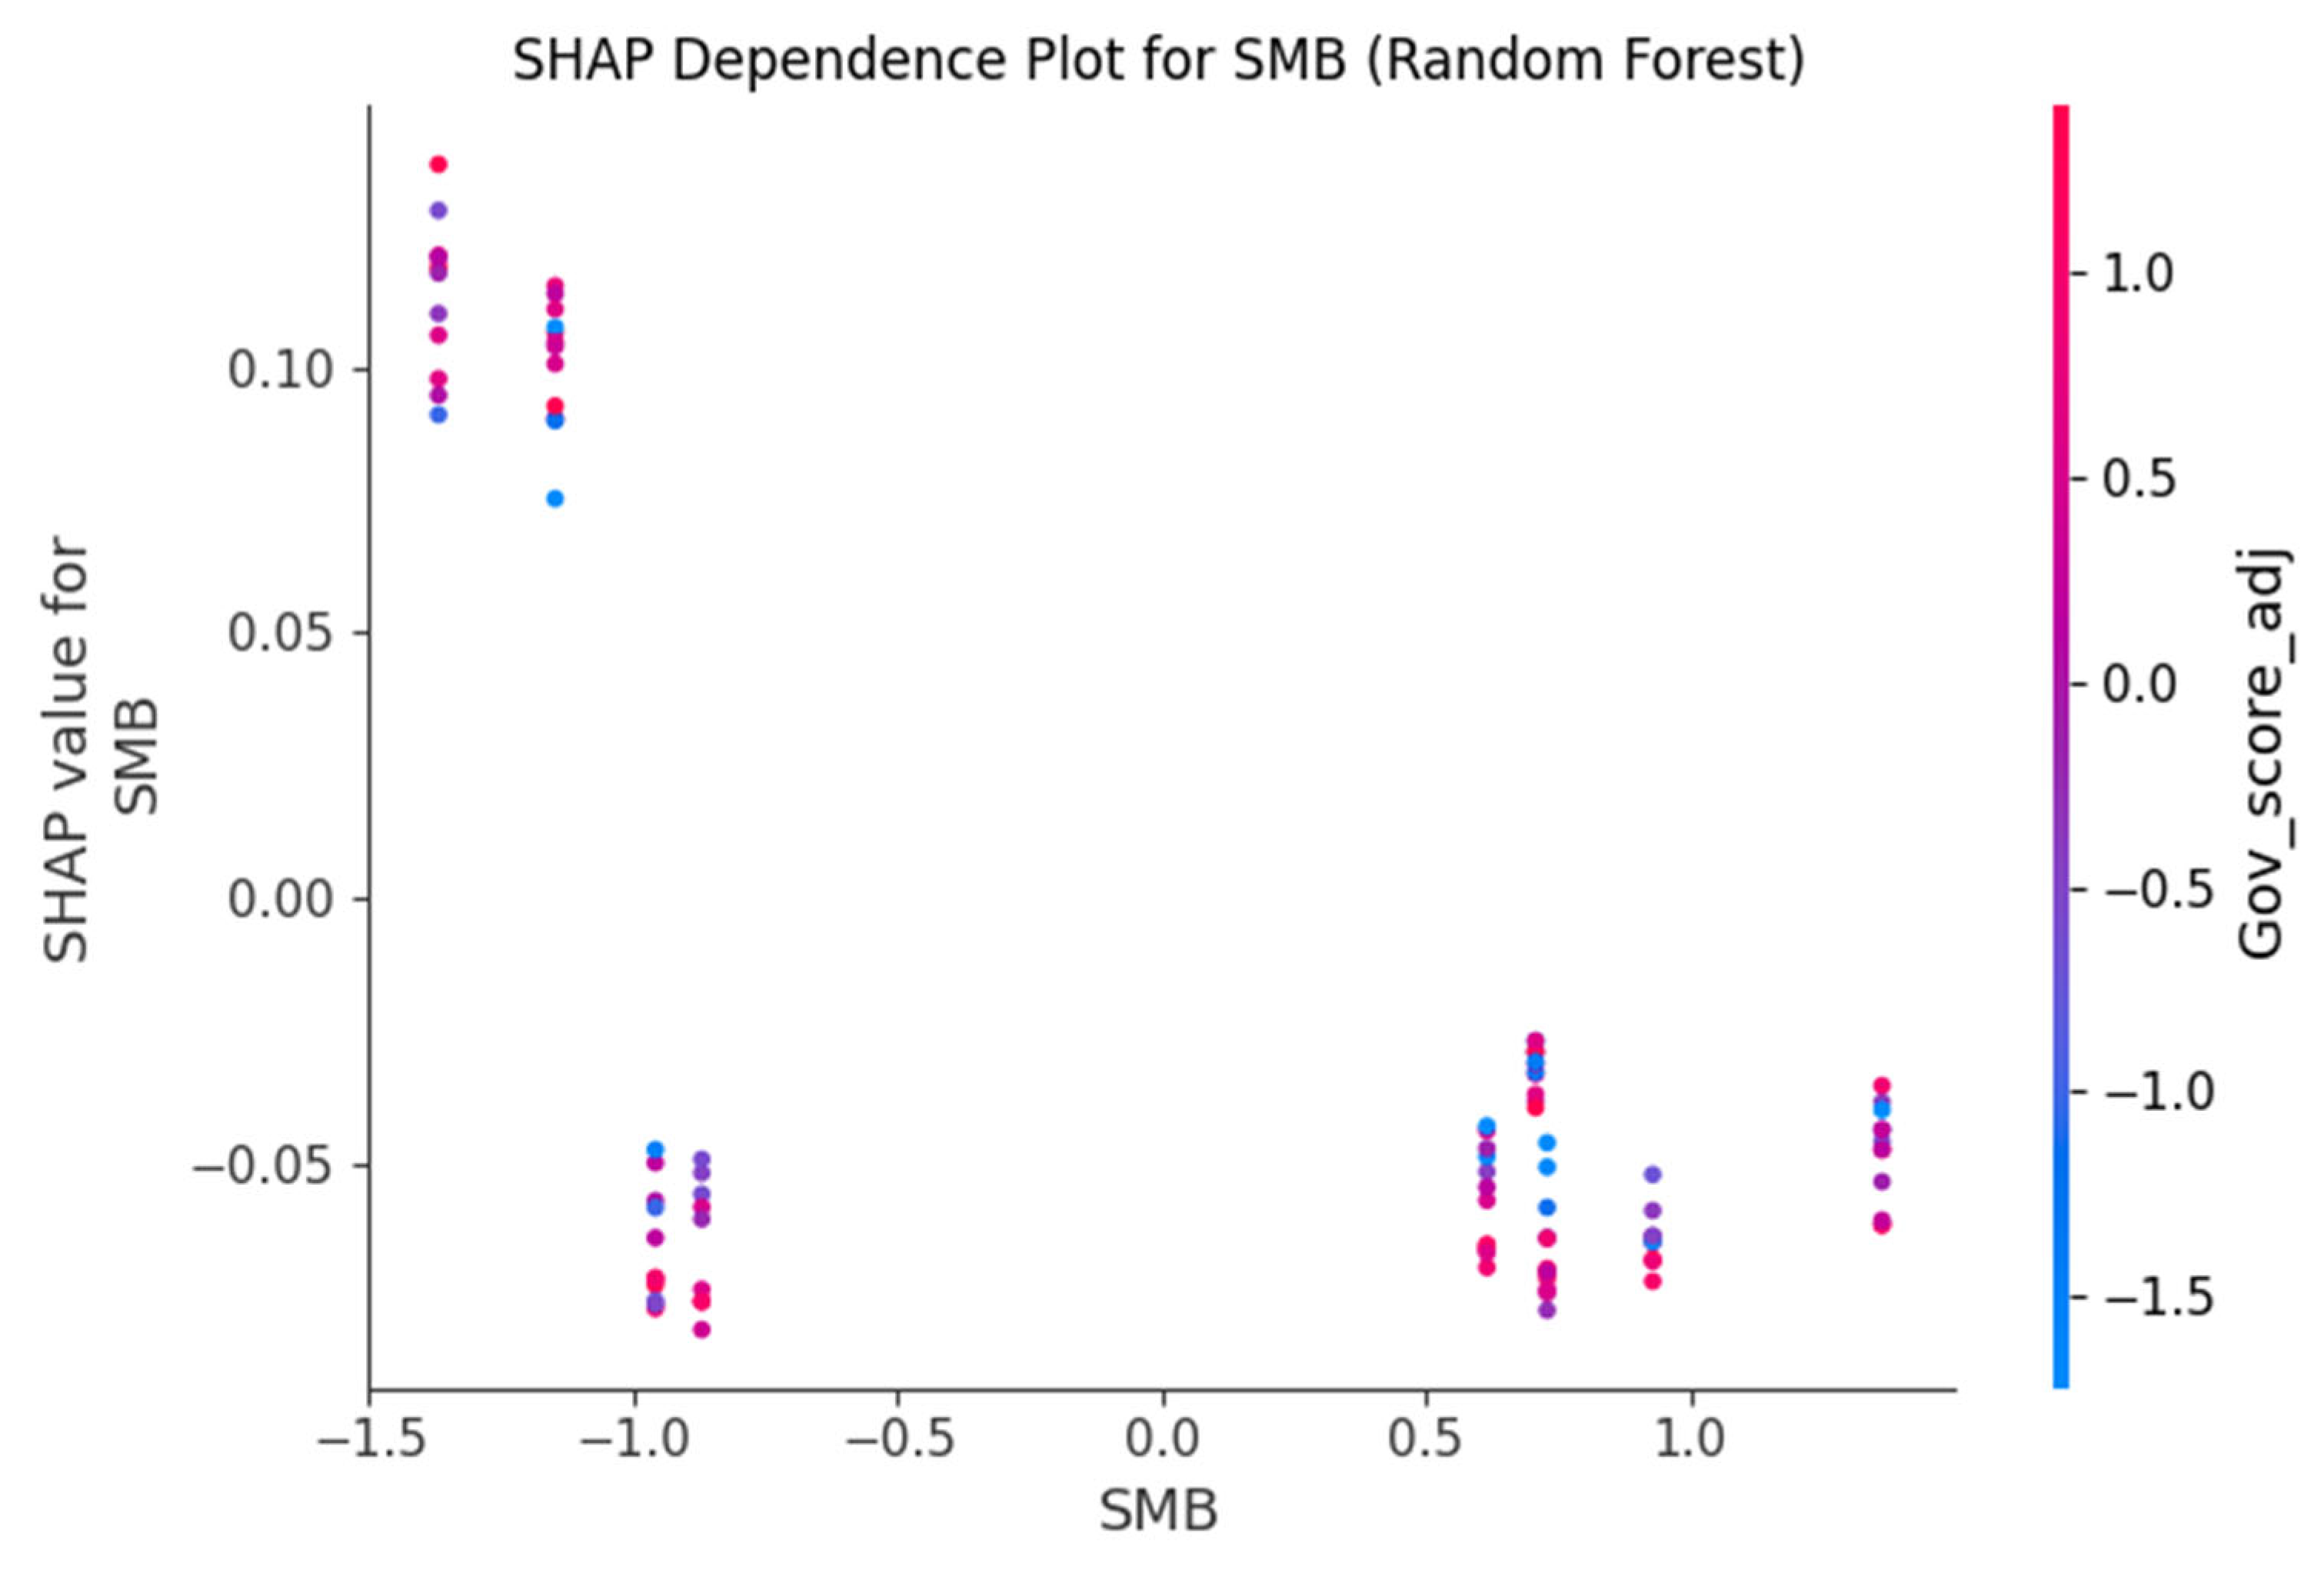
Figure 6.
SHAP Dependence Plot for Random Forest: FF_HML_CMA_PC1.
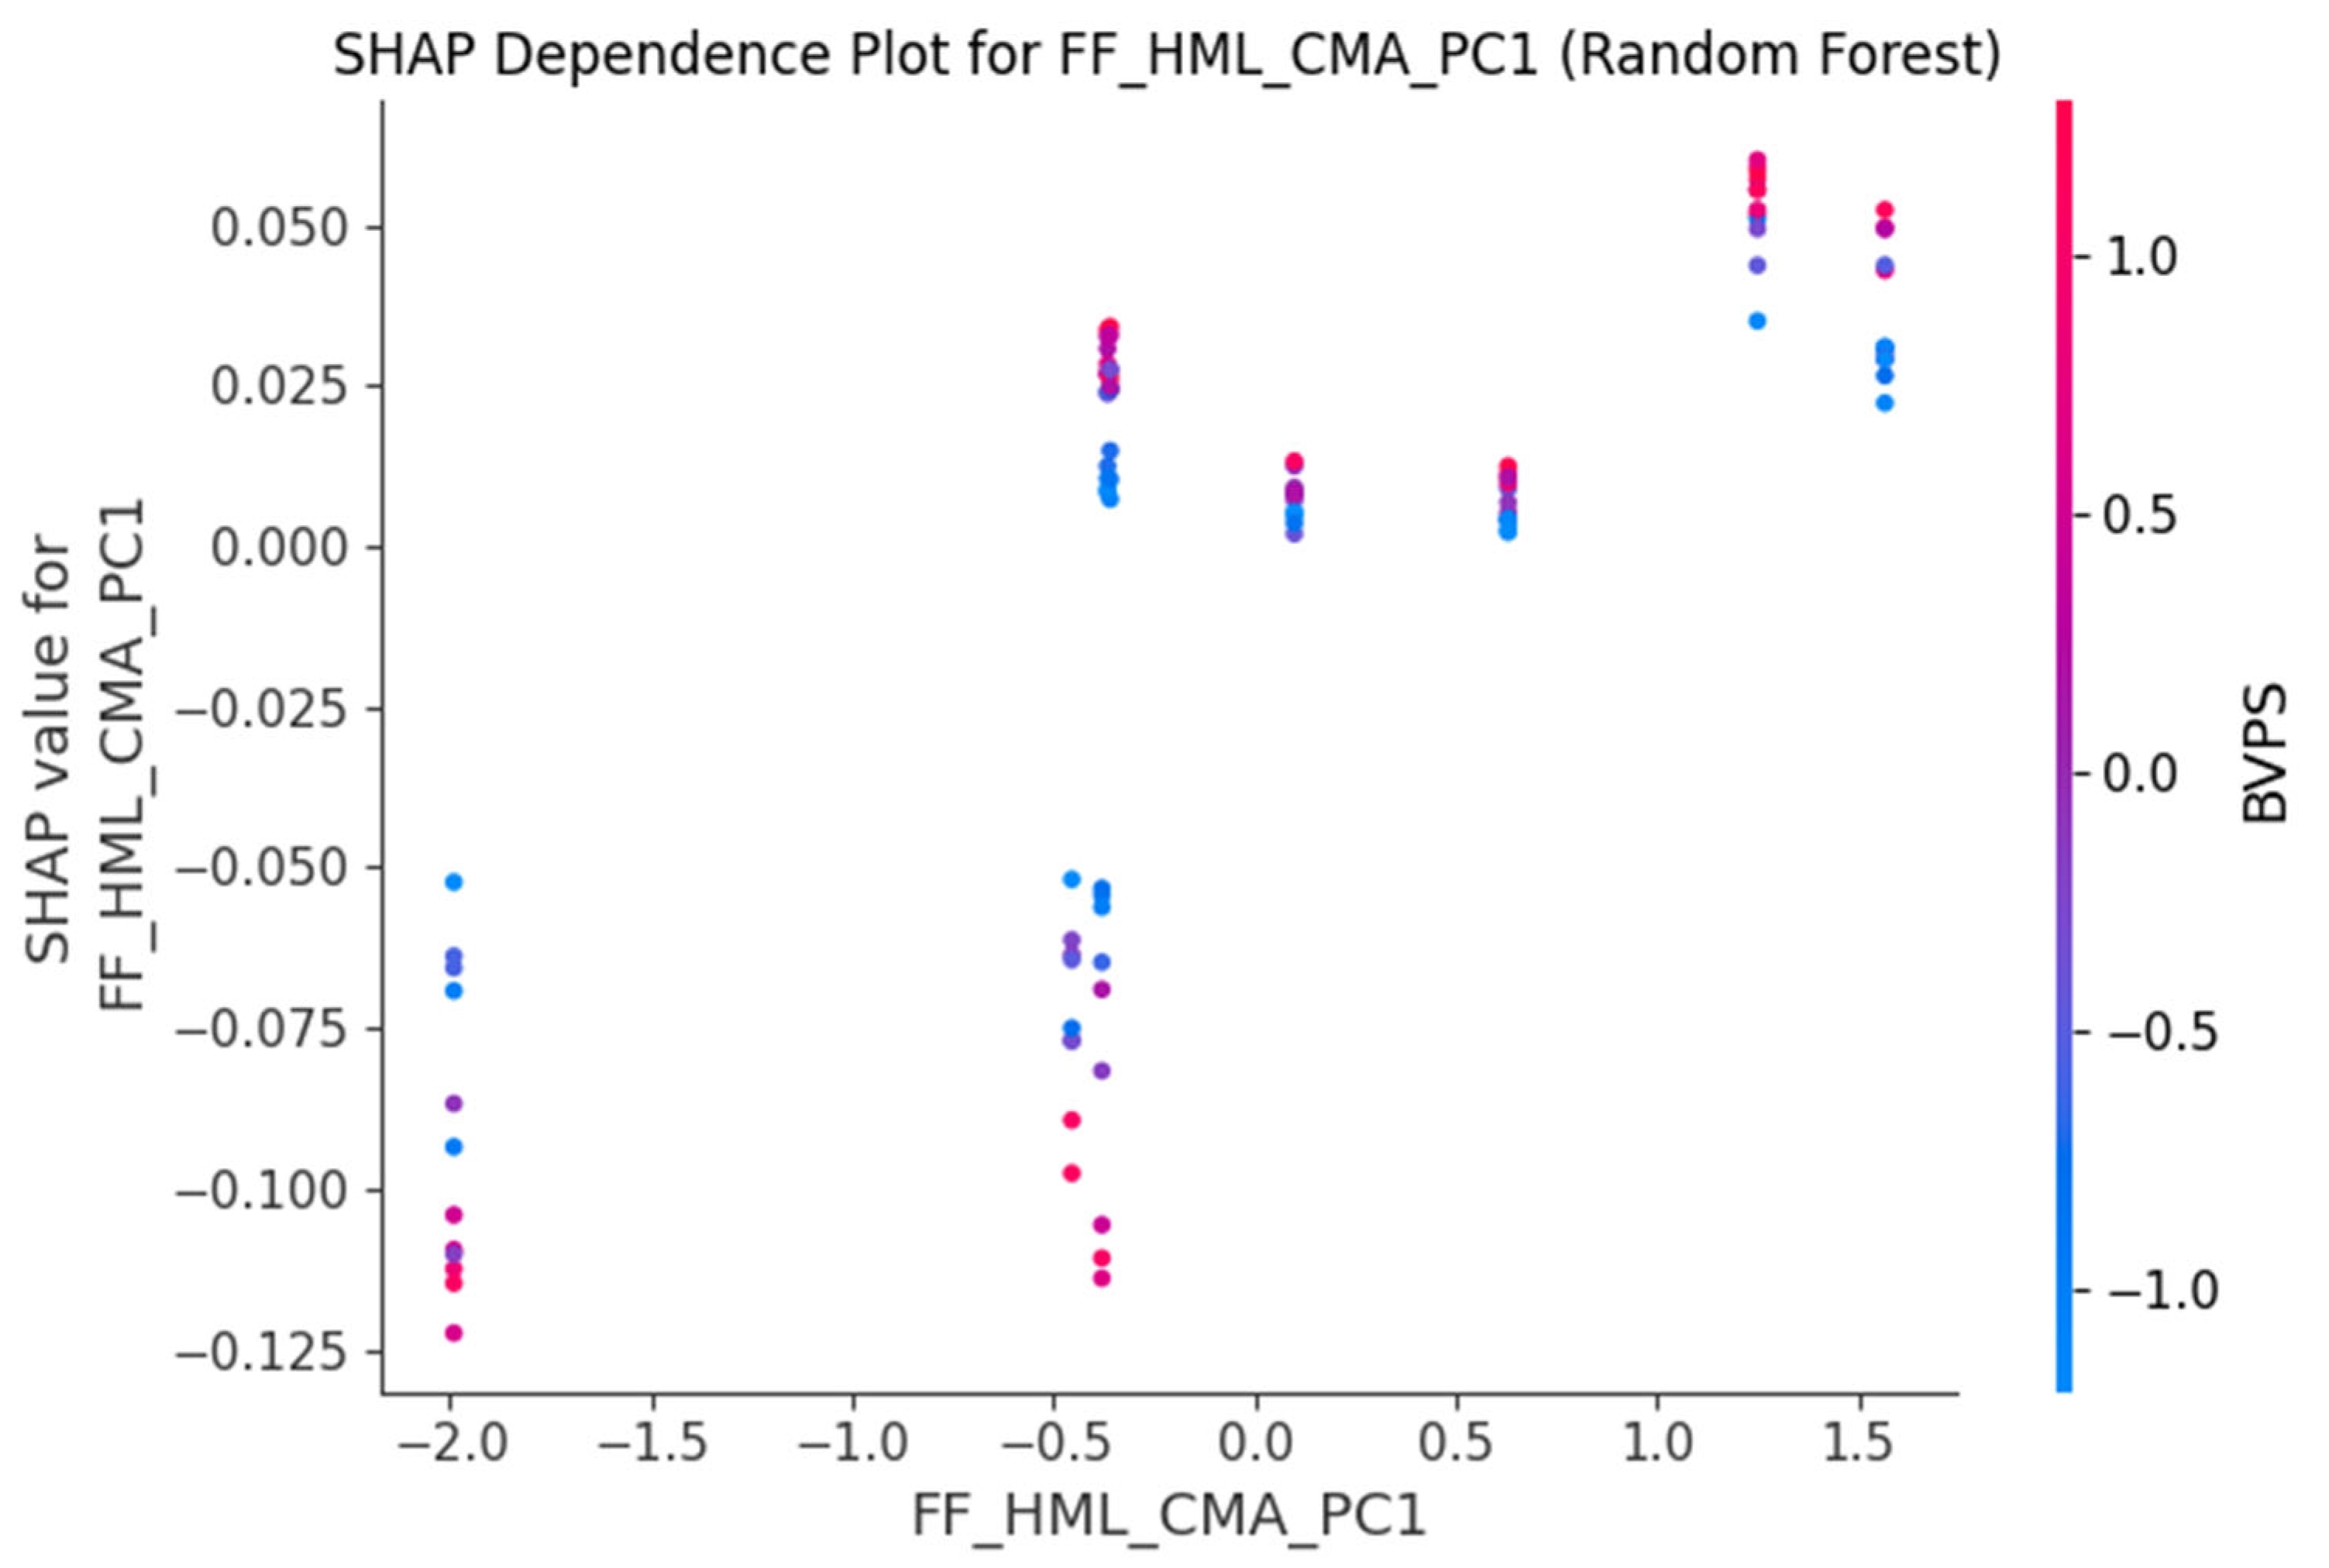
Figure 7.
SHAP Summary Plot for XGBoost: Overall Feature Impact.
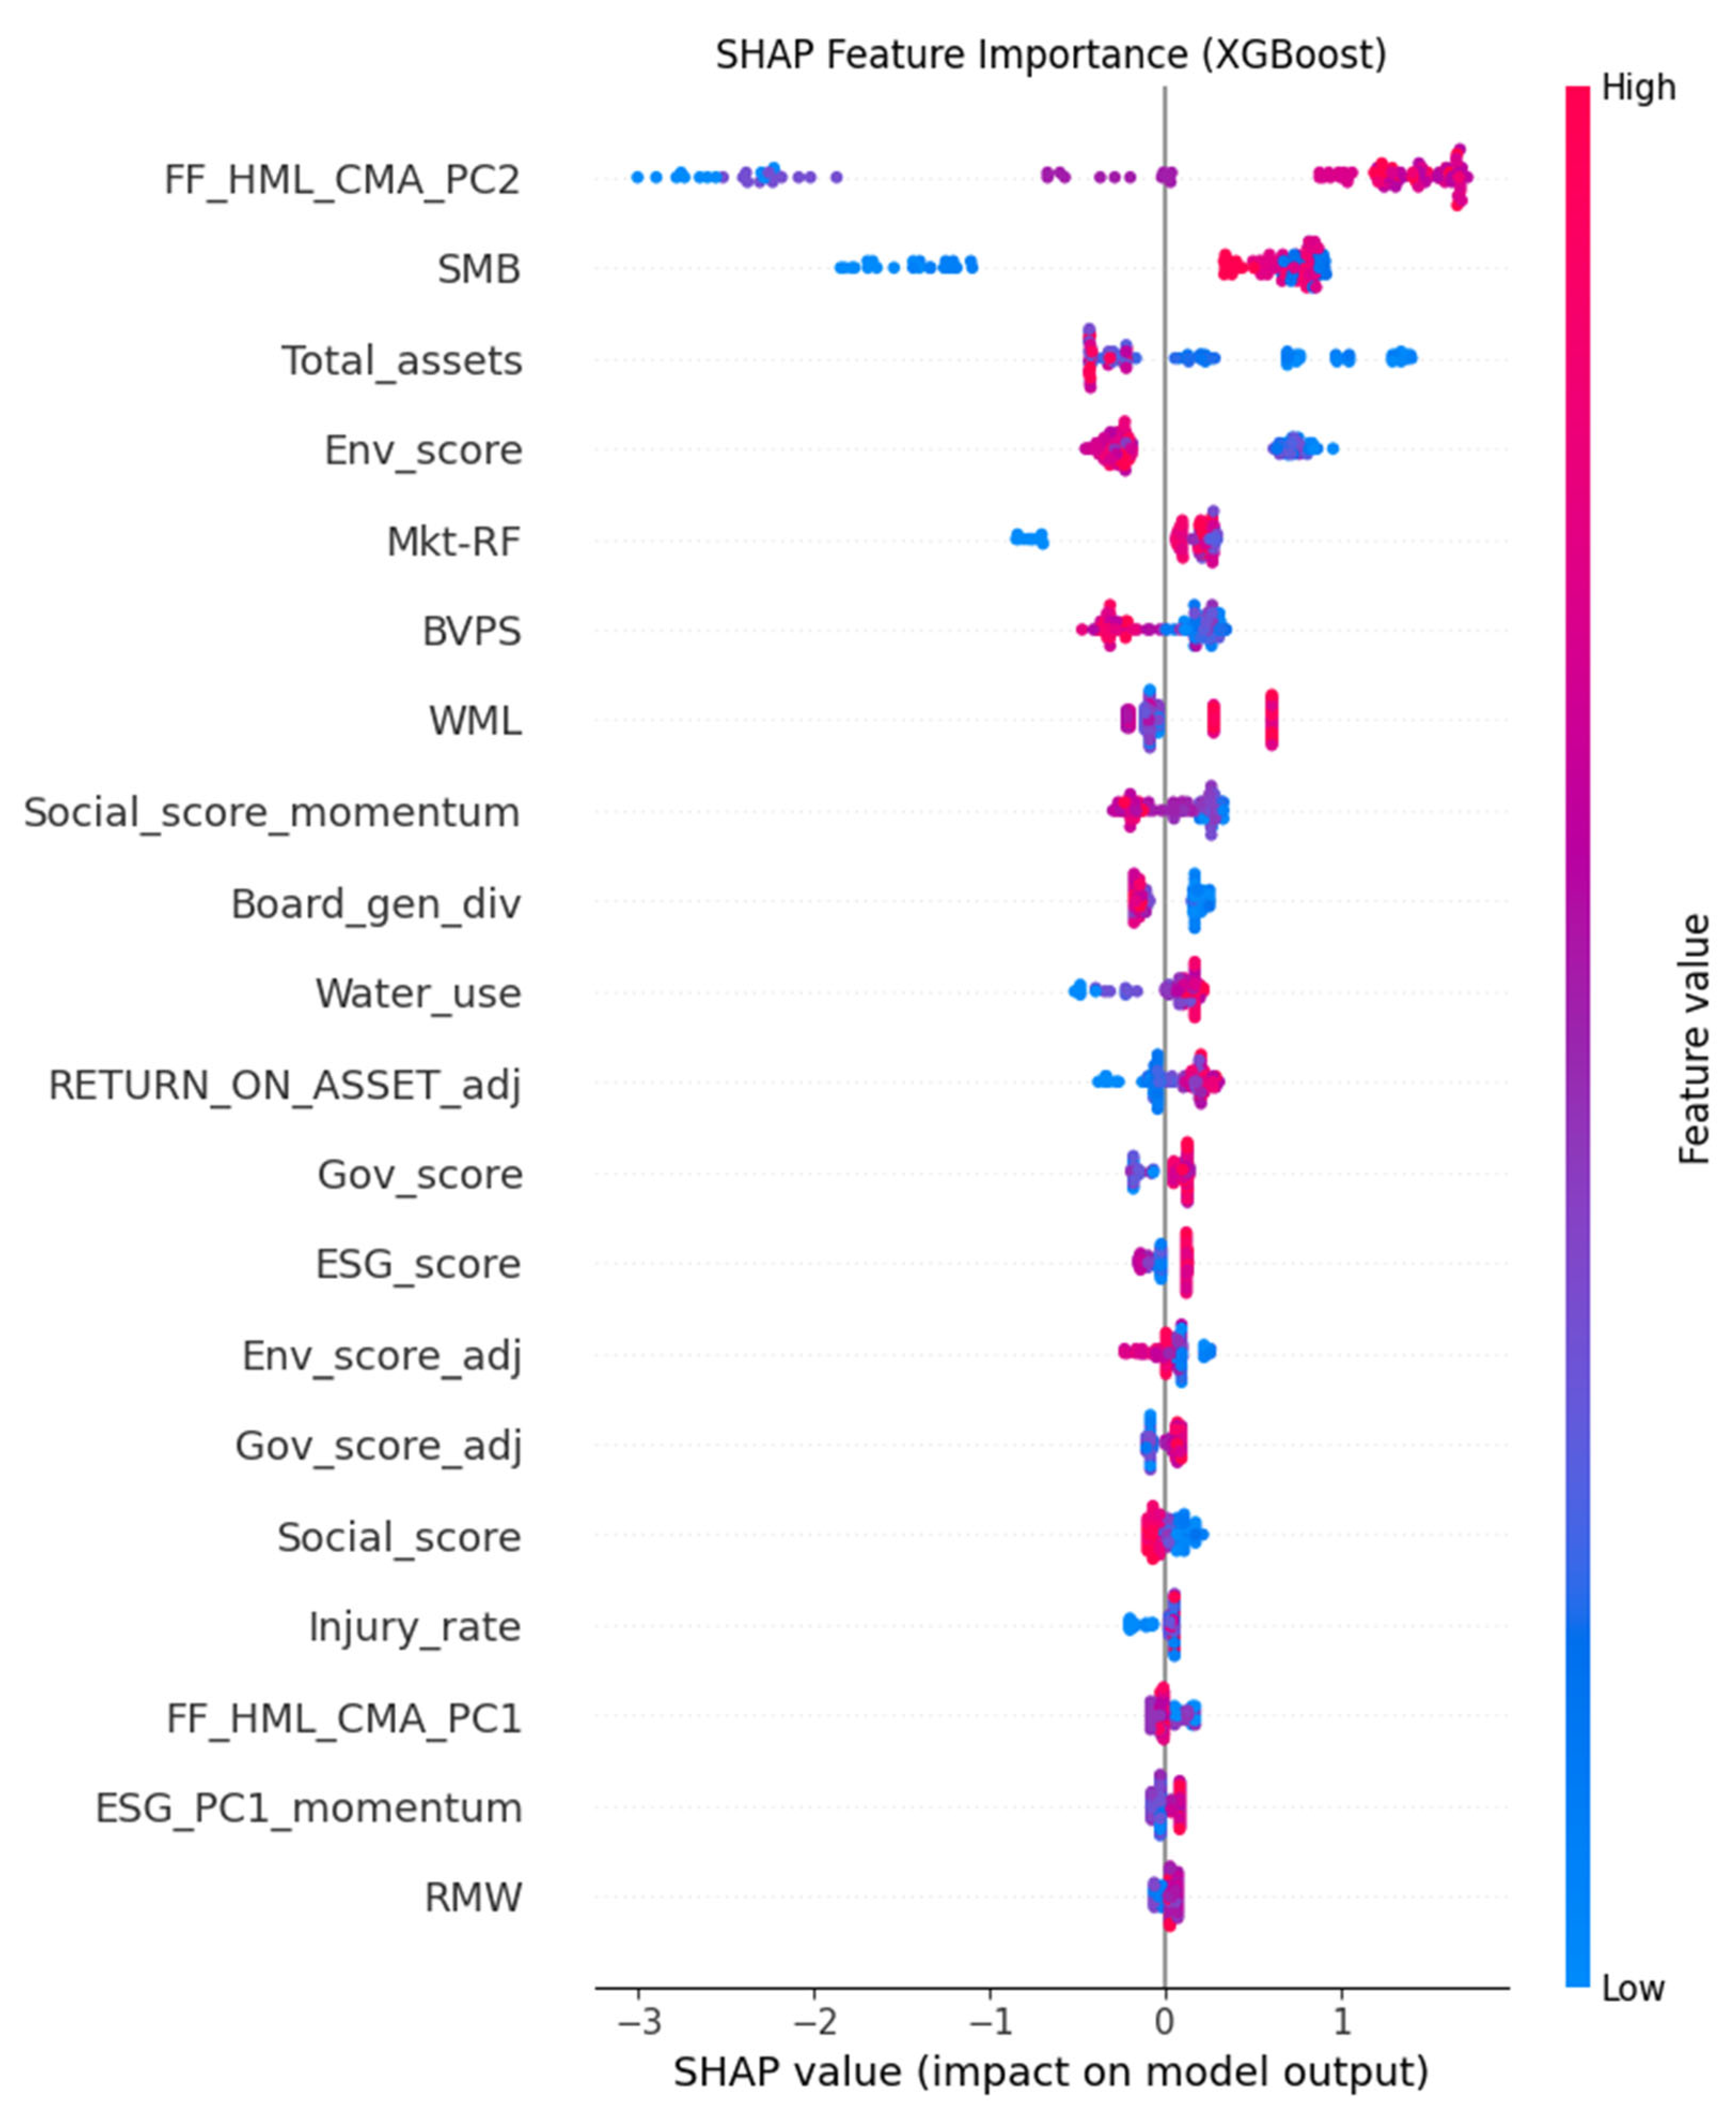
Figure 8.
SHAP Dependence Plot for XGBoost: Mkt-RF.
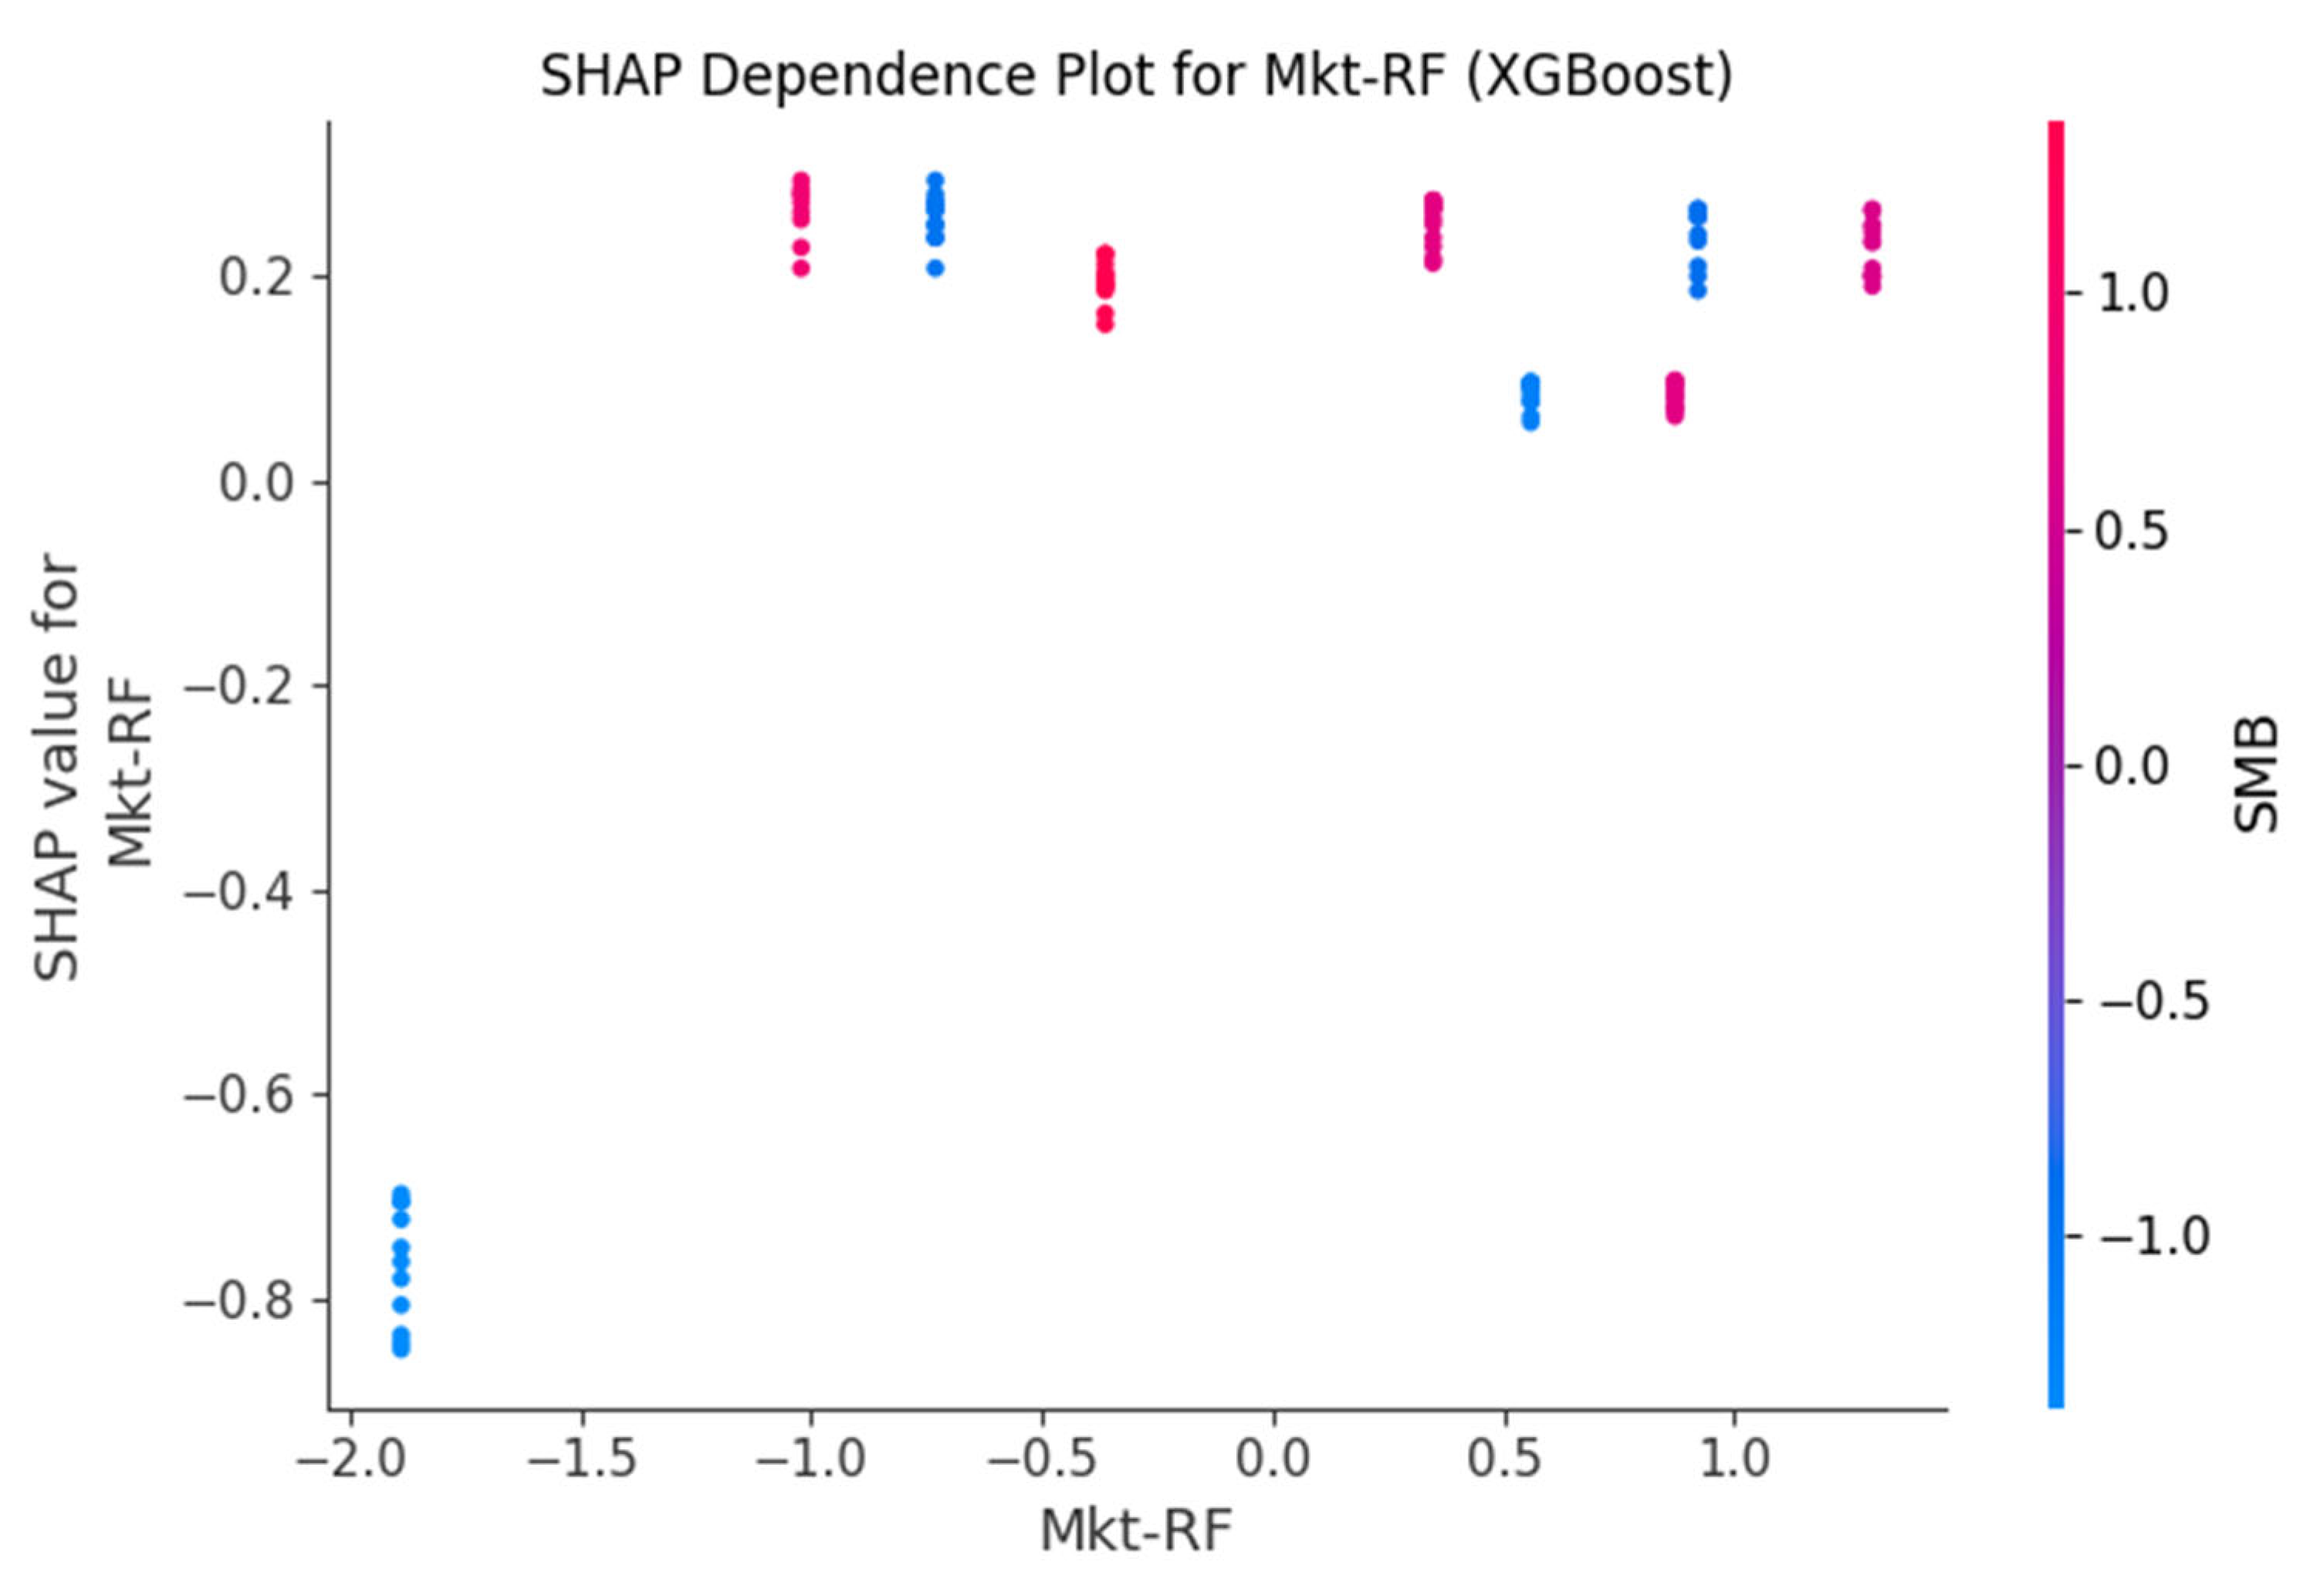
Figure 9.
SHAP Dependence Plot for XGBoost: FF_HML_CMA_PC2.
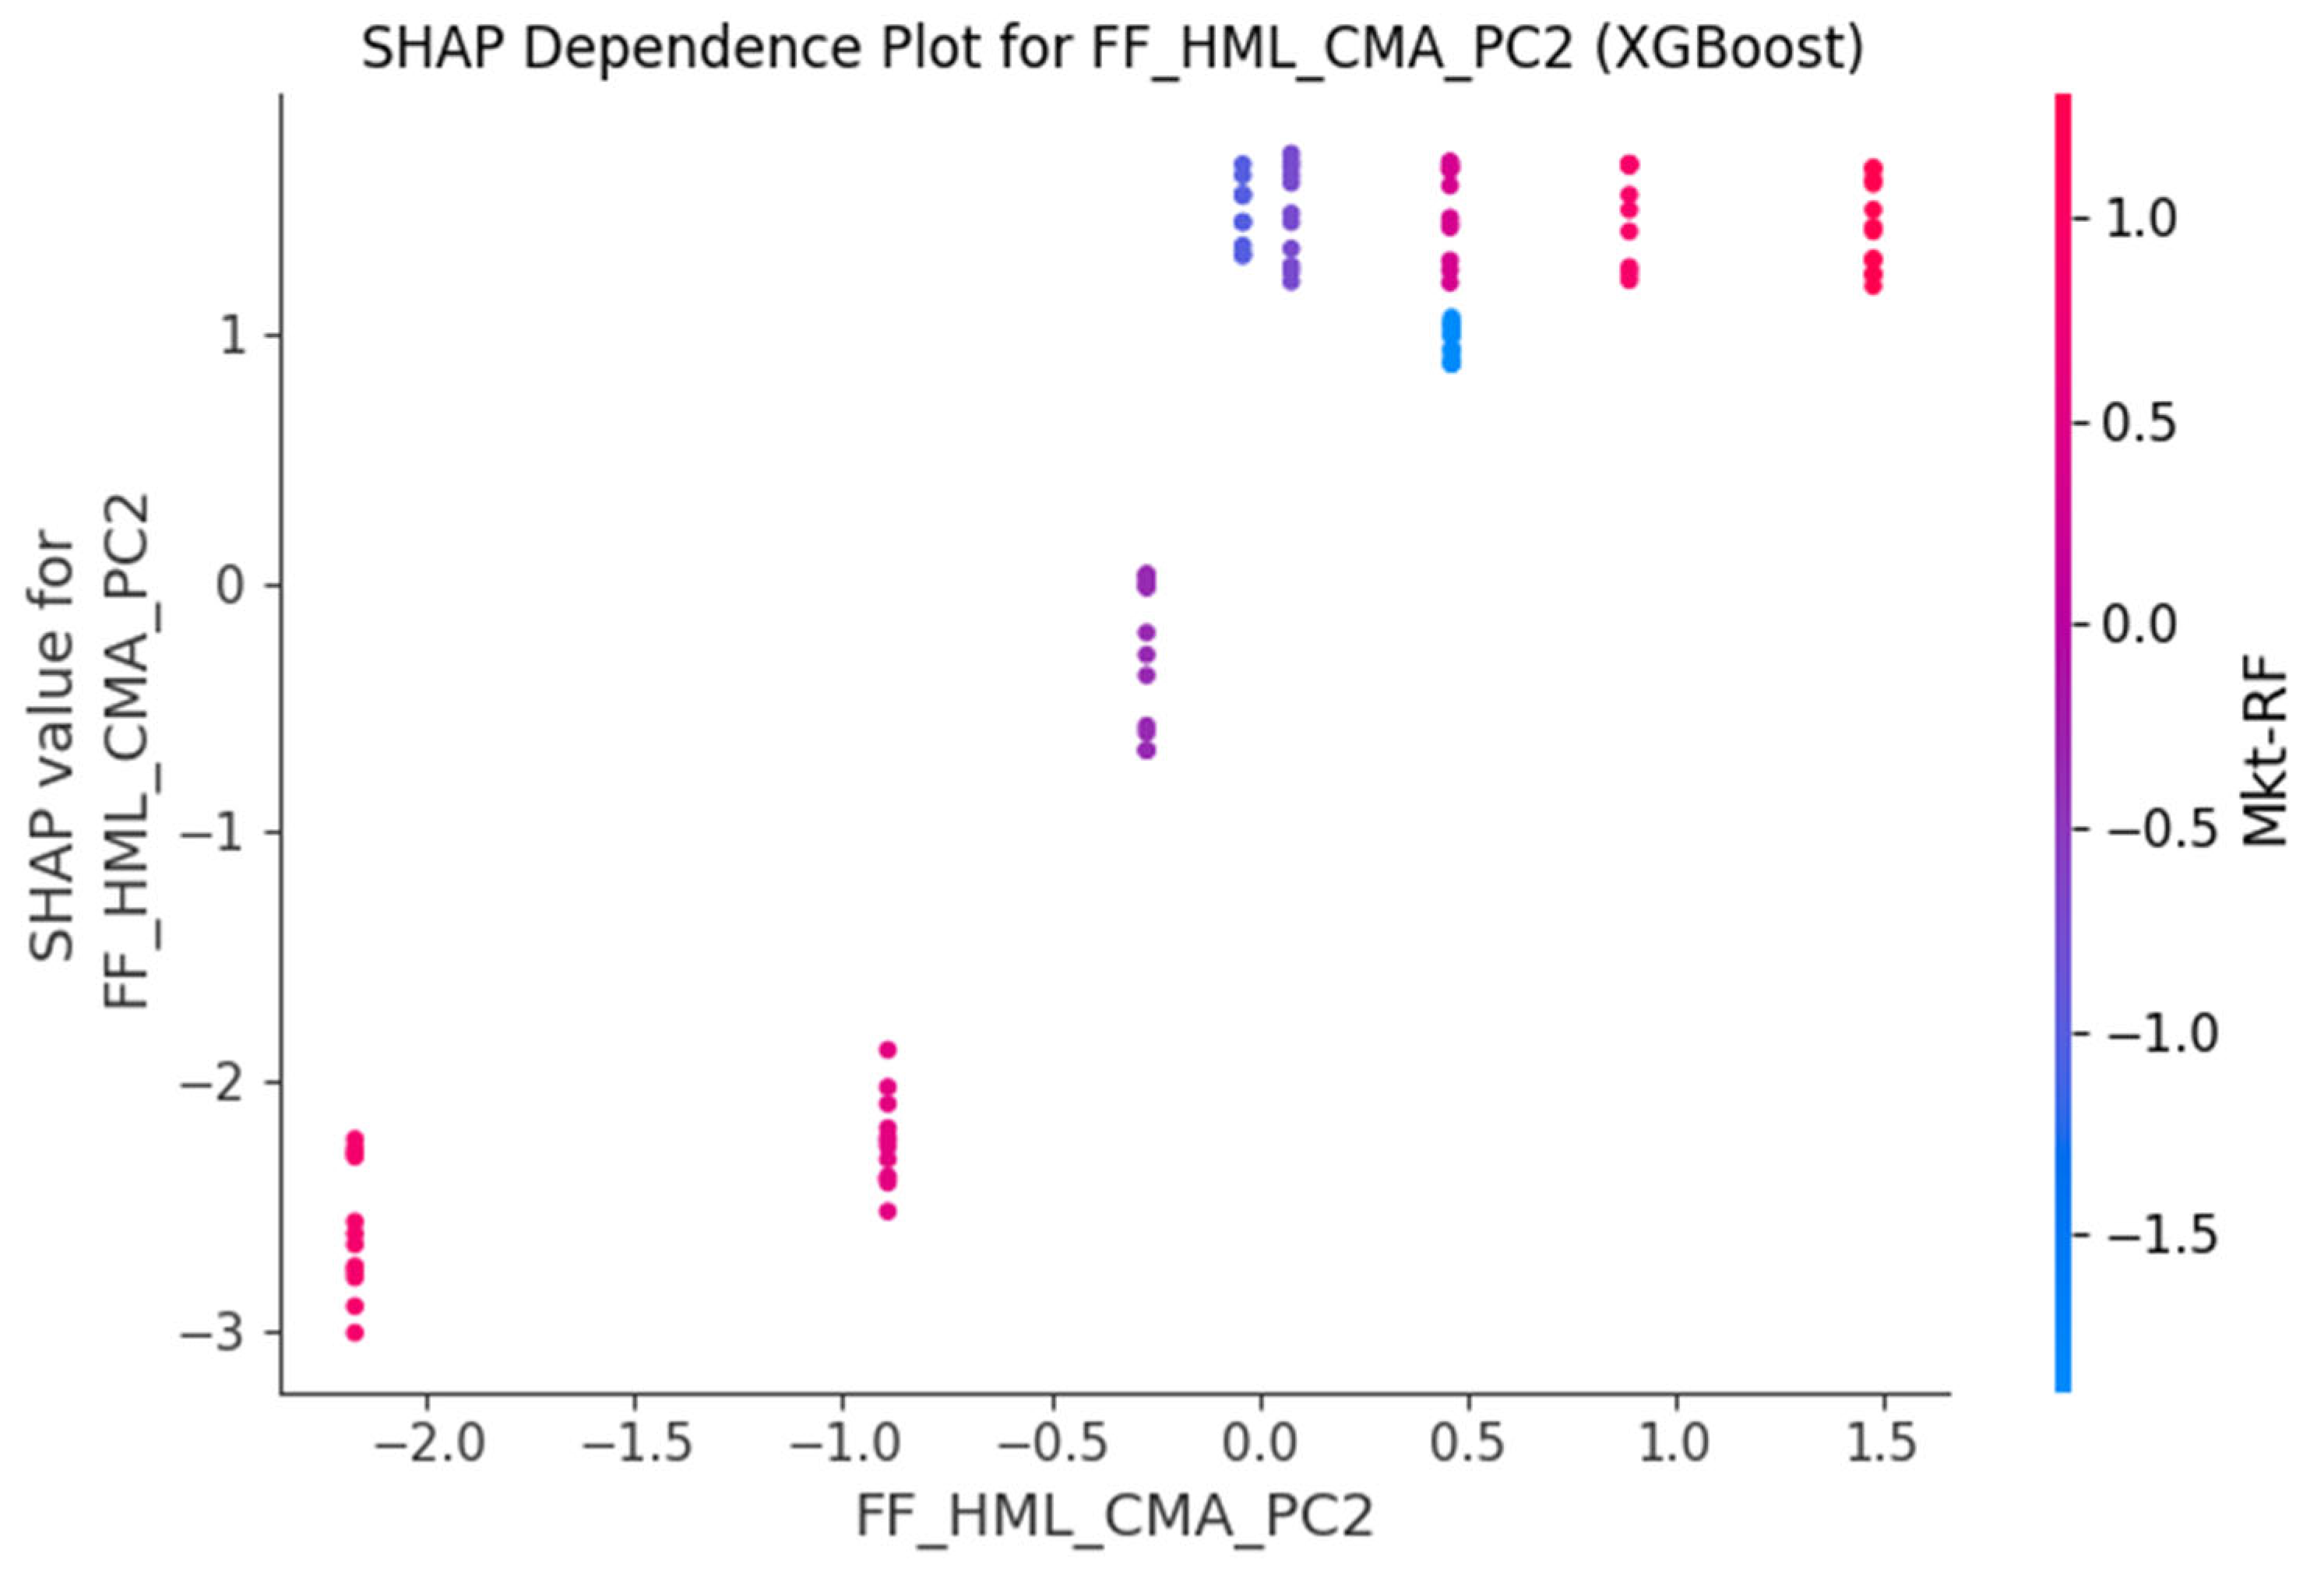
Figure 10.
SHAP Dependence Plot for XGBoost: WML.
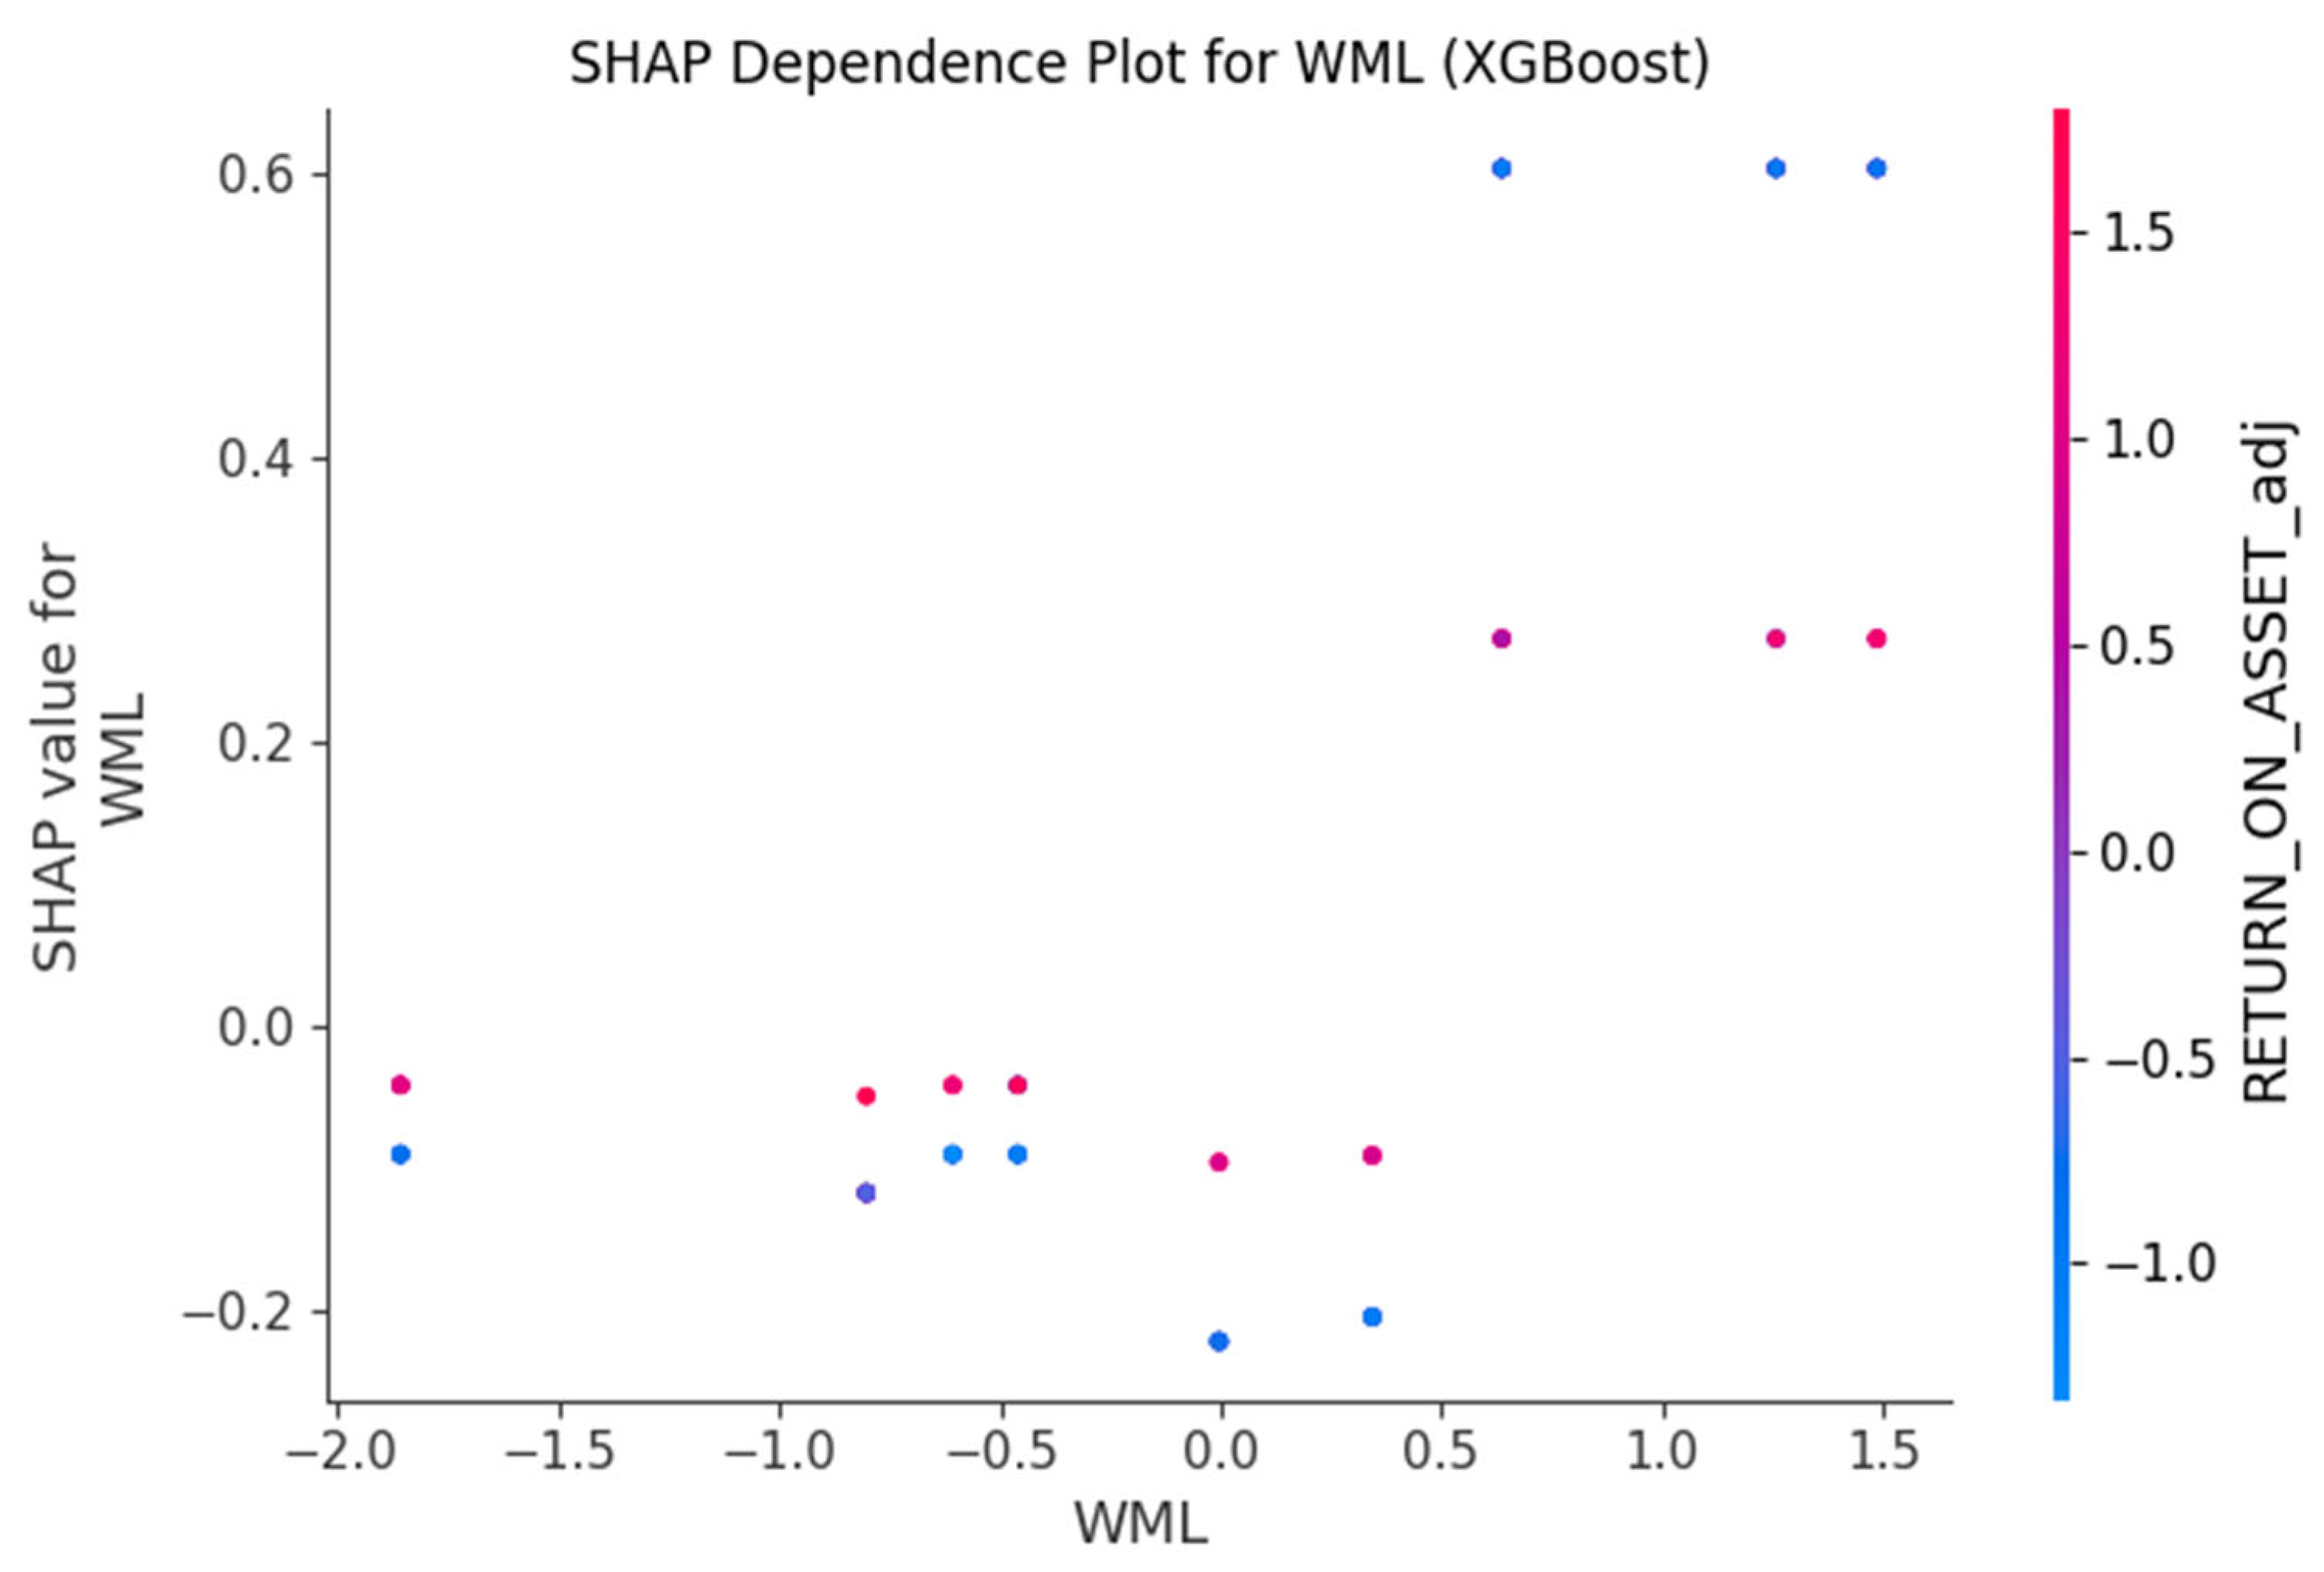

Table 1.
VIF Check with PCA-derived HML/CMA factors.
| Feature | VIF |
|---|---|
| Mkt-RF | 1.211337 |
| SMB | 2.084797 |
| RMW | 2.775956 |
| WML | 1.723362 |
| FF_HML_CMA_PC1 | 1.756370 |
| FF_HML_CMA_PC2 | 1.962121 |
| ESG_score | 1.081960 |
Table 2.
ADF Test Results for Stationarity.
| Variable | Test Statistic | P-value | Critical Values (1%, 5%, 10%) | Conclusion (at 5% significance) |
|---|---|---|---|---|
| Mkt-RF (Levels) | -3.53 | 0.0073 | {'1%': -4.47, '5%': -3.29, '10%': -2.77} | Stationary (I(0)) |
| Market_ESG_Factor_VW (Levels) | 1.49 | 0.9975 | {'1%': -4.94, '5%': -3.48, '10%': -2.84} | Non-stationary |
| Market_ESG_Factor_VW (First Difference) | -5.29 | 0.0000 | {'1%': -4.94, '5%': -3.48, '10%': -2.84} | Stationary (I(1)) |
Table 3.
Breusch-Pagan Test for Homoskedasticity of VAR Residuals.
| Residual Series | LM Statistic | P-value (LM) | F-Statistic | P-value (F) | Conclusion (at 5% significance) |
|---|---|---|---|---|---|
| Mkt-RF Residuals | 0.71 | 0.399 | 0.57 | 0.486 | No significant heteroskedasticity |
| Market_ESG_Factor_VW_diff Residuals | 1.38 | 0.241 | 1.22 | 0.319 | No significant heteroskedasticity |
Table 4.
Panel Data Estimation Summaries (Robust Standard Errors).
| Parameter | Pooled OLS | Std. Err. | T-stat | P-value | Fixed Effects | Std. Err. | T-stat | P-value | Random Effects | Std. Err. | T-stat | P-value |
|---|---|---|---|---|---|---|---|---|---|---|---|---|
| Const | 13.422 | 2.0873 | 6.4306 | 0.0000 | 8.4360 | 2.4026 | 3.5112 | 0.001 | 9.135 | 3.2137 | 2.843 | 0.005 |
| Mkt-RF | -0.0665 | 0.0595 | -1.1181 | 0.2656 | -0.074 | 0.040 | -1.8436 | 0.0677 | -0.0730 | 0.0399 | -1.8293 | 0.07 |
| SMB | 0.8172 | 0.2129 | 3.8392 | 0.0002 | 0.7958 | 0.1416 | 5.6193 | 0.0000 | 0.7988 | 0.1398 | 5.7124 | 0.0000 |
| RMW | 0.8624 | 0.2803 | 3.0761 | 0.0025 | 0.7186 | 0.1911 | 3.7593 | 0.0003 | 0.7387 | 0.1908 | 3.8712 | 0.0002 |
| WML | 0.2318 | 0.1059 | 2.1895 | 0.0303 | 0.2765 | 0.0777 | 3.5568 | 0.0005 | 0.2703 | 0.0767 | 3.5259 | 0.0006 |
| FF_HML_CMA_PC1 | 3.0722 | 0.6110 | 5.0280 | 0.0000 | 3.2379 | 0.4550 | 7.1168 | 0.0000 | 3.2146 | 0.4428 | 7.2603 | 0.0000 |
| FF_HML_CMA_PC2 | 2.5287 | 5.9237 | 0.4269 | 0.6702 | 1.5300 | 4.4258 | 0.3457 | 0.7302 | 1.6700 | 4.2279 | 0.3950 | 0.6935 |
| ESG_score | -0.189 | 0.0323 | -5.846 | 0.0000 | -0.088 | 0.045 | -1.944 | 0.054 | -0.102 | 0.0425 | -2.4 | 0.018 |
| R-squared | 0.368 | 0.4370 | 0.4279 | |||||||||
| F-statistic | 10.99 | 0.0 | 13.194 | 0.0 | 14.11 | 0.0 | ||||||
| No. Obs. | 140 | 140 | 140 | |||||||||
| Entities | 14 | 14 | 14 | |||||||||
| Note: R-squared values for Fixed Effects (Within) and Random Effects (Overall). | ||||||||||||
Table 5.
Fixed Effects Model with Decomposed ESG Factors (Robust Standard Errors).
| Parameter | Coefficient | Std. Err. | T-stat | P-value |
|---|---|---|---|---|
| Const | -76.974 | 103.49 | -0.7438 | 0.4585 |
| Mkt-RF | -0.0011 | 0.0490 | -0.0221 | 0.9824 |
| SMB | 0.6696 | 0.1277 | 5.2440 | 0.0000 |
| RMW | 0.3074 | 0.1813 | 1.6960 | 0.0925 |
| WML | -0.0255 | 0.0545 | -0.4680 | 0.6406 |
| ESG_PC1 | -18.939 | 21.392 | -0.8853 | 0.3778 |
| Social_score | 0.6636 | 0.7189 | 0.9231 | 0.3579 |
| Gov_score | 0.4032 | 0.6668 | 0.6047 | 0.5466 |
| Env_score | 0.5154 | 0.5758 | 0.8951 | 0.3726 |
| R-squared | 0.2562 | |||
| F-statistic | 5.0808 | 0.0000 | ||
| No. Obs. | 140 | |||
| Entities | 14 |
Table 6.
Vector AutoRegression Model Estimation Summary.
| Dependent Variable | Parameter | Coefficient | Std. Err. | T-stat | P-value |
|---|---|---|---|---|---|
| Mkt-RF | Const | -0.236 | 0.067 | -3.537 | 0.000 |
| L1.Mkt-RF | -0.266 | 0.2009 | -1.324 | 0.185 | |
| L1.Market_ESG_Factor_VW_diff | 0.100 | 0.015 | 6.863 | 0.000 | |
| L2.Mkt-RF | 0.300 | 0.155 | 1.936 | 0.053 | |
| L2.Market_ESG_Factor_VW_diff | 0.069 | 0.015 | 4.648 | 0.000 | |
| Market_ESG_Factor_VW_diff | Const | 4.873 | 1.413 | 3.448 | 0.001 |
| L1.Mkt-RF | 5.042 | 4.260 | 1.184 | 0.237 | |
| L1.Market_ESG_Factor_VW_diff | -0.713 | 0.310 | -2.302 | 0.021 | |
| L2.Mkt-RF | 0.551 | 3.286 | 0.168 | 0.867 | |
| L2.Market_ESG_Factor_VW_diff | -0.748 | 0.314 | -2.380 | 0.017 | |
| Note: Nobs = 7 (due to differencing and lags), Log-likelihood = 23.0766, AIC = -9.41193. | |||||
Table 7.
Granger Causality Test Results (Max Lag = 2).
| Null Hypothesis | P-value (Lag 1) | P-value (Lag 2) | Conclusion (at 5%) |
|---|---|---|---|
| Mkt-RF does not Granger-cause Market_ESG_Factor_VW | 0.6256 | 0.2095 | No strong evidence |
| Market_ESG_Factor_VW does not Granger-cause Mkt-RF | 0.6543 | 0.5452 | No strong evidence |
Table 8.
GARCH(1,1) Model Results for Mkt-RF Volatility.
| Parameter | Coefficient | Std. Err. | T-stat | P-value | 95.0% Conf. Int. |
|---|---|---|---|---|---|
| Mean Model | |||||
| mu | 0.1289 | 3.835e-02 | 3.360 | 0.0007 | [0.0537, 0.204] |
| Volatility Model | |||||
| omega | 4.6832e-03 | 1.018e-02 | 0.460 | 0.645 | [-0.0153, 0.0246] |
| alpha[1] | 6.7357e-16 | 1.911e-02 | 3.524e-14 | 1.000 | [-0.0375, 0.0375] |
| beta[1] | 0.6866 | 0.796 | 0.863 | 0.388 | [-0.873, 2.247] |
| Note: No. Observations = 10. Covariance estimator: robust. | |||||
Table 9.
Random Forest (Tuned) Consolidated Cross-Validation Metrics.
| Metric | Value |
|---|---|
| Accuracy | 0.8968 |
| Precision | 0.8925 |
| Recall | 0.9651 |
| F1-Score | 0.9274 |
| ROC AUC | 0.9497 |
Table 10.
XGBoost (Tuned) Consolidated Cross-Validation Metrics.
| Metric | Value |
|---|---|
| Accuracy | 0.9206 |
| Precision | 0.9318 |
| Recall | 0.9535 |
| F1-Score | 0.9425 |
| ROC AUC | 0.9695 |
Table 11.
Random Forest Classification Report (Aggregated CV Predictions).
| Class | Precision | Recall | F1-Score | Support |
|---|---|---|---|---|
| 0 | 0.91 | 0.75 | 0.82 | 40 |
| 1 | 0.89 | 0.97 | 0.93 | 86 |
| Accuracy | 0.90 | 126 | ||
| Macro Avg | 0.90 | 0.86 | 0.87 | 126 |
| Weighted Avg | 0.90 | 0.90 | 0.89 | 126 |
Table 12.
XGBoost Classification Report (Aggregated CV Predictions).
| Class | Precision | Recall | F1-Score | Support |
|---|---|---|---|---|
| 0 | 0.89 | 0.85 | 0.87 | 40 |
| 1 | 0.93 | 0.95 | 0.94 | 86 |
| Accuracy | 0.92 | 126 | ||
| Macro Avg | 0.91 | 0.90 | 0.91 | 126 |
| Weighted Avg | 0.92 | 0.92 | 0.92 | 126 |
Table 13.
Top 10 Feature Importances (Random Forest).
| Feature | Importance |
|---|---|
| FF_HML_CMA_PC2 | 0.126196 |
| SMB | 0.102576 |
| FF_HML_CMA_PC1 | 0.074124 |
| WML | 0.069953 |
| Total_assets | 0.047730 |
| BVPS | 0.044419 |
| ESG_score | 0.033799 |
| RMW | 0.029729 |
| Env_score | 0.029007 |
| QUICK_RATIO | 0.028319 |
Table 14.
Top 10 Feature Importances (XGBoost).
| Feature | Importance |
|---|---|
| Mkt-RF | 0.163994 |
| FF_HML_CMA_PC2 | 0.106657 |
| WML | 0.101681 |
| SMB | 0.098028 |
| Total_assets | 0.073494 |
| Env_score_adj | 0.061145 |
| RMW | 0.060137 |
| Injury_rate | 0.055634 |
| Water_use | 0.034186 |
| RETURN_ON_ASSET_adj | 0.025621 |
Disclaimer/Publisher’s Note: The statements, opinions and data contained in all publications are solely those of the individual author(s) and contributor(s) and not of MDPI and/or the editor(s). MDPI and/or the editor(s) disclaim responsibility for any injury to people or property resulting from any ideas, methods, instructions or products referred to in the content. |
© 2025 by the authors. Licensee MDPI, Basel, Switzerland. This article is an open access article distributed under the terms and conditions of the Creative Commons Attribution (CC BY) license (http://creativecommons.org/licenses/by/4.0/).
Copyright: This open access article is published under a Creative Commons CC BY 4.0 license, which permit the free download, distribution, and reuse, provided that the author and preprint are cited in any reuse.


