
Submitted:
12 July 2025
Posted:
22 July 2025
You are already at the latest version
Abstract
This study investigates the financial materiality of Environmental, Social, and Governance (ESG) performance in the global transport and logistics sector. Recognizing the limitations of single-method approaches and the sector's unique characteristics, an innovative, integrated methodology is employed. Panel regression reveals that aggregate ESG scores significantly correlate with higher excess returns, while individual ESG pillars do not. Vector Autoregression (VAR) analysis demonstrates dynamic interdependencies and spillover effects between ESG portfolios and market factors, supported by bidirectional Granger causality. Volatility modeling using GARCH-family techniques indicates that ESG-leading firms exhibit enhanced resilience, characterized by the absence of a significant leverage effect in volatility. Critically, explainable machine learning (XGBoost with SHAP values) uncovers differentiated return drivers: the Medium-ESG portfolio is primarily influenced by market factors, while the High-ESG portfolio's returns are driven by profitability and momentum, suggesting superior dynamic capabilities. These findings provide crucial, practical insights for corporate strategy and investment decisions, advancing theoretical understanding by linking ESG to financial performance, resilience, and adaptive capacity in this vital industry.
Keywords:
ESG
; transport and logistics
; financial performance
; panel regression
; VAR
; GARCH
; machine learning
; SHAP
; dynamic capabilities
; supply chain resilience
1. Introduction
The transport and logistics industry, a fundamental pillar of the global economy, is under growing examination concerning its environmental impact, societal effects, and governance frameworks [1,4,15]. Given its substantial contribution to worldwide greenhouse gas emissions (with Scope 1, 2, and 3 emissions being key focal points) and its intrinsic dependence on complex international supply networks, the sector finds itself at the vanguard of sustainability demands [8,12,20]. Concurrently, financial markets are increasingly embedding Environmental, Social, and Governance (ESG) criteria into their investment strategies, acknowledging their potential to affect long-term risk and returns [46,47]. This convergence has compelled logistics companies to emphasize green logistics methods, the electrification of vehicle fleets, the adoption of alternative fuels, and clear ESG disclosures [10,17,24,39,44,61]. Digitalization, facilitated by technologies like the Internet of Things (IoT), Artificial Intelligence (AI), and blockchain, is recognized as a critical driver for improving both efficiency and sustainability within logistics, enabling real-time tracking, optimized operations, and lower emissions [11,25,26,28,38]. Moreover, the escalating need for supply chain resilience, brought into sharp focus by recent global disturbances, further highlights how essential strong ESG performance is for buffering operational and financial disruptions [7,21,22].
Despite the escalating focus on ESG and the unique operational complexities of the transport and logistics sector, a comprehensive understanding of the financial materiality of ESG performance remains elusive. Prior research often explores direct correlations or applies single econometric methods, yielding mixed and sometimes contradictory results [46,47]. Such approaches may oversimplify the multifaceted nature of ESG's influence on financial outcomes, neglecting dynamic interdependencies, time-varying volatility, and complex non-linear relationships that are characteristic of financial markets and operational environments. The transport and logistics industry, with its heavy capital investments, long asset lifecycles, and susceptibility to regulatory changes and climate risks, necessitates a more granular and integrated analytical approach to fully capture ESG's financial implications. A deficiency exists in studies that holistically assess ESG as a static risk factor, a dynamic system component, and a predictor of firm resilience and capability within this specific context.
Existing literature predominantly focuses on either broad market analyses of ESG materiality or isolated aspects of ESG in specific industries. A significant research gap persists in studies that:
Employ a multi-method quantitative framework, combining traditional econometrics with advanced machine learning, to provide a holistic view of ESG's financial materiality.
Specifically target the transport and logistics sector, acknowledging its unique operational characteristics, carbon intensity, and susceptibility to global supply chain disruptions.
Investigate not only the static relationship between ESG performance and returns but also the dynamic interrelationships, feedback loops, volatility structures, and non-linear predictive power of ESG factors.
Utilize explainable AI methods (like SHAP) to unravel the complex contributions of various factors, including ESG, to firm performance, particularly differentiating between high- and medium-ESG performers.
This study moves beyond a simple assessment of correlation by employing a comprehensive, multi-method quantitative approach to answer the following research questions:
RQ1: To what extent do aggregate and pillar-level ESG scores have statistically significant explanatory power for cross-sectional stock returns, after controlling for traditional market risk factors using panel regression models?
RQ2: What are the dynamic interrelationships, feedback loops, and spillover effects between ESG-sorted portfolios and key macroeconomic variables, as identified through Vector Autoregression (VAR) and Granger causality analysis?
RQ3: Does ESG performance significantly alter the volatility structure, asymmetries, and conditional risk profiles of logistics firms, as modeled using GARCH, GJR-GARCH, and multivariate GARCH models during normal and shock periods?
RQ4: Which financial, ESG, and macroeconomic variables are most influential in predicting the returns of high- vs. medium-ESG performers, as determined by machine learning models (Random Forest, XGBoost) and SHAP-based explainability methods?
RQ5: How do machine learning-based return predictions for ESG portfolios compare with traditional econometric models (panel regression, GARCH) in terms of accuracy and interpretability across varying market regimes?
To answer these questions, this paper leverages panel regression, Vector Autoregression (VAR), GARCH-family models, and explanatory machine learning. By integrating these methods, a holistic analysis of ESG's role as a static risk factor, a dynamic system component, and a potential indicator of firm resilience and capability is provided. The findings offer crucial insights for corporate managers navigating ESG transformation and for investors seeking to integrate sustainability into portfolio allocation strategies.
2. Theoretical Framework and Literature Review
This study is grounded in four complementary theories that explain why and how ESG performance influences firm behavior and financial outcomes, particularly within the transport and logistics sector.
2.1. Theoretical Framework
Stakeholder theory posits that firms must create value for all stakeholders (e.g., investors, employees, customers, communities, regulators), not just shareholders, to achieve long-term success. Institutional theory explains how firms conform to external norms, rules, and beliefs to gain legitimacy, resources, and support. Together, these theories frame the fundamental drivers of ESG adoption. Firms improve ESG performance to satisfy investors demanding sustainable practices, customers demanding green shipping, and regulators enforcing emissions reporting or safety standards [8,19]. This institutional pressure is central to understanding why firms engage in practices like green logistics, leading to the expectation that ESG scores, as a proxy for a firm's responsiveness to these pressures, are priced by the market. High ESG performance signals adherence to societal expectations, potentially leading to reduced regulatory risks, enhanced reputation, and access to capital.
Crucially, within the transport and logistics sector, ESG performance is theorized to be a direct contributor to supply chain resilience. Supply Chain Resilience Theory defines a supply chain's capacity to anticipate, absorb, adapt to, and recover from disruptions. Firms demonstrating strong ESG practices, particularly in environmental management (e.g., diversified energy sources, climate risk adaptation) and social dimensions (e.g., solid labor relations, ethical sourcing), are intrinsically better positioned to withstand and recover from shocks. For example, the adoption of green logistics and investments in digital twins or IoT for real-time visibility can bolster operational flexibility and responsiveness during crises such as pandemics or climate events [50]. Therefore, this theory informs the investigation into whether higher ESG performance correlates with reduced volatility or a more stable risk profile.
Dynamic capabilities refer to a company's proficiency in integrating, developing, and modifying its internal and external resources to effectively operate within rapidly evolving contexts. Given the inherently unpredictable nature of the transport and logistics industry, which is continuously transformed by technological innovations such as AI and automation, alongside increasing sustainability demands, a firm's capacity for adaptation is critically important [11,25]. Strong ESG performance can thus be interpreted as a proxy for superior dynamic capabilities. Such firms often exhibit robust innovation processes, adaptable governance, and a proactive approach to environmental and social challenges. This proactive stance, facilitated by dynamic capabilities, enables them to innovate in green technologies, optimize resource utilization, and build resilient supply chains, ultimately fostering sustained competitive advantage and distinct financial outcomes. Thus, ESG serves as an indicator of a firm's adaptive and innovative prowess.
2.2. Literature Review
Research exploring the financial impact of ESG factors across the broader market has expanded considerably, with numerous meta-analyses generally indicating a positive correlation between strong ESG performance and financial returns [46,47]. However, studies specifically examining the transport and logistics sector are less prevalent, and their findings can be varied, often due to the sector's unique characteristics and diverse methodologies employed. Emerging research suggests that ESG ratings can indeed bolster the high-quality development of logistics enterprises by fostering digital transformation and green innovation [10,24]. This sector faces increasing pressure to curtail its environmental footprint, adhere to ESG standards, and implement green logistics practices such as fleet electrification, the adoption of alternative fuels, and the use of sustainable packaging. Consequently, transparency and robust ESG reporting have become integral to corporate strategy and investment decisions [8,12,17,20,39,44]. Despite these trends, the precise mechanisms through which these efforts translate into tangible financial benefits, beyond simple correlation, warrant deeper investigation.
A dominant theme shaping the transport and logistics sector is the pervasive influence of technology [11,25]. Digitalization, encompassing technologies like the Internet of Things (IoT), Artificial Intelligence (AI), and blockchain, is recognized as a pivotal enabler for both efficiency and sustainability improvements [26,28,38,51]. The use of AI, robotics, Digital Twins, and blockchain for fully automated, self-optimizing warehouse operations is becoming a critical requirement for competitiveness, with hyperautomation allowing for faster, more accurate processing and lower long-term costs through improved resource efficiency and waste reduction [28,29]. Furthermore, AI-powered Transport Management Systems (TMS) are transforming logistics by enabling continuous adaptation to real-time data, optimizing routes, forecasting demand, and minimizing both costs and emissions. These advanced systems enhance a firm's capacity for rapid disruption response and bolster agile, resilient supply chains, directly contributing to environmental (e.g., lower emissions) and operational ESG objectives [32,38]. Real-time operational insights are further amplified by digital twins, IoT sensors, and 5G connectivity, which provide end-to-end visibility and simulation capabilities. This heightened transparency supports efficient operations and regulatory compliance, crucial for effective environmental and social governance [48,49,50,52,53]. Blockchain technology, in parallel, underpins data integrity and traceability, which are essential for sustainable supply chain management [26,51,52].
In conjunction with technological advancements, the transport and logistics sector is under significant pressure to minimize its environmental impact, meet ESG standards, and embrace green logistics initiatives like fleet electrification, alternative fuels, and sustainable packaging [8,12,17,20,39]. Policies aimed at carbon emission reduction are critically shaping the sector, necessitating substantial investments in green technologies and infrastructure [40,41,42,43,44,45]. This regulatory landscape, coupled with a growing awareness of climate change and resource scarcity, underscores why transparency and ESG reporting are now central to business strategy and investment decisions [10,24].
Moreover, the sector's vulnerability to systemic disruptions—ranging from geopolitical tensions and climate events to pandemics—has elevated resilience and risk management to paramount importance [7,21,22]. Consequently, research is increasingly focusing on strategies such as regionalization, nearshoring, and the development of agile, adaptable supply chains capable of withstanding shocks while maintaining service continuity [7,21,22]. Within this context, ESG performance is increasingly identified as a critical determinant of a firm's risk management capabilities and overall resilience, given that strong governance and social practices can effectively mitigate operational and reputational damage during crises [10,24].
The exploration of ESG's financial materiality has traditionally relied on econometric methodologies. Panel regression models are widely employed to assess the influence of firm-specific attributes, such as ESG scores, on stock returns while controlling for market factors [6,13,14,15,55,61]. To capture dynamic interdependencies and spillover effects between economic variables and market returns in transportation and freight markets, Vector Autoregression (VAR) models are frequently utilized [2,16,54,56]. Furthermore, GARCH-family models, including GARCH, EGARCH, and GJR-GARCH, are standard tools for analyzing time-varying volatility, volatility clustering, and leverage effects in financial time series, such as those found in shipping and freight rates [3]. While these econometric approaches offer robust insights into linear relationships and time-series dynamics, they may face limitations when addressing the complex, non-linear, and high-dimensional nature of ESG-finance relationships.
More recently, machine learning (ML) techniques have emerged as powerful analytical tools, particularly adept at uncovering complex financial data patterns and identifying non-linear relationships. Ensemble methods like Random Forest and XGBoost, for example, are recognized for their predictive capabilities and their efficacy in managing large datasets and intricate interactions [33,34,35,36,37]. Critically, the advancement of explainable AI (XAI) methods, such as SHAP (Shapley Additive exPlanations), has enabled researchers to interpret the specific contributions of individual features within these 'black box' models. This capability offers valuable insights into the underlying drivers of outcomes, as demonstrated in studies concerning transport emissions and safety [33,34,35,36,37,57,58,59]. Building upon these foundations, the current study innovates by integrating these traditional econometric models with advanced explanatory machine learning techniques. This integrated approach facilitates a more comprehensive and interpretable analysis of ESG's multifaceted financial materiality within the transport and logistics sector.
3. Methodology
This study employs a multi-stage quantitative methodology to analyze the financial impact of ESG performance within the transport and logistics sector. The approach integrates traditional econometric modeling with advanced machine learning techniques to provide a holistic understanding of ESG's role in risk, return, and dynamic market linkages.
3.1. Bibliometric Analysis of Current Trends in Academic Research
A preliminary bibliometric analysis was conducted to map the landscape of academic research in transport, logistics, and ESG. This analysis utilized a dataset of relevant publications to identify prominent keywords, research clusters, and emerging themes. The resulting WordCloud (discussed further in the Results section as Figure 1) visually represents the most frequent and important terms, indicating key areas of focus within the field and contextualizing the study's relevance within current research trends. This initial step helped confirm the salience of topics such as emissions, green logistics, digital transformation (AI, IoT, blockchain), supply chain resilience, and the increasing use of advanced analytical methods (including machine learning) in the sector.
3.2. Data and Sample Selection
The analysis drew upon three principal data sources, triangulated to ensure robustness and comprehensive coverage. Firm-level ESG scores, encompassing Total-Score, E-Score, S-Score, and G-Score, were gathered for a selection of global transport and logistics companies. These ESG metrics were primarily accessed via the yesg Python library, which synergistically harmonizes data from multiple reputable providers, including Sustainalytics, MSCI, Bloomberg, and Refinitiv. This multi-source approach mitigates potential biases associated with single-provider ratings, thereby yielding a more robust measure of a firm's ESG performance. The initial dataset contained 56,254 observations. Essential factor data, specifically the Fama-French Five-Factor model components (Mkt-RF, SMB, HML, RMW, CMA), along with the Momentum factor (WML) and the Risk-Free rate (RF), were sourced from the Kenneth R. French Data Library [60]. These factors serve as standard controls for market risk, size, value, profitability, investment, and momentum within asset pricing models. Daily adjusted closing stock prices for the selected companies were obtained from financial data providers. The initial sample comprised 21 tickers, representing a diverse array of global transport and logistics firms across various geographies such as North America, Europe, and Asia. Rigorous data cleaning was undertaken to ensure data continuity and availability across all sources for the entire analysis period, ultimately resulting in a final sample of 18 firms with complete daily data. Missing ESG data, particularly within the pillar scores, were addressed through Multiple Imputation by Chained Equations (MICE), a statistically robust technique adept at preserving inter-variable relationships. The resultant panel dataset for regression analysis comprises 29,628 firm-day observations, providing a high-frequency perspective on ESG's financial impact. While the selection of global firms aimed for sector-wide diversity rather than country-specific analysis, the emphasis remained on capturing ESG materiality across the transport and logistics industry.
3.3. Portfolio Construction
To analyze ESG-related dynamics at a portfolio level, two distinct value-weighted portfolios were constructed. Firms were categorized into two ESG risk groups based on their average Total-Score over the study period. The "High-ESG" portfolio comprised firms with the highest ESG Total-Scores, totaling two companies, while the "Medium-ESG" portfolio included the remaining sixteen firms with moderate ESG Total-Scores. Daily excess returns for these value-weighted portfolios were subsequently calculated by subtracting the daily risk-free rate from the respective portfolio's raw returns. These calculated excess returns then served as the input for the Vector Autoregression (VAR) and GARCH modeling stages.
3.4. Econometric Model Specification and Diagnostic Testing
This section details the econometric models employed and the diagnostic tests conducted to ensure the validity of the results.
3.4.1. Panel Regression
To address RQ1, a Fixed Effects (FE) panel regression model was utilized to assess the explanatory power of ESG scores on firm-level excess returns, while simultaneously controlling for the established Fama-French-Carhart risk factors. The selection of FE over Random Effects (RE) was rigorously supported by a statistically significant Hausman test result (p < 0.05). This outcome indicates that entity-specific effects are likely correlated with the regressors, making FE a more appropriate estimator as it effectively controls for unobserved firm-specific heterogeneity—a crucial consideration in transport economics [6,14]. Two primary model specifications were tested: one incorporating the aggregate Total-Score, and another disaggregating ESG performance into its pillar scores (E-Score, S-Score, G-Score). To account for potential heteroskedasticity and serial correlation within firms, clustered standard errors by entity were implemented in the PanelOLS estimations. The VIF checks performed after separating the ESG scores confirmed a reduction in multicollinearity, allowing for more reliable interpretation.
3.4.2. Vector Autoregression (VAR)
Addressing RQ2, a Vector Autoregression (VAR) model was utilized. VAR models are a standard tool for exploring dynamic linkages and forecasting in economic and transport systems [2,16,56], making them suitable for capturing the interdependencies between the ESG portfolio returns (High-ESG and Medium-ESG) and the Fama-French risk factors. The optimal lag length for the VAR model was determined using the Bayesian Information Criterion (BIC), which indicated a lag of 1. This VAR framework enabled the execution of Granger Causality tests, the generation of Impulse Response Functions (IRFs), and the calculation of Forecast Error Variance Decomposition (FEVD), providing insights into directional influences and the propagation of economic shocks within the analyzed system.
3.4.3. VAR Model Diagnostics
Following the estimation of the VAR model, several critical diagnostics were performed to assess the quality and reliability of its residuals, which are essential for validating subsequent analyses, including Granger causality and impulse response functions. These diagnostics are presented in Table 1.
VAR Stability Test: Confirmed the estimated model's stability (Model Stability: True).
Residual Serial Correlation (Portmanteau) Test: Indicated significant serial correlation (Test Statistic: 711.3, p-value: 0.000), suggesting potential need for higher lags or specification adjustments.
Residual Normality (Jarque-Bera) Test: Rejected normality (Test Statistic: 13240, p-value: 0.000), a common characteristic in financial data that may affect the precision of normality-based inferences.
3.4.4. Impulse Response Functions (IRF)
The Impulse Response Functions (IRFs) graphically illustrate the dynamic impact of a shock in one variable on others within the VAR system. Figure 3 depicts the responses of the Medium-ESG portfolio to Mkt-RF shocks, and Figure 4 shows the responses of the High-ESG portfolio to Mkt-RF shocks. Figure 5 illustrates the impact of a shock to the High-ESG portfolio on other factors (e.g., SMB, HML, RMW), revealing the transmission of influence from these leading firms to broader market variables.
3.4.5. Forecast Error Variance Decomposition (FEVD)
The Forecast Error Variance Decomposition (FEVD) quantifies the proportion of variance in each variable's forecast error attributed to shocks in other variables over different time horizons. As detailed in Table 3 (at horizon 9), the variance of the Medium-ESG portfolio's returns is predominantly explained by its past shocks (87.73%) and the market factor (Mkt-RF) (8.94%). Notably, the High-ESG portfolio's variance is significantly influenced by the Medium-ESG portfolio (27.74% by period 9), demonstrating substantial spillover effects from the larger group of logistics firms to the top ESG performers. This interdependency highlights the interconnectedness within the sector's ESG performance landscape.
3.4.6. GARCH Models
To address RQ3, examining the impact of ESG performance on volatility, univariate GARCH(1,1), EGARCH(1,1), and GJR-GARCH models were fitted to the excess returns of both the High-ESG and Medium-ESG portfolios. GARCH-family models are standard for analyzing time-varying volatility and volatility clustering in financial markets [3]. The estimated alpha and beta coefficients in these models were generally significant (p < 0.05), confirming volatility clustering. The GJR-GARCH model's gamma coefficients were statistically insignificant for both portfolios (Medium-ESG: gamma = -0.000326, p = 0.970; High-ESG: gamma = -0.000609, p = 0.936). This absence of a significant leverage effect suggests that negative shocks do not disproportionately increase volatility compared to positive shocks of the same magnitude, potentially indicating greater risk resilience in these ESG-focused firms. While a full MGARCH model was not explicitly estimated, a rolling correlation analysis between the two ESG portfolios (Figure 5) served as a proxy to infer their time-varying co-movement and potential diversification benefits.
3.5. Econometric and Machine Learning Models
A sequence of four modeling techniques was applied to address the research questions, integrating traditional econometrics with advanced machine learning for a comprehensive analysis.
3.5.1. Panel Regression
The Fixed Effects (FE) panel regression model was used to assess the explanatory power of ESG scores on firm-level excess returns, controlling for Fama-French-Carhart factors. The selection of FE over Random Effects (RE) was supported by a statistically significant Hausman test (p < 0.05), indicating that entity-specific effects are correlated with regressors. This approach controls for unobserved firm-specific heterogeneity. Two specifications were tested: one with aggregate Total-Score and another with pillar scores (E-Score, S-Score, G-Score). Clustered standard errors by entity were applied to account for potential heteroskedasticity and serial correlation within firms.
3.5.2. Vector Autoregression (VAR)
A VAR model was employed to capture interdependencies between ESG portfolio returns and Fama-French risk factors, with an optimal lag length of 1 determined by BIC. This model facilitated Granger Causality tests, IRFs, and FEVD to understand dynamic linkages and shock propagation.
3.5.3. GARCH Models
Univariate GARCH(1,1), EGARCH(1,1), and GJR-GARCH models were fitted to portfolio excess returns to analyze time-varying volatility and leverage effects. The GJR-GARCH results indicated insignificant gamma coefficients for both portfolios, suggesting an absence of the typical leverage effect and potential resilience.
3.5.4. Explanatory Machine Learning
An XGBoost model, alongside SHAP values, was employed to identify key explanatory variables and their nonlinear effects on portfolio returns. This approach prioritizes explanation over pure prediction, as evidenced by the model performance summary (negative average R2 values), but highlights the utility of SHAP for understanding feature contributions. Random Forest, Ridge, Lasso, RNN, and DNN models were also used for comparative performance assessment.
4. Results
The empirical analysis yielded key results across the four modeling stages, examining ESG's financial materiality within the transport and logistics sector.
4.1. Key Diagnostic Tests
Before delving into the main model estimations, several diagnostic tests were performed to ensure the validity of the data and the appropriateness of the chosen models. The Augmented Dickey–Fuller (ADF) test was applied to all time-series variables, including portfolio returns and Fama-French factors, to confirm their stationarity, a prerequisite for the VAR and GARCH analyses; as detailed in Table 1, Stationarity Test Results, all variables were found to be stationary at the 5% significance level. Following the estimation of the VAR model, critical diagnostics were performed and are summarized in Table 2. This analysis confirmed the estimated model's stability (Model Stability: True). However, the Residual Serial Correlation (Portmanteau) Test indicated significant serial correlation (Test Statistic: 711.3, p-value: 0.000), and the Residual Normality (Jarque-Bera) Test rejected normality (Test Statistic: 13240, p-value: 0.000), which are common findings in financial data and suggest potential areas for model refinement but do not invalidate the subsequent inferential analyses. For the panel regressions, the selection of Fixed Effects (FE) over Random Effects (RE) was supported by a statistically significant Hausman test (p < 0.05). Clustered standard errors were used to address potential heteroskedasticity and serial correlation within entities, as well as to account for likely cross-sectional dependence. The preliminary relationships between variables were explored through a correlation analysis, presented in Figure 2.
4.2. Panel Regression Findings: The Primacy of the Aggregate Score
The Fixed Effects panel regression results provide direct evidence on the pricing of ESG risk within the transport and logistics sector. Model 1, utilizing the Total-Score, demonstrated a positive and highly statistically significant coefficient (0.0015, p = 0.0000) for ESG performance, indicating that after controlling for standard market risk factors, higher aggregate ESG performance is associated with higher excess returns. The R-squared (Within) of 0.1845 suggests moderate explanatory power, and low VIF values confirm the absence of significant multicollinearity. The detailed parameter estimates for this model are presented in Table 3. In contrast, Model 2, which disaggregated ESG performance into its pillar scores (E-Score, S-Score, G-Score), found no statistically significant coefficients for these individual components (p-values ranging from 0.1849 to 0.9815). This suggests that the market prices a firm's holistic ESG profile rather than its performance on isolated dimensions. VIF diagnostics confirmed that separating these variables was necessary to avoid severe multicollinearity, allowing for individual interpretation. The detailed parameter estimates for this model are presented in Table 4.
4.3. VAR Analysis: Dynamic Interconnections and Diagnostic Assessment
The Vector Autoregression (VAR) model, selected with an optimal lag length of 1 based on the BIC, reveals complex dynamic linkages between ESG portfolio returns and Fama-French factors. The model's diagnostic checks, summarized in Table 1 and Table 2, confirmed model stability (Model Stability: True) but also indicated significant residual serial correlation (Portmanteau Test: p-value: 0.000) and non-normal residuals (Jarque-Bera Test: p-value: 0.000). While these diagnostics suggest potential areas for model refinement, they do not invalidate the subsequent analyses of Granger causality and impulse response functions.
Significant bidirectional Granger causality was found between the Medium-ESG and High-ESG portfolios (p < 0.001 for both directions), indicating spillover effects and information transmission. The market factor (Mkt-RF) and size factor (SMB) were found to Granger-cause Medium-ESG returns (p=0.000 and p=0.036, respectively), while Mkt-RF also Granger-caused High-ESG returns (p=0.000). Other significant causal relationships are detailed in Table 5 and Table 6.
The Forecast Error Variance Decomposition (FEVD), presented in Table 7, the FEVD at horizon 9 quantifies the proportion of variance in each variable's forecast error attributed to shocks in others. The Medium-ESG portfolio's variance is primarily explained by its past shocks (87.73%) and Mkt-RF (8.94%). Notably, the High-ESG portfolio's variance is significantly influenced by the Medium-ESG portfolio (27.74% by period 9), demonstrating substantial spillover effects from the broader group to the top ESG performers. The Impulse Response Functions (IRFs), graphically illustrated in Figure 3 (Medium-ESG to Mkt-RF shock), Figure 4 (High-ESG to Mkt-RF shock), and Figure 5 (impact of High-ESG shock on other factors), confirm these dynamic relationships, showing how shocks propagate through the system.
4.4. Volatility Modeling: Evidence of Resilience
The GARCH analysis provides insights into the time-varying risk characteristics of the ESG portfolios. The GARCH(1,1) and EGARCH(1,1) models for both Medium-ESG and High-ESG portfolios showed generally significant alpha and beta coefficients (p < 0.05), confirming volatility clustering. Specific coefficients are detailed in Table 8 and Table 9.
Crucially, the GJR-GARCH model's gamma coefficients, indicative of asymmetric volatility, were statistically insignificant for both portfolios (Medium-ESG: gamma = -0.000326, p = 0.970; High-ESG: gamma = -0.000609, p = 0.936). This absence of a significant leverage effect suggests that negative shocks do not disproportionately increase volatility compared to positive shocks of the same magnitude, potentially indicating greater risk resilience in these ESG-focused firms. This finding is summarized in Table 10. While a full MGARCH model was not estimated, the rolling correlation analysis between the High-ESG and Medium-ESG portfolios (Figure 6) illustrated fluctuating co-movements over time, suggesting that diversification benefits between these groups vary.
4.5. Explanatory Machine Learning: Differentiated Factor Importance
The XGBoost models, interpreted using SHAP values, revealed distinct drivers of returns for the two ESG portfolios. While overall predictive accuracy was modest (often negative R-squared values), their value lies in explaining feature contributions. For the Medium-ESG portfolio, the market factor (Mkt-RF) was the overwhelming determinant of returns, with an importance of 53.7%. Figure 7 (SHAP summary plot) and Figure 8 (Feature Importance chart) illustrate these findings. In contrast, the High-ESG portfolio's feature importance was more distributed, with RMW (profitability, 18.7%), WML (momentum, 17.8%), HML (value, 16.7%), and Mkt-RF (16.7%) being most influential. This suggests stronger underlying capabilities in top ESG performers, aligning with the Dynamic Capabilities Theory. Figure 9 (SHAP summary plot) and Figure 10 (Feature Importance chart) detail these results.
5. Discussion
The results, when interpreted through the theoretical framework, provide a nuanced and impactful picture of ESG's role in the transport and logistics sector. The multi-method approach highlights different facets of ESG materiality, ranging from its direct pricing effect to its influence on dynamic market interactions and firm capabilities.
5.1. Answer to Research Questions
RQ1: To what extent do aggregate and pillar-level ESG scores have statistically significant explanatory power for cross-sectional stock returns, after controlling for traditional market risk factors using panel regression models?
The panel regression findings provide direct evidence that aggregate ESG performance, represented by the Total-Score, possesses statistically significant explanatory power for cross-sectional stock returns in the transport and logistics sector (Table 3). A positive coefficient for Total-Score indicates that higher overall ESG performance is associated with higher excess returns, even after controlling for standard market risk factors. This outcome aligns robustly with Stakeholder Theory and Institutional Theory, suggesting that the market perceives a firm's comprehensive ESG commitment as a crucial signal of quality and long-term viability. Investors and other stakeholders appear to value a holistic ESG profile more than isolated performance on individual environmental, social, or governance dimensions. Firms that effectively manage a bundled set of ESG practices gain legitimacy and broad support from the institutional environment [18], leading to this aggregated market recognition. Conversely, individual E, S, and G pillar scores, when analyzed separately, did not exhibit statistically significant explanatory power for returns (Table 4). This implies that the market rewards the comprehensive adoption of "legitimate" sustainability practices as a heuristic for well-managed, forward-thinking companies, rather than dissecting performance on each specific pillar. This finding addresses RQ1 by highlighting the financial materiality of aggregate ESG scores while differentiating it from the impact of individual pillars.
RQ2: What are the dynamic interrelationships, feedback loops, and spillover effects between ESG-sorted portfolios and key macroeconomic variables, as identified through Vector Autoregression (VAR) and Granger causality analysis?
The VAR analysis revealed complex dynamic linkages and spillover effects within the system, addressing RQ2. Significant bidirectional Granger causality was found between the High-ESG and Medium-ESG portfolios (Table 5 and Table 6), indicating that past returns of one portfolio influence the future returns of the other. This suggests information transmission and interconnectedness based on ESG differentiation within the sector. The market factor (Mkt-RF) and size factor (SMB) were significant Granger causes for the Medium-ESG portfolio's returns, indicating that this broader group of logistics firms remains highly exposed to general market and size-related movements. The Forecast Error Variance Decomposition (FEVD) further elaborated these dynamics (Table 7). While their past shocks overwhelmingly explain the variance of both portfolios, the High-ESG portfolio's variance is significantly influenced by the Medium-ESG portfolio's shocks. The Impulse Response Functions (Figure 3, Figure 4 and Figure 5) graphically confirmed that both ESG portfolios react positively and significantly to a market shock, as expected, demonstrating their systematic risk exposure. These results highlight the dynamically interconnected nature of ESG performance across different segments of the transport and logistics sector and its interaction with broader market forces.
RQ3: Does ESG performance significantly alter the volatility structure, asymmetries, and conditional risk profiles of logistics firms, as modeled using GARCH, GJR-GARCH, and multivariate GARCH models during normal and shock periods?
The GARCH-family models provided insights into the risk characteristics of the ESG portfolios, directly addressing RQ3. Volatility clustering was confirmed for both Medium-ESG and High-ESG portfolios, as evidenced by generally significant alpha and beta coefficients in GARCH(1,1) and EGARCH(1,1) models (Table 8 and Table 9). Crucially, the GJR-GARCH models' gamma coefficients, which capture asymmetric volatility or the leverage effect, were statistically insignificant for both portfolios (Table 10). This implies that negative shocks do not disproportionately increase volatility compared to positive shocks of the same magnitude for these ESG-focused transport and logistics firms. This finding is consistent with enhanced resilience, supporting Supply Chain Resilience Theory. Firms with strong ESG practices are hypothesized to be better equipped to absorb and recover from adverse events, leading to a more stable conditional risk profile. The absence of a significant leverage effect suggests that ESG-focused firms may mitigate volatility asymmetry, potentially due to robust risk management, diversified operations, or stronger stakeholder relationships that buffer them against market downturns. The rolling correlation analysis (Figure 6) between the two ESG portfolios further illustrates fluctuating co-movements over time, suggesting time-varying diversification benefits.
RQ4: Which financial, ESG, and macroeconomic variables are most influential in predicting the returns of high- vs. medium-ESG performers, as determined by machine learning models (Random Forest, XGBoost) and SHAP-based explainability methods?
The explanatory machine learning models, particularly XGBoost combined with SHAP, differentiated the underlying drivers of returns for the two ESG portfolios, addressing RQ4. For the Medium-ESG portfolio, the market factor (Mkt-RF) was identified as the overwhelming determinant of returns of 53.7% importance (Figure 7 and Figure 8). This signifies a strong alignment with broader market trends and less differentiation in their fundamental drivers, typical of firms at an earlier stage of ESG integration or facing more traditional market dynamics. In contrast, the High-ESG portfolio's returns were driven by a more diverse set of factors, including RMW (profitability, 18.7%), WML (momentum, 17.8%), HML (value, 16.7%), and Mkt-RF (16.7%) (Figure 9 and Figure 10). This distributed importance, particularly the prominence of profitability and momentum factors, provides strong support for Dynamic Capabilities Theory. Firms achieving high ESG performance are likely to have developed superior strategic and adaptive capabilities [23]. These capabilities enable them to innovate, optimize operations for efficiency, and strategically position themselves to capture market opportunities, translating ESG investments into better operational and financial outcomes. ESG performance, therefore, acts as a proxy for superior strategic agility and capability, differentiating how returns are generated for these leading firms.
RQ5: How do machine learning-based return predictions for ESG portfolios compare with traditional econometric models (panel regression, GARCH) in terms of accuracy and interpretability across varying market regimes?
The comparative analysis (RQ5) highlights a distinction between prediction and explanation when contrasting machine learning models with traditional econometric methods. While the machine learning models did not achieve high R-squared values in predicting daily returns out-of-sample (often exhibiting negative R-squared, indicating performance below a simple historical mean benchmark), their primary strength lies in their interpretability through SHAP. Traditional econometric models, such as panel regression, provide clear, statistically significant linear relationships, offering direct causal inferences under specific assumptions. However, they may not fully capture complex non-linear interactions. Machine learning models, particularly when augmented with SHAP, excel at uncovering these nonlinear relationships and identifying the true relative importance of features, even in noisy financial time series where overall predictive accuracy remains challenging. SHAP plots visually represent the marginal contribution of each variable, providing actionable insights into which factors drive returns for different ESG segments and in what direction. This capability offers an invaluable understanding of ESG's nuanced impact, bridging the gap between traditional econometric rigor and the explanatory power of modern AI.
5.2. Managerial and Investment Implications
The findings yield significant implications for corporate managers and investors within the transport and logistics sector. For managers, prioritizing a holistic approach to ESG integration, rather than fragmented efforts on individual pillars, is demonstrated to be financially rewarding. ESG should be viewed as a strategic imperative that concurrently builds resilience and fosters dynamic capabilities. Investments in digitalization (e.g., AI, IoT, blockchain) and green innovation are not merely compliance costs but rather drivers of superior financial performance and competitive advantage, enabling firms to adapt to and capitalize on evolving environmental and social shifts [10,24]. Developing robust internal governance structures and fostering a culture of sustainability can lead to differentiated market recognition and reduced volatility.
For investors, aggregate ESG scores serve as a valuable signal for identifying firms with potentially higher returns and more resilient risk profiles. Integrating ESG considerations into portfolio allocation strategies within the transport and logistics sector is justified, particularly for long-term value creation. The distinct drivers of high-ESG performers suggest that investors seeking exposure to profitability and momentum factors may find unique opportunities within this segment. The observed absence of a significant leverage effect implies that high-ESG firms might offer better downside protection or less asymmetric risk in volatile markets, making them particularly attractive for risk-averse investors.
5.3. Research Contribution
This study makes several significant contributions to the literature on ESG financial materiality. It uniquely employs an integrated multi-methodology, combining panel regression, VAR, GARCH-family models, and explanatory machine learning with SHAP. This approach offers a comprehensive and multi-dimensional analysis of ESG's financial impact, moving beyond the single-method assessments common in prior research. The research specifically targets the global transport and logistics sector, an under-researched yet critical industry with distinct ESG challenges and opportunities, thereby providing highly relevant and actionable insights for this domain. A nuanced understanding of ESG returns is provided, with empirical evidence for the market's preference for aggregate ESG performance over individual pillars (RQ1), challenging simplified views of ESG integration. The study uncovers dynamic and volatility insights, including interrelationships and spillover effects between ESG portfolios and market factors (RQ2), and demonstrates that ESG performance is associated with a more resilient volatility structure (RQ3), notably the absence of a significant leverage effect, which is novel for this sector. Through explainable factor importance, leveraging SHAP, the study identifies distinct and non-linear drivers of returns for high- vs. medium-ESG performers (RQ4), linking these differences to the concept of dynamic capabilities and offering interpretability beyond traditional statistical significance. Finally, the research contributes to bridging econometrics and ML, with a comparative discussion highlighting the complementary strengths of traditional econometric models for causal inference and machine learning for uncovering complex relationships and feature importance (RQ5), promoting the integration of these paradigms in financial materiality research.
5.4. Shortcomings of the Research
Despite its comprehensive nature, this study is subject to certain limitations. The sample size of high-ESG firms is relatively small, which could limit the generalizability of specific findings of this distinct group. The analysis primarily relies on publicly available ESG scores, which, despite triangulation from multiple providers, may still carry inherent biases or data limitations. While a rolling correlation was used to proxy for multivariate volatility, a full Multivariate GARCH (MGARCH) model was not explicitly estimated due to computational complexity, which could provide more precise quantification of conditional correlations and diversification benefits. The predictive accuracy of the machine learning models for daily stock returns was modest, though their explanatory power remained high. The analysis focused on a global sample within the transport and logistics sector, and country-specific nuances or regulatory environments were not examined in detail, which could influence ESG materiality.
6. Conclusion
This multi-method analysis provides compelling evidence for the financial materiality of ESG performance within the global transport and logistics sector. Findings indicate that the market significantly values a firm's holistic ESG profile, associating higher aggregate ESG scores with superior stock returns. The dynamic analysis reveals interdependencies between ESG-sorted portfolios and market factors, while volatility modeling suggests that ESG-leading firms exhibit a more resilient risk profile, characterized by the absence of a typical leverage effect. Explanatory machine learning further highlights that the returns of high-ESG performers are driven by a more diverse set of factors, including profitability and momentum, pointing to superior dynamic capabilities. This comprehensive approach enriches the understanding of ESG's multifaceted financial implications, offering strategic guidance for corporate management and practical insights for investors seeking to integrate sustainability into their decision-making in this vital industry. ESG is not merely a compliance burden but a strategic asset capable of enhancing financial performance, building resilience, and fostering adaptive capabilities in a dynamically evolving global economy.
Author Contributions
Conceptualization, H.E.O.O.; methodology, H.E.O.O.; software, H.E.O.O.; validation, H.E.O.O.; formal analysis, H.E.O.O.; investigation, H.E.O.O.; resources, H.E.O.O.; data curation, H.E.O.O.; writing—original draft preparation, H.E.O.O.; writing—review and editing, H.E.O.O.; visualization, H.E.O.O.; supervision, H.E.O.O.; project administration, H.E.O.O.; funding acquisition, H.E.O.O.
Funding
This research received no external funding.
Data Availability Statement
The Fama-French factor data used in this study are publicly available from the Kenneth French Data Library. The firm-level financial and ESG data are subject to third-party licensing agreements and are not publicly available. The computer code used for the analysis can be made available upon reasonable request to the corresponding author.
Acknowledgments
The author extends gratitude to the faculty and staff of the Department of Economics and Business for their valuable support during the preparation of this manuscript.
Conflicts of Interest
The author declares no conflicts of interest.
Abbreviation
| AIC | AKAIKE INFORMATION CRITERION |
| BIC | Bayesian Information Criterion |
| CD | Cross-Sectional Dependence |
| CMA | Cost Minus Alpha (Fama-French Factor) |
| DCC-GARCH | Dynamic Conditional Correlation GARCH |
| DEMATEL | Decision-Making Trial and Evaluation Laboratory |
| E-Score | Environmental Score |
| ECN | Abbreviation, context specific |
| EGARCH | Exponential GARCH |
| ESG | Environmental, Social, and Governance |
| FE | Fixed Effects |
| FEVD | Forecast Error Variance Decomposition |
| FPE | Final Prediction Error |
| GARCH | Generalized Autoregressive Conditional Heteroskedasticity |
| GC | Granger Causality |
| GDP | Gross Domestic Product |
| GMM | Generalized Method of Moments |
| GRI | Global Reporting Initiative |
| GJR-GARCH | Glosten-Jagannathan-Runkle GARCH |
| HML | High Minus Low (Fama-French Factor) |
| HQIC | Hannan-Quinn Information Criterion |
| I4.0 | Industry 4.0 |
| ICT | Information and Communication Technology |
| IFRS | International Financial Reporting Standards |
| IMO | International Maritime Organization |
| IMU | Inertial Measurement Unit |
| IoT | Internet of Things |
| IRF | Impulse Response Function |
| IT | Information Technology |
| L4.0 | Logistics 4.0 |
| LASSO | Least Absolute Shrinkage and Selection Operator |
| LPI | Logistics Performance Index |
| Mkt-RF | Market Risk Factor |
| MGARCH | Multivariate GARCH |
| ML | Machine Learning |
| OLS | Ordinary Least Squares |
| RF | Risk-Free Rate |
| RMSE | Root Mean Squared Error |
| RMW | Robust Minus Weak (Fama-French Factor) |
| RQ | Research Question |
| S-Score | Social Score |
| SARIMA | Seasonal Autoregressive Integrated Moving Average |
| SC | Supply Chain |
| SDG | Sustainable Development Goal |
| SES | Socioeconomic Status |
| SHAP | SHapley Additive exPlanations |
| SMEs | Small and Medium-sized Enterprises |
| SMB | Small Minus Big (Fama-French Factor) |
| SMES | Small and Medium Enterprises |
| TOPSIS | Technique for Order of Preference by Similarity to Ideal Solution |
| TQM | Total Quality Management |
| UAV | Unmanned Aerial Vehicle |
References
- Christopher, M. Logistics & Supply Chain Management, 5th ed.; Pearson UK: London, UK, 2016. [Google Scholar]
- Yetkiner, H.; Beyzatlar, M.A. The Granger-causality between wealth and transportation: A panel data approach. Transport Policy 2020, 97, 19–25. [Google Scholar] [CrossRef]
- Zou, Y.; Xu, J.; Chen, Y. Volatility, correlation and risk spillover effect between freight rates in BCI and BPI markets: Evidence from static and dynamic GARCH-Copula and dynamic CoVaR models. PLOS ONE 2025, 20, e0315167. [Google Scholar] [CrossRef]
- Song, M.-J.; Lee, H.-Y. How to lead on carbon neutrality through sustainable development: A perspective on renewable energy, Information and Communication Technology (ICT), and logistics networks. Environ. Sci. Pollut. Res. 2023, 30, 103776–103787. [Google Scholar] [CrossRef]
- Bayat, T.; Çolarslan, K.; Shahbaz, M. How do logistics and financial ındicators contribute to carbon emissions in Turkiye? Environ. Sci. Pollut. Res. 2023, 30, 97842–97856. [Google Scholar] [CrossRef]
- Zou, X.; Sun, L.; Lan, T.; Fan, C.; Liu, S.; Zhao, H.; Qiu, J. The effects of weather factors on road traffic casualties: Analysis on provincial panel data of China from 2006 to 2021. Heliyon 2024, 10, e36788. [Google Scholar] [CrossRef]
- Russell, D.; Ruamsook, K.; Roso, V. Managing supply chain uncertainty by building flexibility in container port capacity: a logistics triad perspective and the COVID-19 case. Marit. Econ. Logist. 2022, 24, 92–113. [Google Scholar] [CrossRef]
- Charłampowicz, J.; Mańkowski, C.; Stajniak, M. The role of environmental management in European inland freight transport enterprises. J. Environ. Manage. 2025, 389, 125962. [Google Scholar] [CrossRef]
- Freeman, R. E. Strategic Management: A Stakeholder Approach; Pitman: Boston, MA, USA, 1984. [Google Scholar]
- Liu, D.; Sun, N.; Zhu, X. ESG ratings empower high-quality development of logistics enterprises through digital transformation and green innovation. Sci. Rep. 2025, 15, 22861. [Google Scholar] [CrossRef]
- Sun, X.; Kuo, Y.-H.; Xue, W.; Li, Y. Technology-driven logistics and supply chain management for societal impacts. Transp. Res. Part E Logist. Transp. Rev. 2024, 185, 103523. [Google Scholar] [CrossRef]
- Xu, C.; Li, L. The dynamic relationship among green logistics, technological innovation and green economy: Evidence from China. Heliyon 2024, 10, e26534. [Google Scholar] [CrossRef]
- Shafique, M.; Azam, A.; Rafiq, M.; Luo, X. Investigating the nexus among transport, economic growth and environmental degradation: Evidence from panel ARDL approach. Transport Policy 2021, 109, 61–71. [Google Scholar] [CrossRef]
- Zheng, Q.Y.; Law, T.H.; Wong, S.V.; Ng, C.P. Relative improvements between roads and railways and economic performance: A panel data analysis. Transport Policy 2024, 153, 87–96. [Google Scholar] [CrossRef]
- Yan, B.; Dong, Q.; Li, Q.; Yang, L.; Amin, F.U.I. A study on the interaction between logistics industry and manufacturing industry from the perspective of integration field. PLOS ONE 2022, 17, e0264585. [Google Scholar] [CrossRef]
- Saidi, S.; Mani, V.; Mefteh, H.; Shahbaz, M.; Akhtar, P. Dynamic linkages between transport, logistics, foreign direct Investment, and economic growth: Empirical evidence from developing countries. Transp. Res. Part A Policy Pract. 2020, 141, 277–293. [Google Scholar] [CrossRef]
- Tetteh, F.K.; Kwateng, K.O.; Mensah, J. Green logistics practices: A bibliometric and systematic methodological review and future research opportunities. J. Clean. Prod. 2024, 476, 143735. [Google Scholar] [CrossRef]
- DiMaggio, P. J.; Powell, W. W. The Iron Cage Revisited: Institutional Isomorphism and Collective Rationality in Organizational Fields. Am. Sociol. Rev. 1983, 48, 147–160. [Google Scholar]
- Wu, Q.; Madni, G.R. Environmental protection in selected one belt one road economies through institutional quality: Prospering transportation and industrialization. PLOS ONE 2021, 16, e0240851. [Google Scholar] [CrossRef]
- Sikder, M.; Wang, C.; Rahman, M.M.; Yeboah, F.K.; Alola, A.A.; Wood, J. Green logistics and circular economy in alleviating CO2 emissions: Does waste generation and GDP growth matter in EU countries? J. Clean. Prod. 2024, 449, 141708. [Google Scholar] [CrossRef]
- Pettit, T. J.; Fiksel, J.; Croxton, K. L. Ensuring supply chain resilience: development of a conceptual framework. J. Bus. Logist. 2010, 31, 1–21. [Google Scholar]
- Naz, F.; Kumar, A.; Majumdar, A.; Agrawal, R. Is artificial intelligence an enabler of supply chain resiliency post COVID-19? An exploratory state-of-the-art review for future research. Oper. Manag. Res. 2022, 15, 378–398. [Google Scholar] [CrossRef]
- Teece, D. J.; Pisano, G.; Shuen, A. Dynamic capabilities and strategic management. Strateg. Manag. J. 1997, 18, 509–533. [Google Scholar]
- Yu, L.; Xu, J.; Yuan, X. Sustainable Digital Shifts in Chinese Transport and Logistics: Exploring Green Innovations and Their ESG Implications. Sustainability 2024, 16, 1877. [Google Scholar] [CrossRef]
- Wang, Y.; Sarkis, J. Emerging digitalisation technologies in freight transport and logistics: Current trends and future directions. Transp. Res. Part E Logist. Transp. Rev. 2021, 148, 102291. [Google Scholar] [CrossRef]
- Sahoo, S.; Kumar, S.; Sivarajah, U.; Lim, W.M.; Westland, J.C.; Kumar, A. Blockchain for sustainable supply chain management: trends and ways forward. Electron. Commer. Res. 2024, 24, 1563–1618. [Google Scholar] [CrossRef]
- Lopes, L.S.; Nabais, J.L.; Pinto, C.; Caldeirinha, V.; Pinho, T. Essential Competencies in Maritime and Port Logistics: A Study on the Current Needs of the Sector. Sustainability 2025, 17, 2378. [Google Scholar] [CrossRef]
- Qureshi, K.M.; Mewada, B.G.; Kaur, S.; Khan, A.; Al-Qahtani, M.M.; Qureshi, M.R.N.M. Investigating industry 4. 0 technologies in logistics 4.0 usage towards sustainable manufacturing supply chain. Heliyon 2024, 10, e30661. [Google Scholar] [CrossRef]
- Oleinik, O.; Vorobyova, S.; Vorobyov, K.; Nikulov, T.; Holovashch, O. AUTOMATION AND DIGITALIZATION OF LOGISTIC CLUSTERS IN INTERNATIONAL TRANSPORTATION OF FOOD INDUSTRY PRODUCTS. City Development 2025, 97–106. [Google Scholar] [CrossRef]
- Zhou, C.; Zhu, S.; Bell, M.G.H.; Lee, L.H.; Chew, E.P. Emerging technology and management research in the container terminals: Trends and the COVID-19 pandemic impacts. Ocean Coast. Manag. 2022, 230, 106318. [Google Scholar] [CrossRef]
- Plomaritou, E.; Jeropoulos, S. The digitalisation in chartering business: special reference to the role of e-bill of lading in the bulk and liner markets. J. Shipp. Trade 2022, 7, 28. [Google Scholar] [CrossRef]
- Heinbach, C.; Beinke, J.; Kammler, F.; Thomas, O. Data-driven forwarding: a typology of digital platforms for road freight transport management. Electron. Mark. 2022, 32, 807–828. [Google Scholar] [CrossRef]
- Zhao, L.; He, Z. Using machine learning to analyze the factors influencing city-level transportation carbon emissions. Energy 2025, 333, 137355. [Google Scholar] [CrossRef]
- Yin, Y.; Wang, H.; Deng, X. Real-time logistics transport emission monitoring-Integrating artificial intelligence and internet of things. Transp. Res. Part D Transp. Environ. 2024, 136, 104426. [Google Scholar] [CrossRef]
- Nguyen, S.; Gadel, M.; Wang, K.; Li, J.; Zhang, X.; Kong, S.-C.; Fu, X.; Qin, Z. Maritime decarbonization through machine learning: A critical systematic review of fuel and power prediction models. Clean. Logist. Supply Chain 2025, 14, 100210. [Google Scholar] [CrossRef]
- Liu, H.-T.; Hu, D.-W. [Construction and Analysis of Machine Learning Based Transportation Carbon Emission Prediction Model]. Huan jing ke xue= Huanjing kexue 2024, 45, 3421–3432. [Google Scholar] [CrossRef]
- Wang, W.; Wang, J. Determinants investigation and peak prediction of CO2 emissions in China’s transport sector utilizing bio-inspired extreme learning machine. Environ. Sci. Pollut. Res. 2021, 28, 55535–55553. [Google Scholar] [CrossRef]
- Tran-Dang, H.; Kim, J.-W.; Lee, J.-M.; Kim, D.-S. Shaping the Future of Logistics: Data-driven Technology Approaches and Strategic Management. IETE Tech. Rev. 2025, 42, 44–79. [Google Scholar] [CrossRef]
- Sbihi, A.; Eglese, R. W. Combinatorial optimization and green logistics. Ann. Oper. Res. 2010, 175, 159–175. [Google Scholar]
- Habib, Y.; Xia, E.; Hashmi, S.H.; Yousaf, A.U. Testing the heterogeneous effect of air transport intensity on CO2 emissions in G20 countries: An advanced empirical analysis. Environ. Sci. Pollut. Res. 2022, 29, 44020–44041. [Google Scholar] [CrossRef]
- Habib, Y.; Xia, E.; Hashmi, S.H.; Ahmed, Z. The nexus between road transport intensity and road-related CO2 emissions in G20 countries: an advanced panel estimation. Environ. Sci. Pollut. Res. 2021, 28, 58405–58425. [Google Scholar] [CrossRef]
- Karlilar Pata, S.; Erdogan, S.; Pata, U.K.; Meo, M.S. Greening road transport: Comparison of technologies in conventional, hybrid, and electric vehicles. J. Environ. Manage. 2025, 380, 124908. [Google Scholar] [CrossRef]
- Dai, J.; Alvarado, R.; Ali, S.; Ahmed, Z.; Meo, M.S. Transport infrastructure, economic growth, and transport CO2 emissions nexus: Does green energy consumption in the transport sector matter? Environ. Sci. Pollut. Res. 2023, 30, 40094–40106. [Google Scholar] [CrossRef]
- Tetteh, F.K.; Kwateng, K.O.; Mensah, J. Green logistics practices: A bibliometric and systematic methodological review and future research opportunities. J. Clean. Prod. 2024, 476, 143735. [Google Scholar] [CrossRef]
- Chatti, W. Moving towards environmental sustainability: information and communication technology (ICT), freight transport, and CO2 emissions. Heliyon 2021, 7, e08190. [Google Scholar] [CrossRef]
- Friede, G.; Busch, T.; Bassen, A. ESG and financial performance: aggregated evidence from more than 2000 empirical studies. J. Sustain. Financ. Invest. 2015, 5, 210–233. [Google Scholar]
- Gillan, S. L.; Koch, A.; Starks, L. T. Firms and social responsibility: A review of ESG and CSR research in corporate finance. J. Corp. Financ. 2021, 66, 101889. [Google Scholar]
- Apruzzese, M.; Bruni, M.E.; Musso, S.; Perboli, G. 5G and Companion Technologies as a Boost in New Business Models for Logistics and Supply Chain. Sustainability 2023, 15, 11846. [Google Scholar] [CrossRef]
- Baeza, V.M.; Ortiz, F.; Garcia, S.H.; Lagunas, E. Enhanced Communications on Satellite-Based IoT Systems to Support Maritime Transportation Services. Sensors 2022, 22, 6450. [Google Scholar] [CrossRef]
- Burgos, D.; Ivanov, D. Food retail supply chain resilience and the COVID-19 pandemic: A digital twin-based impact analysis and improvement directions. Transp. Res. Part E Logist. Transp. Rev. 2021, 152, 102412. [Google Scholar] [CrossRef]
- Tsolakis, N.; Schumacher, R.; Dora, M.; Kumar, M. Artificial intelligence and blockchain implementation in supply chains: a pathway to sustainability and data monetisation? Ann. Oper. Res. 2023, 327, 157–210. [Google Scholar] [CrossRef]
- Park, A.; Li, H. The Effect of Blockchain Technology on Supply Chain Sustainability Performances. Sustainability 2021, 13, 1726. [Google Scholar] [CrossRef]
- Zhou, Y.; Soh, Y.S.; Loh, H.S.; Yuen, K.F. The key challenges and critical success factors of blockchain implementation: Policy implications for Singapore’s maritime industry. Mar. Policy 2020, 122, 104265. [Google Scholar] [CrossRef]
- Park, S.; Kwon, J.; Kim, H.; Ryu, H.; Kim, T. Effect of macroeconomic shocks on the shipping market: Focusing on COVID-19 pandemic. Asian J. Shipp. Logist. 2024, 40, 89–102. [Google Scholar] [CrossRef]
- Gideon, E.M.; Pisa, N.N.; Chakamera, C. Determinants of outbound logistics performance in selected Sub-Saharan Africa countries: a panel data analysis. Int. Bus. Logist. 2024, 4, 44–60. [Google Scholar]
- Ding, X.; Wang, M. Container Freight Rates and International Trade Causality Nexus: Evidence from Panel VAR Approach for Shanghai and ASEAN_6 Countries. Discrete Dyn. Nat. Soc. 2022, 2022, 2415914. [Google Scholar] [CrossRef]
- Dong, S.; Khattak, A.; Ullah, I.; Zhou, J.; Hussain, A. Predicting and Analyzing Road Traffic Injury Severity Using Boosting-Based Ensemble Learning Models with SHAPley Additive exPlanations. Int. J. Environ. Res. Public Health 2022, 19, 2925. [Google Scholar] [CrossRef]
- Li, X.; Shi, L.; Shi, Y.; Tang, J. ; Exploring interactive and nonlinear effects of key factors on intercity travel mode choice using XGBoost. Appl. Geogr. 2024, 166, 103264. [Google Scholar] [CrossRef]
- Sariyer, G.; Mangla, S.K.; Sozen, M.E.; Li, G.; Kazancoglu, Y. Leveraging explainable artificial intelligence in understanding public transportation usage rates for sustainable development. Omega 2024, 127, 103105. [Google Scholar] [CrossRef]
- Fama, E. F.; French, K. R. A five-factor asset pricing model. J. Financ. Econ. 2015, 116, 1–22. [Google Scholar]
- Onomakpo, H. E. O. ESG Risk Ratings and Stock Performance in Electric Vehicle Manufacturing: A Panel Regression Analysis Using the Fama-French Five-Factor Model. J Invest Bank Finance 2025, 3(1), 01–13. [Google Scholar] [CrossRef]
Figure 1.
WordCloud showing the most important terms.
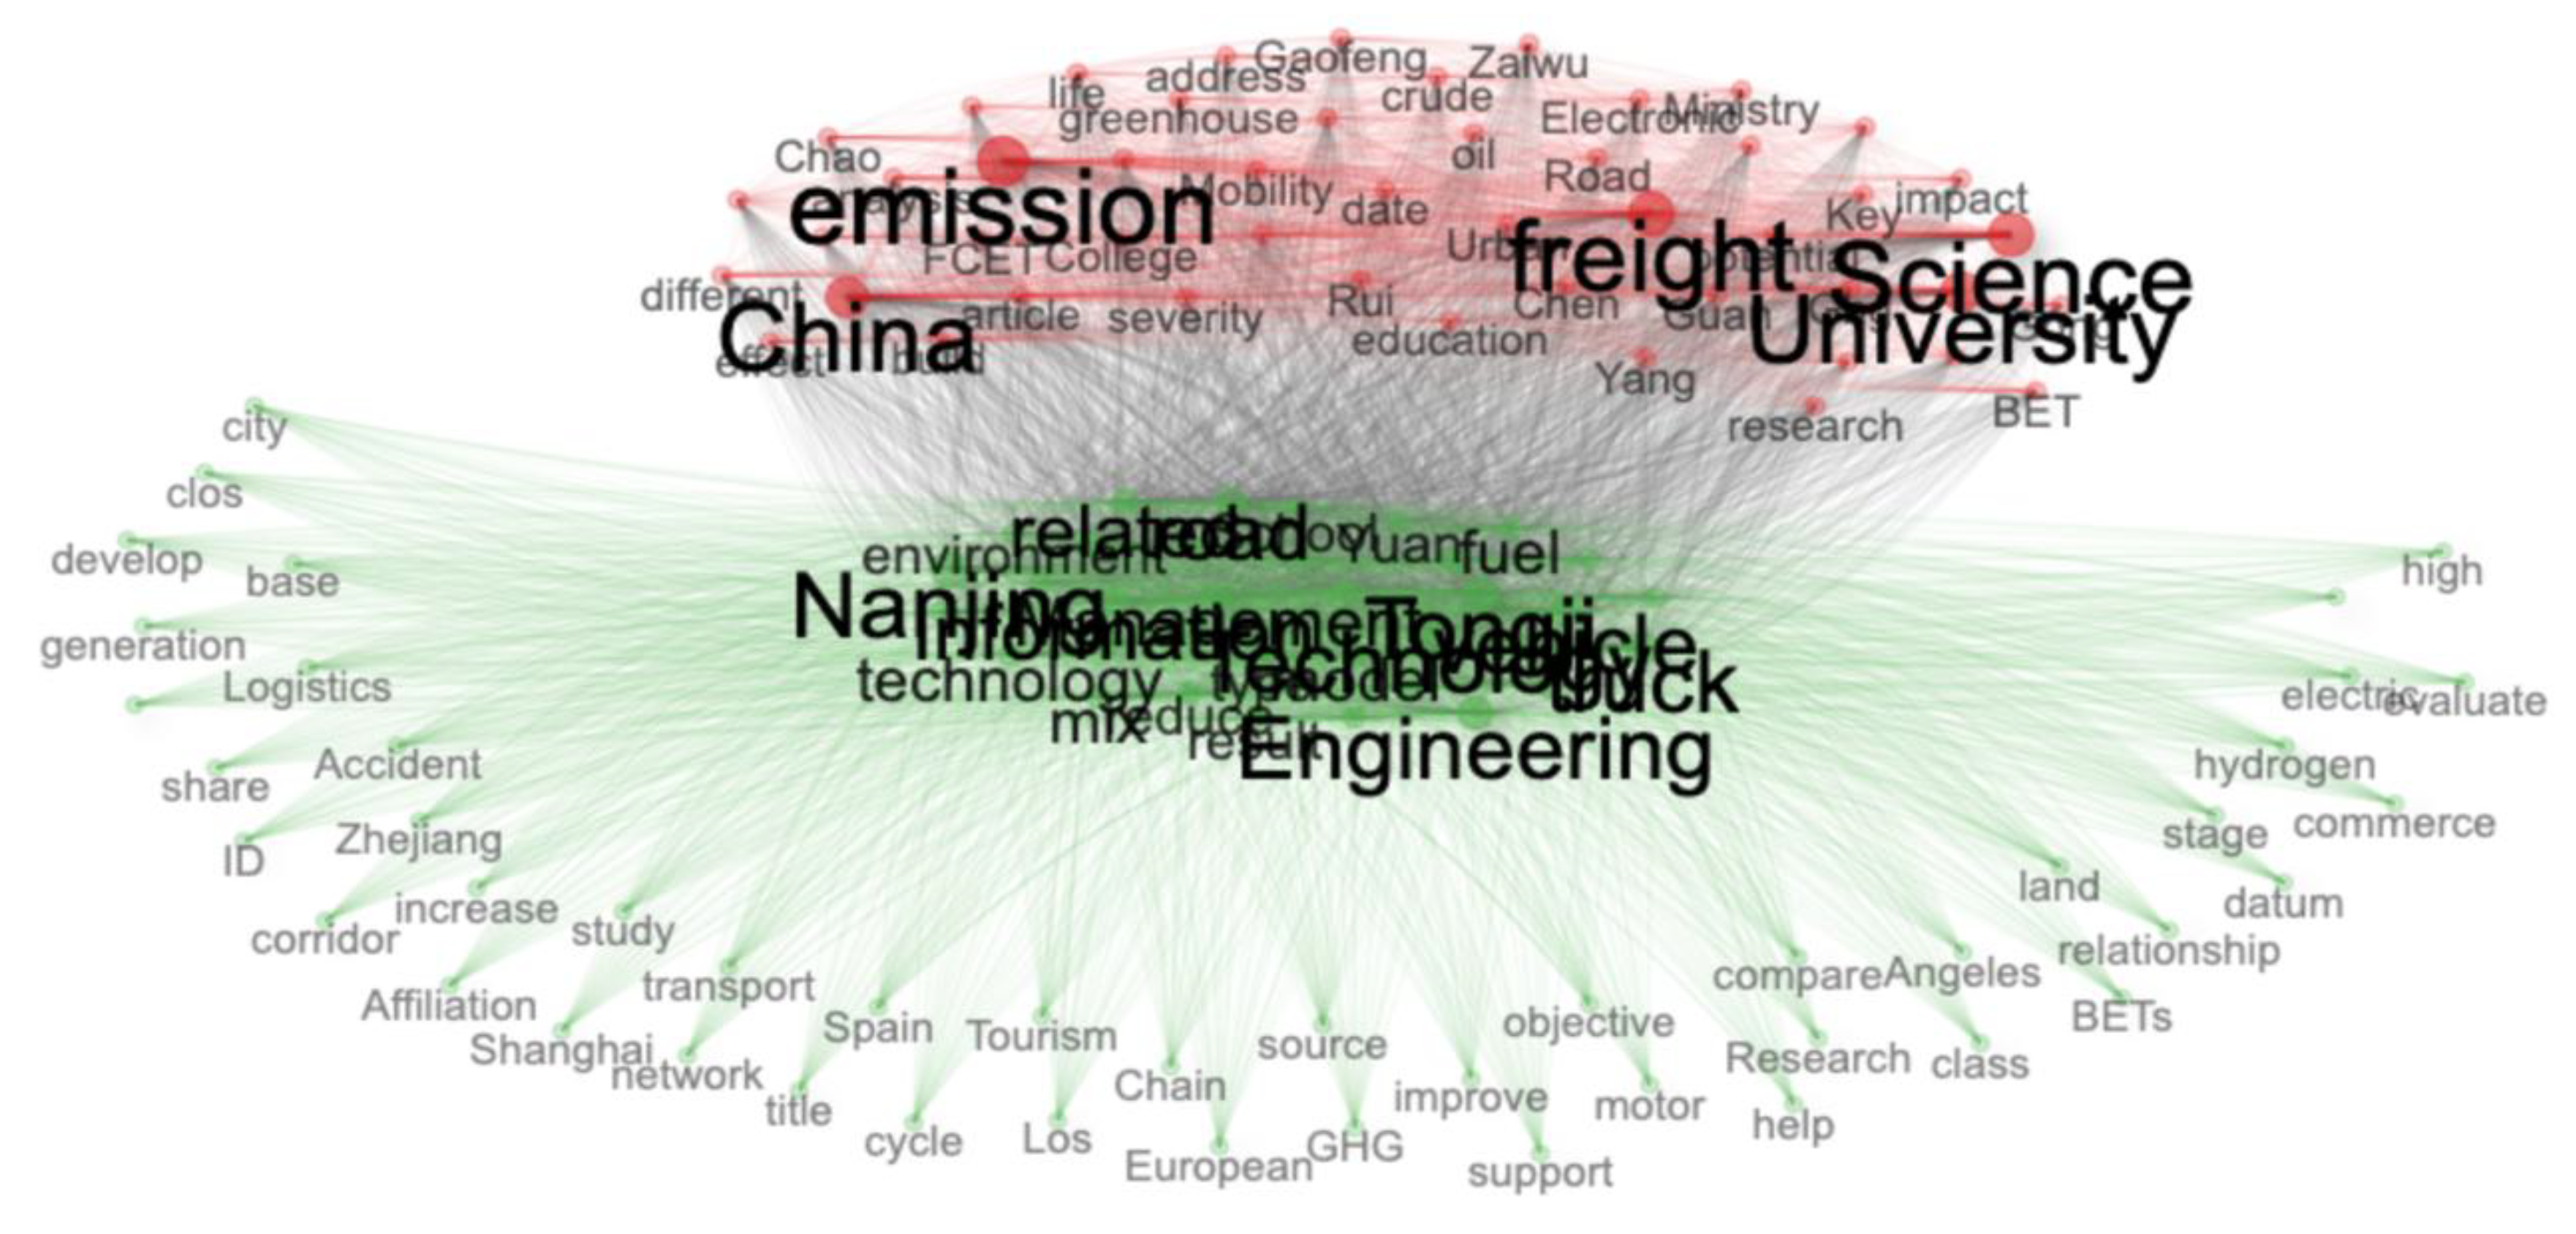
Figure 2.
Sample cross-correlation heatmap.
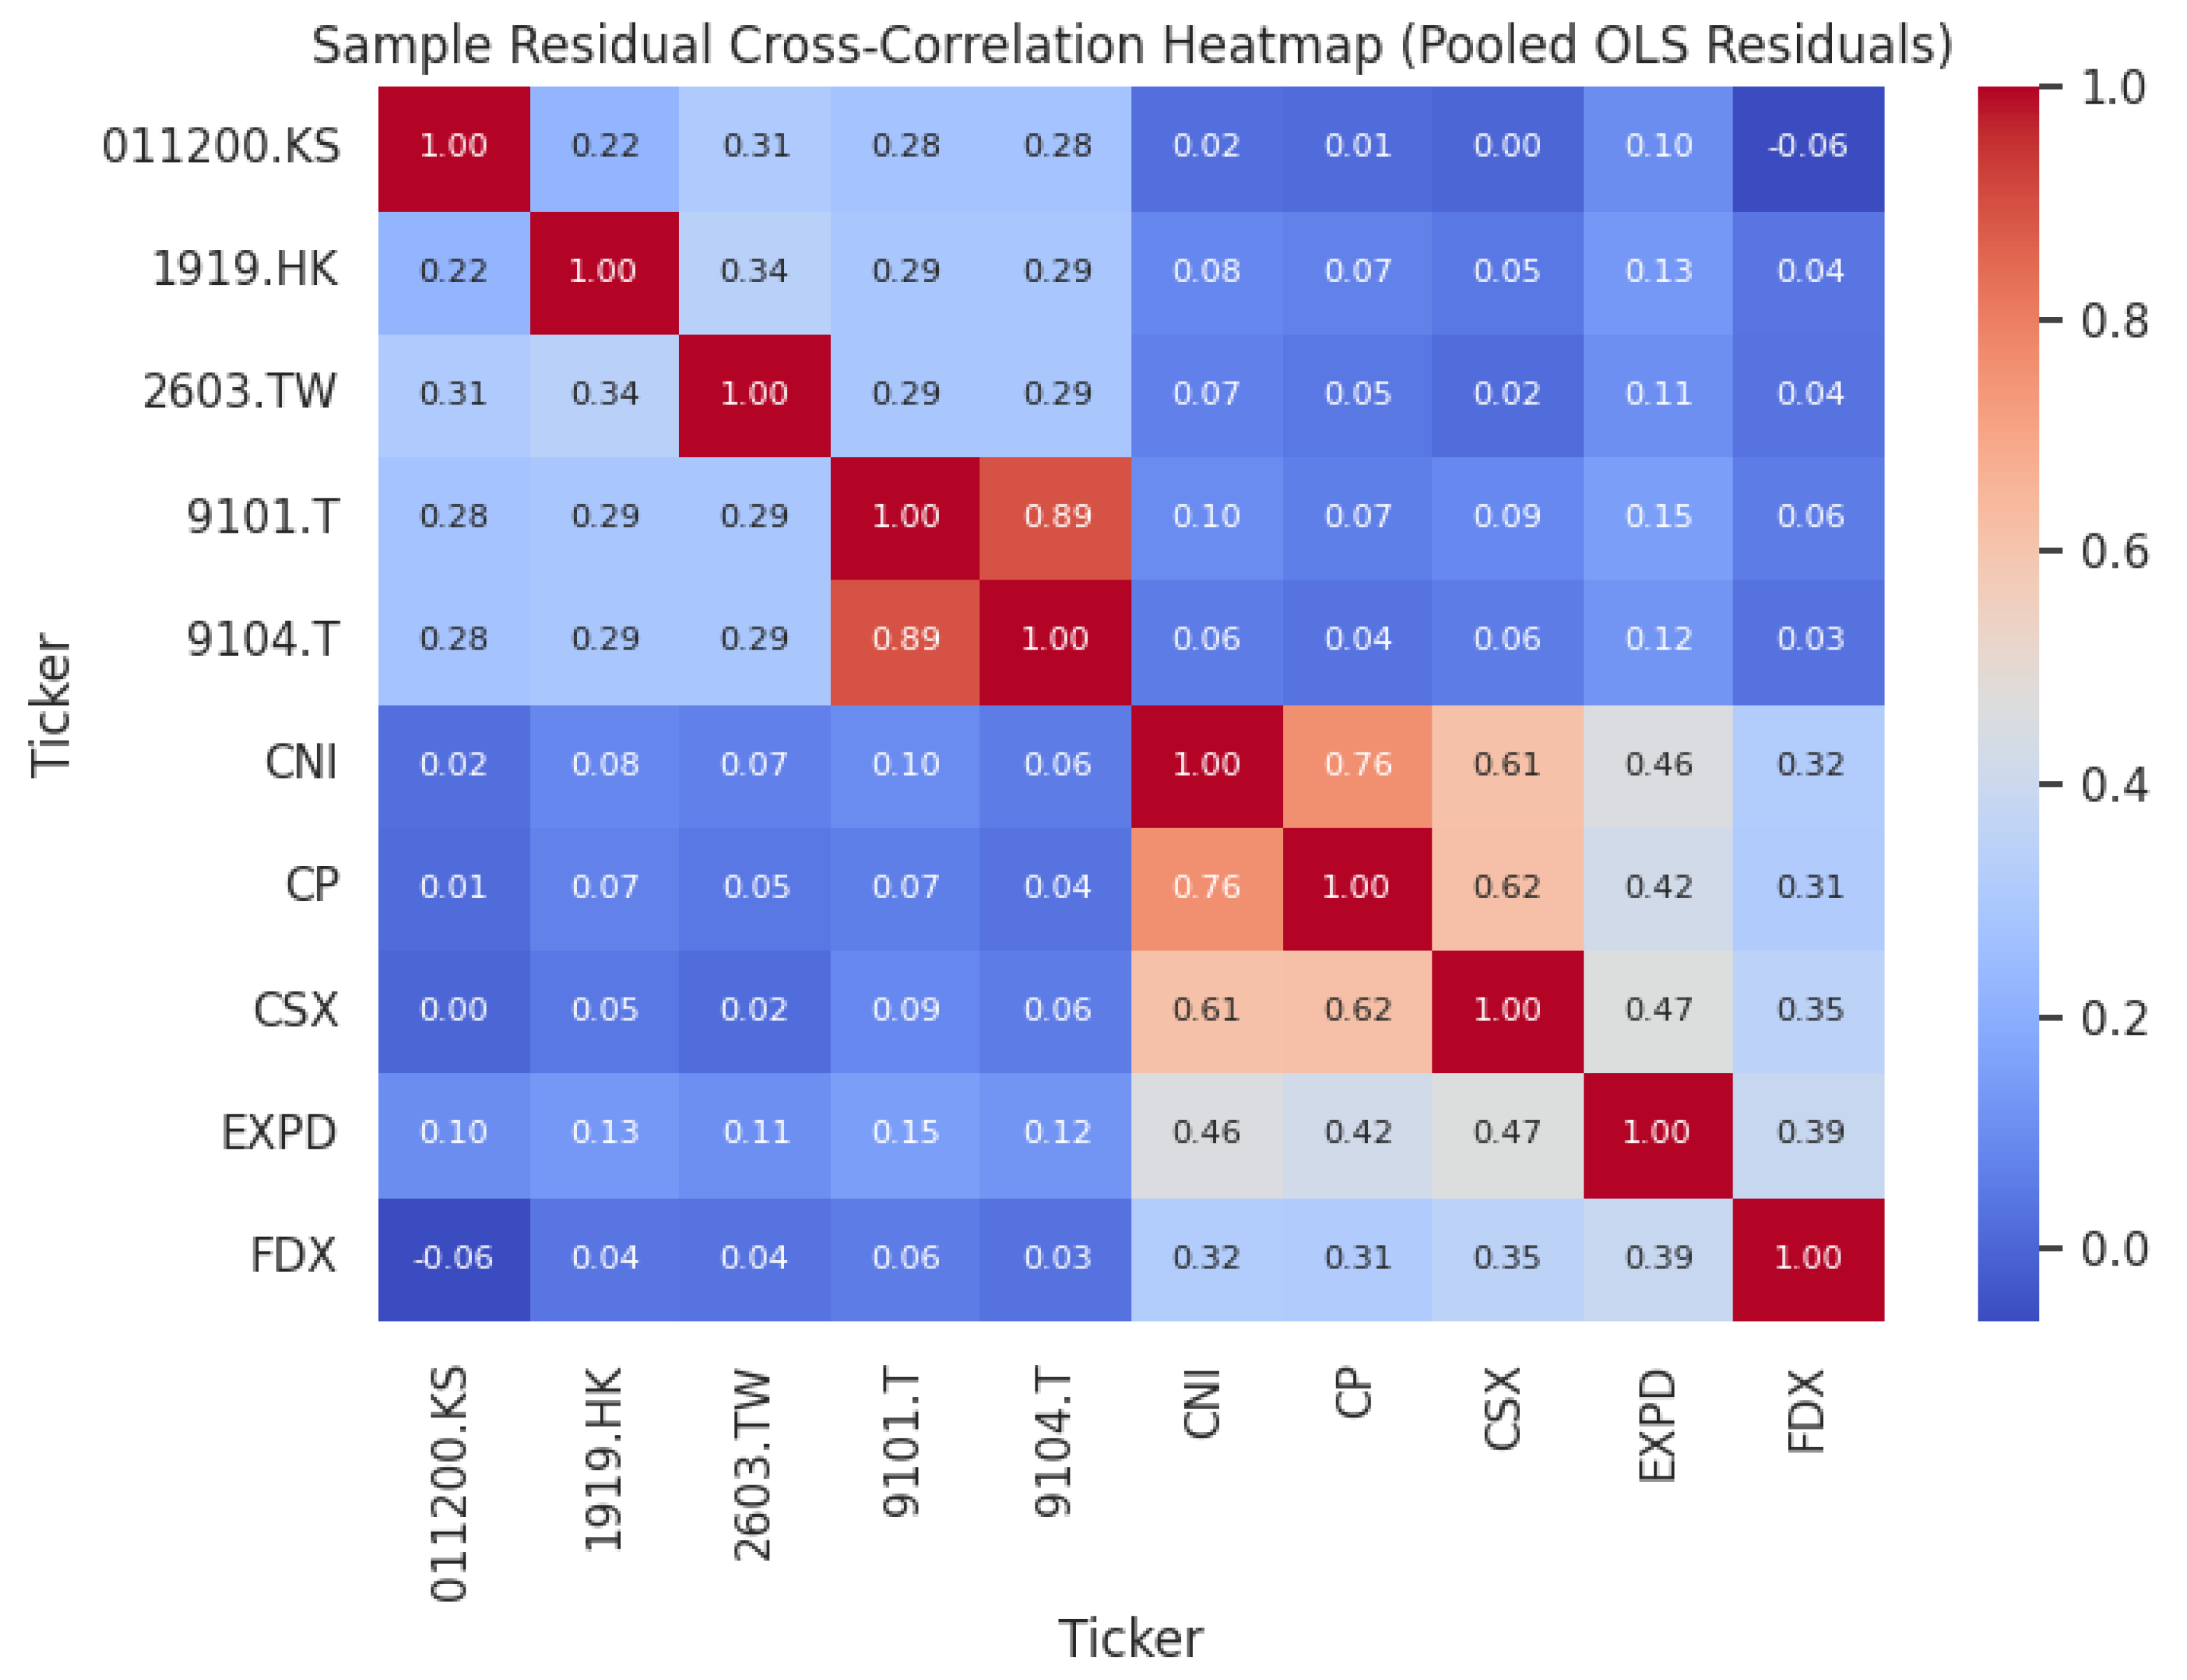
Figure 3.
IRF for Medium-ESG Portfolio to Mkt-RF Shock.
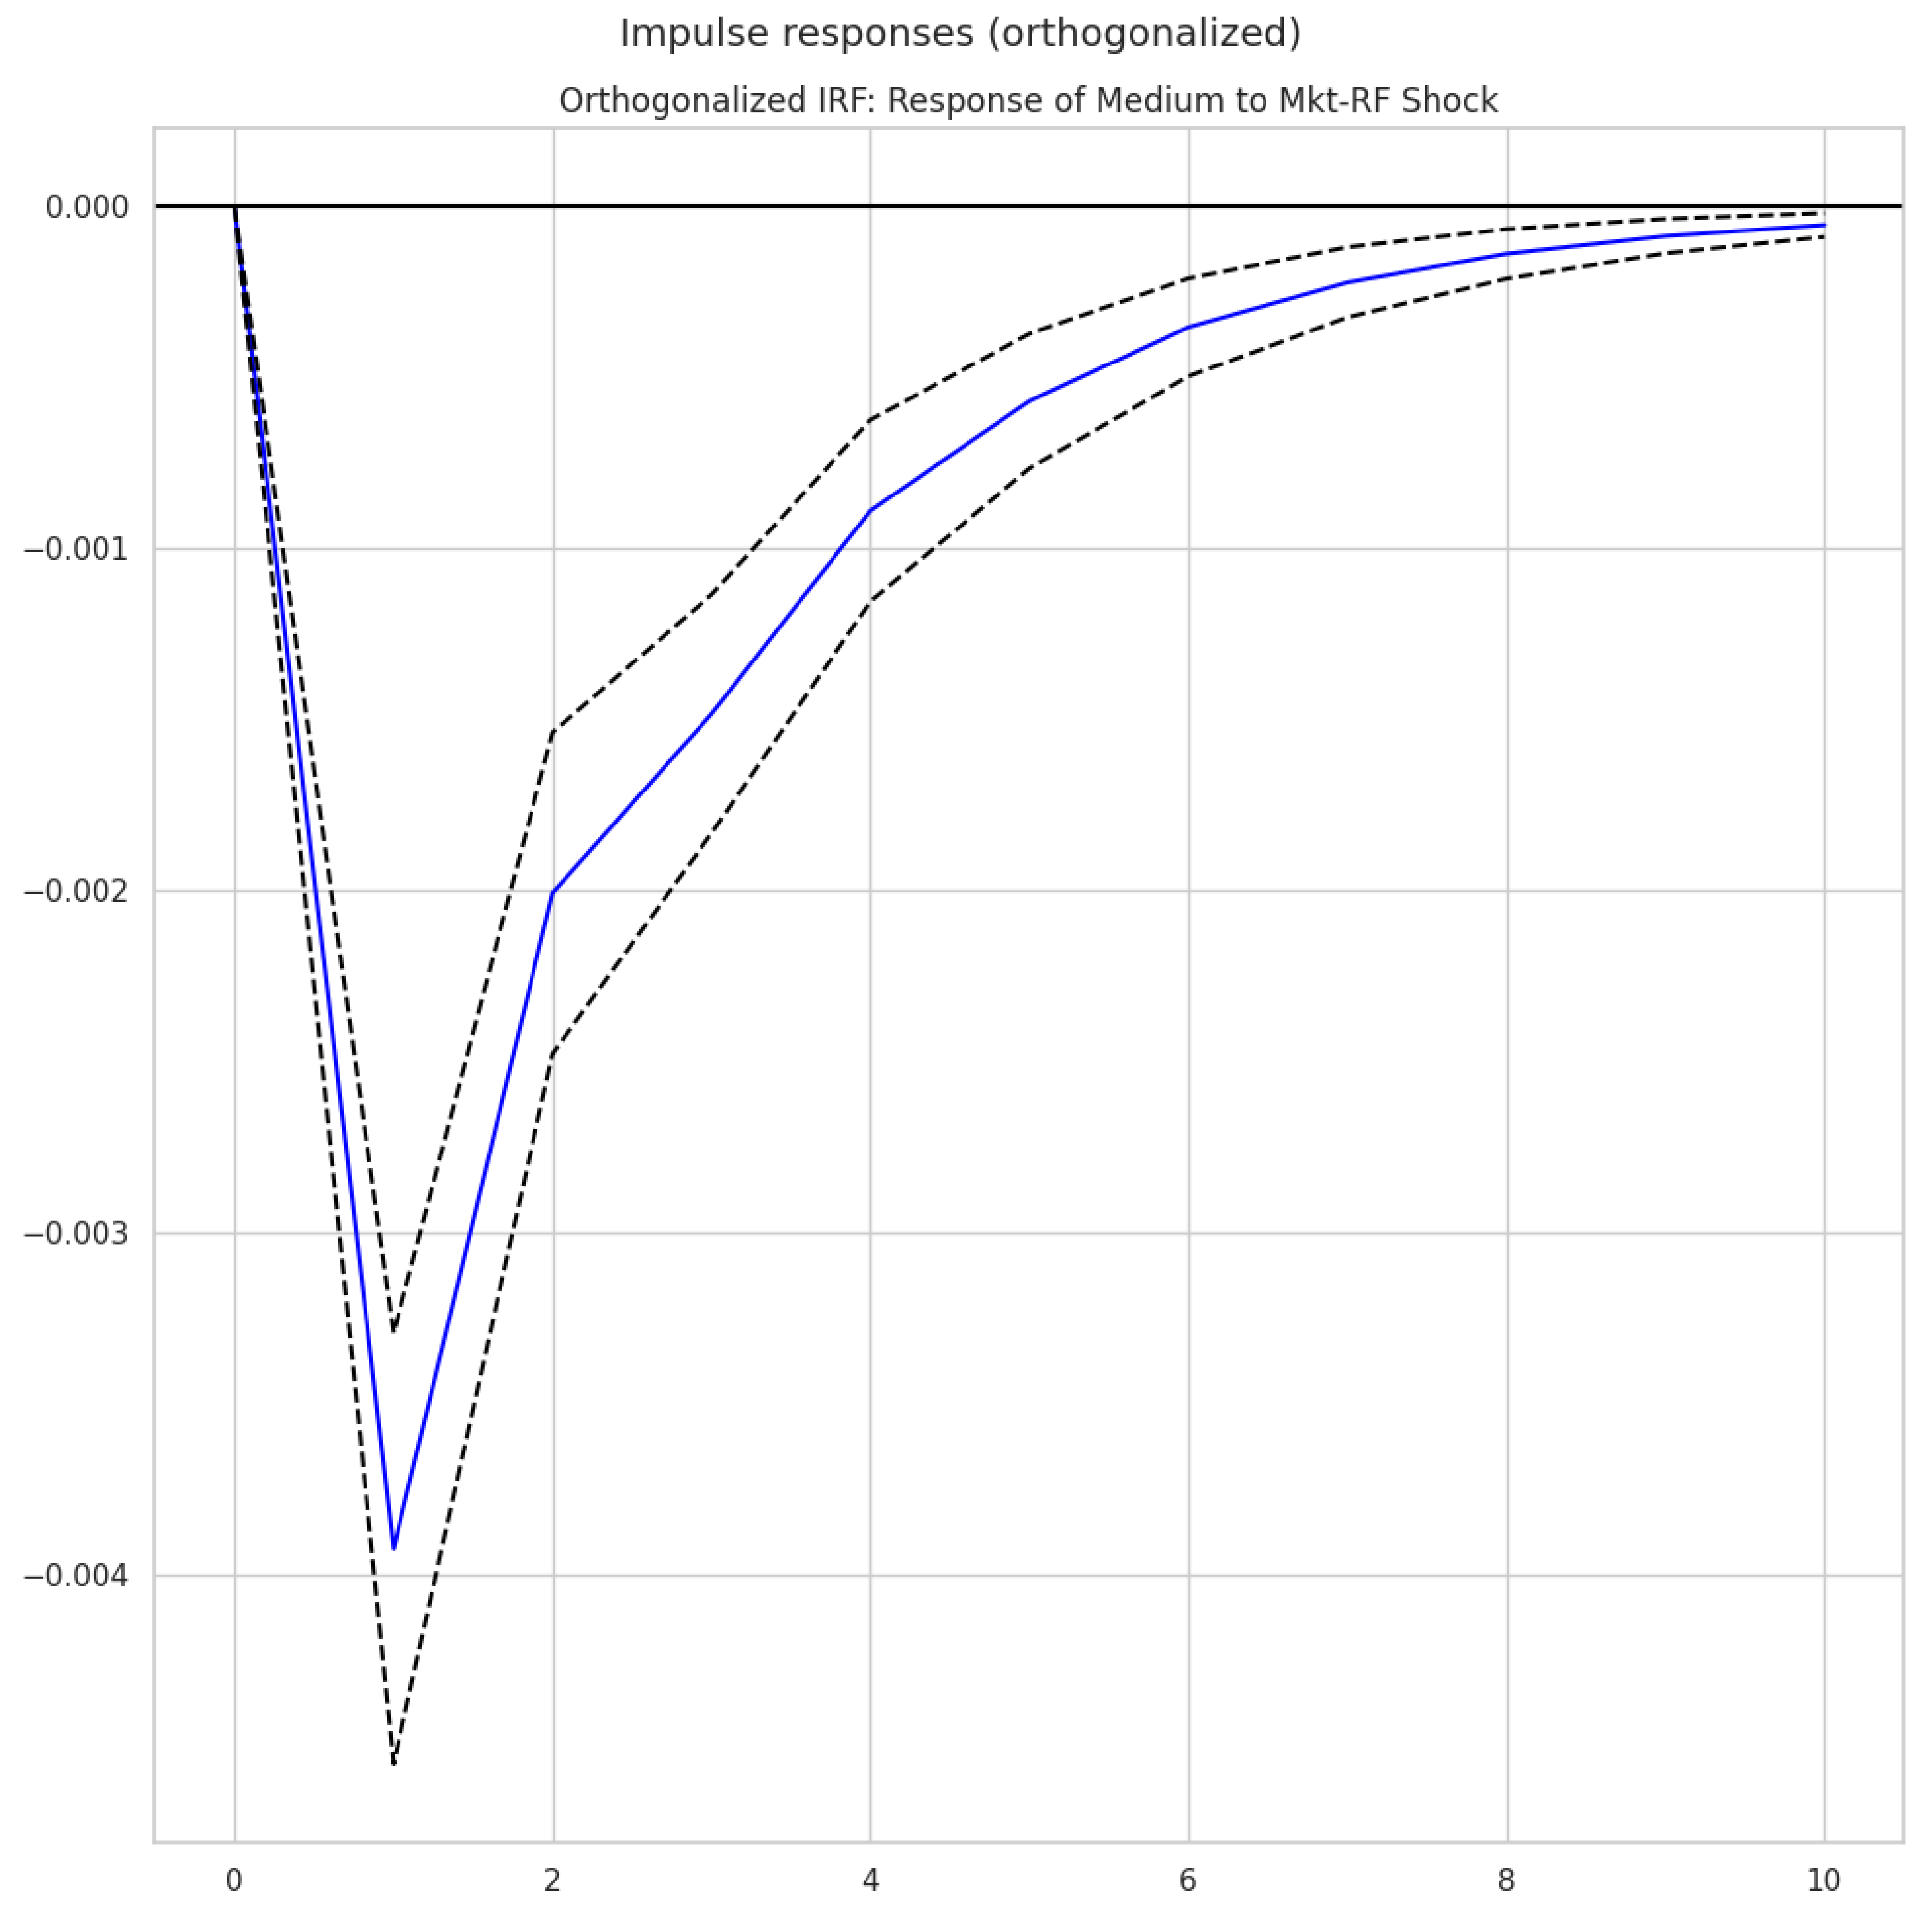
Figure 4.
IRF for High-ESG Portfolio to Mkt-RF Shock.
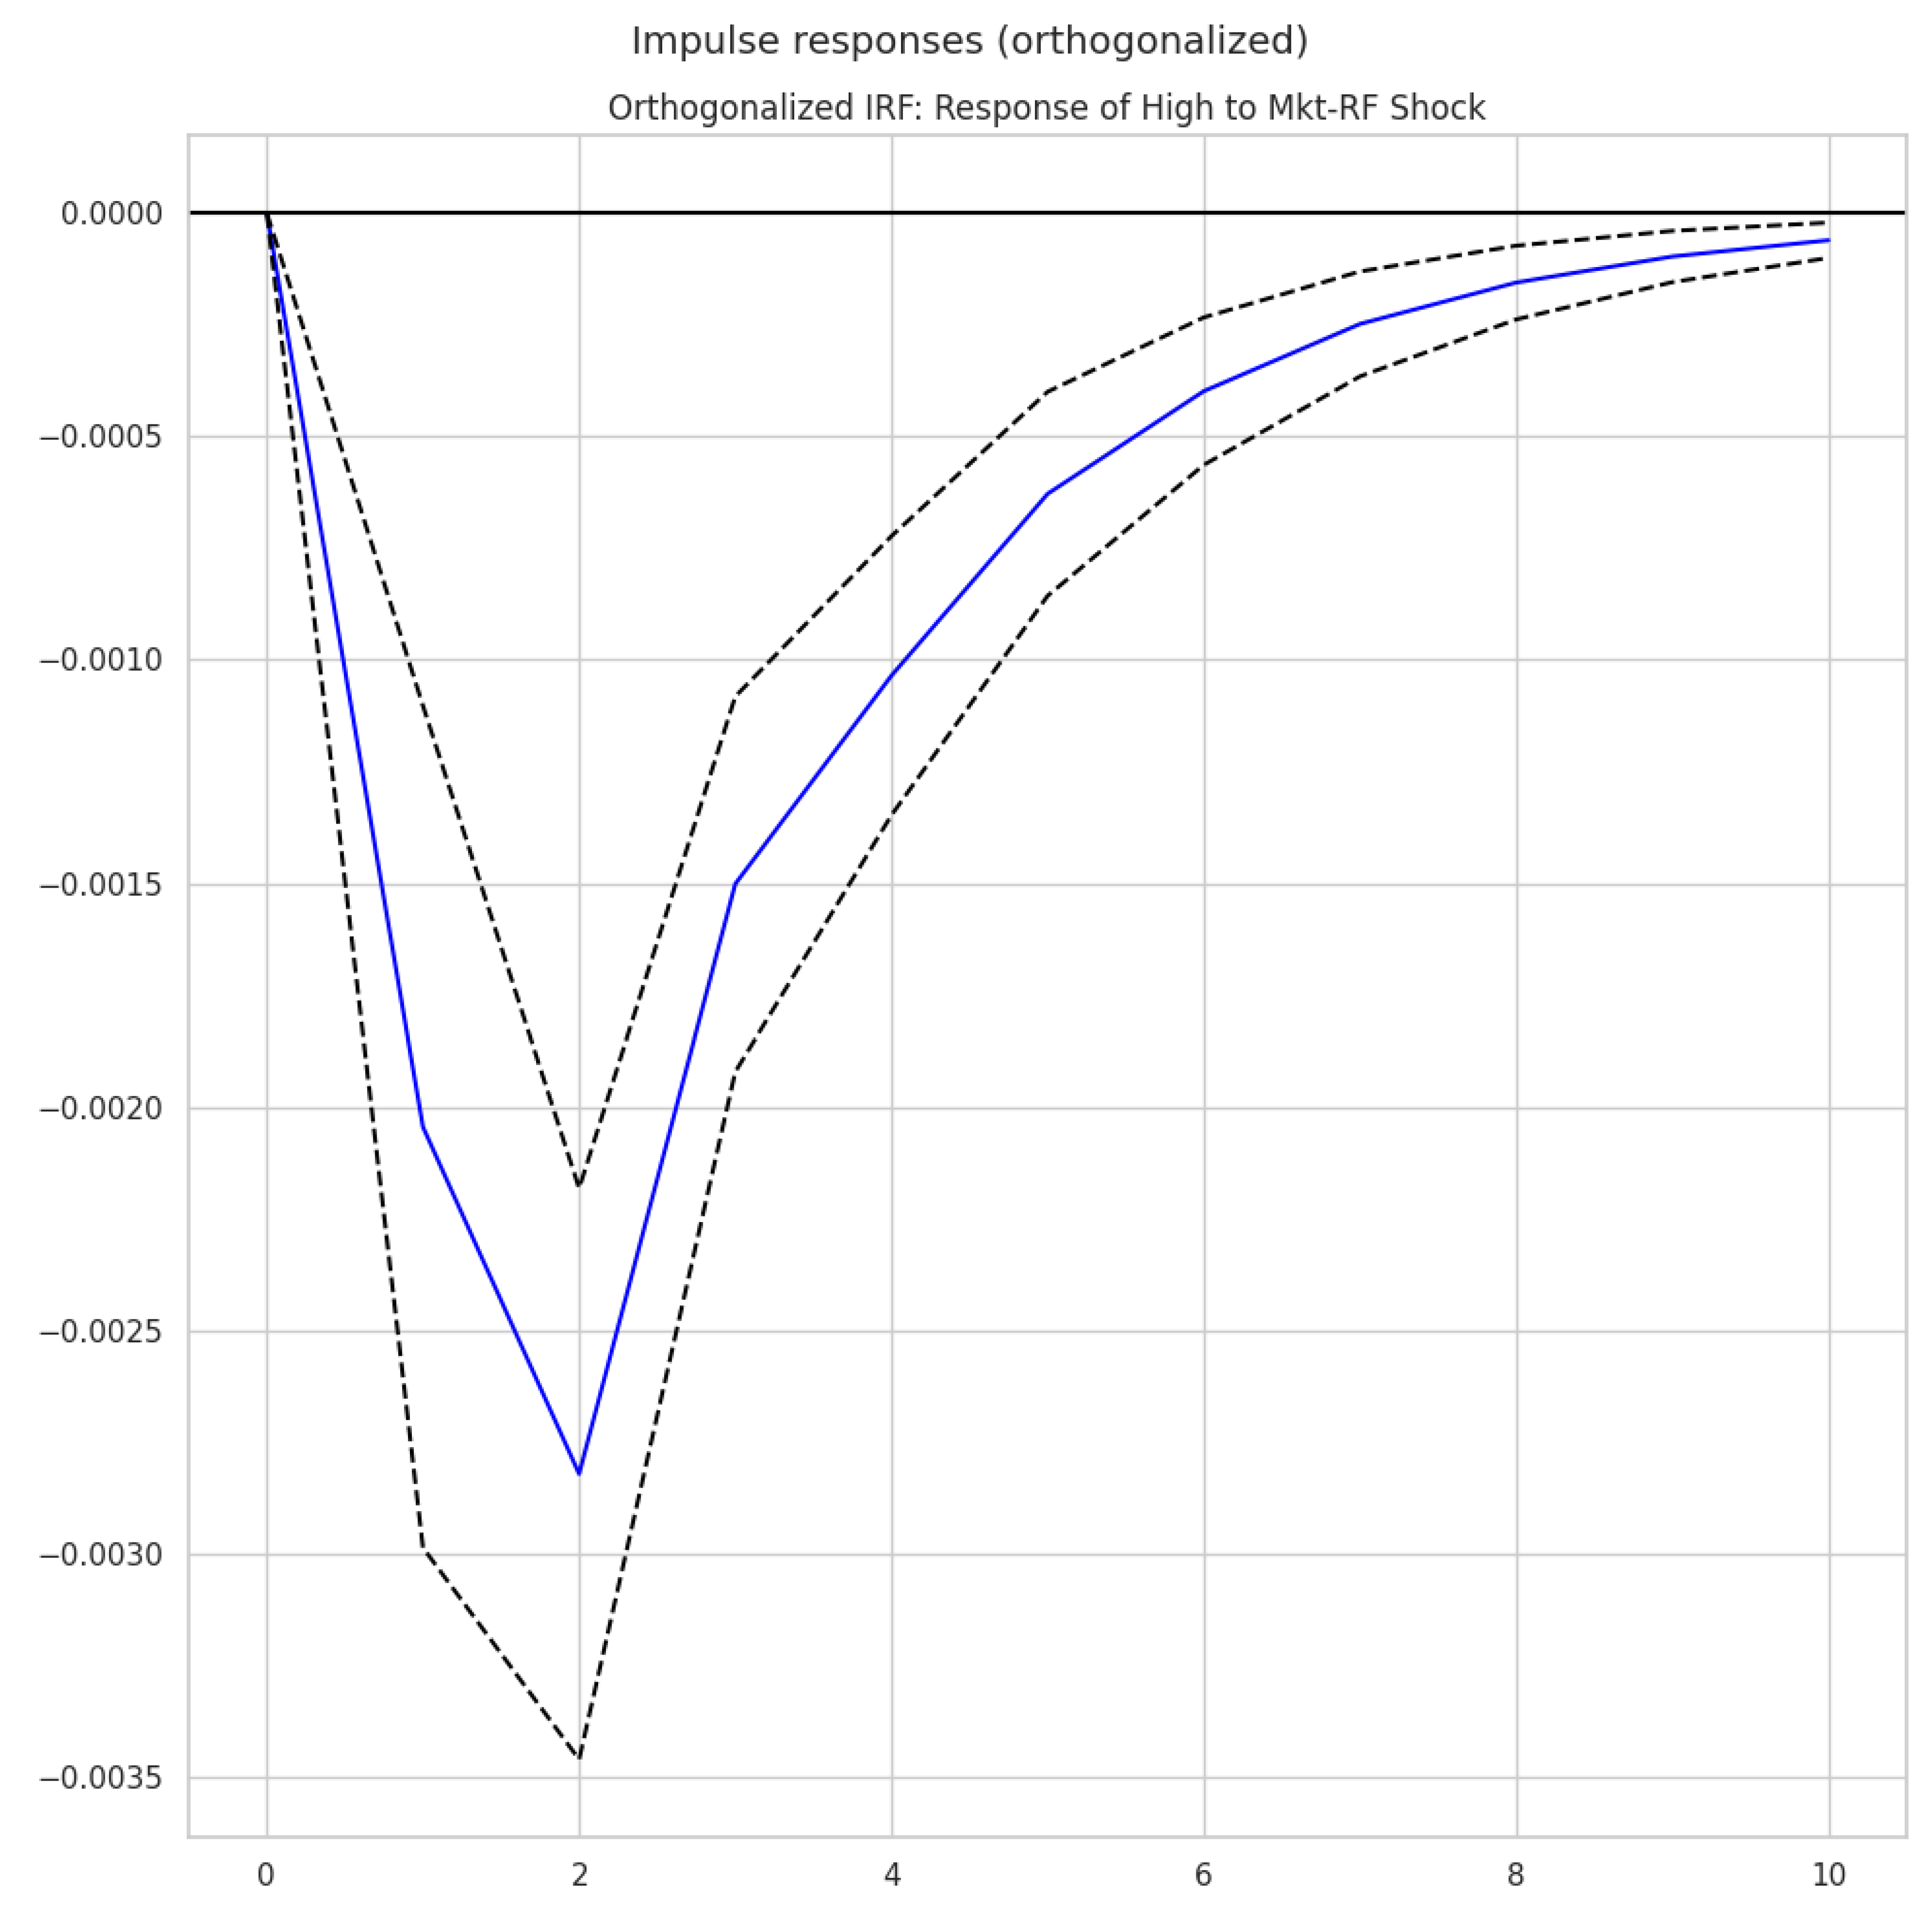
Figure 5.
Impact of High-ESG Portfolio shock on other factors.
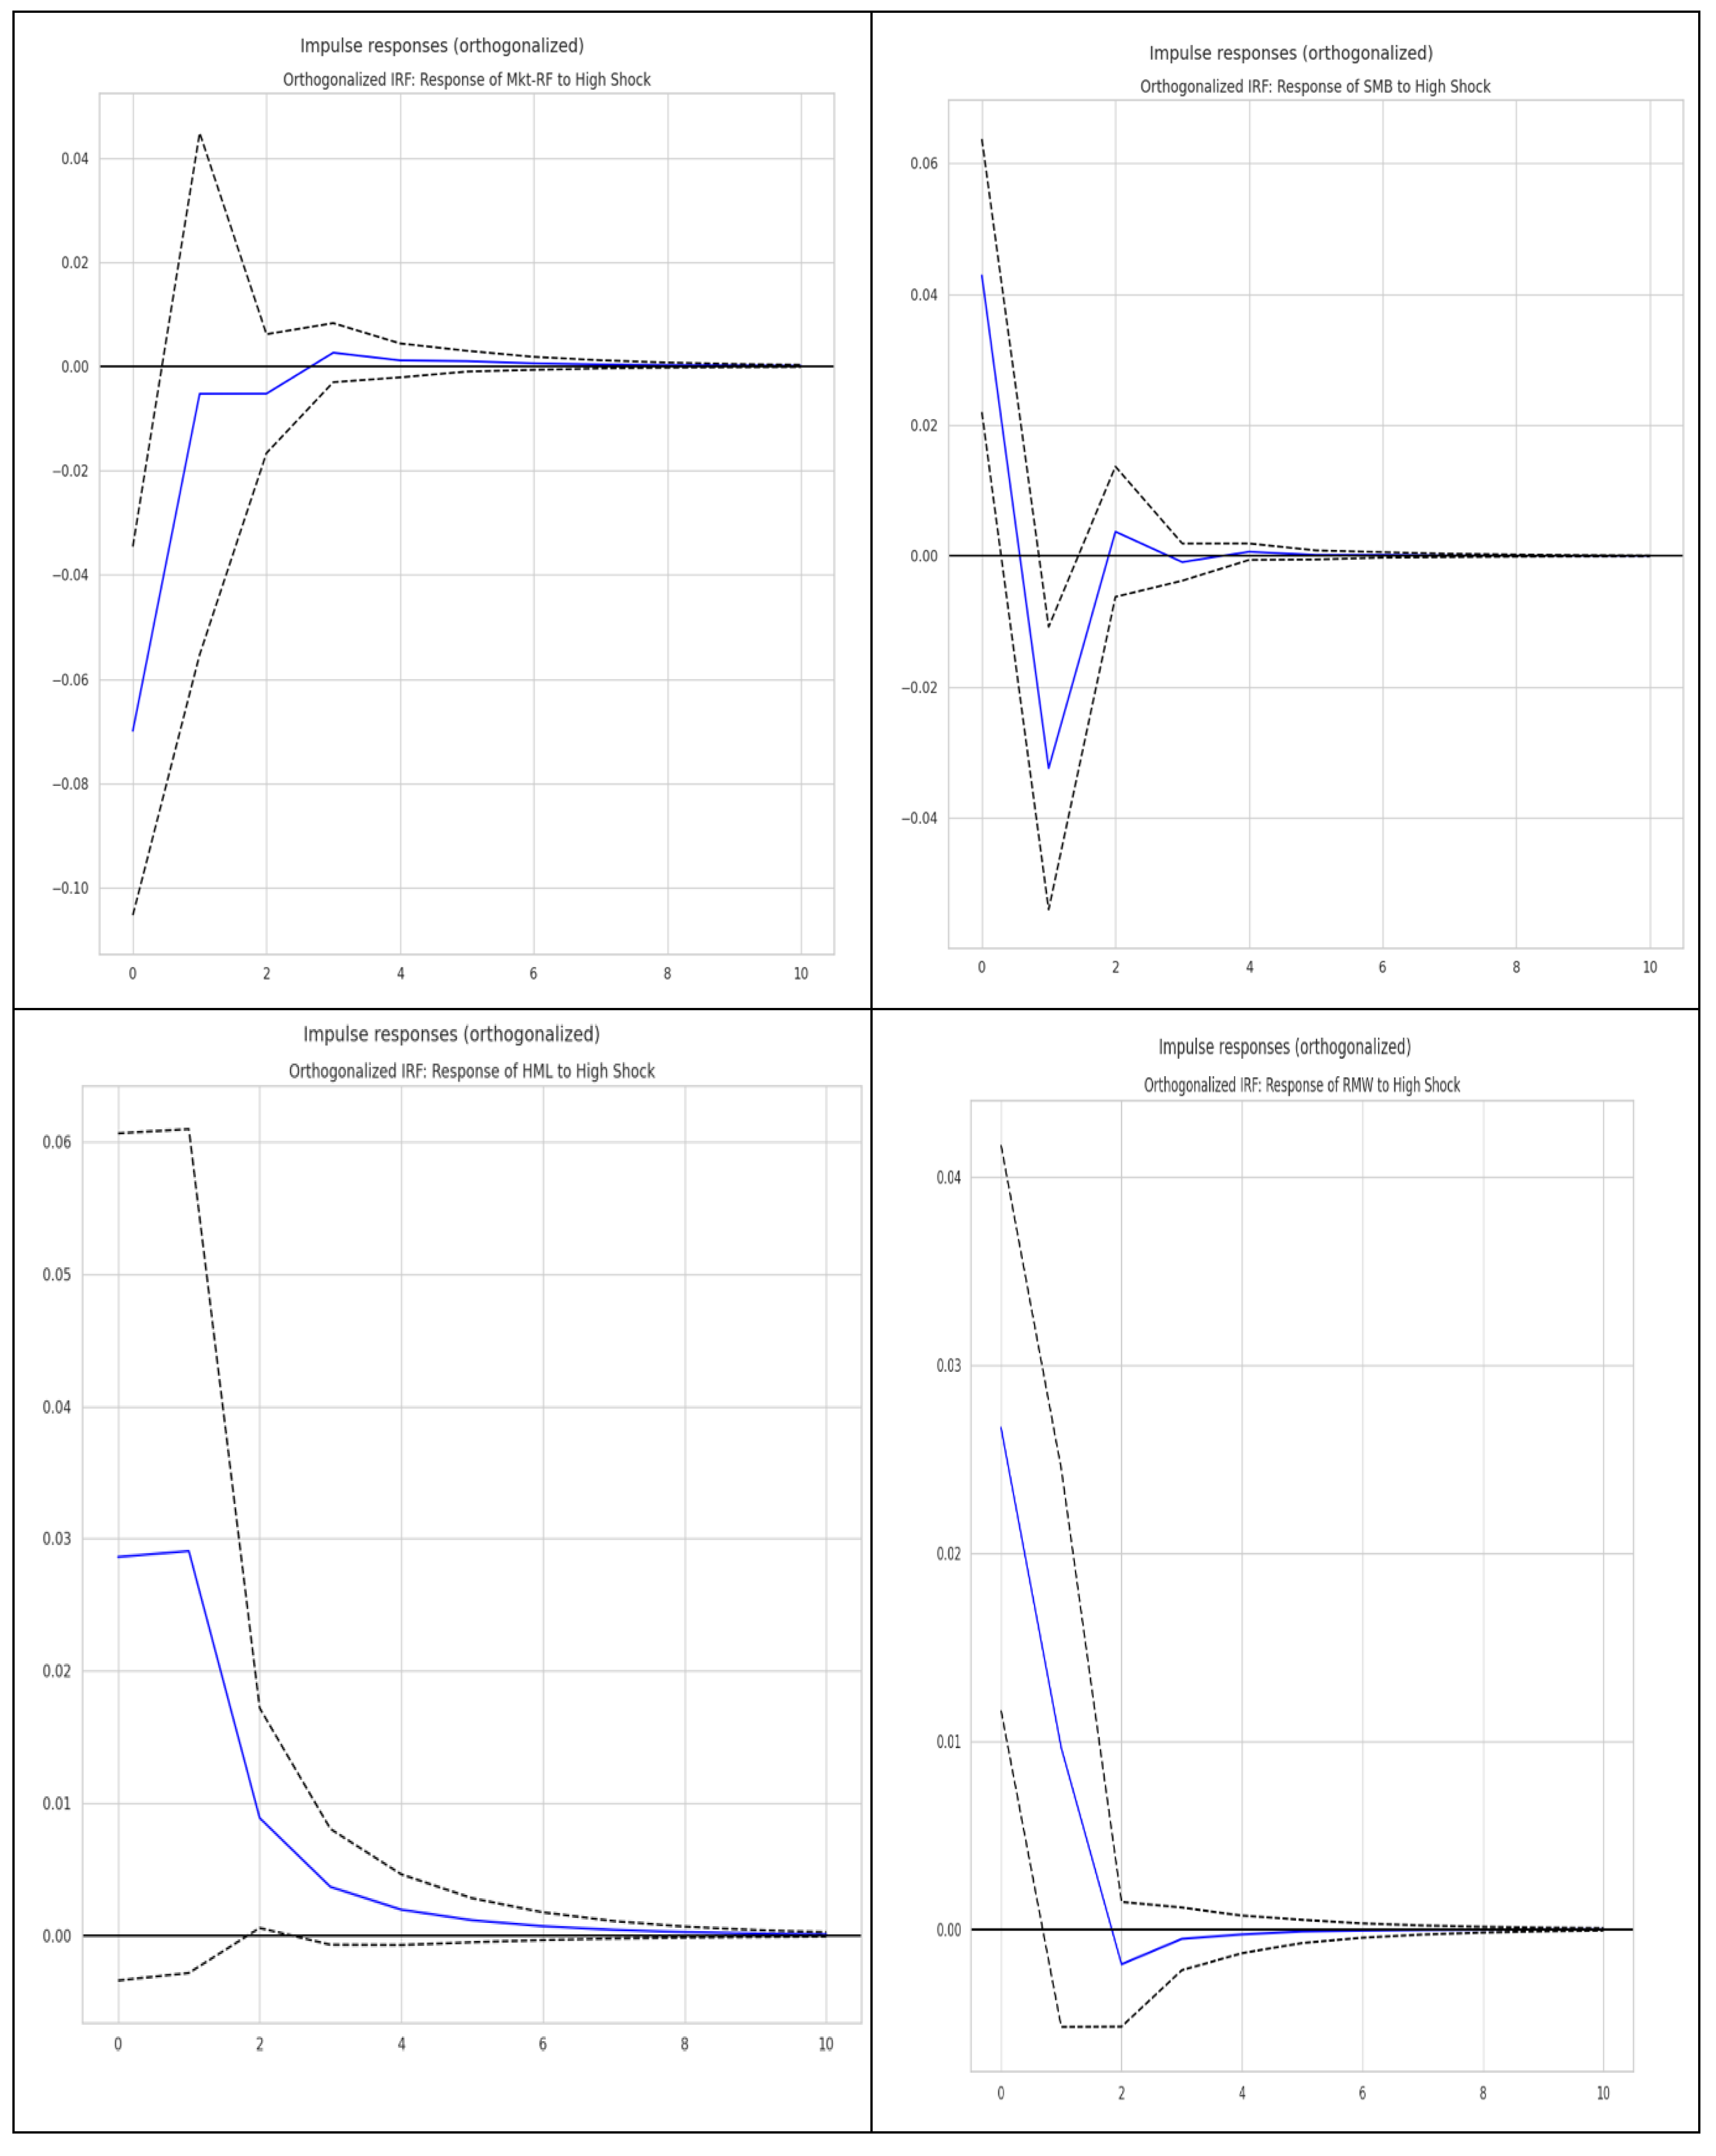
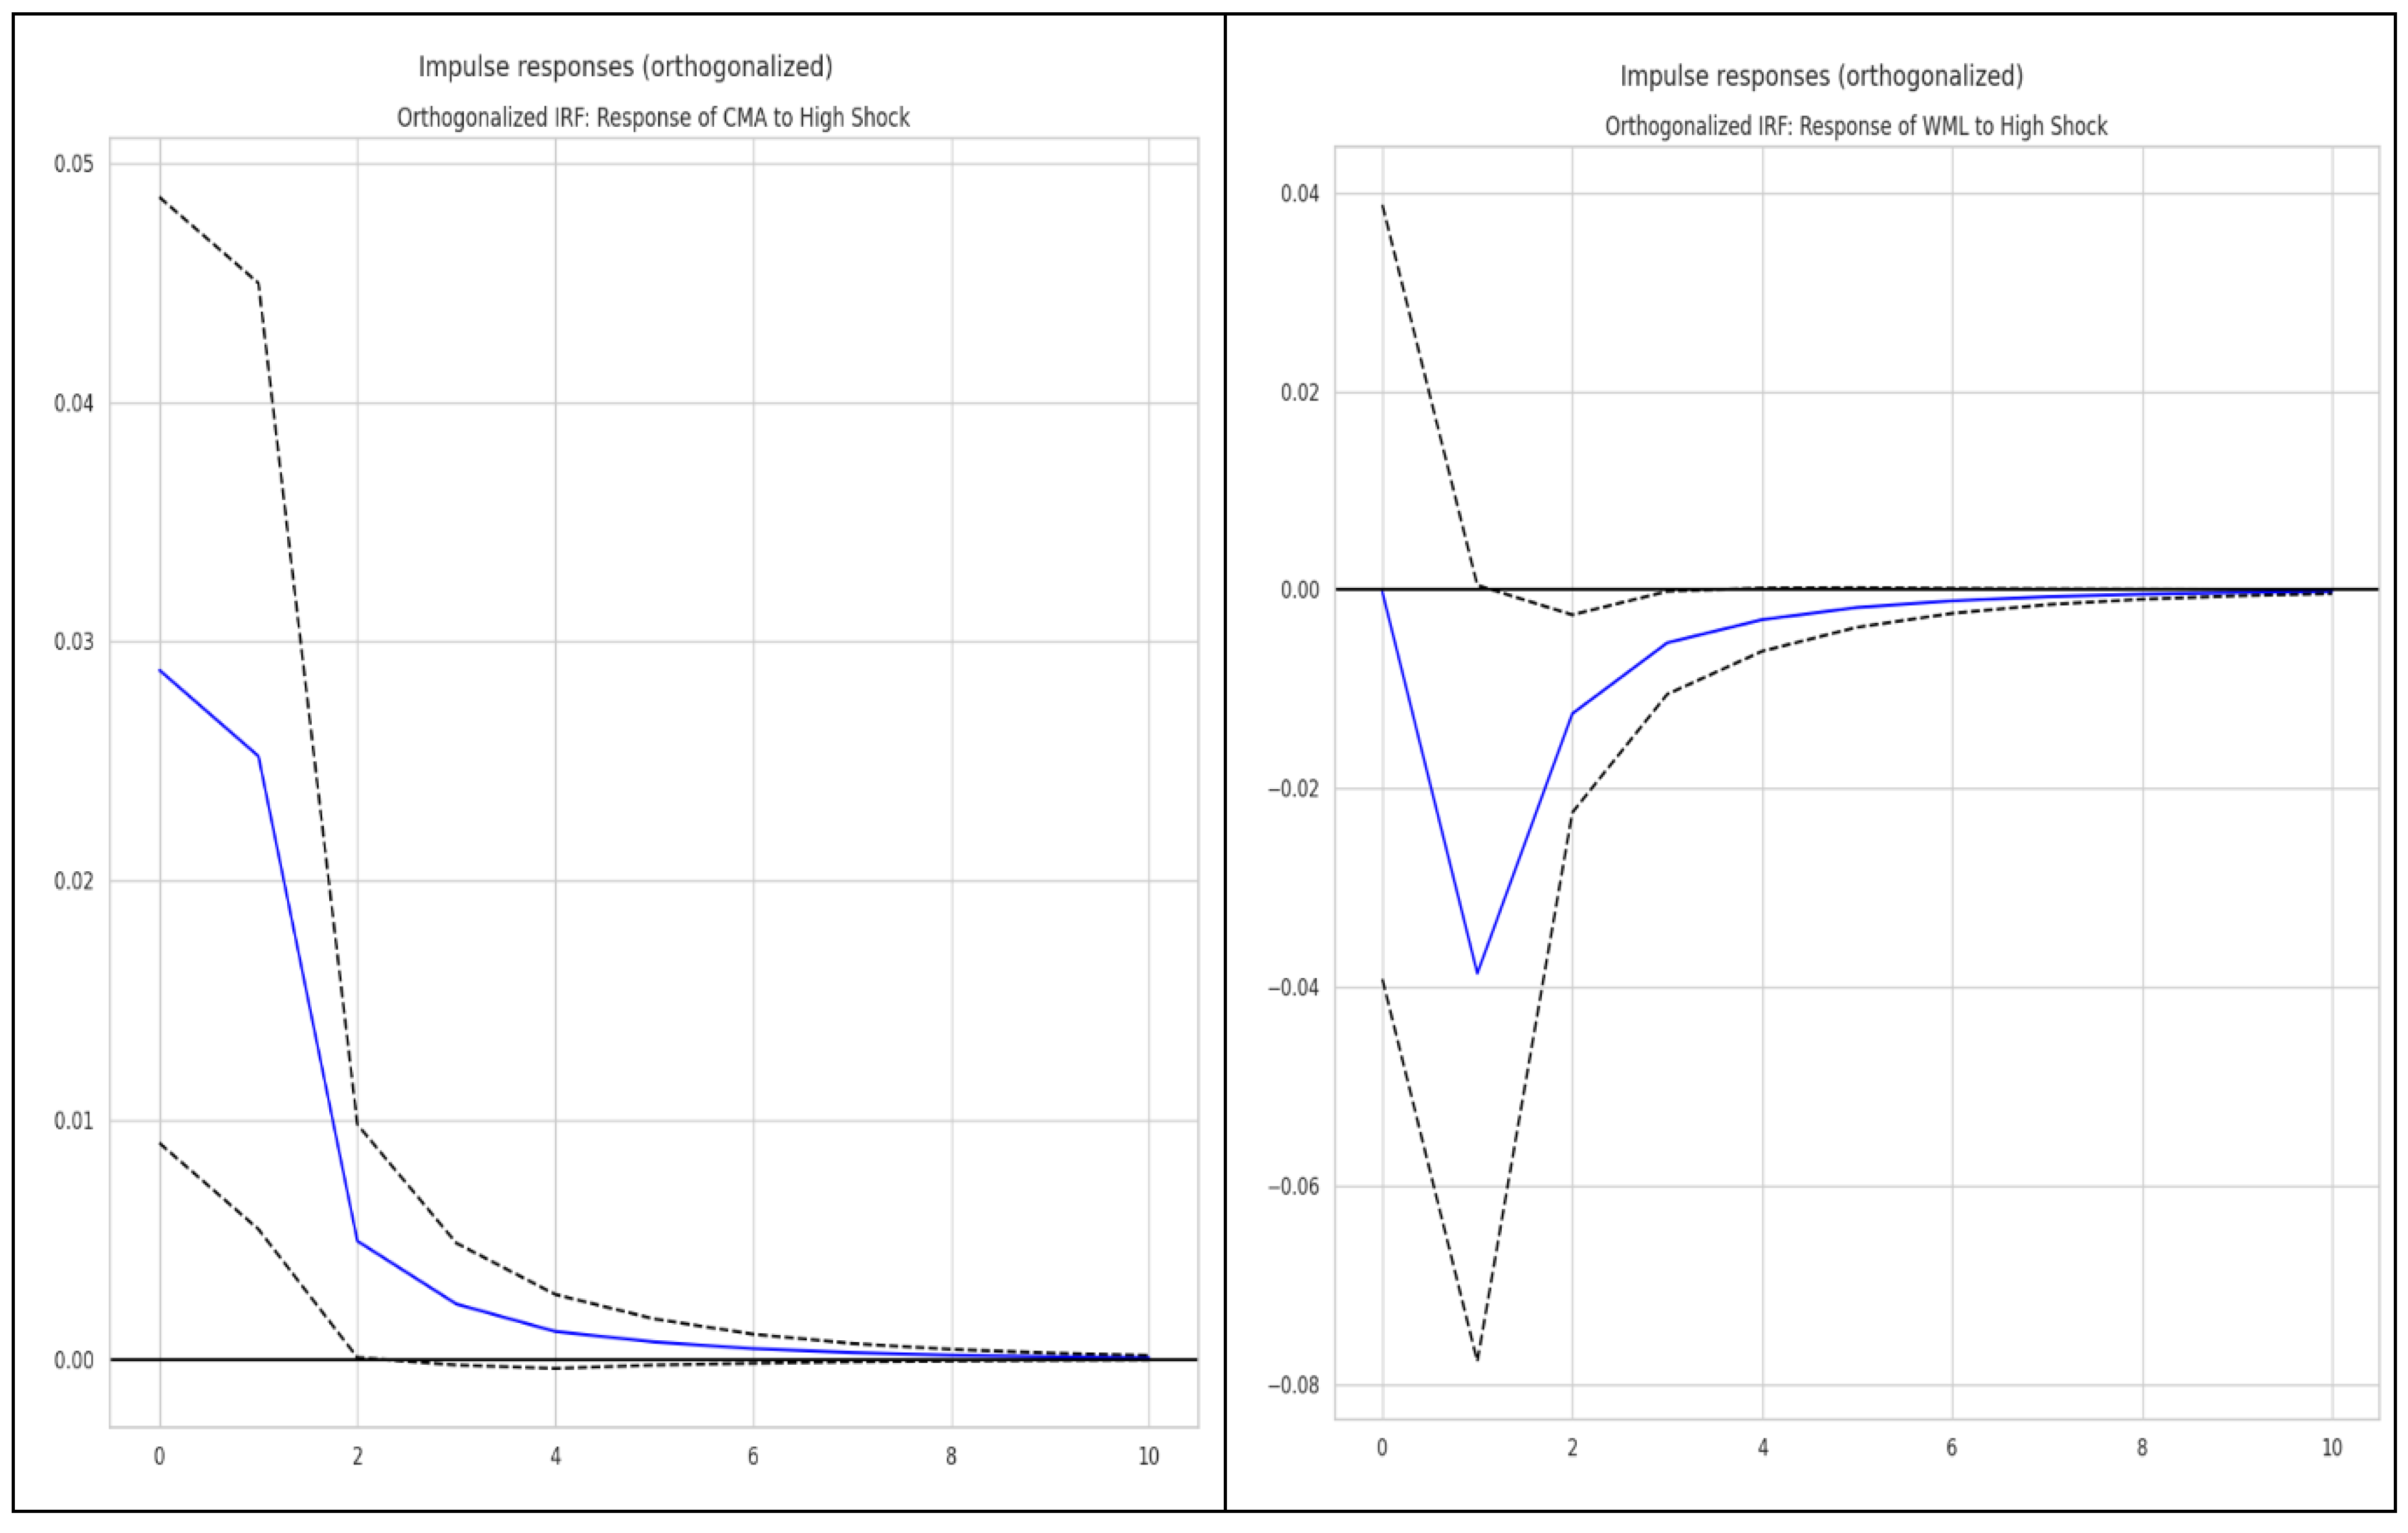
Figure 6.
Rolling correlation between High-ESG and Medium-ESG portfolios.
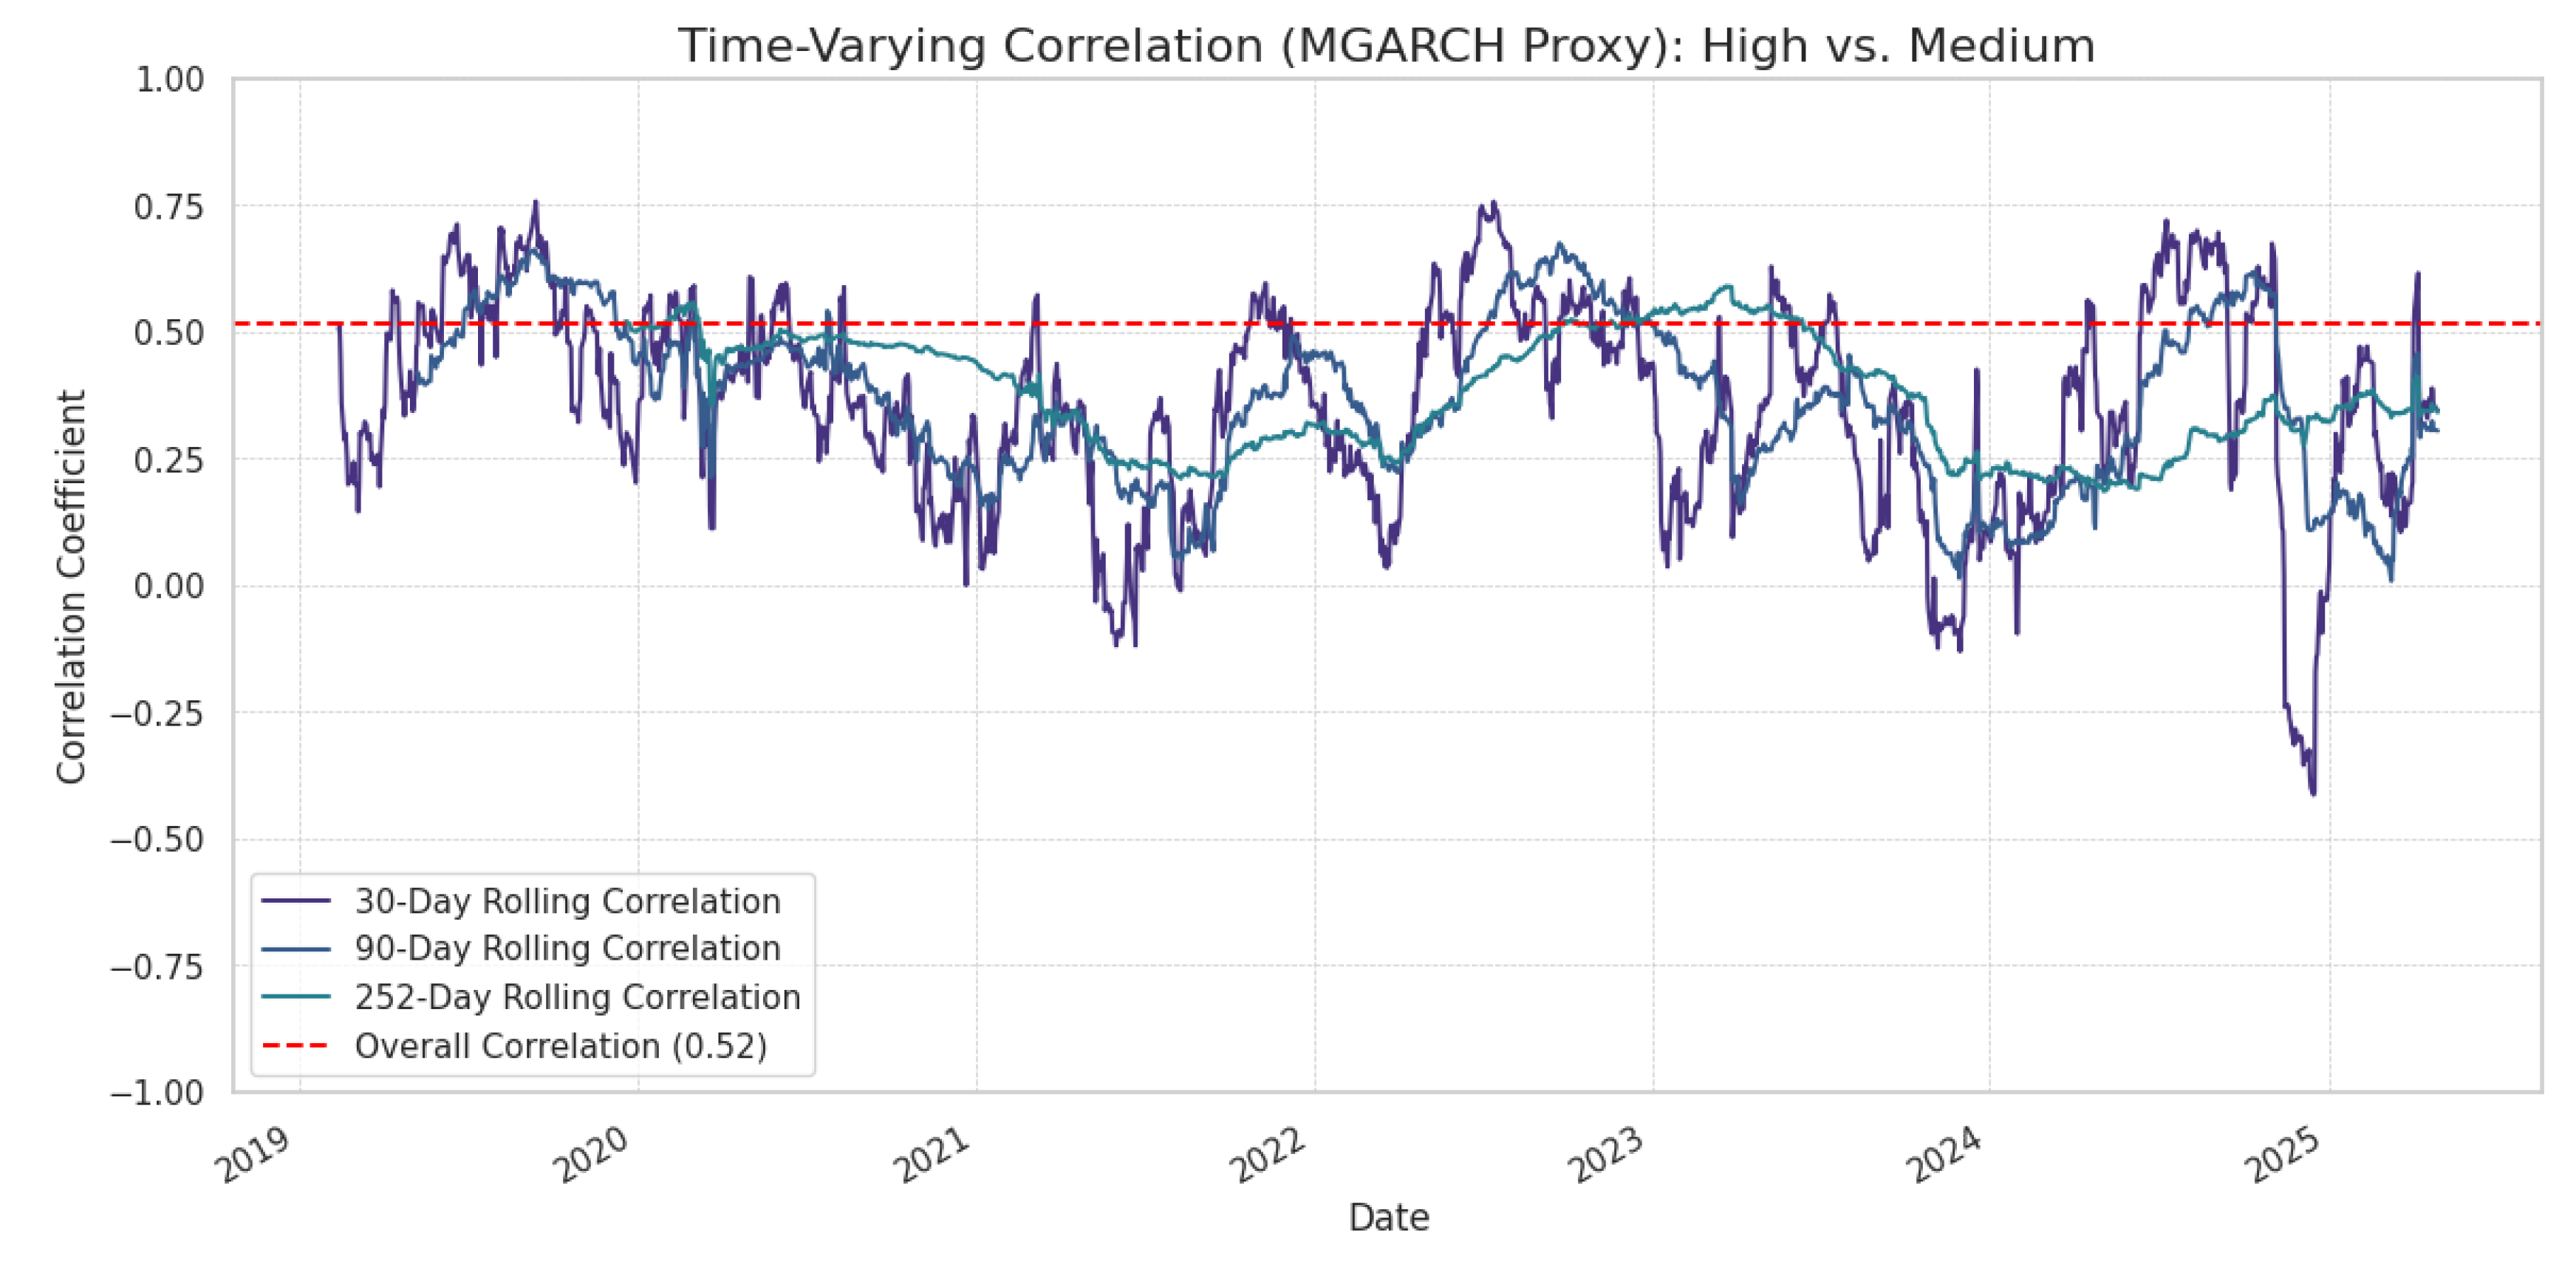
Figure 7.
SHAP Summary Plot for Medium-ESG Portfolio Excess Returns.
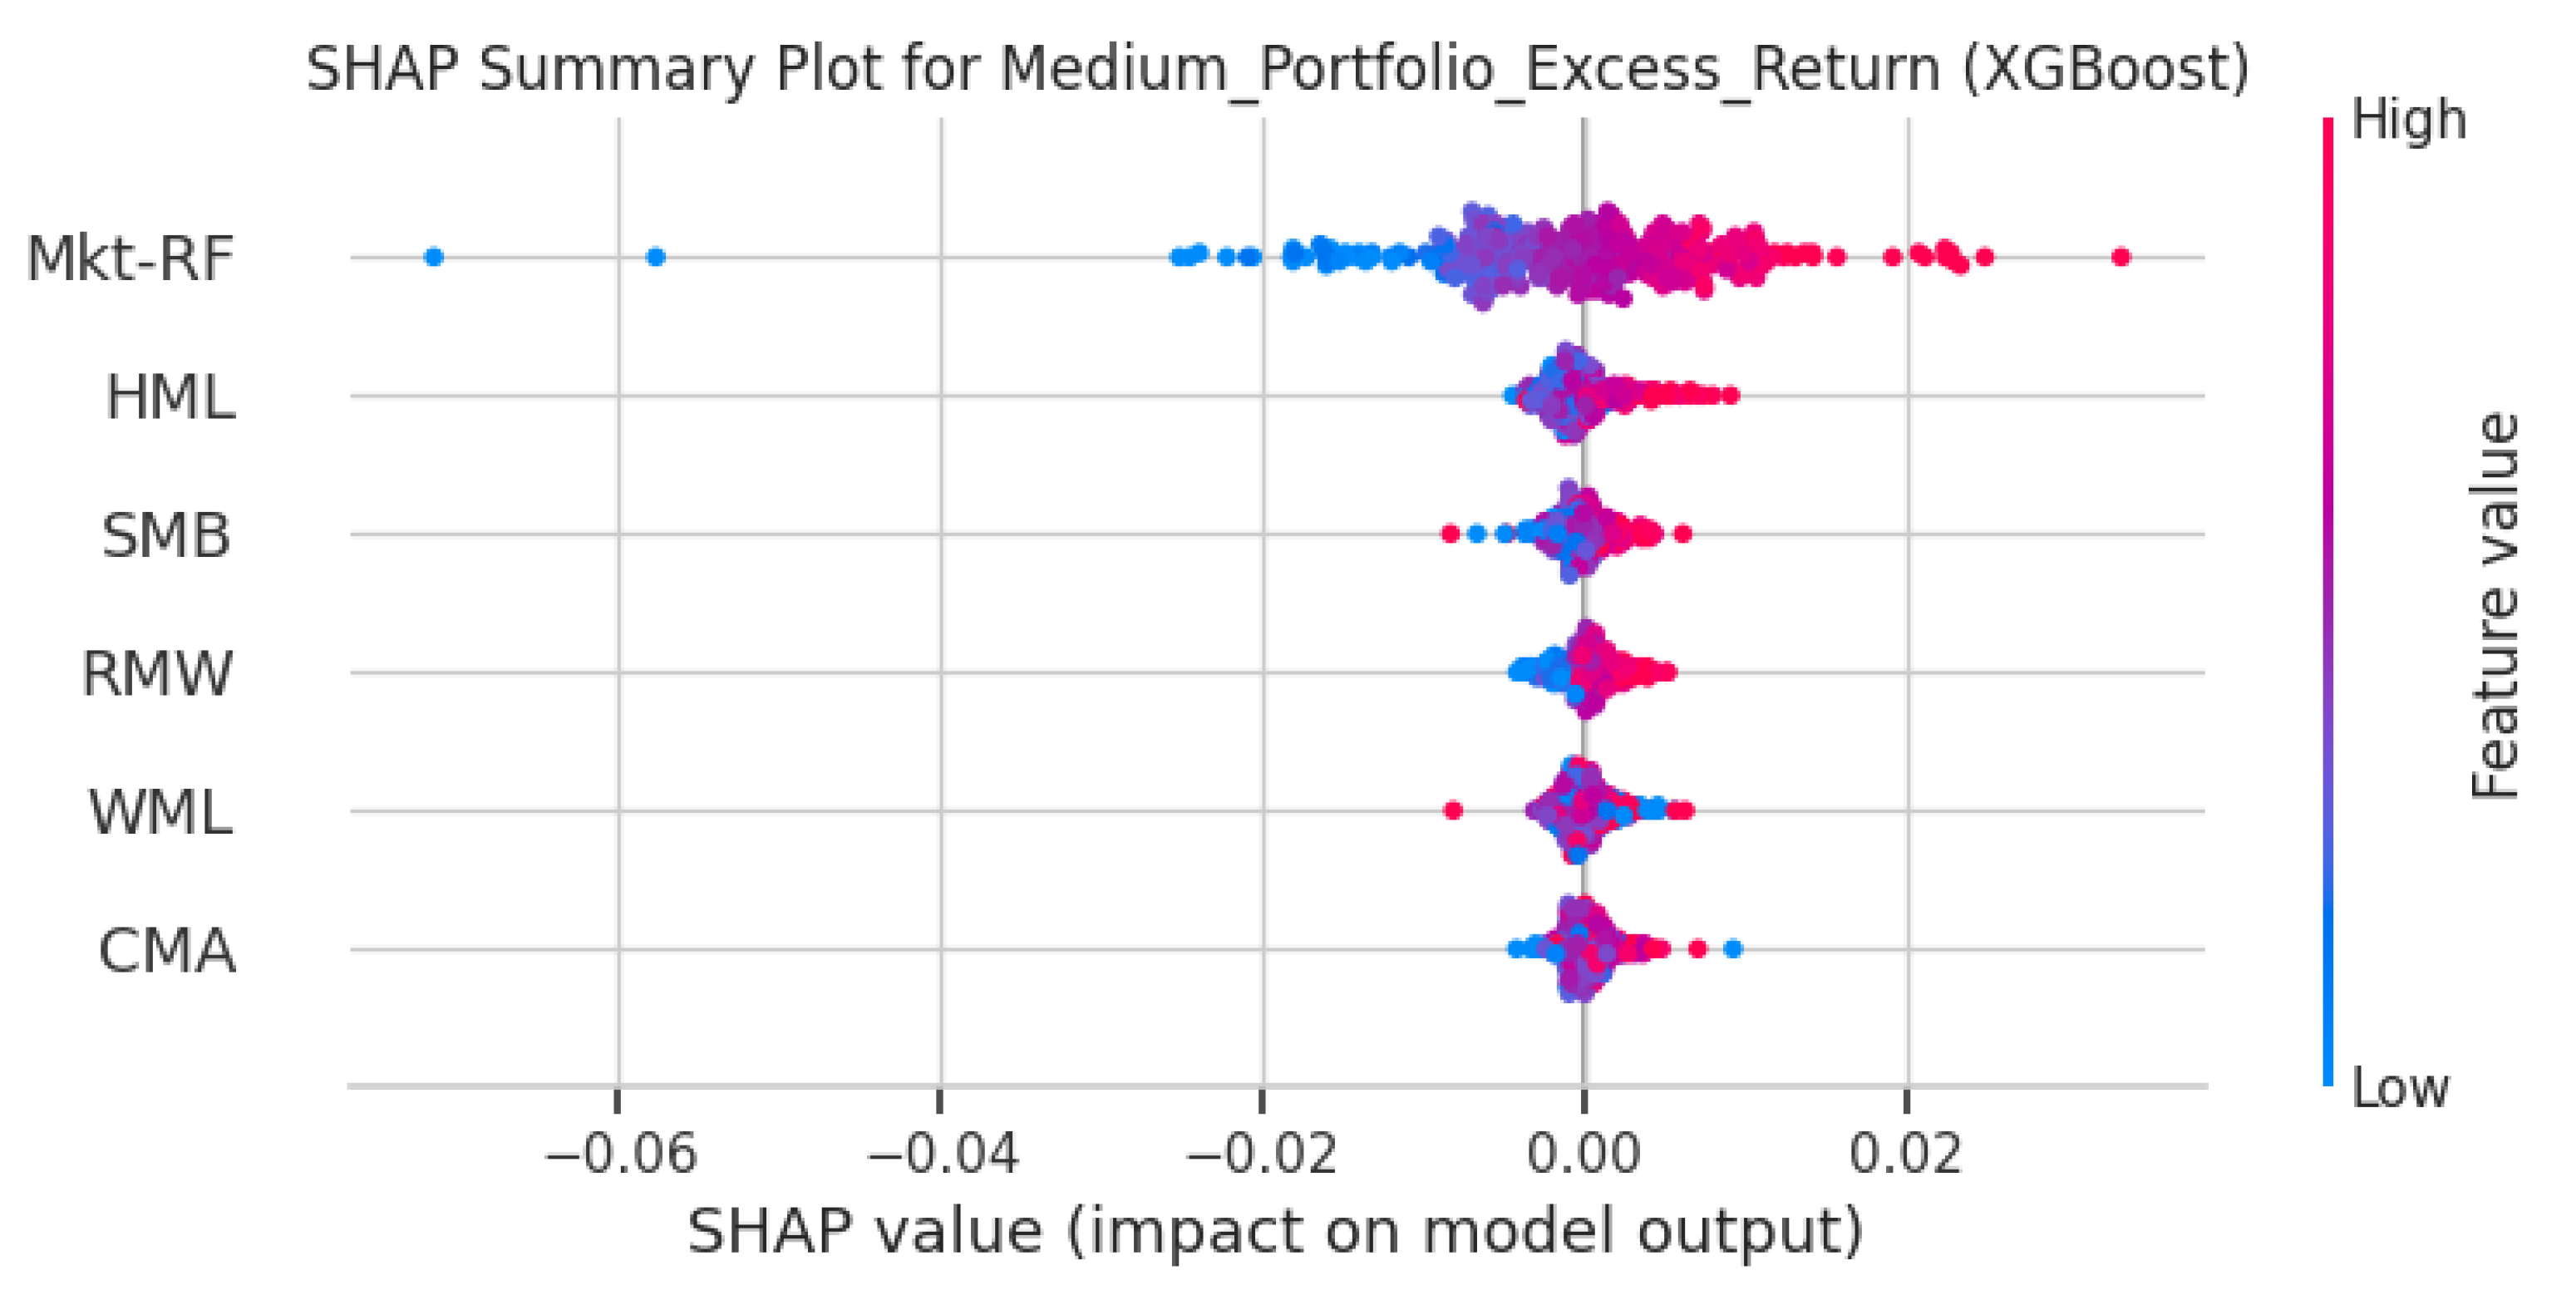
Figure 8.
XGBoost Feature Importance for Medium-ESG Portfolio Excess Returns.
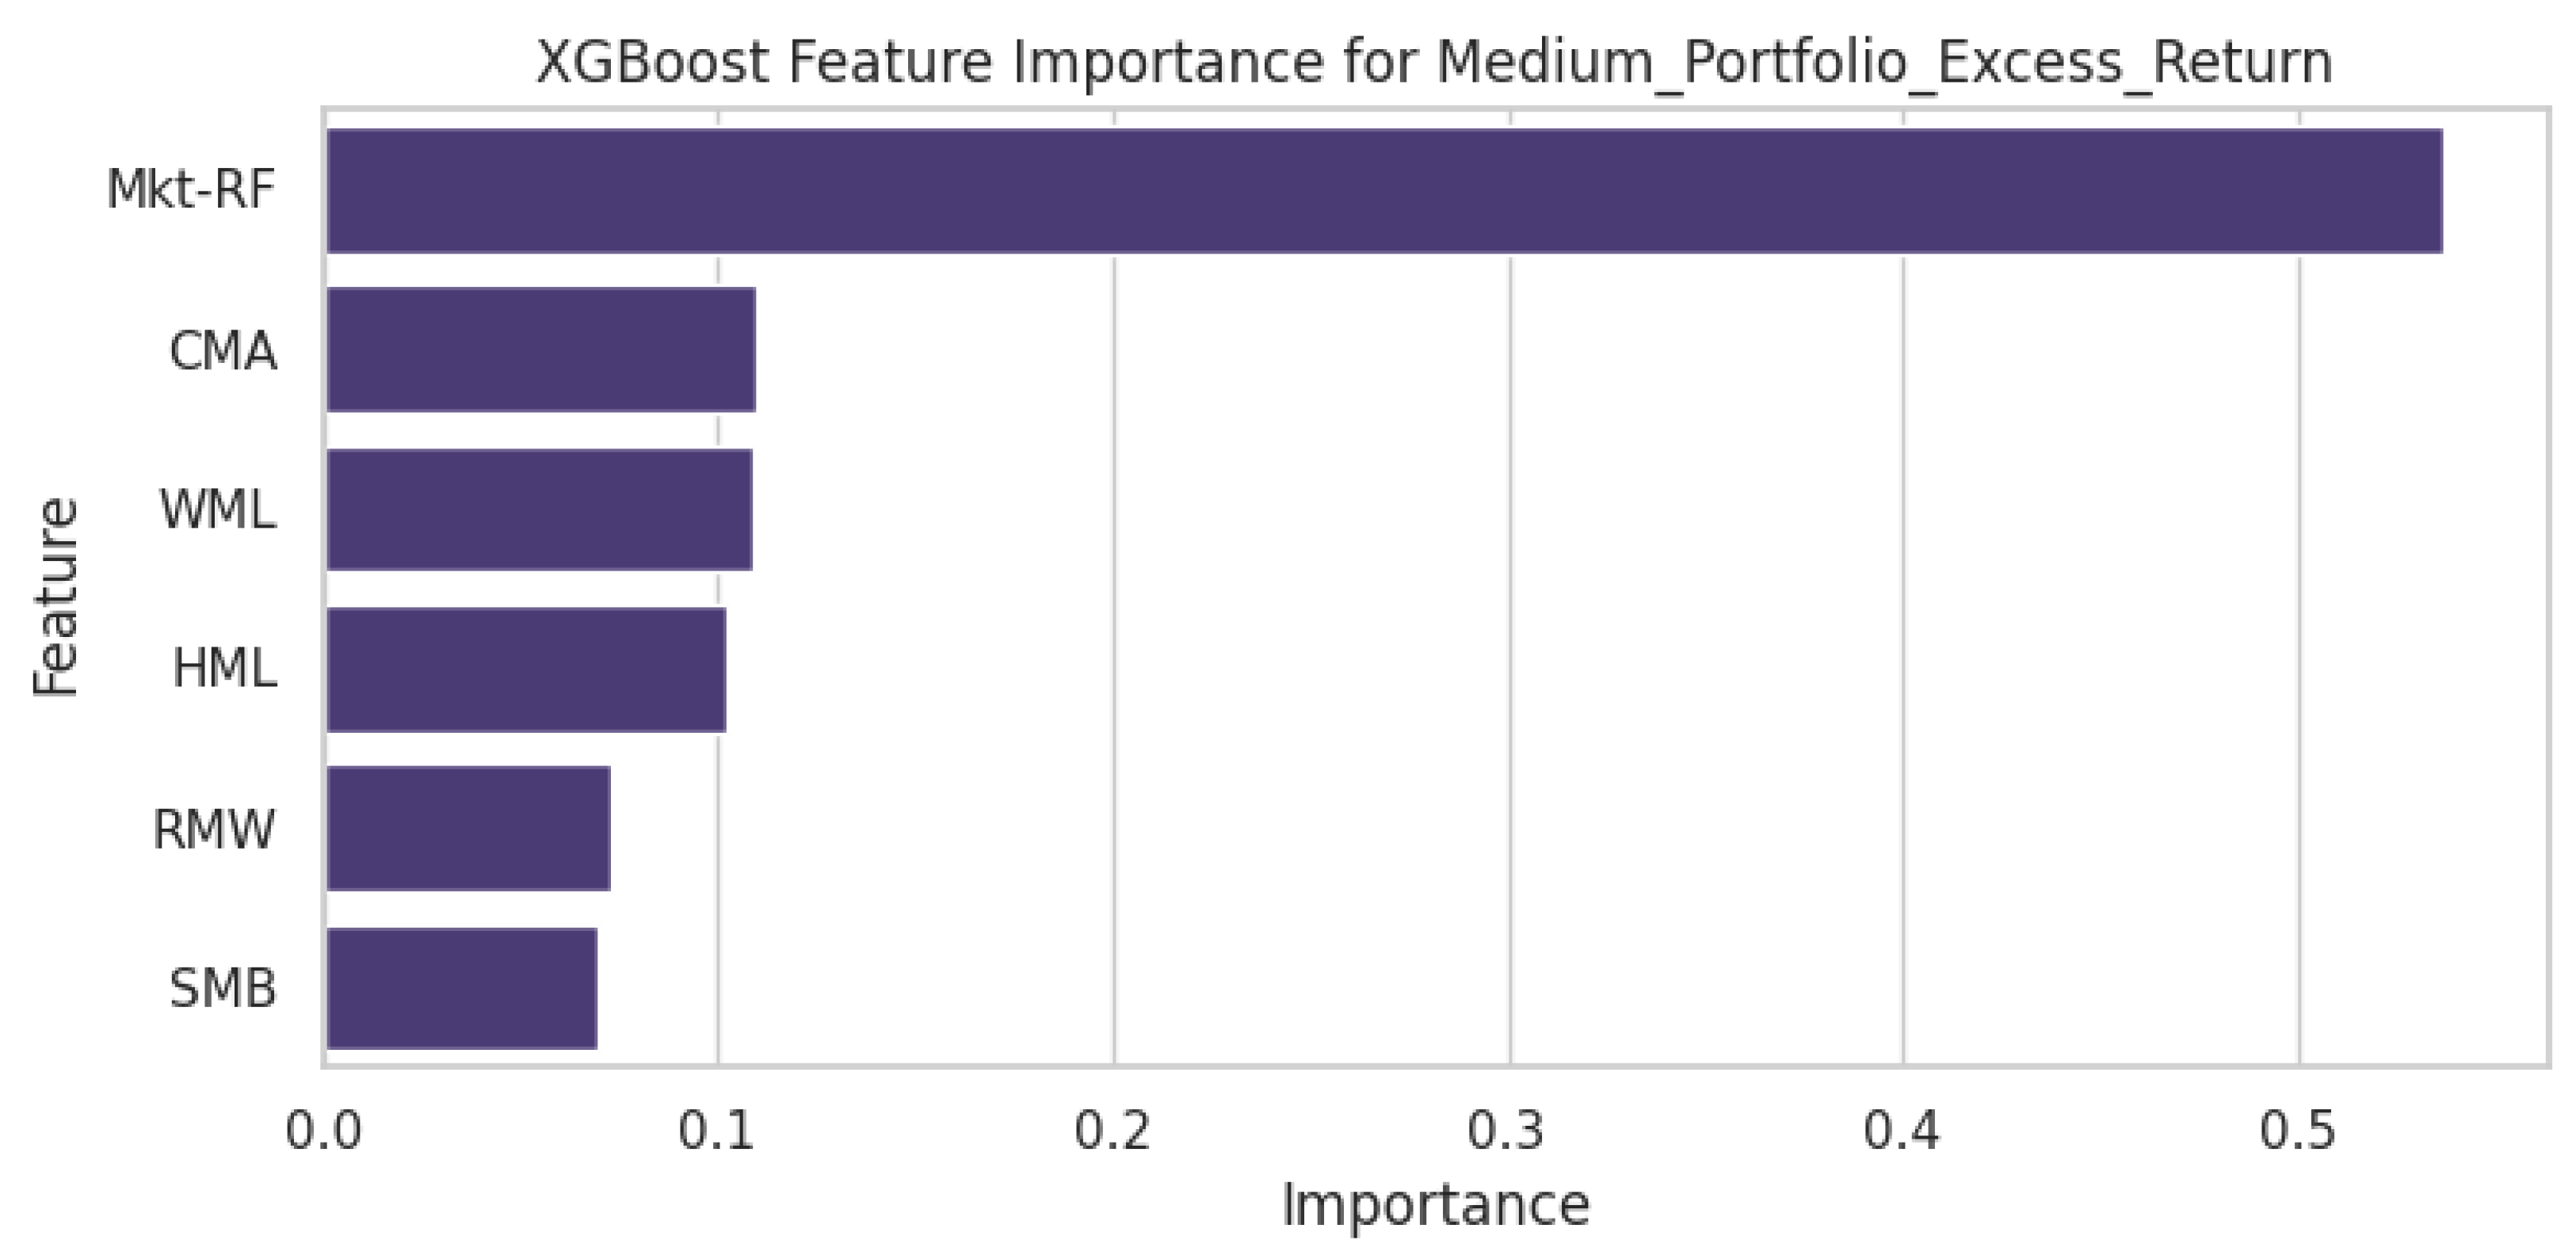
Figure 9.
SHAP Summary Plot for High-ESG Portfolio Excess Returns.
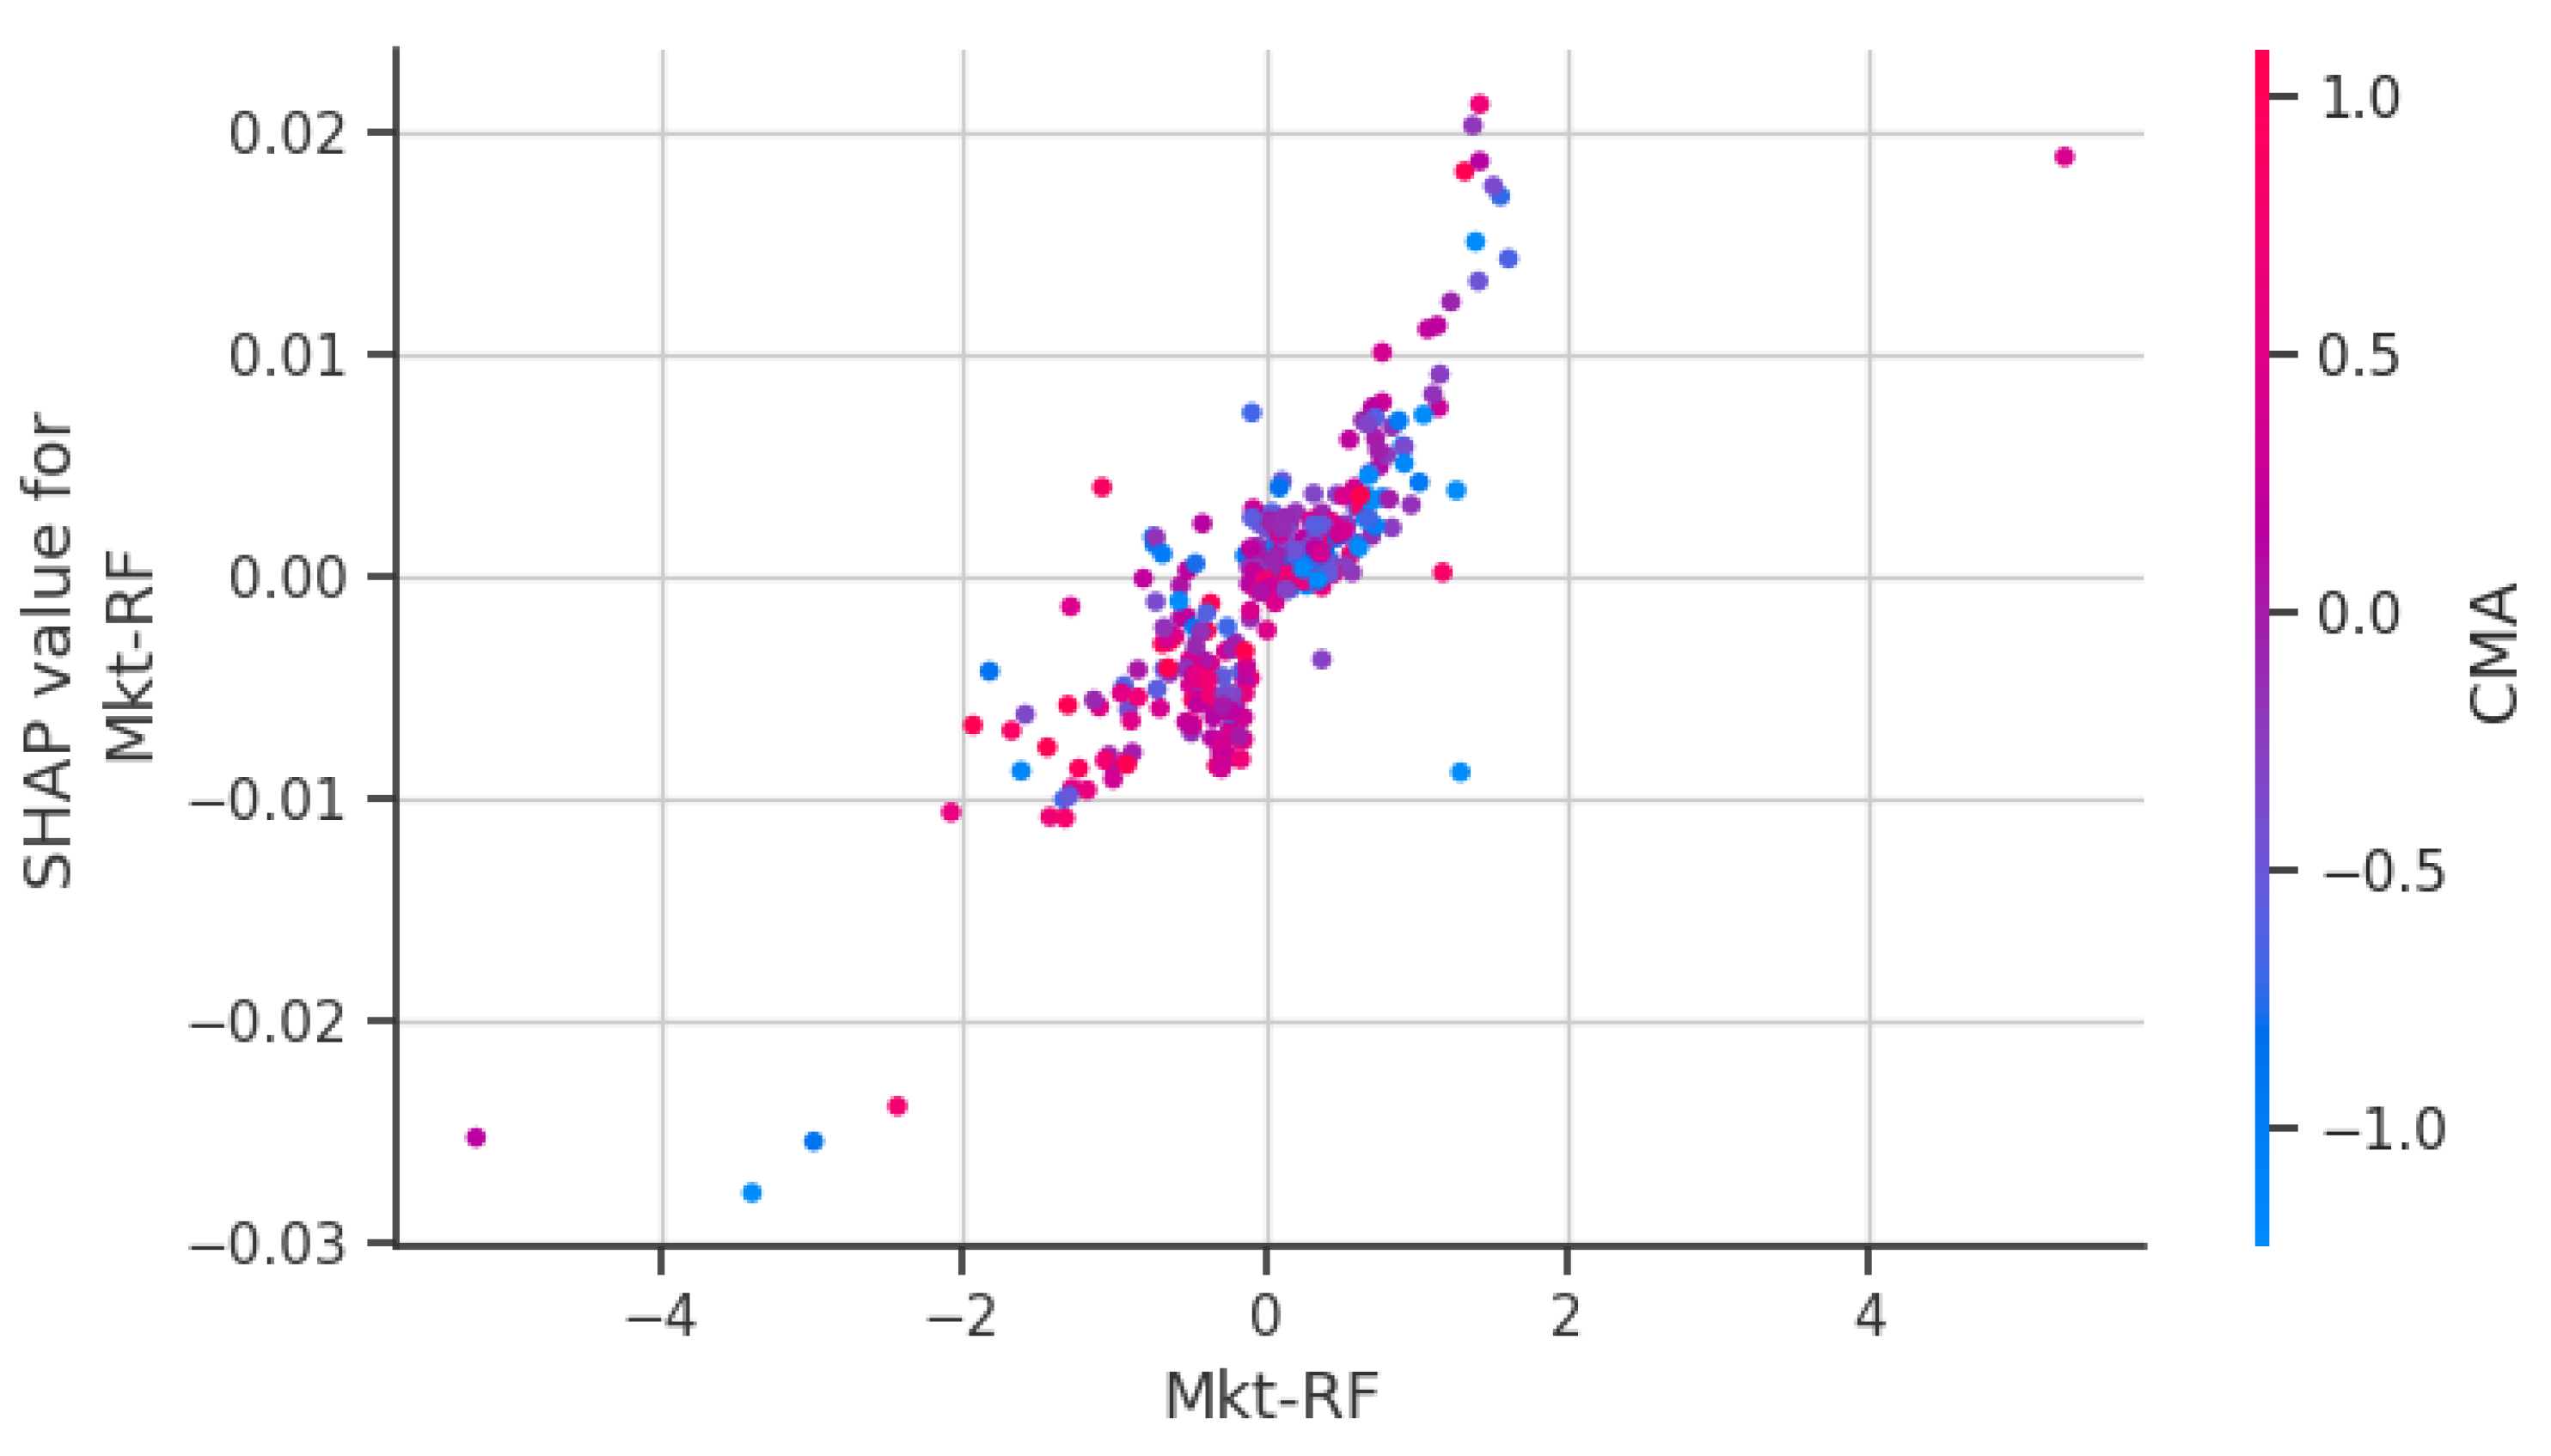
Figure 10.
XGBoost Feature Importance for High-ESG Portfolio Excess Returns.
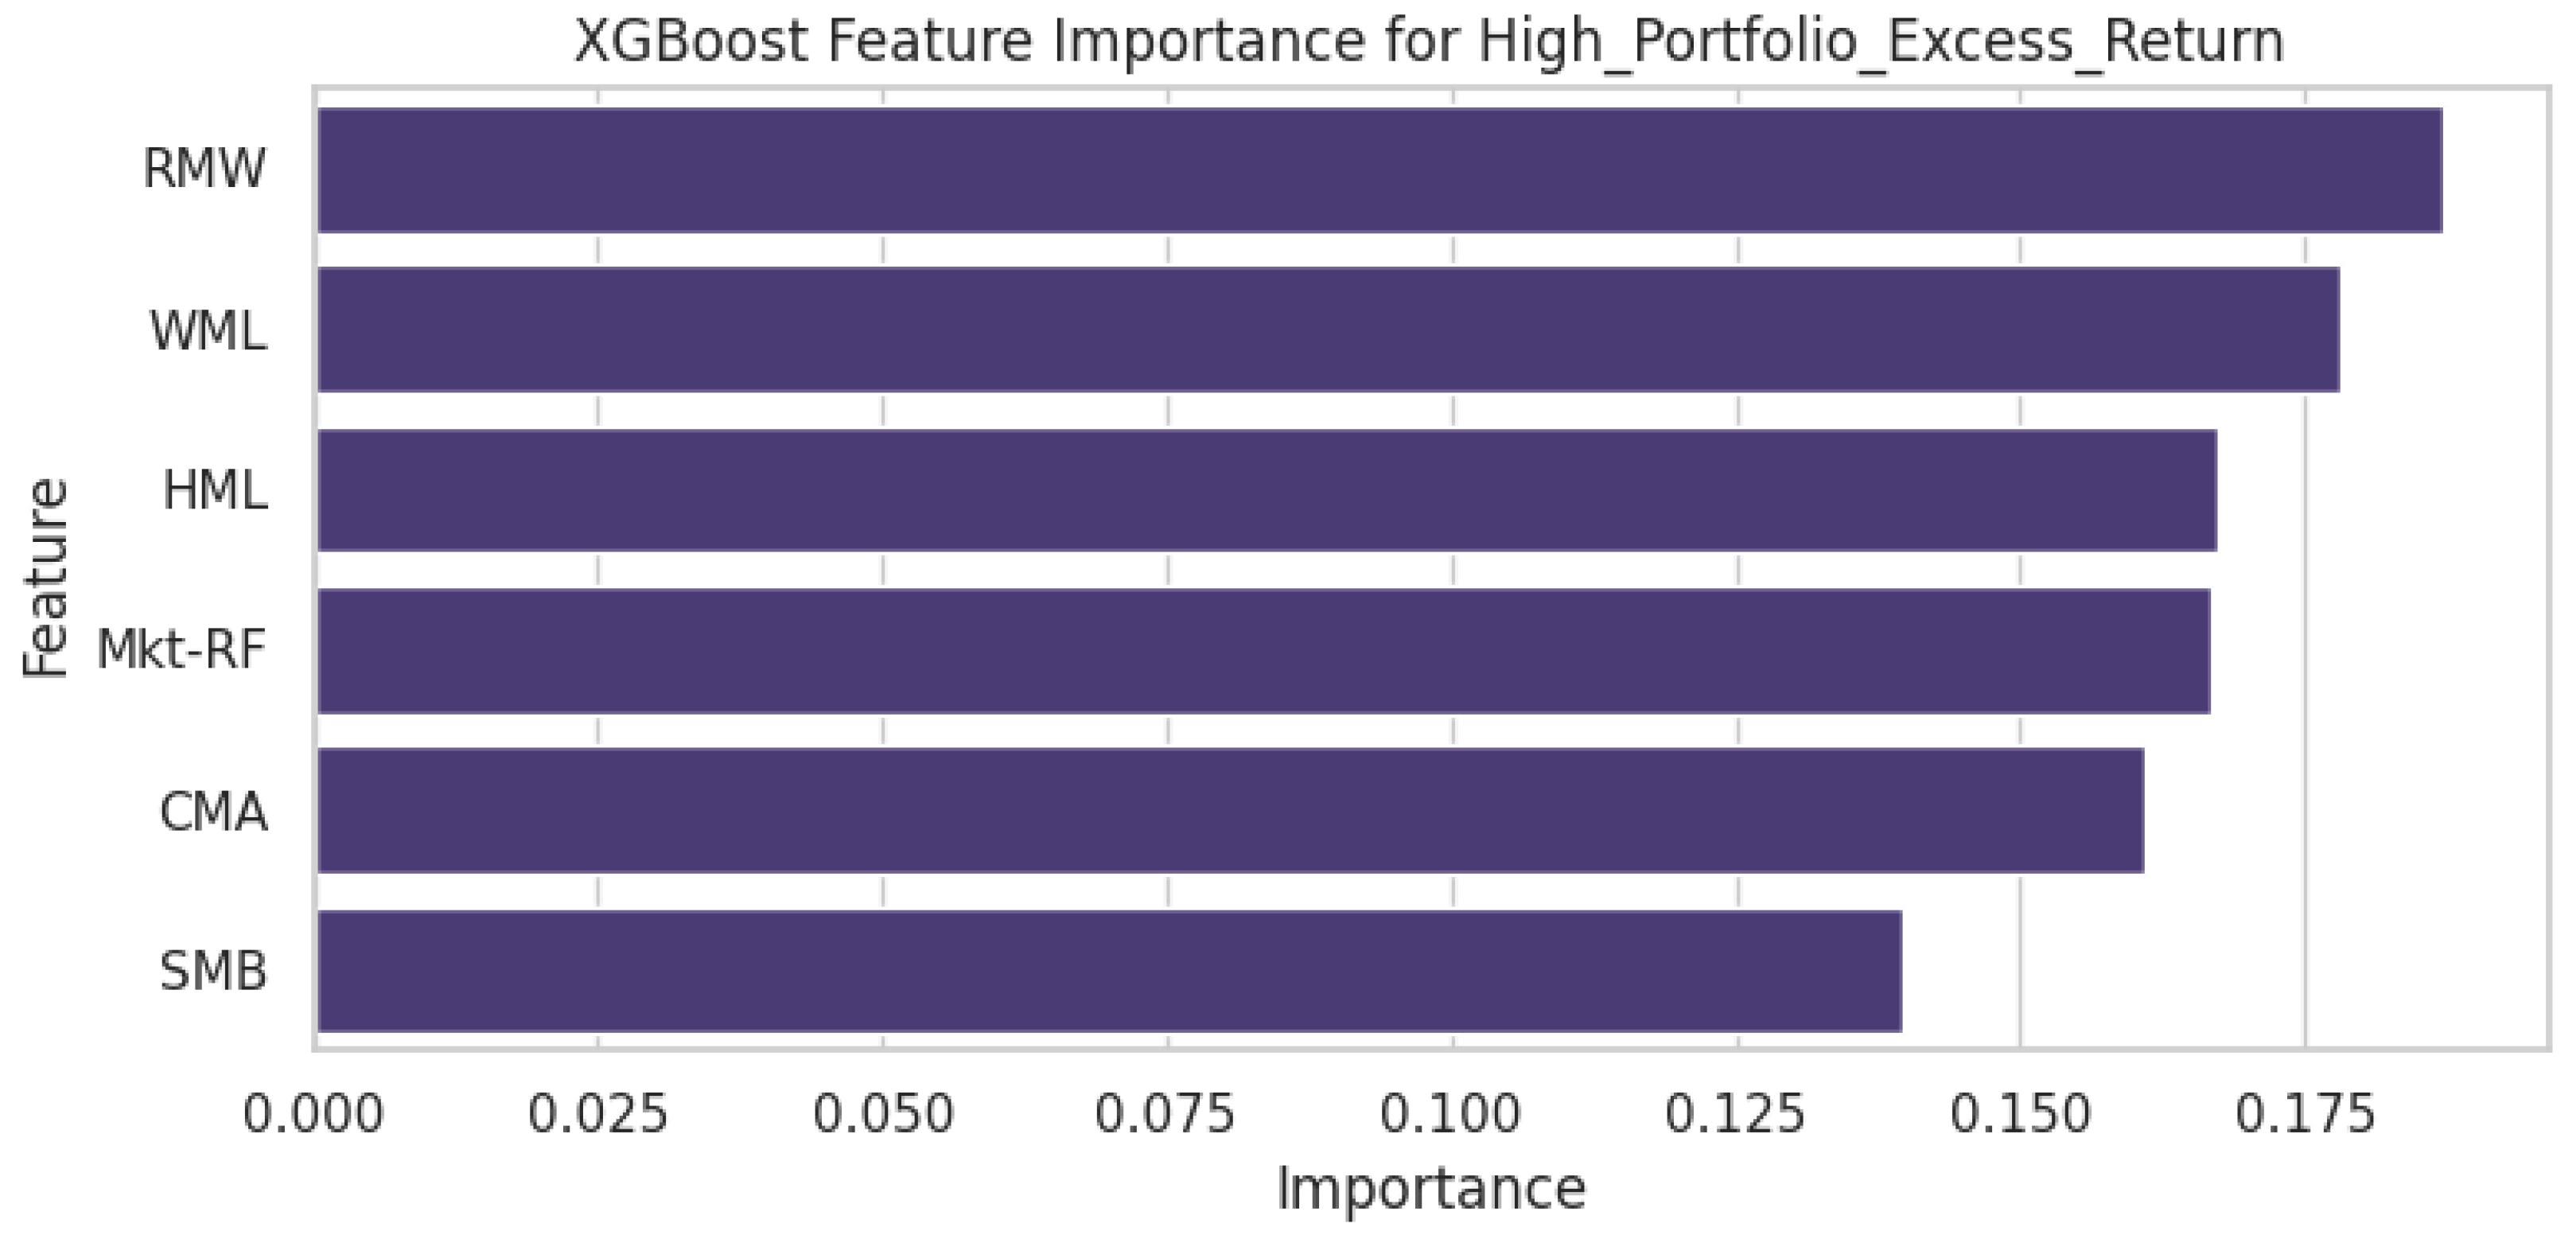

Table 1.
Stationarity Test Results (Augmented Dickey–Fuller Test).
| Variable | ADF Statistic | p-value | Conclusion (at 5% significance) |
| High_Portfolio_Excess_Return | -4.020491 | 0.0013 | Stationary |
| Medium_Portfolio_Excess_Return | -3.223462 | 0.0187 | Stationary |
| Mkt-RF | -12.218014 | 0.0000 | Stationary |
| SMB | -13.388768 | 0.0000 | Stationary |
| HML | -19.655739 | 0.0000 | Stationary |
| RMW | -36.698399 | 0.0000 | Stationary |
| CMA | -24.354242 | 0.0000 | Stationary |
| WML | -25.608553 | 0.0000 | Stationary |
Table 2.
VAR Stability Test.
| Test | Outcome | ||||
| Model Stability | TRUE | ||||
| Residual Serial Correlation (Portmanteau) Test | |||||
| Test | Conclusion | Test Statistic | Critical Value | p-value | df |
| Residual Serial Correlation (lag = 6) | Reject H0 at 5% | 711.3 | 362.7 | 0 | 320 |
| Residual Normality (Jarque-Bera) Test | |||||
| Test | Conclusion | Test Statistic | Critical Value | p-value | df |
| Residual Normality (Jarque-Bera) | Reject H0 at 5% | 13240 | 26.3 | 0 | 16 |
Table 3.
PanelOLS Estimation Summary for Model 1 (Total-Score).
| Parameter | Parameter Estimate | Std. Err. | T-stat | P-value | Lower CI | Upper CI |
| Const | -0.0412 | 0.0029 | -14.201 | 0.0000 | -0.0468 | -0.0355 |
| Mkt-RF | 0.0102 | 0.0007 | 14.837 | 0.0000 | 0.0089 | 0.0116 |
| SMB | 0.0034 | 0.0016 | 2.1173 | 0.0342 | 0.0003 | 0.0066 |
| HML | 0.0030 | 0.0007 | 4.4535 | 0.0000 | 0.0017 | 0.0043 |
| RMW | 0.0053 | 0.0011 | 4.7009 | 0.0000 | 0.0031 | 0.0075 |
| CMA | 0.0012 | 0.0009 | 1.3086 | 0.1907 | -0.0006 | 0.0029 |
| WML | -0.0005 | 0.0003 | -1.7529 | 0.0796 | -0.0011 | 5.984e-05 |
| Total-Score | 0.0015 | 0.0001 | 10.883 | 0.0000 | 0.0012 | 0.0017 |
Note: F-test for Poolability: 29.015 (p-value: 0.0000). Included effects: Entity.
Table 4.
PanelOLS Estimation Summary for Model 2 (ESG Pillars).
| Parameter | Parameter Estimate | Std. Err. | T-stat | P-value | Lower CI | Upper CI |
| const | -0.0186 | 0.0141 | -1.326 | 0.1849 | -0.0462 | 0.0089 |
| Mkt-RF | 0.0103 | 0.0007 | 15.195 | 0.0000 | 0.0090 | 0.0117 |
| SMB | 0.0037 | 0.0017 | 2.221 | 0.0264 | 0.0004 | 0.0070 |
| HML | 0.0025 | 0.0007 | 3.758 | 0.0002 | 0.0012 | 0.0039 |
| RMW | 0.0055 | 0.0011 | 4.838 | 0.0000 | 0.0032 | 0.0077 |
| CMA | 0.0017 | 0.0009 | 1.877 | 0.0606 | -7.613e-05 | 0.0035 |
| WML | -0.0006 | 0.0003 | -2.158 | 0.0310 | -0.0012 | -5.561e-05 |
| E-Score | 0.0007 | 0.0018 | 0.409 | 0.6825 | -0.0027 | 0.0042 |
| S-Score | 0.0005 | 0.0015 | 0.363 | 0.7166 | -0.0023 | 0.0034 |
| G-Score | 8.312e-05 | 0.0036 | 0.023 | 0.9815 | -0.0069 | 0.0071 |
Note: F-test for Poolability: 1.4326 (p-value: 0.1102). Included effects: Entity.
Table 5.
Granger Causality Tests: Medium_Portfolio_Excess_Return.
| Causing Variable | Caused Variable | Test Statistic | P-value | df | Conclusion |
| High_Portfolio_Excess_Return | Medium_Portfolio_Excess_Return | 18.32 | 0.000 | 1 | Reject H0. 'High_Portfolio_Excess_Return' Granger-causes 'Medium_Portfolio_Excess_Return'. |
| Medium_Portfolio_Excess_Return | Mkt-RF | 1.318 | 0.251 | 1 | Fail to reject H0. 'Medium_Portfolio_Excess_Return' does not Granger-cause 'Mkt-RF'. |
| High_Portfolio_Excess_Return | Mkt-RF | 0.1561 | 0.693 | 1 | Fail to reject H0. 'High_Portfolio_Excess_Return' does not Granger-cause 'Mkt-RF'. |
| Medium_Portfolio_Excess_Return | SMB | 1.209 | 0.272 | 1 | Fail to reject H0. 'Medium_Portfolio_Excess_Return' does not Granger-cause 'SMB'. |
| High_Portfolio_Excess_Return | SMB | 2.158 | 0.142 | 1 | Fail to reject H0. 'High_Portfolio_Excess_Return' does not Granger-cause 'SMB'. |
| Medium_Portfolio_Excess_Return | HML | 0.1133 | 0.736 | 1 | Fail to reject H0. 'Medium_Portfolio_Excess_Return' does not Granger-cause 'HML'. |
| High_Portfolio_Excess_Return | HML | 1.707 | 0.191 | 1 | Fail to reject H0. 'High_Portfolio_Excess_Return' does not Granger-cause 'HML'. |
| Medium_Portfolio_Excess_Return | RMW | 0.6808 | 0.409 | 1 | Fail to reject H0. 'Medium_Portfolio_Excess_Return' does not Granger-cause 'RMW'. |
| High_Portfolio_Excess_Return | RMW | 1.166 | 0.280 | 1 | Fail to reject H0. 'High_Portfolio_Excess_Return' does not Granger-cause 'RMW'. |
| Medium_Portfolio_Excess_Return | CMA | 0.006209 | 0.937 | 1 | Fail to reject H0. 'Medium_Portfolio_Excess_Return' does not Granger-cause 'CMA'. |
| High_Portfolio_Excess_Return | CMA | 3.389 | 0.066 | 1 | Fail to reject H0. 'High_Portfolio_Excess_Return' does not Granger-cause 'CMA'. |
Table 6.
Granger Causality Tests: High_Portfolio_Excess_Return.
| Causing Variable | Caused Variable | Test Statistic | P-value | df | Conclusion |
| Medium_Portfolio_Excess_Return | High_Portfolio_Excess_Return | 192.3 | 0.000 | 1 | Reject H0. 'Medium_Portfolio_Excess_Return' Granger-causes 'High_Portfolio_Excess_Return'. |
| Medium_Portfolio_Excess_Return | Mkt-RF | 1.318 | 0.251 | 1 | Fail to reject H0. 'Medium_Portfolio_Excess_Return' does not Granger-cause 'Mkt-RF'. |
| High_Portfolio_Excess_Return | Mkt-RF | 0.1561 | 0.693 | 1 | Fail to reject H0. 'High_Portfolio_Excess_Return' does not Granger-cause 'Mkt-RF'. |
| Medium_Portfolio_Excess_Return | SMB | 1.209 | 0.272 | 1 | Fail to reject H0. 'Medium_Portfolio_Excess_Return' does not Granger-cause 'SMB'. |
| High_Portfolio_Excess_Return | SMB | 2.158 | 0.142 | 1 | Fail to reject H0. 'High_Portfolio_Excess_Return' does not Granger-cause 'SMB'. |
| Medium_Portfolio_Excess_Return | HML | 0.1133 | 0.736 | 1 | Fail to reject H0. 'Medium_Portfolio_Excess_Return' does not Granger-cause 'HML'. |
| High_Portfolio_Excess_Return | HML | 1.707 | 0.191 | 1 | Fail to reject H0. 'High_Portfolio_Excess_Return' does not Granger-cause 'HML'. |
| Medium_Portfolio_Excess_Return | RMW | 0.6808 | 0.409 | 1 | Fail to reject H0. 'Medium_Portfolio_Excess_Return' does not Granger-cause 'RMW'. |
| High_Portfolio_Excess_Return | RMW | 1.166 | 0.280 | 1 | Fail to reject H0. 'High_Portfolio_Excess_Return' does not Granger-cause 'RMW'. |
| Medium_Portfolio_Excess_Return | CMA | 0.006209 | 0.937 | 1 | Fail to reject H0. 'Medium_Portfolio_Excess_Return' does not Granger-cause 'CMA'. |
| High_Portfolio_Excess_Return | CMA | 3.389 | 0.066 | 1 | Fail to reject H0. 'High_Portfolio_Excess_Return' does not Granger-cause 'CMA'. |
| Medium_Portfolio_Excess_Return | WML | 0.09612 | 0.757 | 1 | Fail to reject H0. 'Medium_Portfolio_Excess_Return' does not Granger-cause 'WML'. |
| High_Portfolio_Excess_Return | WML | 3.634 | 0.057 | 1 | Fail to reject H0. 'High_Portfolio_Excess_Return' does not Granger-cause 'WML'. |
Table 7.
Forecast Error Variance Decomposition (FEVD) at horizon 9 (i.e., the 10th period), summarizing the share of variance explained by each shock in the system for each endogenous variable.
Table 7.
Forecast Error Variance Decomposition (FEVD) at horizon 9 (i.e., the 10th period), summarizing the share of variance explained by each shock in the system for each endogenous variable.
| Variable (Response) | Medium_ER | High_ER | Mkt-RF | SMB | HML | RMW | CMA | WML |
| Medium_Portfolio_Excess_Return | 87.73% | 2.00% | 8.94% | 0.17% | 1.04% | 0.003% | 0.10% | 0.01% |
| High_Portfolio_Excess_Return | 27.74% | 68.96% | 2.95% | 0.04% | 0.25% | 0.02% | 0.01% | 0.03% |
| Mkt-RF | 51.45% | 0.44% | 46.98% | 0.80% | 0.10% | 0.01% | 0.19% | 0.03% |
| SMB | 9.72% | 1.28% | 16.42% | 72.23% | 0.07% | 0.20% | 0.07% | 0.01% |
| HML | 0.50% | 0.38% | 5.08% | 6.26% | 87.61% | 0.08% | 0.08% | 0.00% |
| RMW | 0.80% | 0.81% | 1.61% | 15.96% | 4.84% | 75.98% | 0.00% | 0.00% |
| CMA | 1.89% | 0.84% | 10.85% | 0.28% | 50.18% | 1.45% | 34.50% | 0.01% |
| WML | 3.35% | 0.24% | 0.09% | 3.48% | 7.75% | 0.50% | 4.11% | 80.48% |
Notes: All values are approximate and rounded to two decimal places.Values represent the percentage of forecast error variance in the row variable explained by shocks to the column variable after 10 periods (horizon 9).Medium_ER and High_ER refer to Medium and High Portfolio Excess Returns respectively.
Table 8.
GARCH and EGARCH Results – Medium Portfolio Excess Return.
| Model | Parameter | Coefficient | Std. Error | t-stat | p-value | 95% Conf. Interval |
| GARCH | mu | -1.2104 | 0.07308 | -16.562 | <0.0001 | [-1.354, -1.067] |
| omega | 0.0181 | 0.01054 | 1.717 | 0.0860 | [-0.0026, 0.0388] | |
| alpha[1] | 0.0532 | 0.01509 | 3.524 | 0.0004 | [0.0236, 0.0827] | |
| beta[1] | 0.9408 | 0.01715 | 54.864 | <0.0001 | [0.907, 0.974] | |
| nu | 20.6766 | 10.572 | 1.956 | 0.0505 | [-0.044, 41.397] | |
| Metrics | Log-Likelihood | -2986.77 | ||||
| AIC | 5983.55 | |||||
| BIC | 6010.58 | |||||
| Model | Parameter | Coefficient | Std. Error | t-stat | p-value | 95% Conf. Interval |
| EGARCH | Mu | -1.2061 | 0.07459 | -16.170 | <0.0001 | [-1.352, -1.060] |
| omega | 0.0109 | 0.00622 | 1.752 | 0.0798 | [-0.0013, 0.0231] | |
| alpha[1] | 0.1453 | 0.03324 | 4.372 | <0.0001 | [0.0802, 0.210] | |
| beta[1] | 0.9861 | 0.00665 | 148.36 | <0.0001 | [0.973, 0.999] | |
| Nu | 19.5014 | 9.487 | 2.056 | 0.0398 | [0.907, 38.095] | |
| Metrics | Log-Likelihood | -2990.56 | ||||
| AIC | 5991.12 | |||||
| BIC | 6018.15 | |||||
Table 9.
GARCH and EGARCH Results – High Portfolio Excess Return.
| Model | Parameter | Coefficient | Std. Error | t-stat | p-value | 95% Conf. Interval |
| GARCH | mu | -1.0151 | 0.06312 | -16.081 | <0.0001 | [-1.139, -0.891] |
| omega | 0.0549 | 0.06289 | 0.873 | 0.3830 | [-0.0684, 0.178] | |
| alpha[1] | 0.0327 | 0.02090 | 1.562 | 0.1180 | [-0.0083, 0.0736] | |
| beta[1] | 0.9581 | 0.03087 | 31.036 | <0.0001 | [0.898, 1.019] | |
| nu | 6.5060 | 0.967 | 6.728 | <0.0001 | [4.611, 8.401] | |
| Metrics | Log-Likelihood | -3636.06 | ||||
| AIC | 7282.11 | |||||
| BIC | 7309.14 | |||||
| Model | Parameter | Coefficient | Std. Error | t-stat | p-value | 95% Conf. Interval |
| EGARCH | mu | -1.0168 | 0.06738 | -15.091 | <0.0001 | [-1.149, -0.885] |
| omega | 0.0292 | 0.01999 | 1.463 | 0.1440 | [-0.0099, 0.0684] | |
| alpha[1] | 0.0930 | 0.03819 | 2.435 | 0.0149 | [0.0182, 0.168] | |
| beta[1] | 0.9846 | 0.01146 | 85.898 | <0.0001 | [0.962, 1.007] | |
| nu | 6.6073 | 0.990 | 6.677 | <0.0001 | [4.668, 8.547] | |
| Metrics | Log-Likelihood | -3635.27 | ||||
| AIC | 7280.53 | |||||
| BIC | 7307.56 | |||||
Table 10.
GJR-GARCH Leverage Effects – Medium Portfolio and High Portfolio.
| Portfolio | Gamma (Leverage) | P-Value |
| Medium_Portfolio_Excess_Return | -0.000326 | 0.9700 |
| High_Portfolio_Excess_Return | -0.000609 | 0.9361 |
Disclaimer/Publisher’s Note: The statements, opinions and data contained in all publications are solely those of the individual author(s) and contributor(s) and not of MDPI and/or the editor(s). MDPI and/or the editor(s) disclaim responsibility for any injury to people or property resulting from any ideas, methods, instructions or products referred to in the content. |
© 2025 by the authors. Licensee MDPI, Basel, Switzerland. This article is an open access article distributed under the terms and conditions of the Creative Commons Attribution (CC BY) license (http://creativecommons.org/licenses/by/4.0/).
Copyright: This open access article is published under a Creative Commons CC BY 4.0 license, which permit the free download, distribution, and reuse, provided that the author and preprint are cited in any reuse.


