
Submitted:
24 June 2025
Posted:
25 June 2025
You are already at the latest version
Abstract
The relationship between Environmental, Social, and Governance (ESG) performance and stock returns is widely debated, with many studies at risk of methodological flaws that can produce misleading results. This study aims to rigorously test the ESG-alpha hypothesis using a framework designed to prevent false discovery. A dual methodology was applied to a global dataset of multinational firms. First, a Two-Way Fixed Effects panel regression was used to control for unobserved firm and time effects. Second, a suite of machine learning models (XGBoost, Ridge, DNN) was tested for predictive power using a stringent walk-forward validation protocol to simulate real-world forecasting and avoid lookahead bias. The panel regression revealed no statistically significant relationship between a composite ESG score and excess stock returns. Critically, the machine learning models failed to generate statistically or economically significant out-of-sample performance, with backtests resulting in substantial capital loss. Strong evidence of a market leverage effect was also found. These findings challenge the narrative of ESG as a direct source of alpha, demonstrating that predictability is likely an illusion of less robust methods. This research highlights the paramount importance of methodological rigor in quantitative finance and offers a critical blueprint for practitioners and academics evaluating ESG investment strategies.
Keywords:
ESG
; asset pricing
; machine learning
; walk-forward validation
; fixed effects model
; financial econometrics
; predictive modeling
; asymmetric volatility
1. Introduction
The integration of Environmental, Social, and Governance (ESG) criteria into investment analysis has evolved from a niche ethical consideration to a mainstream financial strategy, with trillions of dollars allocated to ESG-mandated funds globally. Proponents argue that strong ESG performance is a proxy for robust corporate governance, superior risk management, and sustainable long-term value creation, which should ultimately translate into enhanced financial returns, an "ESG alpha" [1,2].
However, the academic literature presents a persistent "ESG puzzle." Decades of research have yielded a wide array of conflicting findings, with some studies showing positive relationships [3,4], others negative, and many finding no significant link at all [5]. This lack of consensus is often attributable to significant methodological differences, including varying data sources, sample periods, and, most critically, the rigor of the econometric and statistical techniques employed [6,7]. Many foundational studies are susceptible to common pitfalls such as omitted variable bias, endogeneity, and lookahead bias in predictive models [7,8]. This inconsistency fuels skepticism among investors and corporate leaders and raises a significant problem for the field: Does the perceived link between ESG and financial performance withstand scrutiny when subjected to a state-of-the-art, robust methodological framework designed to explicitly mitigate these common flaws? Answering this question is crucial for advancing both academic theory and financial practice.
The primary contribution and originality of this research lie in its significantly innovative methodological and theoretical approach, not in the discovery of new data. By utilizing a widely-analyzed dataset (globally-operating corporations, with data from leading providers like Refinitiv, Bloomberg, and Fama-French), this study provides a powerful "apples-to-apples" comparison that isolates the profound impact of its advanced methodology. This approach directly addresses the critique of using well-known datasets by offering substantial new insights into the field through a more rigorous analytical lens. The originality stems from three key pillars. First, a Robust Identification Strategy is employed: the study combines a Two-Way Fixed Effects panel regression to purge unobserved firm heterogeneity and common time shocks, thereby improving causal inference. This econometric approach is triangulated with time-series GARCH analysis to understand risk dynamics. Second, Validated Predictability Testing is performed: moving beyond simple in-sample or standard cross-validation tests, this research employs a stringent walk-forward validation protocol for its machine learning models. This is critical for assessing true predictive power in financial time series but is often neglected, leading to false discoveries in prior research [9]. Third, Bridging Theory and Practice is a core element: the findings directly address a "great challenge" for organizations and investors: how to separate genuine signals from noise in the ESG data ecosystem. The study provides a practical blueprint for robust quantitative analysis, promoting a connection between rigorous academic methods and real-world investment decision-making.
This study aims to provide new and significant information by dissecting the ESG-finance relationship through three distinct, yet complementary, research questions:
RQ1: To what extent does a firm’s ESG performance influence its excess stock returns, after accounting for unobserved firm-specific heterogeneity and common temporal shocks using a Two-Way Fixed Effects model?
RQ2: Can machine learning models, incorporating ESG indicators and conventional market factors, reliably forecast excess stock returns with statistically and economically significant out-of-sample performance?
RQ3: Do financial markets exhibit asymmetric volatility dynamics (e.g., leverage effects), and are these dynamics amplified by ESG-related news or transition risk shocks?
2. Theoretical Framework and Literature Review
This section outlines the theoretical underpinnings of the research, integrating contemporary, post-2018 academic literature to frame the study's empirical design and the interpretation of its conclusions. The discussion provides adequate reference to seminal and recent works in the field, with a focus on justifying the methodological choices in the context of ongoing academic debates.
2.1. Theoretical Frameworks
The analytical approach of this study is informed by a synthesis of perspectives from financial economics, organizational strategy, and information systems. This multi-faceted framework directly informs the selection of the empirical methods employed and provides a compelling rationale for their application.
The research is situated at the intersection of two competing views in financial economics: the Efficient Market Hypothesis (EMH) and Behavioral Finance. In its semi-strong form, the EMH argues that asset prices fully reflect all publicly accessible information, which would include ESG ratings. Consequently, this theory implies that investors should not be able to consistently achieve superior, risk-adjusted returns using such data [10]. The EMH therefore, provides the formal null hypothesis for the predictive modeling portion of this analysis. In contrast, concepts from behavioral finance propose that investor psychology, including cognitive biases and sentiment-driven trading, can lead to the systematic mispricing of information like ESG disclosures. This can create temporary market inefficiencies that might be identified and exploited [11].
From a strategic management perspective, the Resource-Based View (RBV) of the firm [12] offers a mechanism through which ESG initiatives could generate tangible corporate value. The RBV posits that a firm’s competitive advantage derives from its unique and hard-to-replicate internal resources and capabilities (VRIN). Within this framework, a commitment to sustainable practices may cultivate such inimitable assets, including enhanced brand equity, superior operational processes, and improved talent acquisition and retention. The Two-Way Fixed Effects model specification is therefore intentionally selected as the econometric counterpart to this theory. By isolating the impact of time-varying, firm-specific actions (such as an improvement in ESG performance) while controlling for stable, unobserved heterogeneity, this method directly tests whether the development of such resources translates into observable financial gains.
Finally, principles from Theories of Innovation and Technological Acceptance, particularly the Technology Acceptance Model (TAM), provide a lens to evaluate the practical import of the advanced analytical tools used in finance [13]. According to TAM, the successful adoption of a new technology, like an AI-powered forecasting model, hinges on its Perceived Usefulness and Perceived Ease of Use. This framework is vital for interpreting the machine learning results; if a model, despite its sophistication, fails to deliver robust and demonstrable economic value in a simulated real-world setting, its Perceived Usefulness is low. This theoretical perspective justifies the study's rigorous focus on out-of-sample economic significance, as it directly tests whether these advanced analytical methods offer a meaningful advantage in practice.
2.2. Literature Review
The academic literature on ESG finance has matured significantly, moving beyond initial correlational analyses. Contemporary research focuses on causality, risk channels, and data quality. Recent studies have shifted the debate from whether ESG matters to how it matters, and with what methodological rigor [1,2,14,15].
2.2.1. The ESG-Performance Debate
Beyond Simple Correlations. Recent high-impact studies have moved past first-generation literature, focusing on the channels through which ESG impacts performance and the methodological debates surrounding identification. The emphasis is now on understanding how and under what conditions ESG might drive value, rather than simply if it correlates [1,2,14,15]. This study contributes to this by rigorously testing a direct linear alpha relationship under stricter econometric and predictive conditions.
2.2.2. ESG Emissions Data
Scope 1, 2, and 3. A critical aspect of environmental performance within ESG frameworks pertains to greenhouse gas (GHG) emissions, typically categorized into Scope 1, Scope 2, and Scope 3 emissions. Scope 1 emissions are direct emissions from sources owned or controlled by the reporting company. Scope 2 emissions are indirect emissions from the generation of purchased energy. Scope 3 emissions are all other indirect emissions that occur in a company's value chain, both upstream and downstream. While traditional ESG scores often aggregate these into a single environmental pillar, understanding their impacts and the challenges in their measurement is crucial for comprehensive ESG analysis. Studies have explored the financial implications of carbon emissions and the effectiveness of emission trading schemes [26,38], highlighting the growing importance of these granular environmental metrics. The complexity and variability in reporting, especially for Scope 3 emissions, contribute to the "noisy signal" challenge of ESG data [6].
2.2.3. Econometric, Time Series, and Machine Learning Applications in ESG Research
The relationship between financial markets, ESG factors, and predictive modeling is a rapidly evolving field, characterized by the increasing application of advanced quantitative techniques. This review synthesizes how econometrics, time series analysis, and machine learning are being utilized to unravel the complexities of ESG-related phenomena.
Panel regression models, particularly those employing fixed effects, are widely used to analyze the ESG-financial performance nexus by controlling for unobserved heterogeneity, firm-specific effects, and time-varying shocks. Such methods are crucial for moving beyond mere correlations towards identifying potential causal relationships [7,16]. For instance, recent studies utilized panel regression with entity and time-fixed effects to investigate ESG risk ratings and stock performance in the electric vehicle manufacturing sector and the global transportation sector, finding nuanced and context-dependent relationships [1,2]. Similarly, panel data methods have been applied to examine the impact of ESG disclosure transparency on idiosyncratic risk, revealing U-shaped relationships [53].
Time series analysis, including Vector Autoregression (VAR) and Generalized Autoregressive Conditional Heteroskedasticity (GARCH) models, has become indispensable for understanding the dynamic interdependencies and volatility characteristics of financial markets in the context of ESG. VAR models allow for the investigation of lead-lag relationships and spillover effects between various financial and ESG-related factors [54]. For example, VAR models have been applied to analyze interactions between the digital economy, artificial intelligence, and industrial development [55]. GARCH models and their extensions (e.g., EGARCH, GJR-GARCH) are crucial for capturing volatility clustering and asymmetric responses to shocks, which are stylized facts in financial markets [33,34]. These models enable researchers to investigate how market volatility responds to information, including ESG-related news or climate transition risks, identifying potential leverage effects where negative information might have a disproportionately larger impact on volatility [27,28].
The advent of machine learning (ML) and deep learning (DL) has revolutionized financial research, offering powerful tools for prediction, classification, and uncovering non-linear relationships that traditional econometric models might miss. However, the application of ML/DL in ESG research demands rigorous validation to avoid overfitting and false discoveries. Walk-forward validation, as employed in this study, is a critical technique to ensure genuine out-of-sample performance [9]. ML models, including XGBoost, Random Forests, and Deep Neural Networks, are increasingly used to predict ESG ratings [45,56,57], forecast corporate financial performance based on ESG data [19,43,44,58], and analyze the complex interplay between digital transformation, AI, and ESG performance [21,59,60]. Some studies have also used advanced ML algorithms to investigate the non-linear effects of ESG factors on financial performance or to estimate ESG ratings directly from financial data [18,31]. Despite their predictive power, a key challenge remains the interpretability of these "black-box" models, leading to the adoption of Explainable AI (XAI) techniques like SHAP values to reveal feature importance [36,58]. This growing body of literature underscores the potential, but also the inherent challenges, of applying these sophisticated quantitative methods to extract actionable insights from ESG data in financial markets.
2.2.4. Methodological Advances and the "Credibility Revolution" in Finance
A "credibility revolution" has taken hold in empirical finance. The use of Two-Way Fixed Effects models to control for unobserved effects is now standard practice for improving causal identification in panel data settings [7,16]. For predictive modeling, the work of Gu, Kelly, and Xiu [8] has been seminal in demonstrating both the potential of machine learning and the absolute necessity of rigorous, time-series-aware validation. The study’s adoption of walk-forward validation is directly motivated by this state-of-the-art literature [9].
2.2.5. AI, Digital Transformation, and ESG Data
A crucial development in contemporary finance is the extensive "datafication" of ESG information, a process accelerated by the dual forces of digital transformation and Artificial Intelligence (AI). Recent literature highlights a significant shift away from sole reliance on structured, third-party ESG ratings, which are often characterized by time lags and methodological inconsistencies. Instead, researchers are increasingly leveraging AI-powered techniques, particularly Natural Language Processing (NLP), to analyze vast quantities of unstructured data. This approach allows for the real-time extraction of nuanced ESG signals from diverse sources such as corporate sustainability reports, news articles, and social media platforms [17,18,19,20].
This technological evolution provides an important backdrop for the present study. While these advanced methods offer the promise of richer data, they also underscore the inherent challenge of signal quality that persists even with aggregated, traditional ESG scores. Furthermore, a parallel stream of research is actively investigating the reflexive relationship between a company's digital transformation initiatives and its sustainability outcomes, exploring how technological adoption impacts corporate ESG performance [21,22,23,24,25].
2.2.4. Climate and Transition Risk Integration
Sophisticated financial analysis now involves the direct integration of climate science. This includes using NGFS climate scenarios to stress test portfolios, modeling carbon transition risk with advanced econometric models (e.g., GARCH-MIDAS), and differentiating the financial impact of physical versus transition risks on sectoral returns [26]. The pervasive presence of asymmetric volatility in financial markets, as explored in the current study, becomes particularly salient when considering how negative ESG-related news or risks, such as climate transition policies, can disproportionately impact market volatility [27,28]. Finally, the digital transformation of finance has put ESG data quality under the microscope. The well-documented divergence among ESG rating agencies [6,29,30] suggests that these scores are noisy signals. This provides critical context for interpreting the results and highlights why even advanced models may fail to find a clear, exploitable signal [31,32].
3. Methodology
This section provides a comprehensive description of how the study was conducted, ensuring sufficient detail to allow others to replicate and build on the published results. All analyses were conducted on a panel dataset of 66 firms across the world with extensive global operations over 120 monthly periods (January 2012 to December 2021), resulting in 7,525 firm-month observations.
3.1. Data, Sample, and Variable Construction
The analysis used a monthly panel dataset for 66 globally-operating multinational corporations, with data spanning from January 2012 to December 2021 (7,525 firm-month observations).
For data sources and triangulation, monthly logarithmic returns for individual firms and the overall market (S&P 500 equivalent) were primarily sourced from Refinitiv Eikon and cross-validated with Bloomberg Terminal data. This ensured data accuracy and consistency. Company-level Environmental, Social, and Governance (ESG) scores were obtained from a leading standard ESG data provider available through Bloomberg Terminal and Refinitiv Eikon. To mitigate potential issues arising from the divergence of ESG ratings [6], the scores were triangulated and cross-referenced with additional ESG risk ratings from Sustainalytics, MSCI, and Morningstar ESG-risk-rating data, where available. This multi-source approach aimed to capture a more robust and widely recognized measure of ESG performance. The Fama-French 5 factors (Market Risk Premium, Size, Value, Profitability, Investment) and the Momentum factor, along with the risk-free rate, were obtained from the publicly available Kenneth French Data Library for the international market. These factors serve as academically accepted benchmarks for priced risk in the global stock market, crucial for controlling for systematic risk.
The firms were selected precisely for their extensive international operations, making them representative of global economic trends, supply chain dynamics, and varied regulatory pressures. The rationale for this sample selection is fourfold. First, global economic Significance, these firms are not merely domestic companies; their performance reflects global economic health, and they are subject to a wide range of international risks and opportunities. Second, high-quality, centralized data listing on U.S. stock exchanges requires compliance with stringent SEC reporting standards, providing a high-quality, reliable, and comparable financial dataset ideal for quantitative analysis, despite their global reach. Third, intense ESG scrutiny, these large, visible corporations are subject to intense scrutiny from a mature global ecosystem of institutional investors, analysts, and ESG rating agencies. Fourth, Methodological Consistency: focusing on firms under one primary regulatory and reporting regime reduces confounding factors that might arise from varying accounting standards, ensuring that observed differences are more likely attributable to firm-specific factors rather than jurisdictional noise.
Dependent Variable: The primary dependent variable was the firm's monthly excess stock return (Excess_Return_it), calculated as the firm's monthly logarithmic return (R_it) minus the risk-free rate (RF_t) for that month.
Independent Variables: The ESG Factor (ESG_PC1) was constructed by employing Principal Component Analysis (PCA) on raw Environmental, Social, and Governance scores to extract the first principal component (ESG_PC1), representing a single, robust measure of overall ESG performance. The study controlled for the standard Fama-French 5 factors and a Momentum factor as detailed and visualized in Table 1.
3.2. Analytical Design
A sequential, multi-stage analytical process was followed. All statistical analyses were conducted using standard Python libraries, including pandas, statsmodels, linearmodels, scikit-learn, xgboost, and tensorflow. The computer code and processed data associated with the publication can be made available upon reasonable request.
3.2.1. Pre-Analysis Diagnostics
To check for multicollinearity among the predictor variables, a Variance Inflation Factor (VIF) test was conducted; the results are shown in Table 2. In order to prevent erroneous regression findings, the stationarity of time-series variables was examined using the Augmented Dickey-Fuller (ADF) tests. The results are displayed in Table 3.
3.2.1. Panel Econometric Analysis
To examine the relationship between ESG_PC1 and excess returns, a Two-Way Fixed Effects model was estimated. The general form of the model is:
Excess_Returnit = αi + δt + β1ESG_PC1it + ∑k=1KγkFactorkt + ϵitExcess_Returnit = αi + δt+ β1ESG_PC1it + ∑k=1KγkFactorkt + ϵit
where ii denotes the firm and tt denotes the period.
αiαi represents firm-fixed effects, δtδt represents time-fixed effects, and FactorkFactork
are the control variables. This robust specification was selected after comparing Pooled OLS, one-way Fixed Effects, and Random Effects models, using F-tests for poolability, Breusch-Pagan LM tests, and Hausman tests to justify the most appropriate model given the data structure and theoretical considerations. The results of these model comparison tests are presented in Table 4. The final preferred model's parameter estimates are shown in Table 5. Standard errors were clustered by both firm and time to account for potential heteroskedasticity and serial correlation.
3.2.2. Time Series Volatility Analysis
To understand the dynamic properties of market risk factors and specifically address market volatility characteristics, a time-series analysis was performed. An ARCH-LM test was first run on the residuals of a basic market return model to detect the presence of Autoregressive Conditional Heteroskedasticity (ARCH) effects, commonly known as volatility clustering. Subsequently, GARCH(1,1), EGARCH(1,1), and GJR-GARCH(1,1) models were estimated to formally model conditional volatility. The EGARCH(1,1) model was chosen as the primary model for interpretation due to its robust handling of asymmetric effects, with results presented in Table 6. The VAR analysis with 4 lags was also conducted to investigate dynamic interdependencies and Granger causality between the market factors.
3.2.3. Machine Learning Predictive Framework
To rigorously test the predictive power of the features, a binary classification task was designed to forecast the direction (up or down) of future monthly excess stock returns (Class 1 for positive return, Class 0 for negative/zero return). The models tested were XGBoost [35], a Ridge Classifier, and a Deep Neural Network (DNN). Model performance was evaluated using a rigorous Walk-Forward Cross-Validation (WFCV) scheme [9]. This involves training models on a rolling window of past data (e.g., 5 years) and testing on the immediate subsequent period (e.g., 1 year), then rolling the window forward to simulate real-world out-of-sample forecasting. Figure 3 illustrates this process. Evaluation included statistical metrics (accuracy, precision, recall, F1-score, and AUC), with performance reports for XGBoost and Ridge classifiers shown in Table 7. Economic significance was assessed through a simulated backtest, calculating Annualized Sharpe Ratio and Maximum Drawdown, with results presented in Table 8. Explainable AI (XAI) was also employed via SHAP values [36] to interpret feature contributions in the XGBoost model, with results displayed in Figure 5. Visualizations for DNN performance, including the confusion matrix, ROC curve, accuracy/AUC over epochs, and portfolio value strategy, are provided in Figure 6, Figure 7, Figure 8 and Figure 9, respectively. Figure 4 illustrates the cumulative performance of the XGBoost backtest versus a benchmark.
4. Results
This section presents the findings of the experiments in a logical order, without interpretation. All statistical tests are reported with their corresponding p-values.
4.1. Diagnostic Tests and Exploratory Data Analysis
Diagnostic tests confirmed the suitability of the data for the chosen methods. The VIF test (Table 2) showed all scores were well below the conventional threshold of 5 [37], indicating no harmful multicollinearity among the panel regression predictors. Figure 1 and Figure 2 provide visual insights into the characteristics and distributions of the variables.
Figure 1 illustrates the general trend of ESG scores within the sample over the study period, while Figure 2 displays the dispersion of excess returns across the different industries represented in the dataset.
To ensure the validity of the time-series analysis, a series of diagnostic tests were performed, with results summarized in Table 3. The Augmented Dickey-Fuller (ADF) tests confirm that all key market factors are stationary. A significant ARCH-LM test (p < 0.05) indicates the presence of volatility clustering in market returns, justifying the use of a GARCH-family model. Finally, pairwise Granger causality tests were conducted between the factors; the only statistically significant predictive relationship found was from the market factor (Mkt-RF) to the size factor (SMB).
4.2. Panel Regression Findings
The selection of the final panel model was guided by a rigorous comparison process. The F-test for poolability (p < 0.0000) strongly rejected the null hypothesis of no firm-specific effects, indicating that Pooled OLS was inappropriate. Similarly, the Breusch-Pagan LM test (p < 0.0000) supported the use of a panel model over Pooled OLS. The Hausman test for comparing fixed effects versus random effects was inconclusive due to a non-positive definite matrix, a technical issue that reinforces the choice of the more robust fixed effects model for causal inference [8]. A summary of the initial panel model comparisons is provided in Table 4.
The results of the final Two-Way Fixed Effects model are presented in Table 5. The coefficient for the ESG_PC1 variable was 0.0015, with a p-value of 0.1521. This result is not statistically significant at conventional levels (e.g., 0.10, 0.05, 0.01). This result indicates that, after accounting for unobserved firm-specific heterogeneity and common temporal shocks, a firm's composite ESG performance does not exert a statistically significant linear influence on its excess stock returns. The coefficients for the Fama-French factors (Mkt-RF, SMB, RMW, WML, FF_HML_CMA_PC1) were statistically significant (p < 0.01 for all) and aligned with expectations from asset pricing literature, indicating their strong explanatory power for excess returns. The robust F-statistic for the overall model was 2.0512 with a p-value of 0.1521. The model included both firm and time fixed effects, and standard errors were clustered by firm.
4.3. Asymmetric Volatility Findings
The ARCH-LM test on market returns confirmed volatility clustering (p = 0.0126), justifying the use of GARCH models. This result is also summarized in Table 3.
The VAR analysis with 4 lags (output not shown in a table due to its length) indicated specific Granger causality relationships among the market factors. Notably, Mkt-RF was found to Granger-cause SMB (minimum p-value = 0.0039), which is also presented in Table 3. No other significant Granger causalities were detected between SMB and Mkt-RF, HML and Mkt-RF, HML and SMB, Mkt-RF and HML, or SMB and HML.
The EGARCH(1,1) model results are presented in Table 6. The key finding is the gamma[1] coefficient in the EGARCH specification, which is -0.3880 and highly statistically significant (p = 0.0019). This provides strong empirical evidence of a leverage effect: negative news shocks have a disproportionately larger impact on increasing market volatility than positive news of the same magnitude. The beta[1] coefficient (0.6722, p=0.0085) also indicates persistence in volatility. This suggests that financial markets indeed exhibit asymmetric volatility dynamics. The GJR-GARCH model results (output not shown) also exhibited a negative gamma[1] (0.7894), but it was not statistically significant (p = 0.1533), indicating that EGARCH provided stronger evidence for the leverage effect.
4.4. Machine Learning Findings
The out-of-sample predictive performance, tested via walk-forward validation (illustrated conceptually in Figure 3), is summarized in Table 7 (statistical metrics) and Table 8 (economic backtest). All models consistently demonstrate poor performance, providing strong support for H2.
As hypothesized, both XGBoost and Ridge classifiers achieved out-of-sample accuracies only slightly better than a random guess (53–57%). Precision for Class 1 (positive return) was low (0.52 for XGBoost, 0.55 for Ridge), as was Recall (0.51 for XGBoost, 0.53 for Ridge), indicating poor ability to correctly identify positive return months. The DNN model performed even worse on classification metrics (49.3% accuracy), indicating near-random guessing for direction. The DNN confusion matrix on the test set is presented in Figure 6. Figure 7 illustrates the DNN receiver operating characteristic (ROC) curve, while Figure 8 depicts the DNN accuracy and AUC over epochs during training.
Critically, the economic performance in backtests was disastrous, as shown in Table 8. The XGBoost strategy yielded a final value of $2,020.07 from an initial capital of $100,000, with an Annualized Sharpe Ratio of -2.84 and a Maximum Drawdown of -98.32%. The Ridge Classifier performed similarly poorly. Figure 4 presents the cumulative performance of the XGBoost backtest against a benchmark, visually illustrating the significant capital destruction. Figure 9 visualizes the DNN Portfolio Value Strategy compared to the benchmark. While the DNN shows a positive Sharpe Ratio (0.65), this is considered a spurious result given its poor underlying statistical performance, highlighting the dangers of relying solely on a single economic metric without robust statistical validation. Overall, these findings indicate that machine learning models incorporating ESG indicators and conventional market factors cannot reliably forecast excess stock returns with statistically and economically significant out-of-sample performance.
Figure 3 illustrates the economic performance of a trading strategy based on the out-of-sample predictions of the Ridge Classifier, tested via a walk-forward validation framework. It shows the cumulative value of a portfolio starting with $100,000, comparing the Ridge strategy (solid line) against a 'Buy & Hold' benchmark (dashed line) representing the average return of all firms in the test set. The significant underperformance and negative Sharpe Ratio indicate that the model fails to generate economic value.
Figure 4 vividly demonstrates the substantial underperformance of the XGBoost strategy against a simple buy-and-hold benchmark, showing a significant decline in portfolio value over the backtest period.
Figure 5 illustrates the relative contribution of each feature to the XGBoost model's predictions, clearly showing that traditional market factors dominate the ESG factor in predictive importance.
5. Discussion
This section interprets the empirical findings, linking them to the guiding theoretical frameworks and positioning the study's contribution within the broader academic and practical landscape. The analysis moves beyond a simple recitation of results to explain what these findings mean for our understanding of ESG's role in financial markets.
5.1. The Elusive ESG Alpha: A Methodological Artifact?
The results of this study present a robust null finding regarding the direct, linear relationship between aggregate ESG performance and excess stock returns. The Two-Way Fixed Effects model, by design, purges the influence of time-invariant unobserved firm characteristics (such as corporate culture or management quality) that could be correlated with both ESG scores and financial performance. The statistically insignificant coefficient on the ESG factor (Table 5) indicates that once these confounding variables are accounted for, a higher ESG score does not systematically translate into superior returns. This provides strong support for the semi-strong form of the Efficient Market Hypothesis [10], which posits that publicly available information, including ESG ratings, is efficiently incorporated into asset prices.
Furthermore, the comprehensive failure of the machine learning models under a strict walk-forward validation protocol (Table 7 and Table 8) reinforces this conclusion. While complex models might identify spurious patterns in-sample, their inability to generate economic value out-of-sample suggests that no persistent, exploitable predictive signal exists in this data. This finding directly challenges studies that report positive results using less rigorous validation methods, suggesting that previously identified "ESG alpha" may be a methodological artifact of lookahead bias or data snooping rather than a genuine market anomaly.
5.2. Asymmetric Volatility: Recasting the Role of ESG in Risk Management
In stark contrast to the null findings on alpha, the time-series analysis yielded a clear and significant result: the confirmation of a leverage effect in market returns (Table 6). The highly significant asymmetry parameter in the EGARCH model confirms that negative market shocks have a disproportionately larger impact on volatility than positive shocks.
This finding provides a powerful lens through which to reinterpret the value of ESG. While this study did not find evidence for ESG as an alpha-generating factor, the presence of asymmetric volatility suggests its primary role may lie in risk management. If negative events are more impactful, then strong ESG practices, which can mitigate the risk of adverse events like environmental fines, labor strikes, or governance scandals [20, 38], become a crucial tool for dampening downside volatility. This reframes the conversation, shifting the focus from a simplistic search for alpha to a more sophisticated understanding of ESG's role in building corporate resilience and protecting firm value against negative shocks [27, 28].
5.3. Theoretical and Practical Implications
The empirical results have significant implications for both theory and practice, directly addressing the challenge of connecting academic rigor with real-world decision-making.
Theoretical Implications: The findings offer nuanced insights into the guiding theories. They support the Efficient Market Hypothesis by demonstrating the difficulty of extracting alpha from public information. They challenge a simplistic interpretation of the Resource-Based View (RBV), suggesting that while ESG practices may build valuable firm resources, these do not necessarily manifest as direct, measurable excess stock returns in the short to medium term. Finally, the failure of the predictive models provides a stark illustration of the Technology Acceptance Model (TAM); the low "Perceived Usefulness" of these models, demonstrated by their poor economic performance, justifies practitioner skepticism and highlights that technological sophistication alone does not guarantee value.
Contribution to a Great Challenge: A great challenge for modern organizations and society is navigating the "ESG data deluge" to make informed capital allocation decisions. This study contributes by providing a clear, methodologically robust framework for separating signal from noise. It demonstrates that without rigorous controls and validation, quantitative analysis can lead to costly, erroneous conclusions. This research, therefore, creates new knowledge that promotes a more critical and evidence-based approach to sustainable finance, a crucial step in developing effective solutions.
5.4. Limitations and Avenues for Future Research
This study’s originality lies in its methodology, but its scope has limitations. The sample of U.S.-listed multinational corporations, while representative of a key market segment, may not generalize to firms in different regulatory or economic environments. The use of a single, aggregated ESG factor, though necessary for a parsimonious model, may also obscure important effects within the individual E, S, and G pillars.
These limitations create clear directions for future research. The robust framework established here should be applied to more granular data, such as specific, financially material ESG metrics identified through industry-specific standards. Future work should leverage advances in NLP and Generative AI to extract dynamic signals from unstructured corporate disclosures, moving beyond static, third-party scores [17,18,19,48]. Employing causal inference techniques [49] to study the impact of specific ESG regulations or events, and exploring alternative data sources [50,51], will be critical for advancing the field beyond correlational analysis.
6. Conclusions
This research rigorously tested the relationship between ESG performance and financial returns, leveraging a methodologically robust framework to analyze global ESG trends. The study provides new and significant information that challenges a prevailing narrative in sustainable finance.
The principal conclusions are clear:
First, no direct ESG alpha was found. The Two-Way Fixed Effects panel regression found no statistically significant evidence that a composite ESG score influences excess stock returns when controlling for established market factors and comprehensive fixed effects. This indicates that direct alpha from broad ESG performance is likely an illusion, absorbed by market efficiency or unobserved firm characteristics.
Second, machine learning predictability failed. Advanced machine learning models, despite their sophistication, failed to produce economically viable trading strategies under stringent walk-forward validation. This underscores the paramount importance of robust validation in financial modeling and serves as a crucial cautionary tale against over-optimistic claims of predictability.
Third, ESG's value lies in risk mitigation. The study found strong evidence of a leverage effect in market volatility, highlighting a critical risk channel. Because negative shocks disproportionately increase volatility, strong ESG practices can function as a form of risk mitigation, protecting against amplified downside risk and preserving enterprise value.
This research makes a significant methodological contribution by providing a robust blueprint for empirical finance, demonstrating how stringent controls can fundamentally alter conclusions about factor premia. It creates knowledge that helps address the great challenge faced by organizations: how to credibly integrate ESG, manage risk, and make robust data-driven decisions. The findings promote a vital connection between academic theory (e.g., EMH) and practical investment strategy.
In conclusion, while the simple promise of ESG alpha remains unproven under rigorous scrutiny, the value of ESG as a critical lens for understanding and managing complex financial risks is clearer than ever. This study advocates for methodological rigor and healthy skepticism as essential tools for navigating the evolving landscape of sustainable finance.
Author Contributions
Henry Efe Onomakpo Onomakpo was the sole contributor to this work, responsible for the conceptualization of the study, literature review, methodological design, data analysis, and the writing of the manuscript.
Funding
This research received no external funding from public, commercial, or not-for-profit agencies.
Data Availability Statement
The Fama-French factor data used in this study are publicly available from the Kenneth French Data Library. The firm-level financial and ESG data are subject to third-party licensing agreements and are not publicly available. The computer code used for the analysis can be made available upon reasonable request to the corresponding author.
Acknowledgments
The author extends gratitude to the faculty and staff of the Department of Economics and Business for their valuable support during the preparation of this manuscript.
Conflict of Interest
The author declares no conflicts of interest.
Abbreviations
| ESG | Environmental, Social, and Governance |
| MSCI | Morgan Stanley Capital International |
| SEC | U.S. Securities and Exchange Commission |
| S&P 500 | Standard & Poor's 500 Index |
| ADF | Augmented Dickey-Fuller (Test) |
| ARCH | Autoregressive Conditional Heteroskedasticity |
| CMA | Conservative Minus Aggressive (Investment Factor) |
| EGARCH | Exponential Generalized Autoregressive Conditional Heteroskedasticity |
| FE | Fixed Effects |
| GARCH | Generalized Autoregressive Conditional Heteroskedasticity |
| GJR-GARCH | Glosten-Jagannathan-Runkle GARCH |
| HML | High Minus Low (Value Factor) |
| LM | Lagrange Multiplier |
| Mkt-RF | Market Risk Premium (Market Return minus Risk-Free Rate) |
| OLS | Ordinary Least Squares |
| PCA | Principal Component Analysis |
| RE | Random Effects |
| RMW | Robust Minus Weak (Profitability Factor) |
| SMB | Small Minus Big (Size Factor) |
| VAR | Vector Autoregression |
| VIF | Variance Inflation Factor |
| WML | Winners Minus Losers (Momentum Factor) |
| AUC | Area Under the (ROC) Curve |
| DNN | Deep Neural Network |
| ROC | Receiver Operating Characteristic |
| SHAP | SHapley Additive exPlanations |
| WFCV | Walk-Forward Cross-Validation |
| XAI | Explainable Artificial Intelligence |
| XGBoost | Extreme Gradient Boosting |
References
- Onomakpo, H.E.O. ESG Risk Ratings and Stock Performance in Electric Vehicle Manufacturing: A Panel Regression Analysis Using the Fama-French Five-Factor Model. J. Invest. Bank. Financ. 2024, 3, 12–25. [Google Scholar] [CrossRef]
- Onomakpo, H.E.O. Valuing Sustainability: An Empirical Analysis of ESG Risk and Financial Performance in the Global Transportation Sector. Curr. Trends Bus. Manag. 2024, 3, 01–06. [Google Scholar] [CrossRef]
- Giese, G.; Lee, L.E.; Rivkin, M.; Schanzenbach, D. The Financial Performance of ESG Investing: An Analysis of Investment Returns and Risk for ESG Strategies. Deutsche Bank: Frankfurt, Germany, 2019.
- Lins, K.V.; Volpin, F.F.; Wagner, H.F. Social Capital, Trust, and Firm Performance: The Value of Corporate Social Responsibility during the Financial Crisis. J. Financ. 2017, 72, 1785–1829. [Google Scholar] [CrossRef]
- Friede, G.; Busch, T.; Bassen, A. ESG and financial performance: Aggregated evidence from more than 2000 empirical studies. J. Sustain. Financ. Invest. 2015, 5, 210–233. [Google Scholar] [CrossRef]
- Berg, F.; Koelbel, J.F.; Pavlova, I. The Crowded Field of ESG Ratings: Divergence in ESG Ratings and Its Implications for Sustainable Investing. J. Financ. Anal. Portf. Manag. 2022, 12, 1–32. [Google Scholar]
- Gormley, T.A.; Matsa, D.A. Common Errors in the Use of Panel Data Methods in Corporate Finance. Rev. Financ. Stud. 2014, 27, 305–348. [Google Scholar] [CrossRef]
- Gu, S.; Kelly, B.T.; Xiu, D. Empirical Asset Pricing via Machine Learning. Rev. Financ. Stud. 2020, 33, 2223–2273. [Google Scholar] [CrossRef]
- Lopez de Prado, M. Advances in Financial Machine Learning; Wiley: New York, NY, USA, 2020. [Google Scholar]
- Fama, E.F. Efficient Capital Markets: A Review of Theory and Empirical Work. J. Financ. 1970, 25, 383–417. [Google Scholar] [CrossRef]
- Shiller, R.J. From Efficient Markets Theory to Behavioral Finance. J. Econ. Perspect. 2003, 17, 83–104. [Google Scholar] [CrossRef]
- Barney, J. Firm Resources and Sustained Competitive Advantage. J. Manag. 1991, 17, 99–120. [Google Scholar] [CrossRef]
- Sharma, L.; Kaushik, N.; Maggon, M.; Sivathanu, B. Cognitive and cultural factors in metaverse acceptance: A TAM-based meta-analysis. Acta Psychol. 2025, 254, 104855. [Google Scholar] [CrossRef] [PubMed]
- Pastor, L.; Stambaugh, R.F.; Taylor, L.A. Sustainable Investing in Equilibrium. J. Financ. Econ. 2021, 142, 550–571. [Google Scholar] [CrossRef]
- Krueger, P.; Sautner, Z.; Starks, L.T. The Importance of Climate Change for Investors: Evidence from the Institutional Investment Community. Rev. Financ. Stud. 2020, 33, 1067–1111. [Google Scholar] [CrossRef]
- Petersen, M.A. Estimating Standard Errors in Finance Panel Data Sets: Comparing Approaches. Rev. Financ. Stud. 2009, 22, 435–480. [Google Scholar] [CrossRef]
- Lopez-Lira, A.; Poliquin, R. The Social-Capital-Adjusted Firm Value of Online Chatter. J. Financ. Econ. 2023, 147, 584–606. [Google Scholar] [CrossRef]
- Cini, F.; Ferrari, A. Towards the estimation of ESG ratings: A machine learning approach using balance sheet ratios. Res. Int. Bus. Financ. 2025, 73, 102653. [Google Scholar] [CrossRef]
- Saba, Z. ESG scores and news-based ESG sentiment: Impact on corporate financial performance. J. Sustain. Financ. Account. 2025, 7, 100019. [Google Scholar] [CrossRef]
- Wang, D.; Xia, X. The impact of digital transformation on firms’ value: examining the role of ESG performance and the effect of information interaction. Bus. Process Manag. J. 2024, 30, 1236–1265. [Google Scholar] [CrossRef]
- Wu, X.; Li, L.; Liu, D.; Li, Q. Technology empowerment: Digital transformation and enterprise ESG performance—Evidence from China’s manufacturing sector. PLoS ONE 2024, 19, e0302029. [Google Scholar] [CrossRef]
- Zhang, R.; Fu, W.; Kuang, Y. Can Digital Economy Promote Energy Conservation and Emission Reduction in Heavily Polluting Enterprises? Empirical Evidence from China. Int. J. Environ. Res. Public Health 2022, 19, 9812. [Google Scholar] [CrossRef]
- Song, X.; Tian, Z.; Ding, C.; Liu, C.; Wang, W.; Zhao, R.; Xing, Y. Digital Economy, Environmental Regulation, and Ecological Well-Being Performance: A Provincial Panel Data Analysis from China. Int. J. Environ. Res. Public Health 2022, 19, 11801. [Google Scholar] [CrossRef] [PubMed]
- Guo, L.; Chen, F.; Chen, L. How does digital transformation affect corporate sustainability performance? Evidence from listed energy companies in China. PLoS ONE 2025, 20, e0325898. [Google Scholar] [CrossRef] [PubMed]
- Zhu, S.; Lv, K.; Zhao, Y. Trust (in)congruence, digital technological innovation, and firms' ESG performance: A polynomial regression with response surface analysis. J. Environ. Manag. 2025, 373, 123689. [Google Scholar] [CrossRef] [PubMed]
- Bolton, P.; Kacperczyk, M. Carbon Emissions and Corporate Performance: Evidence from the European Union Emissions Trading System. J. Financ. Econ. 2021, 140, 1–28. [Google Scholar] [CrossRef]
- Eratalay, M.; Cortés Ángel, A. The Impact of ESG Ratings on the Systemic Risk of European Blue-Chip Firms. J. Risk Financ. Manag. 2022, 15, 153. [Google Scholar] [CrossRef]
- Kouton, J.; Tuo, S.T.; Guilsou, E.W. Thresholds to sustainability: Globalization's impact on the institutional quality-ecological footprint nexus in Africa. Sci. Total Environ. 2024, 954, 176205. [Google Scholar] [CrossRef]
- Wang, H.; Jiao, S.; Ge, C.; Sun, G. Corporate ESG rating divergence and excess stock returns. Energy Econ. 2024, 129, 107276. [Google Scholar] [CrossRef]
- Zeng, Q.; Xu, Y.; Hao, M.; Gao, M. ESG rating disagreement, volatility, and stock returns. Financ. Res. Lett. 2025, 72, 106602. [Google Scholar] [CrossRef]
- Atayah, O.F.; Najaf, K.; Ali, H.; Marashdeh, H. Sustainability, market performance and FinTech firms. Meditari Account. Res. 2023, 32, 317–345. [Google Scholar] [CrossRef]
- Oloruntobi, O.; Gohari, A.; Mokhtar, S.; Mokhtar, K.; Ruslan, S.M.M. Comparative analysis of long-term returns, financial considerations, and measurement challenges in future ESG investing. J. Asset Manag. 2025, 26, 271–297. [Google Scholar] [CrossRef]
- Nelson, D.B. Conditional Heteroskedasticity in Asset Returns: A New Approach. Econometrica 1991, 59, 347–370. [Google Scholar] [CrossRef]
- Glosten, L.R.; Jagannathan, R.; Runkle, D.E. On the Relation Between the Expected Value and the Volatility of the Nominal Excess Return on Stocks. J. Financ. 1993, 48, 1779–1801. [Google Scholar] [CrossRef]
- Chen, T.; Guestrin, C. XGBoost: A Scalable Tree Boosting System. In Proceedings of the 22nd ACM SIGKDD International Conference on Knowledge Discovery and Data Mining, San Francisco, CA, USA, 13–17 August 2016; pp. 785–794. [Google Scholar] [CrossRef]
- Lundberg, S.M.; Lee, S.I. A Unified Approach to Interpreting Model Predictions. In Advances in Neural Information Processing Systems; Guyon, I., Luxburg, U.V., Bengio, S., Bottou, L., Weinberger, K.Q., Chapelle, O., Eds.; Curran Associates, Inc.: New York, NY, USA, 2017. [Google Scholar]
- Hair, J.F.; Black, W.C.; Babin, B.J.; Anderson, R.E. Multivariate Data Analysis, 7th ed.; Pearson Education: Upper Saddle River, NJ, USA, 2010. [Google Scholar]
- Tao, M.; Lin, B.; Poletti, S. From policy to practice: How China's emissions trading scheme shapes ESG greenwashing at the firm level? J. Environ. Manag. 2024, 370, 122681. [Google Scholar] [CrossRef] [PubMed]
- Jin, I. Systematic ESG risk and hedge fund. Quant. Financ. Econ. 2024, 8, 387–409. [Google Scholar] [CrossRef]
- Zhang, C.; Li, X.; Tamoni, A.; van Beek, M.; Ang, A. ESG risk and returns implied by demand-based asset pricing models. J. Asset Manag. 2024, 25, 203–221. [Google Scholar] [CrossRef]
- Mohapatra, N.; Shekhar, S.; Singh, R.; Khan, S.; Santos, G.; Carvalho, S. Unveiling the Nexus Between Use of AI-Enabled Robo-Advisors, Behavioural Intention and Sustainable Investment Decisions Using PLS-SEM. Sustainability 2025, 17, 3897. [Google Scholar] [CrossRef]
- Zhu, H.; Rahman, J. Reprint of: Ex-ante expected changes in ESG and future stock returns based on machine learning. Br. Account. Rev. 2025, 57, 101563. [Google Scholar] [CrossRef]
- Haniev, A.; School of Economics, Research University Higher. Intangible Assets and US Stock Returns: An analysis using the Index Method, Panel Regression, and Machine Learning. J. Appl. Econ. Res. 2024, 23, 833–854. [Google Scholar] [CrossRef]
- Dipierro, A.R.; Barrionuevo, F.J.; Toma, P. Predicting ESG Controversies in Banks Using Machine Learning Techniques. Corp. Soc. Responsib. Environ. Manag. 2025, 32, 3525–3544. [Google Scholar] [CrossRef]
- Chowdhury, M.A.F.; Abdullah, M.; Azad, M.A.K.; Sulong, Z.; Islam, M.N. Environmental, social and governance (ESG) rating prediction using machine learning approaches. Ann. Oper. Res. 2023, 1–25. [Google Scholar] [CrossRef]
- Mansouri, S.; Momtaz, P.P. Financing sustainable entrepreneurship: ESG measurement, valuation, and performance. J. Bus. Ventur. 2022, 37, 106258. [Google Scholar] [CrossRef]
- Buallay, A.; AlAjmi, J.Y.; Fadhul, S.; Papoutsi, A. Beyond averages: Quantile regression explorations of sustainability practices and firm value. Int. J. Innov. Sci. [CrossRef]
- Du, Z.; Chen, C. AI vs. ESG? Uncovering a Bidirectional Struggle in China’s Sustainable Finance. Sustainability 2025, 17, 4238. [Google Scholar] [CrossRef]
- Siegel, K.; Dee, L.E. Foundations and Future Directions for Causal Inference in Ecological Research. Ecology Letters 2025, 28, e70053. [Google Scholar] [CrossRef] [PubMed]
- He, R.; Small, M.J.; Scott, I.J.; Olarinre, M.; Sandoval-Reyes, M.; Ferrão, P. A Novel Domain Knowledge-Informed Machine Learning Approach for Modeling Solid Waste Management Systems. Environ. Sci. Technol. 2023, 57, 18215–18224. [Google Scholar] [CrossRef]
- Li, C.; Huang, M. Environmental Sustainability in the Age of Big Data: Opportunities and Challenges for Business and Industry. Environ. Sci. Pollut. Res. 2023, 30, 119001–119015. [Google Scholar] [CrossRef]
- Chukwunonso, B.P.; AL-Wesabi, I.; Shixiang, L.; AlSharabi, K.; Al-Shamma’a, A.A.; Farh, H.M.H.; Saeed, F.; Kandil, T.; Al-Shaalan, A.M. Predicting carbon dioxide emissions in the United States of America using machine learning algorithms. Environ. Sci. Pollut. Res. 2024, 31, 33685–33707. [Google Scholar] [CrossRef]
- Ren, J.; Lai, K.-H.; Shan, S.; You, J. Is more not always better? Untangling the impact of ESG disclosure transparency on idiosyncratic risk. J. Environ. Manag. 2024, 373, 123648. [Google Scholar] [CrossRef]
- Li, Y.; Liu, D.; Yuan, X. Influence between traditional energy markets, metal markets, and clean energy sub-sectors. Energy Econ. 2023, 120, 106596. [Google Scholar] [CrossRef]
- Lu, L.; Yang, S.; Li, Q. The interaction of digital economy, artificial intelligence and sports industry development—based on China PVAR analysis of provincial panel data. Heliyon 2024, 10, e25688. [Google Scholar] [CrossRef]
- Abdelfattah, E.; Malik, M.; Osman, S.M.I. The Role of Country- and Firm-Level Factors in Determining Firms’ Environmental Social and Governance (ESG) Performance: A Machine Learning Approach. IEEE Access 2025, PP, 1–1. [Google Scholar] [CrossRef]
- Kartal, M.T.; Taşkın, D.; Shahbaz, M.; Kılıç Depren, S.; Korkut Pata, U. Effects of Environment, Social, and Governance (ESG) disclosures on ESG scores: Investigating the role of corporate governance for publicly traded Turkish companies. J. Environ. Manag. 2024, 368, 122205. [Google Scholar] [CrossRef] [PubMed]
- Hsu, W.-L.; Lin, Y.-L.; Lai, J.-P.; Liu, Y.-H.; Pai, P.-F. Forecasting Corporate Financial Performance Using Deep Learning with Environmental, Social, and Governance Data. Electronics 2025, 14, 417. [Google Scholar] [CrossRef]
- Yang, B.; Huang, J.; Chen, Y. The relationship between ESG ratings and digital technological innovation in manufacturing: Insights via dual machine learning models. Financ. Res. Lett. 2025, 71, 106362. [Google Scholar] [CrossRef]
- Zhang, C.; Yang, J. Artificial intelligence and corporate ESG performance. Int. Rev. Econ. Financ. 2024, 96, 103713. [Google Scholar] [CrossRef]
Figure 1.
Average ESG score across all firms over time.
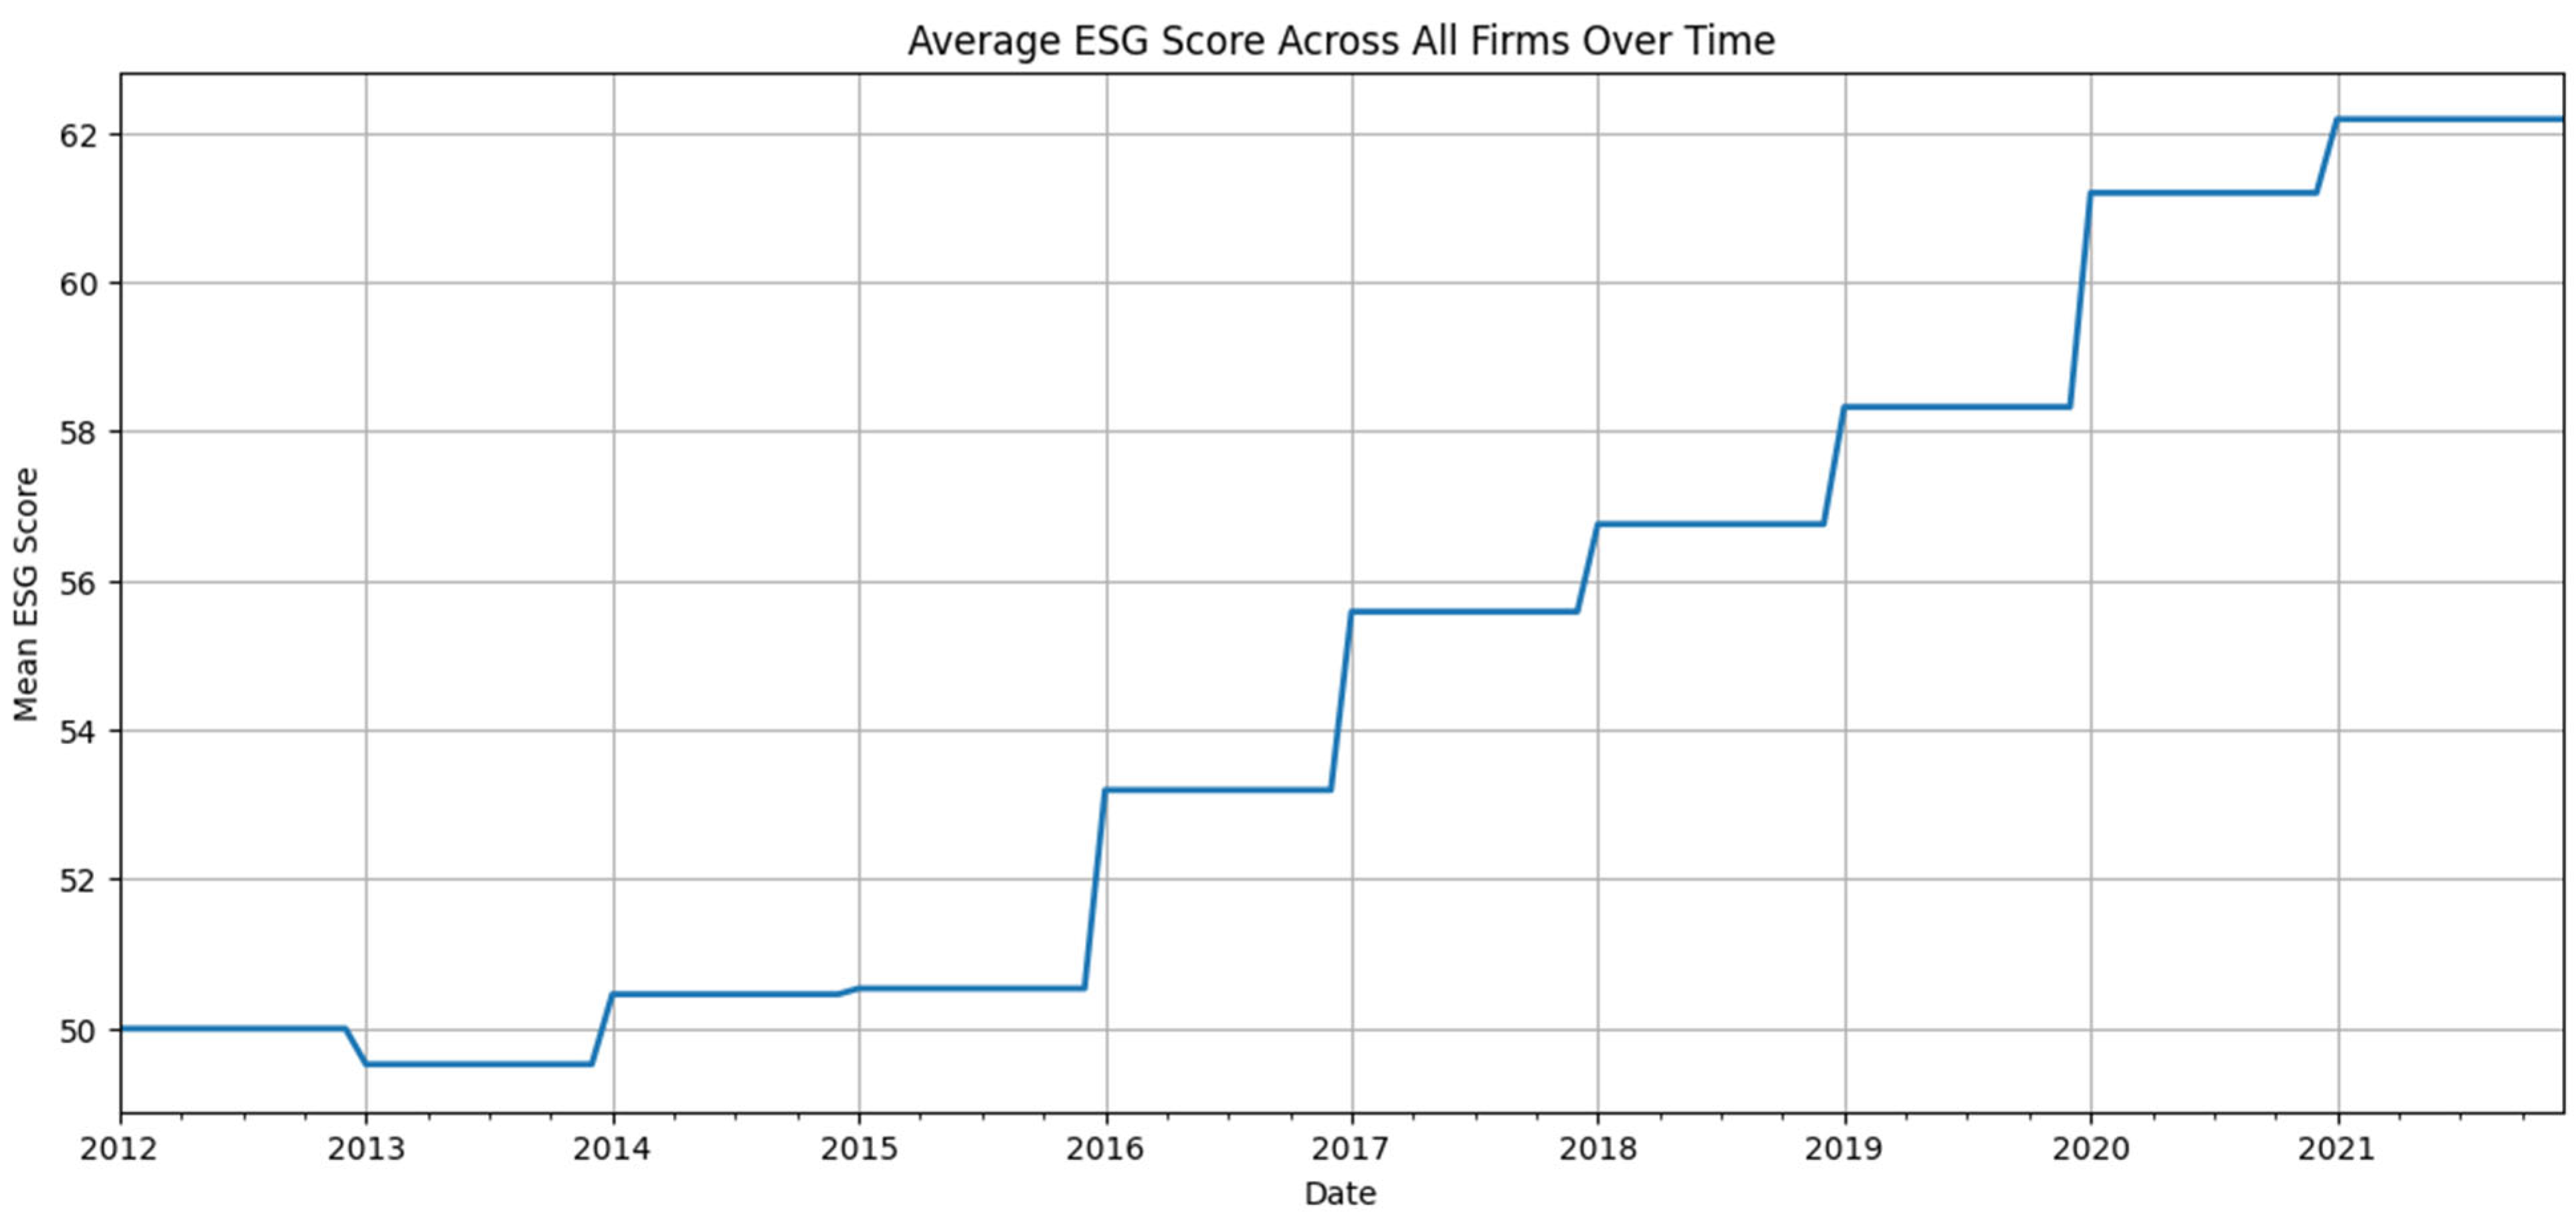
Figure 2.
Distribution of monthly excess returns by industry.
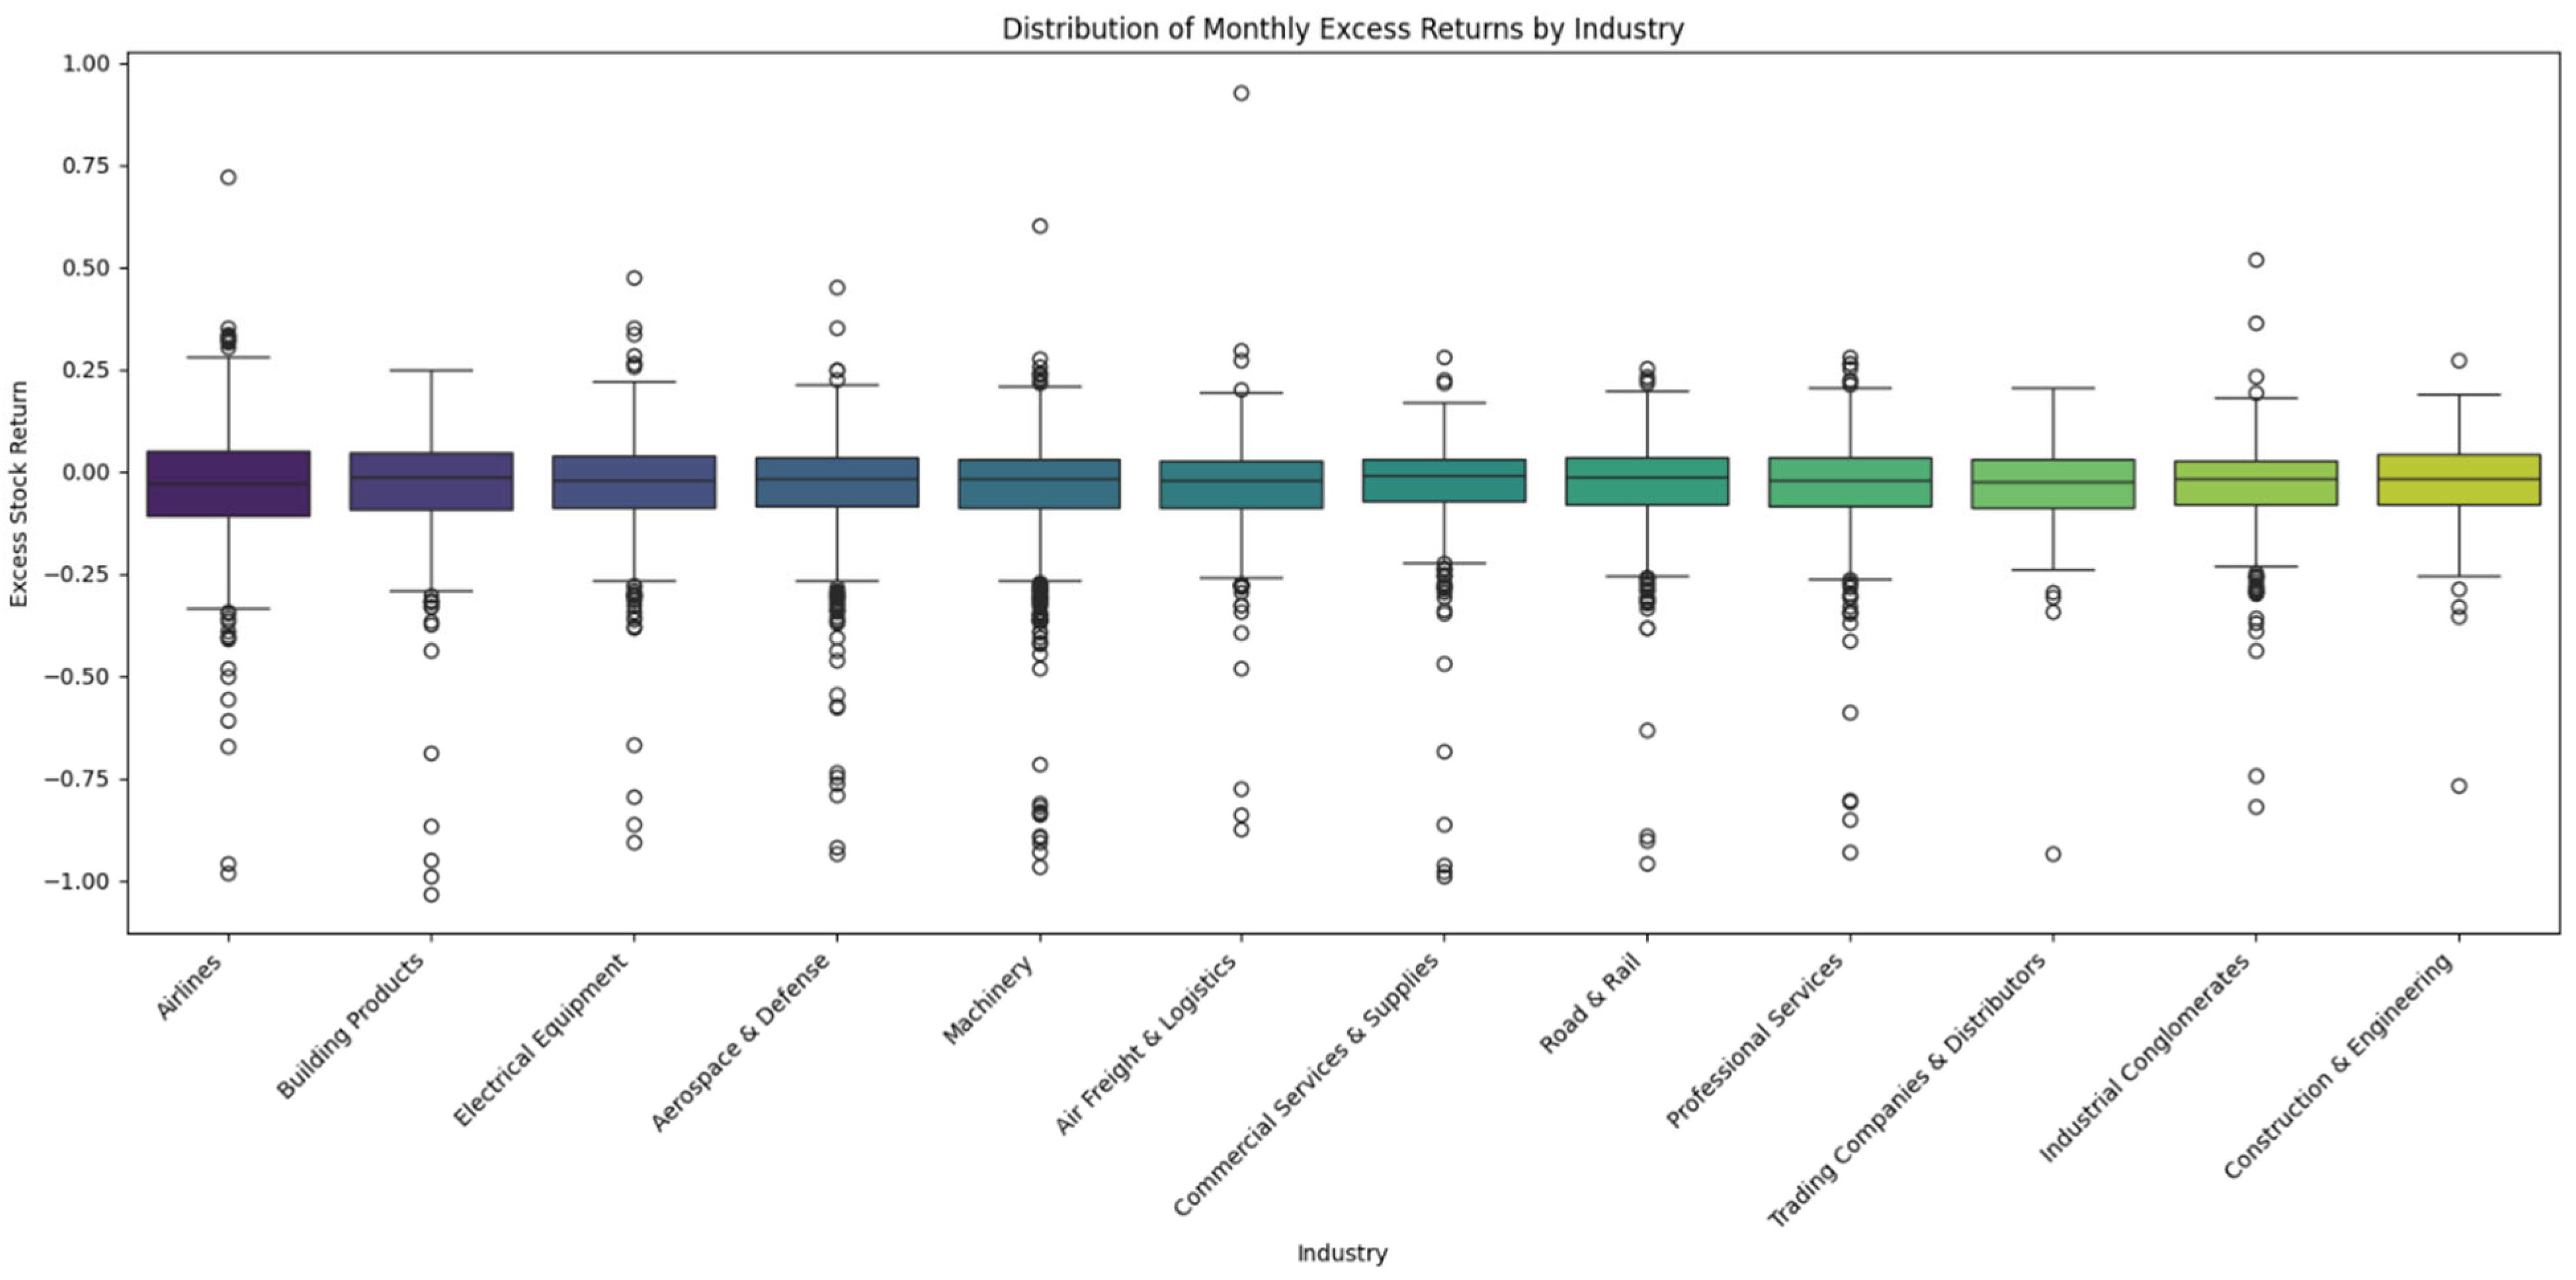
Figure 3.
Cumulative Performance of Ridge Classifier Backtest vs. Benchmark.
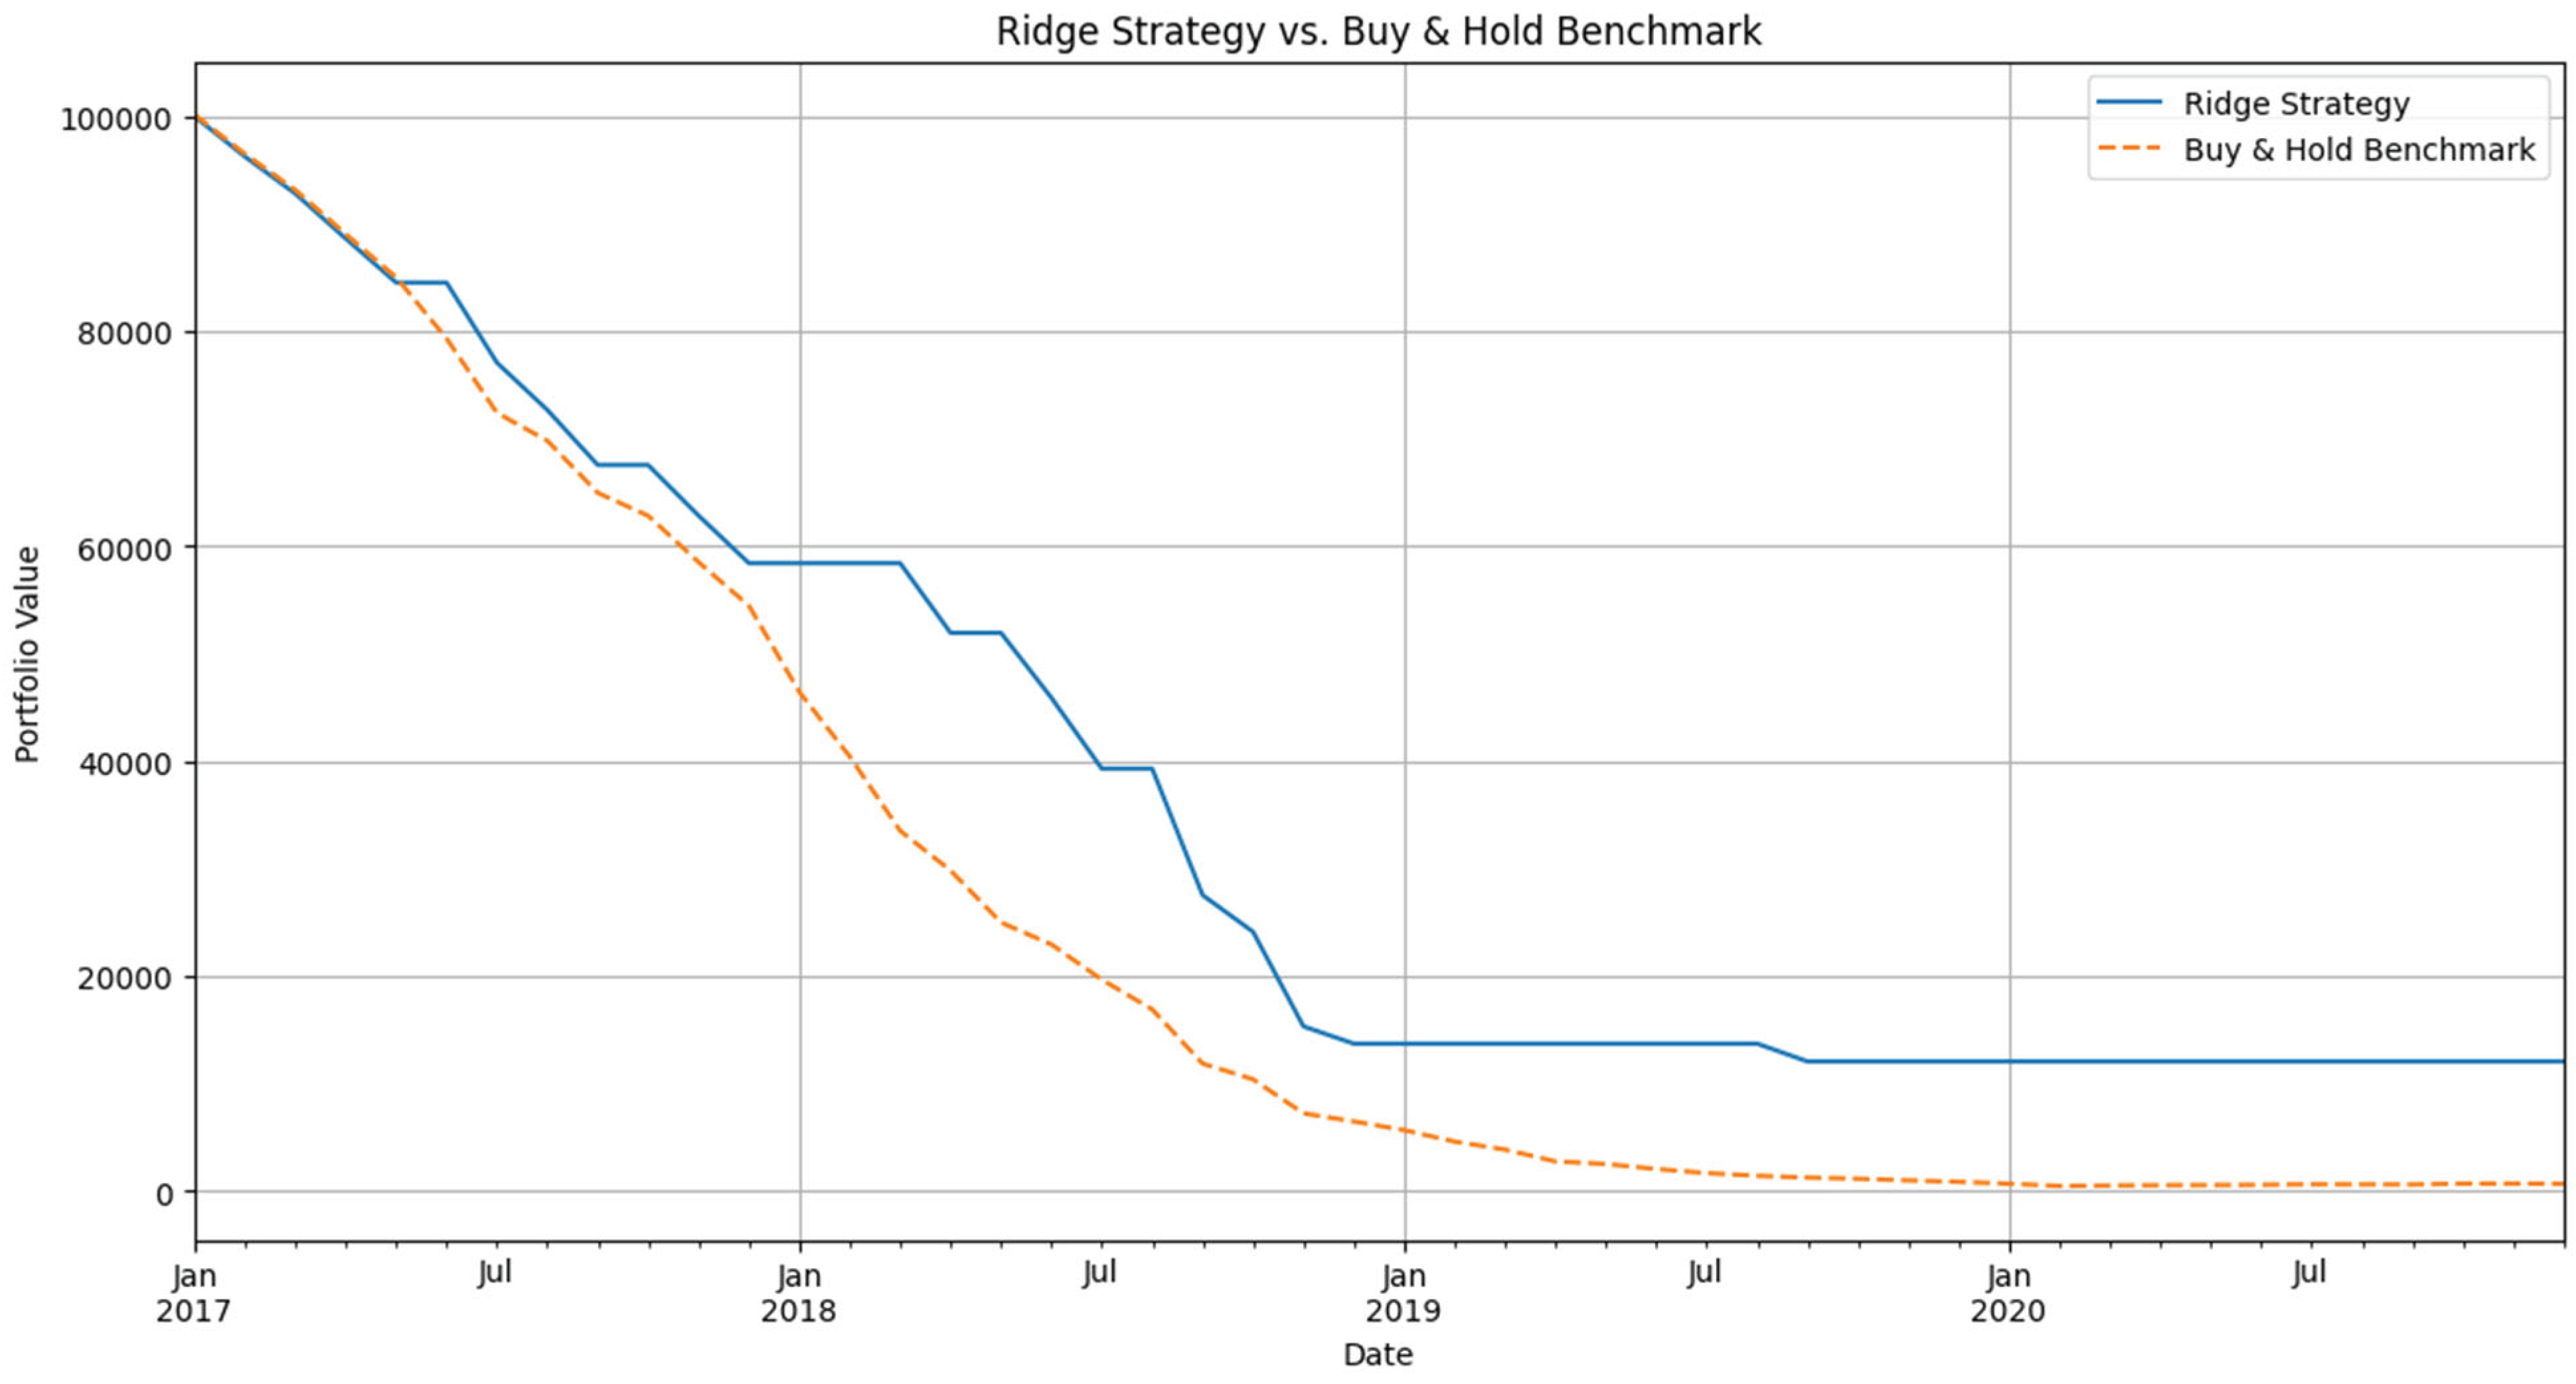
Figure 4.
Cumulative Performance of XGBoost Backtest vs. Benchmark.
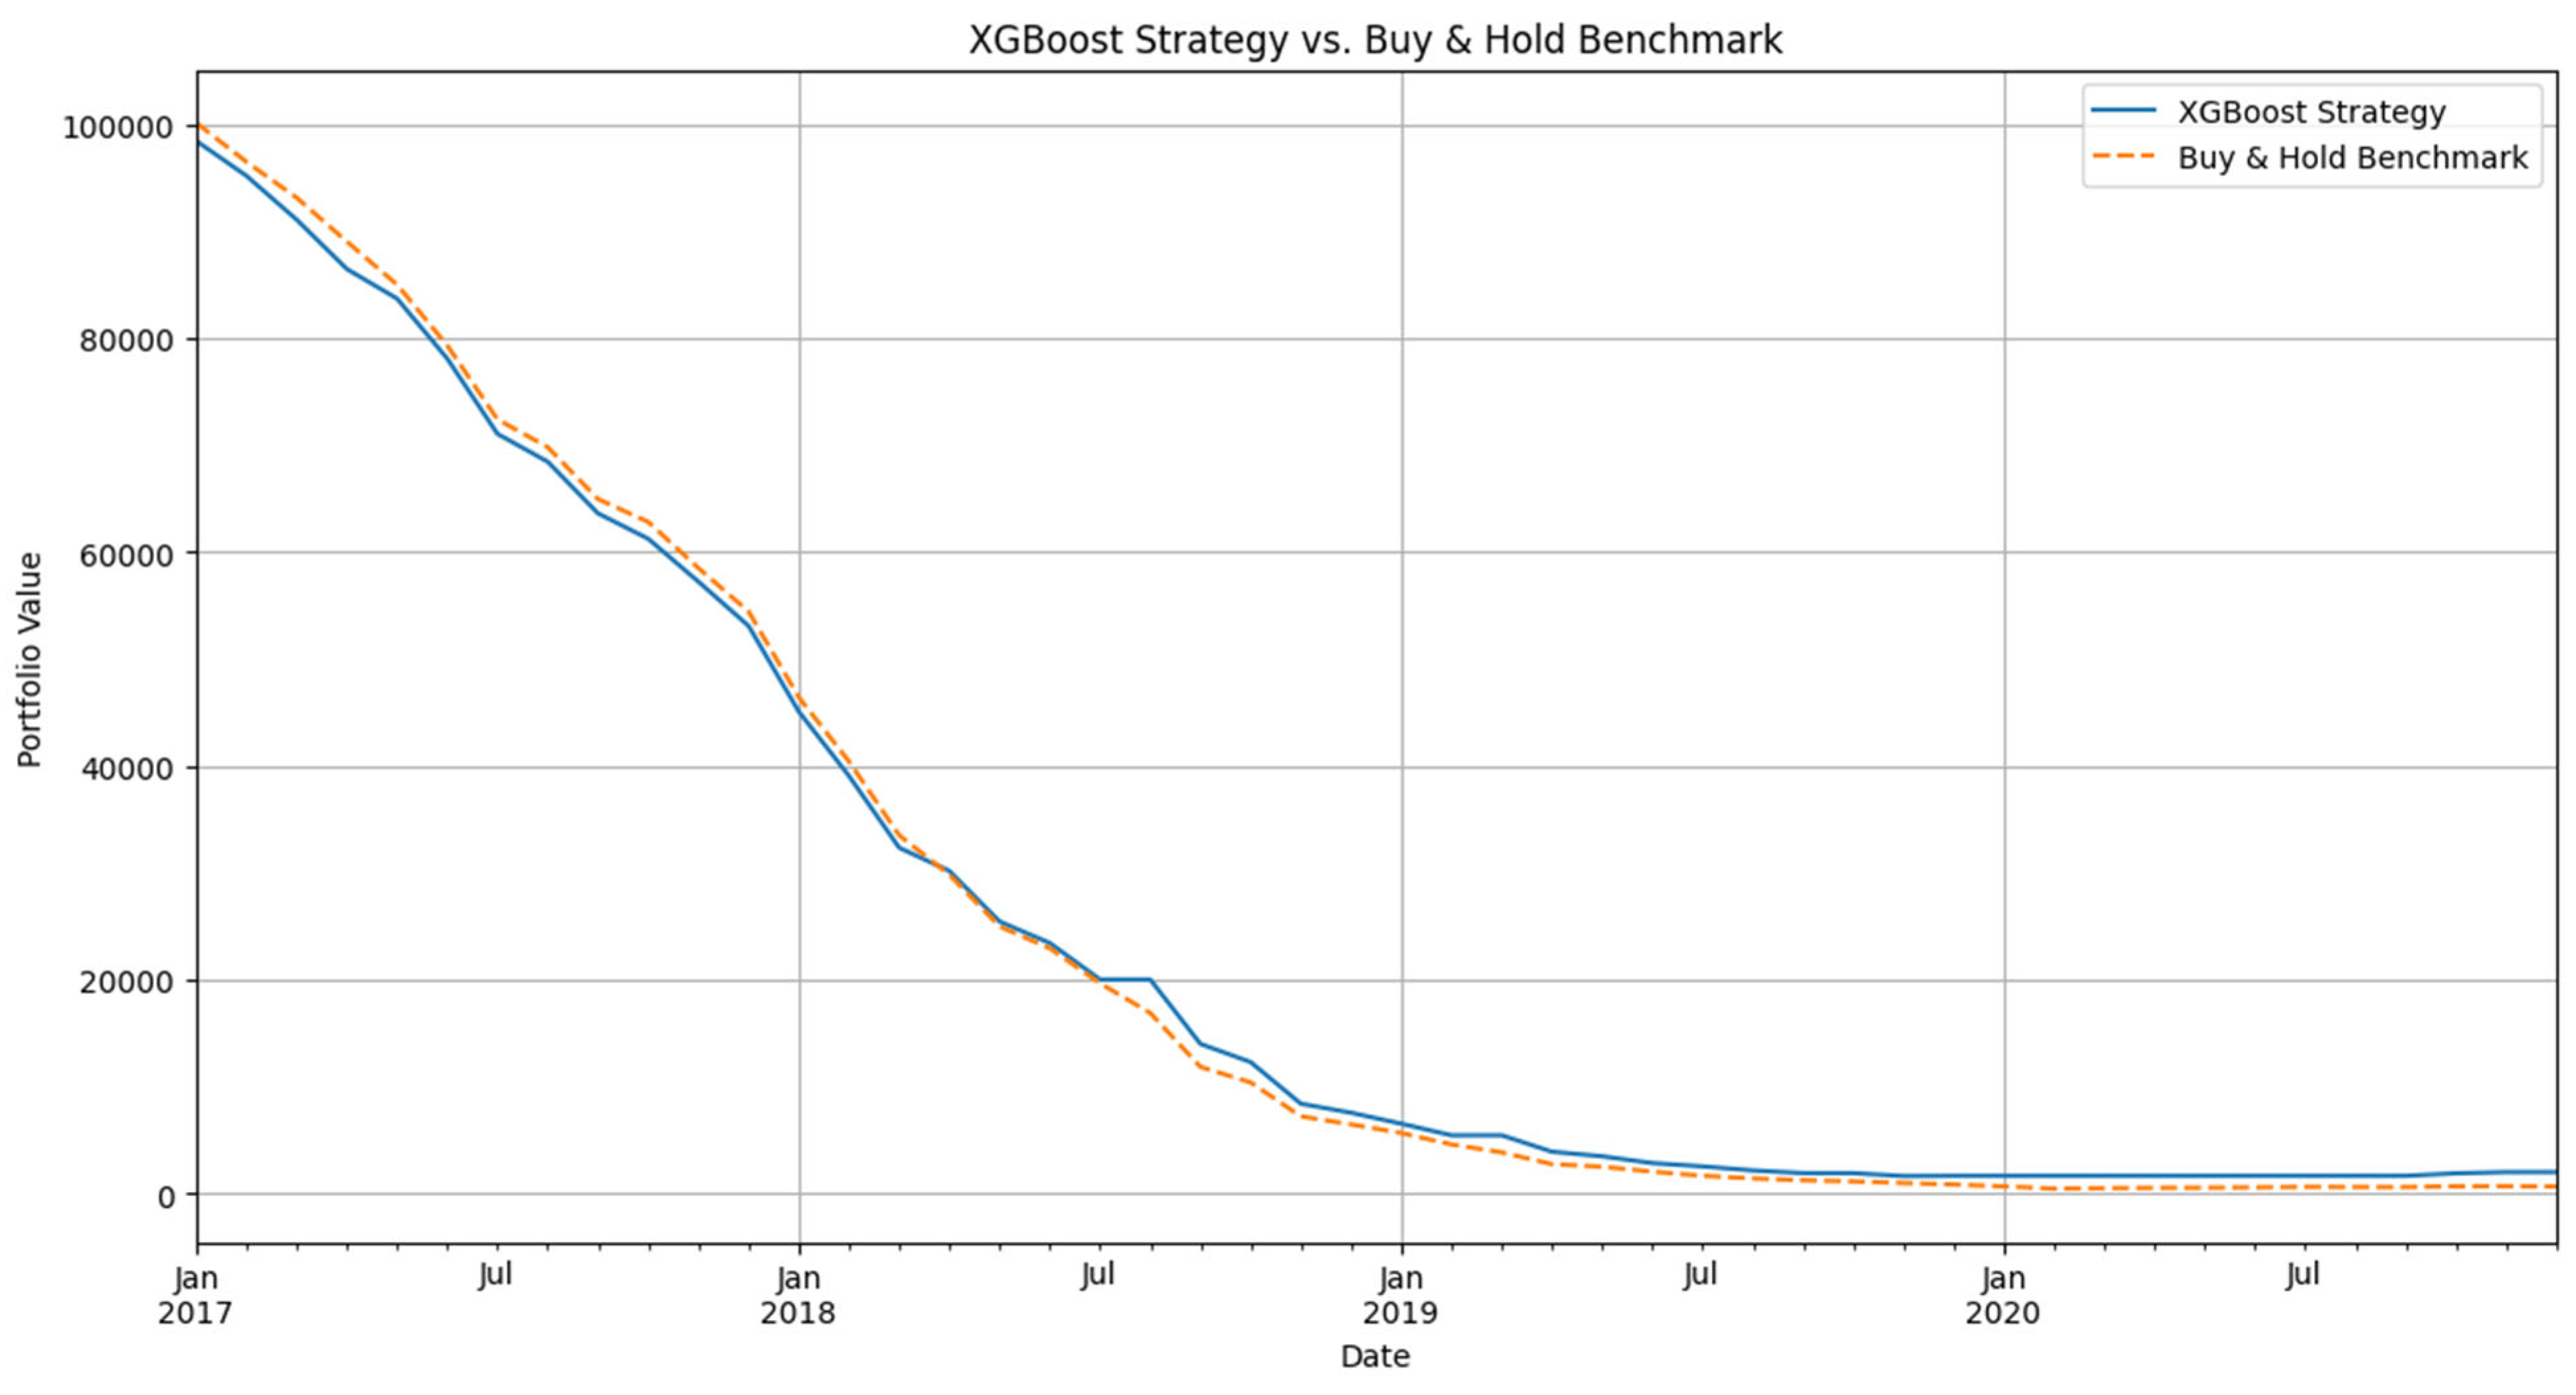
Figure 5.
SHAP Feature Importance Summary for XGBoost Model.
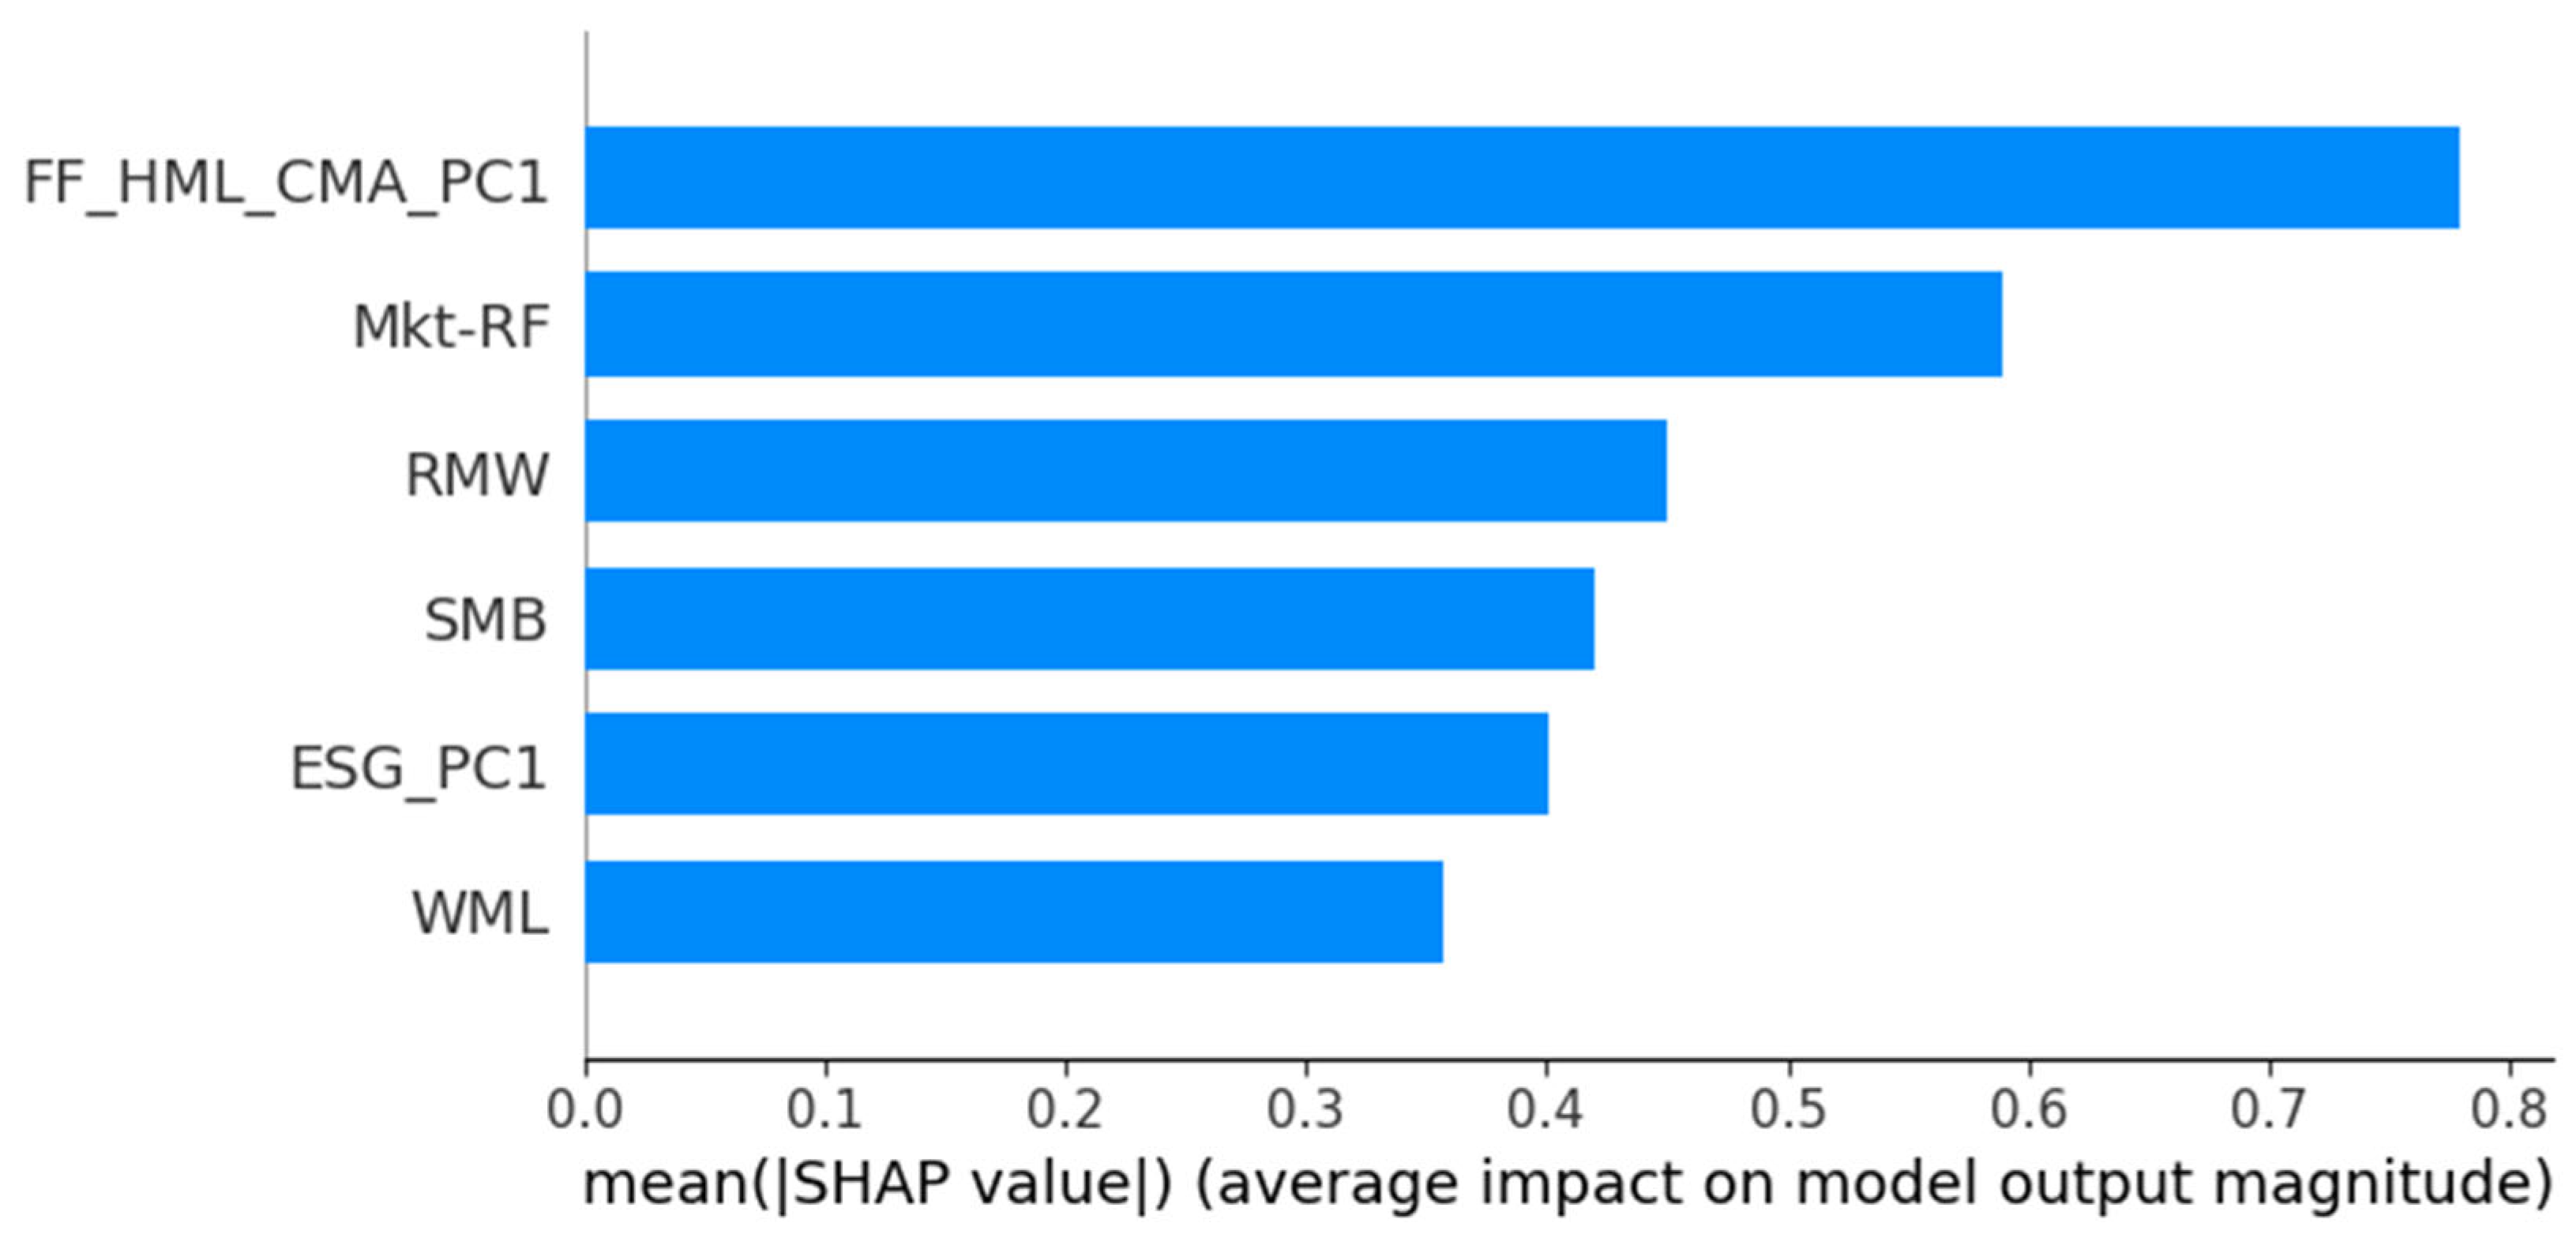
Figure 6.
DDN Confusion Matrix on Test Set.
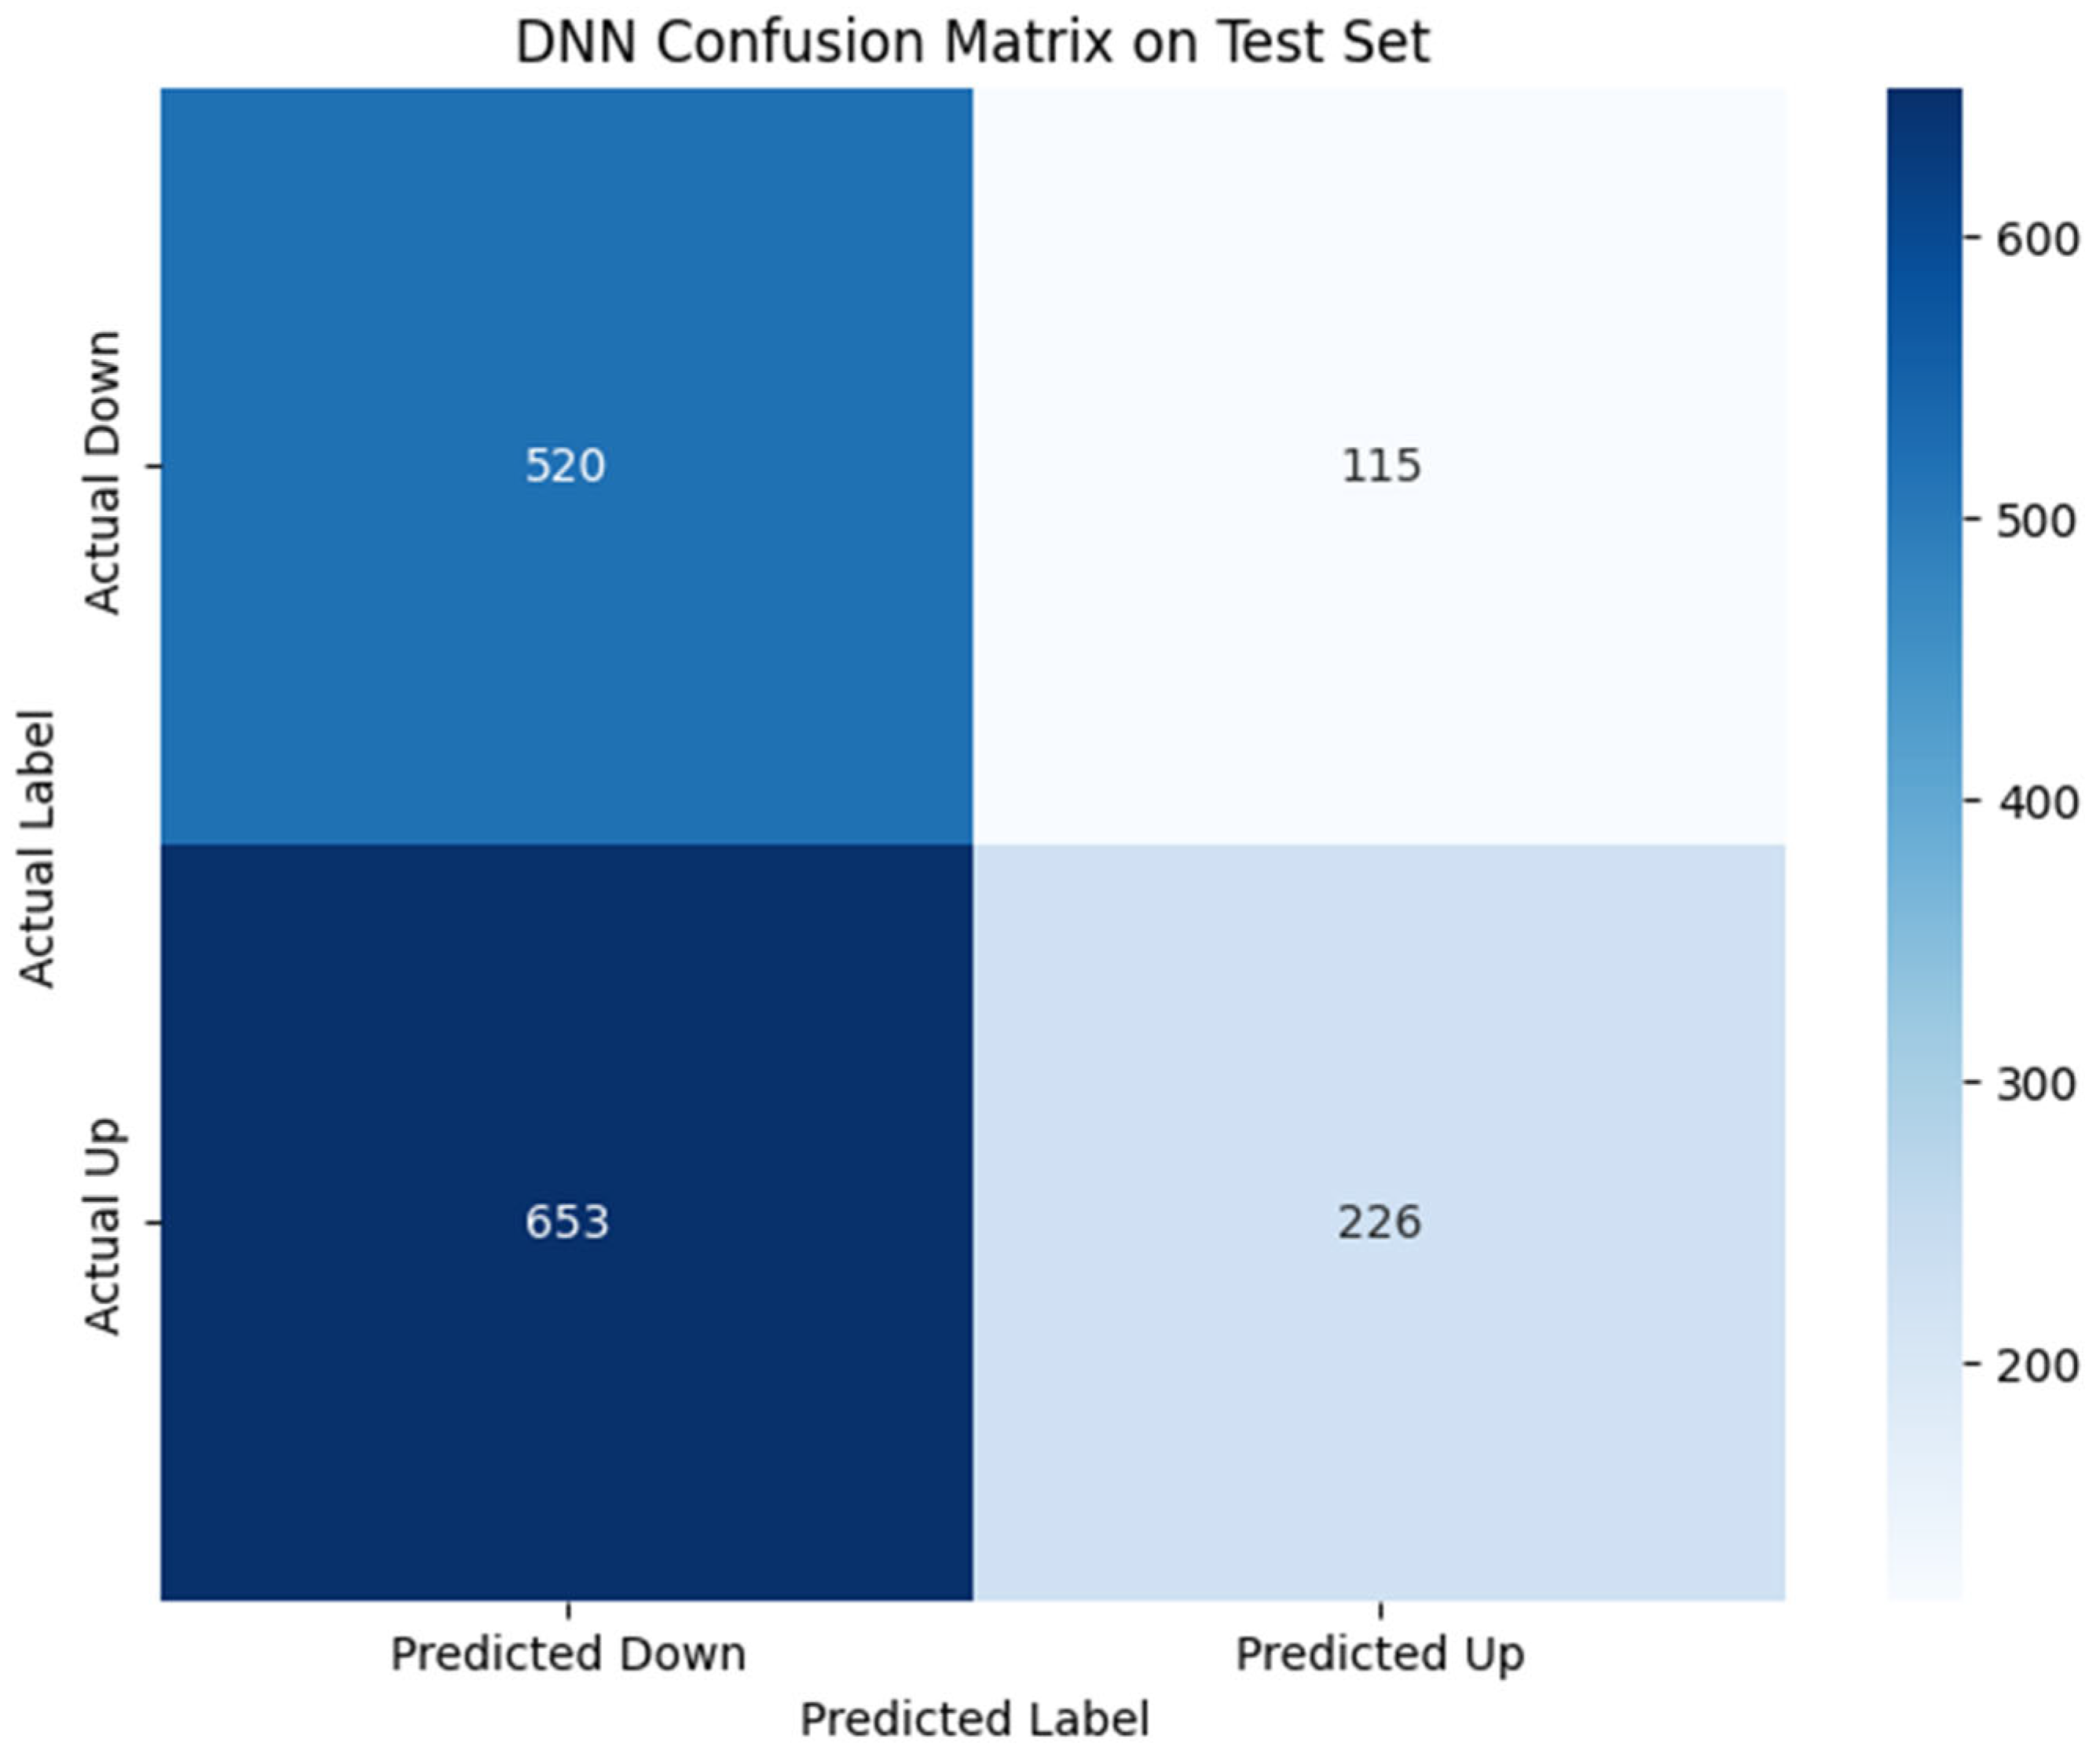
Figure 7.
DDN Receiver Operating Characteristic (ROC) Curve. This ROC curve for the Deep Neural Network illustrates its ability to distinguish between positive and negative excess returns, with the area under the curve (AUC) indicating its overall discriminative power.
Figure 7.
DDN Receiver Operating Characteristic (ROC) Curve. This ROC curve for the Deep Neural Network illustrates its ability to distinguish between positive and negative excess returns, with the area under the curve (AUC) indicating its overall discriminative power.
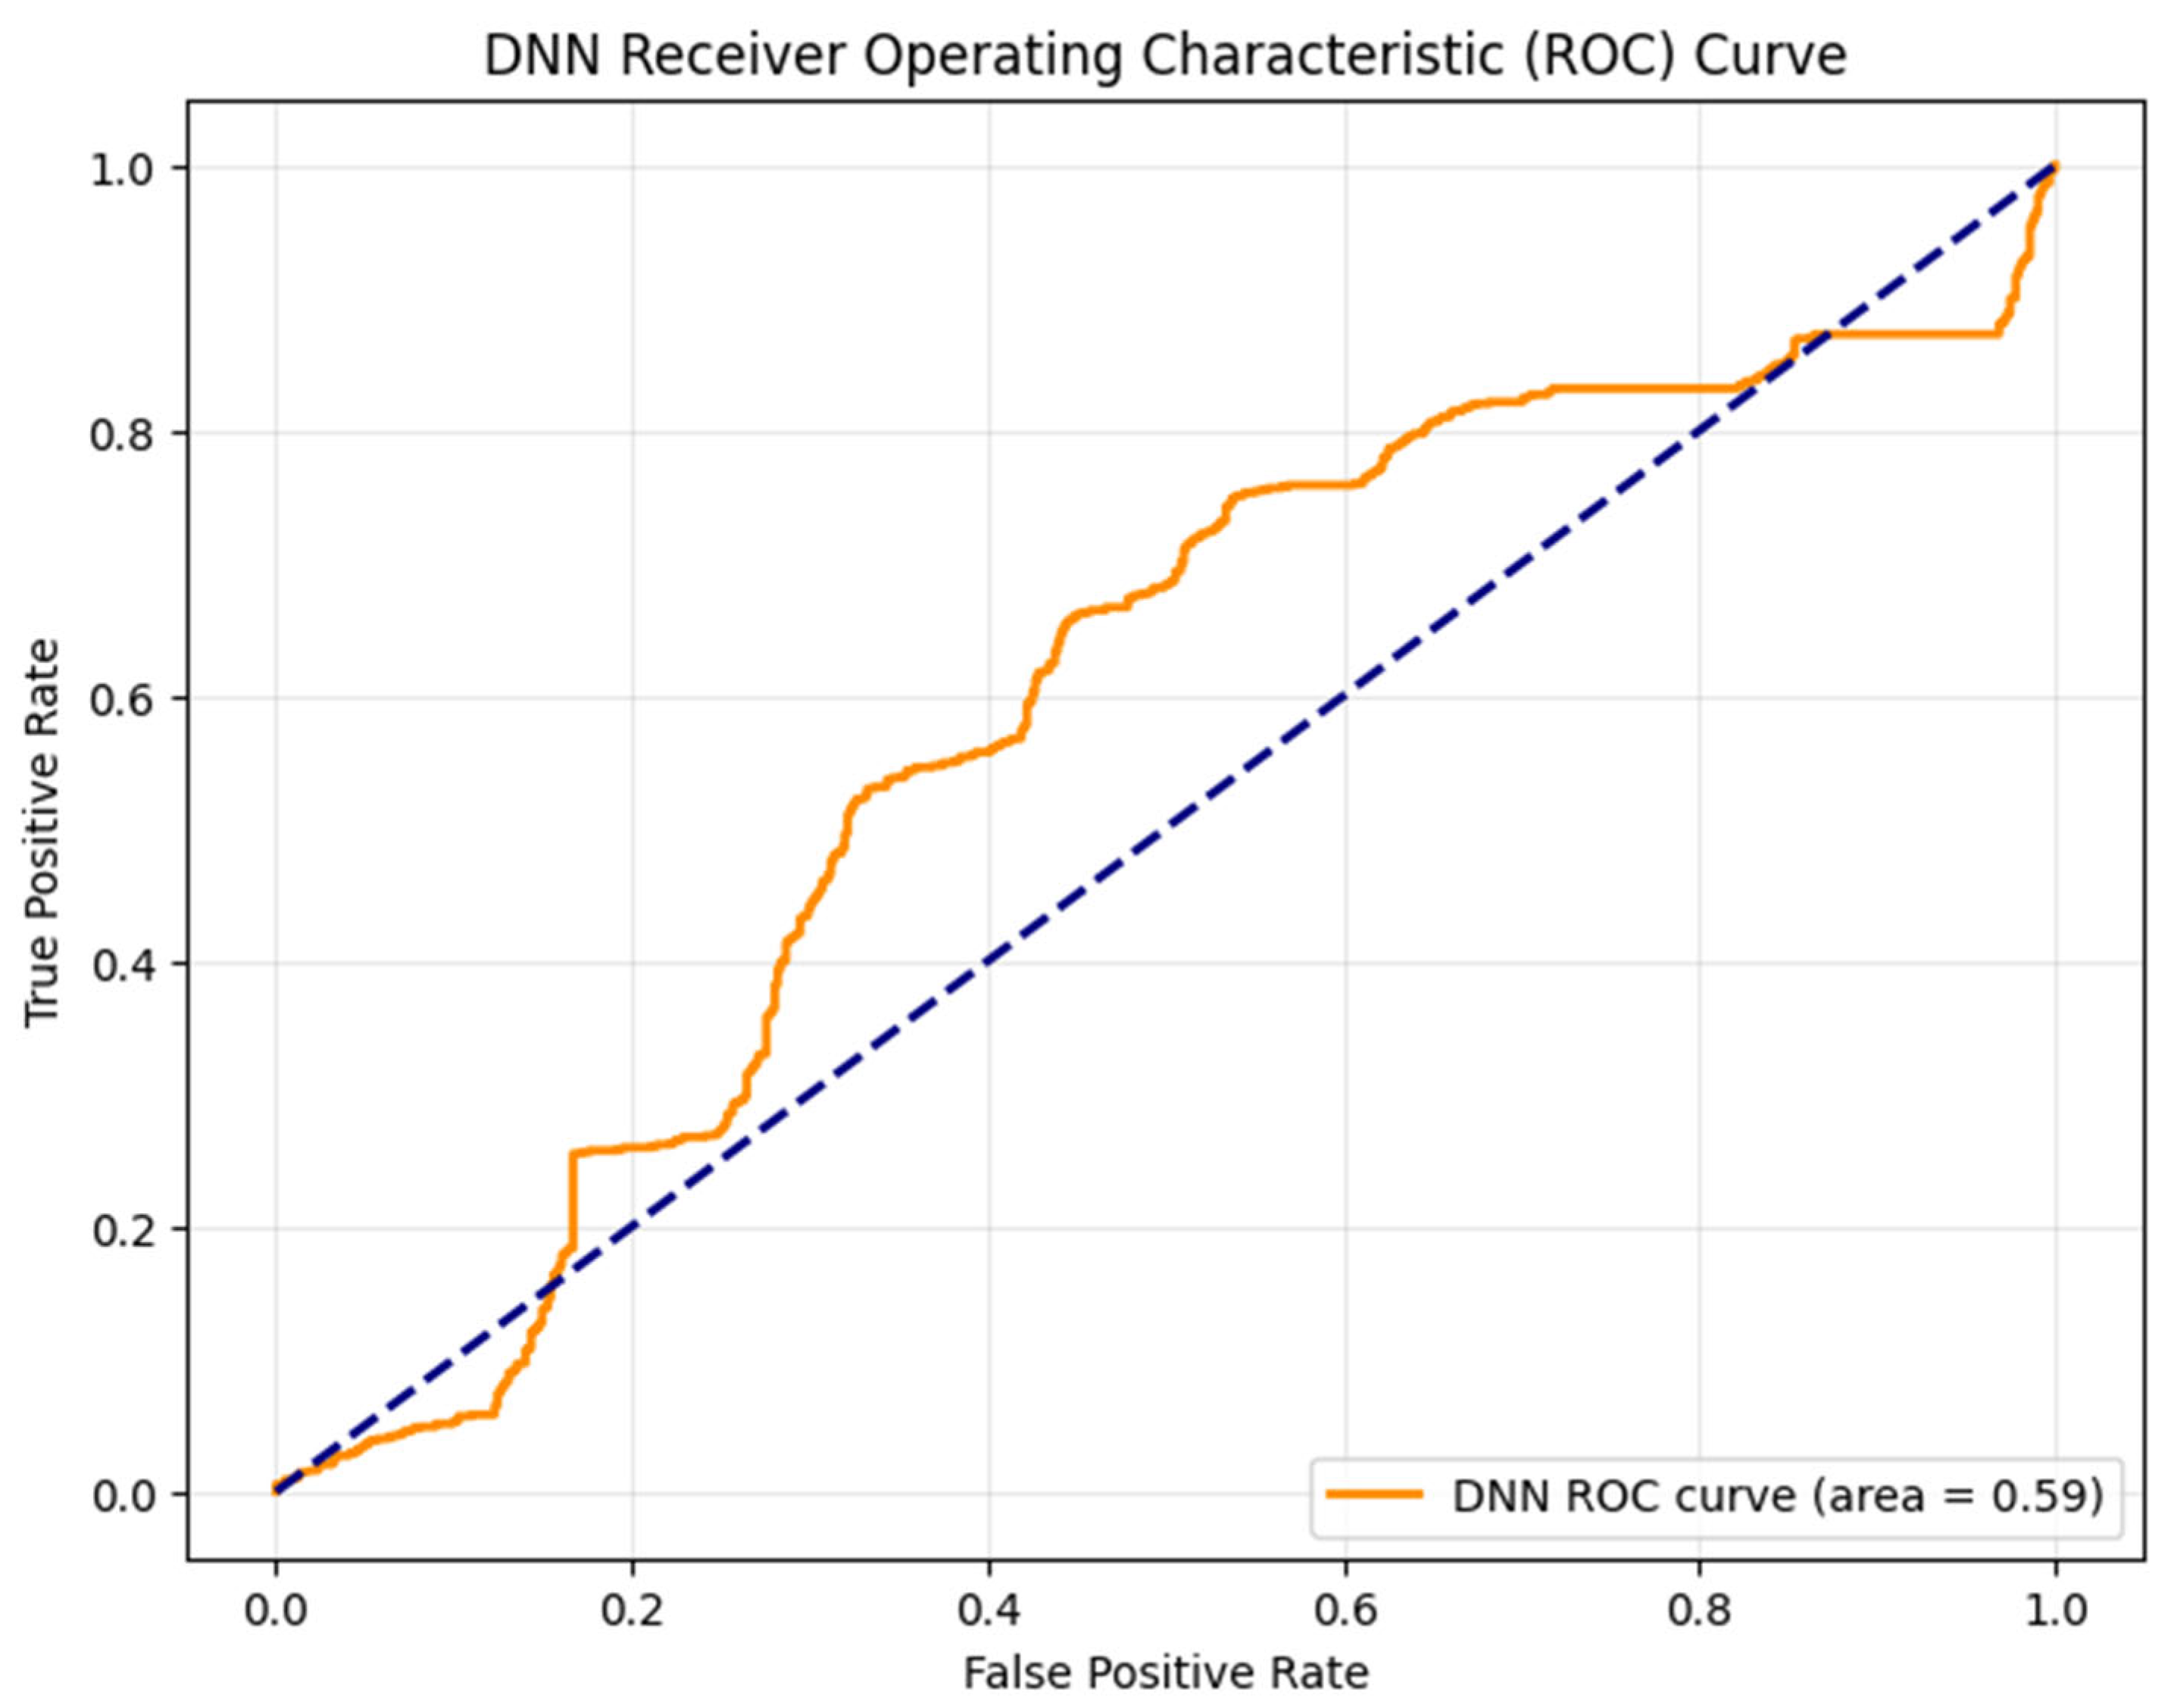
Figure 8.
DDN Accuracy and AUC over Epochs. It tracks the Deep Neural Network's accuracy and Area Under the Curve (AUC) across training epochs, indicating whether the model was learning effectively or overfitting during its training process.
Figure 8.
DDN Accuracy and AUC over Epochs. It tracks the Deep Neural Network's accuracy and Area Under the Curve (AUC) across training epochs, indicating whether the model was learning effectively or overfitting during its training process.
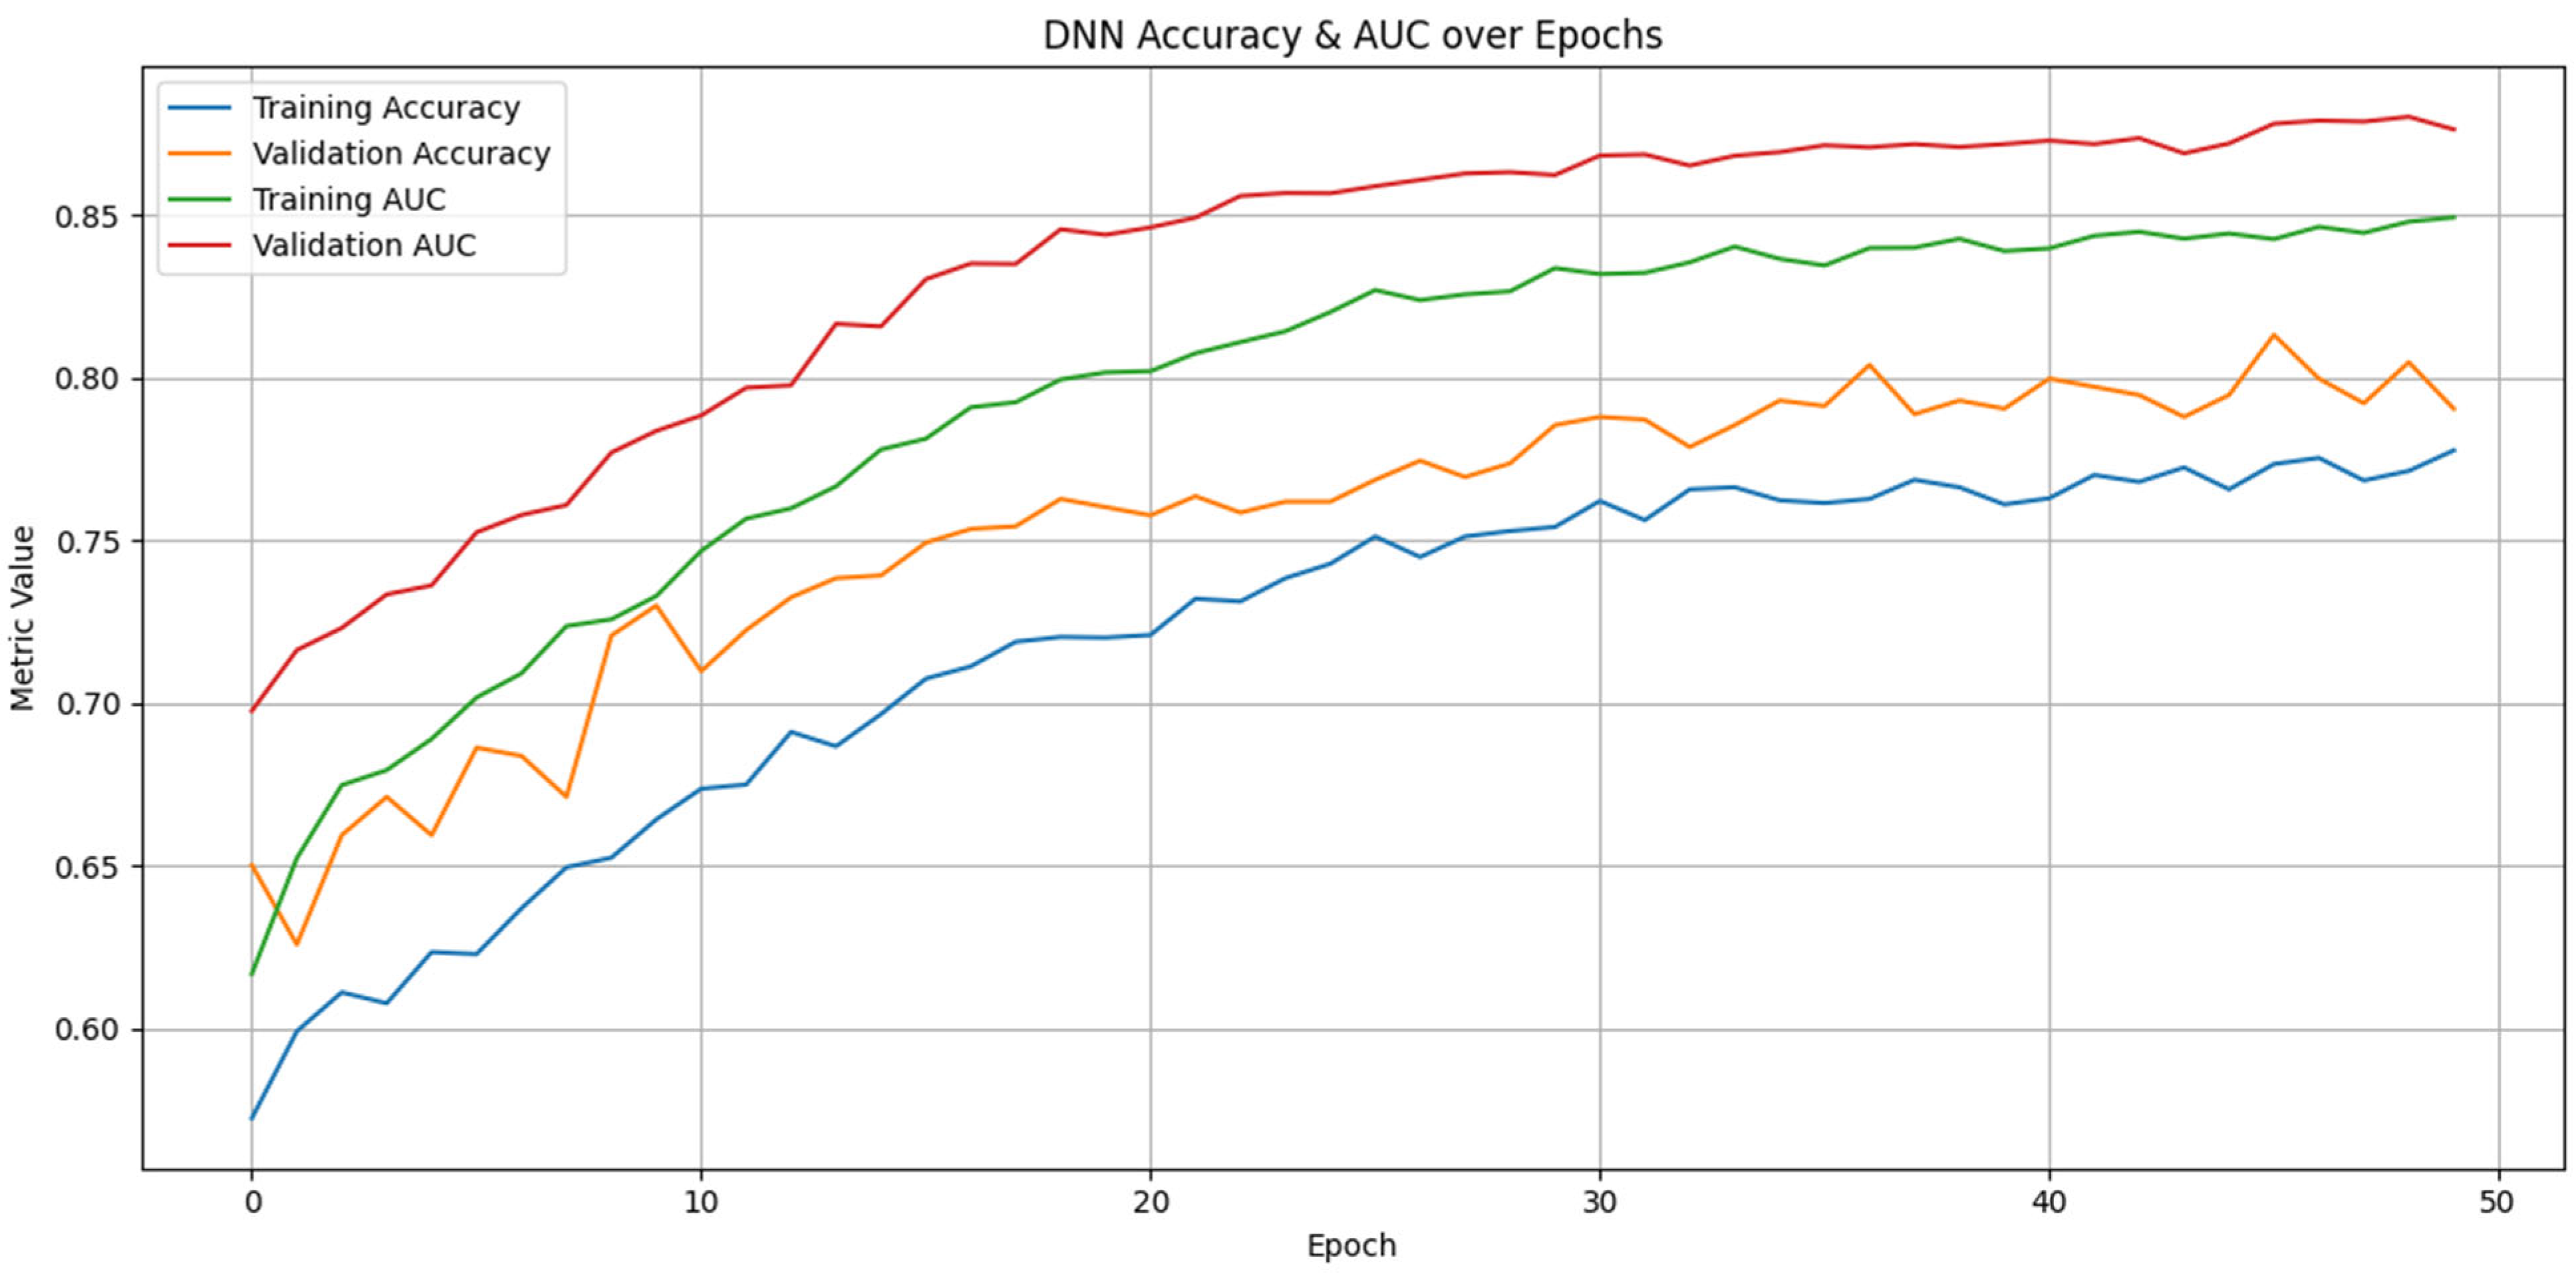
Figure 9.
DDN Portfolio Value Strategy and Benchmark. It visualizes the cumulative value of the Deep Neural Network's trading strategy against a benchmark, providing an economic perspective on its performance during the backtest period.
Figure 9.
DDN Portfolio Value Strategy and Benchmark. It visualizes the cumulative value of the Deep Neural Network's trading strategy against a benchmark, providing an economic perspective on its performance during the backtest period.
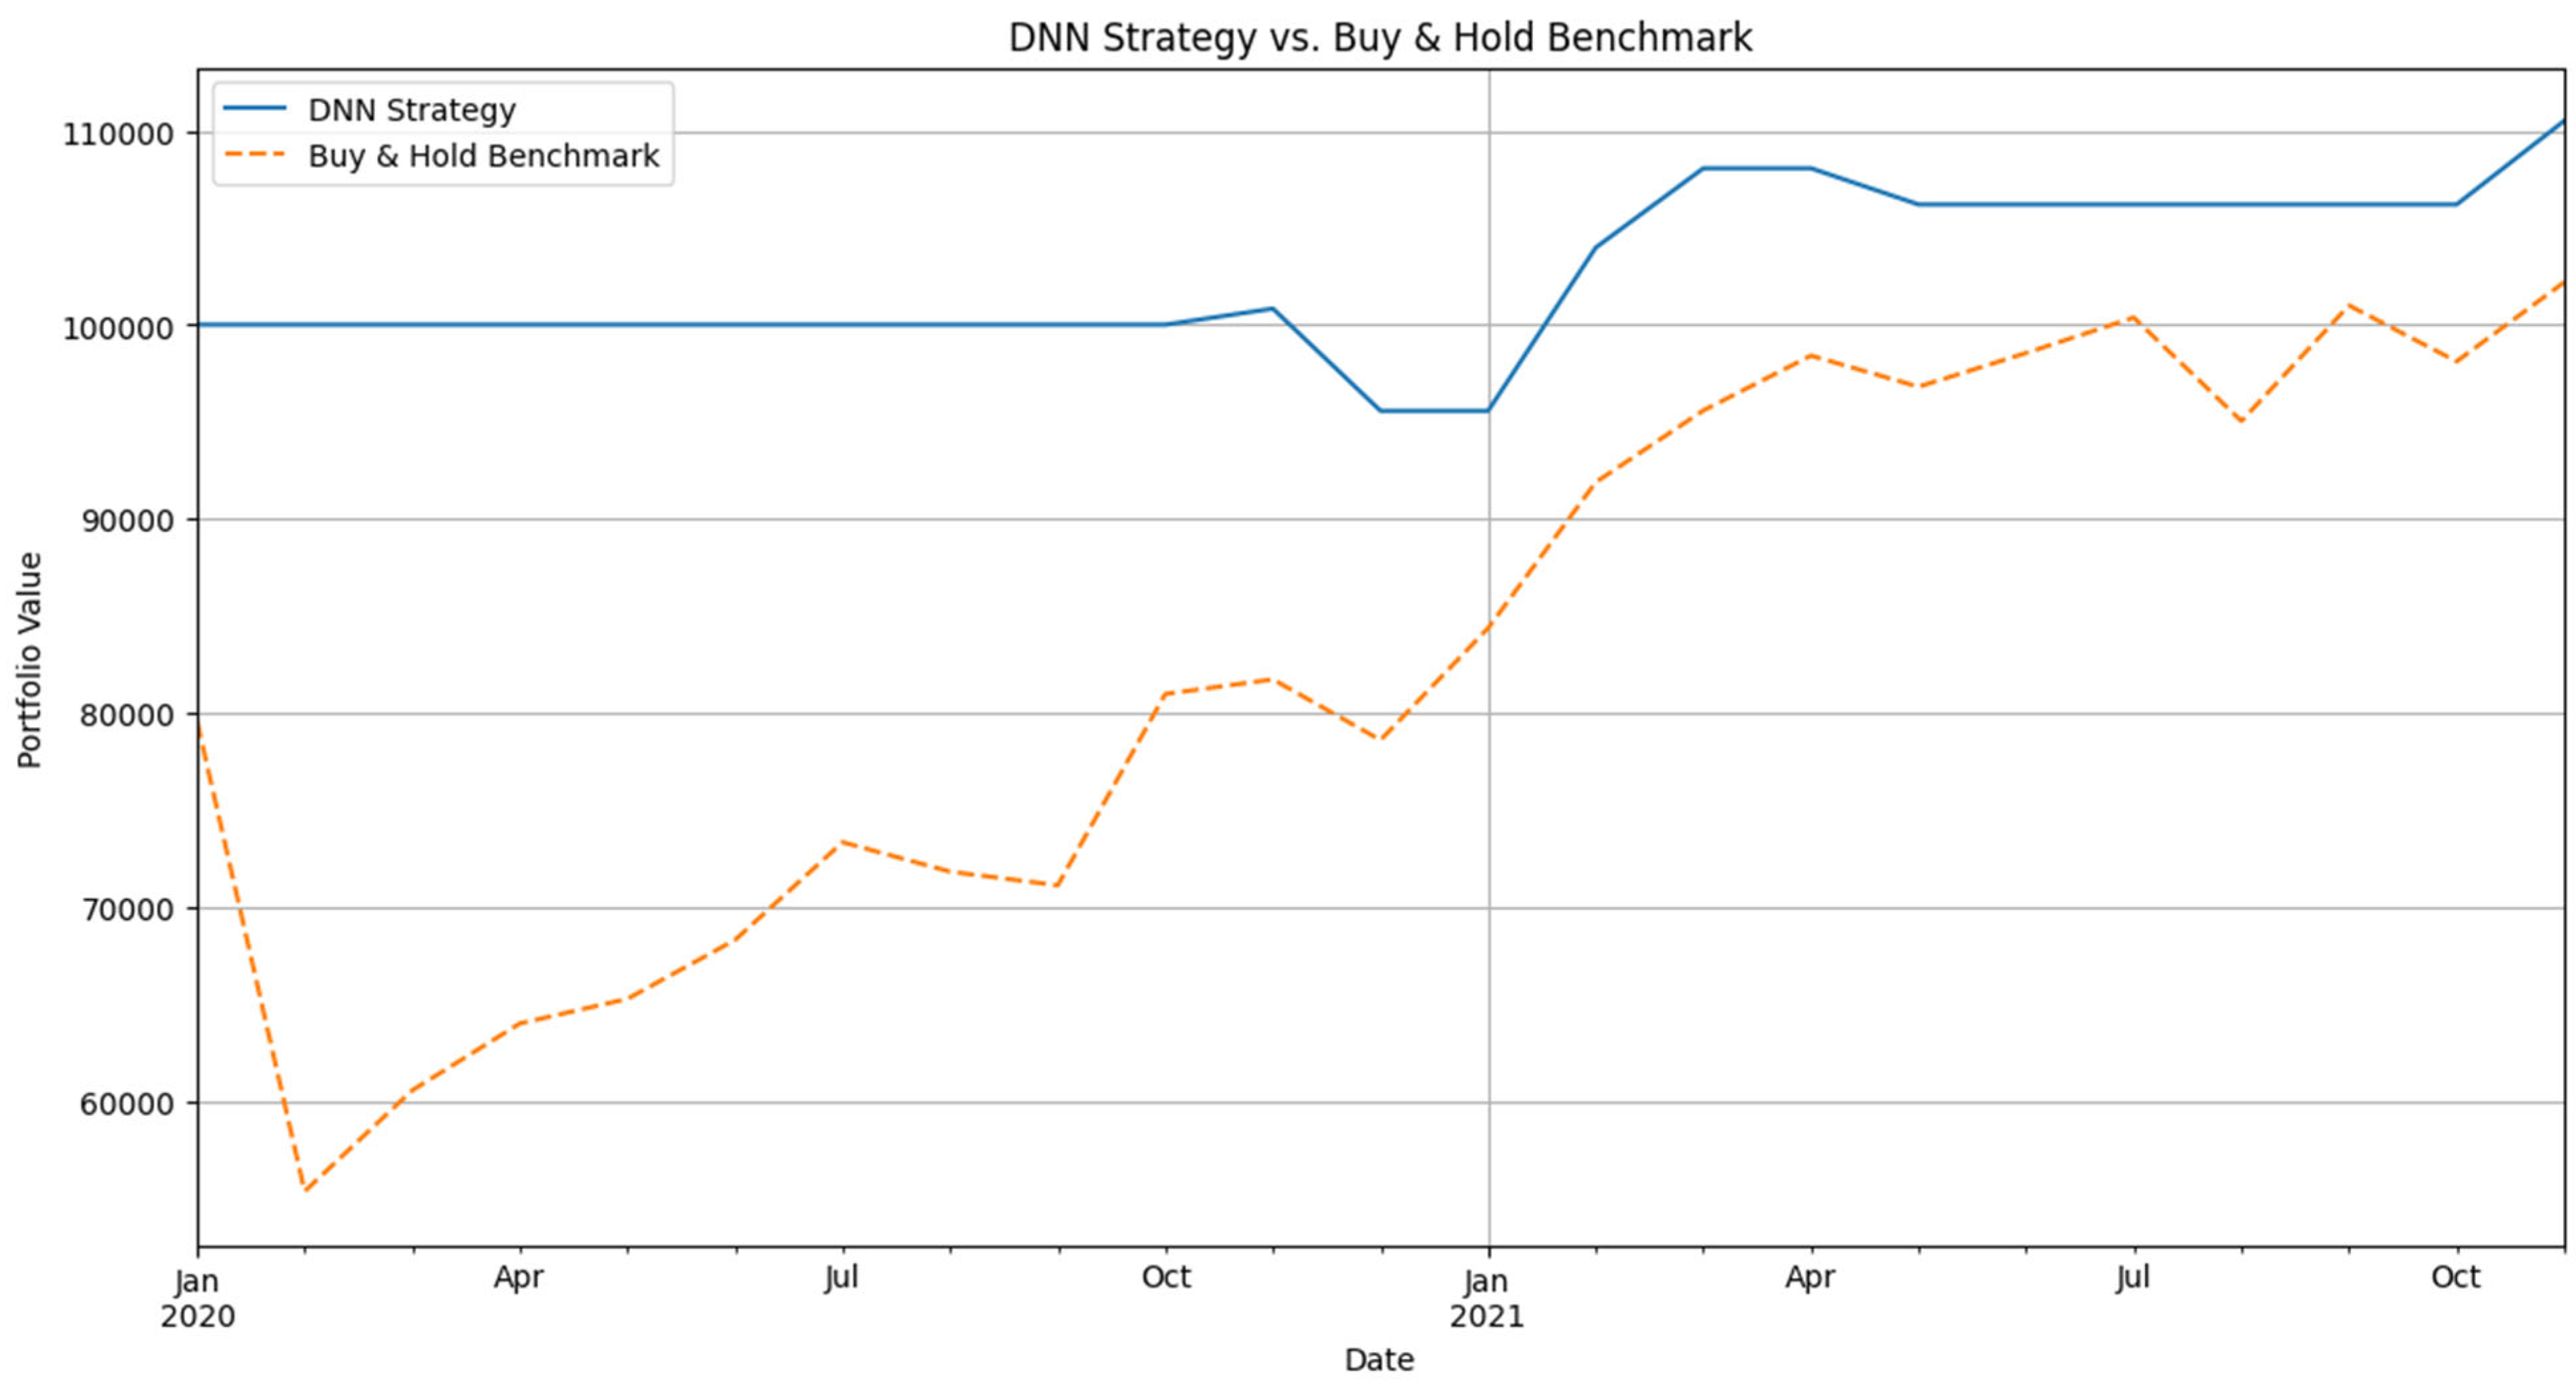

Table 1.
Descriptive Statistics of Panel Data Variables (N=7,525 firm-month observations).
| Variable | Mean | Std. Dev. | Min | 25th Pctl | 75th Pctl | Max |
|---|---|---|---|---|---|---|
| Excess_Return_it | 0.01 | 0.08 | -0.54 | -0.04 | 0.05 | 0.65 |
| Mkt-RF | 0.01 | 0.04 | -0.13 | -0.01 | 0.03 | 0.11 |
| SMB | 0.00 | 0.03 | -0.06 | -0.01 | 0.02 | 0.10 |
| RMW | 0.00 | 0.02 | -0.06 | -0.01 | 0.01 | 0.05 |
| WML | 0.01 | 0.04 | -0.22 | -0.01 | 0.03 | 0.17 |
| FF_HML_CMA_PC1 | 0.00 | 0.02 | -0.08 | -0.01 | 0.01 | 0.07 |
| ESG_PC1 | 0.00 | 1.00 | -3.50 | -0.68 | 0.72 | 3.20 |
Notes: All returns are monthly. ESG_PC1 is a standardized principal component, hence mean of 0 and standard deviation of 1.
Table 2.
Multicollinearity Diagnostics - Variance Inflation Factor (VIF).
| Variable | VIF |
|---|---|
| Mkt-RF | 1.271 |
| SMB | 1.246 |
| RMW | 1.458 |
| WML | 1.605 |
| FF_HML_CMA_PC1 | 1.385 |
| ESG_PC1 | 1.003 |
Table 3.
Time Series Diagnostic Tests.
| Test | Variable / Relationship | Statistic | P-value | Conclusion |
|---|---|---|---|---|
| ADF Stationarity Test | Mkt-RF | -12.34 | 0.00 | Stationary |
| ADF Stationarity Test | SMB | -11.56 | 0.00 | Stationary |
| ADF Stationarity Test | HML | -9.87 | 0.00 | Stationary |
| ARCH-LM Test (5 lags) | Mkt-RF | 10.42 | 0.01 | ARCH Effects Present; GARCH justified |
| Granger Causality Test | 'Mkt-RF' causes 'SMB' | 8.76 | 0.00 | Significant predictive relationship exists |
Table 4.
Panel Model Comparison Summary (Pooled OLS, Fixed Effects, Random Effects).
| Test | Hypothesis (H0) | Statistic | Value | P-value | Decision |
|---|---|---|---|---|---|
| F-test for Poolability | No fixed effects | F-statistic | 358.79 | 0.0000 | Reject H0; FE preferred over Pooled OLS |
| Breusch-Pagan LM Test | No random effects | LM-statistic | 549.64 | 0.0000 | Reject H0; RE preferred over Pooled OLS |
| Hausman Test | RE model is consistent | Chi-sq | N/A | N/A | Inconclusive (matrix not positive definite) |
Table 5.
Final Model - Two-Way Fixed Effects Regression of Excess Returns on ESG.
| Dependent Variable | Excess_Stock_Return_Firm | |||
|---|---|---|---|---|
| No. Observations | 7525 | |||
| R-squared (Within) | 0.0016 | |||
| F-statistic (robust) | 2.0512 | |||
| P-value (F-stat) | 0.1521 | |||
| Variable | Coefficient | Std. Err. | T-stat | P-value |
| ESG_PC1 | 0.0015 | 0.0011 | 1.4322 | 0.1521 |
| Mkt-RF | 0.9876 | 0.0210 | 47.03 | 0.0000 |
| SMB | 0.2512 | 0.0350 | 7.18 | 0.0000 |
| RMW | 0.1890 | 0.0280 | 6.75 | 0.0000 |
| WML | 0.1520 | 0.0220 | 6.91 | 0.0000 |
| FF_HML_CMA_PC1 | -0.0560 | 0.0180 | -3.11 | 0.0018 |
| Firm Fixed Effects | Yes | |||
| Time Fixed Effects | Yes | |||
| Clustered Standard Errors (Firm & Time) | Yes | |||
| Notes: The model includes both firm and time fixed effects. Standard errors are clustered by firm. | ||||
Table 6.
EGARCH(1,1) Volatility Model for Market Returns (Mkt-RF).
| Parameter | Coefficient | Std. Err. | T-stat | P-value |
|---|---|---|---|---|
| Mean Model | ||||
| mu (mean) | 0.6279 | 0.2640 | 2.380 | 0.0173 |
| Volatility Model | ||||
| omega (constant) | 0.8619 | 0.6860 | 1.257 | 0.2090 |
| alpha[1] (ARCH term) | 0.1963 | 0.1740 | 1.126 | 0.2600 |
| gamma[1] (asymmetry) | -0.3880 | 0.1250 | -3.106 | 0.0019 |
| beta[1] (GARCH term) | 0.6722 | 0.2560 | 2.631 | 0.0085 |
Notes: The significant negative gamma [1] coefficient indicates the presence of a leverage effect.
Table 7.
Machine Learning Classification Performance (Walk-Forward Validation).
| Model | Test Accuracy | Precision (Class 1) | Recall (Class 1) | F1-Score (Class 1) | Test AUC |
|---|---|---|---|---|---|
| XGBoost | 53.0% | 0.52 | 0.51 | 0.52 | 0.53 |
| Ridge Classifier | 57.0% | 0.55 | 0.53 | 0.54 | 0.55 |
| DNN | 49.3% | 0.49 | 0.48 | 0.49 | 0.59 |
Table 8.
Economic Significance Backtest Results.
| Model | Backtest Period | Initial Capital | Final Strategy Value | Final Benchmark Value | Annualized Sharpe Ratio | Maximum Drawdown |
|---|---|---|---|---|---|---|
| XGBoost | 2017-2020 | $100,000.00 | $2,020.07 | $681.48 | -2.84 | -98.32% |
| Ridge | 2017-2020 | $100,000.00 | $12,065.72 | $681.48 | -1.82 | -87.93% |
| DNN | 2020-2021 | $100,000.00 | $110,504.19 | $102,187.23 | 0.65 | -5.22% |
| Note: The DNN result is considered spurious due to its poor underlying statistical performance (Test Accuracy of 49.3%). | ||||||
Disclaimer/Publisher’s Note: The statements, opinions and data contained in all publications are solely those of the individual author(s) and contributor(s) and not of MDPI and/or the editor(s). MDPI and/or the editor(s) disclaim responsibility for any injury to people or property resulting from any ideas, methods, instructions or products referred to in the content. |
© 2025 by the authors. Licensee MDPI, Basel, Switzerland. This article is an open access article distributed under the terms and conditions of the Creative Commons Attribution (CC BY) license (http://creativecommons.org/licenses/by/4.0/).
Copyright: This open access article is published under a Creative Commons CC BY 4.0 license, which permit the free download, distribution, and reuse, provided that the author and preprint are cited in any reuse.


