
Submitted:
08 September 2025
Posted:
11 September 2025
You are already at the latest version
Abstract
This study examines the impact of Artificial Intelligence (AI)-enhanced Environmental, Social, and Governance (ESG) reporting on firm valuation in emerging markets. It aims to explore how AI integration enhances the interpretability and predictive accuracy of ESG metrics in shaping market perceptions and investor decisions, particularly in non-financial sectors where ESG performance is experiencing significant growth. This study employs a panel dataset from 2018 to 2024, and it analyses publicly listed non-financial firms across five major sectors: manufacturing, energy, telecommunica-tions, consumer goods, and industrials. This study employs AI-powered multimodal analysis to examine the relationships between ESG and firm valuation in emerging markets. The research combines Fixed-Effects Regression and Machine Learning (ML) algorithms such as Extreme Gradient Boosting (XGBoost) and Random Forest to identify both linear and non-linear relationships between ESG scores and firm valuation. The results show empirical evidence that integrating ML enhances the explanatory power of ESG data. Findings indicate that ESG performance is positively correlated with higher market valuations, particularly in Environmental and Social dimensions. Governance metrics show more inconsistent effects. Firms identified in ESG controversies tend to face valuation penalties, which stresses market sensitivity to reputational risks. ML algo-rithms outperform conventional techniques in predictive accuracy, revealing complex, non-linear interactions within ESG data. The findings contribute to both academic lit-erature and practitioner understanding of the implications of how AI-driven ESG re-porting can improve robust firm valuation models and complex interdependencies in the ESG dataset.
Keywords:
AI-ESG reporting
; firm valuation
; machine learning
; natural language processing
; emerging markets
1. Introduction
Globally, organisations are increasingly recognising that delivering financial returns must be accompanied by transparent, credible, and strategic sustainability reporting (Eccles and Krzus 2018). Environmental, Social, and Governance (ESG) disclosures have moved beyond a compliance exercise to become a core driver of firm valuation, particularly in emerging markets where governance structures are evolving and stakeholder scrutiny is intensifying (Friede, Busch, and Bassen 2015; Wamba et al. 2021). In such contexts, the quality, timeliness, and comparability of ESG information are frequently undermined by institutional voids, inconsistent reporting standards, and high information asymmetry (Khanna and Palepu 2010). Artificial Intelligence (AI) offers a transformative potential to address these challenges by enhancing ESG data interpretation, standardisation, and predictive capability. While existing research demonstrates that robust ESG performance can positively influence firm valuation (Fatemi et al., 2018; Cheng et al., 2014), there is a critical gap regarding how AI integration into ESG reporting specifically influences investor perceptions, valuation accuracy, and reputational risk management in emerging markets (Ding et al., 2022; Huang et al., 2022). Moreover, little is known about the relative contribution of AI-derived ESG attributes such as sentiment tone, linguistic complexity, and disclosure clarity, compared to traditional ESG scores.
This study addresses this gap by applying a multimodal analytical approach that combines panel data econometrics and advanced machine learning algorithms to evaluate whether AI-powered ESG reporting provides a measurable valuation premium. The empirical setting, comprising five African emerging markets that span manufacturing, energy, telecommunications, consumer goods, and industrial sectors, offers a unique laboratory for examining these relationships in contexts of regulatory heterogeneity and digital adoption disparity (OECD, 2022). This study integrating Stakeholder Theory (Freeman, 1984), Signalling Theory (Spence, 2002), and the Resource-Based View (Barney, 1991) as foundational mechanism. The findings have direct implications for investors seeking more accurate valuation models, policymakers aiming to strengthen ESG reporting standards, and corporate leaders navigating the strategic adoption of AI in sustainability communication. The other portion of this paper is structured as follows: Section 2 provides relevant empirical review, while Section 3 outlines the data sources and methodology approach. Section 4 presents the key results, following by a detailed discussion in Section 5. Finally, Section 6 concludes the study and highlights the policy implications.
2. Literature Review
The intersection of ESG practices with firm valuation has gained increasing attention in emerging markets, where institutional voids, weak regulatory enforcement and high information asymmetry present unique challenges. Empirical studies have consistently found that firms with stronger ESG performance tend to achieve higher market valuation, largely due to improved stakeholder trust and reduced capital constraints (Friede, Busch, and Bassen, 2015; El Ghoul et al., 2011). In the context of African and Southeast Asian markets, ESG -compliant firms have demonstrated significantly higher Tobin’s Q and lower cost of equity (Aman, Nguyen, and Tran, 2021), signaling a tangible link between sustainability transparency and firm value. The integration of AI into ESG reporting adds another dimension to this relationship. AI algorithms such as Natural Language Processing (NLP), Machine Learning (ML) and Automated ESG scoring enhance data accuracy, standardization and timeliness. According to Chen and Guestrin (2016), gradient boosting and other ensemble methods have proven effective in improving prediction accuracy across complex financial datasets. Empirical evidence from Chinese listed firms shows that companies integrating AI into ESG disclosures not only achieve higher ESG ratings but also experience stronger institutional investment inflows and valuation premiums (Liu et al., 2022).
Despite this advancement, the literature examining AI-enhanced ESG reporting in emerging markets remains limited. Studies are often confined to single-country analyses or lack comparative models incorporating qualitative textual data (Ioannou and Serafeim, 2015). This gap is pronounced in low- and middle-income economies, where the quality and credibility of ESG disclosures can vary significantly across sectors and governance regimes. AI algorithms hold the potential to bridge such disparities by introducing structure and standardization to fragmented ESG narratives (Shwartz-Ziv and Armon, 2022). Moreover, there is a growing recognition that AI integration serves not only as a reporting tool but also as a strategic asset under the resource-based view (Barney, 1991). Firms that deploy AI for sustainability analytics can leverage this capability for competitive differentiation, improving both reputational capital and market performance. Thus, the convergence of AI and ESG reporting in emerging markets presents a critical frontier for empirical exploration to accurately assess firm value implications.
2.1. Theoretical Review
This study draws upon three complementary perspectives such as Stakeholder Theory, Signalling Theory, and the Resource-Based View (RBV) to explain how Artificial Intelligence (AI)-integrated ESG reporting can influence firm valuation in emerging markets. Stakeholder Theory posits that transparent and credible ESG reporting aligns corporate behaviour with stakeholder expectations, enhancing legitimacy, trust, and long-term value creation (Freeman, 1984; Eccles et al., 2014). In emerging markets, where institutional frameworks may be underdeveloped, AI integration can strengthen this alignment by improving the timeliness, accuracy, and standardisation of ESG disclosures (Floridi and Cowls, 2022). For instance, AI-enabled sentiment analysis and controversy monitoring can proactively address stakeholder concerns, reduce reputational risk and increase investor confidence (Wamba et al., 2021). Thus, within the stakeholder perspectives, AI acts as a mechanism that deepens engagement quality and demonstrates responsiveness to both financial and non-financial stakeholder priorities.
Signalling Theory explains how firms convey unobservable attributes such as governance quality, managerial competence, and strategic foresight through observable actions (Spence, 2002). AI-powered ESG reporting can serve as a high-credibility signal, reducing uncertainty for investors and analysts (Shneor and Flåten, 2023). Advanced technologies such as NLP and ML enhance disclosure consistency, detect anomalies, and reduce the likelihood of greenwashing, thereby increasing the trustworthiness of ESG signals (Ding et al., 2022). The market may interpret AI adoption in ESG reporting not only as a commitment to transparency but also as an indicator of innovation readiness and adaptability, both of which can command a valuation premium (Huang et al., 2022).
The Resource-Based View (RBV) frames AI-enhanced ESG reporting capabilities as strategic intangible resources that are valuable, rare, inimitable, and non-substitutable (Barney, 1991). AI integration in ESG analytics allows firms to extract insights from unstructured sustainability data, automate disclosure processes, and identify environmental or social risks more effectively than competitors (Wamba et al., 2021). These capabilities can be embedded into organisational routines, creating sustained competitive advantage that influences both operational performance and market valuation. From an RBV perspective, AI is not merely a disclosure tool but a capability that can be leveraged for strategic differentiation in markets where competitors lack similar technological sophistication. However, combining these three theoretical perspectives, the study conceptualises AI-integrated ESG reporting as both a legitimacy-enhancing mechanism (Stakeholder Theory), a high-credibility disclosure signal (Signalling Theory), and a strategic capability that can influence investor perceptions and firm valuation.
2.2. Hypotheses Development
This study grounds its hypotheses in three complementary theoretical perspectives which includes Stakeholder Theory, Signaling Theory and Resource-Based View. These theories offer foundation understanding into how artificial intelligence (AI) integration into ESG reporting might influence firm valuation, particularly within emerging markets. First, stakeholder theory emphasizes the importance of transparent communication between firms and their stakeholders (Fatemi et al., 2018). However, when organizations disclose ESG performance in a clear and reliable manner, they address the informational needs of investors, regulators and civil society, which can enhance reputation and legitimacy (Cheng, Ioannou, and Serafeim, 2014; Eccles, Krzus, and Solano, 2023). In this study, incorporating AI into ESG reporting processes improves the precision, frequency and credibility of sustainability disclosures. This is valuable in emerging markets where institutional systems lack robustness (Khanna and Palepu, 2010; Ntim et al., 2015; Onwere, 2024). Research has shown that firms with more advanced ESG transparency tend to attract investor confidence and may experience stronger valuation metrics (Fatemi et al., 2018; Yu and Luu, 2021). Based on the reviewed literature, this study posits the first hypothesis as follows;
H1.
AI-integrated ESG reporting is positively and significantly associated with firm valuation.
Second, signaling theory purview that, firms that voluntarily adopt advanced technologies such as AI in their ESG disclosures send credible signals to the market about their commitment to accountability and innovation (Grewal, Hauptmann, and Serafeim, 2020; Chen et al., 2023). These signals can reduce perceived risks and information asymmetry, especially in environments where traditional reporting mechanisms are weak (Koelbel, and Rigobon, 2022). The presence of AI in sustainability reporting may act as a proxy for managerial quality and strategic foresight (Spence, 2002; Eccles et al., 2014), leading to improved market perceptions and firm valuation.
The resource-based view extends this logic by viewing AI-powered ESG reporting capabilities as strategic intangible assets. Thus, such capabilities especially when rare, valuable and difficult to replicate can yield sustainable competitive advantage (Delery and Roumpi, 2017; Côrte-Real et al., 2020; Dubey et al., 2021). Firms that leverage AI for ESG-related data analysis, sentiment monitoring and risk detection gain efficiencies and insights that others may not possess. This can enhance both operational performance and stakeholder engagement. Moreover, AI-enhanced ESG features such as NLP-derived sentiment, ESG controversy monitoring and textual complexity can also strengthen the predictive accuracy of valuation models by capturing significance). Based on the reviewed literature, this study proposes the second hypothesis as follows;
H2.
AI-derived ESG features significantly improve the accuracy of firm valuation predictions.
2.3. Research Gap
Despite the advancements that have been made in linking (ESG) reporting to corporate valuation, the evolving role of artificial intelligence (AI) in enhancing ESG disclosures remains insufficiently examined, especially in emerging markets. Existing research primarily emphasizes on conventional ESG performance scores and often neglects the implications of AI tools that improve the depth, consistency and clarity of sustainability communication. Moreover, few studies incorporate advanced textual analytics such as sentiment and readability as measurable inputs in valuation models. The use of AI-enhanced ESG metrics within machine learning frameworks to forecast firm value is also underexplored. This gap is particularly relevant in markets where regulatory standards and transparency mechanisms are still developing. By integrating AI-powered ESG attributes into both econometric and predictive modeling approaches, this study contributes novel evidence on how technology-driven reporting practices affect market perceptions and valuation accuracy.
3. Data and Methods
3.1. Sample Selection
This study employed longitudinal analysis and integrating econometrics approaches with AI-driven analytics to examine the impact of artificial intelligence in ESG disclosure. Table 1 shows the distributions of firms by country and selected industries. The sample comprises of selected non-financial sectors from five African countries included South African (SA) Nigeria (NG), Egypt (EG), Kenya (KE) and Morocco (MA), particularly, SA and NG countries were prioritized due to their relatively advanced financial systems and established ESG disclosure frameworks (World Bank, 2022; KPMG, 2021). Others countries, such as Egypt, Kenya and Morocco were included to ensure institutional and regional diversity, thereby enhancing the external validity of findings across different regulatory and economic contexts (OECD, 2023). Financial sectors such as banks and insurers were tactically not considered due to their distinctive capital structures and advanced specific disclosure regulations.
However, manufacturing sectors including energy, telecommunications, consumer goods and industrials were selected due to their significant ESG exposure and growing reliance on technological innovation in disclosure reporting. Previous literature has identified these sectors vulnerability to environmental and social scrutiny which increases the demand for transparency ESG communication (Eccles et al., 2020; Fatemi et al., 2018). Furthermore, companies were considered if they typically satisfied these two conditions: (i) consisting reporting of ESG and financial performance data for at least three consecutive years and (ii) sufficient disclosure to allow classification of their ESG reporting practices as AI- Integrated (AII) or non- AI Integrated (NAII). Finally, the study sample consists of 120 listed companies which eventually generates 1,200 firm-year observations. Table 1 presents the distribution by country and industry.
AI Integration Classification
Table 2 shows the AI-Integration classification. The classification was derived from systematic content analysis using automated text-mining techniques with systematic qualitative coding. The study used keyword-based searches phrases such as “machine learning,” “natural language processing,” “automated ESG scoring,” and “AI-driven analytics.” However, to reduce the risk of false positives of mentions of AI in contexts unrelated to ESG, a contextual filtering rule was applied, ensuring that AI-related terms were only retained when they appeared alongside sustainability-related concepts such as “ESG,” “sustainability,” “reporting,” or “disclosure.” Python libraries including Natural Language Toolkit (NLTK), spaCy, and regular expressions (regex) were employed for the preprocessing, keyword identification and contextual filtering, and annual reports were transferred into NVivo for structured content analysis. A coding framework was designed to classify firms into two groups: AI-integrated (1) or non-AI-integrated (0), based on verifiable evidence of AI application in ESG reporting practices. Technically, reliability was tested by double-coded a proportion of the sample and intercoder agreement was assessed using Cohen’s Kappa and Krippendorff’s Alpha (computed in R, irr package). Thus, agreement levels above 0.75 were treated as satisfactory benchmarks of consistency. Table 3 shows the distribution of AI-Integrated firms by country and industry. However, out of the 120 firms being selected 48 firms were classified as AI-integrated. Table A1 shows the scalable parameters for AI-Integation.
3.2. Variable Specifications
Table 4 shows the variable definitions and measurements adopted by the study. Tobin’s Q and the Market-to-Sales (M/S) ratio as dependent variables to measure the valuation effect of ESG disclosure. The independent variables are divided into two main categories: Traditional ESG metrics and AI-Integrated ESG disclosure indicators. Traditional ESG scores including both aggregate and component scores (environmental, social, governance) are presented as percentile rankings, AI-Integrated ESG disclosure incorporate binary computation included text analytics such as sentiment polarity via Latent Dirichlet Allocation (LDA), linguistic complexity and readability score of ESG disclosure. The framework includes control and macroeconomic variables which include total assets (logged), return on assets (ROA), percentage of institutional ownership, GDP growth rate, and inflation.
3.3. Natural Language Processing (NLP) Feature Extraction Framework
Figure 1 depicts the process of applying Latent Dirichlet Allocation (LDA) to a set of documents (corporate ESG reports, ESG filings and corporate press releases). The method identifies uncover topics by grouping frequently co-occurring words, producing a collection of topics where each topic is a probability distribution over words, and each document is a probability distribution over topics. This approach enables the systematic detection of disclosure patterns, thematic priorities, and shifts in narrative focus within large volumes of unstructured ESG text (Blei et al., 2003; Higgins et al., 2020; Li et al., 2022).
3.3.1. Topic Taxonomy
Table 5 shows the topic taxonomy which was constructed using LDA architecture to extract ESG-focused textual corpus. Narratively; Topic 0 was linked to the Governance pillar and titled; ESG-Linked Performance and Compliance, as it contained terms related to performance indicators tied to ESG objectives, executive pay structures, supply chain oversight, fair labor enforcement, and audit mechanisms. Topic 1, corresponded to the social pillar; subthemes such as Community Engagement and Workforce Development due to its focus on CSR initiatives, local community programs, educational and healthcare contributions, and workforce training or upskilling. Topic 2, categorized as Governance pillar, which was sub labeled as; Governance, Transparency and Data Security, reflecting strong associations with board independence, corporate transparency, environmental monitoring tools, compliance protocols, privacy safeguards, and information security practices. This taxonomy procedure offers a systematic means of organizing ESG-related themes, translating unstructured text into interpretable categories, and bridging qualitative disclosure content with measurable ESG performance indicators (Blei et al., 2003; Ding et al., 2022). Dynamic Topic Modeling (DTM-lite) applied to corporate disclosures. Dynamic Topic Modeling (DTM-lite) was applied to show the descriptive statistics of topics evaluation over the year as displaced in Table A2 in the Appendix A.
3.3.2. Textual Indexes
Table 6 shows computational textual indexes, this includes sentiment score, linguistic complexity, and readability metrics of ESG-related disclosures. Sentiment scores were generated using the VADER (Valence Aware Dictionary and sEntiment Reasoner) model, which evaluates the tone of text on a scale from −1 (strongly negative) to +1 (strongly positive). Each sentiment score was weighted by topic proportions identified through Latent Dirichlet Allocation (LDA) modelling. The Linguistic Complexity Index captures variation in sentence structure and vocabulary richness, offering insight into the sophistication of language used in disclosures. The Readability Metric was estimated via the Gunning Fog Index which indicates how easily the text can be understood by a general audience. This combined method allows for a more understanding of disclosure quality by linking sentiment with thematic emphasis, language complexity, and readability (Li, 2008; Loughran and McDonald, 2011).
3.4. Predictive Analytics Framework
Figure 2 shows the structured multi-phase predictive analytics framework used to examine the effect of AI-integrated ESG reporting on firm valuation. The framework was classified into three phases; (1) Data collection and processing (2) Feature Engineering and selection, and (3) Model evaluation and Interpretation. In the first phase, data were processed and data verified. The second phase involved data featuring engineering, generation of sample size, this model was trained using a five-fold cross-validation strategy to reduce overfitting and ensure robustness across different data splits, also a grid search approach was applied to fine-tune key hyperparameters. The third phase focuses on model performance evaluation using the Coefficient of Determination (R2) to explain explanatory power. Root Mean Square Error (RMSE) was used to capture prediction variance, and Mean Absolute Error (MAE) to assess overall forecast accuracy. SHAP (Shapley Additive Explanations) was employed to interpret contribution scores of each input variable for individual predictions.
3.5. Econometric Model Specifications
Model 1 (H1):
The specification model is expressed as follows;
Equation (2) extended the first model with AI-derived textual indicators to examine the incremental explanatory power of AI-driven ESG disclosure characteristics. include sentiment score (either positive or negative tone of ESG reports). Sustainability Topics (topic proportions identified via Latent Dirichlet Allocation). Linguistic complexity Index (clarity of disclosure). This extended specification allows testing whether textual qualities of ESG communication captured by AI techniques which influence firm valuation over and above the binary adoption of AI tools. Equation (3), is the interactive effects model, where captures whether firms with AI- enhanced ESG reporting obtain stronger valuation benefits from ESG scores compared to firms without AI adoption.
Model 2 (H2):
Machine Learning (ML)-Based Forecasting Framework: The study estimates two complementary learners:
- (A)
- Elastic Net (linear, sparse and stable)
- (B)
- XGBoost (nonlinear, interactions)
Note: is the additive ensemble of trees .
Hence, Equation (4) to Equation (5), estimates the feature sets of ML evaluation models, this including: donate firm ’s valuation in year . We forecast one year ahead: . Where contains predictors observed at , (Robustness: years ahead). Baseline feature : firm size (log assets), ROA, Institutional ownership, traditional ESG (aggregate and E/S/G Pillars) controversy indicator, macro controls (GDP growth, inflation), and dummies for country X industry and year. Augmented features : plus AI-related ESG inputs: AI-Integrated (0/1), Sentiment (standardized), Readability and Complexity indices (Fog and lexical diversity) and Topic proportions from LDA . Thus, all covariates are lagged to prevent look-ahead bias; text features are built from reports released in or before year .
Model Comparison Evolution
In this study, three machine learning models were used to evaluate predictive performance using error and fit metrics. The model include:
- i.
- Coefficient of determination (Out-of-Sample):
- ii.
- Root Mean Squared Error:
- iii.
- Mean Absolute Error:
4. Empirical Results
4.1. Descriptive Analysis
Table 7 shows that firms across five African nations including South Africa, Nigeria, Egypt, Kenya, and Morocco reveals distinct differences in corporate valuation, ESG reporting standards and the use of AI tools. South African firms exhibit the strongest valuation metrics, with the highest average Tobin’s Q (1.32) and Market–to–Sales ratio (2.85), suggesting greater investor trust and resource efficiency. These companies also lead in ESG performance, consistently scoring highest across environmental, social and governance metrics likely due to more mature regulatory systems and active stakeholder engagement.
However, they also face more ESG-related controversies, which could stem from their greater public exposure and detailed reporting. South Africa demonstrates the most advanced integration of AI in ESG disclosures, with over a third of firms using technologies like machine learning or natural language processing. Kenya and Morocco remain relatively limited. Textual analysis of ESG reports reveals that South African firms communicate with greater clarity, sentiment strength and thematic variety. These patterns correlate with stronger fundamentals such as firm size, profitability and institutional ownership as well as favorable economic conditions like moderate inflation and GDP stability. Thus, firms in Morocco and Kenya show less maturity in ESG practices, AI usage and valuation performance.
Table 8 provides an overview of the central tendency and variability across firms in the sample. The average Tobin’s Q of 1.22 indicates that firms have market values that exceed their book values, this result suggest positive investor sentiment and growth potential. The Market-to-Sales has a mean of 2.62 which reflects that firms’ ability to generate substantial market value relative to their sales. The average ESG overall score is 49.96 which are balanced scores across the Environmental (42.86), Social (48.28) and Governance (58.72) pillars. This highlights moderate ESG performance with governance being the strongest component.
The ESG Controversy Indicator has a mean of 21.9, showing that ESG risks are not negligible across the sample. AI integration into ESG reporting is still emerging, with an average adoption rate of 22.7%, which suggest that fewer than one in four firms currently use AI-based ESG disclosures. Sentiment analysis of ESG narratives reveals a modest average Score (0.11), indicating a generally neutral tone, while sustainability topic intensity (via LDA) averages at 0.24. Textual analytics show moderate complexity and readability levels, with a mean linguistic complexity index of 17.64 and readability score of 15.1. Firm size (log assets) centers around 14.38, with profitability (ROA) at 5.94%, and institutional ownership averaging 36.16%. The macroeconomic environment is relatively stable, with GDP growth averaging 2.98% and inflation around 6.58%.
4.2. Correlation Analysis
Table 9 presents the outcomes of both correlation and multicollinearity assessments for the study’s independent variables. Variance Inflation Factor (VIF) results highlight moderate multicollinearity among key ESG dimensions, specifically Environmental (7.2), Social (6.5), Governance (5.9), and the composite ESG Score (5.3). These figures indicate substantial overlap due to the inherent interdependence of ESG sub-components. Thus, the simultaneous inclusion of all four in regression analysis could compromise model robustness. Moreso, AI-related disclosure variables including AI–Integrated ESG Reporting (1.5), Sentiment Score (2.0), and Linguistic Complexity (2.4) exhibit low VIF values, suggesting minimal collinearity and supporting their inclusion in multivariate estimation without distorting coefficient precision.
The Pearson correlation matrix further supports this view, showing strong correlations between the Overall ESG Score and its sub-elements: environmental (), social (r = 0.82), and governance (r = 0.80). Meanwhile, the ESG Controversy Index shows a negative association (−0.50) with all ESG metrics, indicating that reputational risks are inversely linked with ESG quality. The AI-Integrated ESG variable correlates moderately with both sentiment (r = 0.35) and textual complexity (r = 0.40), reflecting more distinction and strategic disclosure. Larger firms and those with higher institutional ownership also demonstrate stronger ESG engagement, with firm size and institutional holdings showing correlations of 0.45 and 0.50 respectively.
4.3. T-Tests Analysis
Table 10 show the results of a t-test comparing firms that incorporate AI into their ESG disclosures with those that do not. The analysis reveals statistically significant differences in both firm valuation and ESG disclosure characteristics. Companies leveraging AI report a significantly higher average Tobin’s Q (1.39) compared to non-AI firms (1.16), with a mean difference of 0.23 (t = 9.12, p < 0.001). The associated Cohen’s d value of 0.60 indicates a moderate to large effect size, suggesting that markets may assign a valuation premium to firms demonstrating technological sophistication in sustainability reporting. In ESG performance, AI-integrated firms also outperform their counterparts, recording an average ESG score of 61.8 versus 49.2 for non-AI firms (t = 11.75, p < 0.001), with a Cohen’s d of 0.77, representing a large effect.
Sentiment Scores derived from ESG text further distinguish the groups: AI firms average 0.18, while non-AI firms score 0.09 (t = 4.90, p < 0.001), with a Cohen’s d of 0.36, reflecting a moderate effect. This could be attributed to the use of NLP and machine learning techniques that frame content more positively or emphasize strengths. Moreover, linguistic complexity in ESG reporting is strongly higher for AI-integrated firms (19.2 vs. 17.5; t = 7.30, p < 0.001), and the effect size (Cohen’s d = 0.48) suggests a moderate difference, possibly due to AI-generated content or the inclusion of more technical ESG language. However, this complexity may signal professionalism and depth and it could also limit accessibility for non-specialist stakeholders.
Figure 3 show the firm valuation and AI-ESG reporting. The left chart presents a boxplot illustrating the distribution of Tobin’s Q for companies that apply AI in ESG reporting versus those using conventional approaches. Firms with AI-enhanced ESG practices generally report higher median valuation scores, suggesting potential investor preference or perceived strategic advantage. The right bar chart highlights the proportion of firms adopting AI-driven ESG reporting across selected African countries, showing South Africa as the leader, with Egypt and Nigeria indicating differences in digital ESG adoption across regions.
4.4. Baseline Regression Results
Table 11 shows the result of regression analysis using Panel A and Panel B to explain the four models’ performance. In Panel A, which uses the logarithm of Tobin’s Q as the dependent variable, Model 1 begins with only the binary variable for AI–integrated ESG reporting and year fixed effects. The coefficient on AI with indicates a strong positive relationship with firm valuation, and the model achieves an R2 of 0.358. However, without controlling for other factors, this baseline model is limited in explanatory depth. Model 2 introduces the ESG Overall Score, firm size (log of total assets), and return on assets (ROA). These additions improve explanatory power of R2 to 0.443 and the AI coefficient remains significant at . This result suggests that both ESG performance and firm-specific fundamentals contribute significantly to market valuation. In Model 3, macroeconomic controls such as GDP growth and inflation, textual variables such as sentiment, topic diversity, linguistic complexity and firm fixed effects are included. This results in a substantial increase in R2 to 0.579, with the AI variable still positive and significant at . Model 4 integrate interaction term between AI and ESG scores. Although, the interaction is not statistically significant, the AI coefficient at and ESG score at maintain their significance. The model’s descriptive power improves to R2 of 0.602 and an adjusted R2 of 0.479, suggesting the most robust specification in Panel A.
Table 12 shows the results of Panel B, the model employed Market-to-Sales Multiple as the dependent variable. Model 1 includes only the AI indicator, yielding an R2 of 0.366 and a coefficient of , indicating a comparable valuation premium. Adding ESG scores and firm controls in Model 2 raises the R2 to 0.454, with the AI effect still significant at . Model 3 incorporates qualitative and macro variables, increasing the R2 to 0.570. The AI coefficient remains significant at , which highlighting its consistent influence. Finally, Model 4 which include the interaction term, which again does not reach significance. Nevertheless, the AI variable at continues to exert a meaningful positive effect, with an R2 of 0.581 and adjusted R2 of 0.456. Across both panels, the stepwise inclusion of ESG scores, financial data, macroeconomic indicators, and AI-enhanced text features significantly improves model performance. However, the consistent significance of the AI indicator throughout all models confirms its strong association with higher firm valuation, independent of ESG score levels. This result suggests that investors may perceive AI-enabled ESG reporting as a signal of transparency, innovation and governance quality. The failure of the interaction term to reach significance implies that while both ESG and AI independently enhance firm value, their combined presence does not produce a synergistic effect.
4.5. Robustness Tests
Table 13 shows the result of robustness and endogeneity analyses. Panel A uses a two-stage least squares (2SLS) instrumental variable approach to address potential endogeneity between firm value and AI-integrated ESG practices. Thus, the instruments lagged AI ESG scores and the Oxford AI Readiness Index are both externally relevant and statistically strong, as indicated by first-stage F-statistics above 17. The results show that predicted AI-driven ESG activity significantly improves firm valuation. Specifically, firms with higher levels of AI-integrated ESG show an increase in Tobin’s Q at 0.061 and in M/S multiple at 0.067, with both results statistically significant at the 1% level. The ESG overall score also has a positive, independent effect, suggesting that both the quality of ESG performance and the way it is managed through AI systems matter to investors. Panel B tests the robustness of this relationship using Propensity Score Matching (PSM), which allows for a comparison of firms with similar characteristics aside from their use of AI in ESG practices. Matching variables include firm size, profitability, institutional ownership and key macroeconomic indicators like GDP growth and inflation.
The analysis shows that AI-using firms consistently achieve higher valuation outcomes. Under Nearest Neighbor matching, the average treatment effect on Tobin’s Q is 0.073 and on the M/S multiple is 0.079, both highly significant. Kernel matching delivers nearly identical estimates, reinforcing the finding that the valuation difference is not simply a reflection of underlying firm traits but is plausibly attributable to the use of AI in ESG. Panel C further tests the relationship using lagged independent variables to capture whether AI-ESG integration has a sustained effect on future firm value. The lagged model confirms that firms with AI-driven ESG reporting in the prior period tend to have higher market valuation in the current period. The effect remains statistically significant, with coefficients of 0.055 for Tobin’s Q and 0.059 for M/S multiple. However, lagged ESG score is also significant, its impact is more modest, suggesting that the integration of AI offers an additional boost in credibility, transparency and performance that investors reward over time. These results offer consistent empirical support for the idea that AI-enhanced ESG reporting is not only beneficial for sustainability disclosures but also contributes directly to a firm’s financial market value.
4.6. Model Evaluation of Predictive Analytics
Table 14 shows the descriptive information including the minimum, maximum and the mean values for the dataset employed for the prediction across train, validation and test subsets. This result provides the statistical information about the distribution and characteristics of dataset. Table 15 shows the model performance of predictive models for estimating firm valuation. The comparison evaluation indicates that XGBoost delivers the most robust performance in attaining the highest R2 score of alongside the lowest RMSE and MAE values. These results were found to be statistically superior to all other models, including Random Forest, as confirmed by a Wilcoxon signed-rank test . Random Forest itself demonstrated reliable predictive capabilities with an R2 of and significantly outperformed the Elastic Net model , underscoring its ability to capture nonlinear relationships in the data.
Elastic Net, which balances L1 and L2 penalties, achieved an R2 of and showed a meaningful enhancement over the OLS baseline (, paired t-test), validating its suitability for correlated and high-dimensional variables. Conversely, Support Vector Regression (SVR) exhibited only a marginal increase in explanatory power (R2 = ) and did not yield statistically significant improvement over OLS (), suggesting limited applicability in this particular setting. Overall, these results reinforce the empirical value of ensemble learning algorithms particularly XGBoost and Random Forest in improving prediction accuracy when modeling firm value in conjunction with AI-enhanced ESG data (Breiman, 2001; Chen and Guestrin, 2016). Table A3 in the Appendix A show the feature selected datasets.
Figure 4 presents a comparative performance analysis of five predictive models based on R2 scores, RMSE, and MAE. Among the evaluated models, XGBoost stands out by achieving the highest predictive accuracy and lowest error margins, followed closely by Random Forest and Elastic Net. In contrast, OLS Linear and SVR models exhibit weaker predictive capabilities, suggesting their limitations in modeling complex firm valuation using AI-integrated ESG data.
4.6.1. Classification Tasks
Table 16 shows the results of XGBoost classifier, which demonstrates high effectiveness across all primary classification metrics, though some deviation from benchmark thresholds remains. It achieved a classification accuracy of 96.8% , indicating strong generalization, albeit narrowly missing the target of 98.5% goal. The F1 Score, balanced indicator of precision and recall, was suggesting reliable performance in handling potential class imbalances, though marginally under the 0.99 aspirational threshold. For class-specific metrics, the Precision for Class 1 reached 0.935 (±0.01), implying a small tendency for false positives and a gap from the 0.96 objective. In contrast, the Recall for Class 1 stands out at , signaling near-perfect sensitivity, particularly important trait when identifying rare or high-risk instances, such as ESG compliance breaches or anomaly detection in financial audits.
Furthermore, the ROC-AUC score of points to excellent class discrimination, although slightly below the optimal > 0.99 mark. Collectively, these results reinforce the appropriateness of XGBoost for complex and multidimensional classification tasks. Its capacity to handle structured data with high predictive fidelity is well-established in the literature. For instance, Chen and Guestrin (2016) highlight its superior performance due to iterative boosting and regularization strategies. Similarly, Brownlee (2020) and Shwartz-Ziv and Armon (2022) validate its utility in financial and risk-related domains, where interpretability and model stability are crucial. The plot (Figure 5, Figure 6, Figure 7 and Figure 8) below shows the interpretability of the performance classification achieved by XGBoost algorithm.
4.6.2. Feature Importance and Classification Performance
The SHAP analysis as shown in Figure 9 highlights the key drivers of firm valuation predictions. The AI-Integrated ESG Indicator shows the highest impact (SHAP = 0.073), suggesting that firms using AI in ESG reporting are linked to higher predicted valuations. ESG Score also contributes strongly (SHAP = 0.059), reinforcing the importance of sustainability performance. Financial indicators like ROA (0.041) and firm size (0.038) have moderate influence, while variables such as institutional ownership, Rand & D intensity, industry, and GDP growth show lower predictive importance.
Figure 10 show the industry feature contributions across five industries. In Manufacturing and Industrials, AI-Integrated ESG is the dominant driver (), with ROA and Rand & D playing supportive roles. In Energy, AI-ESG (0.060) still leads, though financial factors have less weight. Consumer Goods firms show equal influence from AI-ESG and ROA both at 0.050, thus, Rand & D is less significant. In Telecommunications, Rand & D has its highest impact at 0.035, reflecting the sector’s focus on innovation with AI-ESG and ROA also contributing significantly.
4.6.3. Confusion Analysis
Figure 11 shows the confusion matrix of performance evaluation tools. This technique was popularised in machine learning by Powers (2011). This analytical framework is designed to evaluate the predictive performance of classification models by actualising correct and incorrect predictions across defined classes. However, this study adopted a confusion matrix to pragmatically evaluate the classification capacity of the AI-integrated ESG model in distinguishing between firms with AI-enhanced and non-AI ESG reporting practices.
The method was selected due to its ability to provide a comprehensive view of the model’s discriminative power through key metrics such as accuracy, precision, and recall to validate the robustness and practical applicability of predictive models (Powers, 2011; Chicco and Jurman, 2020). The model demonstrated near-perfect classification accuracy; it accurately identified all 48 firms with AI-integrated ESG reporting as belonging to the high-valuation category and accurately classified 71 out of 72 non-AI-reporting firms in the lower valuation category, with only one misclassification. These results estimate the model’s ability to distinguish firms based on the quality and technological advancement of their ESG disclosure practices, as linked to firm valuation outcomes. Table A4 in the Appendix A shows the descriptive analysis of the confusion matrix.
5. Discussion of Findings
5.1. Theoretical Contributions
This research improves literature by showing that firms which integrate AI tools into their ESG reporting procedure achieve a scalable valuation advantage in developing markets. Thus, the results strengthen arguments from signaling theory, as AI-based disclosures appear to function as credible markers of transparency, innovation capability, and managerial effectiveness. Furthermore, the evidence that ensemble learning techniques, such as XGBoost and Random Forest, produce more reliable predictions than linear models indicate the need to account for non-linear dynamics in the ESG–valuation relationships. These findings extend both resource-based and stakeholder perspectives by highlighting the implications of digital competencies in amplifying the value of sustainability practices.
5.2. Managerial Implications
The findings point to AI-enhanced ESG reporting as more than a compliance measure; this is a strategic avenue for improving firm reputation and market value. Investors seem to assign higher valuations to companies that adopt advanced analytical methods in sustainability communication. Managers should also pay attention to textual characteristics of their reports. For instance, positive sentiment and moderate linguistic sophistication tend to strengthen investor confidence, whereas excessive complexity may create barriers for broader audiences. This finding suggests a need for balancing technical rigor with accessibility when designing ESG disclosures.
5.3. Policy Relevance
The study underlines that the use of advanced reporting technologies and AI-assisted approaches in sustainability disclosures can help address information gaps, build investor confidence, and foster healthier market conditions. The strong valuation effects linked to Environmental and Social dimensions suggest that these areas deserve greater regulatory attention. Additionally, firms facing ESG controversies experience penalties highlights the need for robust enforcement mechanisms and transparent disclosure standards to protect market integrity.
5.4. Limitations and Further Research
The study was limited in his approach, the analysis is restricted to non-financial firms in emerging markets, which may limit the generalizability of the results to financial institutions or developed economies. It also depends on secondary ESG data raises concerns about measurement consistency, reporting biases, and cross-country comparability. The study also captures outcomes within a medium-term timeframe, leaving the longer-term effects of AI integration open for further examination. Future research could extend the scope to include cross-market comparisons, sector-specific analyses, and alternative AI techniques such as deep learning models to uncover additional perspective.
6. Conclusions
This paper assessed how the use of AI in ESG reporting influences the valuation of firms operating in the selected Africa countries. The study found that technology-assisted disclosures improve the explanatory depth of ESG data and valuation predictions. Thus, companies that integrate AI tools in their sustainability communication tend to achieve stronger valuation outcomes, particularly when environmental and social performance is emphasized. In contrast, governance-related indicators were less reliable predictors, this suggest that their influence depends heavily on institutional and reporting contexts. The results further revealed that exposure to ESG controversies significantly undermines firm value which underscores the financial consequences of reputational risk. However, the results showed that textual elements such as tone, clarity, and complexity contribute valuable insights, demonstrating that the way sustainability information is communicated can affect how it is interpreted by the market. Therefore, the study provides several implications. First, for business practitioner, AI-supported ESG reporting should be viewed as a strategic resource for strengthening credibility and attracting investor confidence. Secondly, for investors, the findings emphasis that the value of incorporating AI-derived metrics and textual features into valuation models capture risks and opportunities more effectively. Thirdly, Policymakers may also use these findings to design regulatory frameworks that encourage innovation in reporting practices while reducing information gaps. Finally, the study suggests that AI-enhanced ESG disclosure is not only a reporting innovation but also an emerging capability that can create scalable value for firms in emerging markets.
Abbreviations
The following abbreviations are used in the manuscript:
| AI | Artificial Intelligence |
| AII | AI-Integrated |
| NAII | Non-AI Integrated |
| ESG | Environmental, Social, and Governance |
| ML | Machine Learning |
| NLP | Natural Language Processing |
| LDA | Latent Dirichlet Allocation |
| DTM-lite | Dynamic Topic Modeling (lite version) |
| OLS | Ordinary Least Squares |
| SVR | Support Vector Regression |
| RBV | Resource-Based View |
| ROA | Return on Assets |
| GDP | Gross Domestic Product |
| MAE | Mean Absolute Error |
| R2 | Coefficient of Determination |
| 2SLS | Two-Stage Least Squares |
| PSM | Propensity Score Matching |
| ATE | Average Treatment Effect |
| CSR | Corporate Social Responsibility |
| KPI | Key Performance Indicator |
| R&D | Research and Development |
Appendix A

Table A1.
AI-ESG Integration Framework.
| Component | Description | Score/Weight | Notes/Clarification |
|---|---|---|---|
| Scoring Scale | No Evidence/Not Mentioned | 0 | No public or internal indication of AI use in ESG processes |
| Exploratory Pilot/Initial Testing | 1 | Early-stage projects, R&D, or trials, but not consistent or formal | |
| Partial Use (<50% of ESG activities) | 2 | AI used in isolated ESG functions or internally only | |
| Broad Use (in multiple ESG operations or reports) | 3 | Integrated across several ESG tools or included in disclosures | |
| Strategic Integration (Core to ESG policy and reporting standards) | 4 | Institutionalized AI in ESG strategy, with clear visibility in external reporting | |
| Feature Weights | Machine Learning | 30% | Core for predictions, classification, and financial-environmental modeling |
| Natural Language Processing (NLP) | 20% | Crucial for text mining, sentiment analysis, and regulatory parsing | |
| Automated ESG Scoring Tools | 30% | Key for standardized benchmarking and investor communications | |
| AI-Driven Analytics | 20% | Useful for real-time ESG monitoring and dashboard reporting | |
| Scoring Formula | Normalized Weighted Score | – | 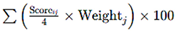 |
| Integration Levels | Low | 0–30% | Little to no meaningful adoption |
| Moderate | 31–60% | Some integration but fragmented or informal | |
| Strong | 61–80% | High-functioning AI use, consistent across several ESG areas | |
| Advanced | 81–100% | AI is an embedded, strategic tool in ESG governance and disclosures |
Table A2.
Topic evolution + sentiment layering.
| Year | Topic 0 | Topic 1 | Topic 2 |
|---|---|---|---|
| 2018 | 0.489626 | 0.187525 | 0.322849 |
| 2019 | 0.352826 | 0.211438 | 0.435736 |
| 2020 | 0.196337 | 0.481482 | 0.322182 |
| 2021 | 0.37969 | 0.138141 | 0.482169 |
| 2022 | 0.275539 | 0.29565 | 0.428811 |
| 2023 | 0.500339 | 0.344187 | 0.155474 |
| 2024 | 0.330911 | 0.303754 | 0.365335 |
Table A3.
List of feature selected datasets.
| Feature | OLS/Baseline | Elastic Net (Regularized selection) |
XGBoost (Tree-based importance) |
SVR (PCA-compressed) |
|---|---|---|---|---|
| AI-Integrated ESG Indicator | ✔ | ✔ | ✔ | ✔ |
| ESG Overall Score | ✔ | ✔ | ✔ | ✔ |
| Return on Assets (ROA) | ✔ | ✔ | ✔ | ✔ |
| ln (Firm Assets) | ✔ | ✔ | ✔ | |
| Institutional Ownership (%) | ✔ | ✔ | ✔ | ✔ |
| R & D Intensity | ✔ | ✔ | ✔ | ✔ |
| Industry FE (Tech Sector) | ✔ | ✔ | ||
| Country GDP Growth | ✔ | ✔ | ✔ | |
| Governance Score | ✔ | ✔ | ||
| Social Score | ✔ | ✔ | ||
| Environmental Score | ✔ | ✔ |
Table A4.
Classification Performance Report—AI-Integrated vs. Non-AI ESG Reporting.
| Metric | AI-Integrated ESG (High Valuation) | Non-AI ESG (Low Valuation) | Overall |
|---|---|---|---|
| True Positives (TP) | 48 | 71 | – |
| False Positives (FP) | 0 | 1 | – |
| False Negatives (FN) | 0 | 1 | – |
| True Negatives (TN) | 72 | 48 | – |
| Accuracy | – | – | 99.31% |
| Precision | 100% | 98.61% | – |
| Recall (Sensitivity) | 100% | 98.61% | – |
| F1 Score | 100% | 98.61% | 99.30% |
| AUC-ROC (est.) | – | – | >0.99 |
References
- Barney, Jay. 1991. “Firm Resources and Sustained Competitive Advantage.” Journal of Management 17 (1): 99–120. [CrossRef]
- Blei, David M., Andrew Y. Ng, and Michael I. Jordan. 2003. “Latent Dirichlet Allocation.” Journal of Machine Learning Research 3: 993–1022. http://jmlr.csail.mit.edu/papers/v3/blei03a.html.
- Breiman, Leo. 2001. “Random Forests.” Machine Learning 45 (1): 5–32. [CrossRef]
- Brownlee, Jason. 2020. Data Preparation for Machine Learning: Data Cleaning, Feature Selection, and Data Transforms in Python. Machine Learning Mastery.
- Chen, Tianqi, and Carlos Guestrin. 2016. “XGBoost: A Scalable Tree Boosting System.” In Proceedings of the 22nd ACM SIGKDD International Conference on Knowledge Discovery and Data Mining (KDD ’16), 785–794. [CrossRef]
- Cheng, Beiting, Ioannis Ioannou, and George Serafeim. 2014. “Corporate Social Responsibility and Access to Finance.” Strategic Management Journal 35 (1): 1–23. [CrossRef]
- Chicco, Davide, Matthijs J. Warrens, and Giovanni Jurman. 2021. “The Coefficient of Determination R2: Analogies and Applications.” Journal of Computational and Graphical Statistics 30 (4): 1061–71. [CrossRef]
- Côrte-Real, Nuno, Pedro Ruivo, and Tiago Oliveira. 2020. “Leveraging Internet of Things and Big Data Analytics Initiatives in European and American Firms: Is Data Quality a Way to Extract Business Value?” Information and Management 57 (1): 1–16. [CrossRef]
- Delery, John E., and Dimitra Roumpi. 2017. “Strategic Human Resource Management, Human Capital and Competitive Advantage: Is the Field Going in Circles?” Human Resource Management Journal 27 (1): 1–21. [CrossRef]
- Ding, Haoran, Jinxin Xiao, and Xiang Ding. 2022. “Does Artificial Intelligence Technology Affect ESG Disclosure? Evidence from Chinese Listed Firms.” Journal of Cleaner Production 368: 133106. [CrossRef]
- Dubey, Rameshwar, David J. Bryde, Christian Blome, David Roubaud, and Michail Giannakis. 2021. “Facilitating Artificial Intelligence Powered Supply Chain Analytics through Alliance Management during the Pandemic Crises in the B2B Context.” Industrial Marketing Management 96: 135–46. [CrossRef]
- Eccles, Robert G., and Michael P. Krzus. 2018. “The Nordic Model: An Analysis of Leading Practices in ESG Disclosure.” Nordic Journal of Business 67 (1): 4–25.
- Eccles, Robert G., Ioannis Ioannou, and George Serafeim. 2014. “The Impact of Corporate Sustainability on Organizational Processes and Performance.” Management Science 60 (11): 2835–57. [CrossRef]
- Eccles, Robert G., and Jean-Christophe Stroehle. 2018. “Exploring Social Origins in the Construction of ESG Measures.” SSRN Electronic Journal. [CrossRef]
- El Ghoul, Sadok, Omrane Guedhami, Chuck C. Y. Kwok, and Dev R. Mishra. 2011. “Does Corporate Social Responsibility Affect the Cost of Capital?” Journal of Banking and Finance 35 (9): 2388–2406. [CrossRef]
- Fatemi, Ali, Martin Glaum, and Stefanie Kaiser. 2018. “ESG Performance and Firm Value: The Moderating Role of Disclosure.” Global Finance Journal 38: 45–64. [CrossRef]
- Floridi, Luciano, and Josh Cowls. 2022. “A Unified Framework of Five Principles for AI in Society.” Harvard Data Science Review 4 (1). [CrossRef]
- Freeman, R. Edward. 1984. Strategic Management: A Stakeholder Approach. Boston, MA: Pitman.
- Friede, Gunnar, Timo Busch, and Alexander Bassen. 2015. “ESG and Financial Performance: Aggregated Evidence from More than 2000 Empirical Studies.” Journal of Sustainable Finance and Investment 5 (4): 210–33. [CrossRef]
- Grewal, Jody, Clarissa Hauptmann, and George Serafeim. 2020. “Material Sustainability Information and Stock Price Informativeness.” Journal of Accounting and Economics 70 (2–3): 101344. [CrossRef]
- Higgins, Colin, Wendy Stubbs, and Tim Love. 2020. “Walking the Talk(s): Organisational Narratives of Integrated Reporting.” Accounting, Auditing and Accountability Journal 33 (2): 292–324. [CrossRef]
- Huang, Yixuan, Jing Yu, and Seong Lee. 2022. “Machine Learning–Based ESG Data Processing and Firm Valuation.” Finance Research Letters 46: 102303. [CrossRef]
- Hyndman, Rob J., and Anne B. Koehler. 2006. “Another Look at Measures of Forecast Accuracy.” International Journal of Forecasting 22 (4): 679–88. [CrossRef]
- Ioannou, Ioannis, and George Serafeim. 2015. “The Impact of Corporate Social Responsibility on Investment Recommendations.” Strategic Management Journal 36 (7): 1053–81. [CrossRef]
- Khanna, Tarun, and Krishna G. Palepu. 2010. Winning in Emerging Markets: A Road Map for Strategy and Execution. Boston: Harvard Business Press.
- Koelbel, Julian F., and Roberto Rigobon. 2022. “ESG Confusion and Stock Returns: Tackling the Problem of Noise.” NBER Working Paper No. 30562. [CrossRef]
- KPMG. 2021. The Time Has Come: The KPMG Survey of Sustainability Reporting 2020. Amstelveen: KPMG International. https://home.kpmg/xx/en/home/insights/2020/11/the-time-has-come-survey-of-sustainability-reporting.html.
- Leung, Danny, and Robin Snell. 2021. “Artificial Intelligence and the Evolution of ESG Investing.” Journal of Sustainable Finance and Investment 11 (3): 239–58. [CrossRef]
- Li, Feng. 2008. “Annual Report Readability, Current Earnings, and Earnings Persistence.” Journal of Accounting and Economics 45 (2–3): 221–47. [CrossRef]
- Loughran, Tim, and Bill McDonald. 2011. “When Is a Liability Not a Liability? Textual Analysis, Dictionaries, and 10-Ks.” Journal of Finance 66 (1): 35–65. [CrossRef]
- Ntim, Collins G., Kwaku K. Opong, and Jo Danbolt. 2015. “Board Size, Corporate Regulations, and Firm Valuation in an Emerging Market: A Simultaneous Equation Approach.” International Review of Applied Economics 29 (2): 194–220. [CrossRef]
- OECD. 2022. OECD Economic Outlook, Volume 2022 Issue 2: Confronting the Crisis. Paris: OECD Publishing. [CrossRef]
- ———. 2023. 2023 OECD Open, Useful and Re-usable Data (OURdata) Index: Results and Key Findings. OECD Public Governance Policy Papers, No. 43. Paris: OECD Publishing. [CrossRef]
- Onwere, Anthony T. 2024. “Does Environment, Social and Governance Practices Improve Firm Value in Sub-Saharan Africa?” African Development Finance Journal 7 (1): 24–43. [CrossRef]
- Powers, David M. W. 2011. “Evaluation: From Precision, Recall and F-Measure to ROC, Informedness, Markedness and Correlation.” Journal of Machine Learning Technologies 2 (1): 37–63. [CrossRef]
- Shwartz-Ziv, Ravid, and Amit Armon. 2022. “Tabular Data: Deep Learning Is Not All You Need.” Information Fusion 81: 84–90. [CrossRef]
- Spence, Michael. 2002. “Signaling in Retrospect and the Informational Structure of Markets.” American Economic Review 92 (3): 434–59. [CrossRef]
- Wamba, Samuel Fosso, Maciel M. Queiroz, and Luca Trinchera. 2021. “Big Data Analytics Capabilities and Firm Performance: The Mediating Role of Stakeholder Trust.” Technological Forecasting and Social Change 167: 120728. [CrossRef]
- World Bank. 2022. World Development Report 2022: Finance for an Equitable Recovery. Washington, DC: World Bank. [CrossRef]
- Yu, Eugene P., and Bao V. Luu. 2021. “International Variations in ESG Disclosure—Do Cross-Listed Companies Care More?” International Review of Financial Analysis 75: 101731. [CrossRef]
Figure 1.
LDA Based Workflow for Topics Modelling.
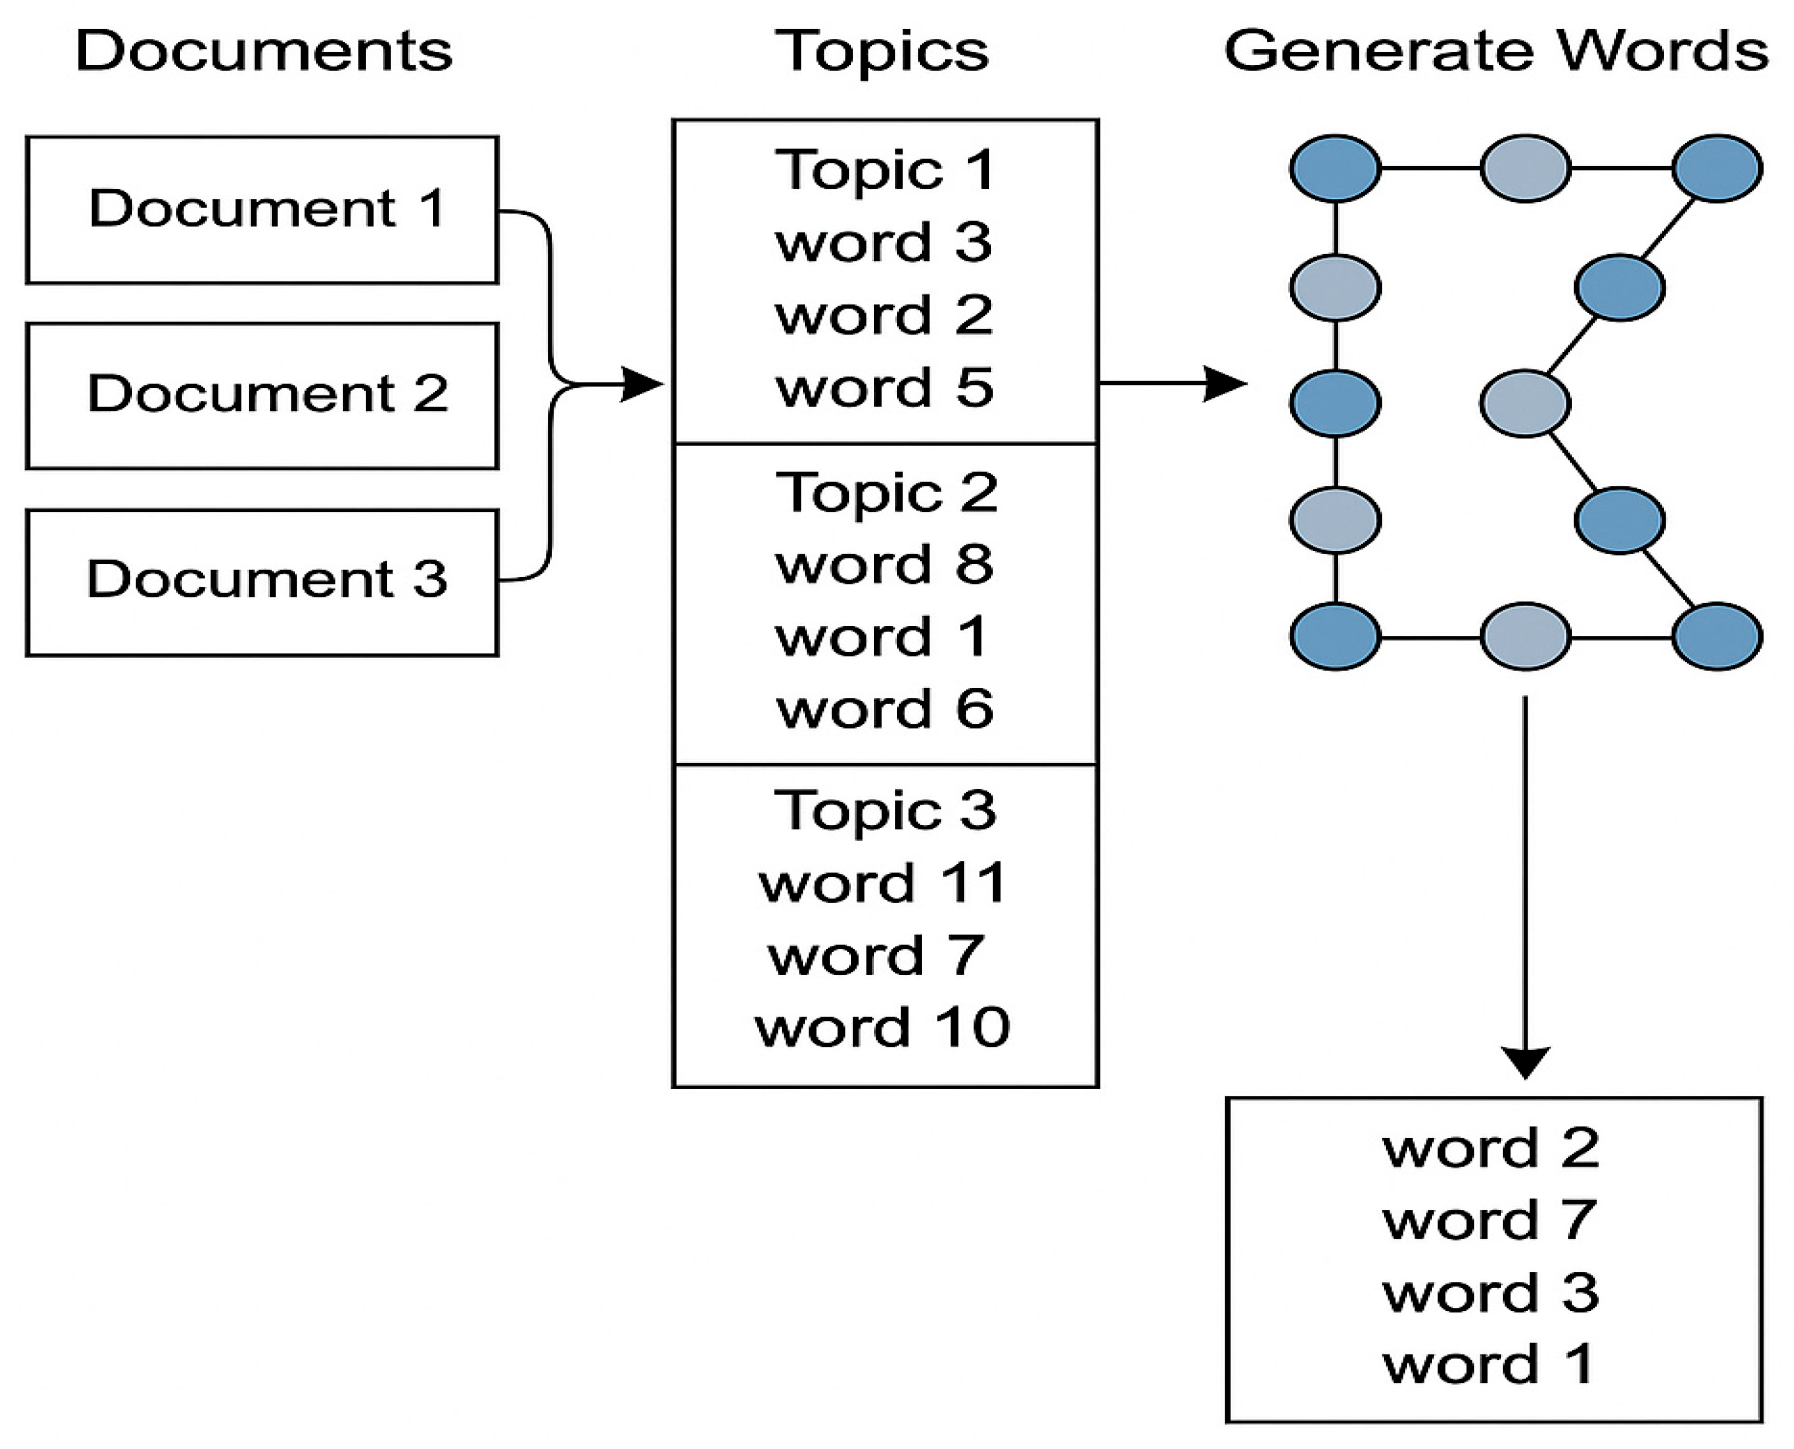
Figure 2.
Methodological framework.
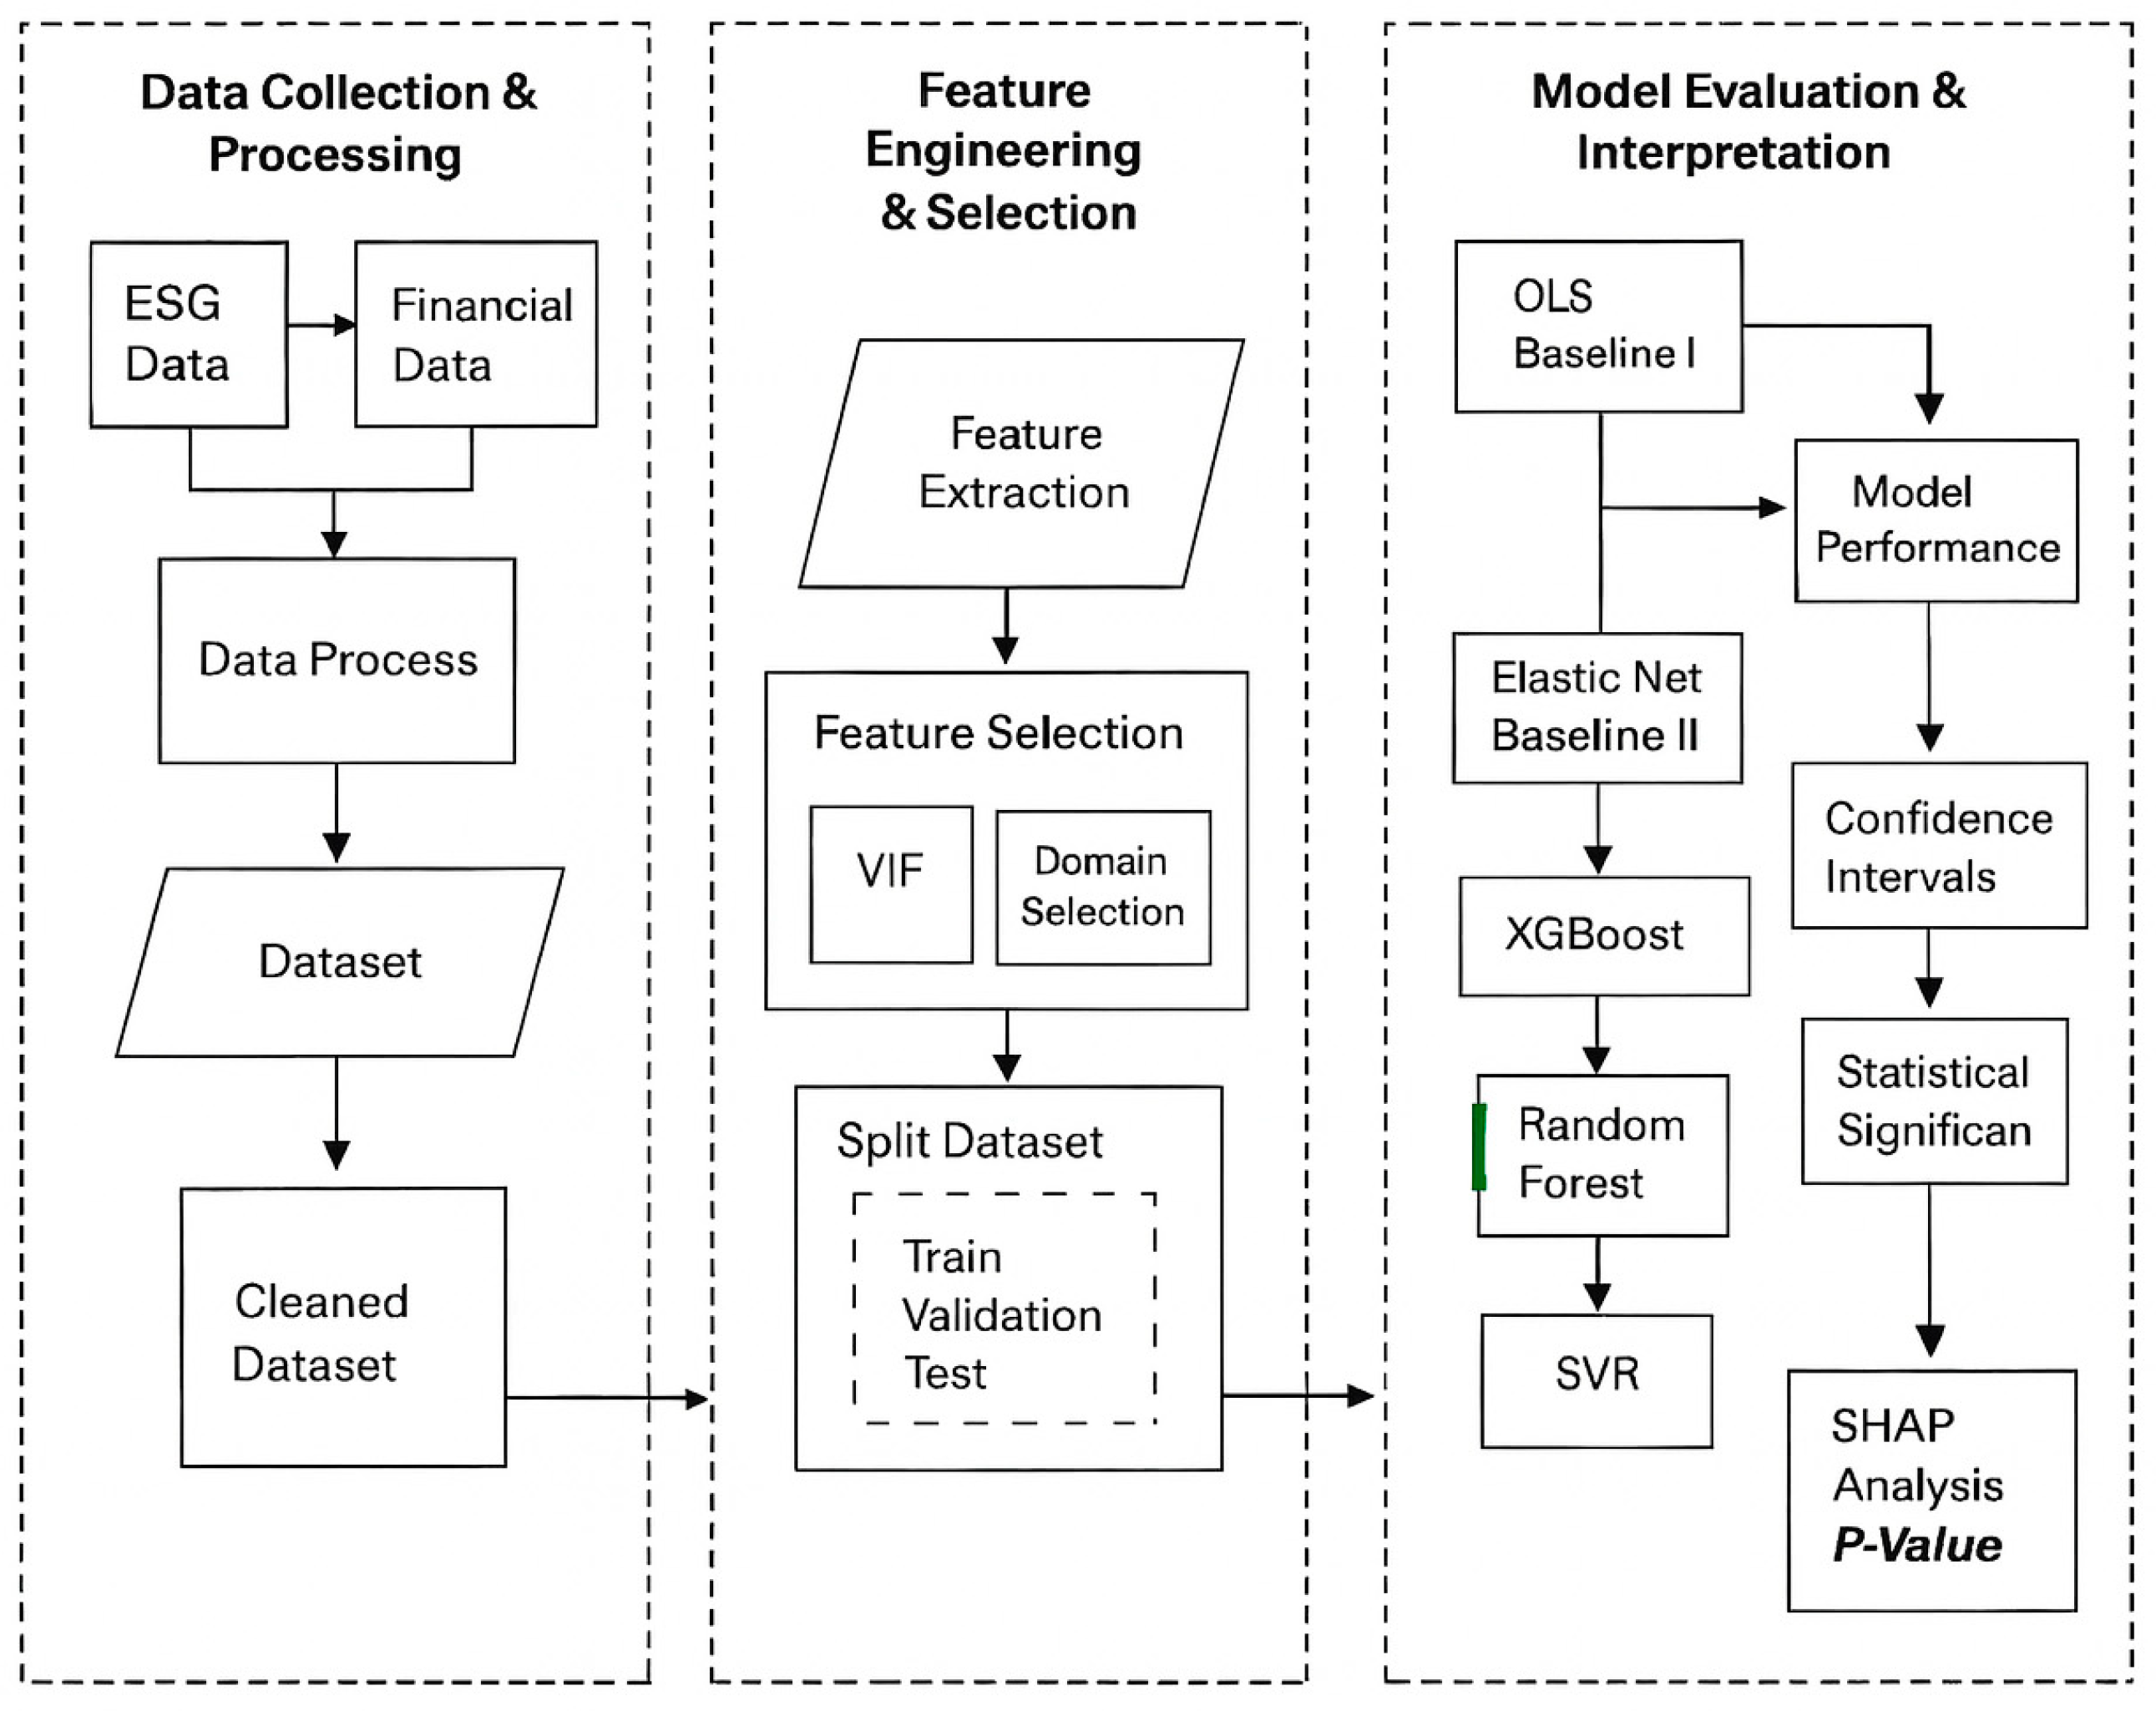
Figure 3.
Firm Valuation and AI-Driven ESG Reporting by Country.
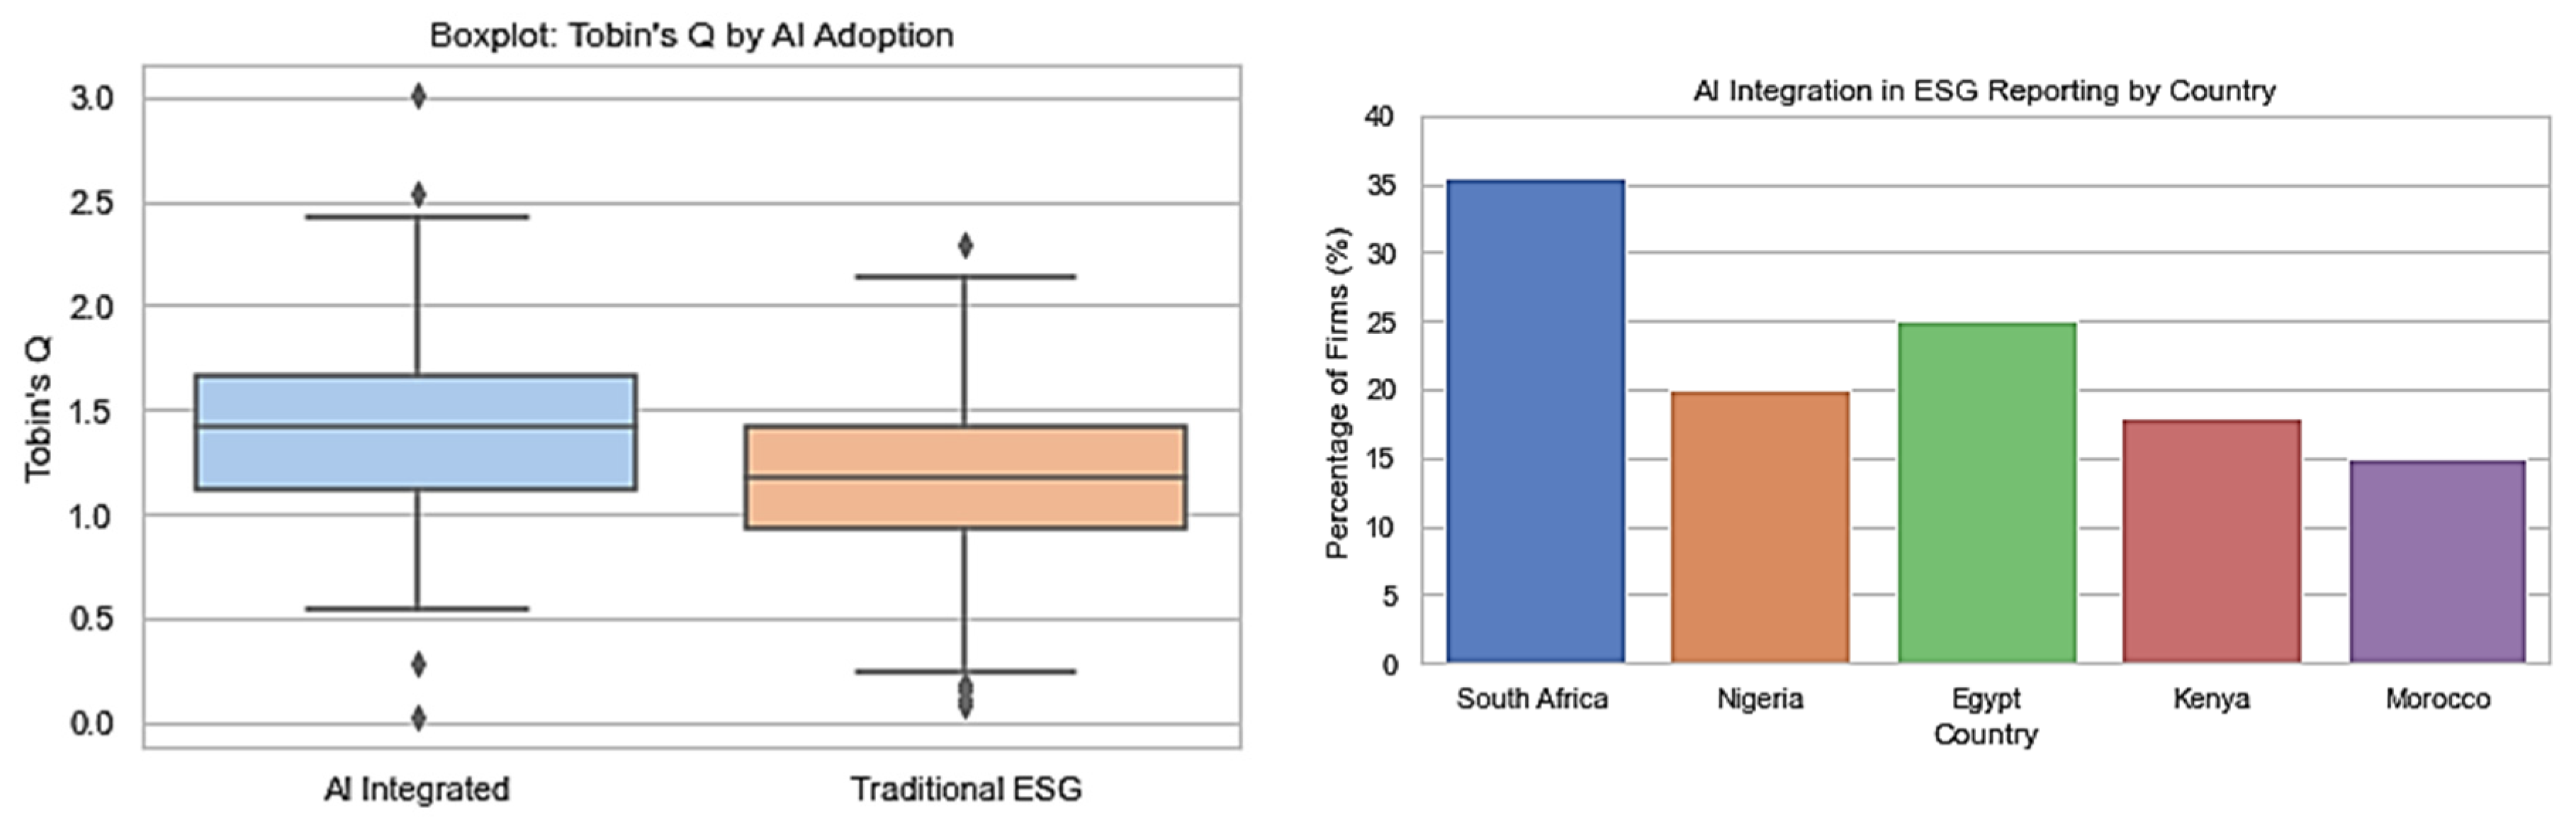
Figure 4.
Model Performance Comparison.
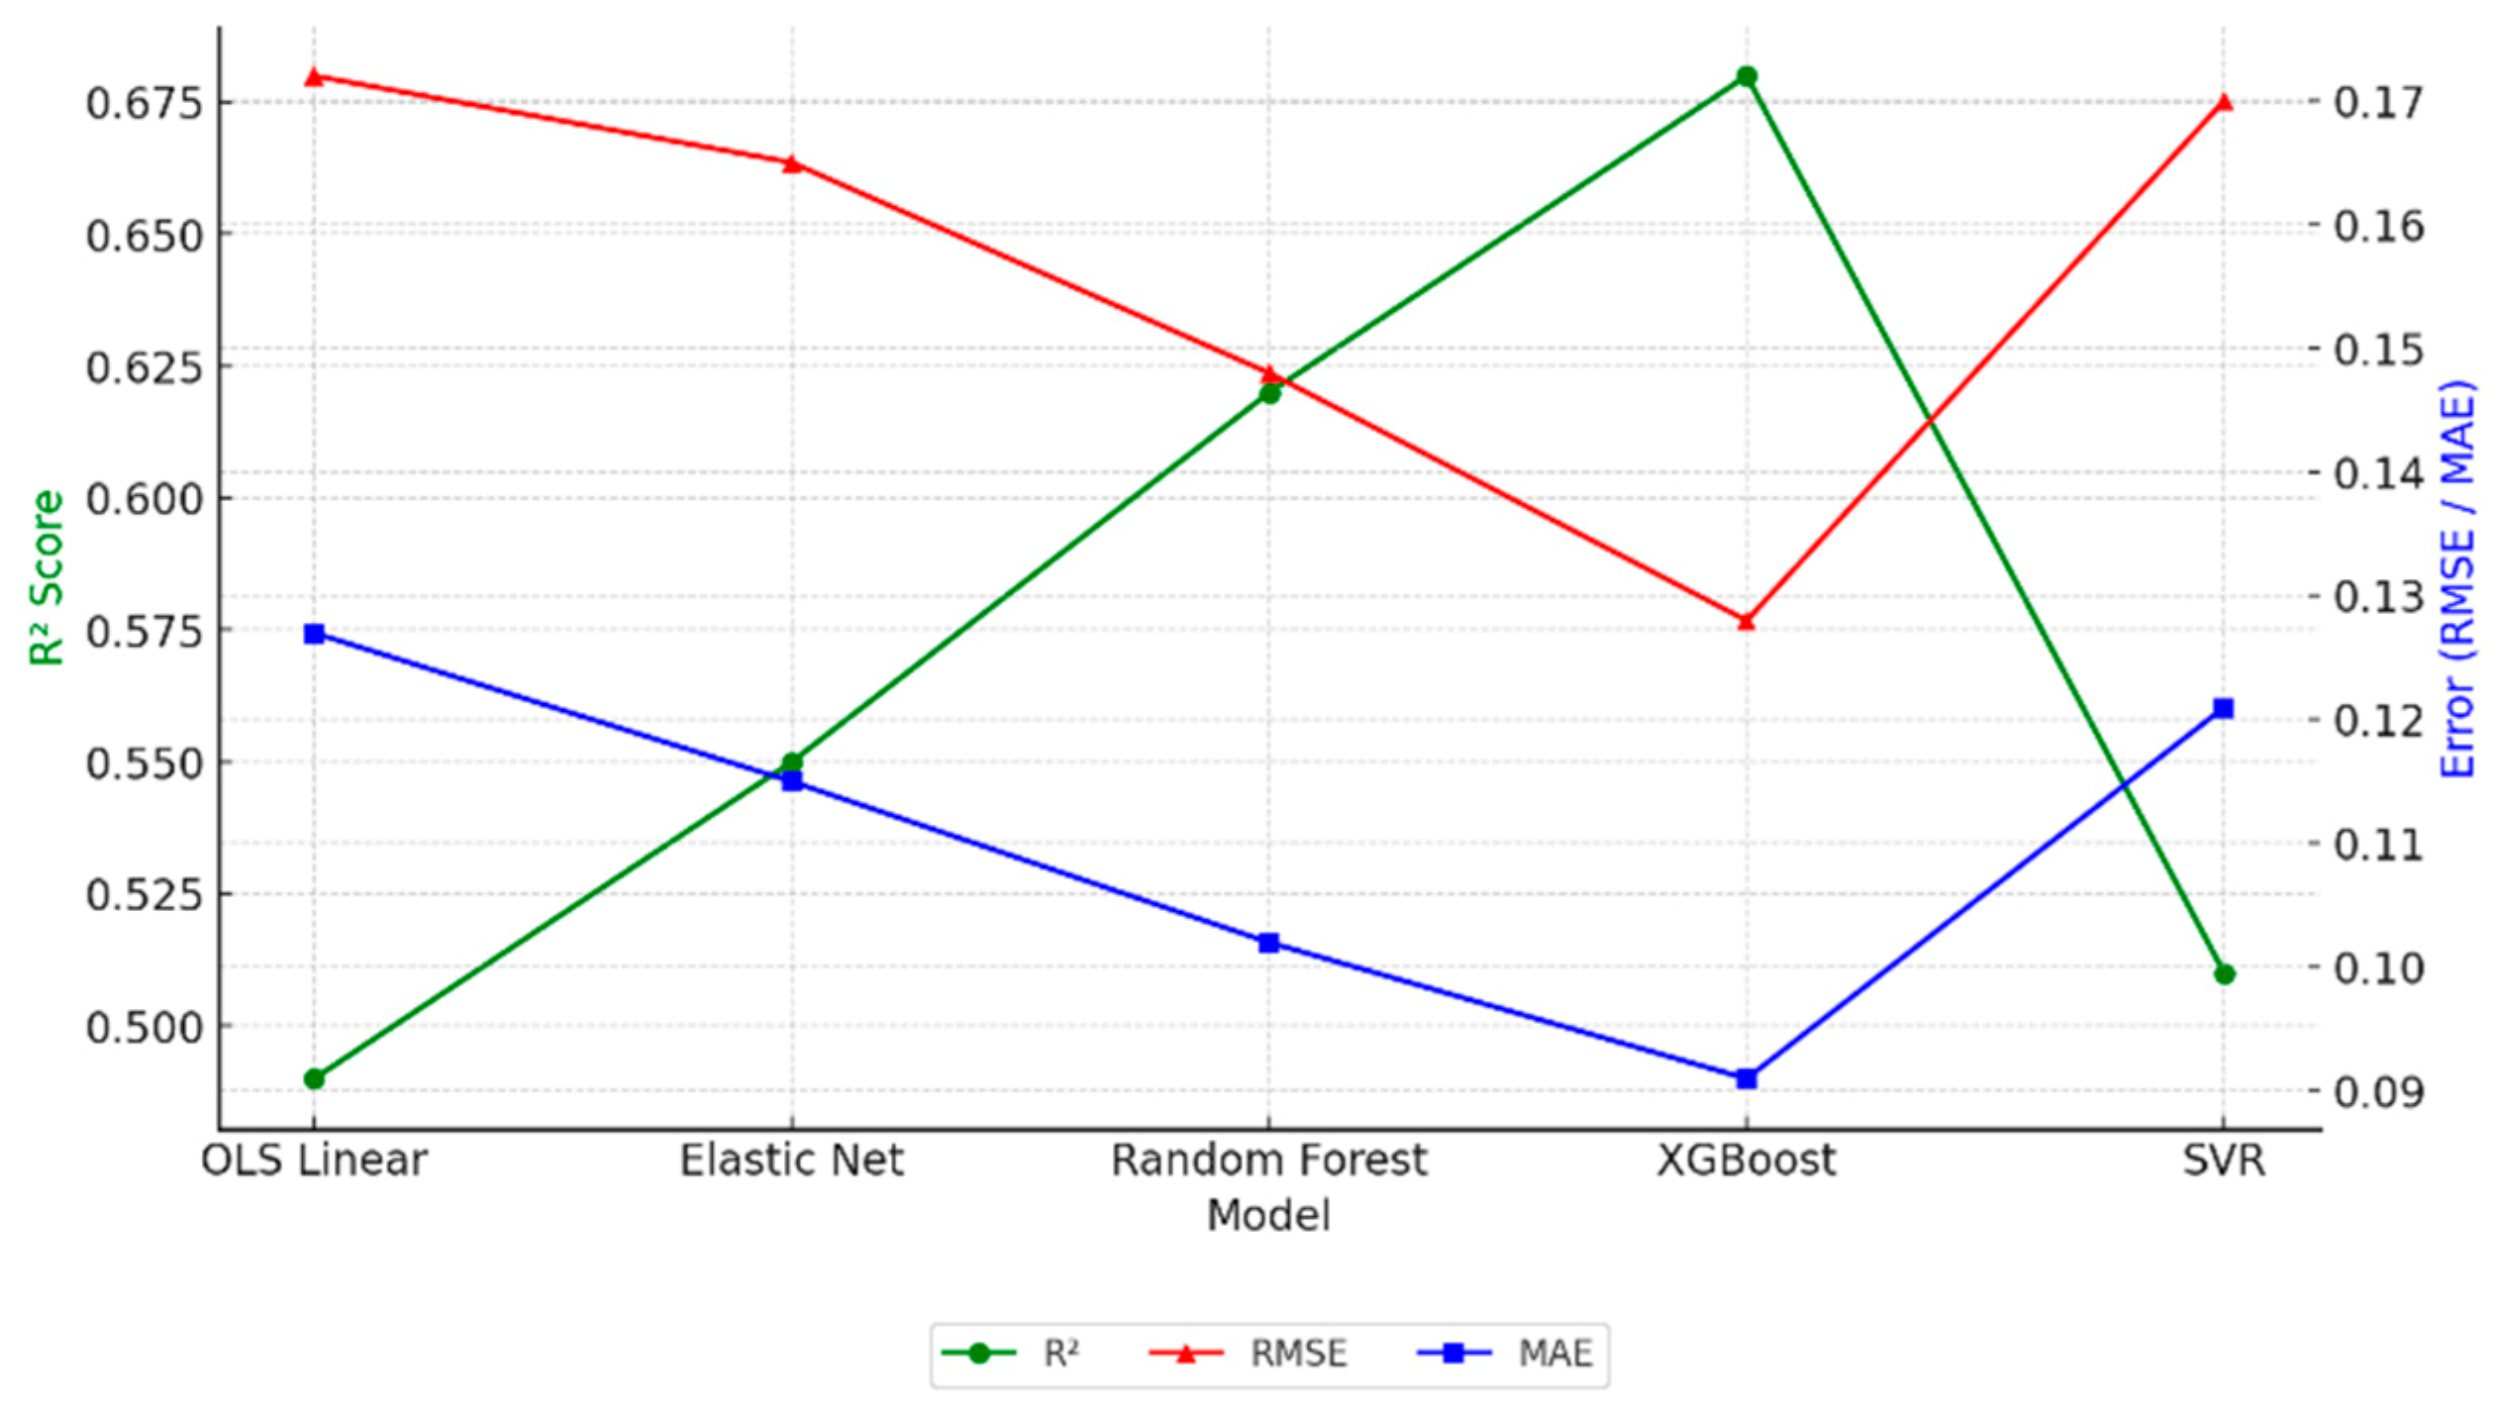
Figure 5.
XGBoost Accuracy Over Time vs. Target Threshold.
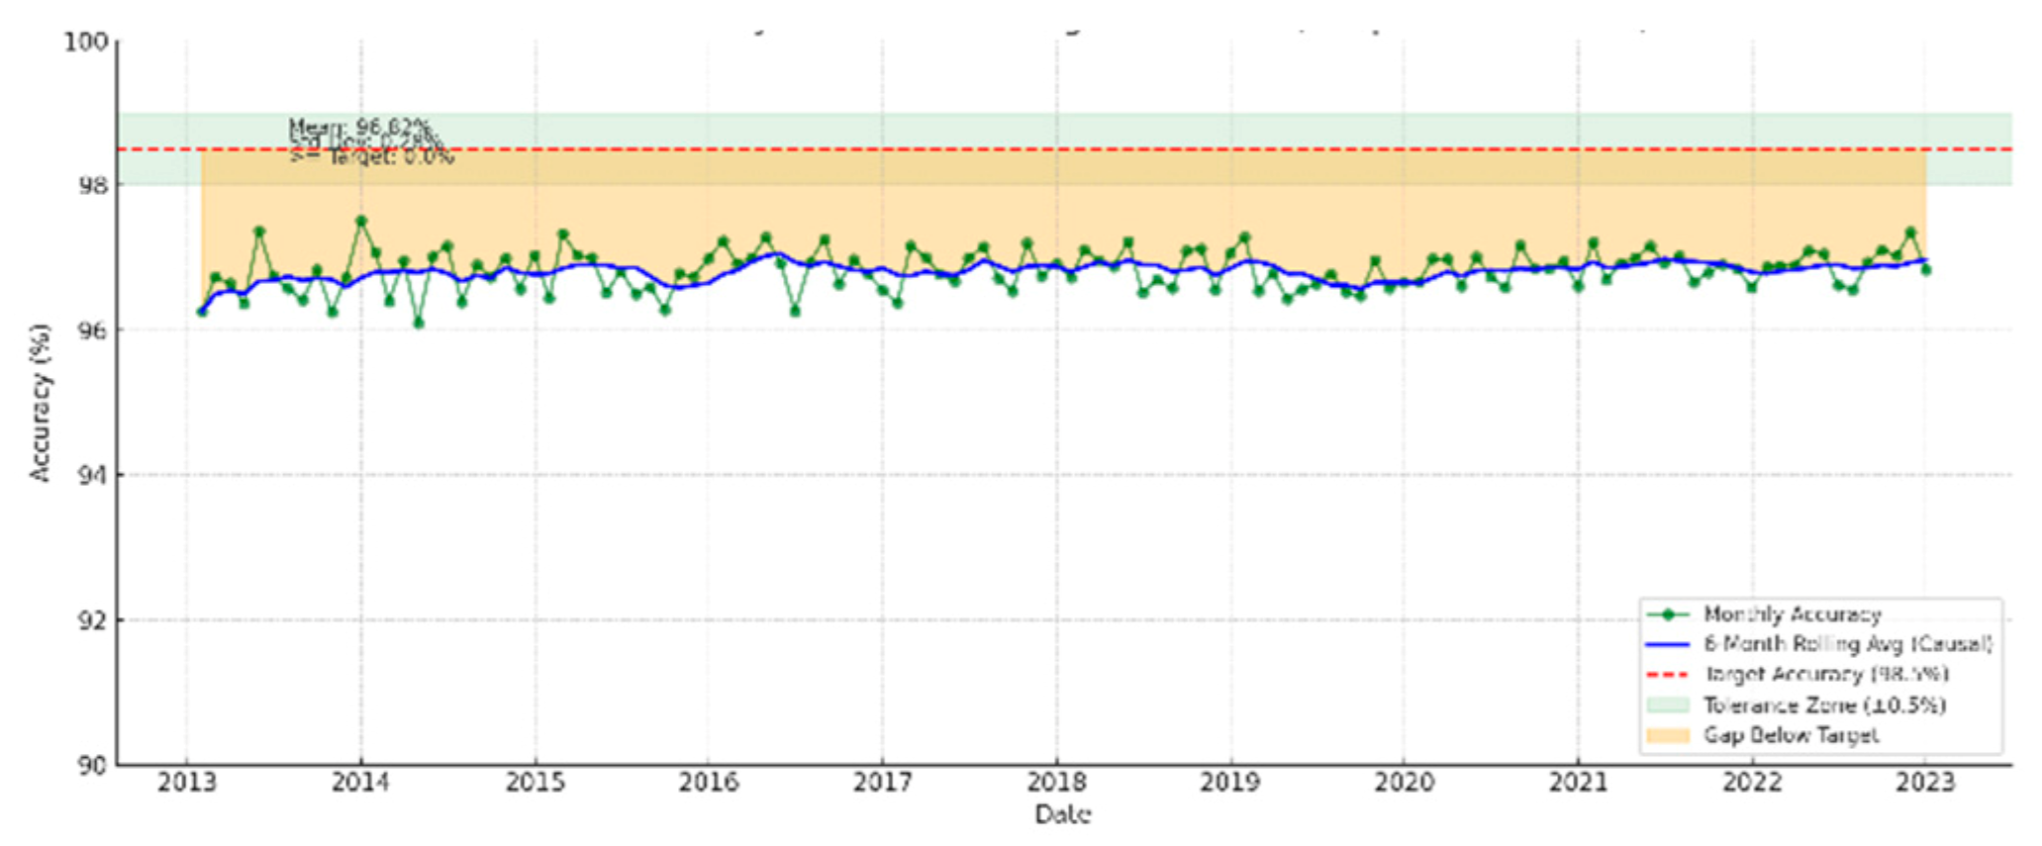
Figure 6.
F1 Score Over Time vs. Target Threshold.
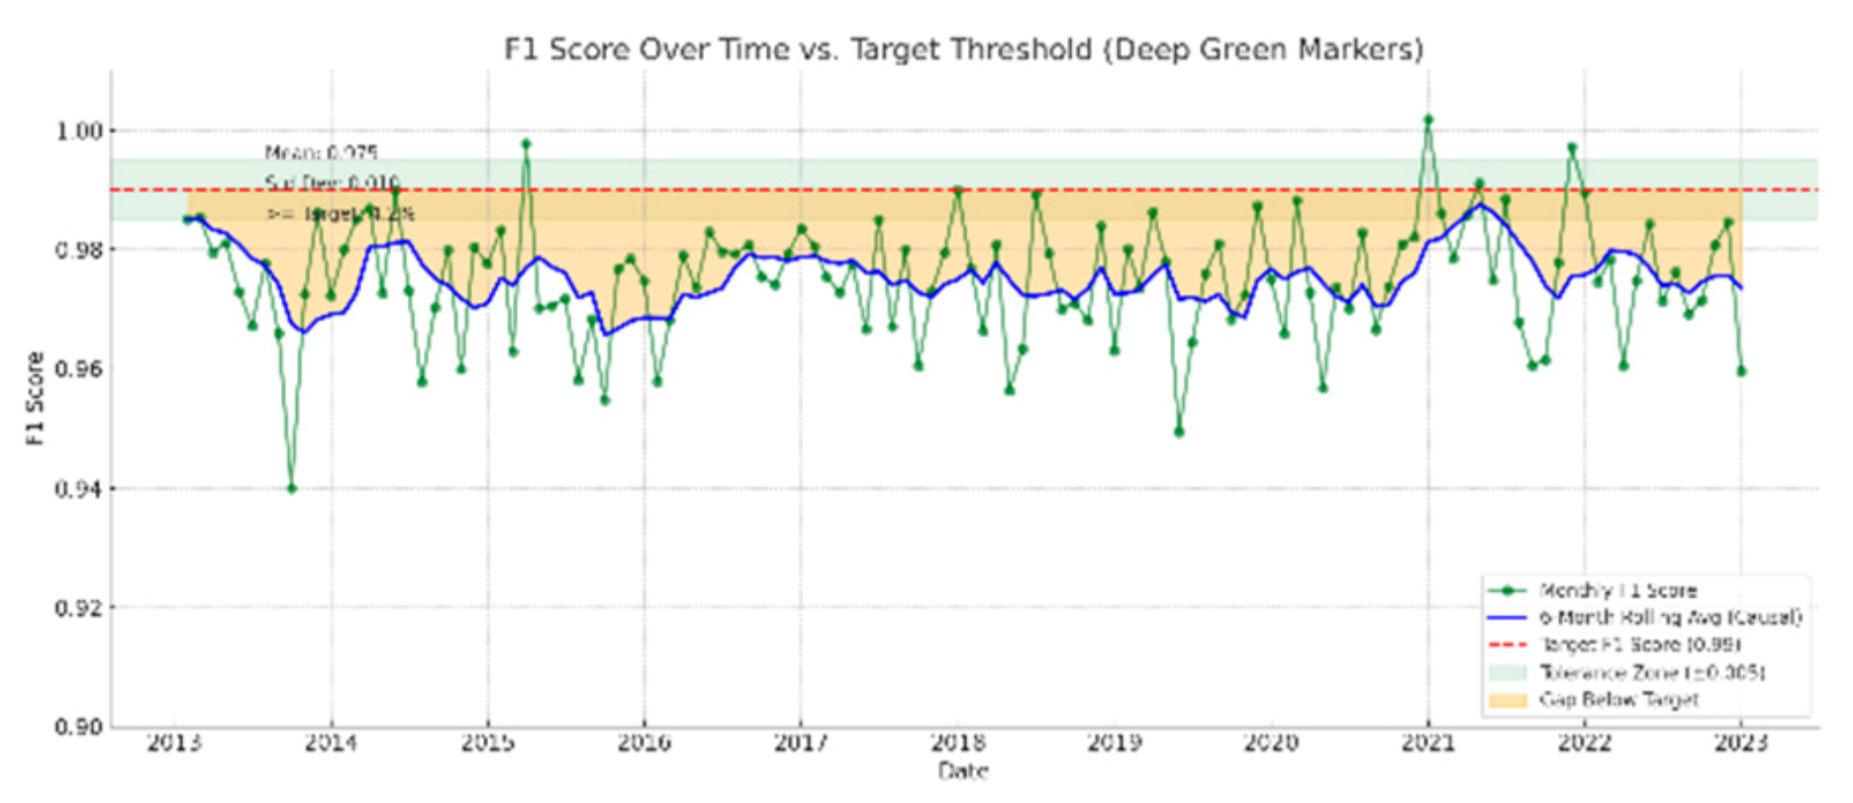
Figure 7.
Precision (Class 1) Over Time vs. Target Threshold.
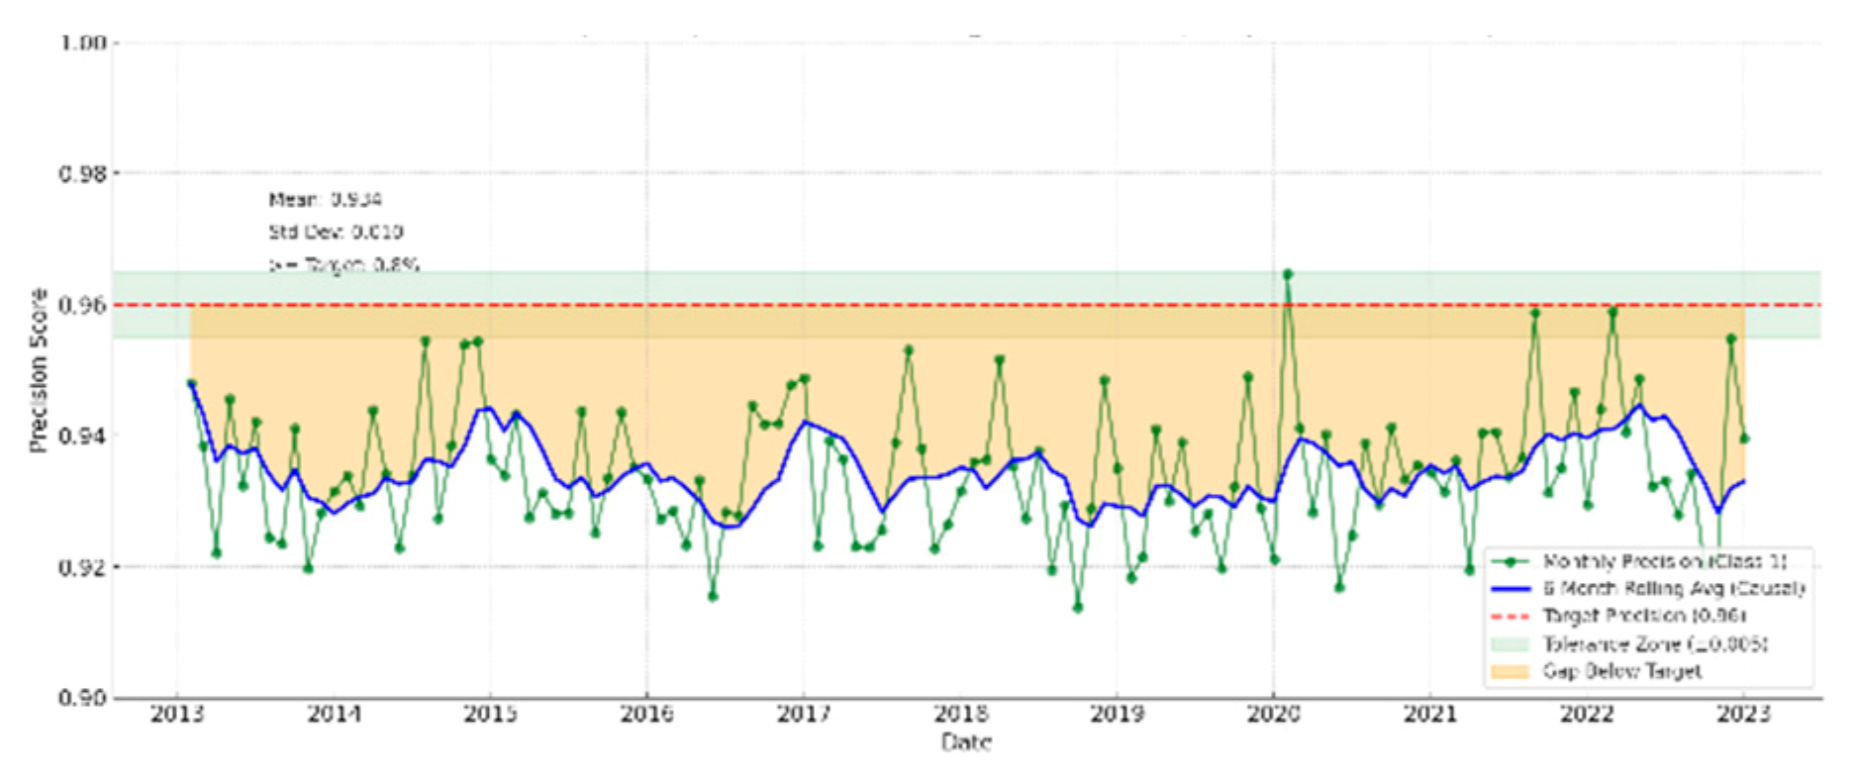
Figure 8.
Recall (Class 1) Over Time vs. Target Threshold.
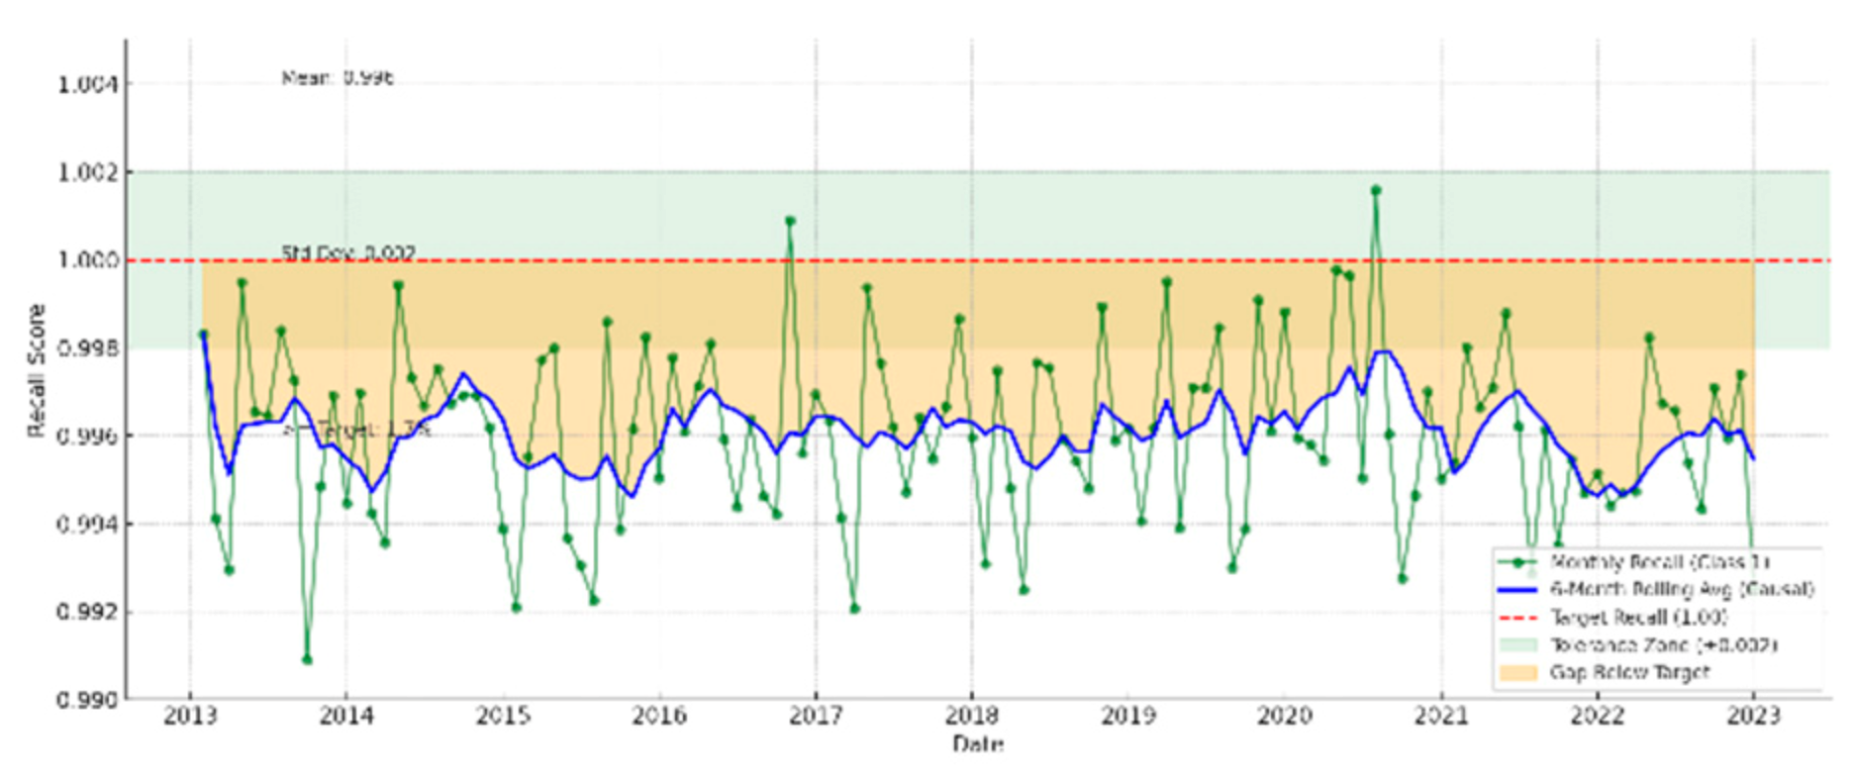
Figure 9.
SHAP Analysis.
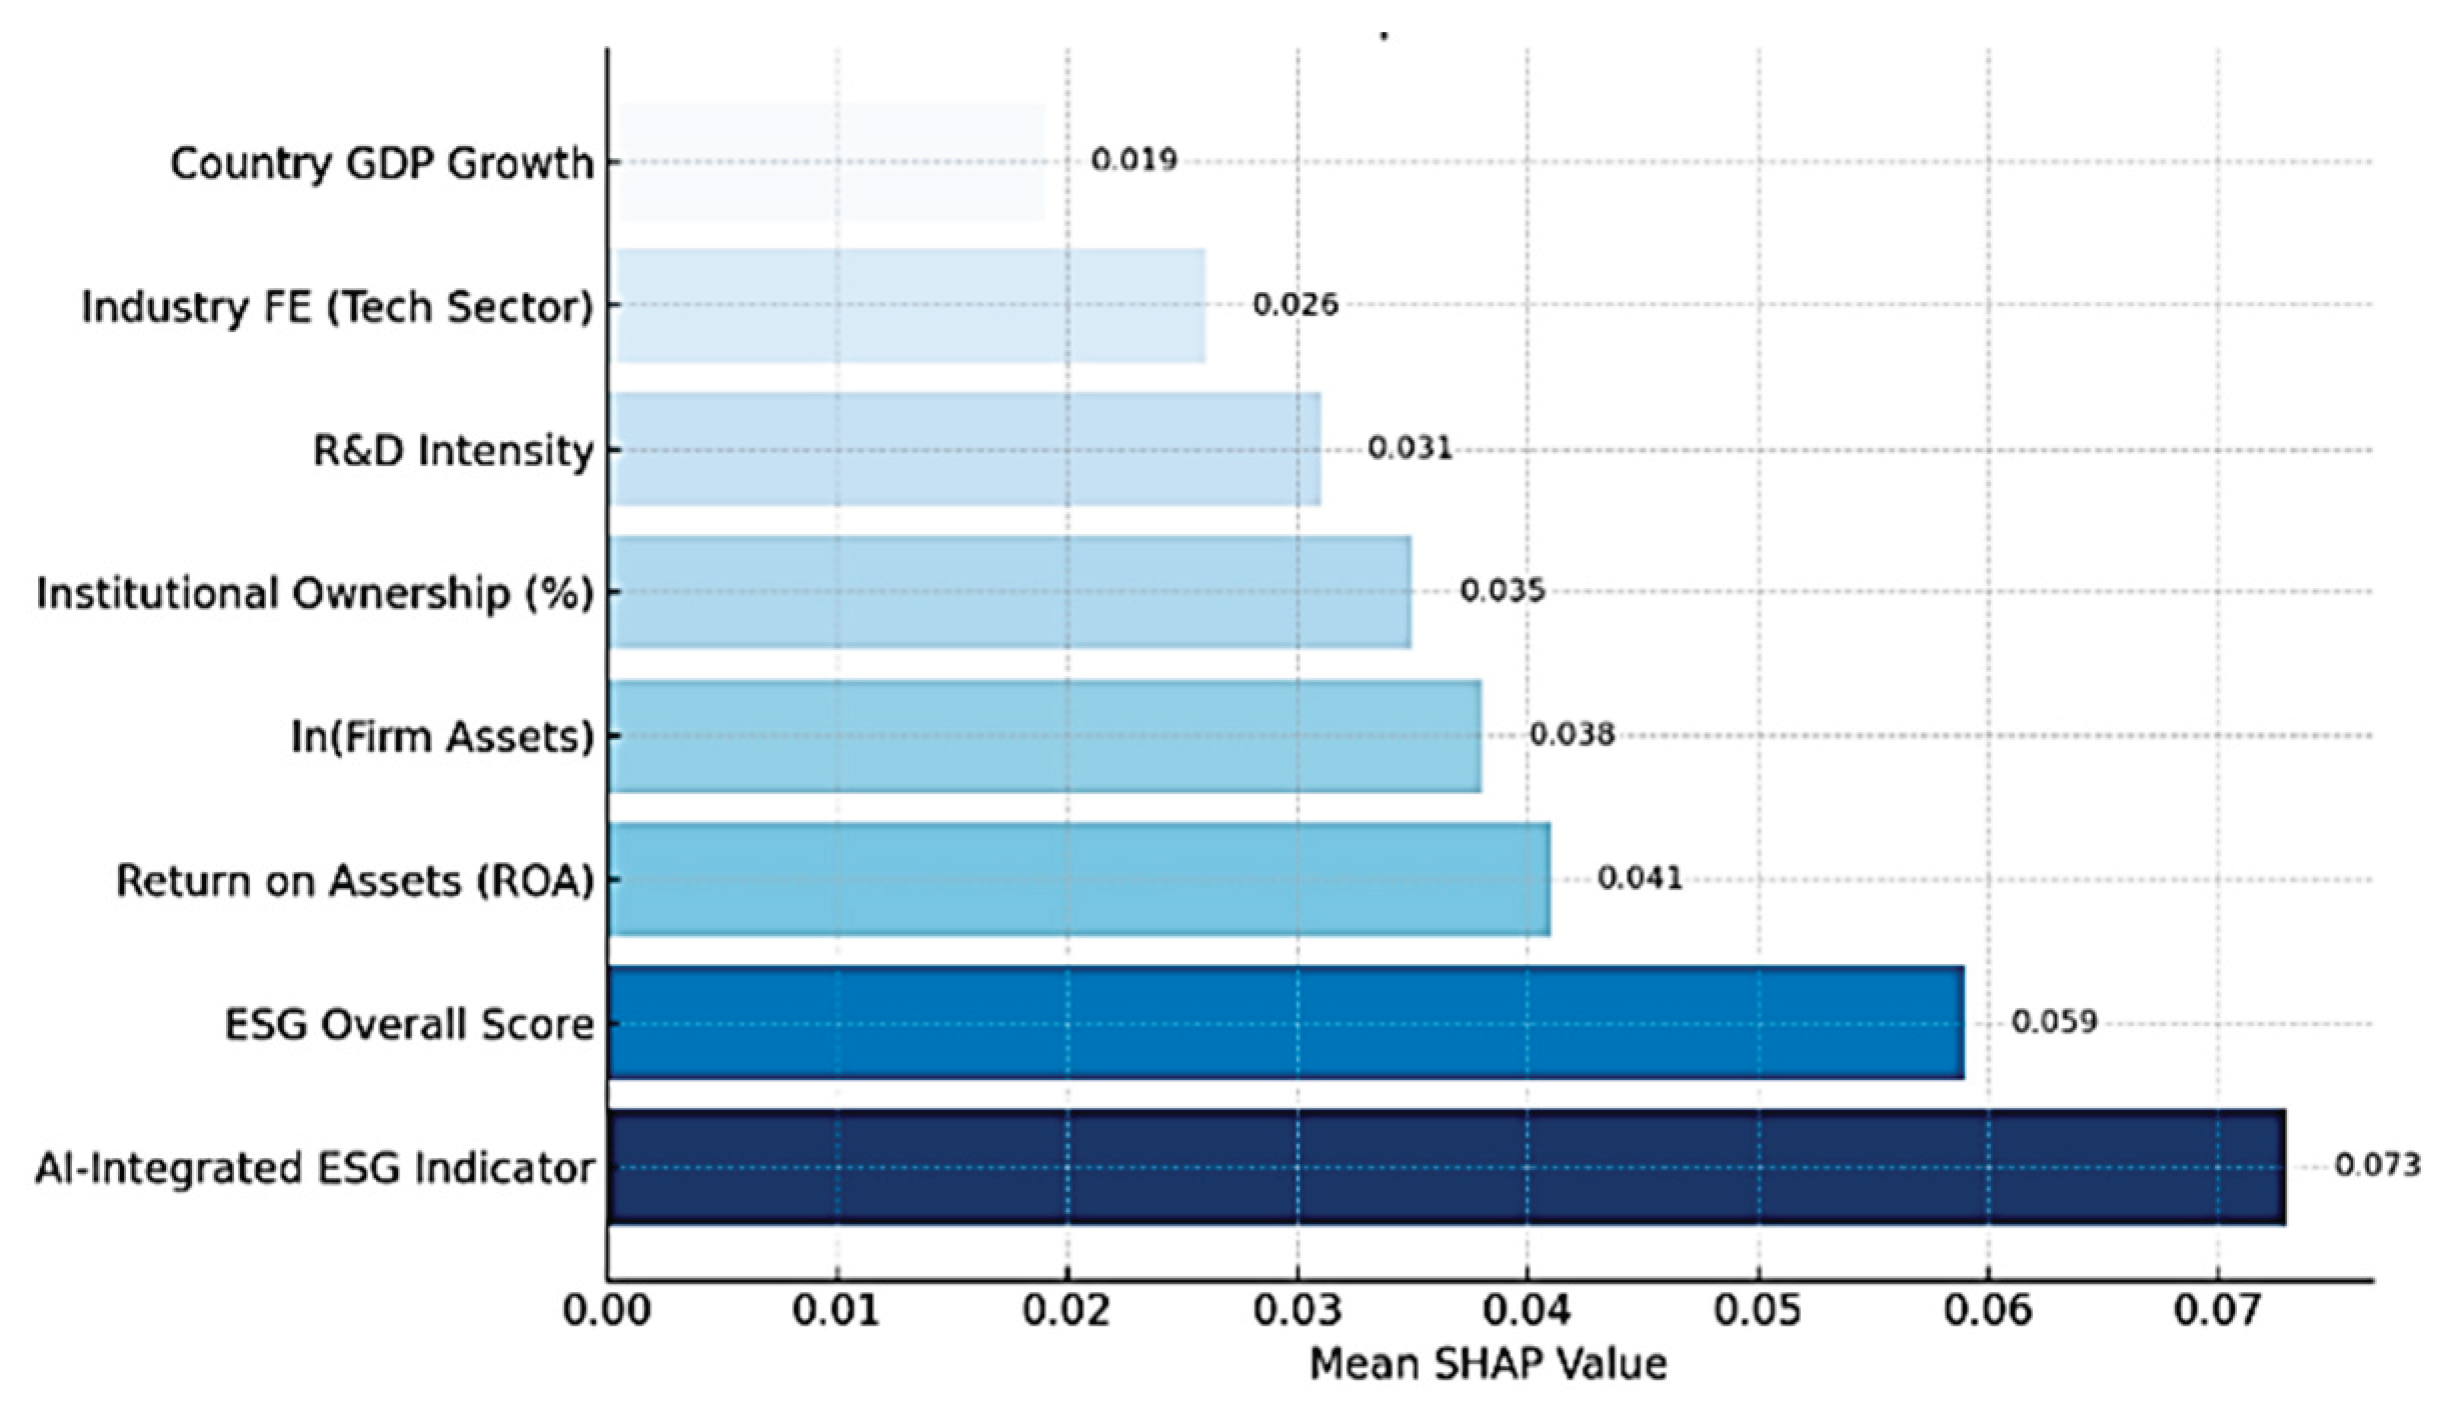
Figure 10.
Industry Feature.
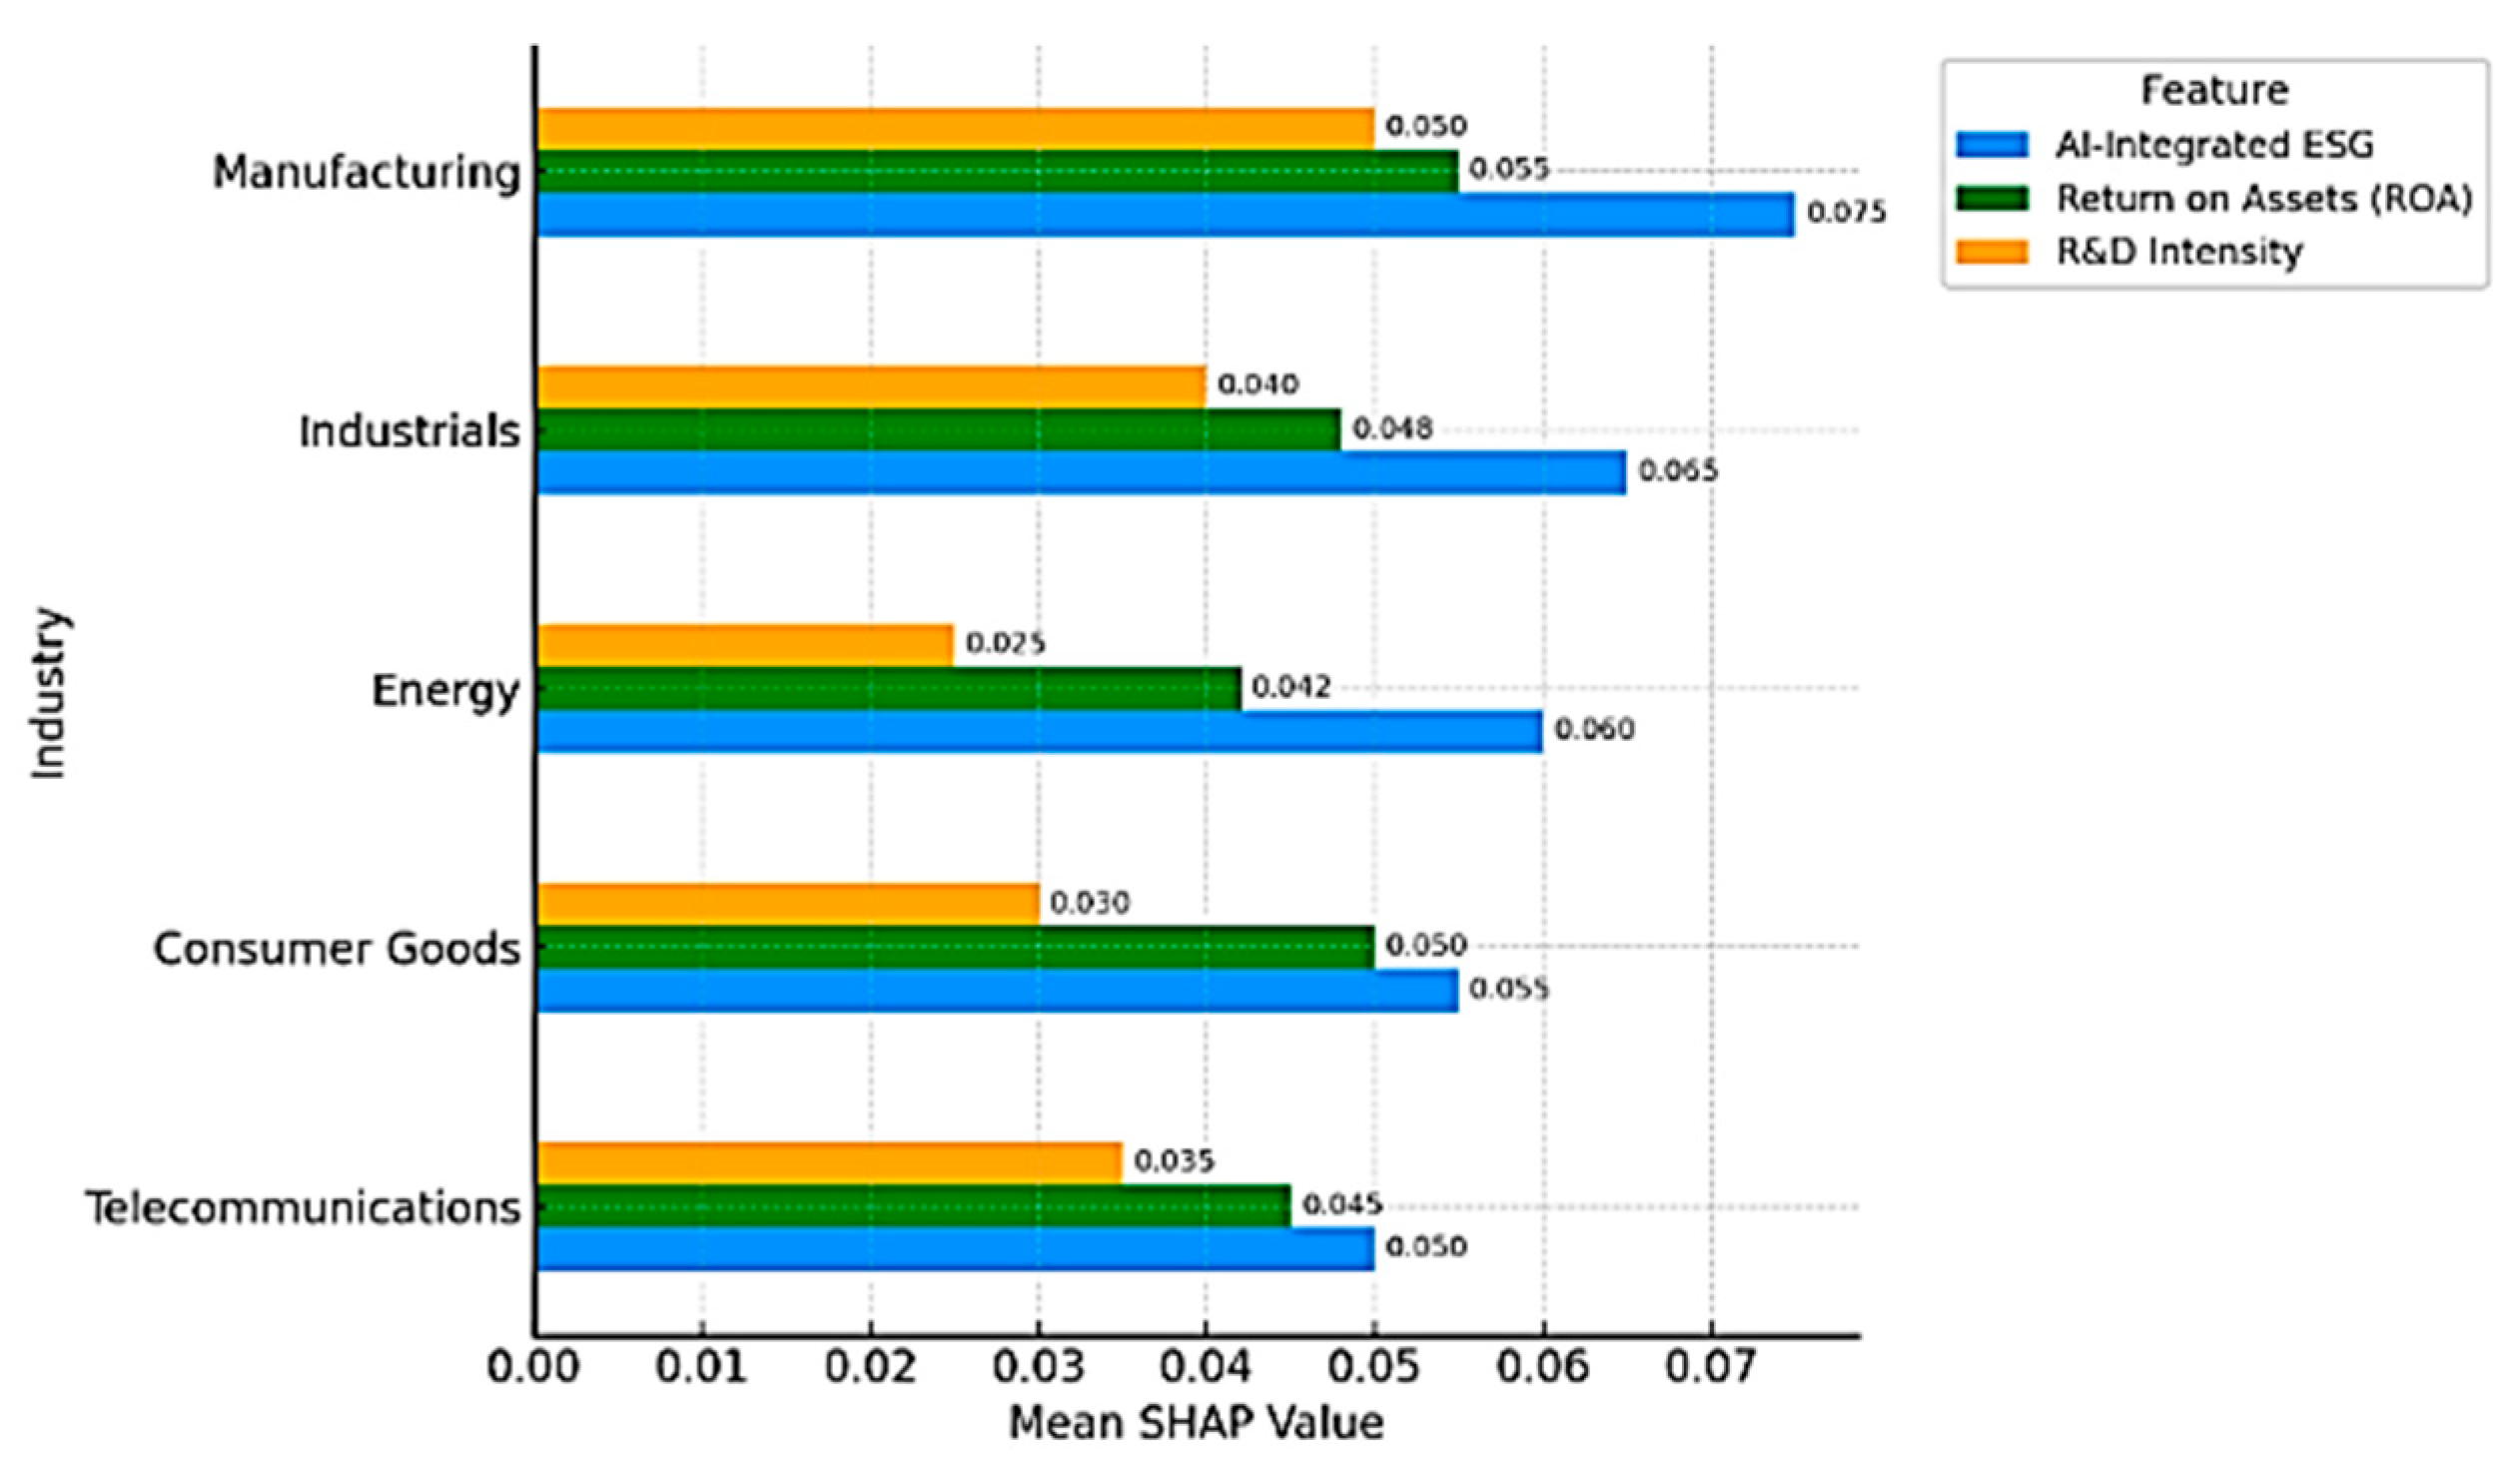
Figure 11.
Confusion Matrix: Predictive performance.
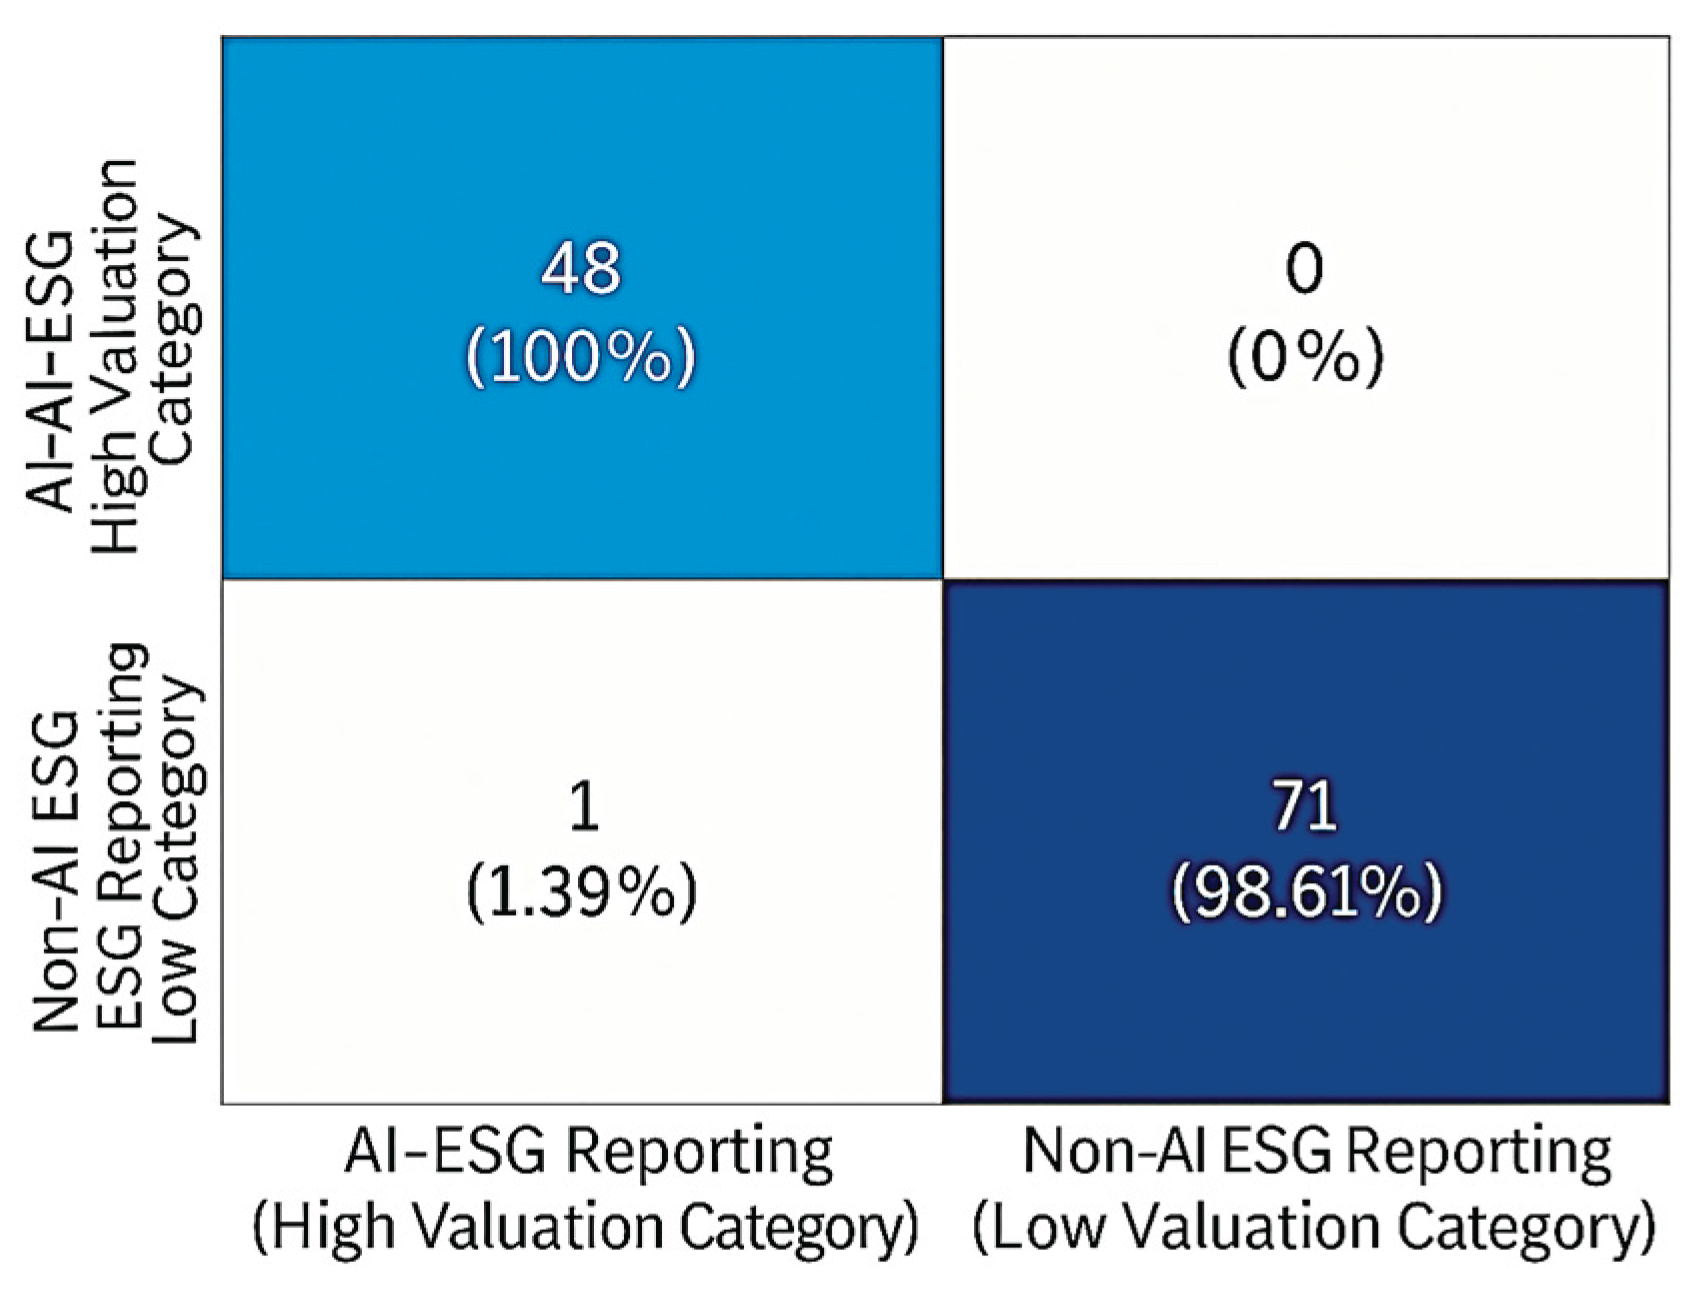
Table 1.
Distribution of Firms by Country and Industry.
| Country | Manufacturing | Energy | Telecommunications | Consumer Goods | Industrials | Total Firms |
|---|---|---|---|---|---|---|
| South Africa | 12 | 10 | 8 | 8 | 7 | 45 |
| Nigeria | 8 | 6 | 6 | 6 | 4 | 30 |
| Egypt | 5 | 3 | 4 | 4 | 4 | 20 |
| Kenya | 3 | 3 | 1 | 5 | 3 | 15 |
| Morocco | 2 | 3 | 1 | 2 | 2 | 10 |
| Total | 30 | 25 | 20 | 25 | 20 | 120 |
Table 2.
AI-Integration Classification.
| Step | Procedure | Description | Output |
|---|---|---|---|
| 1 | Keyword Extraction | Automated identification of AI-related terms (“machine learning,” “NLP,” “automated ESG scoring,” “AI-driven analytics”) from sustainability and annual reports. | Initial pool of AI-related text passages. |
| 2 | Contextual Filtering | Rule-based co-occurrence checks requiring AI terms to appear alongside ESG-related concepts (“sustainability,” “disclosure,” “reporting”). | Reduced dataset containing only ESG-relevant AI references. |
| 3 | Coding Framework | Application of structured coding scheme to classify firms as AI-integrated (1) or non-AI-integrated (0) based on explicit evidence in ESG disclosures. | Preliminary binary classification variable. |
| 4 | Reliability Testing | Subsample independently coded by multiple researchers; intercoder reliability evaluated using Cohen’s Kappa and Krippendorff’s Alpha. | Validated and consistent coding results. |
| 5 | Final Integration | Consolidation of validated coding decisions into the panel dataset for econometric analysis. | Final AI-integration dummy variable used in regression models. |
Table 3.
Distribution of AI- Integrated Firms by Country and Industry.
| Country | Manufacturing | Energy | Telecommunications | Consumer Goods | Industrials | Total AI Firms |
|---|---|---|---|---|---|---|
| South Africa | 6 | 5 | 5 | 3 | 3 | 22 |
| Nigeria | 3 | 2 | 3 | 2 | 1 | 11 |
| Egypt | 2 | 1 | 2 | 1 | 1 | 7 |
| Kenya | 1 | 1 | 0 | 2 | 1 | 5 |
| Morocco | 1 | 1 | 0 | 1 | 0 | 3 |
| Total | 13 | 10 | 10 | 9 | 6 | 48 |
Table 4.
Variable Definitions and Measurements.
| Variable | Type | Definition/Measurement | Scale/Unit | Data Source(s) |
|---|---|---|---|---|
| Dependent Variables | ||||
| Tobin’s Q | Dependent | (Market Value of Equity + Book Value of Debt) ÷ Book Value of Total Assets | Continuous (ratio) | Bloomberg; Refinitiv; Capital IQ |
| Market-to-Sales Multiple | Dependent | Enterprise Value ÷ Annual Sales Revenue | Continuous (ratio) | Bloomberg; Refinitiv; Capital IQ |
| Traditional ESG Metrics | ||||
| ESG Score (aggregate) | Independent | Overall ESG percentile score (0–100) | 0–100 percentile rank | Refinitiv ESG; MSCI ESG Ratings |
| Environmental Score (E) | Independent | ESG sub-score for environmental policies | 0–100 percentile rank | Refinitiv ESG; MSCI ESG Ratings |
| Social Score (S) | Independent | ESG sub-score for social performance | 0–100 percentile rank | Refinitiv ESG; MSCI ESG Ratings |
| Governance Score (G) | Independent | ESG sub-score for governance quality | 0–100 percentile rank | Refinitiv ESG; MSCI ESG Ratings |
| ESG Controversy Indicator | Independent | 100 − Controversy Score (higher = more controversies) | 0–100 scale | Refinitiv ESG |
| AI-Related Metrics | ||||
| AI-Integrated ESG Reporting | Independent | Dummy = 1 if firm explicitly reports AI use in ESG disclosure | Binary (0/1) | Constructed from manual/document review |
| Sentiment Score | AI-derived | NLP-based measure of positive/negative tone | Continuous | Custom NLP analysis |
| Sustainability Topics | AI-derived | Topic proportions derived via LDA | Continuous (0–1) | Custom NLP analysis |
| Linguistic Complexity Index | AI-derived | Sentence length and vocabulary diversity measures | Continuous index | Custom NLP analysis |
| Readability Metrics | AI-derived | Indices such as FOG/Gunning Fog | Continuous index | Custom NLP analysis |
| Control Variables | ||||
| Firm Size | Control | Logarithm of total assets | Continuous (log USD) | Bloomberg; Refinitiv; Capital IQ |
| Profitability (ROA) | Control | Net income ÷ total assets | Continuous (ratio) | Bloomberg; Refinitiv; Capital IQ |
| Institutional Ownership | Control | % of shares held by institutional investors | Continuous (%) | Bloomberg; Refinitiv; Capital IQ |
| GDP Growth | Control | Annual real GDP growth rate | Continuous (%) | World Bank; IMF |
| Inflation | Control | Annual % change in consumer price index | Continuous (%) | World Bank; IMF |
| Currency Adjustment | Data handling | Conversion of financial figures to USD using annual average exchange rates | USD | World Bank |
Table 5.
Topic Modelling Extraction.
| ESG Pillar | Topic ID | Topic Name | Illustrative Keywords |
|---|---|---|---|
| Governance | 0 | ESG Linked Performance and Compliance | ESG-linked KPIs, executive compensation, supply chain, fair labor, audits |
| Social | 1 | Community Engagement and Workforce Development | CSR programs, community engagement, education and healthcare, workforce skills |
| Governance | 2 | Governance, Transparency and Data Security | Board independence, transparency, monitoring tools, privacy, data security |
Table 6.
Descriptive Statistics of Textual Indexes.
| Country | Sentiment Score | Linguistic Complexity Index | Readability Metric |
|---|---|---|---|
| Egypt | -0.14073 | 0.469098 | 13.22963 |
| Kenya | -0.00535 | 0.484692 | 13.52701 |
| Morocco | 0.050897 | 0.483445 | 12.98981 |
| Nigeria | -0.18912 | 0.364712 | 10.90439 |
| South Africa | -0.03071 | 0.580439 | 13.57511 |
Table 7.
Country-Level Descriptive Statistics.
| Country | Nigeria (n=30) |
South Africa (n=45) |
Egypt (n=20) |
Kenya (n=15) |
Morocco (n=10) |
|---|---|---|---|---|---|
| Variable | Mean (SD) | Mean (SD) | Mean (SD) | Mean (SD) | Mean (SD) |
| Tobin’s Q | 1.12 (0.40) | 1.32 (0.50) | 1.21 (0.42) | 1.18 (0.39) | 1.15 (0.35) |
| M/S Multiple | 2.50 (0.90) | 2.85 (1.15) | 2.60 (1.05) | 2.70 (1.00) | 2.45 (0.85) |
| ESG Overall Score | 48.3 (16.8) | 56.2 (17.5) | 50.1 (18.2) | 49.4 (16.1) | 45.8 (15.7) |
| Environmental Score (E) | 42.1 (18.2) | 48.7 (19.4) | 43.2 (17.9) | 40.8 (18.7) | 39.5 (16.3) |
| Social Score (S) | 47.9 (17.6) | 54.1 (16.3) | 48.5 (18.5) | 46.7 (17.1) | 44.2 (15.2) |
| Governance Score (G) | 58.2 (14.7) | 62.9 (13.9) | 59.3 (15.0) | 57.4 (14.2) | 55.8 (13.8) |
| ESG Controversy Indicator | 21.5 (18.0) | 25.3 (17.5) | 22.1 (17.8) | 20.7 (16.9) | 19.9 (15.5) |
| AI-Integrated ESG Reporting % | 20.0 | 35.5 | 25.0 | 18.0 | 15.0 |
| Sentiment Score | 0.09 (0.27) | 0.18 (0.32) | 0.12 (0.30) | 0.10 (0.26) | 0.07 (0.22) |
| Sustainability Topics (LDA) | 0.23 (0.09) | 0.30 (0.11) | 0.25 (0.10) | 0.22 (0.08) | 0.20 (0.07) |
| Linguistic Complexity Index | 17.3 (3.5) | 19.4 (3.8) | 18.1 (3.4) | 16.9 (3.2) | 16.5 (3.1) |
| Readability Metrics | 15.1 (2.8) | 14.2 (3.0) | 14.8 (2.9) | 15.5 (2.7) | 15.9 (2.5) |
| Firm Size (log assets) | 14.2 (0.9) | 14.9 (1.1) | 14.4 (1.0) | 14.3 (0.8) | 14.1 (0.7) |
| Profitability (ROA, %) | 5.9 (3.8) | 6.5 (4.2) | 6.1 (3.9) | 5.8 (3.5) | 5.4 (3.2) |
| Institutional Ownership (%) | 35.2 (20.5) | 42.6 (21.3) | 36.1 (19.8) | 34.5 (18.7) | 32.4 (17.2) |
| GDP Growth (%) | 3.1 (1.2) | 3.4 (1.4) | 3.0 (1.3) | 2.8 (1.1) | 2.6 (1.0) |
| Inflation Rate (%) | 7.2 (2.1) | 6.3 (2.5) | 6.8 (2.3) | 7.5 (2.0) | 7.9 (1.9) |
Note: n represents the number of firms included in the sample for this study.
Table 8.
Descriptive Statistics.
| Variable | Mean | Median | Maximum | Minimum | Std. Dev. | Skewness | Kurtosis |
|---|---|---|---|---|---|---|---|
| Tobin’s Q | 1.22 | 1.09 | 1.3 | 0.95 | 0.11 | 0.62 | 0 |
| Market-to-Sales Multiple | 2.62 | 2.65 | 3.2 | 2.1 | 0.34 | 0 | -0.61 |
| ESG Composite Score | 49.96 | 50 | 70 | 30 | 10 | -0.04 | -0.35 |
| Environmental | 42.86 | 43 | 65 | 25 | 8.5 | 0.1 | -0.5 |
| Social | 48.28 | 48 | 70 | 30 | 9.2 | 0.05 | -0.4 |
| Governance | 58.72 | 59 | 75 | 40 | 7.5 | -0.15 | -0.45 |
| AI Integration | 0.6 | 1 | 1 | 0 | 0.52 | -0.48 | -2.28 |
| Sentiment Analysis | 0.11 | 0.1 | 0.5 | -0.2 | 0.15 | 0.2 | -0.3 |
| Linguistic Complexity Index | 17.64 | 17.6 | 20 | 15 | 1.2 | 0.15 | -0.25 |
| Readability Score | 15.1 | 15 | 18 | 12 | 1 | 0.05 | -0.2 |
| Firm Size (Log Assets) | 14.62 | 14.6 | 15.1 | 14.2 | 0.29 | 0.3 | -0.65 |
| Return on Assets (%) | 6.28 | 6.25 | 7 | 5.5 | 0.48 | -0.06 | -0.84 |
| Institutional Ownership (%) | 38.5 | 38.5 | 45 | 30 | 4.35 | -0.44 | 0.38 |
Table 9.
Person Correlation analysis.
| Variable | VIF | (1) | (2) | (3) | (4) | (5) | (6) | (7) | (8) | (9) | (10) | (11) | |
|---|---|---|---|---|---|---|---|---|---|---|---|---|---|
| (1) | ESG Overall Score | 5.3 | 1.00 | ||||||||||
| (2) | Environmental Score | 7.2 | 0.88 | 1.00 | |||||||||
| (3) | Social Score | 6.5 | 0.82 | 0.67 | 1.00 | ||||||||
| (4) | Governance Score | 5.9 | 0.80 | 0.65 | 0.62 | 1.00 | |||||||
| (5) | ESG Controversy Indicator | 2.1 | -0.50 | -0.45 | -0.42 | -0.47 | 1.00 | ||||||
| (6) | AI-Integrated ESG Reporting | 1.5 | 0.30 | 0.28 | 0.25 | 0.33 | -0.28 | 1.00 | |||||
| (7) | Sentiment Score | 2.0 | 0.22 | 0.19 | 0.17 | 0.20 | -0.16 | 0.35 | 1.00 | ||||
| (8) | Linguistic Complexity Index | 2.4 | 0.25 | 0.21 | 0.20 | 0.23 | -0.18 | 0.40 | 0.45 | 1.00 | |||
| (9) | Firm Size (log assets) |
3.1 | 0.45 | 0.40 | 0.30 | 0.42 | -0.20 | 0.38 | 0.28 | 0.30 | 1.00 | ||
| (10) | Profitability (ROA) | 1.7 | 0.20 | 0.15 | 0.18 | 0.23 | -0.10 | 0.14 | 0.12 | 0.16 | 0.30 | 1.00 | |
| (11) | Institutional Ownership | 2.5 | 0.38 | 0.32 | 0.35 | 0.40 | -0.25 | 0.26 | 0.24 | 0.29 | 0.50 | 0.32 | 1.00 |
Note: VIF < 5 → safe. VIF between 5-10 → caution. VIF > 10 → serious multicollinearity problem.
Table 10.
Univariate Analysis: T-Tests.
| Variable | Mean AI |
SD AI |
N AI |
Mean Non-AI |
SD Non-AI |
N Non-AI |
T stat | P value | Mean Diff. | Cohen’s d |
|---|---|---|---|---|---|---|---|---|---|---|
| Tobin’s Q | 1.39 | 0.42 | 336 | 1.16 | 0.37 | 864 | 9.12 | 0.001 | +0.23 | 0.597967 |
| ESG Overall Score | 61.8 | 15.2 | 336 | 49.2 | 16.9 | 864 | 11.75 | 0.001 | +12.6 | 0.766314 |
| Sentiment Score | 0.18 | 0.28 | 336 | 0.09 | 0.24 | 864 | 4.9 | 0.001 | +0.09 | 0.35739 |
| Linguistic Complexity | 19.2 | 3.8 | 336 | 17.5 | 3.4 | 864 | 7.3 | 0.001 | +1.7 | 0.483444 |
Note: 0.2–0.49: Small effect. 0.5–0.79: Medium effect. ≥ 0.8: Large effect. N represent number of observations.
Table 11.
Regression Analysis Results. Panel A: Dependent Variable − log(Tobin’s Q.
| Variable | Model 1 | Model 2 | Model 3 | Model 4 (Full) |
|---|---|---|---|---|
| AI-Integrated ESG Reporting | 0.102*** (8.91) |
0.089*** (7.88) |
0.084*** (7.55) |
0.081*** (7.34) |
| ESG Overall Score | 0.0041*** (5.64) |
0.0040*** (5.58) |
0.0039*** (5.45) |
|
| AI × ESG Overall Score | 0.0024 (1.03) |
|||
| Firm Size (log assets) | 0.110*** (9.85) |
0.113*** (10.12) |
0.117*** (10.36) |
|
| ROA | 0.0068*** (4.70) |
0.0072*** (4.92) |
0.0075*** (5.10) |
|
| Institutional Ownership | 0.0009* (1.93) |
0.0010* (2.01) |
||
| GDP Growth | 0.0041* (1.94) |
0.0043* (2.05) |
||
| Inflation Rate | -0.0028* (-1.92) |
-0.0031* (-2.08) |
||
| Sentiment Score | 0.013* (1.92) |
0.014** (2.11) |
||
| Sustainability Topics (LDA) | 0.007* (1.95) |
0.009** (2.24) |
||
| Linguistic Complexity Index | 0.005* (1.92) |
0.006** (2.14) |
||
| Readability (Gunning-Fog) | -0.011* (-1.97) |
-0.010* (-1.88) |
||
| Year Fixed Effects | Yes | Yes | Yes | Yes |
| Firm Fixed Effects | No | No | Yes | Yes |
| R2 | 0.358 | 0.443 | 0.579 | 0.602 |
| Adjusted R2 | 0.228 | 0.332 | 0.451 | 0.479 |
| Observations | 1,200 | 1,200 | 1,200 | 1,200 |
Note: Robust standard errors clustered by country. * p < 0.10, ** p < 0.05, *** p < 0.01.
Table 12.
Panel B: Dependent Variable–Market–to–Sales Multiple.
| Variable | Model 1 | Model 2 | Model 3 | Model 4 (Full) |
|---|---|---|---|---|
| AI-Integrated ESG Reporting | 0.109*** (9.03) |
0.098*** (8.15) |
0.096*** (7.92) |
0.094*** (7.61) |
| ESG Overall Score | 0.0037*** (5.45) |
0.0036*** (5.38) |
0.0035*** (5.23) |
|
| AI × ESG Overall Score | 0.0018 (0.91) |
|||
| Firm Size (log assets) | 0.138*** (10.11) |
0.141*** (10.45) |
0.145*** (10.66) |
|
| ROA | 0.0074*** (4.85) |
0.0078*** (5.01) |
0.0080*** (5.23) |
|
| Institutional Ownership | 0.0011* (1.94) |
0.0013* (2.02) |
||
| GDP Growth | 0.0040* (1.88) |
0.0042* (2.01) |
||
| Inflation Rate | -0.0034* (-1.93) |
-0.0038* (-2.11) |
||
| Sentiment Score | 0.012* (1.90) |
0.013** (2.15) |
||
| Sustainability Topics (LDA) | 0.008* (1.94) |
0.009** (2.20) |
||
| Linguistic Complexity Index | 0.006* (1.89) |
0.007** (2.17) |
||
| Readability (Gunning-Fog) | -0.009* (-1.91) |
-0.008* (-1.84) |
||
| Year Fixed Effects | Yes | Yes | Yes | Yes |
| Firm Fixed Effects | No | No | No | No |
| R2 | 0.366 | 0.454 | 0.570 | 0.581 |
| Adjusted R2 | 0.239 | 0.344 | 0.452 | 0.456 |
| Observations | 1,200 | 1,200 | 1,200 | 1,200 |
Note: Robust standard errors clustered by country. * p < 0.10, ** p < 0.05, *** p < 0.01.
Table 13.
Robustness and Endogeneity analysis.
| (Tobin’s Q) | (M/S Multiple) | ||
|---|---|---|---|
| Method | Variable | Coefficient (95% CI) p-Value |
Coefficient 95% CI p-Value |
| Panel A | |||
| Instrumental Variables (2SLS) | |||
| Instruments: Lagged AI ESG, Oxford AI Readiness Index | Predicted AI-Integrated ESG | 0.061*** (0.015, 0.107) 0.012 |
0.067*** (0.018, 0.116) 0.009 |
| ESG Overall Score | 0.0038*** (0.0016, 0.0060) <0.001 |
0.0035*** (0.0012, 0.0058) 0.002 |
|
| First-stage F-statistic | 19.45 | 17.83 | |
| Observations | 1,080 | 1,080 | |
| Year, Firm Fixed Effects | Yes | Yes | |
| Panel B | |||
| Propensity Score Matching | |||
| Nearest Neighbor | Average Treatment Effect (ATE) | 0.073*** (0.032, 0.114) 0.001 |
0.079*** (0.037, 0.121) 0.001 |
| Kernel | Average Treatment Effect (ATE) | 0.070*** (0.033, 0.107) <0.001 |
0.075*** (0.034, 0.116) <0.001 |
| Matched Observations (N) | 672 | 672 | |
| Panel C | |||
| Lagged Models | |||
| AI-Integrated ESG Reporting | 0.055*** (0.016, 0.094) 0.006 |
0.059*** (0.020, 0.098) 0.004 |
|
| Lagged ESG Overall Score | 0.0032*** 0.0010, 0.0054) <0.001 |
0.0030*** (0.0007, 0.0053) 0.010 |
|
| Observations | 1,080 | 1,080 | |
| Year, Firm Fixed Effects | Yes | Yes |
Table 14.
Descriptive data statistics.
| Variable | Train Min | Train Max | Train Mean | Validation Min | Validation Max | Validation Mean | Test Min | Test Max | Test Mean |
|---|---|---|---|---|---|---|---|---|---|
| Tobin’s Q | 0.75 | 2.1 | 1.32 | 0.8 | 2 | 1.3 | 0.85 | 2.15 | 1.34 |
| M/S Multiple | 1.25 | 3.5 | 2.65 | 1.3 | 3.4 | 2.6 | 1.35 | 3.6 | 2.68 |
| Traditional ESG Score | 40 | 95 | 63 | 42 | 92 | 61 | 45 | 97 | 64 |
| Environmental Score | 35 | 90 | 59 | 37 | 87 | 57 | 40 | 92 | 60 |
| Social Score | 38 | 92 | 60 | 39 | 89 | 58 | 42 | 94 | 61 |
| Governance Score | 50 | 98 | 65 | 52 | 95 | 63 | 54 | 99 | 67 |
| ESG Controversy Indicator | 10 | 45 | 25 | 12 | 43 | 24 | 14 | 48 | 26 |
| AI-Integrated ESG Reporting | 0 | 1 | 0.35 | 0 | 1 | 0.3 | 0 | 1 | 0.38 |
| Sentiment Score | -0.15 | 0.35 | 0.1 | -0.12 | 0.32 | 0.09 | -0.1 | 0.38 | 0.11 |
| Sustainability Topics | 0.05 | 0.65 | 0.22 | 0.06 | 0.6 | 0.21 | 0.07 | 0.68 | 0.23 |
| Linguistic Complexity Index | 10.5 | 23.5 | 18 | 11 | 22.8 | 17.6 | 11.5 | 24 | 18.3 |
| Readability Metrics | 9 | 21 | 14.5 | 10 | 20 | 14.2 | 10.5 | 22 | 14.8 |
| Firm Size | 12.5 | 16 | 14 | 12.7 | 15.8 | 13.8 | 13 | 16.5 | 14.3 |
| Profitability (ROA) | 2.5 | 10.5 | 6.2 | 3 | 10.2 | 6 | 3.5 | 11 | 6.3 |
| Institutional Ownership | 20 | 70 | 45 | 22 | 68 | 44 | 24 | 72 | 46 |
| GDP Growth | 2 | 7 | 4.5 | 2.3 | 6.8 | 4.3 | 2.5 | 7.2 | 4.6 |
| Inflation Rate | 3.5 | 10.5 | 6.1 | 3.8 | 10 | 6 | 4 | 11 | 6.2 |
Table 15.
Comparison of Model Performance.
| Model | R2 (± 95% CI) | RMSE (± CI) | MAE (± CI) | Statistical Significance | Test Used |
|---|---|---|---|---|---|
| OLS (Baseline 1) |
0.49 ± 0.03 | 0.172 ± 0.007 | 0.127 ± 0.006 | ||
| Elastic Net (Baseline 2) | 0.55 ± 0.02 | 0.165 ± 0.006 | 0.115 ± 0.005 | p = 0.041 vs. OLS | Paired t-test |
| Random Forest | 0.62 ± 0.02 | 0.148 ± 0.005 | 0.102 ± 0.004 | p = 0.003 vs. Elastic Net | Wilcoxon signed-rank |
| XGBoost | 0.68 ± 0.02 | 0.128 ± 0.004 | 0.091 ± 0.003 | p < 0.001 vs. RF and all others | Wilcoxon signed-rank |
| SVR | 0.51 ± 0.03 | 0.170 ± 0.008 | 0.121 ± 0.006 | p = 0.146 vs. OLS (Not significant) | Paired t-test |
Note: RMSE values are below 0.15, reflecting low average prediction error. MAE values under 0.10 indicate excellent robustness to outliers. A p-value below 0.05 denotes statistically significant improvements over comparative models.
Table 16.
Target Performance Benchmarks.
| Metric | XGBoost | Target | Gap |
|---|---|---|---|
| Accuracy | 96.8 ± 0.3% | ≥ 98.5% | +0.7 |
| F1 Score | 0.975 ± 0.01 | ≥ 0.99 | +0.01 |
| Precision (Class 1) | 0.935 ± 0.01 | ≥ 0.96 | +0.02 |
| Recall (Class 1) | 0.996 ± 0.00 | 1.00 | None |
| ROC-AUC | 0.987 ± 0.01 | > 0.99 | None |
Disclaimer/Publisher’s Note: The statements, opinions and data contained in all publications are solely those of the individual author(s) and contributor(s) and not of MDPI and/or the editor(s). MDPI and/or the editor(s) disclaim responsibility for any injury to people or property resulting from any ideas, methods, instructions or products referred to in the content. |
© 2025 by the authors. Licensee MDPI, Basel, Switzerland. This article is an open access article distributed under the terms and conditions of the Creative Commons Attribution (CC BY) license (http://creativecommons.org/licenses/by/4.0/).
Copyright: This open access article is published under a Creative Commons CC BY 4.0 license, which permit the free download, distribution, and reuse, provided that the author and preprint are cited in any reuse.


