
Submitted:
18 June 2025
Posted:
19 June 2025
You are already at the latest version
Abstract
Cross-industry and cross-country evidence from the ESG-firm value literature indicates no consensus on the ESG performance impact on corporate financial performance. Stemming from the ongoing debate over whether ESG principles enhance or hinder value creation, this study investigates the effect of Environmental, Social, and Governance (ESG) performance on firm value through three proxies: Tobin's Q (TQ), Price to Book ratio (PB), and Price to Earnings ratio (PE). Using a cross-country and cross-sectoral comparative approach, the study employs principal component analysis and fixed and random effects panel regression techniques to test the hypothesized relationships across nine MENA region countries and ten sectors from 2017 to 2022. To the best of the authors’ knowledge, this is the first study to examine ESG’s impact on TQ, PB, and PE while offering a comparative analysis in the MENA region. Empirical results reveal a significantly positive relationship between ESG scores and firm value using TQ and PB ratios, but this relationship is insignificant with the PE ratio. This study contributes to the ESG and financial decision-making literature, providing insights for investors on portfolio optimization and sustainable investing. The findings offer recommendations that further benefit businesses, policymakers, and decision-makers in enhancing their understanding of ESG implications.
Keywords:
sustainable investment
; environment
; social
; governance
; ESG
; firm value
1. Introduction
In the context of the contemporary wave of sustainability, nations are constantly striving for improvement. Consequently, the globe is confronting both opportunities and challenges as a result of the accelerated growth of economies, advancement of societies, and rapid industrialization [1]. The adoption of sustainability is a dynamic and complex process, where re-evaluating business operational procedures and strategic plans to address this persistent challenge has become inevitable. Consequently, corporate behavior has recently been referred to as Environmental, Social, and Governance (ESG) performance [2,3].
ESG has gained increasing popularity over the past decade. Some firms employ sustainability to obtain a competitive advantage, while others view it as a standard operation. Nevertheless, ESG adoption urges firms to provide additional information to the public and investors. This transparency of disclosures and practices could facilitate fair consensus appraisal by analysts and investors [4]. Despite the increasing prevalence of activist ESG investing, socially responsible investing concepts, and imposed ESG policies, the problem of businesses being hesitant to incorporate ESG principles into their business models is still critically persisting [1]. This is a result of the ongoing debate over whether ESG principles truly contribute to increasing corporate financial performance or form a threat that hinders firm value and growth, which are major concerns for firm managers and investors, according to Eldomiaty and Rashwan [5].
Cross-industry and cross-country evidence from the ESG-firm value literature suggests that no consensus has been reached regarding the impact of ESG on corporate financial performance. In other words, does ESG positively influence firm value? Given the divergent results, this debate persists, highlighting the necessity for further research to identify the potential scenarios of ESG and to investigate the mechanisms that explain whether and to what extent ESG performance influences firm value [6, 7]. Specifically, this field of interest has historically been under-researched in the Middle East and North Africa (MENA) region [8,9], where empirical studies in emerging economies like the MENA region may be significantly impeded by the difficulty of obtaining trustworthy financial and ESG data. Accordingly, many ESG-related subjects are still unexplored in this area [10].
The PWC 2024 Middle East Report highlights that the number of firms in the MENA region with a formal ESG strategy increased from 64% in 2023 to 80% in 2024 [11]. These highly structured institutional efforts demonstrate that ESG-related concerns in many firms have developed to the point of creating new executive roles to carry out ESG strategies [12].
The MENA region confronts unique challenges in terms of ESG implementation. If there is no clear vision as to whether ESG is beneficial or detrimental to financial performance, this will only exacerbate the current challenges. Challenges include the need for greater stakeholder engagement and collaboration, as well as the need to address social and environmental issues such as energy efficiency, scarcity of water, and labor rights, according to Khan and Adomaitis [10]. Unfortunately, the mission of persuading businesses in the MENA region of the advantages of ESG implementation is a major and persistent challenge. Another challenge is the varying levels of ESG adoption and application across countries and business sectors, which could have diverse impacts on value creation.
In the pursuit of understanding the true impact of ESG performance on corporate value creation amidst the ongoing debate across countries, industries, and measures, this study aims to investigate the impact of the ESG Score on firm value through the three proxies of Tobin's Q (TQ), Price to Book ratio (PB), and Price to Earnings ratio (PE) in the context of MENA region firms while conducting a cross-country and cross-sectoral comparative analysis. The analysis is based on a panel dataset of 51 firms in 9 MENA region countries (including the 6 Gulf Cooperation Council countries) and 10 business sectors from 2017 to 2022.
This comprehensive approach is deeply rooted in the variations of firm value proxies employed by previous researchers. Over the course of time, researchers have used various measures of firm value, from TQ to price multiples like PB and PE ratios. Researchers have also debated the varying characteristics of these proxies in determining market sentiments for firms. Consequently, this ongoing discussion underscores the complexities entailed in firm value measurement and emphasizes our comprehensive approach in this study.
This study aspires to contribute to existing literature by addressing the following two research questions:
1. Is there a significant relationship between ESG scores and firm value in the MENA region?
2. Does the relationship between ESG scores and firm value vary across measures, industries, and countries within the MENA region?
By shedding light on the advancement of ESG MENA region scoring trends and conducting comparative empirical cross-country and cross-sector analyses, an enhancement for prior studies focusing on a single country or business sector is provided.
Theoretically, the research goal and contribution set a foundation for future research on sustainability regarding its theoretical implications. From a practical perspective, the results of this study could expand knowledge regarding the relationship between ESG scores and firm value on a firm level across a variety of countries and sectors. This, in turn, is expected to enhance the decision-making process and improve the understanding of ESG implications by a variety of stakeholders, such as investors, regulators, standard-setters, policymakers, decision-makers, and scholars, especially in emerging economies. By linking ESG scores to firm value, promising insights into how businesses could perceive the financial implications of ESG adoption are obtained.
2. Literature Review and Hypothesis Development
2.1. Literature on Corporate Sustainability Performance and Financial Performance
Efforts to link Corporate Sustainability Performance (CSP) and Corporate Financial Performance (CFP) date back to the 1970s. Moskowitz [13] identified 14 firms as promising financial opportunities based on their sustainability performance. He subsequently found that a portfolio of these 14 stocks outperformed the NYSE, Dow Jones, and S&P over the following six months. Interestingly, Bragdon and Marlin [14] conducted the first empirical test, analyzing profit growth and pollution reduction initiatives for 17 paper and pulp firms. The study found that implementing pollution control measures could potentially increase earnings.
In his criticism of Moskowitz's research, Vance [15] highlighted that an investment portfolio composed of 22 stocks with the highest sustainability performance ranking would perform significantly worse than a portfolio consisting of 22 stocks with the lowest ranking. Afterwards, Hong and Kacperczyk [16] concluded that a sin stocks portfolio outperforms a comparable portfolio. On the contrary, Lobe and Walkshaeusl [17] created portfolios of sinful equities at global, regional, and domestic levels to find no proof that portfolios including sin equities outperformed or underperformed the market. This has led to contrasting opinions on whether a company may provide value to its shareholders through its sustainability performance.
The discussion on the link between CSP and CFP has led to a discussion on the causality direction. Waddock and Graves [18] demonstrated a favourable correlation between sustainability performance components and financial performance measurements, both as dependent and independent variables, proposing that the two aspects have a simultaneous impact and that causation is bidirectional. Contrastingly, Scholtens [19] discovered that financial performance typically comes before social performance.
In the recent literature regarding CSP-CFP direction of causality, Lu and Taylor [20] highlight that CSP improves CFP in the long run. On the other hand, Tuppura et al. [21] argue that there is no conclusive answer to the CSP-CFP relationship in the USA. According to Wang and Gao [22], the CSP-CFP causality direction remains unclear—whether high CSP leads to high CFP or whether high CFP provides capabilities to improve CSP. This echoes Ullmann's [23] earlier statement, which contends that variability in sample size, industrial context, proxies used, and data collection and analysis methods contribute to the inconsistent CSP-CFP relationship.
2.2. Literature on ESG Performance Measurement
The importance of corporate sustainability has increased among business leaders, policymakers, the media, and academics. The inception of ESG can be traced back to investors' realization in the late 1960s and early 1970s that a firm’s financial performance might be impacted by social and environmental factors. To include the environmental, social, and governance aspects of sustainability into a unified framework, the term "ESG" was created in the early 2000s [24]. This approach aligned with the paradigm shift toward moving beyond simple accounting variables to understanding how businesses practically manage their activities. This evolution highlights the growing relevance of ESG adoption and raises questions about its true impact on corporate financial performance.
In both developed and developing nations, the impact of ESG on financial performance has been a subject of ongoing debate among practitioners, investors, and researchers. Amel-Zadeh and Serafeim [25] assert that ESG covers aspects of businesses that not only address their sustainability policies but also demonstrate how well they manage their governance practices and social influence. Therefore, ESG is crucial because it encourages businesses to provide more transparent information to the public and investors. Gyönyörová et al. [4] further emphasize that businesses are better valued by analysts and investors through high transparency regarding their policies and procedures. This underscores the need for a comprehensive approach to addressing this debate, as the lack of consensus may arise from variations in the measures examined, as well as differences across countries or sectors.
The first challenge in evaluating ESG implementation, according to Cornell and Damodaran [26], is defining what constitutes ESG information and how ESG performance is measured. Several rating organizations are attempting to answer such questions. According to Li and Polychronopoulos [27], there is a substantial body of literature highlighting disparities in ESG ratings for the same firms. Rating organizations differ not only in how they assess each of the multiple ESG elements but also in which factors are deemed significant enough to warrant measurement. As a result, scales had to be unified, so the ESG scoring systems were introduced [4].
Several ESG matrices and scoring systems, including Bloomberg and London Stock Exchange Group (LSEG) Data & Analytics (formerly Refinitiv® Eikon), have similar elements. According to Olsen et al. [28], ESG disclosure enables businesses to consider the majority of stakeholders, address investor needs, create credibility, and respond to competitiveness in their industries. Moreover, it helps rating organizations develop ESG scores for firms based on their ESG disclosure. Therefore, ESG disclosure has been quite popular during the past ten years. While some businesses use sustainability to gain a competitive edge, others see it as a routine practice. Ioannou and Serafeim [3] note that adopting sustainability is a dynamic and challenging process.
2.3. Literature on ESG and Firm Value
Several theories in literature have been associated with the ESG concept. The stakeholder and shareholder theories debate whether there is a positive or negative link and are two major critical theories widely referred to in this association. Other theories, such as agency theory, signaling theory, resource slack theory, good management theory, risk reduction theory, and virtuous cycle theory, may be used to articulate the direction of causation once a link between ESG performance and financial performance is established.
According to Friedman [29], the primary objective of a business is to maximize value for shareholders while abiding by the law and moral principles. However, this theory has been criticized, as managers may pursue personal gain with money saved by not investing for the good of society. This argument overlooks Friedman's last point, that businesses should increase profits "without deception or fraud." If this is the case, businesses should anticipate a rise in shareholder value from increased ESG initiatives, supporting Friedman's theory [30]. Freeman and Mcvea [31], argue that previous hypotheses did not account for the changes in the corporate environment.
To address these issues, the stakeholder theory was developed, where any group or individual impacted by or capable of impacting an organization's goals is considered a stakeholder. Ambler and Wilson [32] criticized the stakeholder perspective, questioning whether it is feasible to harmonize the concerns of all stakeholders, given their varying perspectives on evaluating business success.
The relationship between ESG and firm value is argued to be mitigated by the agency problem [33]. Family enterprises with high ownership concentration, strong corporate governance, and tied management face critical agency problems. In developing markets, ownership is typically concentrated among families and large institutional shareholders, where controlling shareholders may prioritize non-financial activities to preserve corporate reputation and respond to stakeholder expectations [34,35].
The resource slack theory suggests that firms with strong financial performance have greater capacity to invest in sustainability projects, leading to improved corporate financial and sustainability performance. While nearly 50 years of research on the link between corporate sustainability performance and corporate financial performance exist, most research is attributed to the good management theory [36]. Some scholars explain the ESG-firm value relationship in terms of the risk-reduction mechanism, which impacts firm value [37-39]. Researchers have also proposed the theoretical integration of value-creating and value-destroying paradigms [40]. Waddock and Graves [18] contend that businesses may modify their corporate culture to accept sustainability spending, even when managers' actions are motivated by the "wrong" motives, as it benefits them monetarily, thus starting a virtuous cycle.
The rationale behind the importance of ESG impact on firm value is that it determines whether businesses should bear ESG compliance costs or risk ignoring them. A number of studies have explored this relationship, with some authors claiming that ESG promotes firm value [41-47]. However, other researchers argue that ESG applications and sustainability programs are costly, especially for small and medium-sized enterprises [48-51]. Despite extensive research, there is no consensus on how ESG impacts firm value, especially in emerging markets like the MENA region, which is the focus of this study.
Gerged et al. [52] report a positive and significant relationship between ESG scores and ROA, though the significance decreased compared to TQ. Buallay [53] introduces a framework for driving firm performance in the MENA region through sustainability reporting, revealing mixed impacts on operational, financial, and market performance. He also highlights that managers focus on a disclosure strategy that includes non-financial information. Srour [54] observes an insignificant positive impact of ESG on ROA but a significant positive impact on TQ in Egypt. Al Amosh et al. [55] argue that environmental, social, and overall ESG disclosures positively affect financial performance indicators, with governance performance specifically favoring ROA. Aqabna et al. [56] and El Khoury et al. [51] present research on sustainability in the MENA region, finding mixed results. Aqabna et al. [56] suggest that ESG investments significantly improves ROA and TQ but have no impact on ROE, while El Khoury et al. [51] highlight that ESG boosts TQ but does not significantly affect ROA or ROE. These findings underscore the mixed results in the MENA region, pointing to the need for further comprehensive investigation.
Ibrahim and Wahba [57] highlight the positive and significant relationship between corporate sustainability and financial performance, encouraging firms to consider their responsibilities toward the community. Eldomiaty et al. [58] report that Corporate Social Responsibility (CSR) is positively associated with financial performance, including sales turnover and customer loyalty, suggesting that market mechanisms will favor firms excelling in social governance. This view is further supported by other researchers [59-62].
Aboud and Diab [33] argue that firms should aim for a high ranking in the ESG index, noting a stronger relationship between financial success and ESG during political turmoil, supporting the view that investors increasingly factor ESG into investment decisions. Abdelfattah and Aboud [63] conclude that firms with higher CSR ratings have higher stock returns. Al-Hiyari and Kolsi [64] highlight that ESG transparency provides MENA stock market players with value-relevant information, helping shareholders make more informed investment decisions. These findings highlight how a strong ESG rating can benefit companies, particularly in challenging political climates, and stresses the growing importance of ESG transparency for investors
Elhendawy et al. [65] suggest that managers can enhance a firm’s appeal to investors by sponsoring social and environmental initiatives. Bashatweh et al. [66] highlight that in Jordan, banks' market value increases with ESG, boosting market share and competitiveness. This finding is further supported in Saudi Arabia by Kouaib [67], where ESG has a significant positive impact on investment efficiency. Ellili [68] provides evidence from the UAE, showing a favorable association between ESG and cost of capital.
On the other hand, Al-Jalahma et al. [69] suggest that sustainability reporting negatively impacts banks’ performance in terms of ROA and ROE, a viewpoint further supported by Janah and Sassi [70] in Morocco, where ESG does not significantly improve stock performance. Firmansyah et al. [71] contribute to the discussion with insights from Saudi Arabia, concluding that ESG has a significant negative impact on TQ, although the negative association between ESG and ROE is insignificant. These studies present counterarguments in the ESG-firm value literature, highlighting the mixed nature of the evidence. Table A1 in Appendix A provides a chronological summary of the reviewed ESG and financial performance literature in the MENA region.
2.4. Hpothesis Development
Considering the evidence in the literature regarding the increasing interest of investors in ESG-compliant firms and firms’ concerns for public image, as well as the lack of consensus on this topic of interest, it could be inferred that the gap in the MENA region exists, persists, and needs to be addressed. Accordingly, the following main hypothesis and sub-hypotheses are developed:
H1: There is a significant impact of ESG score on firm value measures in the MENA region.
- H1a: There is a significant impact of ESG score on Tobin’s Q (TQ) in the MENA region.
- H1b: There is a significant impact of ESG score on Price to Book ratio (PB) in the MENA region.
- H1c: There is a significant impact of ESG score on Price to Earnings ratio (PE) in the MENA region.
Researchers’ insights regarding the industrial disparities in the relationship between ESG scores and financial performance date back to Barney's [72] contention that competitive advantages for sustainability are dependent on several interconnected competencies that vary based on industry and country regulations. This was further confirmed by Hull and Rothenberg [72]. Thereafter, Hoepner and Yu [73] discovered a positive relationship between social and financial performance in limited business sectors, notably health care and consumer discretionary. In addition, Baron et al. [74] argued that corporate social performance positively affects financial performance in the consumer industry sector while it exhibits a negative relationship in the industrial sector. Similarly, Arian et al. [75] highlight that while firm ESG performance appears to be associated with improved financial performance, this is not consistent across industries.
The variables, business strategies, and industrial characteristics that could change the relationship are still under-researched [76,77]. Further research with a more robust examination of diverse industries is needed [78-80]. Therefore, this study contends that earlier studies on the relationship's inconsistent and contradictory conclusions may be the result of distinct stakeholder groups and expectations among firms operating in different countries and sectors with varying characteristics and strategies. Accordingly, the study further proposes the following main hypotheses and sub-hypotheses:
H2: The impact of ESG score on firm value measures differs across countries in the MENA region.
- H2a:The impact of ESG score on Tobin’s Q (TQ) differs across countries in the MENA region.
- H2b: The impact of ESG score on Price to Book (PB) ratio differs across countries in the MENA region.
- H2c:The impact of ESG score on Price to Earnings (PE) ratio differs across countries in the MENA region.
H3: The impact of ESG score on firm value measures differs across sectors in the MENA region.
- H3a: The impact of ESG score on Tobin’s Q (TQ) differs across sectors in the MENA region.
- H3b: The impact of ESG score on Price to Book (PB) ratio differs across sectors in the MENA region.
- H3c The impact of ESG score on Price to Earnings (PE) ratio differs across sectors in the MENA region.
3. Data and Methodology
3.1. Data
In this study, ESG scores and financial data were sourced from London Stock Exchange Group (LSEG) Data & Analytics. For the country-specific control variables, data for the MENA region, including the list of countries, Gross Domestic Product (GDP), as well as the six Worldwide Governance Indicators (WGI), were obtained from the World Bank.
Notably, the COP21 signing of the Paris Agreement, effective November 2016, marked a turning point for ESG awareness and disclosures in the MENA region (PWC, 2023). Accordingly, 2017 became the starting point for the extensively rising ESG scoring trend for the MENA region firms, as very little information on ESG scores and disclosures was available prior to that year. This trend could be observed in Figure 1, which demonstrates a growing response in disclosing sustainability performance from MENA region firms due to the imposed regulations and increased stakeholder awareness.
The study sample includes all publicly traded firms with LSEG Data & Analytics ESG scores in the MENA region over a 6-year period from 2017 to 2022 in all MENA region countries based on data availability. The list of firms with ESG scores is collected each year, alongside the corresponding firm value measures. Some exclusions are imposed to ensure dataset reliability based on two selection criteria. In line with the previous literature, the first criterion is that firms should be operating in a non-banking industry due to the different nature of their working capital structure and the varied regulatory constraints imposed by authorities [64]. The availability of full data and variables for the firms in the sample during the whole study period is the second criterion.
This quantitative methodology and sampling technique yield a sample of 306 observations across 51 firms in 9 MENA region countries, including the 6 GCC countries of Bahrain, Kuwait, Oman, Qatar, Saudi Arabia, and the United Arab Emirates, as well as Egypt, Israel, and Morocco, from 10 sectors based on the Global Industry Classification Standard (GICS®) by Morgan Stanley Capital International (MSCI) over the period from 2017 to 2022. According to Karimi et al. [81] and Kripfganz [82], since the panel data sample includes complete observations for each sample unit throughout the study period, it represents a strongly balanced panel data sample that excels at establishing trends and highlighting correlations. Table 1 illustrates the classification of the sampled firms in the MENA region into their corresponding GICS® sectors.
3.2. Measurement of Variables
This study employs the same ESG performance proxy that has been widely used by predecessor researchers. Several studies in the MENA region have used the LSEG Data & Analytics (formerly Refinitiv® Eikon) ESG scores as their independent variable [52,64,67,83].
Regarding firm value measures, TQ is preferred as a proxy by many scholars [50,84-89]. It is a market-based performance indicator that compares a firm’s assets to its market value. This ratio is commonly used by academics and practitioners to analyse if a company is overvalued or undervalued [90-95]. However, some critiques have been directed towards TQ as a proxy for firm value. As highlighted in their paper, Butt et al. [96]. shed light on TQ criticism by arguing that TQ may provide falsely favourable results for marketing-related research, where marketing academics typically use TQ as an indicator of firm value. Additionally, TQ is based on accounting-based data, which frequently undervalues intangibles, thereby overstating firms’ success in intangibles such as marketing, human resources, and R&D.
Price multiples can also be used as proxies for firm value [97-99]. Therefore, recent researchers then employed PE and PB ratios as firm value proxies since they capture the market expectations relating to both future earnings and the risks associated with those earnings [100-103]. Consequently, this study contributes to the literature by considering these three financial measures of firm value.
Consistent with ESG literature, size and leverage are included as firm-specific control variables [52,86,88,89]. The funds received by a firm from outside sources to finance its operations are referred to as financial leverage, which is the ratio of total liabilities to total assets. In this study, financial leverage is considered a control variable since it is argued that managers frequently reveal more ESG information as leverage increases due to increased financial institution scrutiny. Furthermore, firm size, which is calculated by the natural log of total assets, is considered a control variable because previous research revealed a favorable association between ESG disclosure and size [86,104].
Regarding the country-specific control variables, this paper controls for Gross Domestic Product (GDP) and Country Governance (GOV) to consider the other effects on ESG score [46,53]. The description and measurements of the dependent, independent, and control variables employed in the empirical models are further illustrated in Table 2.
3.3. Research Model
This paper employs the following panel regression analysis models to investigate the impact of ESG on firm value by incorporating country and sector dummies, following Kaiser [105] and Sharma et al. [106], as follows:
The model is divided further into three sub-models based on the firm value proxy as follows:
Where: FV is a continuous variable; the dependent variable is the firm value measured by three models (i.e., TQ model, PE model, and PB model). β0 is the constant and β1–5 the slope of the controls and independent variables. The independent variable is the ESG score. The firm’s control variables are leverage (Lev) and firm size (S), and the country’s control variables are Gross Domestic Product (GDP) and governance (GOV). (ε) is a random error, (i) stands for firms, (t) stands for the period, and (g) represents the country. The description and measurements of the dependent, independent, and control variables employed in the empirical models are further illustrated in Table 4. dCountry represents the country dummy variables to control for the country-effects in the models, and dSector represents the sector dummy variables to control for the sector-effects in the models.
To ensure robustness of the models prior to performing regression analyses, sensitivity analysis was conducted through the forward stepwise introduction of variables. This method is widely established for its ability to systematically evaluate the contribution of different variables to get a model outcome and, in that way, to identify substantial predictors while taking into consideration the differing potential of the input variables for multicollinearity [107]. This analysis adds variables sequentially via statistical selection processes and details how the addition of any given variable influences the fit of the research model.
4. Results and Discussion
4.1. Descriptive Statistics
Table 3 presents the descriptive statistics for the sample, showing the distribution of firm-year observations by country and sector. The sample composition by country reveals that the highest number of firm-year observations is from Israel (72), followed by Saudi Arabia (54). The sample composition by sector reveals that most firm-year observations are concentrated in the communication services sector (90), followed by the real estate sector (54).
Table 4 shows that the average ESG score in the MENA region is 32.08. The highest score was 86.20 in 2021 for Teva Pharmaceutical Industries Ltd in Israel’s healthcare sector, while the lowest was 0.97 in 2017 for Israel Corporation Ltd in the materials sector. The average TQ in the region is 0.66, with the highest TQ of 4.76 in 2022 for Global Telecom Holding SAE in Egypt’s communication services sector, and the lowest of 0.02 in 2020 for Taro Pharmaceutical Industries Ltd in Israel’s healthcare sector. The average PB ratio is 2.38, with the highest of 22.57 in 2018 for Bezeq Israeli Telecommunication Corp Ltd in Israel’s communication services sector, and the lowest of 0.28 in 2020 for Douja Promotion Groupe Addoha SA in Morocco’s real estate sector. The average PE ratio is 16.67, with a maximum of 479.18 in 2021 for Ooredoo QPSC in Qatar’s communication services sector, and a minimum of 0.49 in 2021 for Douja Promotion Groupe Addoha SA in Morocco’s real estate sector.
4.2. Correlation Analysis
Table 5 presents the results of Pearson’s correlation matrix coefficients for all variables. At the significance level of 10%, it is noted that the ESG score and firm value proxies of TQ, PB, and PE are strongly linked with each other. Results show that the positive coefficients of ESG of 0.123, 0.199, and 0.123 are significantly correlated with TQ, PB. and PE ratios, respectively. This proposes initial evidence regarding the existence of a significant positive relationship between the ESG score and firm value proxies. These correlations provide some preliminary evidence to suggest that the ESG score offers informative inferences about MENA region firm value proxies to market participants.
4.3. Regression Analysis
Table 6 reports the empirical regression results, where, at significance level of 10%, the ESG regression coefficients are positive and significant with both TQ and PB, respectively. However, at the same level of significance, the positive regression coefficient of ESG is not statistically significant with PE ratio. This implies that, for MENA region firms, a higher ESG score—after controlling for the country and sector effects—correlates with higher TQ and PB ratios, and thus, higher firm value. This is consistent with the studies previously mentioned, which support the positive viewpoint of this relationship in the literature review, indicating that ESG scores are perceived as a crucial variable in determining the value of MENA region firms. Since a firm’s capital in the MENA region is typically characterized by higher concentrated ownership structures and the predominance of family ties and informal relationships [108], the level of information asymmetry between firms’ management and outsiders will be higher. Therefore, ESG scores add incremental value-relevant information beyond those contained in the financial reports [51,56,109,110].
The incorporation of county and sector dummies points to further evidence of the influence various countries and sectors may have on the significance and direction of the relationship between ESG score and firm value. Regarding country effects, first, the dCountry slope coefficients of ESG for TQ indicate that the impact of ESG is significant compared to the base category (United Arab Emirates); however negatively, in Israel, Kuwait, Morocco, Oman, and Saudi Arabia. These results suggest that high ESG performance and disclosures, reflected in high ESG scores, do not outweigh their costs in these countries. For Bahrain and Egypt, no statistical evidence is strong enough to highlight the existence of a significant relationship. However, statistical evidence points to the existence of significant positive ESG-TQ in Qatar. Second, the dCountry slope coefficients of ESG for PB indicate that the impact of ESG is negatively significant, only for Oman and Qatar. Moreover, no statistical evidence is significant to indicate the existence of an ESG-PB relationship in the other countries.
Regarding sector effects, first, the dSector slope coefficients of ESG for TQ indicate that the impact of ESG is significant compared to the base category (utilities), however negatively, in consumer staples, financials, healthcare, industrials, information technology, materials, and real estate sectors. For the other sectors (communication services and energy), no statistical evidence is strong enough to highlight the existence of a significant relationship between ESG and TQ ratio. Second, the dSector slope coefficients of ESG for PB indicate that the impact of ESG is negatively significant only for healthcare and real estate sectors. However, it points to a significant positive relationship in the communication services and information technology sectors. Furthermore, no statistical evidence is significant to indicate the existence of the ESG-PB relationship in the other MENA region sectors in the sample understudy.
Third, the dCountry and dSector slope coefficient results for the PE model are not regarded in the analysis of findings since the model empirical results do not point to a significant relationship between ESG and PE ratio in the MENA region, as highlighted in some literature [111-113]. The PE ratio reflects investors’ market perception of a firm’s future earnings potential. Thus, lower PE ratios for high ESG scores indicate that investors have negative sentiments regarding the future performance of the firm and are paying less for each dollar of earnings [113].
Interestingly, both Qatar and the information technology sector exhibit a changing behavior between the direction of significant ESG-TQ relationship and ESG-PB relationship, where Qatar shows a negative influence of ESG on TQ, however it changes to be positive with respect to PB. Similarly, the information technology sector shows a negative impact of ESG on TQ; however, it changes to be positive with respect to PB. In addition, the countries of Israel, Kuwait, Morocco, and Saudi Arabia and the sectors of consumer staples, financials, industrials, and materials all exhibit a diminishing ESG impact on PB firm value proxy despite showing a significant impact when proxied by TQ. This provides supportive evidence for the hypothesis that the ESG impact on firm value differs depending on the firm value proxy used, even for the same sample unit.
Consequently, the regression results provide sufficient evidence regarding the empirical hypotheses testing of ESG-firm value country and sector-effects models by failing to reject H1a, H1b, H2a, H2b, H3a, and H3b while rejecting H1c, H2c, and H3c. In line with previous literature, mixed results and contradicting conclusions have been reached regarding the impact of the ESG score on firm value as measured by various indicators, including TQ, PB, and PE ratios. Such disparities in direction and significance of ESG-firm value effects using different proxies for TQ, PB, and PE models, even with respect to the results of the same country and sector, add to the advocating literature of the mixed viewpoint, as highlighted by previous researchers [49,51,53,54,56,89,114,115].
4.4. Discussion
The findings of this study are supported by the Institutional Difference Hypotheses, where the institutional, cultural, and regulatory differences across countries as well as the institutional weaknesses in emerging markets affect the relationship between corporate sustainability performance and financial performance. In developing markets, firms tend to focus on capital accumulation rather than ESG investment. Such firms in developing markets are not subject to the same government pressures for ESG as those operating in developed economies [114].
In emerging markets like the MENA region, the positive impact of ESG on firm value decreases, and the excessive expenditure on ESG adoption and expensive ESG activities in such developing nations may serve as an explanation for this. Another explanation could be that the impact of ESG practices and scores does not often reflect in the short term, but they have a long-term orientation [115].
This could be further explained by the Enterprise Risk Management paradigm in the argument of Chairani and Siregar [116], where different risk management approaches among firms may cause ESG impact on firm value to fluctuate. Moreover, limited investor competency, changing investor preferences, market misvaluation, and ESG disclosure complexity are to blame for the negative correlation between ESG scores and firm value in emerging markets. Although ESG companies have outperformed the market in developed countries, this does not apply to developing countries [70,102].
The concept of ESG is relatively new in the MENA region, with few nations having developed any policies or regulations. With the assistance of NGOs and stock exchange authorities, the most notable attempts to encourage firms to move in that direction have been made during the past eight years. Nonetheless, there have been some initiatives in the area to raise the profile of sustainability. Notably, the UN Sustainable Stock Exchanges Initiative (SSE) is the significant driver behind ESG transparency and sustainability [117-120].
The disparities across MENA region sectors regarding ESG impact on value creation are justified by firms demonstrating varying ESG responsibilities by engaging in procedures that achieve a broader contextual, environmental, social, and governance agenda beyond legal frameworks [121].However, the importance of particular activities is determined by their application context, where these activities may differ in terms of impacting financial performance [121,122].Consequently, for instance, issues that are crucial to stakeholders in the energy sector may not be of utmost importance to those in the healthcare sector. In addition, the relationship between sustainability performance and financial performance is contingent upon the kind of commodities offered to customers [123].
Accordingly, each sector benefits/loses from ESG to different extents. Some of them are immune to ESG scores; for example: the energy sector is not sensitive to ESG across all firm value measures. The consumer staples, financial, industrials, and materials sectors are sensitive towards ESG only when measured by TQ. For information technology, real estate, communication services, and healthcare sectors, the direction and significance of ESG impact fluctuates across measures. Therefore, based on these findings, it is noted that there exists a contingency perspective on the effect of ESG scores on firm value, which can be observed by statistically significant differentiated results across the analysed countries and sectors. Indeed, results range from local to international levels, short-term to long-term, and voluntary to fully mandated [124].
Lastly, it is important to recall that imperfect markets might affect the valuation in the case of ESG scores. Since there may be wide variations in the relationship between created value and cost, the market for ESG initiatives is highly imperfect. With reference to Table 6, some MENA region countries exhibit immune behaviour against ESG across all proxies (i.e., Bahrain and Egypt). Israel, Kuwait, Morocco, and Saudi Arabia are sensitive towards ESG only when measured by TQ. Oman and Qatar exhibit fluctuating significance and direction of ESG impact across measures. These arguments lead to the conclusion that the primary valuation issue is market incompleteness [125]. It is suggested that there might be more possible variations arising from the arguments among the specific market nature across various countries.
4.5. Robustness Test
Robustness tests were applied to the regression results by expanding the analyses from the MENA region to the MENAT region. This approach is crucial for validating the robustness of the study findings because it demonstrates whether conclusions drawn from the initial analyses hold true across a larger and more diverse set of data [126]. Further adding to the rigor of the overall hypotheses conclusions was the incorporation of Turkey, indicating that the relations between ESG scores and proxies of firm values are generally stable and generalizable across a broader regional context. Including Turkey not only enhances sample representativeness but also allows for a more comprehensive investigation of the relationships between ESG scores and firm value proxies, thereby increasing the generalizability of the findings across different economic and cultural contexts.
The empirical results of the MENAT region, exhibited in Table 7, indicate that integrating Turkey into the analyses did not alter any of the core hypotheses regarding the impact of ESG scores on firm value, which differs across different proxies, countries, and sectors. Turkey exhibits a variety of unique market features, including economic dynamics, regulatory environment specifics, and culture [127]. These variations are likely to induce minor differences in the significance and direction of some variables and country/sector dummies. Ultimately, model robustness and resilience are proven since the main hypotheses hold despite these modifications. This confirms that while Turkey adds complexity, it does not alter the relationship being investigated.
5. Conclusions
The association between sustainability performance and financial performance has attracted many scholars, who report inconclusive results. The reasons for these mixed results could be attributed to the complex nature of ESG activities, embedded country-specific legal origin, cultural, social, and economic institutional environment, industry characteristics, investor perception, and the associated costs as well as benefits of such activities. As a result, data discrepancies based on geographical locations and business characteristics lead to inconsistent conclusions in both developed and developing countries across the literature [8,9]. Research concerning ESG performance, as it relates to firm value, has provided mixed results in developed countries. The same is true for developing nations. Therefore, the primary motivation for this study is to provide empirical evidence that could convince firms not only to adopt ESG but also to have high ESG ranks.
Based on the data availability of LSEG Data & Analytics publicly traded non-financial firms in the MENA region from 2017 to 2022, a sample of 51 firms in 9 countries and 10 business sectors is employed to investigate the impact of ESG scores on firm value through the three proxies of Tobin’s Q (TQ), Price to Book ratio (PB), and Price to Earnings ratio (PE). Regression analysis reveals mixed findings as the results vary based on the used proxy, where the ESG-firm value relationship is found to be significantly positive using TQ and PB ratios. However, when the PE ratio is integrated into the analysis, no significant relationship is yielded. Empirical results demonstrate that there are differences in the impact of ESG on firm value across measures, countries, and sectors.
This study has implications for both theory and practice. Theoretically, this study expands the ESG-firm value literature by investigating the ESG-firm value relationship on a firm-level across a variety of MENA region countries and sectors using various proxies. Empirical findings also contribute to the enrichment of ESG and financial decision-making literature, where they could raise investors’ awareness in terms of portfolio optimization and sustainable investing.
Practically, results are beneficial to stakeholders such as investors, regulators, policymakers, and scholars in improving their understanding of ESG implications and advantages. It also provides insights on how firms might benefit from the initiatives to promote ESG by linking ESG to financial performance. This study proposes that managers need to carefully choose ESG goals because their success depends on the country and industry contexts. Firms should maximize their efforts to find cost-efficient ways of ESG incorporation into value chains. Firms should also accept sustainability as a strategic priority prior to implementing ESG practices. Once sustainability has been elevated to a strategic priority, firms can begin to implement ESG practices with some confidence that this will not only yield ESG performance improvements but also improved organizational performance in the long term [115,128].
The findings also offer insights for market regulators in emerging economies on the advancement of ESG adoption, where regulators are central in shaping the ESG adoption landscape. This study pinpoints the need for strong regulatory structures that encourage firms to adopt sustainable practices. The regulators are in a position to enact policies that promote transparency and accountability, with the expectation that companies will comply with the formalized standards. In conclusion, effective regulation would allow competition among firms to spur improvement in ESG application. Of primary relevance are extensive insights from this study for countries with emerging economies, where regulatory frameworks are not fully developed, and thus it becomes important to establish clear guidelines to induce ESG practices.
For standard setters, it does stress the importance of enhancing the ESG regulations at the country level. Standard setters can work out comprehensive guidelines by discovering the key drivers of ESG performance, which are the ones to help companies adopt ESG factors in their business models. The study outcomes indicate that connecting ESG criteria to financial performance metrics can motivate firms to prioritise sustainability goals. This alignment should not only increase ESG rating credibility but also the firms are provided with an incentive to regard ESG as a competitive advantage instead of a compliance issue. In this regard, standard setters have the option to either improve the existing frameworks or create new ones that are more applicable to the challenges faced by the firms in the developing markets.
Similar to sustainability research conducted in emerging economies, a major limitation is the small sample size, which hinders the generalizability of findings. This could be justified by ESG disclosure deficiency and, accordingly, scores for firms, which reduce the sample size. The study period has been reduced to 6 years for the same reason. Another limitation is the quantity rather than the quality of ESG disclosure, where the results of this study may not necessarily provide the “true” motivation for firms to disclose sustainability activities.
Future studies may consider capturing performance related to each ESG pillar, gathering wide sample data to better separate industries and geographic regions in cross-national contexts, and examining the financial performance before and after ESG adoption. Consequently, it is advised to continue the regression analysis to forecast the ESG-firm value relationship, particularly by examining investors' understanding of ESG in a comprehensive approach. Lastly, the theme of long-term and short-term investors can also be tackled since they may have distinct investment goals that influence firm valuation. Incorporating and investigating their goals alongside their ESG motives for incorporating or not incorporating ESG criteria might shed new insights.
Author Contributions
For research articles with several authors, a short paragraph specifying their individual contributions must be provided. The following statements should be used “Conceptualization, M.R. and R.P.; methodology, M.R., N.F, and R.P; software, N.F. and R.P; validation, M.R.; formal analysis, M.R.; investigation, N.F.; resources, R.P.; data curation, N.F.; writing—original draft preparation, M.R., N.F and R.P.; writing—review and editing, M.R., N.F and R.P.; visualization, N.F.; supervision, R.P.; project administration, M.R.; All authors have read and agreed to the published version of the manuscript.”.
Funding
This research received no external funding.
Institutional Review Board Statement
“Not applicable”.
Informed Consent Statement
Not Applicable.
Data Availability Statement
the data is available as open source at World Bank (https://www.worldbank.org/en/publication/worldwide-governance-indicators) and at LSEG Refinetive database (https://eikon.refinitiv.com/) password restricted. Any Data will be provided upon request.
Conflicts of Interest
The authors declare no conflicts of interest.
Appendix A

Table A1.
ESG and Financial Performance Literature Summary for the MENA Region.
| Author/Year/ Journal | Title | Context | Variables/ Measures | Findings | Viewpoint |
| Ibrahim & Wahba [57] International Journal of Business and Management Studies. |
The Effect of Corporate Social Responsibility on the Firm’s Financial Performance. | Egypt (2007- 2010) |
CSR: S&P/EGX ESG Index. Financial Performance: ROA and EPS. |
There is a positive significant relation between corporate financial performance and the CSR. | Positive |
| Eldomiaty et al. [58] International Journal of Social Economics. |
The financial aspects of the corporate responsibility index in Egypt: A quantitative approach to institutional economics. | Egypt (2007- 2010) |
CSR: CSR Index. Financial Performance: Fundamental Financial Ratios. |
CSR positively impacts firms’ financial performance in terms of customer loyalty and sales turnover. | Positive |
| Ahmed [59] Journal of Accounting Research, Department of Accounting, Faculty of Commerce, Tanta University. |
Are corporate social and environmental responsibility, firm performance, and value mutually exclusive? Evidence from Egypt. | Egypt (2014) |
ESG: Dummy Variable for S&P/EGX ESG Inclusion. Firm Value: ROA and Tobin’s Q. |
There is a positive relationship between ESG and firm value. | Positive |
| Genedy and Sakr [60] International Journal of Business and Economic Development. |
The relationship between Corporate Social Responsibility and Corporate Financial Performance in developing countries. Case of Egypt. | Egypt (2007- 2015) |
CSR: S&P/EGX ESG ratings. CFP: ROA, ROE, and EPS. |
CSR has a positive relationship with Corporate Financial Performance. | Positive |
| Aboud and Diab [33] Sustainability Accounting, Management and Policy Journal. |
The financial and market consequences of environmental, social and governance ratings: The implications of recent political volatility in Egypt. | Egypt (2007-2016) |
ESG: S&P/EGX ESG index Firm Financial Performance: ROA. Firm Market Performance: Liquidity and Trading Volume. |
ESG has a significant positive impact on market & financial performance of a firm. The correlation between ESG ratings and financial performance was more pronounced during the recent period of political instability. | Positive |
| Abdelfattah & Aboud [63] Journal of International Accounting, Auditing and Taxation. |
Tax avoidance, corporate governance, and corporate social responsibility: The case of the Egyptian capital market. | Egypt (2007- 2016) |
CSR: S&P/EGX ESG ratings. Stock Returns: Average annual stock return. |
Higher CSR ratings are associated with higher stock returns, suggesting that CSR enhances firm value rather than reducing it. | Positive |
| Al-Jalahma et al. [69] 2020 International Conference on Decision Aid Sciences & Application. DASA. IEEE. |
Environmental, Social, and Governance (ESG) disclosure and firm performance: Evidence from GCC Banking sector. | GCC Countries (2016- 2019) |
ESG: ESG Disclosure. Bank Performance: ROA and ROE. |
Sustainability reporting negatively impacts banks’ performance. | Negative |
| Buallay et al. [46] Measuring Business Excellence |
Sustainability reporting and performance of MENA banks: is there a trade-off? | 12 MENA Countries (2008-2017) |
ESG: The Bloomberg ESG Score. Operational Performance: ROA. Financial Performance: ROE. Market Performance: Tobin’s Q. |
There is a positive impact of ESG score on performance and value to shareholders. | Positive |
| Ellili [68] Sustainability. |
Environmental, social, and governance disclosure, ownership structure and cost of capital: Evidence from the UAE. | United Arab Emirates (2010- 2019) |
ESG: The Bloomberg ESG Score. Cost of Capital: Cost of Equity, Cost of Debt, Cost of Preferred Equity, and Weighted Average Cost of Capital. |
ESG non-financial disclosures lower the cost of capital as well as the cost of debt and equity, separately. | Positive |
| Gerged et al. [52] Business Strategy & the Environment |
Is corporate environmental disclosure associated with firm value? A multicounty study of Gulf Cooperation Council firms. | Gulf Countries (2010-2014) |
CED: Annual Reports Content Analysis Firm Value: ROA and Tobin’s Q. |
CED has a significant positive impact on ROA, while it decreases on Tobin’s Q. | Mixed |
| Al-Hiyari and Kolsi [64] Global Business Review. |
How do stock market participants value ESG performance? Evidence from Middle Eastern and North African Countries. | 9 MENA Countries (2013- 2019) |
ESG: Thomson Reuters Eikon Scores. Firm Value: Stock Price per Share. |
There is a positive relationship between ESG performance and MENA firm valuation. ESG transparency provides MENA stock market players with value-relevant information which leads to more effective investment decisions and reduces the cost of capital. | Positive |
| Otaify [61] Journal of Financial and Commercial Studies. |
Environmental, Social, and Governance (ESG) Investing Risk and Return Analysis of Egyptian Sustainable Equity Index. | Egypt (2007- 2020) |
ESG Risk Premium: Risk Exposure of ESG Index to EGX30 Index. Financial Performance: abnormal return achieved by ESG index than the EGX30 index. |
ESG activities should be integrated into business practices by firms listed on the Egyptian stock exchange due to their significant role in enhancing firm value. | Positive |
| Bashatweh et al. [66] International Conference on Business and Technology. |
Does Environmental, Social, and Governance (ESG) Disclosure Add Firm Value? Evidence from Sharia-Compliant Banks in Jordan. | Jordan (2013- 2019) |
ESG Disclosure: Annual reports, CSR reports, and sustainability reports. Bank Value: ROA, ROI, EPS, and MBR. |
A higher ESG disclosure level is important for increasing the value of the institution for investors and other stakeholders. | Positive |
| Buallay [53] Sustainability reporting in the MENA region. |
Toward sustainability reporting in the MENA region: the effects on sector’s performance. | 11 MENA Countries (2008-2017) |
ESG: The Bloomberg ESG Score. Firm Operational Performance: ROA. Firm Financial Performance: ROE. Firm Market Performance: Tobin’s Q. |
The impact of Sustainability Reporting on firm performance (ROA), (ROE) and (TQ) is mixed in the MENA region. | Mixed |
| Hamdy et al. [62] The Scientific Journal of Business and Environmental Studies. |
Investigating the Impact of Sustainability on Corporate Profitability: Evidence from Egypt. | Egypt (2017) |
CSR: S&P/EGX ESG composite score. Corporate Profitability: ROE, ROA, and Return on Invested Capital (ROIC). |
ESG has a significant positive impact on investor behavior. High ESG firms are rewarded with high CSP. | Positive |
| Janah and Sassi [70] African Scientific Journal |
The role of ESG factors in mitigating crisis effects on Moroccan public companies’ financial performance. | Morocco (2022) |
Event Study. | While ESG companies have outperformed the market in developed countries, this does not necessarily apply to developing countries. | Mixed |
| Kouaib [67] Sustainability. |
Corporate Sustainability Disclosure and Investment Efficiency: The Saudi Arabian Context. | Saudi Arabia (2014- 2021) |
ESG: Thomson Reuters ESG score. Financial Performance: Investment Efficiency. |
ESG has a significant positive impact on firms' investment efficiency, promoting overall firm value. | Positive |
| Srour [54] Commerce and Finance. |
The impact of Environmental, Social, Governance (ESG) disclosure on firm value and Financial Performance: Evidence from Egypt during Covid 19. | Egypt (2018- 2021) |
ESG: S&P/EGX ESG index ranking. Firm Value: ROA and Tobin’s Q. |
ESG has an insignificant positive impact on ROA and a significant positive impact on Tobin’s Q | Mixed |
| Al Amosh et al. [55] Corporate Governance: The International Journal of Business in Society |
Environmental, social and governance impact on financial performance: evidence from the Levant countries. | 4 Levant Countries (2012-2019) |
ESG: Annual Reports Content Analysis Financial Performance: Tobin’s Q, ROA, and ROE. |
ESG collective performance maximizes financial performance, while the governance performance influences ROA only. | Mixed |
| Aqabna et al. [56] Sustainability |
Firm Performance, Corporate Social Responsibility, and the Impact of Earnings Management during COVID-19: Evidence from MENA Region. | 9 MENA Countries (2007-2021) |
ESG: Refinitiv® Eikon ESG Score. Operational Performance: ROA. Financial Performance: ROE. Market Performance: Tobin’s Q. |
ESG has a significant positive impact on ROA and Tobin’s Q, however, an insignificant impact on ROE. | Mixed |
| El Khoury et al. [51] Journal of Sustainable Finance & Investment |
ESG and financial performance of banks in the MENAT region: concavity–convexity patterns. | 10 MENAT Countries (2007-2019) |
ESG: Refinitiv® Eikon ESG Score. Firm Operational Performance: ROA. Firm Financial Performance: ROE. Firm Market Performance: Tobin’s Q. |
The magnitude of ESG investment is not impacting anymore the accounting performance in MENAT while it still positively affects market performance. | Mixed |
| Firmansyah et al. [71] Cogent Economics & Finance |
Investigating the effect of ESG disclosure on firm performance: The case of Saudi Arabian listed firms. | Saudi Arabia (2010- 2020) | ESG: The Bloomberg ESG Score. Market-based Performance: Tobin’s Q. Accounting-based Performance: ROE |
ESG has a significant negative impact on Tobin’s Q, however, an insignificant negative association exists between ESG and ROE. | Negative |
References
- Liou, J.J.; Liu, P.Y.; Huang, S.-W. Exploring the key barriers to ESG adoption in enterprises. Syst. Soft Comput. 2023, 5. [CrossRef]
- Hashmi, S.D.; Akram, S. Impact of Green Supply Chain Management on Financial and Environmental Performance: Mediating Role of Operational Performance and the Moderating Role of External Pressures. Logforum 2015, 17, 359–371. [CrossRef]
- Ioannou, I.; Serafeim, G. Yes, Sustainability Can Be a Strategy. Harvard Business Review. 2019, 11.
- Gyönyörová, L.; Stachoň, M.; Stašek, D. ESG ratings: relevant information or misleading clue? Evidence from the S&P Global 1200. J. Sustain. Finance Invest. 2021, 13, 1075–1109. [CrossRef]
- Eldomiaty, T.; Rashwan, M. Monitoring Competing Models of Firm Growth Using Financial Data. International Journal of Economics & Business Research. 2013, 6, 69-86.
- Gillan, S.L.; Koch, A.; Starks, L.T. Firms and social responsibility: A review of ESG and CSR research in corporate finance. J. Corp. Finance 2021, 66. [CrossRef]
- Mio, C.; Fasan, M.; Scarpa, F. Materiality investor perspectives on utilities’ ESG performance. An empirical analysis of ESG factors and cost of equity. Util. Policy 2023, 82. [CrossRef]
- Darrag, M.; El Seidi, R. AAIB & CSR in Egypt: A 10 year Review! The MENA Journal of Business Case Studies. 2015, 1.
- Janah, O.; Sassi, H. The ESG Impact on Corporate Financial Performance in Developing Countries: A Systematic Literature Review. International Journal of Accounting, Finance, Auditing, Management and Economics. 2021, 2, 391-410. [CrossRef]
- Ernest & Young. Available online: https://www.ey.com/en_sa/sustainability/why-sustainability-is-an-opportunity-for-better-growth-in-mena. Accessed on (15 August 2024).
- PwC. Available online: https://www.pwc.com/m1/en/sustainability/insights/sustainability-in-the-middle-east-2024.html. Accessed on (24 August 2024).
- Annesi, N.; Battaglia, M.; Ceglia, I.; Mercuri, F. Navigating paradoxes: building a sustainable strategy for an integrated ESG corporate governance. Manag. Decis. 2024, 63, 531–559. [CrossRef]
- Moskowitz, M. Choosing Socially Responsible Stocks. Business and Society Review. 1972, 1, 71-75.
- Bragdon, J. H.; Marlin, J. Is Pollution profitable. Risk Management. 1972, 19, 9-18.
- Vance, S. Are Socially Responsible Corporations Good Investment Risks? Management Review. 1975, 64, 18.
- Hong, H.; Kacperczyk, M. The price of sin: The effects of social norms on markets. J. Financial Econ. 2009, 93, 15–36. [CrossRef]
- Lobe, S.; Walkshäusl, C. Vice versus virtue investing around the world. Rev. Manag. Sci. 2014, 10, 303–344. [CrossRef]
- Waddock, S.A.; Graves, S. B. The Corporate Social Performance–Financial Performance Link. Strategic Management Journal. 1997, 18, 303-319.
- Scholtens, B. A note on the interaction between corporate social responsibility and financial performance. Ecol. Econ. 2008, 68, 46–55. [CrossRef]
- Lu, W.(.; Taylor, M.E. Which Factors Moderate the Relationship between Sustainability Performance and Financial Performance? A Meta-Analysis Study. J. Int. Account. Res. 2015, 15, 1–15. [CrossRef]
- Tuppura, A.; Arminen, H.; Pätäri, S.; Jantunen, A. Corporate social and financial performance in different industry contexts: the chicken or the egg?. Soc. Responsib. J. 2016, 12, 672–686. [CrossRef]
- Wang, S.; Gao, Y. What do we know about corporate social responsibility research? a content analysis. Ir. J. Manag. 2016, 35, 1–16. [CrossRef]
- Ullmann, A. A. Data in Search of a Theory: A Critical Examination of the Relationships among Social Performance, Social Disclosure, and Economic Performance of US Firms. Academy of management review. 1985, 10,540-57.
- Fowler, S.J.; Hope, C. A Critical Review of Sustainable Business Indices and their Impact. J. Bus. Ethic- 2007, 76, 243–252. [CrossRef]
- Amel-Zadeh, A.; Serafeim, G. Why and How Investors Use ESG Information: Evidence from a Global Survey. Financial Anal. J. 2018, 74, 87–103. [CrossRef]
- Cornell, B.; Damodaran A. Valuing ESG: Doing Good or Sounding Good? NYU Stern School of Business. 2020.
- Li, F.; Polychronopoulos, A. What a Difference an ESG Ratings Provider Makes. Research Affiliates. 2020, 15.
- Olsen, B.C.; Awuah-Offei, K.; Bumblauskas, D. Setting materiality thresholds for ESG disclosures: A case study of U. S. mine safety disclosures. Resour. Policy 2021, 70. [CrossRef]
- Friedman, M. Corporate Ethics and Corporate Governance, 1st ed.; Springer Berlin, Heidelberg; 2007, pp. 173-178.
- Azmi, W.; Hassan, M.K.; Houston, R.; Karim, M.S. ESG activities and banking performance: International evidence from emerging economies. J. Int. Financial Mark. Institutions Money 2021, 70. [CrossRef]
- Freeman, R. E. (1984). Strategic management: A stakeholder approach. Pitman.
- Ambler, T.; Wilson, A. Problems of Stakeholder Theory. Business Ethics: A European Review. 1995, 4, 30–5.
- Aboud, A.; Diab, A. Ownership Characteristics and Financial Performance: Evidence from Chinese Split-Share Structure Reform. Sustainability 2022, 14, 7240. [CrossRef]
- Khan, A.; Baker, H.K. How board diversity and ownership structure shape sustainable corporate performance. Manag. Decis. Econ. 2022, 43, 3751–3770. [CrossRef]
- Espinosa-Méndez, C.; Maquieira, C.P.; Arias, J.T. The Impact of ESG Performance on the Value of Family Firms: The Moderating Role of Financial Constraints and Agency Problems. Sustainability 2023, 15, 6176. [CrossRef]
- Melo, T. Slack-resources hypothesis: a critical analysis under a multidimensional approach to corporate social performance. Soc. Responsib. J. 2012, 8, 257–269. [CrossRef]
- Godfrey, P.C.; Merrill, C.B.; Hansen, J.M. The relationship between corporate social responsibility and shareholder value: an empirical test of the risk management hypothesis. Strat. Manag. J. 2008, 30, 425–445. [CrossRef]
- Schaltegger, S.; Freund, F.L.; Hansen, E.G. Business cases for sustainability: the role of business model innovation for corporate sustainability. Int. J. Innov. Sustain. Dev. 2012, 6, 95-119. [CrossRef]
- Lu, H.; Liu, X.; Falkenberg, L. Investigating the Impact of Corporate Social Responsibility (CSR) on Risk Management Practices. Bus. Soc. 2020, 61, 496–534. [CrossRef]
- Yu, M.; Zhao, R. Sustainability and firm valuation: an international investigation. Int. J. Account. Inf. Manag. 2015, 23, 289–307. [CrossRef]
- Lu, W.; Chau, K.; Wang, H.; Pan, W. A decade's debate on the nexus between corporate social and corporate financial performance: a critical review of empirical studies 2002–2011. J. Clean. Prod. 2014, 79, 195–206. [CrossRef]
- Friede, G.; Busch, T.; Bassen, A. ESG and financial performance: aggregated evidence from more than 2000 empirical studies. J. Sustain. Finance Invest. 2015, 5, 210–233. [CrossRef]
- Santis, P.; Albuquerque, A.; Lizarelli, F. Do sustainable companies have a better financial performance? A study on Brazilian public companies. J. Clean. Prod. 2016, 133, 735–745. [CrossRef]
- Chen, R. C. Y.; Hung, S. W.; Lee, C. H. Does Corporate Value Affect the Relationship between Corporate Social Responsibility and Stock Returns? Journal of Sustainable Finance & Investment. 2017, 7, 188–96.
- Fatemi, A.; Glaum, M.; Kaiser, S. ESG performance and firm value: The moderating role of disclosure. Glob. Finance J. 2018, 38, 45–64. [CrossRef]
- Buallay, A.; Fadel, S. M.; Al-Ajmi, J. Y.; Saudagaran, S. Sustainability Reporting and Performance of MENA Banks: is there a Trade-off? Measuring Business Excellence. 2020, 24, 197–221.
- Varvara, N.; Victoria, L. Do ESG Factors Influence Investment Attractiveness of the Public Companies? Journal of Corporate Finance Research. 2022, 16, 38–64.
- Fahad, P.; Busru, S. CSR Disclosure and Firm Performance: Evidence from an Emerging Market. Corporate Governance: The International Journal of Business in Society. 2021, 21, 553–68.
- Dincă, M.S.; Vezeteu, C.-D.; Dincă, D. The relationship between ESG and firm value. Case study of the automotive industry. Front. Environ. Sci. 2022, 10. [CrossRef]
- Saygili, E.; Arslan, S.; Birkan, A.O. ESG practices and corporate financial performance: Evidence from Borsa Istanbul. Borsa Istanb. Rev. 2022, 22, 525–533. [CrossRef]
- El Khoury, R.; Nasrallah, N.; Alareeni, B. ESG and financial performance of banks in the MENAT region: concavity–convexity patterns. J. Sustain. Finance Invest. 2021, 13, 406–430. [CrossRef]
- Gerged, A.M.; Beddewela, E.; Cowton, C.J. Is corporate environmental disclosure associated with firm value? A multicountry study of Gulf Cooperation Council firms. Bus. Strat. Environ. 2020, 30, 185–203. [CrossRef]
- Buallay, A. Toward sustainability reporting in the MENA region: the effects on sector's performance. Manag. Finance 2022, 48, 1137–1155. [CrossRef]
- Srour, M.I. The impact of Environmental, Social, Governance (ESG) disclosure on firm value and Financial Performance: Evidence from Egypt during Covid 19. Al-Tiǧāraẗ Wa Al-Tamwīl 2022, 42, 1–19. [CrossRef]
- Al Amosh, H.; Khatib, S.F.; Ananzeh, H. Environmental, social and governance impact on financial performance: evidence from the Levant countries. Corp. Governance: Int. J. Bus. Soc. 2022, 23, 493–513. [CrossRef]
- Aqabna, S.M.; Aga, M.; Jabari, H.N. Firm Performance, Corporate Social Responsibility and the Impact of Earnings Management during COVID-19: Evidence from MENA Region. Sustainability 2023, 15, 1485. [CrossRef]
- Ibrahim, M. E. M.; Wahba, H. H. The Effect of Corporate Social Responsibility on the Firm’s Financial Performance. International Journal of Business and Management Studies. 2013, 5, 147–56.
- Eldomiaty, T.; Soliman, A.; Fikri, A.; Anis, M. The financial aspects of the Corporate Responsibility Index in Egypt. Int. J. Soc. Econ. 2016, 43, 284–307. [CrossRef]
- Ahmed, A. H. Are Corporate Social and Environmental Responsibility, Firm Performance and Value Mutually Exclusive? Evidence from Egypt. Journal of Accounting Research. 2017, 2, 1–21.
- Genedy, A.; Sakr, A. The Relationship between Corporate Social Responsibility and Corporate Financial Performance in Developing Countries. Case of Egypt. International Journal of Business and Economic Development. 2017, 5, 59–73.
- Otaify, M. Environmental, Social, and Governance (ESG) Investing Risk and Return Analysis of Egyptian Sustainable Equity Index. Maǧallaẗ Al-Dirāsāt Al-Māliyyaẗ Wa Al-Tiǧāriyyaẗ. 2021, 31, 1–23. [CrossRef]
- Hamdy, A.; Abdel-Kader, M.G.; Mahmoud, K.A.-E.K. An Empirical Examination of Stock Market Reaction to the Corporate Sustainable Performance: The Egyptian Stock Exchange Evidence. Al-Mağallah Al-ʿilmiyyaẗ Lil-Dirāsāt Al-Muḥāsabiyyaẗ 2022, 4, 471–525. [CrossRef]
- Abdelfattah, T.; Aboud, A. Tax avoidance, corporate governance, and corporate social responsibility: The case of the Egyptian capital market. J. Int. Accounting, Audit. Tax. 2020, 38. [CrossRef]
- Al-Hiyari, A.; Kolsi, M.C. How do Stock Market Participants Value ESG Performance? Evidence from Middle Eastern and North African Countries. Glob. Bus. Rev. 2021, 25, 934–956. [CrossRef]
- Elhendawy, M.; Shousha, A.; Rady, A. Corporate Governance, Environmental and Social Responsibility and Firm Performance: Evidence from Egypt. Al-Mağallah Al-ʿilmiyyaẗ Lil Dirāsāt Wa Al-Buḥut Al-Māliyyaẗ Wa Al-Tiğāriyyaẗ. 2021, 2, 455–526.
- Bashatweh, A.D.; Abutaber, T.A.; AlZu’bi, M.J.; Abu Khader, L.F.; Al-Jaghbir, S.A.; AlZoubi, I.J. Does Environmental, Social, and Governance (ESG) Disclosure Add Firm Value? Evidence from Sharia-Compliant Banks in Jordan. International Conference on Business and Technology. 2022, 487, 585–595.
- Kouaib, A. Corporate Sustainability Disclosure and Investment Efficiency: The Saudi Arabian Context. Sustainability 2022, 14, 13984. [CrossRef]
- Ellili, N.O.D. Impact of environmental, social and governance disclosure on dividend policy: What is the role of corporate governance? Evidence from an emerging market. Corp. Soc. Responsib. Environ. Manag. 2022, 29, 1396–1413. [CrossRef]
- Al-Jalahma, A.; Al-Fadhel, H.; Al-Muhanadi, M.; Al-Zaimoor, N. Environmental, Social, and Governance (ESG) Disclosure and Firm Performance: Evidence from GCC Banking Sector. In Proceedings of 2020 International Conference on Decision Aid Sciences and Application, Sakheer, Bahrain, 08-09 November 2020.
- Janah, O. O.; Sassi, H. The Role of ESG Factors in Mitigating Crisis Effects on Moroccan Public Companies’ Financial Performance. African Scientific Journal. 2022, 3, 256–256.
- Firmansyah, E.A.; Umar, U.H.; Jibril, R.S. Investigating the effect of ESG disclosure on firm performance: The case of Saudi Arabian listed firms. Cogent Econ. Finance 2023, 11. [CrossRef]
- Hull, C.E.; Rothenberg, S. Firm performance: the interactions of corporate social performance with innovation and industry differentiation. Strat. Manag. J. 2008, 29, 781–789. [CrossRef]
- Hoepner, G.F.; Yu, P.S. Corporate Social Responsibility Across Industries: When Can Who Do Well by Doing Good? Social Science Research Network. 2010.
- Baron, D.P.; Harjoto, M.A.; Jo, H. The Economics and Politics of Corporate Social Performance. Bus. Politi- 2011, 13, 1–46. [CrossRef]
- Gholami, A.; Sands, J.; Shams, S. The Impact of Corporate ESG Performance Disclosure Across Australian Industries. Australas. Account. Bus. Finance J. 2022, 16, 180–200. [CrossRef]
- Aouadi, A.; Marsat, S. Do ESG Controversies Matter for Firm Value? Evidence from International Data. J. Bus. Ethic- 2016, 151, 1027–1047. [CrossRef]
- Brooks, C.; Oikonomou, I. The effects of environmental, social and governance disclosures and performance on firm value: A review of the literature in accounting and finance. Br. Account. Rev. 2018, 50, 1–15. [CrossRef]
- Omar, B.F.; Zallom, N.O. Corporate social responsibility and market value: evidence from Jordan. J. Financial Rep. Account. 2016, 14, 2–29. [CrossRef]
- Sanches Garcíia, A.; Mendes-Da-Silva, W.; Orsato, R.J. Sensitive industries produce better ESG performance: Evidence from emerging markets. J. Clean. Prod. 2017, 150, 135–147. [CrossRef]
- Kumar, P.; Firoz, M. Does Accounting-based Financial Performance Value Environmental, Social and Governance (ESG) Disclosures? A detailed note on a corporate sustainability perspective. Australas. Account. Bus. Finance J. 2022, 16, 41–72. [CrossRef]
- Karimi, T.O.; Niknam, A.R.; Moghadam, M.S. Natural Gas Consumption and Temperature: Balanced and Unbalanced Panel Data Regression Model. Advances in Environment, Biotechnology and Biomedicine. 2012, 1, 81–86.
- Kripfganz, S. Generalized Method of Moments Estimation of Linear Dynamic Panel Data Models. In Proceedings of London Stata Conference, London, United Kingdom, 05–06 September 2019.
- Lunawat, A.; Lunawat, D. Do Environmental, Social, and Governance Performance Impact Firm Performance? Evidence from Indian Firms. Indones. J. Sustain. Account. Manag. 2022, 6, 133–146–133–146. [CrossRef]
- Mishra, D.R. Post-innovation CSR Performance and Firm Value. J. Bus. Ethic- 2015, 140, 285–306. [CrossRef]
- Rehman, O. Impact of Capital Structure and Dividend Policy on Firm Value. Journal of Poverty, Investment and Development. 2016, 21, 40–57.
- Atan, R.; Alam, M.d.M.; Said, J.; Zamri, M. The Impacts of Environmental, Social, and Governance Factors on Firm Performance. Management of Environmental Quality. 2018, 29, 182–94.
- Budagaga, A.R. Dividend policy and market value of banks in MENA emerging markets: residual income approach. J. Cap. Mark. Stud. 2020, 4, 25–45. [CrossRef]
- Naeem, M.; Ulah, H.; Jan, S. The Impact of ESG Practices on Firm Performance: Evidence from Emerging Countries. Indian Journal of Economics and Business. 2021, 20, 731–50.
- Giannopoulos, G.; Fagernes, R.V.K.; Elmarzouky, M.; Hossain, K.A.B.M.A. The ESG Disclosure and the Financial Performance of Norwegian Listed Firms. J. Risk Financial Manag. 2022, 15, 237. [CrossRef]
- Dowell, G.; Hart, S.; Yeung, B. Do Corporate Global Environmental Standards Create or Destroy Market Value? Management Science. 2000, 46, 1059–1074.
- Daily, C.M.; Dalton, D.R. Women in the boardroom: a business imperative. J. Bus. Strat. 2003, 24. [CrossRef]
- Guenster, N.; Bauer, R.; Derwall, J.; Koedijk, K. The Economic Value of Corporate Eco-Efficiency. Eur. Financial Manag. 2010, 17, 679–704. [CrossRef]
- Arora, A.; Sharma, C. Corporate governance and firm performance in developing countries: evidence from India. Corp. Governance: Int. J. Bus. Soc. 2016, 16, 420–436. [CrossRef]
- Hassan, M.K. Governance, Product Market Competition and Agency Costs: Evidence From the UAE. International Journal of Business Governance and Ethics. 2018, 13, 59.
- Ramadan, M.M.; Hassan, M.K. Board Gender Diversity, Governance and Egyptian Listed Firms’ Performance. Journal of Accounting in Emerging Economies. 2022, 12, 279–299.
- Butt, M.N.; Baig, A.S.; Seyyed, F.J. Tobin’s Q approximation as a metric of firm performance: an empirical evaluation. J. Strat. Mark. 2021, 31, 532–548. [CrossRef]
- Kaplan, S.N.; Ruback, R.S. The Valuation of Cash Flow Forecasts: An Empirical Analysis. The Journal of Finance. 1995, 50, 1059–1093.
- Tasker, S.C. Bridging the Information Gap: Quarterly Conference Calls as a Medium for Voluntary Disclosure. Rev. Account. Stud. 1998, 3, 137–167. [CrossRef]
- Kim, M.; Ritter, J. Valuing IPOs. Journal of Financial Economics. 1999, 53, 409–437.
- Bird, R.; Hall, A.D.; Momentè, F.; Reggiani, F. What Corporate Social Responsibility Activities Are Valued by the Market? Journal of Business Ethics. 2007, 76, 189–206.
- Banerjee, A.; Gokarn, S.; Pattanayak, M.; Sinha, S. Corporate Governance and Market Value: Preliminary Evidence from Indian Companies. Standard and Poor’s Financial Services LLC. 2009, 12, 42–77.
- Marsat, S.; Williams, B. CSR and Market Valuation: International Evidence. Bankers Markets & Investors: An Academic & Professional Review. 2013, 123, 29–42.
- Daszynska-Zygadlo, K.; Slonski, T.; Zawadzki, B. The market value of CSR performance across sectors. Eng. Econ. 2016, 27, 230 - 238. [CrossRef]
- Lanis, R.; Richardson, G. Corporate social responsibility and tax aggressiveness: a test of legitimacy theory. Accounting, Audit. Account. J. 2012, 26, 75–100. [CrossRef]
- Kaiser, L. ESG Integration: Value, Growth and Momentum. Journal of Asset Management. 2020, 21, 32–51.
- Sharma, R.B.; Lodha, S.; Sharma, A.; Ali, S.; Elmezughi, A.M. Environment, Social and Governance Reporting and Firm Performance: Evidence from GCC Countries. Int. J. Innov. Res. Sci. Stud. 2022, 5, 419–427. [CrossRef]
- Frey, H.C.; Patil, S.R. Identification and Review of Sensitivity Analysis Methods. Risk Anal. 2002, 22, 553–578. [CrossRef]
- Al-Bassam, W.M.; Ntim, C.G.; Opong, K.K.; Downs, Y. Corporate Boards and Ownership Structure as Antecedents of Corporate Governance Disclosure in Saudi Arabian Publicly Listed Corporations. Bus. Soc. 2015, 57, 335–377. [CrossRef]
- Bose, S.; Shams, S.; Ali, M.J.; Mihret, D. COVID-19 impact, sustainability performance and firm value: international evidence. Account. Finance 2021, 62, 597–643. [CrossRef]
- Seth, R.; Mahenthiran, S. Impact of dividend payouts and corporate social responsibility on firm value – Evidence from India. J. Bus. Res. 2022, 146, 571–581. [CrossRef]
- Ahmed, S.U.; Islam, Z.M.; Hasan, I. Corporate Social Responsibility and Financial Performance Linkage: Evidence from the Banking Sector of Bangladesh. Journal of Organizational Management. 2012, 1, 14–21.
- Junius, D.; Adisurjo, A.; Rijanto, Y.A.; Adelina, Y.E. THE IMPACT OF ESG PERFORMANCE TO FIRM PERFORMANCE AND MARKET VALUE. J. Apl. Akunt. 2020, 5, 21–41. [CrossRef]
- Kong, L.; Akbar, M.; Poulova, P. The Role of Environment, Social, and Governance Performance in Shaping Corporate Current and Future Value: The Case of Global Tech Leaders. Sustainability 2023, 15, 13114. [CrossRef]
- Gregory, R.P. ESG activities and firm cash flow. Glob. Finance J. 2022, 52. [CrossRef]
- Guastella, G.; Mazzarano, M.; Pareglio, S.; Spani, R.C. Do Environmental and Emission Disclosure Affect Firms’ Performance? Eurasian Business Review. 2022, 12, 695–718.
- Chairani, C.; Siregar, S.V. The effect of enterprise risk management on financial performance and firm value: the role of environmental, social and governance performance. Meditari Account. Res. 2021, 29, 647–670. [CrossRef]
- Al-Janadi, Y.; Rahman, R.A.; Alazzani, A. Does Government Ownership Affect Corporate Governance and Corporate Disclosure? Managerial Auditing Journal. 2016, 31, 871–890.
- Dubai Financial Market. Available online: https://api.dfm.ae/docs/default-source/default-document-library/dfm-annual-report-2018-english.pdf?sfvrsn=b2d06281_0. Accessed on (15 September 2024).
- Saudi Exchange. Available online: https://www.saudiexchange.sa/wps/portal/tadawul/knowledge-center/about/esg?locale=e.
- Accessed on (15 September 2024).
- Bamahros, H.M.; Alquhaif, A.; Qasem, A.; Wan-Hussin, W.N.; Thomran, M.; Al-Duais, S.D.; Shukeri, S.N.; Khojally, H.M.A. Corporate Governance Mechanisms and ESG Reporting: Evidence from the Saudi Stock Market. Sustainability 2022, 14, 6202. [CrossRef]
- Hoepner, G. F., & Yu, P. S. Corporate Social Responsibility Across Industries: When Can Who Do Well by Doing Good? Social Science Research Network. 2010.
- Barnett, M.L. Stakeholder influence capacity and the variability of financial returns to corporate social responsibility. Acad. Manag. Rev. 2007, 32, 794–816. [CrossRef]
- Siegel, D.S.; Vitaliano, D.F. An Empirical Analysis of the Strategic Use of Corporate Social Responsibility. J. Econ. Manag. Strat. 2007, 16, 773–792. [CrossRef]
- Sisaye, S. The organizational ecological resource framework of sustainability reporting: implications for corporate social reporting (CSR). J. Bus. Socio-economic Dev. 2021, 2, 99–116. [CrossRef]
- Ortas, E.; Álvarez, I.; Jaussaud, J.; Garayar, A. The impact of institutional and social context on corporate environmental, social and governance performance of companies committed to voluntary corporate social responsibility initiatives. J. Clean. Prod. 2015, 108, 673–684. [CrossRef]
- Boubakri, N., & Cosset, J. C. Privatization in Developing Countries. Public Policy for the Private Sector. 1998, 156.
- Khan, M.S. The Transformation of Turkish Foreign Policy Towards the Middle East. Policy Perspect. The Journal of the Institute of Policy Studies 2015, 12. [CrossRef]
- Green, K.W., Jr.; Zelbst, P.J.; Meacham, J.; Bhadauria, V.S. Green supply chain management practices: impact on performance. Supply Chain Manag. Int. J. 2012, 17, 290–305.
Figure 1.
Number of ESG SEG Data & Analytics Score observations/year in the MENA region.
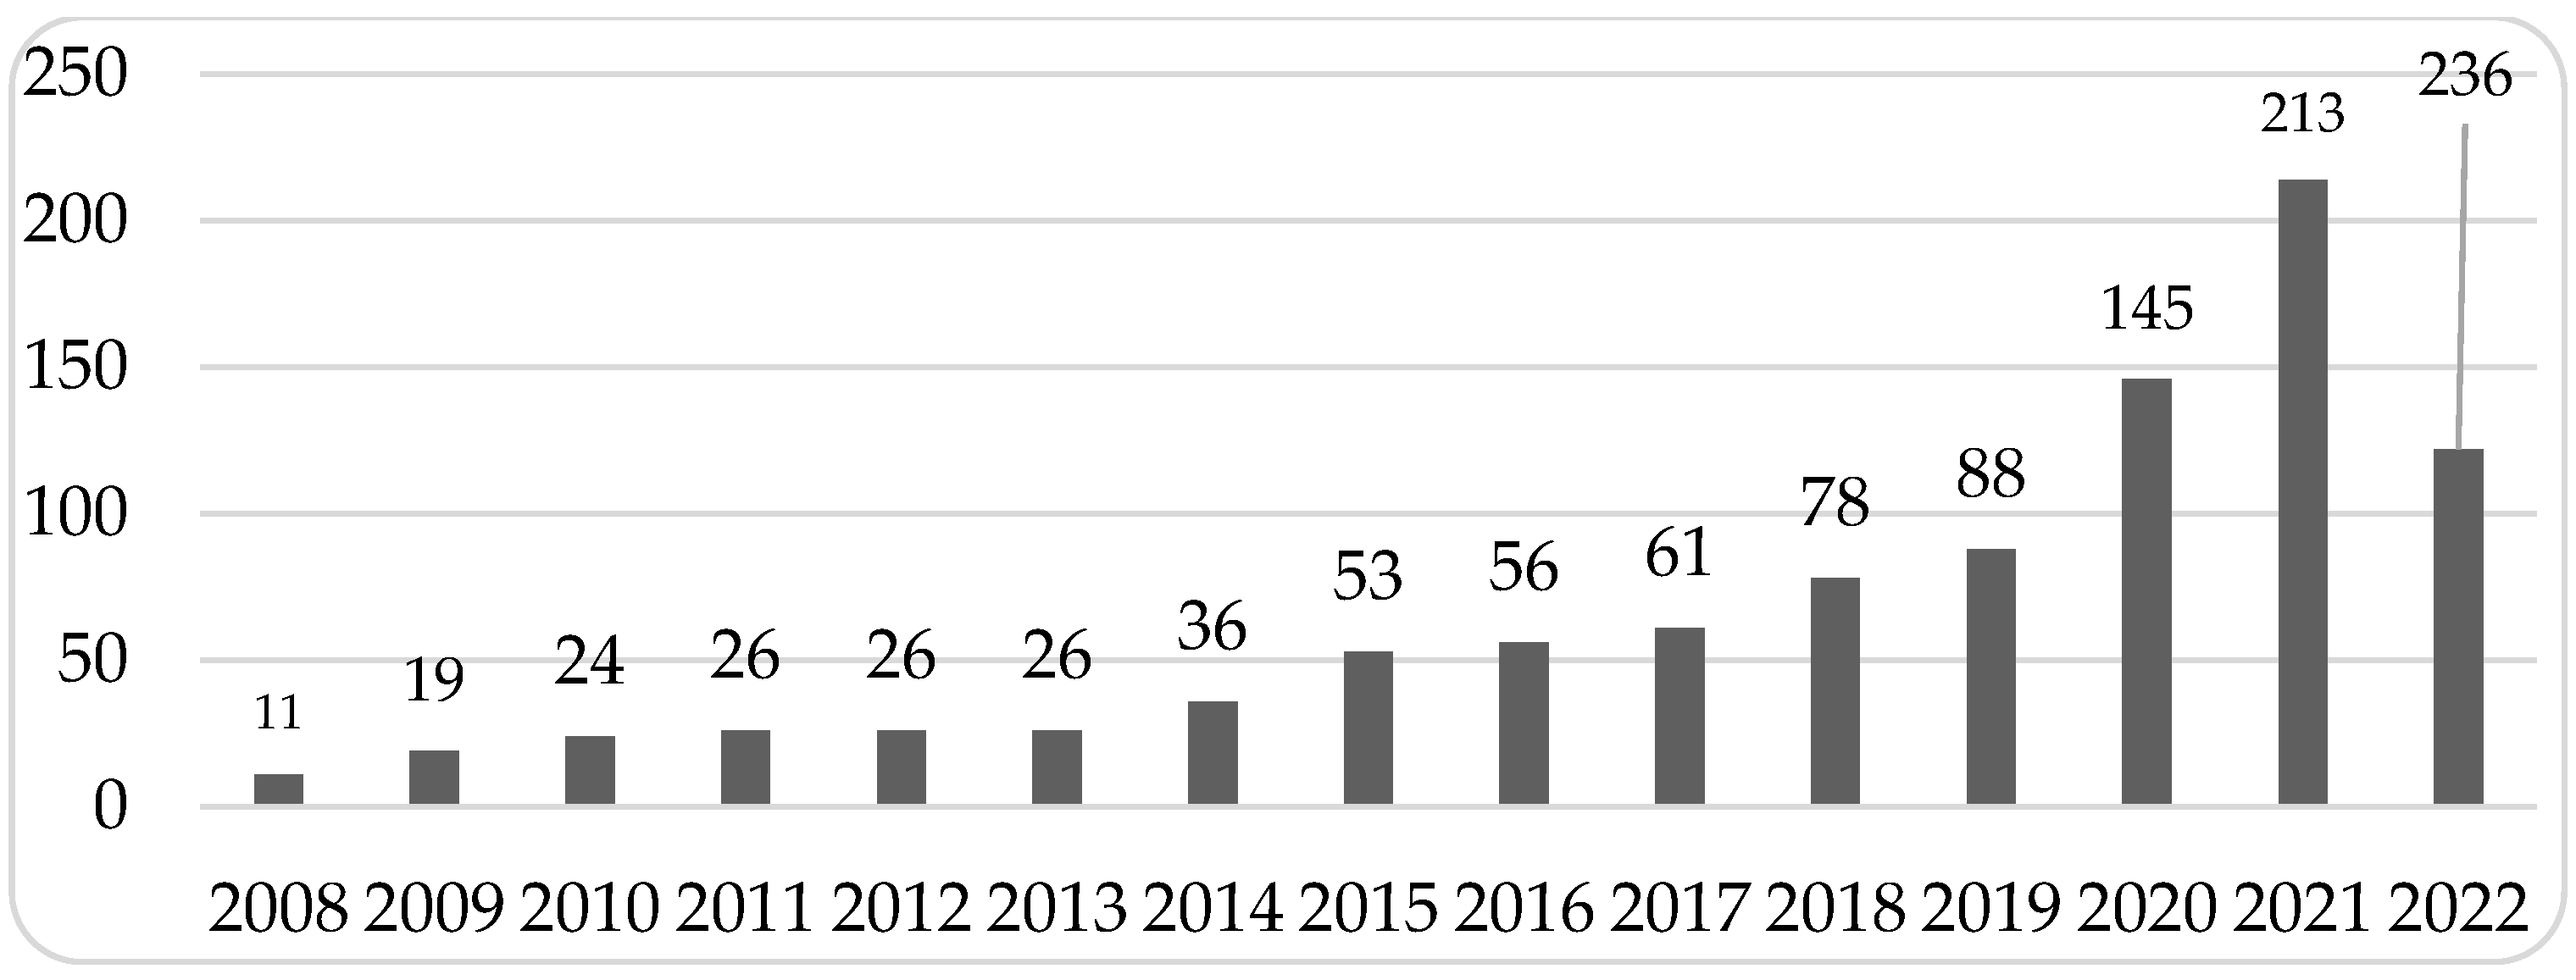
Table 1.
Descriptive matrix of balanced panel data sample by country, sector, and year.
| Country/Sector | 2017 | 2018 | 2019 | 2020 | 2021 | 2022 | Total |
| Bahrain | 2 | 2 | 2 | 2 | 2 | 2 | 12 |
| Financials | 1 | 1 | 1 | 1 | 1 | 1 | 6 |
| Industrials | 1 | 1 | 1 | 1 | 1 | 1 | 6 |
| Egypt | 6 | 6 | 6 | 6 | 6 | 6 | 36 |
| Communication Services | 2 | 2 | 2 | 2 | 2 | 2 | 12 |
| Industrials | 1 | 1 | 1 | 1 | 1 | 1 | 6 |
| Materials | 2 | 2 | 2 | 2 | 2 | 2 | 12 |
| Real Estate | 1 | 1 | 1 | 1 | 1 | 1 | 6 |
| Israel | 12 | 12 | 12 | 12 | 12 | 12 | 72 |
| Communication Services | 3 | 3 | 3 | 3 | 3 | 3 | 18 |
| Energy | 1 | 1 | 1 | 1 | 1 | 1 | 6 |
| Healthcare | 2 | 2 | 2 | 2 | 2 | 2 | 12 |
| Industrials | 1 | 1 | 1 | 1 | 1 | 1 | 6 |
| Information Technology | 2 | 2 | 2 | 2 | 2 | 2 | 12 |
| Materials | 2 | 2 | 2 | 2 | 2 | 2 | 12 |
| Real Estate | 1 | 1 | 1 | 1 | 1 | 1 | 6 |
| Kuwait | 5 | 5 | 5 | 5 | 5 | 5 | 30 |
| Communication Services | 2 | 2 | 2 | 2 | 2 | 2 | 12 |
| Industrials | 1 | 1 | 1 | 1 | 1 | 1 | 6 |
| Real Estate | 2 | 2 | 2 | 2 | 2 | 2 | 12 |
| Morocco | 2 | 2 | 2 | 2 | 2 | 2 | 12 |
| Communication Services | 1 | 1 | 1 | 1 | 1 | 1 | 6 |
| Real Estate | 1 | 1 | 1 | 1 | 1 | 1 | 6 |
| Oman | 3 | 3 | 3 | 3 | 3 | 3 | 18 |
| Communication Services | 1 | 1 | 1 | 1 | 1 | 1 | 6 |
| Materials | 1 | 1 | 1 | 1 | 1 | 1 | 6 |
| Utilities | 1 | 1 | 1 | 1 | 1 | 1 | 6 |
| Qatar | 8 | 8 | 8 | 8 | 8 | 8 | 48 |
| Communication Services | 2 | 2 | 2 | 2 | 2 | 2 | 12 |
| Energy | 2 | 2 | 2 | 2 | 2 | 2 | 12 |
| Financials | 1 | 1 | 1 | 1 | 1 | 1 | 6 |
| Industrials | 1 | 1 | 1 | 1 | 1 | 1 | 6 |
| Real Estate | 1 | 1 | 1 | 1 | 1 | 1 | 6 |
| Utilities | 1 | 1 | 1 | 1 | 1 | 1 | 6 |
| Saudi Arabia | 9 | 9 | 9 | 9 | 9 | 9 | 54 |
| Communication Services | 2 | 2 | 2 | 2 | 2 | 2 | 12 |
| Consumer Staples | 1 | 1 | 1 | 1 | 1 | 1 | 6 |
| Financials | 1 | 1 | 1 | 1 | 1 | 1 | 6 |
| Materials | 3 | 3 | 3 | 3 | 3 | 3 | 18 |
| Real Estate | 1 | 1 | 1 | 1 | 1 | 1 | 6 |
| Utilities | 1 | 1 | 1 | 1 | 1 | 1 | 6 |
| United Arab Emirates | 4 | 4 | 4 | 4 | 4 | 4 | 24 |
| Communication Services | 2 | 2 | 2 | 2 | 2 | 2 | 12 |
| Real Estate | 2 | 2 | 2 | 2 | 2 | 2 | 12 |
| Total | 51 | 51 | 51 | 51 | 51 | 51 | 306 |
Table 2.
Variable Measurement.
| Variable | Acronym | Measure | Source |
|
Dependent: Tobin’s Q Price to Book ratio Price to Earnings ratio |
TQ PB PE |
[Market value of all outstanding shares +Book value of debts] / Book value of total assets Market price per share / Equity book value per share Market price per share / Earnings per share |
LSEG Data & Analytics Database LSEG Data & Analytics Database LSEG Data & Analytics Database |
| Independent: | |||
| ESG Score | ESG | ESG Combined Score | LSEG Data & Analytics Database |
|
Control: Firm-specific: |
|||
| Firm Size | S | Natural Logarithm of Total Assets | LSEG Data & Analytics Database |
| Leverage | Lev | Total Debt / Total Assets | |
| Country-specific: | |||
|
Gross Domestic Product Governance |
GDP GOV |
Natural Logarithm of annual GDP of Country. Governance Index combined by PCA analysis. |
The World Bank Open Data Source |
Table 3.
Distribution of firm-year observations by country and sector.
| Country | GICS Sector | Frequency | Percentage | |||||||||
| Communication Services | Consumer Staples | Energy | Financials | Health- care | Industrials | Information Technology | Materials | Real Estate | Utilities | |||
| Bahrain | 0 | 0 | 0 | 6 | 0 | 6 | 0 | 0 | 0 | 0 | 12 | 3.92% |
| Egypt | 12 | 0 | 0 | 0 | 0 | 6 | 0 | 12 | 6 | 0 | 36 | 11.76% |
| Israel | 18 | 0 | 6 | 0 | 12 | 6 | 12 | 12 | 6 | 0 | 72 | 23.53% |
| Kuwait | 12 | 0 | 0 | 0 | 0 | 6 | 0 | 0 | 12 | 0 | 30 | 9.80% |
| Morocco | 6 | 0 | 0 | 0 | 0 | 0 | 0 | 0 | 6 | 0 | 12 | 3.92% |
| Oman | 6 | 0 | 0 | 0 | 0 | 0 | 0 | 6 | 0 | 6 | 18 | 5.88% |
| Qatar | 12 | 0 | 12 | 6 | 0 | 6 | 0 | 0 | 6 | 6 | 48 | 15.69% |
| KSA | 12 | 6 | 0 | 6 | 0 | 0 | 0 | 18 | 6 | 6 | 54 | 17.65% |
| UAE | 12 | 0 | 0 | 0 | 0 | 0 | 0 | 0 | 12 | 0 | 24 | 7.84% |
| Frequency | 90 | 6 | 18 | 18 | 12 | 30 | 12 | 48 | 54 | 18 | 306 | 100.00% |
| Percentage | 29.41% | 1.96% | 5.88% | 5.88% | 3.92% | 9.80% | 3.92% | 15.69% | 17.65% | 5.88% | ||
Table 4.
Descriptive statistics of variables.
| Variable | Obs. | Mean | Std. Dev. | Min. | Max. |
| TQ | 306 | 0.6556 | 0.5157 | 0.0158 | 4.7592 |
| PB | 306 | 2.3794 | 2.5306 | 0.2848 | 22.5677 |
| PE | 306 | 16.6742 | 30.1914 | 0.49 | 479.1809 |
| ESG | 306 | 32.0766 | 21.6401 | 0.973548 | 86.2006 |
| Lev | 306 | 0.2709 | 0.1971 | 0 | 1.0237 |
| S | 306 | 22.37 | 1.3204 | 18.6333 | 25.5862 |
| GDP | 306 | 26.3853 | 0.7988 | 24.2678 | 27.7341 |
| GOV | 306 | 0.2018 | 1.0993 | -2.3834 | 1.504 |
Note: The variable definitions are provided in Table 2.
Table 5.
Correlation matrix of variables.
| TQ | PB | PE | ESG | Lev | S | GDP | GOV | |
| TQ | 1 | |||||||
| PB | 0.0152 | 1 | ||||||
| PE | -0.0735 | 0.0622 | 1 | |||||
| ESG | 0.1234* | 0.1989* | 0.1229* | 1 | ||||
| Lev | 0.2601* | 0.1593* | -0.0605 | -0.0825 | 1 | |||
| S | -0.3190* | 0.0119 | 0.089 | 0.4889* | 0.1437* | 1 | ||
| GDP | -0.2611* | 0.0798 | 0.011 | 0.2458* | 0.1040* | 0.5390* | 1 | |
| GOV | -0.1604* | 0.1537* | 0.1390* | 0.2096* | 0.0341 | 0.3060* | 0.1884* | 1 |
Note: The variable definitions are provided in Table 2. The superscript * in bold denotes significance at 10% level.
Table 6.
Country and Sector-effects models regression results – MENA region.
| Country and Sector-effects Model | TQ Model | PB Model | PE Model |
| Coeff. | Coeff. | Coeff. | |
| ESG | 0.0078*** | 0.0124*** | 1.7040 |
| Lev | 0.5395*** | 3.7419*** | -5.7070 |
| S | -0.2393*** | -0.4977*** | 20.8110 |
| GDP | 0.0000 | -0.0000 | -0.0000* |
| GOV | -0.0771 | -0.1158 | -64.6993* |
| Bahrain | -0.3643 | -1.8539 | -727.5360* |
| Egypt | -0.1274 | -2.0896 | -680.5596* |
| Israel | -0.4182*** | 0.5224 | -412.2612** |
| Kuwait | -0.4663** | -2.0506 | -789.1379** |
| Morocco | -0.7385*** | 1.5933 | -806.6479** |
| Oman | -0.4073* | -3.2147** | -701.6425* |
| Qatar | 0.2128* | -1.6496** | -598.4400** |
| Saudi Arabia | -0.3516* | -0.6441 | -449.6844** |
| Communication Services | -0.0800 | 1.2236** | -29.5586 |
| Consumer Staples | -0.5059*** | -0.7201 | -137.4289 |
| Energy | -0.1402 | -1.0717 | -26.2245 |
| Financials | -0.7750*** | 0.6768 | -7.5504 |
| Health Care | -0.4417*** | -1.8529* | -84.0297 |
| Industrials | -0.4297*** | 0.9325 | -55.0987 |
| Information Technology | -0.7056*** | 1.7338* | -38.7935 |
| Materials | -0.3038*** | 0.0159 | 86.2746 |
| Real Estate | -0.2631** | -1.4914** | -20.81321 |
| _cons | 6.1416*** | 12.8269*** | 388.7758 |
| Hausman Test | Random | Random | Random |
| Adj-R squared | 56.46% | 34.52% | 11.04% |
| No. of Obs. | 306 | 306 | 306 |
Note: The variable definitions are provided in Table 2. ***, ** and * in bold denote significance at 1%, 5% and 10% levels, respectively.
Table 7.
Country and Sector-effects models regression results – MENAT region.
| Country and Sector-effects Model | TQ Model | PB Model | PE Model |
| Coeff. | Coeff. | Coeff. | |
| ESG | 0.0076*** | 0.0179** | 0.1665 |
| Lev | 0.5527*** | 2.2905*** | -10.5101 |
| S | -0.2406*** | -0.3161** | -0.3074 |
| GDP | -0.0000 | -0.0000 | -0.0000** |
| GOV | 0.0177 | -0.1607 | 0.5002* |
| Bahrain | -0.2867 | -1.5004 | -1.6640* |
| Egypt | 0.1697 | -1.5380* | -2.5646* |
| Israel | -0.4028*** | 1.5348*** | 4.8244* |
| Kuwait | -0.3051** | -1.9941** | -2.5579 |
| Morocco | -0.5096*** | 1.3242 | 0.6195 |
| Oman | -0.2950* | -2.2246** | -8.0952 |
| Qatar | 0.2075* | -0.0734 | 13.4540 |
| Saudi Arabia | -0.2044 | 0.2042 | 19.4343 |
| Turkey | -0.2238 | -0.9552 | 13.6696 |
| Communication Services | -0.0888 | 1.2379** | 2.9223 |
| Consumer Discretionary | -0.7940*** | 2.0334** | -7.2375 |
| Consumer Staples | -0.6042*** | 0.9185 | 11.0320 |
| Energy | -0.1263 | -1.2114 | -1.3212 |
| Financials | -0.7486*** | 0.1529 | -15.9205 |
| Health Care | -0.4211*** | -2.2459** | -10.0477 |
| Industrials | -0.3181*** | 1.1247 | -1.2852 |
| Information Technology | -0.6844*** | 1.3751 | 21.0526 |
| Materials | -0.3092*** | 0.2607 | -2.5793 |
| Real Estate | -0.2573** | -0.2137 | -4.6320 |
| _cons | 6.0633*** | 8.5074** | 25.8415 |
| Hausman Test | Random | Random | Random |
| Adj-Rsquared | 53.86% | 31.00% | 10.72% |
| No. of Obs. | 372 | 372 | 372 |
Disclaimer/Publisher’s Note: The statements, opinions and data contained in all publications are solely those of the individual author(s) and contributor(s) and not of MDPI and/or the editor(s). MDPI and/or the editor(s) disclaim responsibility for any injury to people or property resulting from any ideas, methods, instructions or products referred to in the content. |
© 2025 by the authors. Licensee MDPI, Basel, Switzerland. This article is an open access article distributed under the terms and conditions of the Creative Commons Attribution (CC BY) license (http://creativecommons.org/licenses/by/4.0/).
Copyright: This open access article is published under a Creative Commons CC BY 4.0 license, which permit the free download, distribution, and reuse, provided that the author and preprint are cited in any reuse.


