
Submitted:
02 March 2025
Posted:
03 March 2025
You are already at the latest version
Abstract
The oil and gas industry plays a pivotal role in the global energy and financial markets. With increasing concerns surrounding Environmental, Social, and Governance (ESG) scores, their impact on this sector has become a growing area of focus. This study aims to forecast ESG scores in the oil and gas sector using extensive datasets comprising publicly available financial and ESG indicators of firms. The research analyzed data from 497 companies within the industry over a 12-year period. A total of 10 machine learning algorithms were utilized to predict ESG scores, including decision trees, en-semble methods (boosting, bagging, and voting), XGBoost, LightGBM, random forest, extreme random trees, linear regression, robust linear regression, and elastic net. The analysis incorporated a one-year lag in ESG scores and employed panel data regression techniques in machine learning. The findings demonstrated a high predictive performance, with the best R² value reaching 0.922. These results provide a practical framework for investors and decision-makers to evaluate a firm's ESG performance, facilitating more informed and sustainable investment decisions within the oil and gas sector.
Keywords:
sustainability
; machine learning
; ESG score prediction
; firm financial performance
; data analysis
; ESG investments
; oil and gas industry
1. Introduction
Environmental, Social, and Governance (ESG) serves as a corporate evaluation metric that assesses companies' non-financial performance. It encompasses key concerns such as corporate governance, climate change, social inequality, workplace conditions, and broader sustainability challenges facing society (Lee et al., 2022). Additionally, ESG factors shape how companies engage in environmental innovation, uphold human rights, manage resources efficiently, adhere to social ethics, and fulfill their product responsibilities (Gamlath et al., 2023). As a result, businesses worldwide are increasingly integrating ESG considerations into their managerial decision-making processes (Lee et al., 2022). The oil and gas industry plays a vital role in the global energy and financial markets. It remains one of the most developed and transparent energy sectors (Zhang et al., 2024) and continues to be a primary energy source worldwide (Ramírez-Orellana et al., 2023). However, compared to sectors such as finance, insurance, and retail, this industry faces significant environmental and social challenges due to the nature of its operations. Consequently, investors, governments, environmental advocates, and the general public closely monitor the oil and gas sector, given its considerable ecological impact. In response to mounting stakeholder pressure, companies within this industry have implemented more sustainable policies and regulations, aiming to transition toward a more environmentally responsible energy model (Ramírez-Orellana et al., 2023). ESG performance is becoming a crucial factor in investment decisions. As corporate governance and environmental concerns gain prominence, investors are increasingly considering ESG metrics as key non-financial indicators (Yu & Su, 2024). The benefits of ESG investment are evident, as prioritizing ESG initiatives can improve corporate behavior and enhance access to external financial resources (Zhang et al., 2024). Furthermore, substantial evidence highlights the role of ESG practices in mitigating financial risks. By fostering greater transparency and reducing information asymmetry between firms and investors, ESG investments contribute to enhanced corporate responsibility. This, in turn, reduces uncertainty within financial markets (Siew et al., 2016).
2. Related Work
2.1. ESG-finance analysis utilizing machine learning
Researchers have employed machine learning (ML) algorithms alongside firms' financial indicators to analyze ESG performance. Gamlath et al. (2023) integrated annual financial indicators with natural language data in their study, utilizing models such as XGBoost, CatBoost, a Keras sequential model, the K-Nearest Neighbors (KNN) classifier, and a simple linear regressor to predict firms' annual ESG ratings. The research conducted by Si (2023) introduced a model for ESG score prediction by training heterogeneous ensemble models, incorporating neural networks and the random forest algorithm. Lin and Hsu (2023) not only examined the impact of financial indicators on ESG scores but also included governance factors to provide a more comprehensive assessment. Their study, which encompassed over 30 industries in Taiwan, including the oil, electricity, and gas sectors, tested four ML models: support vector machines (SVM), random forest, extreme learning machine (ELM), and extreme gradient boosting. Meanwhile, Krappel et al. (2021) initially implemented three standalone machine learning models—categorical gradient-boosted trees, feedforward neural networks, and gradient-boosted trees. They later proposed two ensemble models: a neural network ensemble and a heterogeneous ensemble combining all three individual models. Their findings revealed that the heterogeneous ensemble achieved the most accurate ESG predictions, as it leveraged the strengths of each individual model to uncover unique correlations between input variables and ESG scores. Zheng, Zhang, Zeng et al. (2023) investigated the external environmental factors and internal corporate attributes influencing ESG performance. They applied the Lasso method for data screening and employed ML models such as SVM, KNN, neural networks, and random forests to predict firms' ESG performance. Their study confirmed that both internal and external factors play a crucial role in enhancing corporate ESG performance. Furthermore, Lee et al. (2022) and Sokolov et al. (2020) incorporated social and governance datasets along with unstructured news and social media content, including Twitter data, to improve ESG score prediction. To analyze this unstructured text, they utilized natural language processing (NLP), which allowed the models to differentiate between pillar-specific input data and intermediate data representations. Their results highlighted the effectiveness of NLP in capturing the full scope of ESG-related data.
2.1. ESG-finance analysis utilizing machine learning
The numerical results obtained from the models utilizing regression machine learning algorithms, were evaluated against their prediction accuracy. In the research conducted by Gamlath et al. (2023), Si (2023), and Krappel et al. (2021), researchers used mean average error (MAE) and the coefficient of determination (R2) parameters. In the research conducted by Lin and Hsu (2023), two more performance variables were added, root mean square error (RMSE) and mean absolute percentage error (MAPE), for their models’ results comparison. While Lee et al. (2022) used the RMSE and MAE to examine the models obtained for predicting ESG scores.
3. Data
3.1. ESG Scores
LSEG Data & Analytics (LSEG) is a globally recognized provider of financial data, operating in 175 countries. Beyond its role as a key source of financial information, numerous research studies have analyzed its ESG disclosures, which encompass data from over 12,000 public and private companies, covering more than 80% of global market capitalization. The methodology used to determine sustainability ratings is entirely data-driven, carefully adjusted to reflect industry-specific criteria, and refined to mitigate biases related to market capitalization and transparency (LSEG Data & Analytics | Financial Technology & Data, 2023). For companies in the oil and gas industry, the parameters used in ESG score calculations were compared. The environmental (E) and social (S) pillar scores are assessed in relation to firms and their industry counterparts, whereas the governance (G) pillar score is evaluated based on the country of incorporation. The total ESG score is derived from the combined scores of these three pillars. These scores are not absolute but are instead calculated relative to the broader industry and market context in which the company operates (Del Vitto et al., 2023). A total of 186 selected metrics contribute to the ESG scores, which are further categorized into 10 groups, as illustrated in Figure 1. Consequently, the overall scores provided by Refinitiv are utilized for this analysis, in alignment with the methodologies applied by Krappel et al. (2021), Si (2023), and Ramírez-Orellana et al. (2023).
3.2. Financial indicators
The input variables, consisting of historical financial indicators relevant to firms in the oil and gas industry, are also obtained from LSEG. The retrieval of both financial indicators and ESG scores was carried out using two separate methodologies—Datastream and Refinitiv—both of which are well-established data sourcing methods provided by LSEG.
3.3. Sample size and population
The dataset comprised companies from the oil and gas industry that had reported their ESG scores between 2010 and 2022. This selection process resulted in a total of 497 companies, whose data were acquired using both the Datastream and Refinitiv methodologies. Table 1 provides a breakdown of the number of companies from each continent included in this analysis.
The selection of indicators covered a 12-year period, ranging from 2010 to 2022. Over the past decade and a half, the incorporation of ESG scores and related indicators into financial reporting has steadily increased within the oil and gas industry. To gain deeper insights into ESG score trends and patterns, a large sample size spanning 12 years was chosen for analysis. Machine learning algorithms are particularly effective in predicting outcomes from extensive datasets, as they can identify intricate and hidden relationships while improving prediction accuracy. Therefore, the comprehensive dataset covering 12 years is well-suited for ML analysis. The exclusion of ESG scores for 2023 was due to incomplete disclosures for the selected companies. Since ESG scores serve as the primary predictor, missing data were not processed to prevent introducing noise into the dataset, as such inconsistencies could compromise the accuracy and reliability of the prediction model (L’Heureux et al., 2017).
3.4. Creating lagged ESG scores
To improve the predictive performance of models, feature engineering techniques can be utilized by generating new features from existing variables. In this analysis, lagged features play a crucial role, where ESG scores from prior time periods serve as lagged variables in the time series analysis (Kumar et al., 2023). These lagged ESG scores are essential for constructing training datasets based on past values, enabling more accurate future predictions and significantly enhancing forecasting precision (Surakhi et al., 2021).
3.5. Data analysis diagram
The data analysis process followed in this study is depicted in Figure 2. The process began with data collection, followed by multiple stages of data preprocessing. After preprocessing, the data were processed using two separate platforms—MATLAB and Azure AI/Machine Learning Studio—where ML algorithms were applied. The dataset was automatically split into training and testing subsets based on the default specifications of each platform. No parameter tuning was performed.
3.6. Subsets
Dummy variables were integrated into the dataset alongside ESG scores and financial indicators. The explanatory variables selected for analysis included country, firm size, and ESG scores. The inclusion of dummy variables aimed to enable a comprehensive evaluation of how firm size and country influence ESG scores. Additionally, for datasets that produced the most promising results, further analyses were conducted. This included testing models without dummy variables, removing missing financial indicators, and assessing their impact, as detailed in Table 2. In total, 7 data sets were tested in this analysis as shown in Figure 3 and Figure 4.
4. Data Analysis and Findings
4.1. MATLAB results
The 7 data sets were fed into regression learner analysis, using continuous ESG scores. The obtained R2 of Refinitiv 1 are provided in Table 3. The highest value of R2 was found to be 0.892 obtained from Bagged trees (ensemble) model. R2 is used to evaluate the effectiveness and fit of regression models, higher the values of R2, (closer to 1), the higher the explanation of the variance in the dependent variable (ESG scores), that is explained by the independent variables (financial indicators and ESG scores), according to Baek et al. (2020), generally, a model with an R2 value greater than 0.9 is considered reliable, hence, a value of 0.892 is slightly lower than being reliable.
In order to test the effect of having companies with missing ESG scores, Refinitiv 2 was tested, and the results of R2 values were compared to Refinitiv 1 values, as presented in Figure 5. R2 value was reduced from 0.892 to 0.812 for the ensemble bagged trees.
Table 4 and Figure 6, presents the RMSE, MSE and MAE values for both Refinitiv 1 and 2. In addition to evaluating the models based on R2 value, other performance metrices such as MAE, MSE and RMSE were also analyzed. According to Chicco et al. (2021), MAE and MSE are used to evaluate the models by considering the distance between the predicted values and the actual training data points. Moreover, MSE is more sensitive to outliers compared to MAE. The values obtained from the 5 models are promising as the error values are small (maximum obtained error is 0.0617 for MAE, and 0.00717). Ensemble bagged tree model outperforms the other 2 models with MAE value of 0.0535 and MSE values of 0.00571. Furthermore, RMSE is commonly used to standardize the units of MSE. The distinct types of regularization inherent to these metrics influence their relative effectiveness depending on the structure of the data (Chicco et al., 2021). Ensemble bagged tree outperform other models as it has the least RMSE value.
Furthermore, the values of MAE, MSE, and RMSE are 0 if the regression model fits the data perfectly, and they are positive if the fit is not perfect. Therefore, the models with lower values (closer to 0) have better prediction performance (Chicco et al., 2021), accordingly, the error results obtained from the regression analysis of this data set are excellent.
Figure 7 presents the comparison between Refinitiv 1 and 3 R2 values, to test the effect of removing the missing financial indicators from the data set. R2 value was 0.892 before the exclusion, and 0.858 after the exclusion.
Figure 8 presents a comparison between Refinitiv 1 and 4. It is observed that once the dummy variables are removed from the data set, the performance of the regression analysis improved slightly in terms of R2, from the highest accuracy of 0.892 obtained from bagged trees in Refinitiv 1 to 0.920 obtained by the linear regression in Refinitiv 4, by an amount of 2.779%. This introduced and made the Robust linear regression models superior to the ensembled bagged trees, that obtained the highest accuracy. One possible explanation to this increase in performance once the dummy variables are removed is that the linear regression exhibits limitations in capturing the nonlinearity and complexity inherent in the data system with dummy variables (Sen & Engelbrecht, 2021). Therefore, as a result of having complex sets with dummy variables, linearity is not assumed, therefore, tree-based algorithms are more applicable than linear regression (Svanberg et al., 2022).
Table 5 represents a comparison between Refinitiv 3 and 4 performance metrices in terms of the values of MAE, MSE, RMSE.
Similar regression analysis was performed on the data obtained from Datastream. The results obtained are presented in Figure 9. The highest R2 value was obtained from bagged trees, as 0.878 in comparison to Refinitiv regression analysis, which was 0.892.
To test the effect of utilizing the full data set with missing ESG scores, Datastream 2 was used, and the values of R2 obtained are compared to Datastream 1 as provided in Figure 10. The value of R2 for the ensemble bagged tree increased slightly from 0.878 to 0.888 when the whole data set with missing values was used. The results conclude that the sample size is important in machine learning , hence, this indicates that both, classification, and regression analysis would significantly benefit from a larger set of companies, and historical data of ESG and financial indicators extended for a decade or more, and robust features (Gamlath et al., 2023).
4.2. Azure results
Regression was applied on Refinitiv 1 data set, and the results obtained are provided in Table 7. The highest obtained R2 value was 0.922 and obtained from the voting ensemble algorithm, followed by slight reduction for the algorithm’s extreme random trees 0.920, elastic net 0.919, random forest 0.917, LightGBM 0.914, and XGBoost regressor 0.906. Since a greater R2 value suggests a better fit for the data set, its value is considered important. However, a value closer to 1 is aimed as when the value of R2 score is 1, the regression predictions and the data are perfectly matched (Vaid & Ghose, 2020).
As explained with the results obtained from MATLAB, the closer the values of MAE and RMSE to zero, the better the performance of the model. According to the obtained results, the highest MAE and RMSE values amongst the 6 models were 0.0516 and 0.0701, obtained by XGBoost regressor. Those values, although are the highest, yet, are promising, and close to the other 5 models of error values.
When relative variances in a regression job are more important than absolute values, the MAPE, which highlights percentage errors, is the suitable metric (Chicco et al., 2021). The values of MAPE obtained from this analysis showed the lowest value when elastic net was used, with a percentage of 18.725, followed by Random Forest 19.455, voting ensemble 20.059, LightGBM 20.576, and XGBoost regressor 22.971.
Testing the effect of removing the financial indicators, Table 8 represents a comparison between Refinitiv 1 and 3 R2 values. The results show that all the models implied showed a slight reduction in the value of R2 except the XGBoost regressor, whose value of R2 was 0.907 and increased to 0.913 when the missing financial indicators were removed. The influence of reducing the sample in regression analysis reduced the performance of R2, is aligned to the findings from MATLAB.
Figure 12 represents the R2 comparison between Refinitiv 1, 3, and 4 for the data set for the regression analysis. First, the results of Refinitiv 4 show the value of R2 obtained was slightly lower for the models, voting ensemble, extreme random trees, elastic net, random forest, and LighGBM, in comparison to the values obtained from Refinitiv 1. Employing that having dummy variables in the data set had very slight lower accuracy effects on the data set when Azure platform is used.
Comparing the results of the three regression cases, initially, the voting ensemble provided the highest R2 value which was 0.922 for Refinitiv 1. However, once Refinitiv 3 was used, R2 generally reduced slightly, furthermore, Refinitiv 4, resulted in further slight reduction in the R2 values. This could be attributed to the fact that regression analysis prefers slightly larger sample sizes to account for the increased variety in the training and testing data sets (Sen & Engelbrecht, 2021). Furthermore, the results of the regression analysis could be improved with a solid dataset that includes a large set of financial and ESG historical data (Gamlath et al, 2023).
4.3. Feature importance
Figure 13, Figure 14, and Figure 15 illustrate the feature importance of country-level, firm size, and ESG scores for the Refinitiv 1 dataset, respectively. The minimum-redundancy maximum-relevancy (mRMR) feature selection method was applied in this analysis, as it has been shown to outperform traditional top-ranking methods in various recent studies, as noted by MathWorks (2024).
5. Discussion
This study examines the prediction of ESG scores in the oil and gas sector by leveraging historical financial and ESG indicators as input data. Additionally, machine learning has proven to be highly effective and well-suited for predicting complex scenarios within the ESG-finance domain (Lin & Hsu, 2023).
5.1. MATLAB analysis
The results obtained from bagged, boosted, and decision tree models for the Refinitiv 1 dataset were closely aligned. Each algorithm yielded high accuracy but emphasized different factors. In the case of ensemble boosted trees, one possible reason for its performance is that boosting operates sequentially, correcting errors from previous trees to minimize bias in the final prediction. The ensemble’s final output is derived from the collective predictions of all trees in the model (Shivanna & Agrawal, 2020). Decision trees are widely recognized for their effectiveness in regression analysis (Sheth et al., 2022), as demonstrated in the results across the Refinitiv 1, 2, 3, and 4 datasets. The strong performance of these models may be attributed to the efficiency of the tree traversal algorithm (Sheth et al., 2022) and their high generalization capability (Singh et al., 2016). Regarding ensemble bagged trees, their effectiveness lies in the fact that bagging generates multiple subsets of the original dataset and trains them independently (Taser, 2021). This approach utilizes all available dataset features and integrates them simultaneously to produce a collective prediction (Stepanov et al., 2020). Linear regression performed best for Refinitiv 4 when the dummy variables were removed from the data set. For the results obtained in MATLAB, linear regression failed to interrupt the results, except for this data set. The highest R2 value and the lowest MAE, MSE, and RMSE for Refinitiv 4 were obtained from the robust linear regression, a form of linear regression algorithms that utilizes weighted least squares that includes the weight as an additional scaling factor in the fitting process, which improves the fit. The weights determine how much each response value affects the final parameter estimates, with low-quality data points, such as outliers, having less influence on the fit (MathWorks, 2024).
5.2. Azure analysis
The voting ensemble delivered the highest performance among the regression models, though its advantage over other models was only marginal. The strong performance of the voting ensemble in machine learning tasks is attributed to its ability to combine multiple learning models rather than relying on a single predictor. It generates multiple decision trees and determines the preferred output class through a majority vote (Milad et al., 2020). XGBoost was employed for regression analysis due to its advantages, including high accuracy, sensitivity, and precision. The model achieved a regression score of 0.906, indicating a reliable and well-performing outcome. The results obtained from the random forest algorithm were also reliable, likely due to its robustness against noise and resistance to overfitting (Singh et al., 2016). Both random forest and LightGBM are well-suited for regression problems, effectively handling continuous values (Sarker, 2021). However, random forest was unable to accurately interpret the results for the Refinitiv 3 dataset. Regarding the extreme random trees algorithm, its results were very similar to those of other models, demonstrating its computational efficiency. According to Ampomah et al. (2020), in the randomized tree strategy, using all original training samples instead of bootstrap replicas helps reduce bias, contributing to the model's effectiveness. The elastic net algorithm was utilized for the regression analysis, that is a built upon the traditional regression or logistic regression (De Lima Lemos et al., 2022). For the regression analysis, the R2 values were too close to the results obtained from voting ensemble, extreme random trees, random forest, Light GBM, XGBoost regressor, and decision tree. However, the elastic net models achieved the lowest MAPE amongst the other algorithms. The performance of this model is attributed to its ability to assess the random effects of panel data regressions that incorporate multiple interactions (Del Vitto et al., 2023). Lastly, decision trees, in azure machine learning, were only able to interpret the results of regression analysis of the data of Refinitiv 3 and 4, meaning, decision trees were only applicable with the reduced data sets. This could be attributed to the fact that decision trees utilize a divide-and-conquer strategy, excelling when there are only a few highly relevant attributes. However, their performance declines when there are numerous complex interactions among attributes. Errors can propagate through the tree, especially as the number of classes increases. Additionally, as the tree grows larger, the records within leaf nodes often become too small to support statistically significant decisions (Singh et al., 2016). Furthermore, another possible reason is that decision trees could be unstable, and the difficulty to manage the tree size (Sheth et al., 2022).
5.3. Datastream results
The results obtained from the Datastream show a significant reduction in performance in comparison to the Refinitiv sourced data. A comparison between the Datastream and Refinitiv regressions reveal that the highest R2 value was obtained from bagged trees as 0.878 in comparison to Refinitiv regression analysis, which was 0.892. Furthermore, the value of R2 for the ensemble bagged tree increased slightly from 0.878 to 0.888 between Datastream 1 and 2. This reduction in performance for Datastream sourced data could be attributed to overfitting, the sample data obtained from Datastream is too small in comparison of Refinitiv, as a result, inadequate data for training and testing are provided for the machine learning algorithms. According to Zheng et al. (2021) the more training data provided, the stronger the generalization ability. The accuracy of learning outcomes is significantly influenced by the volume of training data available, and improved performance correlates with larger datasets. Consequently, addressing data shortage becomes imperative to mitigate potential overfitting during training, thereby preserving the model's generalization capability (Zheng et al., 2021).
5.4. Effect of country and firm size
At the country level, this study examined the impact of country-level sustainability performance. Feature importance analysis revealed that country-level factors had the highest influence. Notably, Malaysia emerged as the most significant indicator, with a feature importance value of 0.934. Malaysia has been a focal point in ESG research since implementing its first corporate social responsibility (CSR) framework in 2006. The integration of CSR into the Tenth Malaysia Plan, along with mandatory CSR disclosure requirements under the Companies Act 2016, has contributed to high CSR scores among Malaysian firms. As a result, Malaysia has positioned itself as a global leader in CSR reporting, with approximately 97% of its top 100 companies disclosing their corporate sustainability performance (Mohammad & Wasiuzzaman, 2021). These findings align with Wang and Zhong (2023), who argued that countries with strong ESG improvement initiatives often experience positive economic outcomes from their sustainability efforts. Furthermore, this effect is more pronounced in nations with supportive regulatory, legal, financial, and cultural frameworks for ESG implementation.
At the firm level, feature importance was found to be lower than at the country level. Mega-capitalization companies had the highest firm-level feature importance, with a value of 0.131. Company size plays a crucial role in determining access to ESG initiatives and financial stability (Bruna et al., 2022). Several factors highlight the significance of firm size in the ESG-financial performance relationship. Larger firms generally possess greater financial resources than smaller ones, allowing them to invest more extensively in sustainability initiatives (Krappel et al., 2021). Additionally, large corporations typically have structured strategies and business monitoring mechanisms that facilitate effective sustainability management. Moreover, firm visibility plays a key role, as prominent companies are more likely to adopt superior sustainability practices to maintain their reputation among stakeholders (D’Amato & Falivena, 2020).
Furthermore, the substantial difference in feature importance scores between the highest-ranked and second-ranked features suggests a high level of confidence in the feature selection process. This significant drop indicates that MATLAB is highly certain in identifying the most critical predictor (MathWorks, 2024).
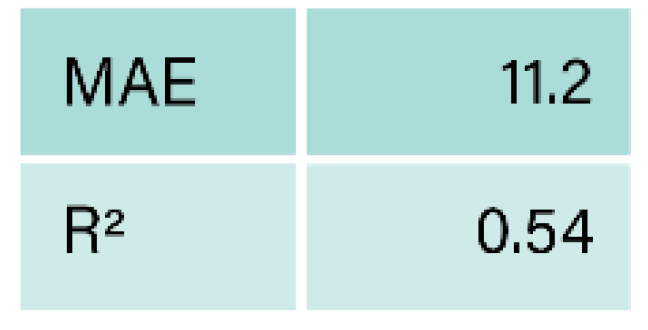
Most studies highlighted in this work suggest a positive relationship between ESG performance and financial performance (Krappel et al., 2021). The results obtained from this study are aligned with the results obtained from Si (2023) and Lin and Hsu (2023), who utilized quantitative approaches utilizing firms’ financial indicators to predict ESG scores and are superior to the results of Lee et al. (2022) and Krappel et al. (2021), as indicated in Table 11, Table 12, Table 13 and Table 14. Furthermore, this research addresses the gap in the literature where the prediction of ESG scores, specifically in the oil and gas industry, utilizing machine learning and firm financial indicators is lacking.
6. Conclusion
Companies and their stakeholders are increasingly prioritizing ESG and sustainability, particularly in the oil and gas sector. This study presents a methodology for predicting ESG scores within the industry by leveraging publicly available financial and ESG indicators alongside machine learning algorithms. A total of 10 machine learning models were employed, including decision trees, ensemble algorithms (boosted, bagged, and voting), XGBoost, LightGBM, random forest, extreme random trees, linear regression, robust linear regression, and elastic net. These algorithms were applied to regression-based machine learning analyses, were the maximum R² value of 0.922 was obtained by the voting ensemble algorithm. Beyond financial and ESG indicators, the study also examined the influence of country-level sustainability regulations and firm size. The results indicated that country-level ESG enforcement had the highest feature importance, followed by firm size. This research provides a robust framework to support informed ESG investment decisions within the energy sector.
Author Contributions
Conceptualization, S.M.F. and M.A.; methodology, S.M.F. and M.A.; software, S.M.F. and M.A.; data curation, M.A and S.M.F; writing—original draft preparation, M.A; writing—review and editing, M.A; supervision, S.M.F. All authors have read and agreed to the published version of the manuscript.
Funding
This research received no external funding.
Institutional Review Board Statement
Not Applicable.
Informed Consent Statement
Not Applicable.
Data Availability Statement
Dataset available upon reasonable request from the authors.
Acknowledgments
This research was conducted with the support of the American University of Bahrain (AUBH), which granted access to essential resources needed for its completion.
Conflicts of Interest
The authors declare no conflict of interest.
References
- Ampomah, E. K. , Qin, Z., & Nyame, G. Evaluation of tree-based ensemble machine learning models in predicting stock price direction of movement. Information, 2020, 11, 332. [Google Scholar]
- Baek, S.-M. , Kim, W.-S., Kim, Y.-S., Baek, S.-Y., & Kim, Y.-J. Development of a Simulation Model for HMT of a 50 kW Class Agricultural Tractor. Applied Sciences, 2020, 10, 4064. [Google Scholar] [CrossRef]
- Bruna, M. G. , Loprevite, S., Raucci, D., Ricca, B., & Rupo, D. Investigating the marginal impact of ESG results on corporate financial performance. Finance Research Letters, 2022, 47, 102828. [Google Scholar]
- Chicco, D. , Warrens, M. J., & Jurman, G. The coefficient of determination R-squared is more informative than SMAPE, MAE, MAPE, MSE and RMSE in regression analysis evaluation. Peerj computer science, 2021, 7, e623. [Google Scholar] [PubMed]
- D'Amato, A. , & Falivena, C. Corporate social responsibility and firm value: Do firm size and age matter? Empirical evidence from European listed companies. Corporate Social Responsibility and Environmental Management, 2020, 27, 909–924. [Google Scholar]
- De Lima Lemos, R. A. Silva, T. C., & Tabak, B. M. (2022). Propension to customer churn in a financial institution: A machine learning approach. Neural Computing and Applications, 34(14), 11751-11768.
- Del Vitto, A. Marazzina, D., & Stocco, D. (2023). ESG ratings explainability through machine learning techniques. Annals of Operations Research, 1-30.
- Gamlath, M. , Gunathilaka, C., Wijesinghe, A., Ahangama, S., Perera, I., & Sivaneasharajah, L. (2023, November). An Integrated Approach to ESG Index Construction with Machine Learning. In 2023 Moratuwa Engineering Research Conference (MERCon) (pp. 252-257). IEEE.
- Krappel, T. Bogun, A., & Borth, D. (2021). Heterogeneous ensemble for ESG ratings prediction. arXiv preprint arXiv:2109.10085.
- Kumar, V. , Kedam, N., Sharma, K. V., Mehta, D. J., & Caloiero, T. Advanced machine learning techniques to improve hydrological prediction: A comparative analysis of streamflow prediction models. Water, 2023, 15, 2572. [Google Scholar]
- L’heureux, A. , Grolinger, K., Elyamany, H. F., & Capretz, M. A. Machine learning with big data: Challenges and approaches. Ieee Access, 2017, 5, 7776–7797. [Google Scholar]
- Lee, O. , Joo, H. , Choi, H., & Cheon, M. Proposing an Integrated Approach to Analyzing ESG Data via Machine Learning and Deep Learning Algorithms. Sustainability 2022, 14, 8745. [Google Scholar]
- Lin, H. Y. , & Hsu, B. W. Empirical Study of ESG Score Prediction through Machine Learning—A Case of Non-Financial Companies in Taiwan. Sustainability, 2023, 15, 14106. [Google Scholar]
- LSEG Data & Analytics | Financial Technology & Data. (2023, November 20). Www.lseg.com. https://www.lseg.com/en/data-analytics.
- MathWorks. (2024). Reduce Outlier Effects Using Robust Regression - MATLAB & Simulink. Www.mathworks.com. https://www.mathworks.com/help/stats/robust-regression-reduce-outlier-effects.html.
- Milad, A. , Yusoff, N. I. M., Majeed, S. A., Ibrahim, A. N. H., Hassan, M. A., & Ali, A. S. B. (2020, February). Using an azure machine learning approach for flexible pavement maintenance. In 2020 16th IEEE International Colloquium on Signal Processing & Its Applications (CSPA) (pp. 146-150). IEEE.
- Mohammad, W. M. W. & Wasiuzzaman, S. (2021). Environmental, Social and Governance (ESG) disclosure, competitive advantage and performance of firms in Malaysia. Cleaner Environmental Systems, 2, 100015.
- Ramírez-Orellana, A. , Martínez-Victoria, M., García-Amate, A., & Rojo-Ramírez, A. A. Is the corporate financial strategy in the oil and gas sector affected by ESG dimensions? Resources Policy, 2023, 81, 103303. [Google Scholar]
- Sarker, I. H. Machine learning: Algorithms, real-world applications and research directions. SN computer science, 2021, 2, 160. [Google Scholar] [CrossRef] [PubMed]
- Sen, J. , Mehtab, S., & Engelbrecht, A. (2021). Machine learning: algorithms, models and applications.
- Sheth, V. Tripathi, U., & Sharma, A. (2022). A comparative analysis of machine learning algorithms for classification purpose. Procedia Computer Science, 215, 422-431.
- Shivanna, A. , & Agrawal, D. P. (2020, November). Prediction of defaulters using machine learning on azure ml. In 2020 11th IEEE annual information technology, electronics and mobile communication conference (IEMCON) (pp. 0320-0325). IEEE.
- Si, D. (2023). An Efficient Predicative Approach of ESG Invest Scoring Using Random Forest Algorithm. BCP Business & Management.
- Siew, R. Y. J. , Balatbat, M. C. A., & Carmichael, D. G. (2016). The impact of ESG disclosures and institutional ownership on market information asymmetry. Asia-Pacific Journal of Accounting & Economics. [CrossRef]
- Singh, A. , Thakur, N., & Sharma, A. (2016, March). A review of supervised machine learning algorithms. In 2016 3rd international conference on computing for sustainable global development (INDIACom) (pp. 1310-1315). Ieee.
- Sokolov, A. , Mostovoy, J., Ding, J., & Seco, L. (2020). Building machine learning systems to automate ESG index construction.
- Stepanov, N. , Alekseeva, D., Ometov, A., & Lohan, E. S. (2020, October). Applying machine learning to LTE traffic prediction: Comparison of bagging, random forest, and SVM. In 2020 12th International Congress on Ultra Modern Telecommunications and Control Systems and Workshops (ICUMT) (pp. 119-123). IEEE.
- Surakhi, O. , Zaidan, M. A., Fung, P. L., Hossein Motlagh, N., Serhan, S., AlKhanafseh, M., Ghoniem, R. M., & Hussein, T. (2021). Time-Lag Selection for Time-Series Forecasting Using Neural Network and Heuristic Algorithm. Electronics. [CrossRef]
- Svanberg, J. Ardeshiri, T., Samsten, I., Öhman, P., Neidermeyer, P. E., Rana, T., ... & Danielson, M. (2022). Corporate governance performance ratings with machine learning. Intelligent Systems in Accounting, Finance and Management, 29(1), 50-68.
- Taser, P. Y. (2021, March). Application of bagging and boosting approaches using decision tree-based algorithms in diabetes risk prediction. In Proceedings (Vol. 74, No. 1, p. 6). MDPI.
- Vaid, K. , & Ghose, U. Predictive analysis of manpower requirements in scrum projects using regression techniques. Procedia Computer Science, 2020, 173, 335–344. [Google Scholar]
- Wang, J. , Yu, J., & Zhong, R. Country environmental, social and governance performance and economic growth: The international evidence. Accounting & Finance, 2023, 63, 3911–3941. [Google Scholar]
- Yu, H. , & Su, T. ESG performance and corporate solvency. Finance Research Letters, 2024, 59, 104799. [Google Scholar]
- Zhang, D. , Bai, D., & Chen, X. Can crude oil futures market volatility motivate peer firms in competing ESG performance? An exploration of Shanghai International Energy Exchange. Energy Economics, 2024, 129, 107240. [Google Scholar]
- Zhang, M., Zeng, C., Xiao, F., & Liu, M. (2023, June). Analysis of the Influential Factors and Prediction of Corporate ESG Performance under Multi-source Data Fusion-Based on Frontier Machine Learning. In Proceedings of the 3rd International Conference on Big Data Economy and Information Management, BDEIM 2022, December 2-3, 2022, Zhengzhou, China.
- Zheng, H. , Zhou, Z., & Chen, J. (2021). RLSTM: A New Framework of Stock Prediction by Using Random Noise for Overfitting Prevention. Computational Intelligence and Neuroscience. [CrossRef]
Figure 1.
ESG score computation.
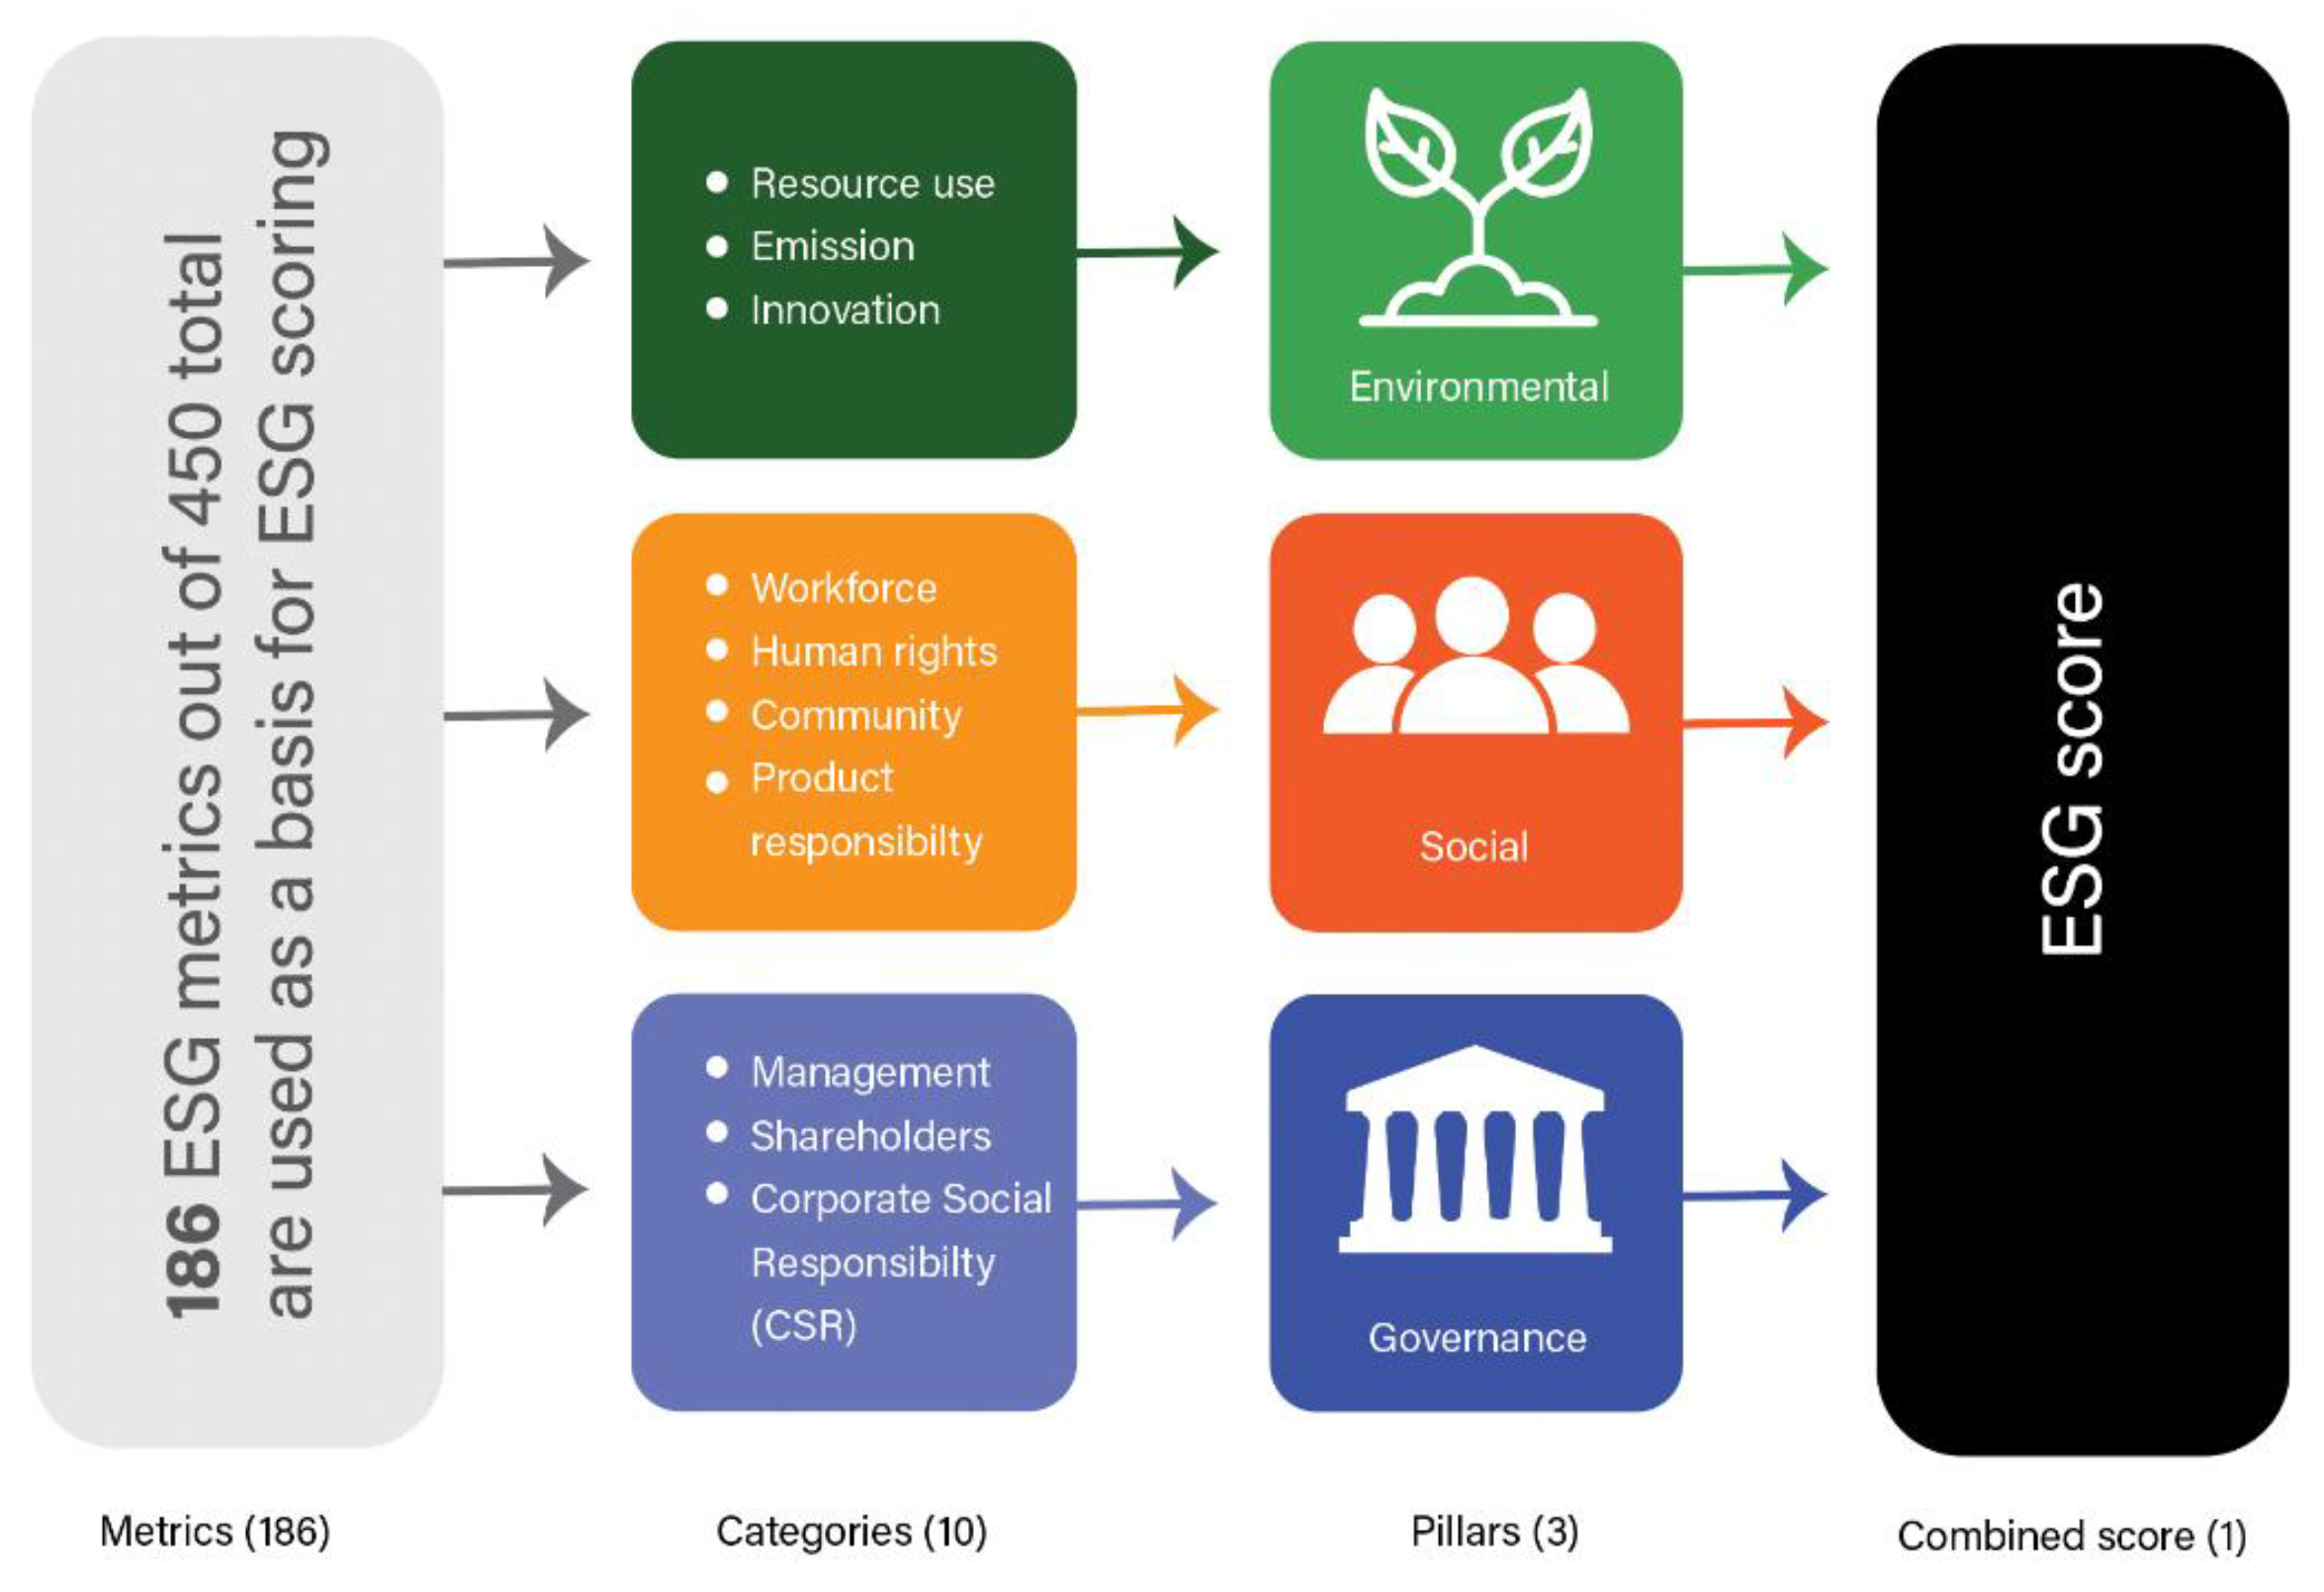
Figure 2.
Data analysis diagram.
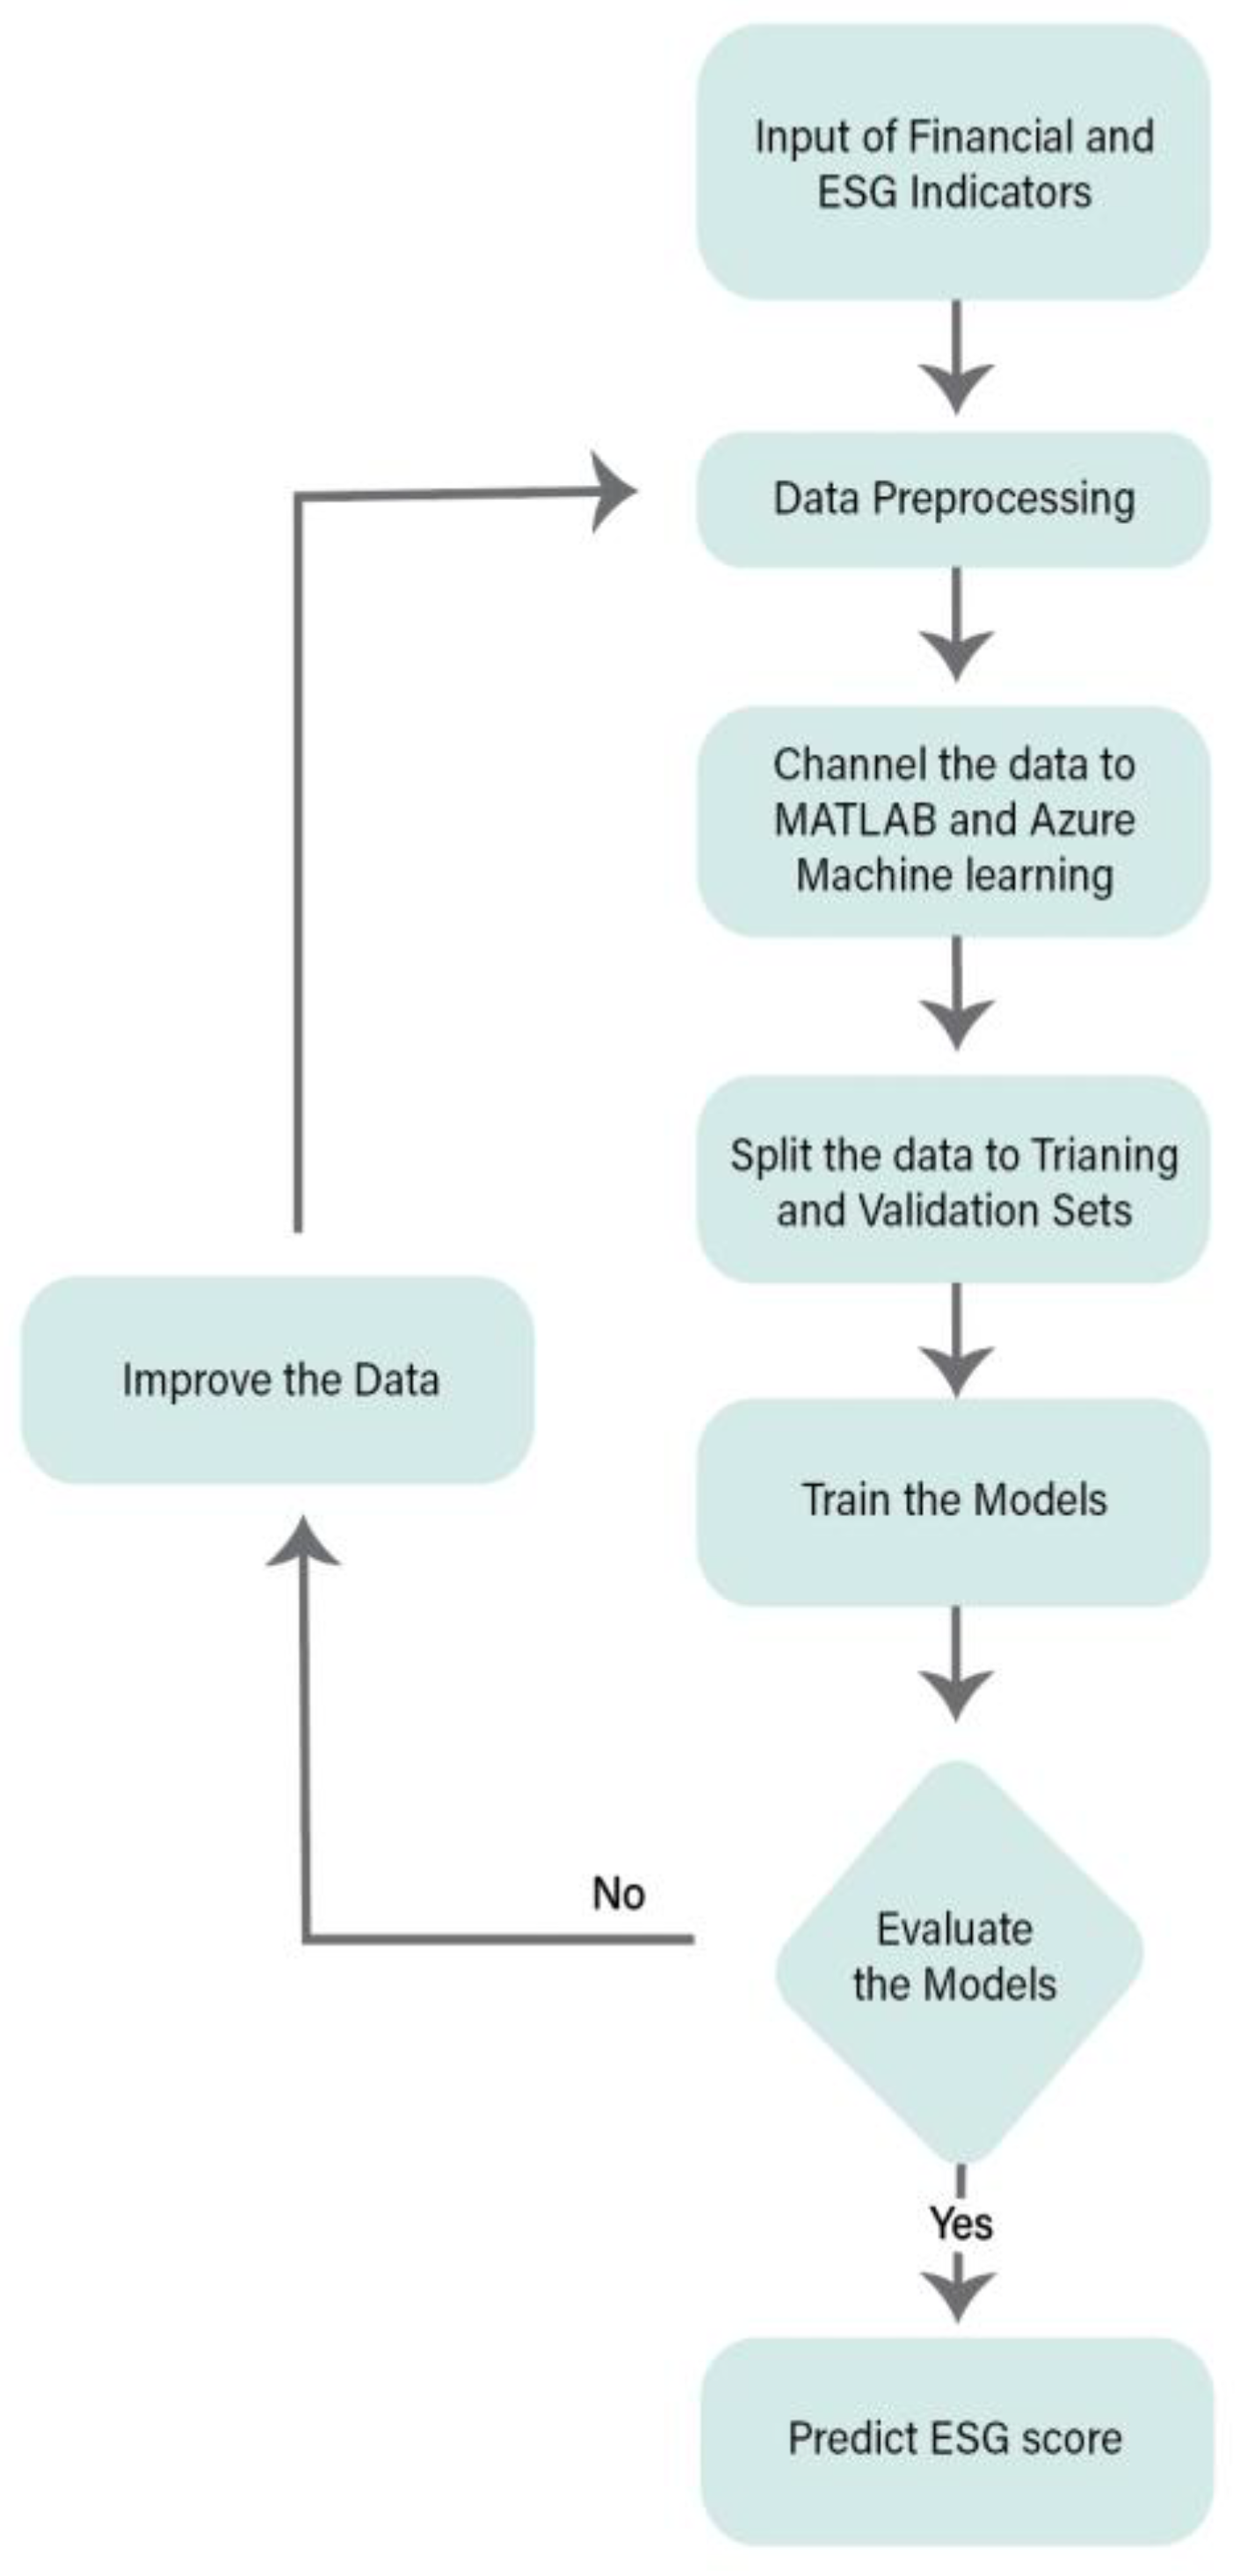
Figure 3.
The 5 Refinitiv data sets.
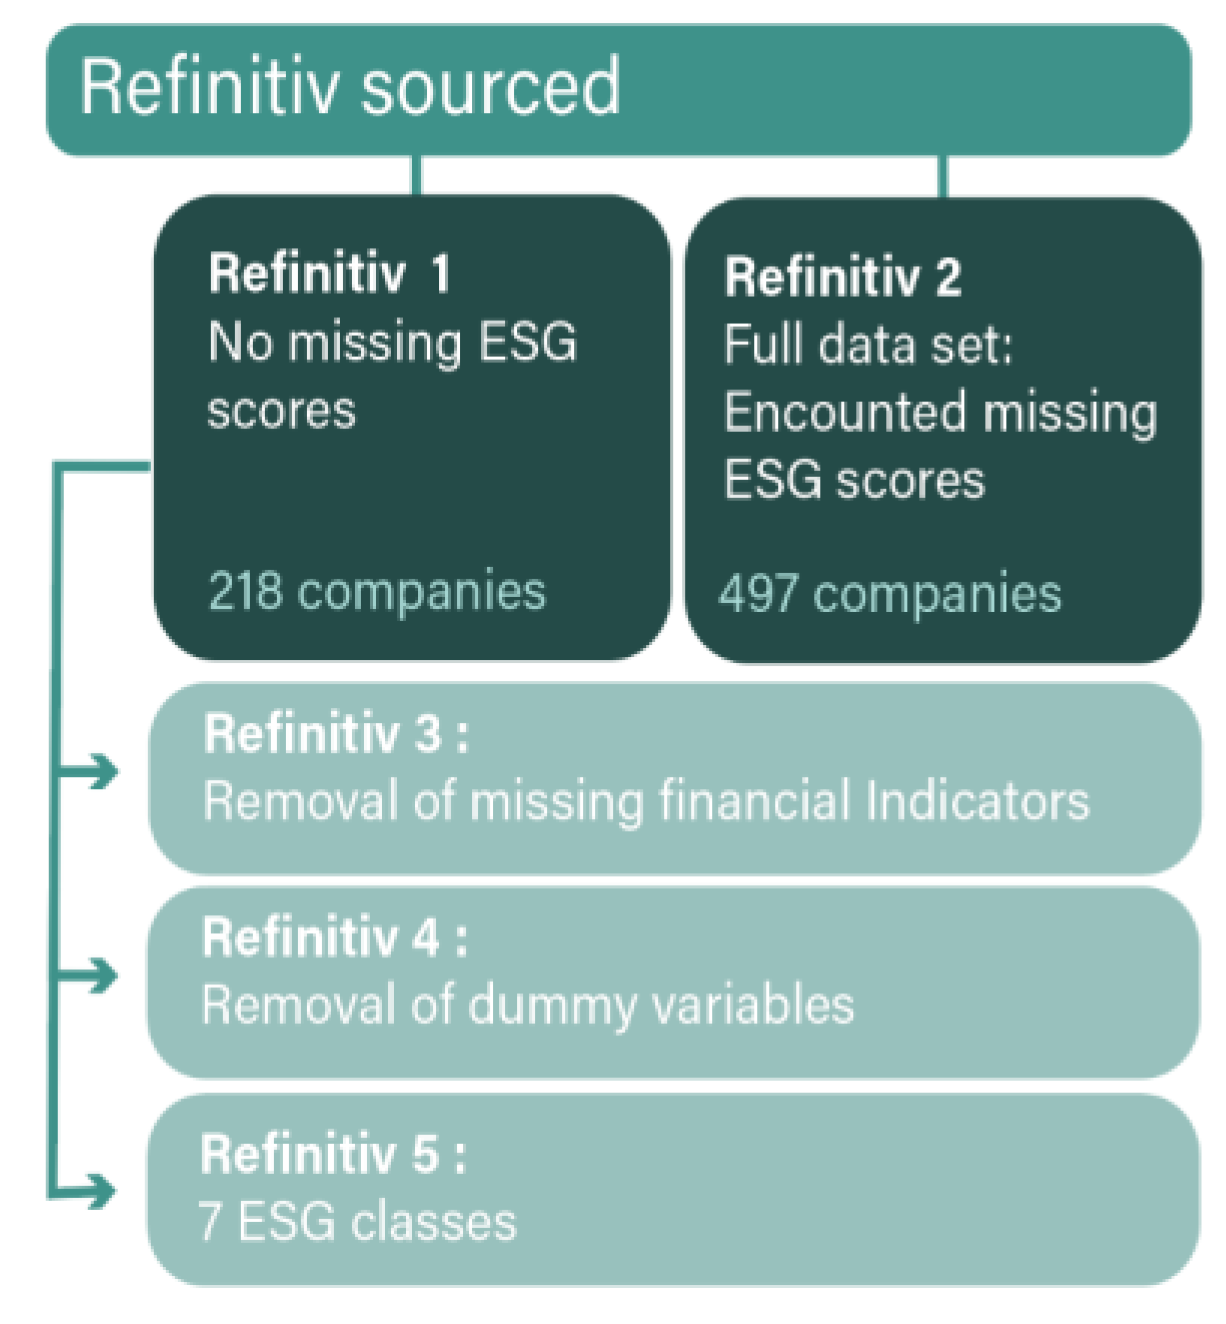
Figure 4.
The 2 Datastream data sets.
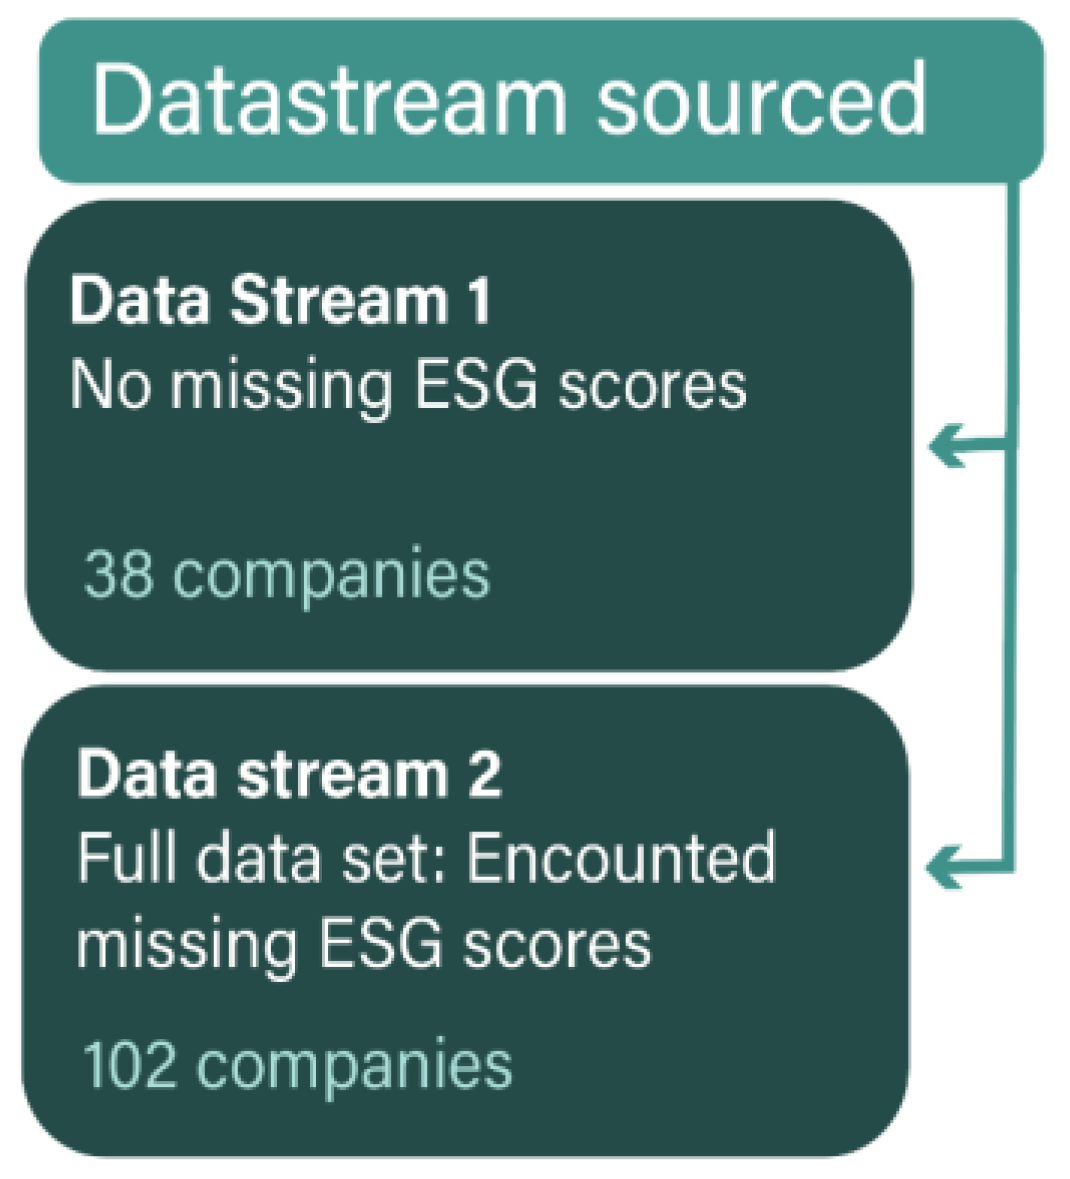
Figure 5.
Comparison between Refinitiv 1 and 2 (encountered missing ESG scores) R2 values.
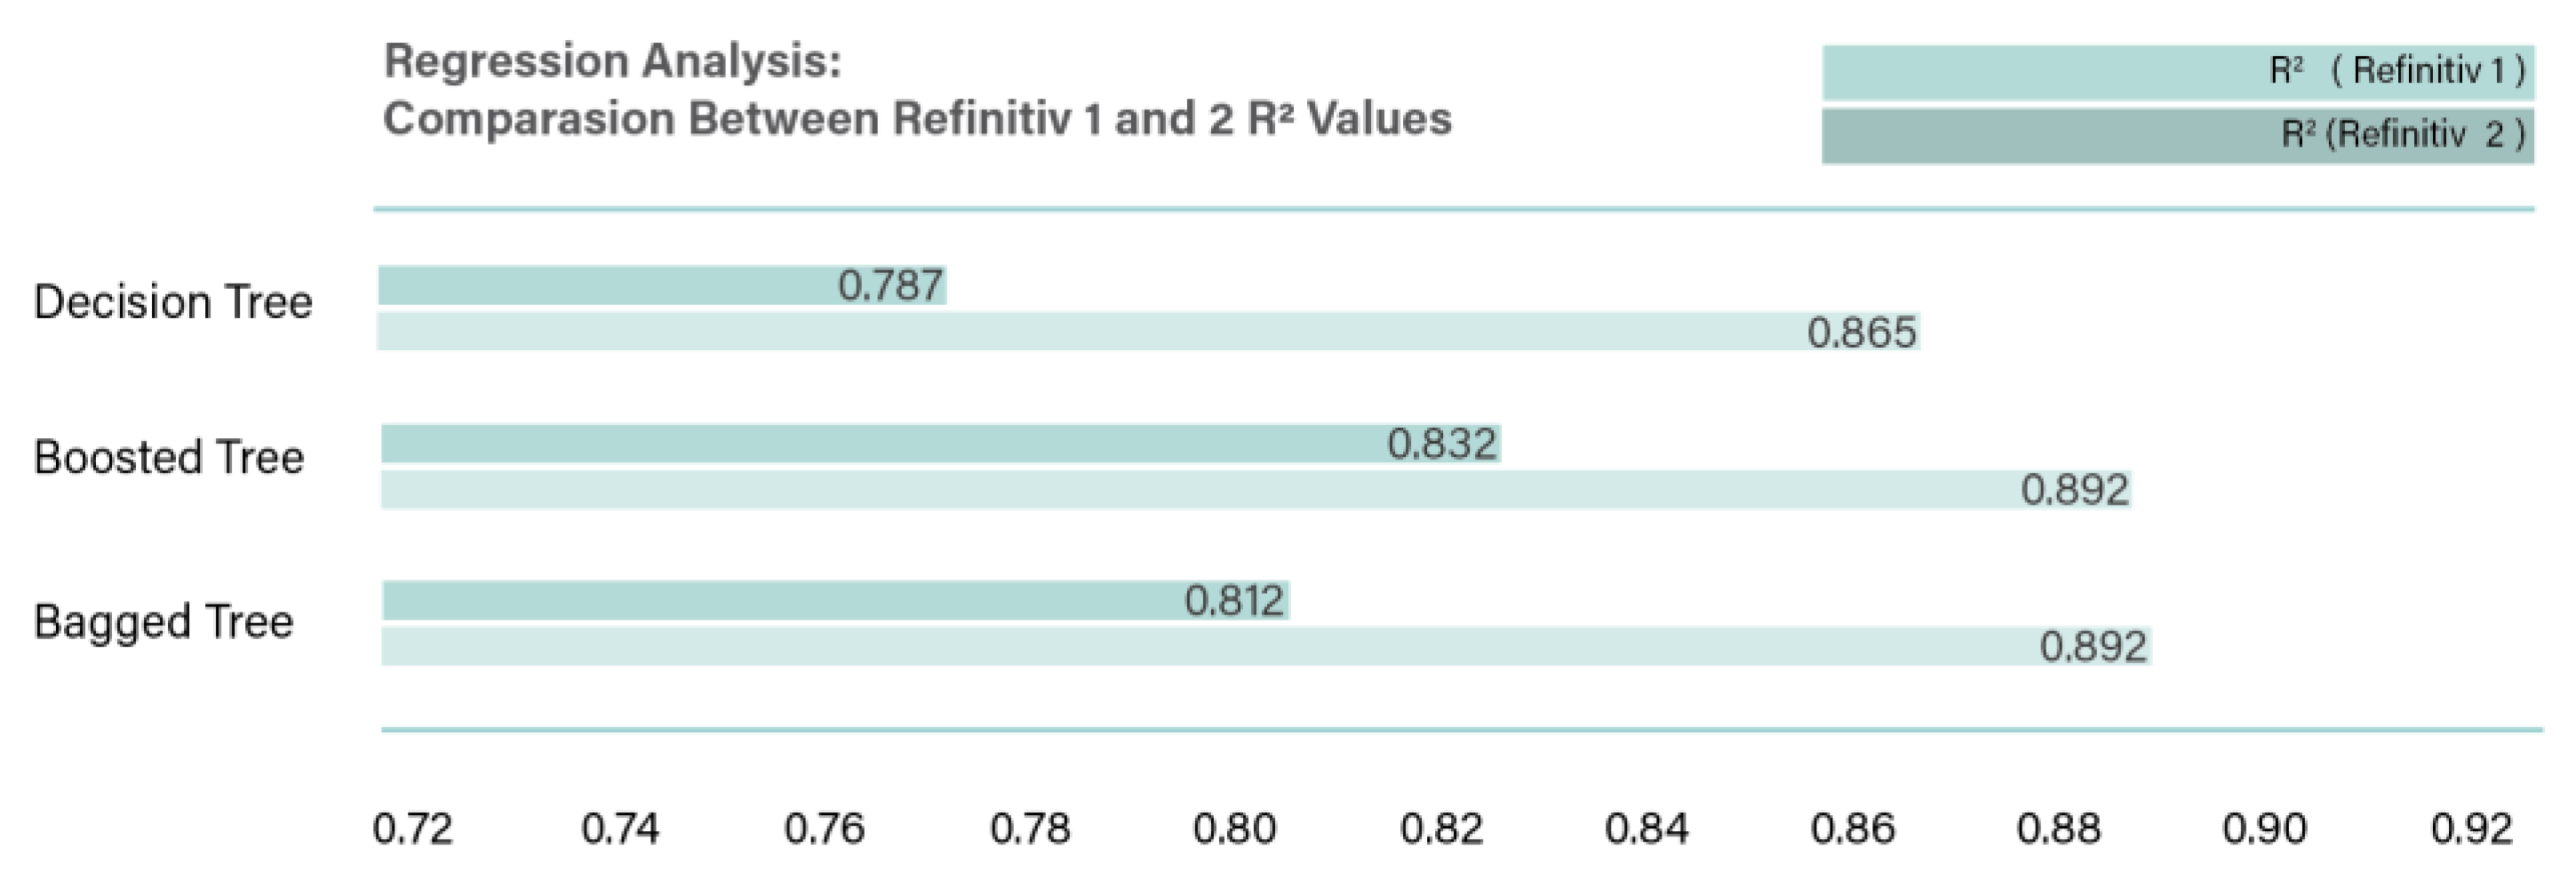
Figure 6.
Comparison between Refinitiv 1 and 2 RMSE, MSE, and MAE values.
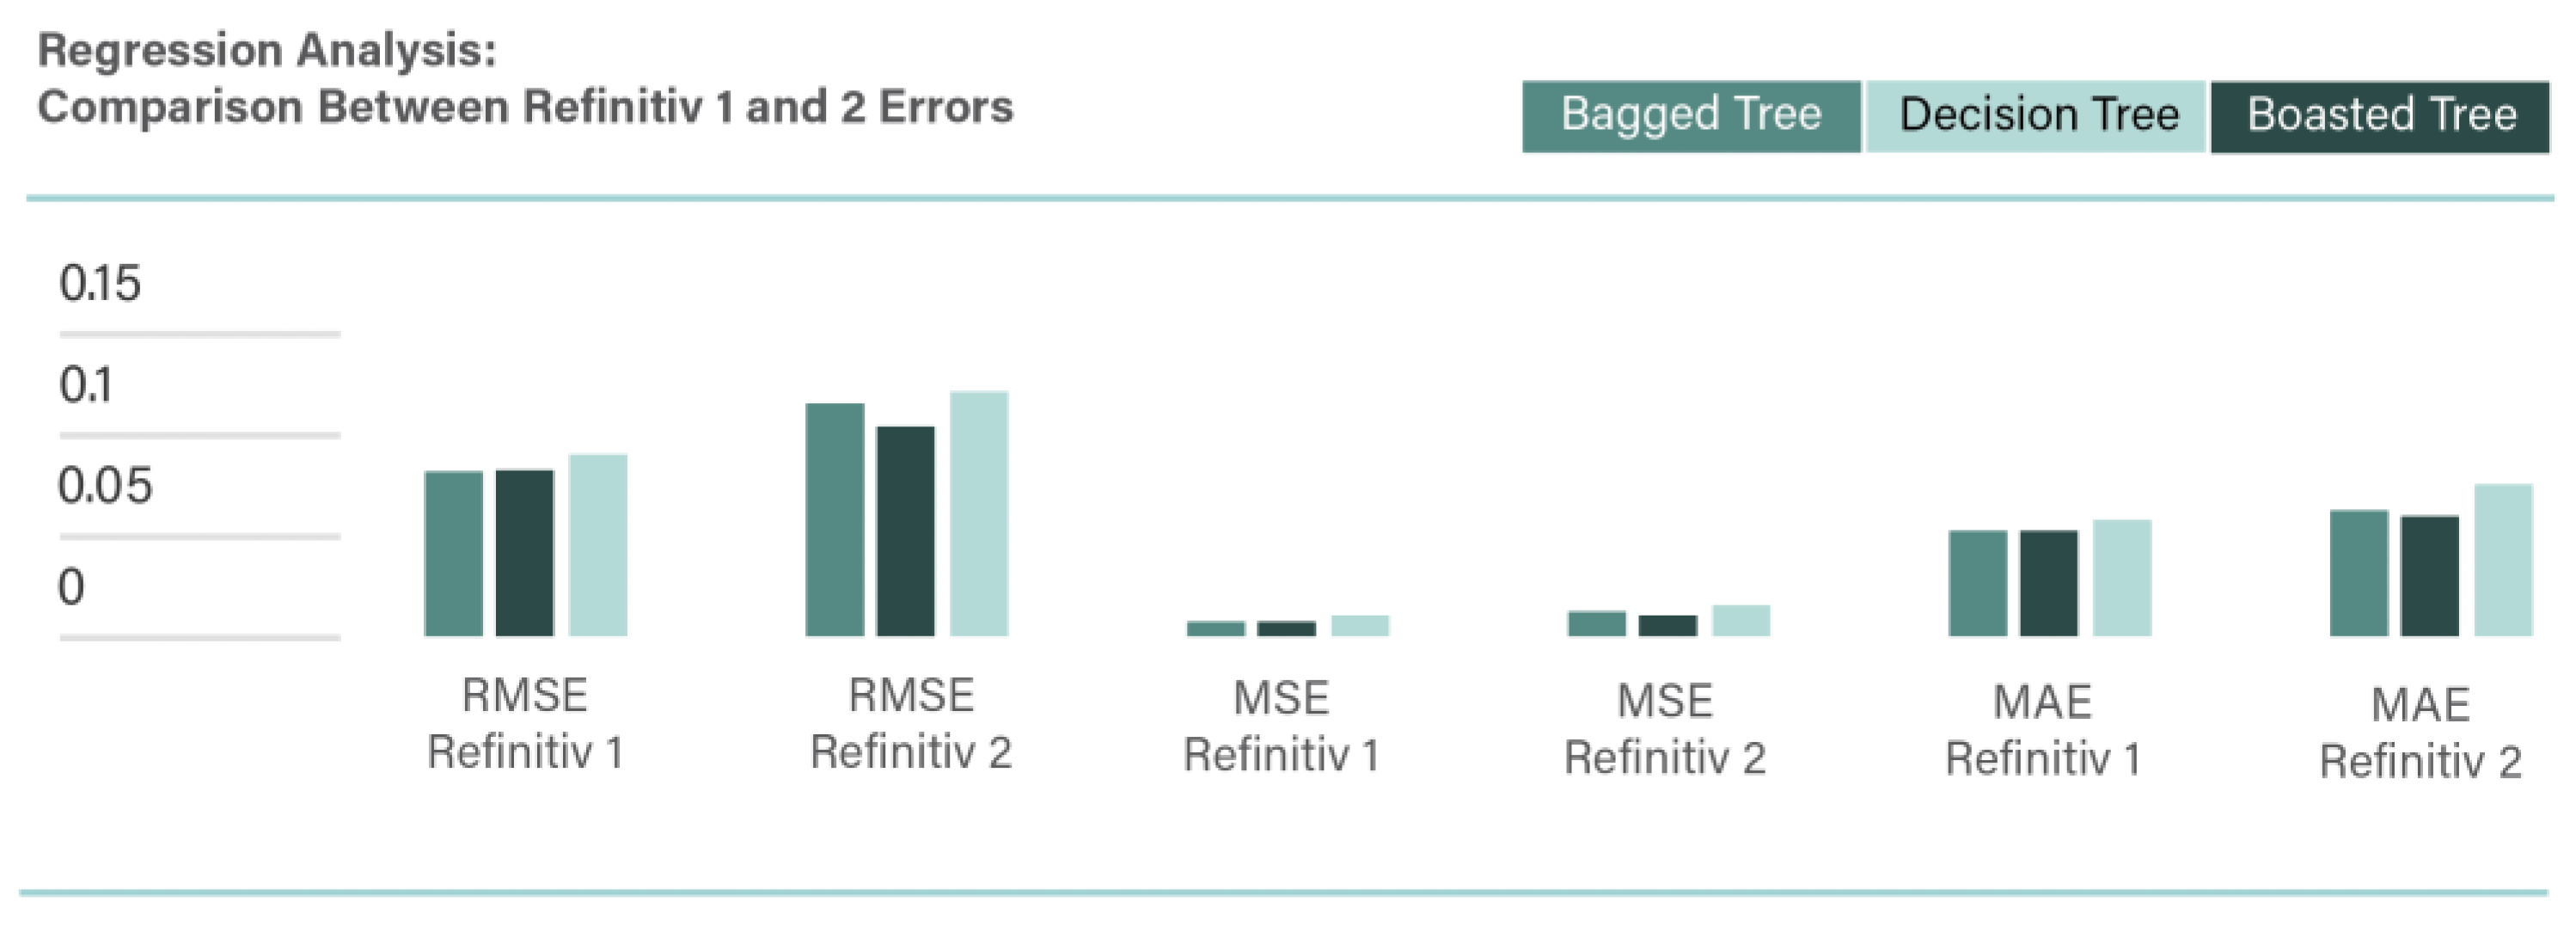
Figure 7.
Comparison between Refinitiv 1 and 3 (no missing financial indicators) R2 values.
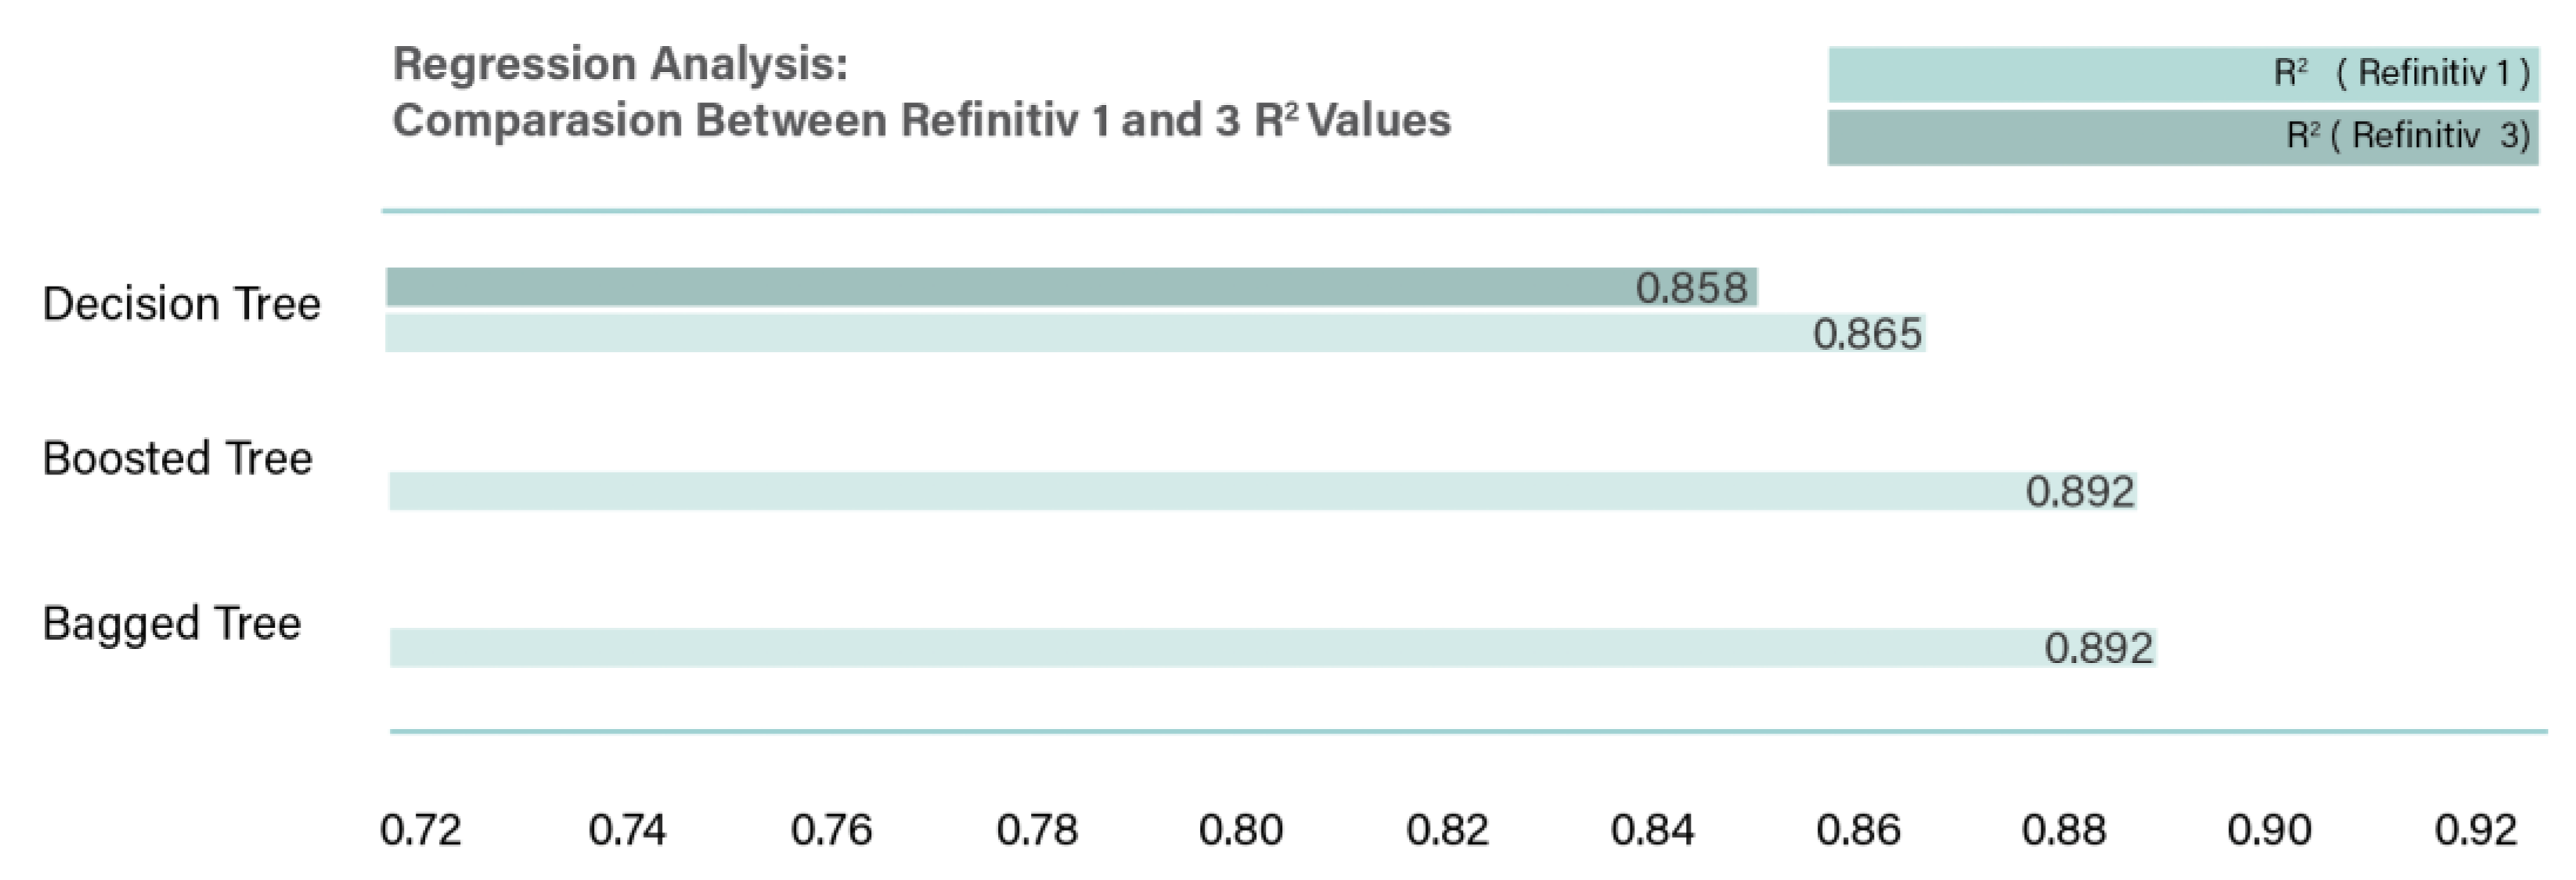
Figure 8.
Comparison between Refinitiv 1 and 4 (no dummy variables) R2 values.
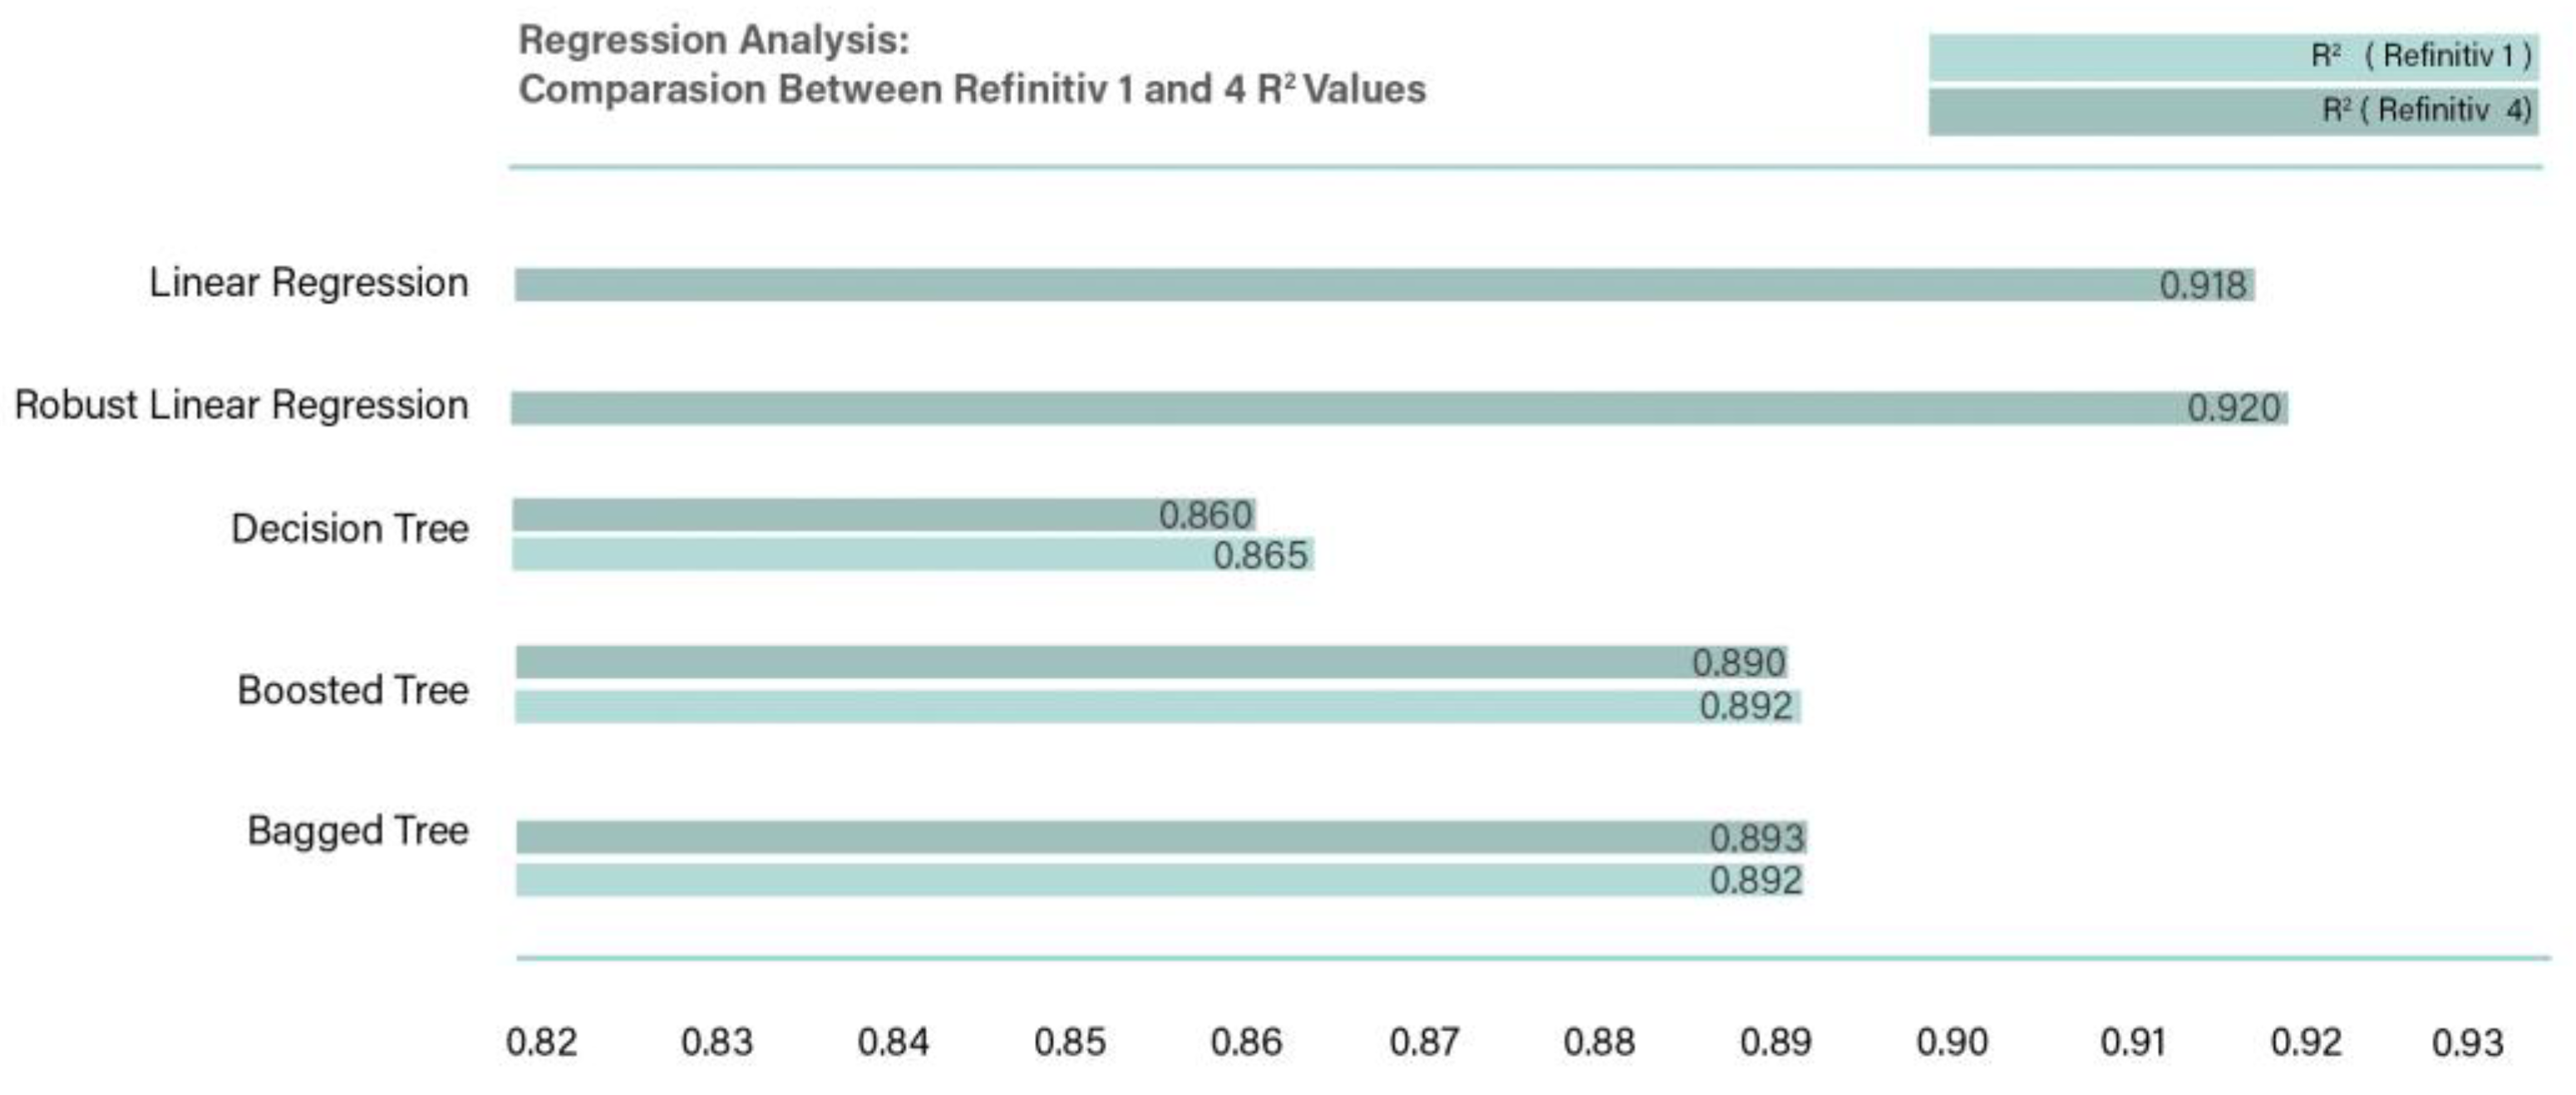
Figure 9.
R2 values of Datastream 1 (no missing ESG scores set).
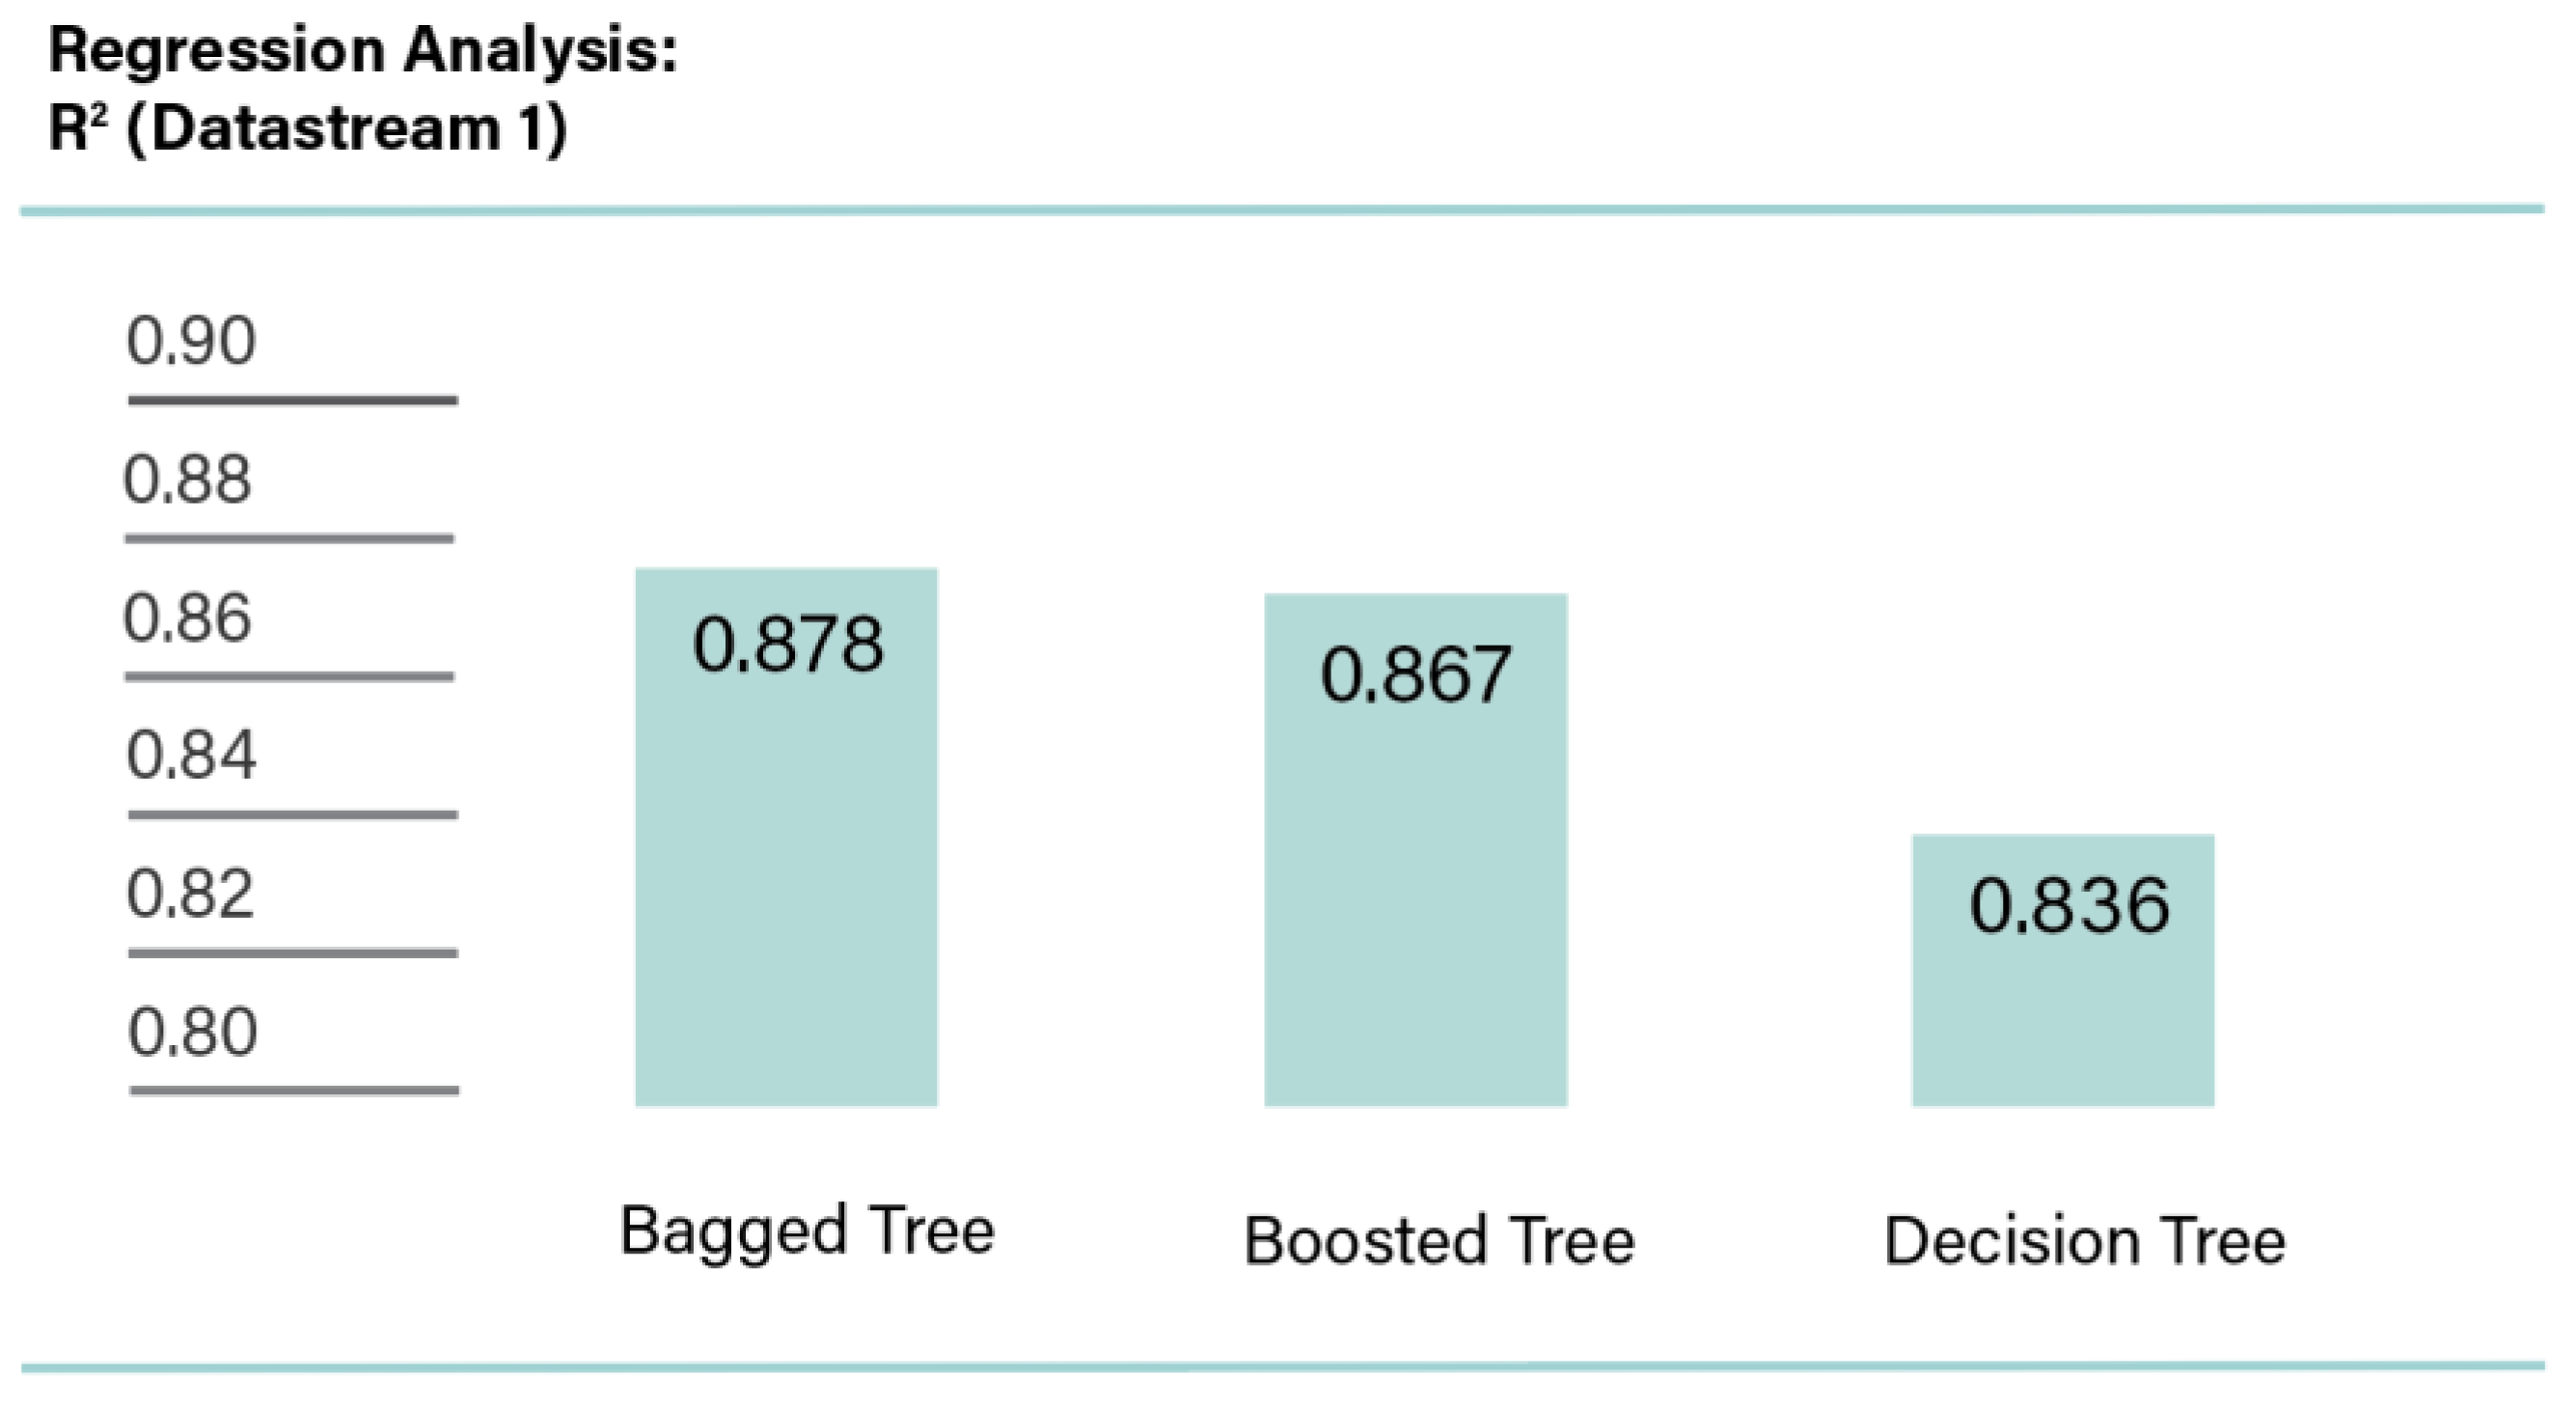
Figure 10.
Comparison of R2 values of Datastream 1 and 2 (encountered missing ESG scores).
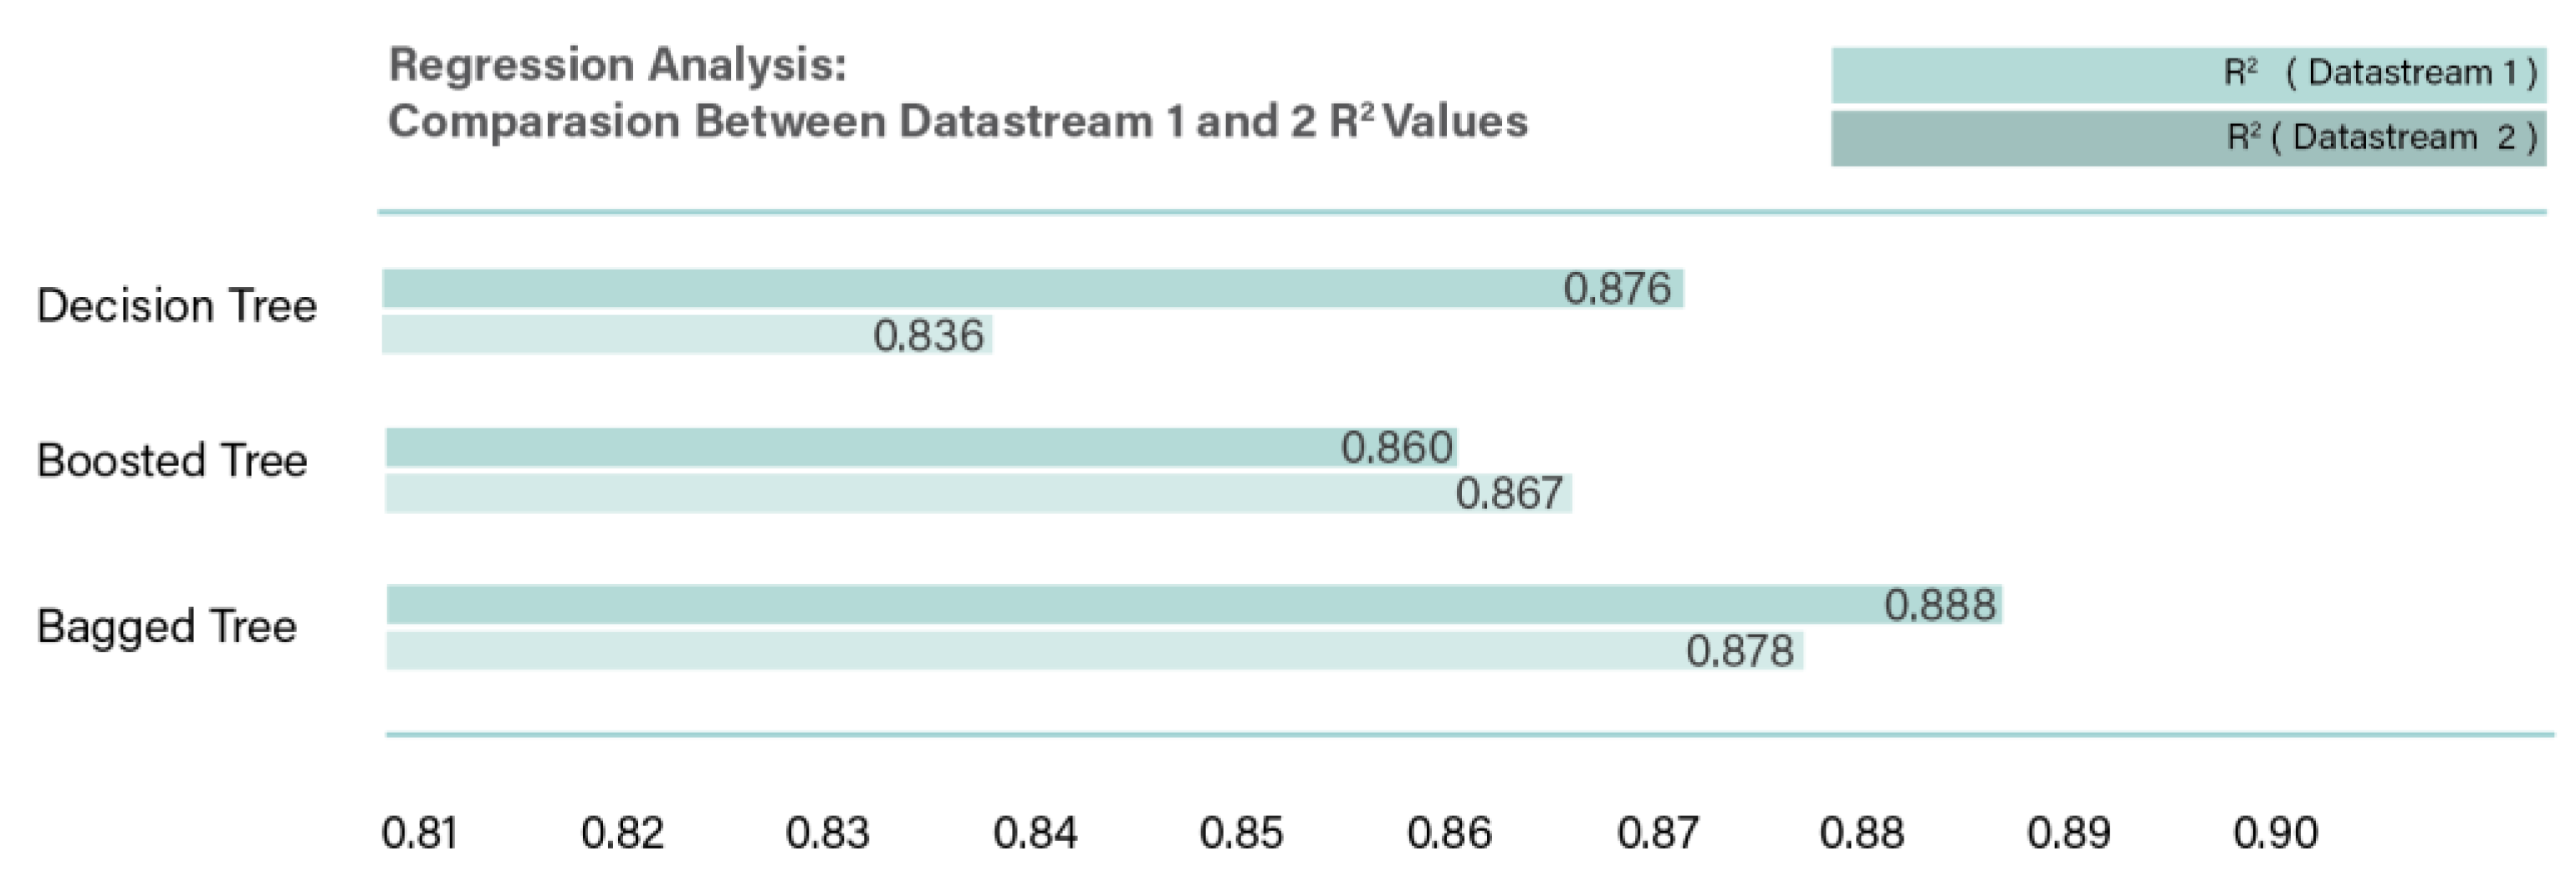
Figure 11.
Comparison between Datastream 1 and 2 RMSE, MSE, and MAE values.
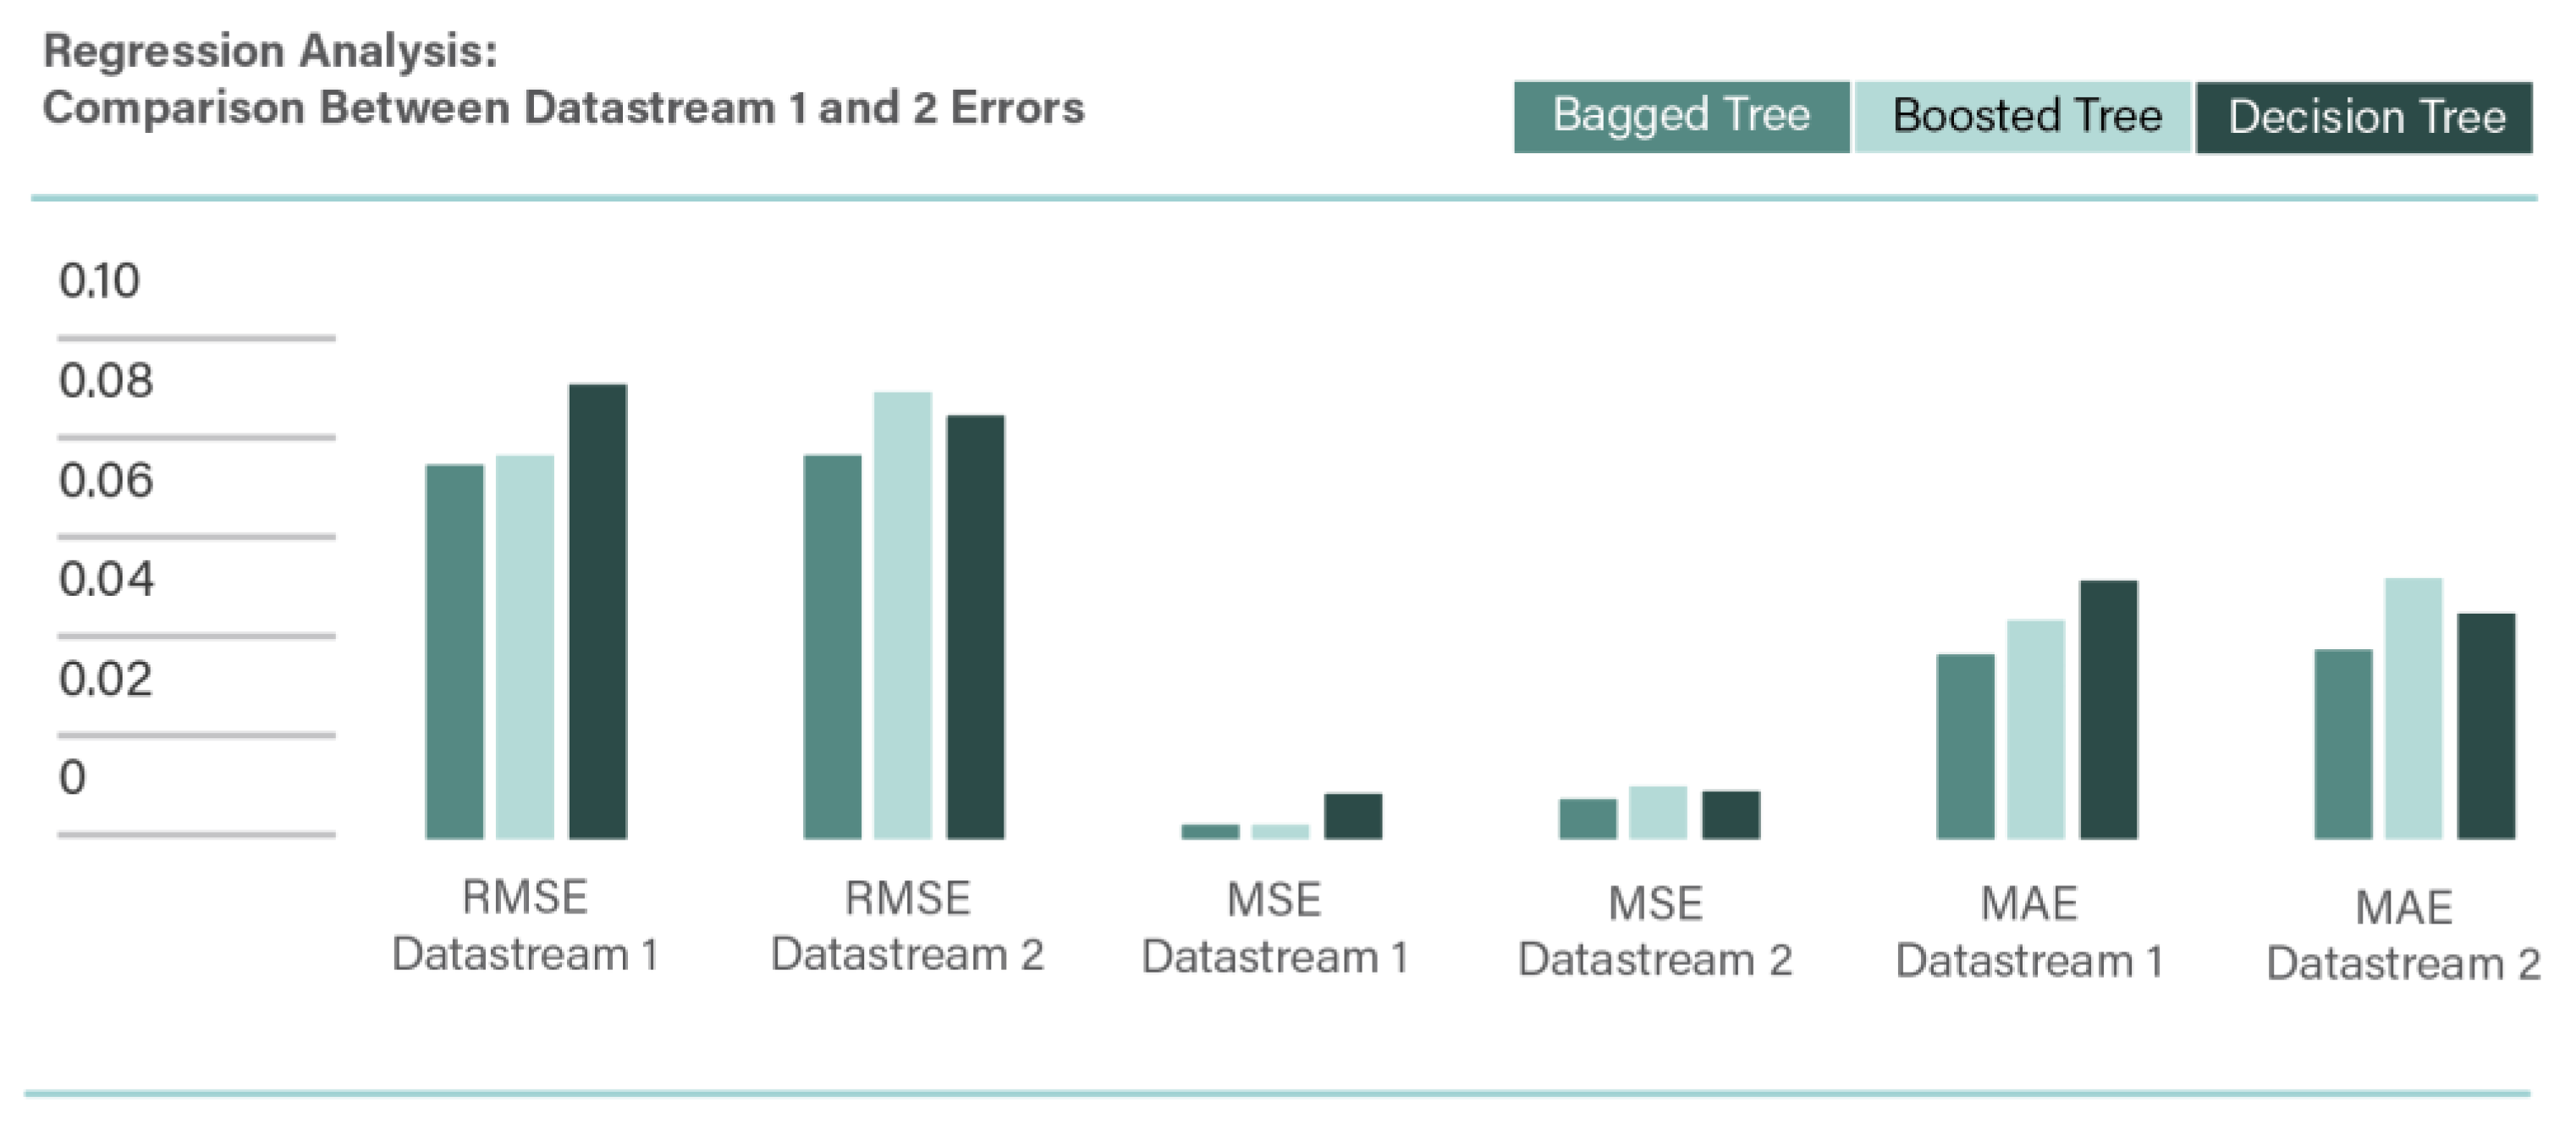
Figure 12.
Comparison between Refinitiv 1, 3, and 4 R2 values.
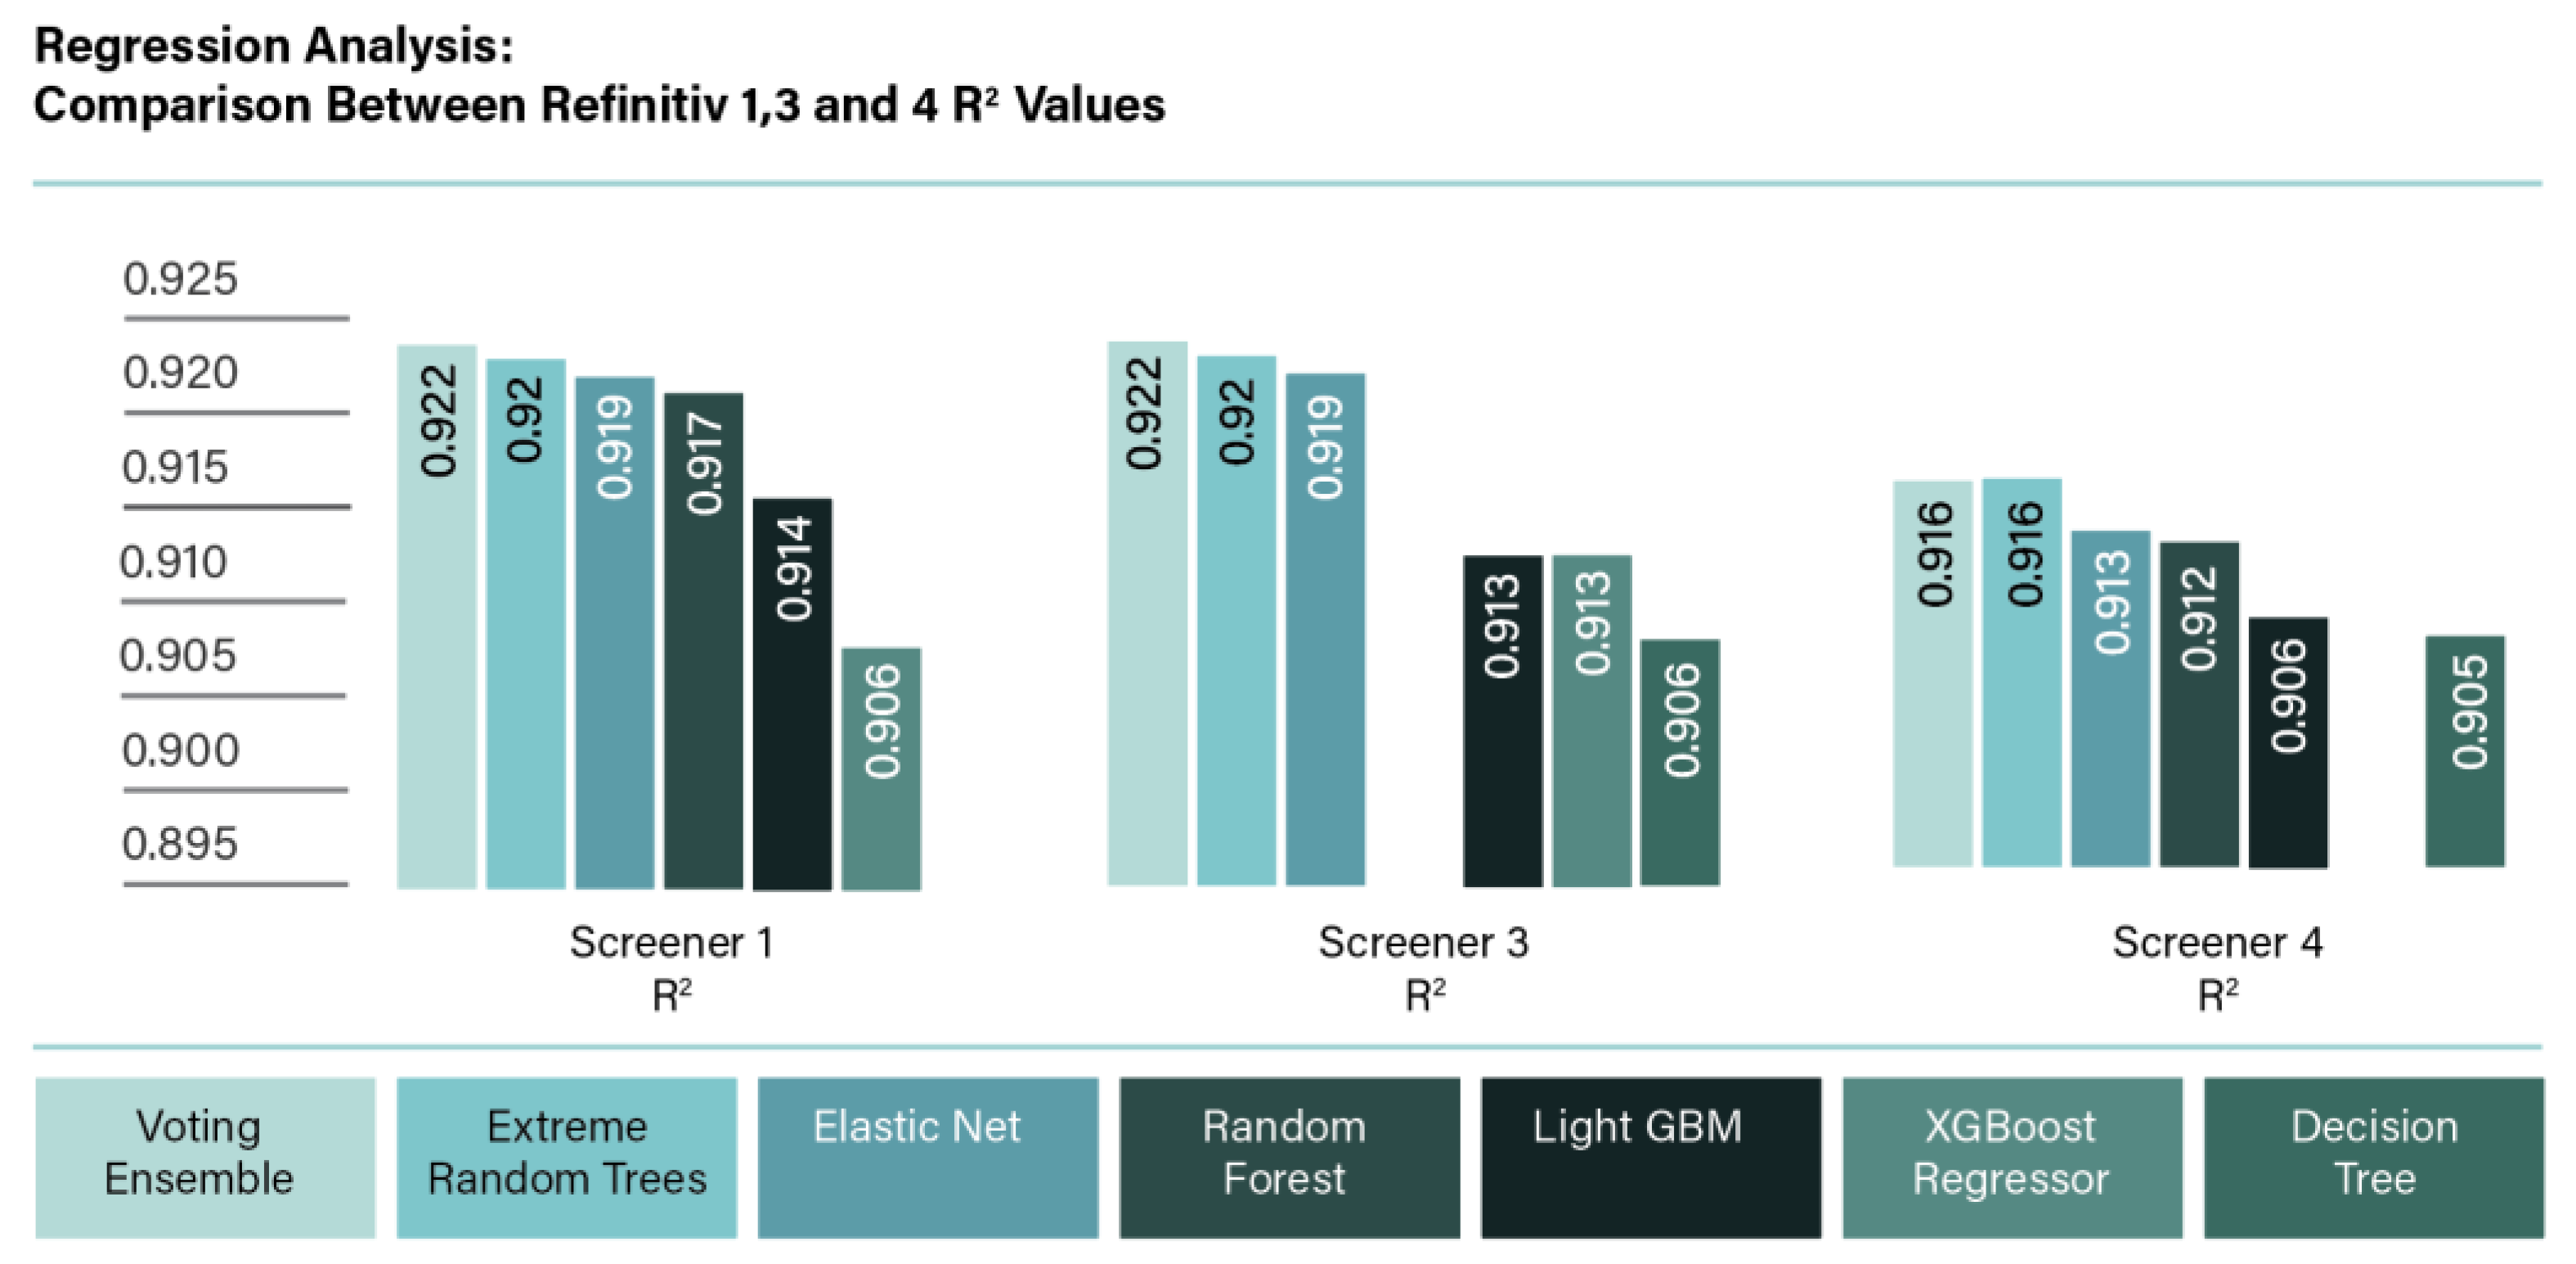
Figure 13.
Importance score-Country level.
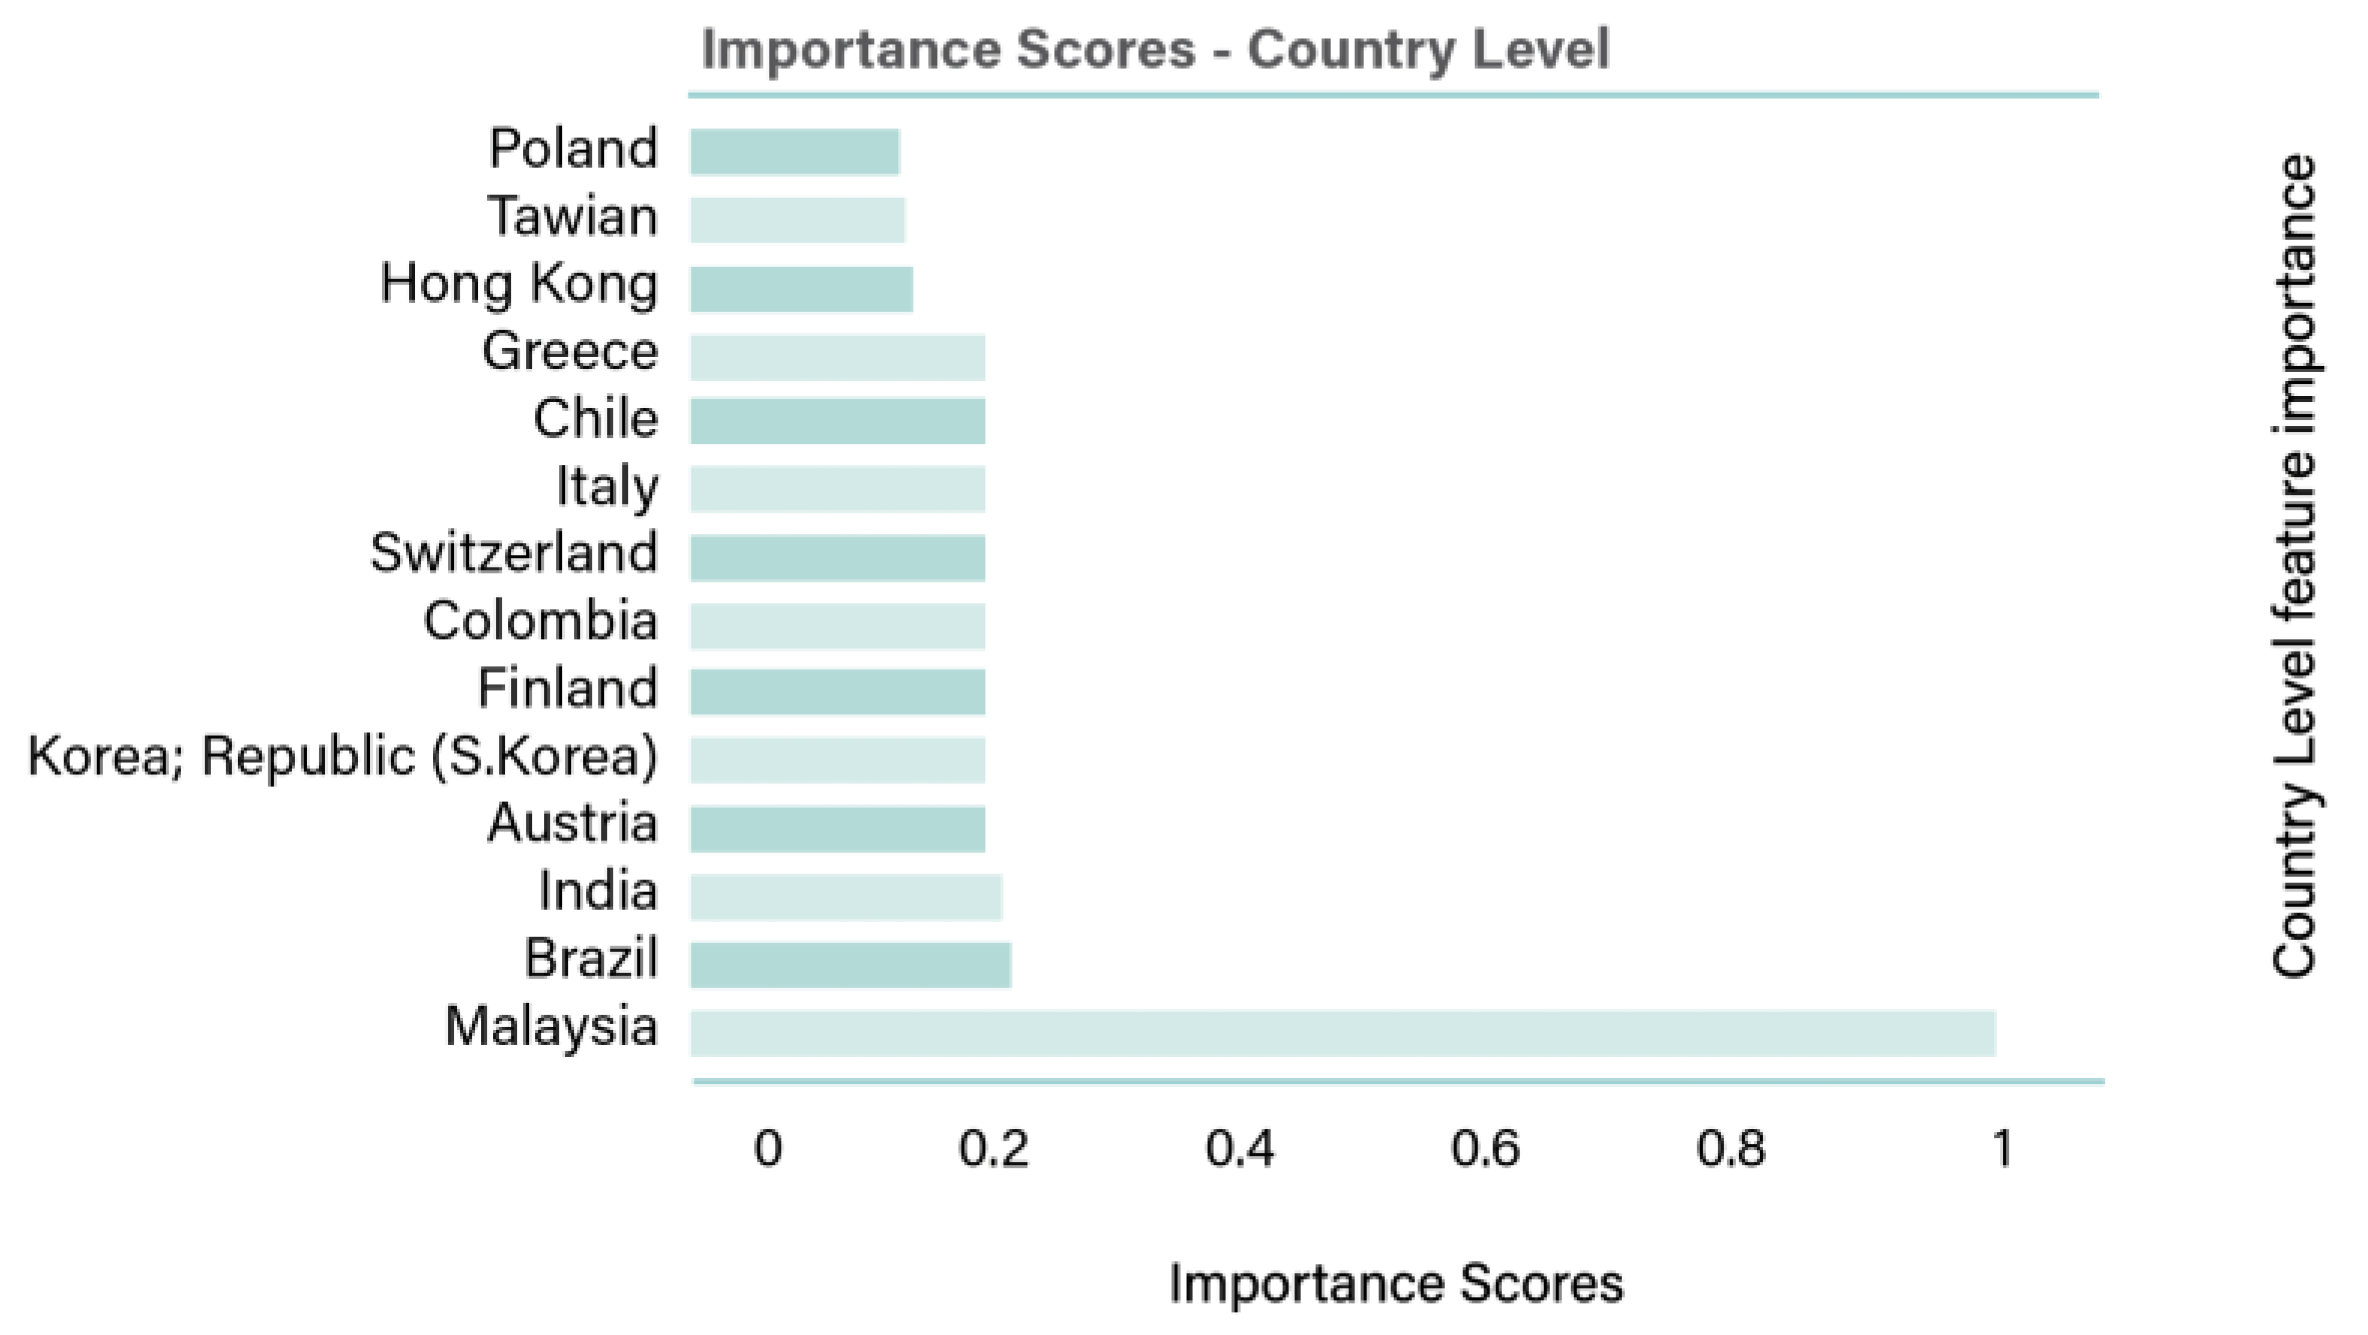
Figure 14.
Importance scores-Firm size.
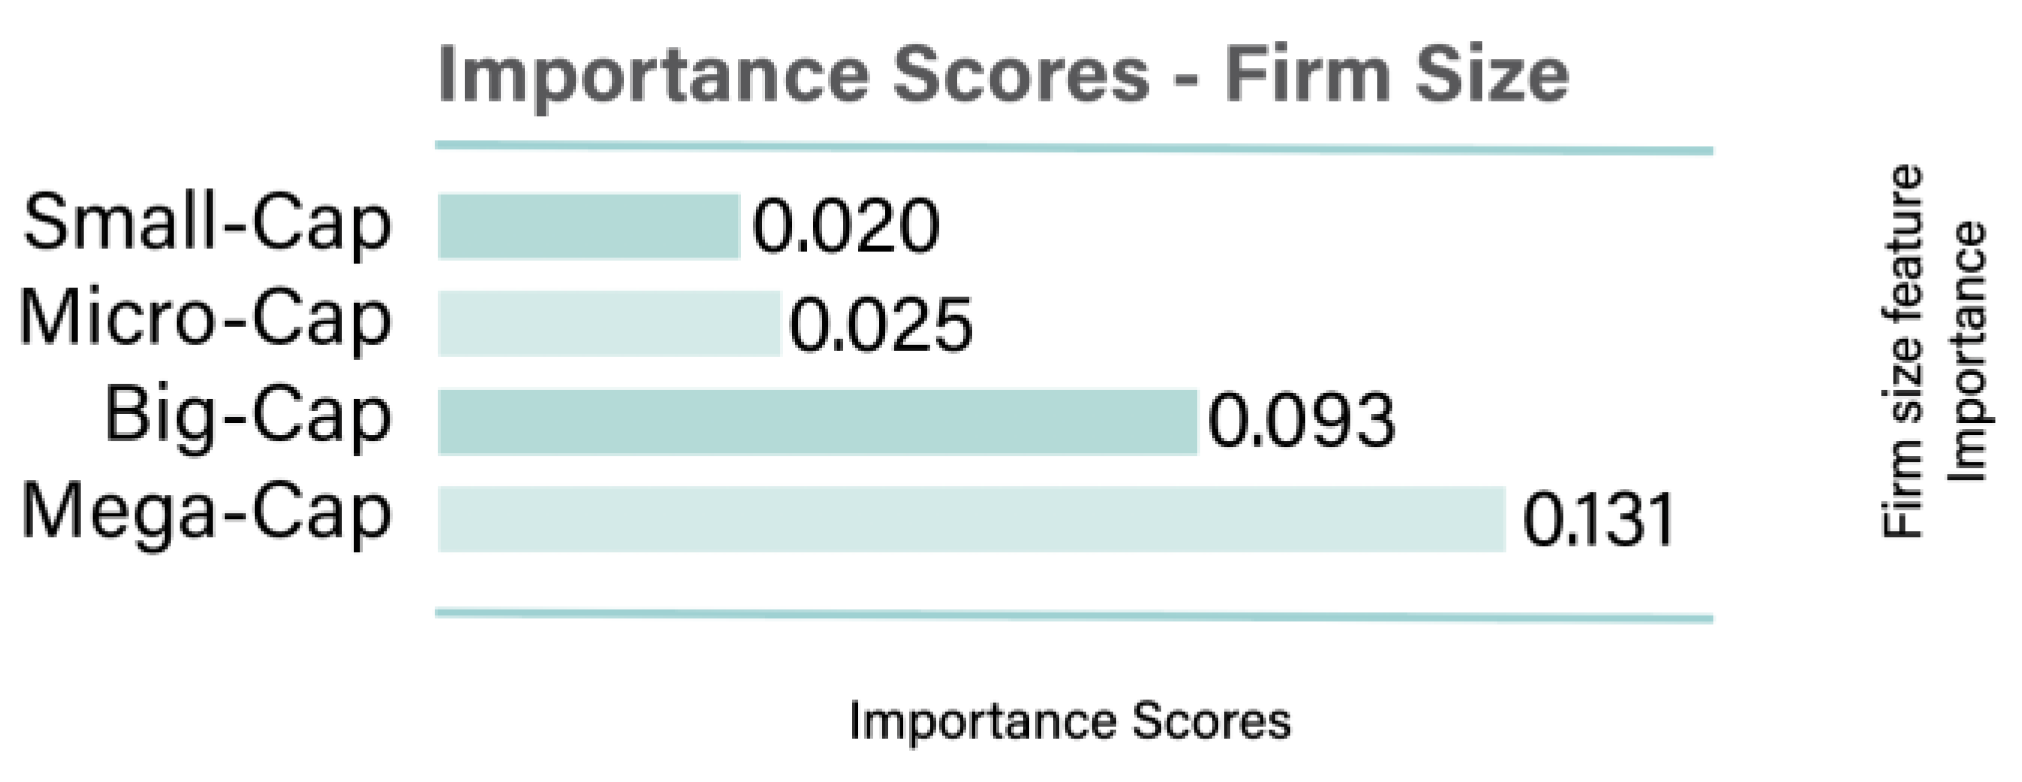
Figure 15.
Importance scores-ESG score.
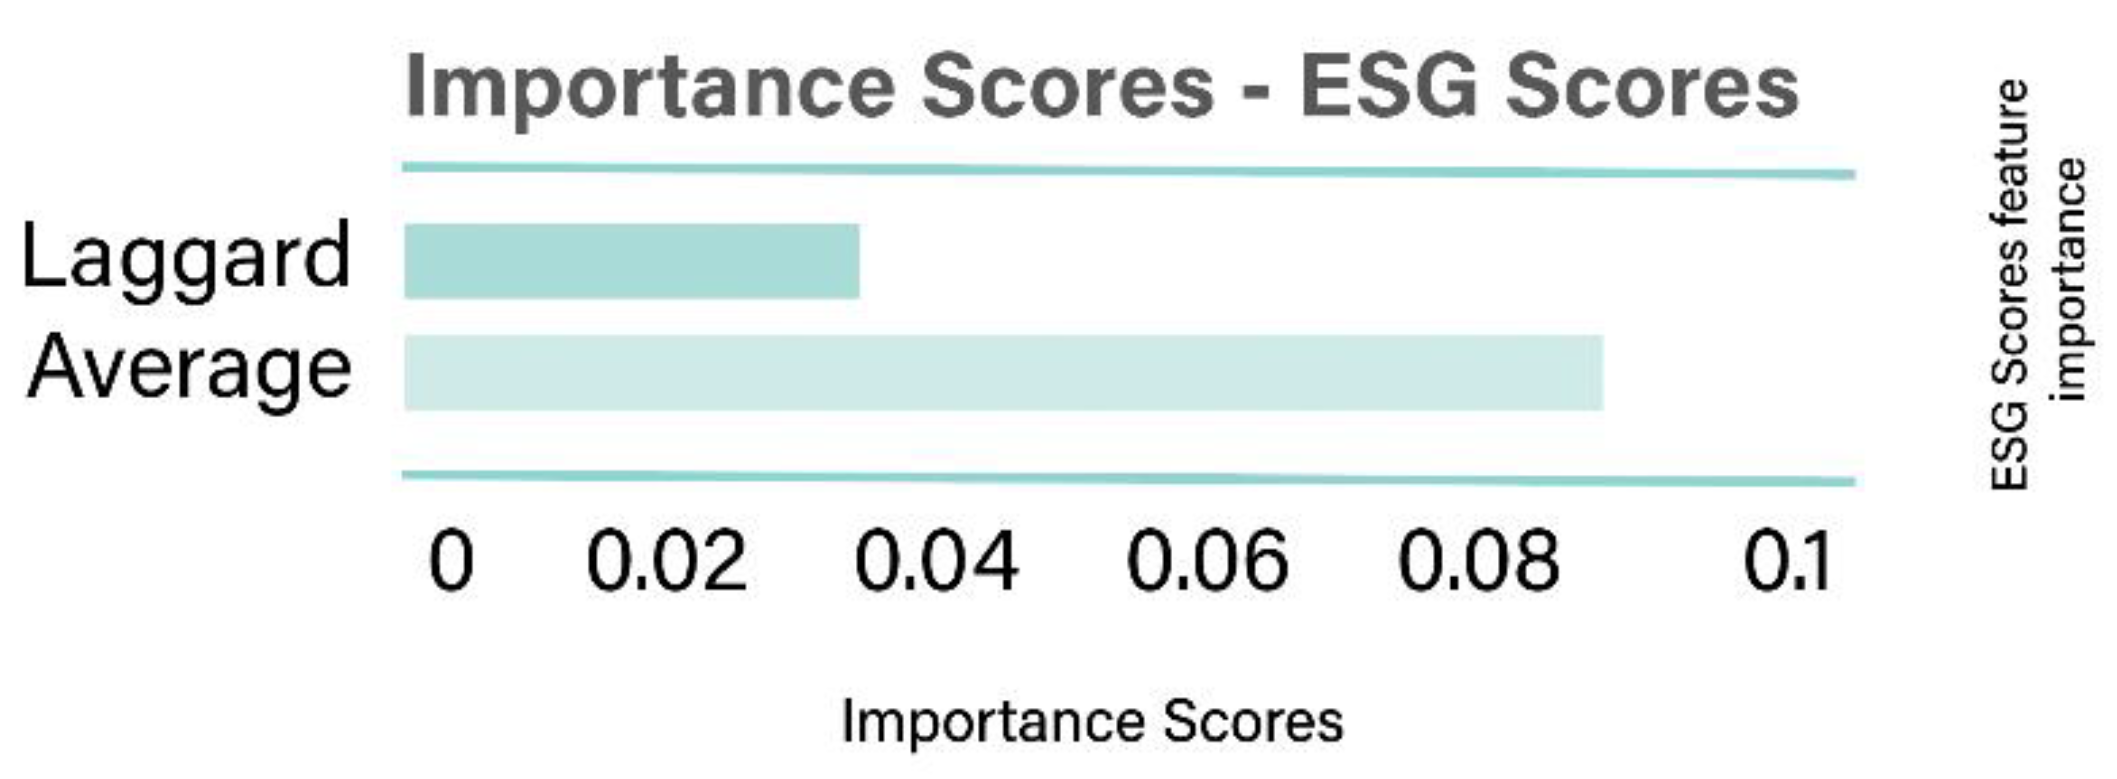

Table 1.
Number of companies included in the analysis.
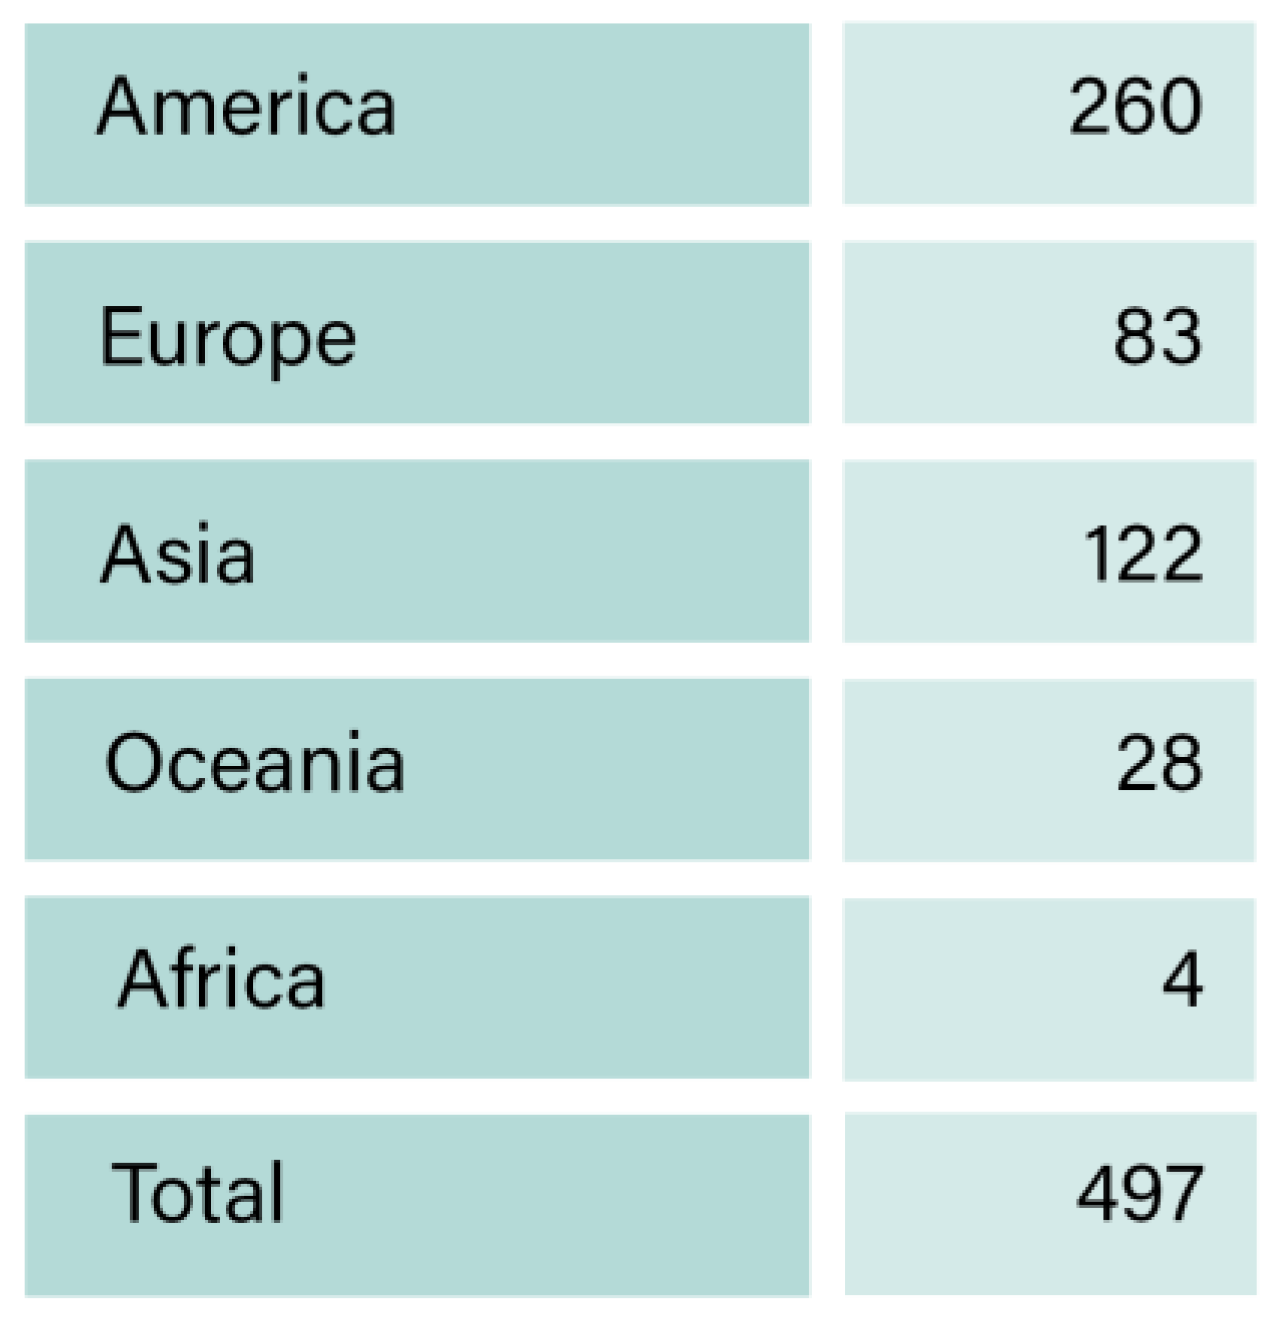 |
Table 2.
Financial indicators with high missing values from Refinitiv.
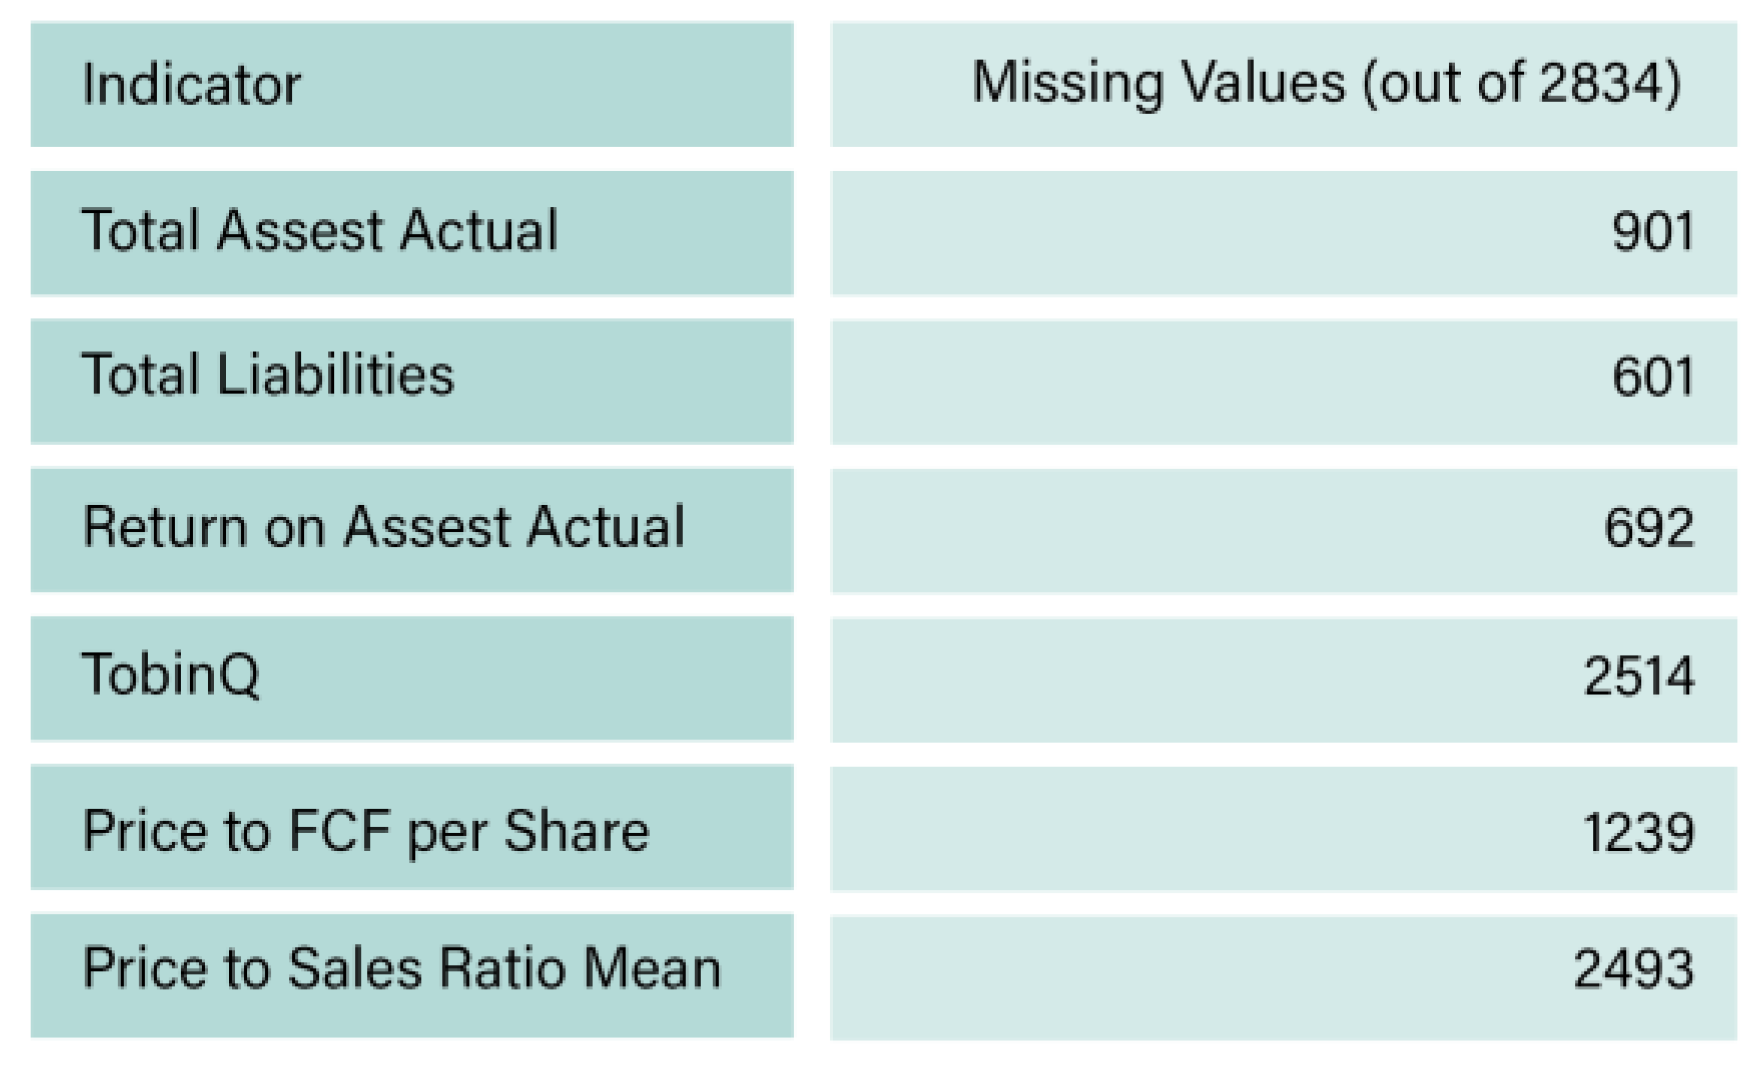 |
Table 3.
Refinitiv 1(no missing ESG scores) regression R2 values.
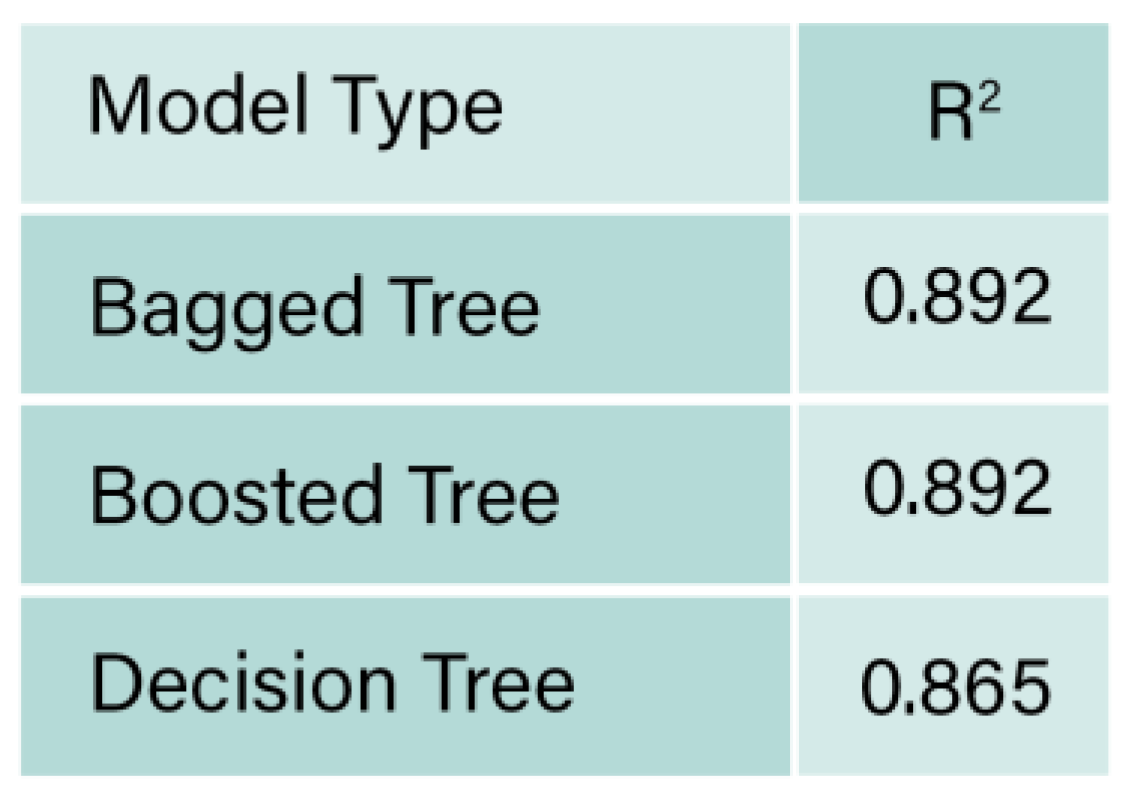 |
Table 4.
Comparison between Refinitiv 1 and 2 RMSE, MSE, and MAE values.
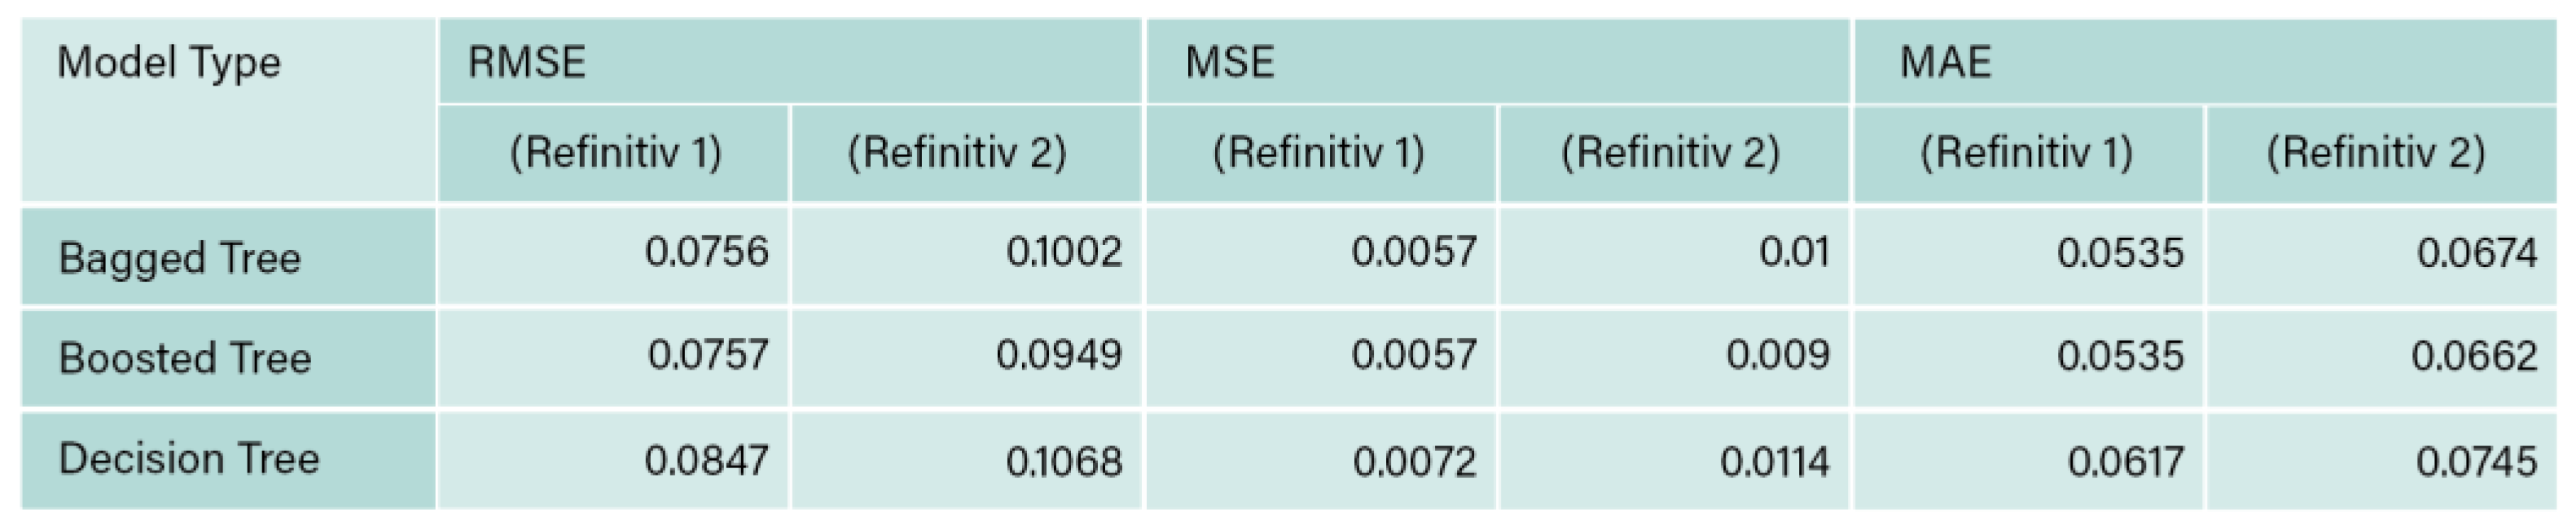 |
Table 5.
Refinitiv 3 and 4 RMSE, MSE, and MAE values.
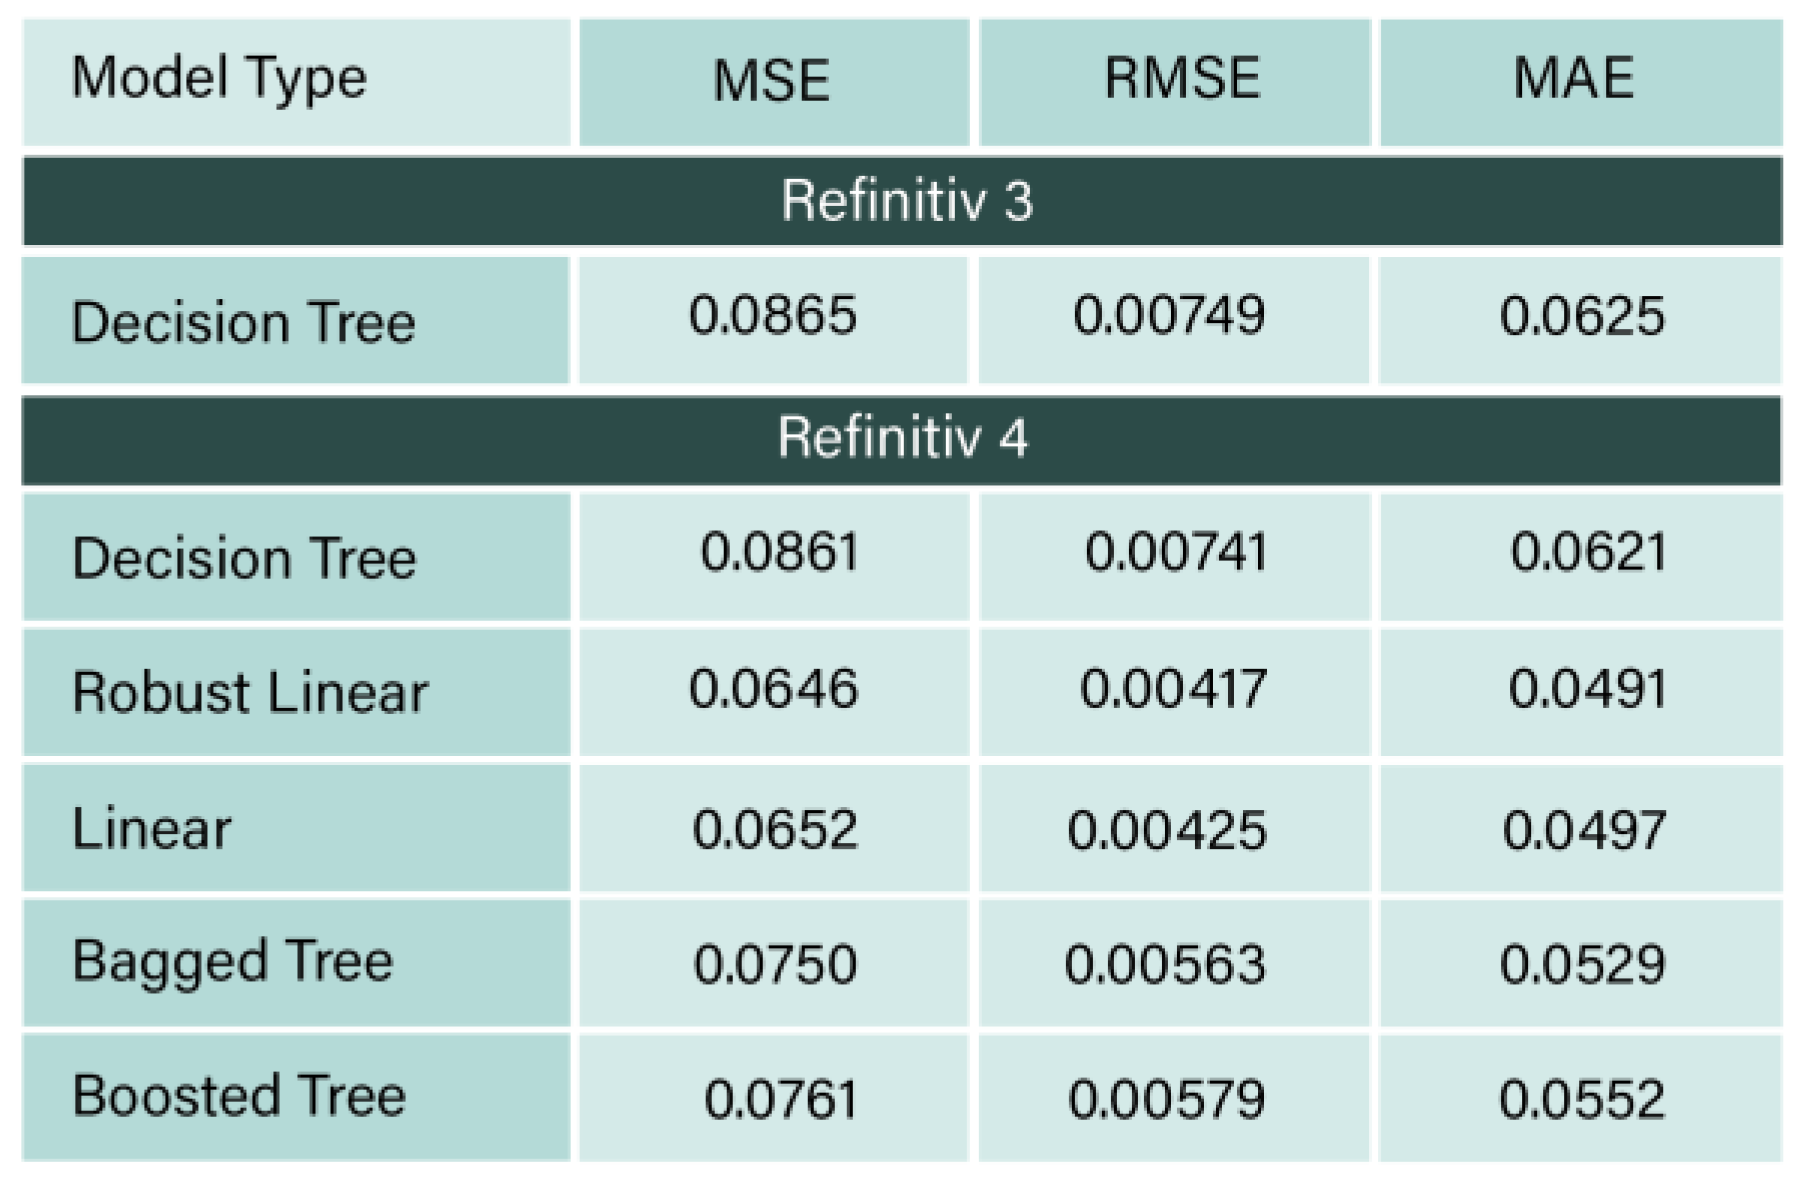 |
Table 6.
RMSE, MSE, and MAE values of Datastream 1 and 2.
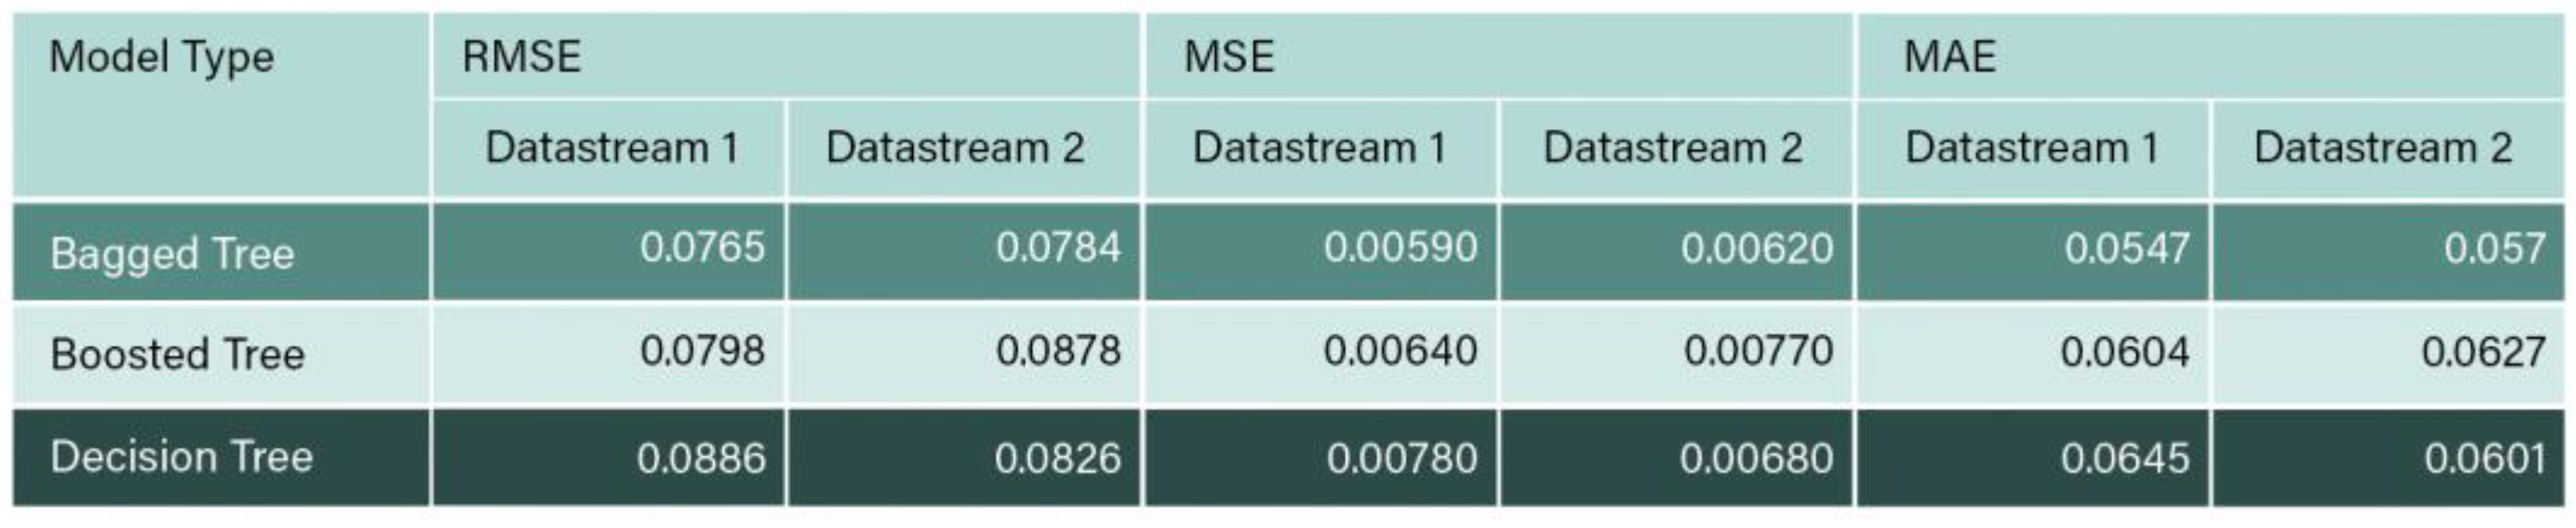 |
Table 7.
Refinitiv 1(3 classes of ESG scores) performance metrices.
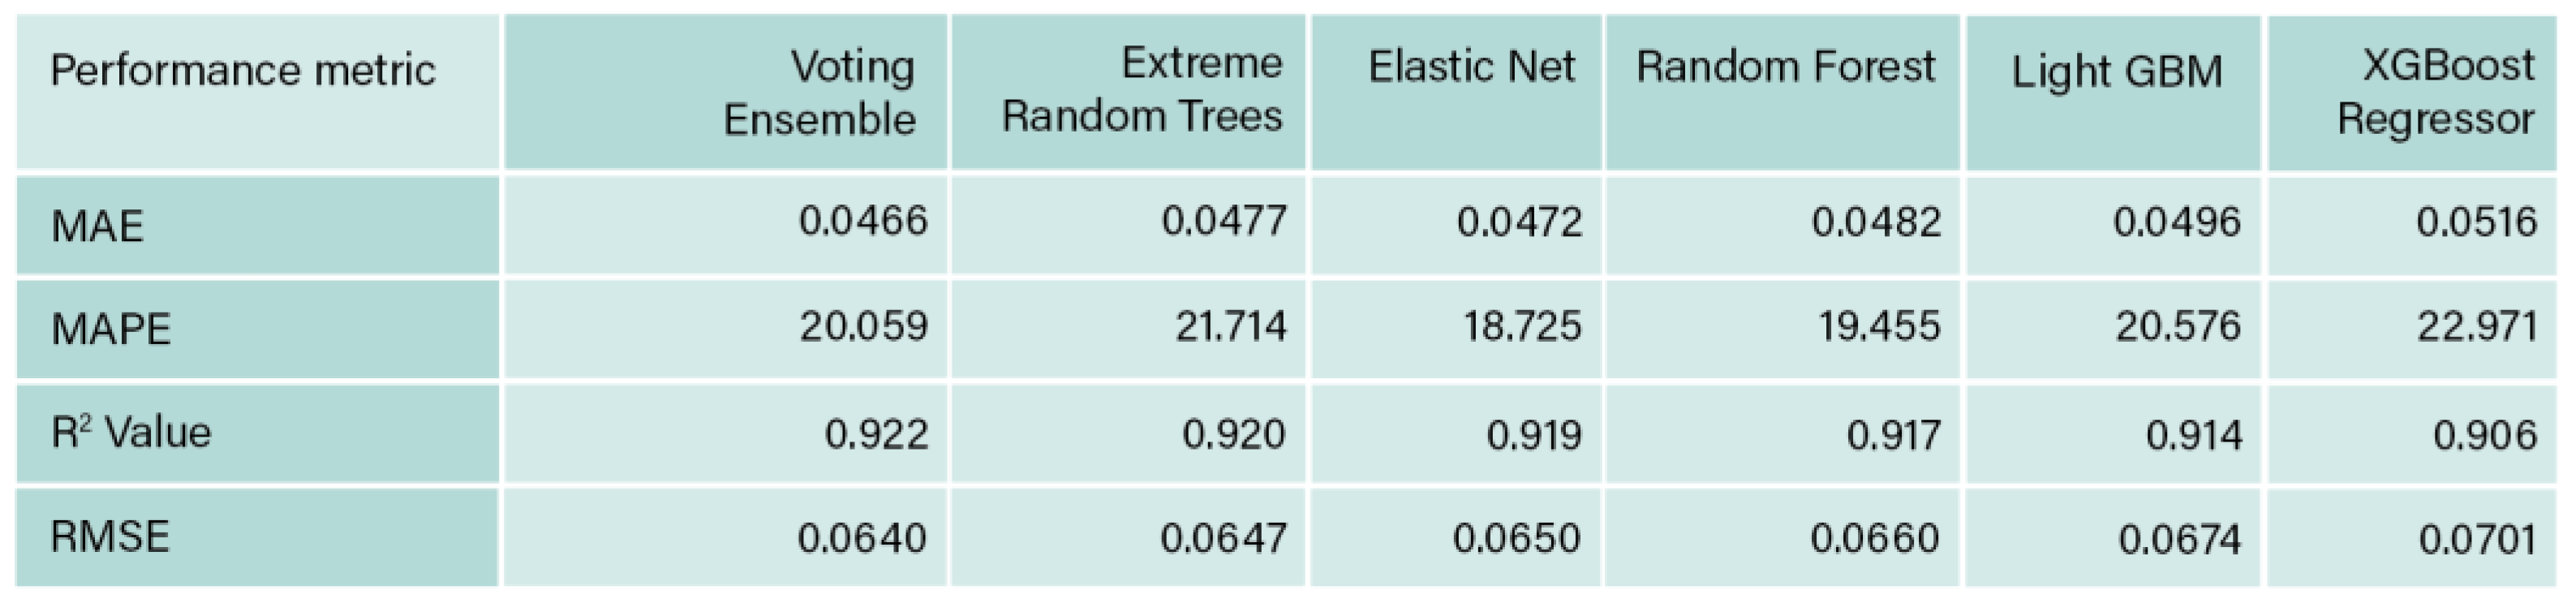 |
Table 8.
Comparison between Refinitiv 1, 3 and 4 R2 values.
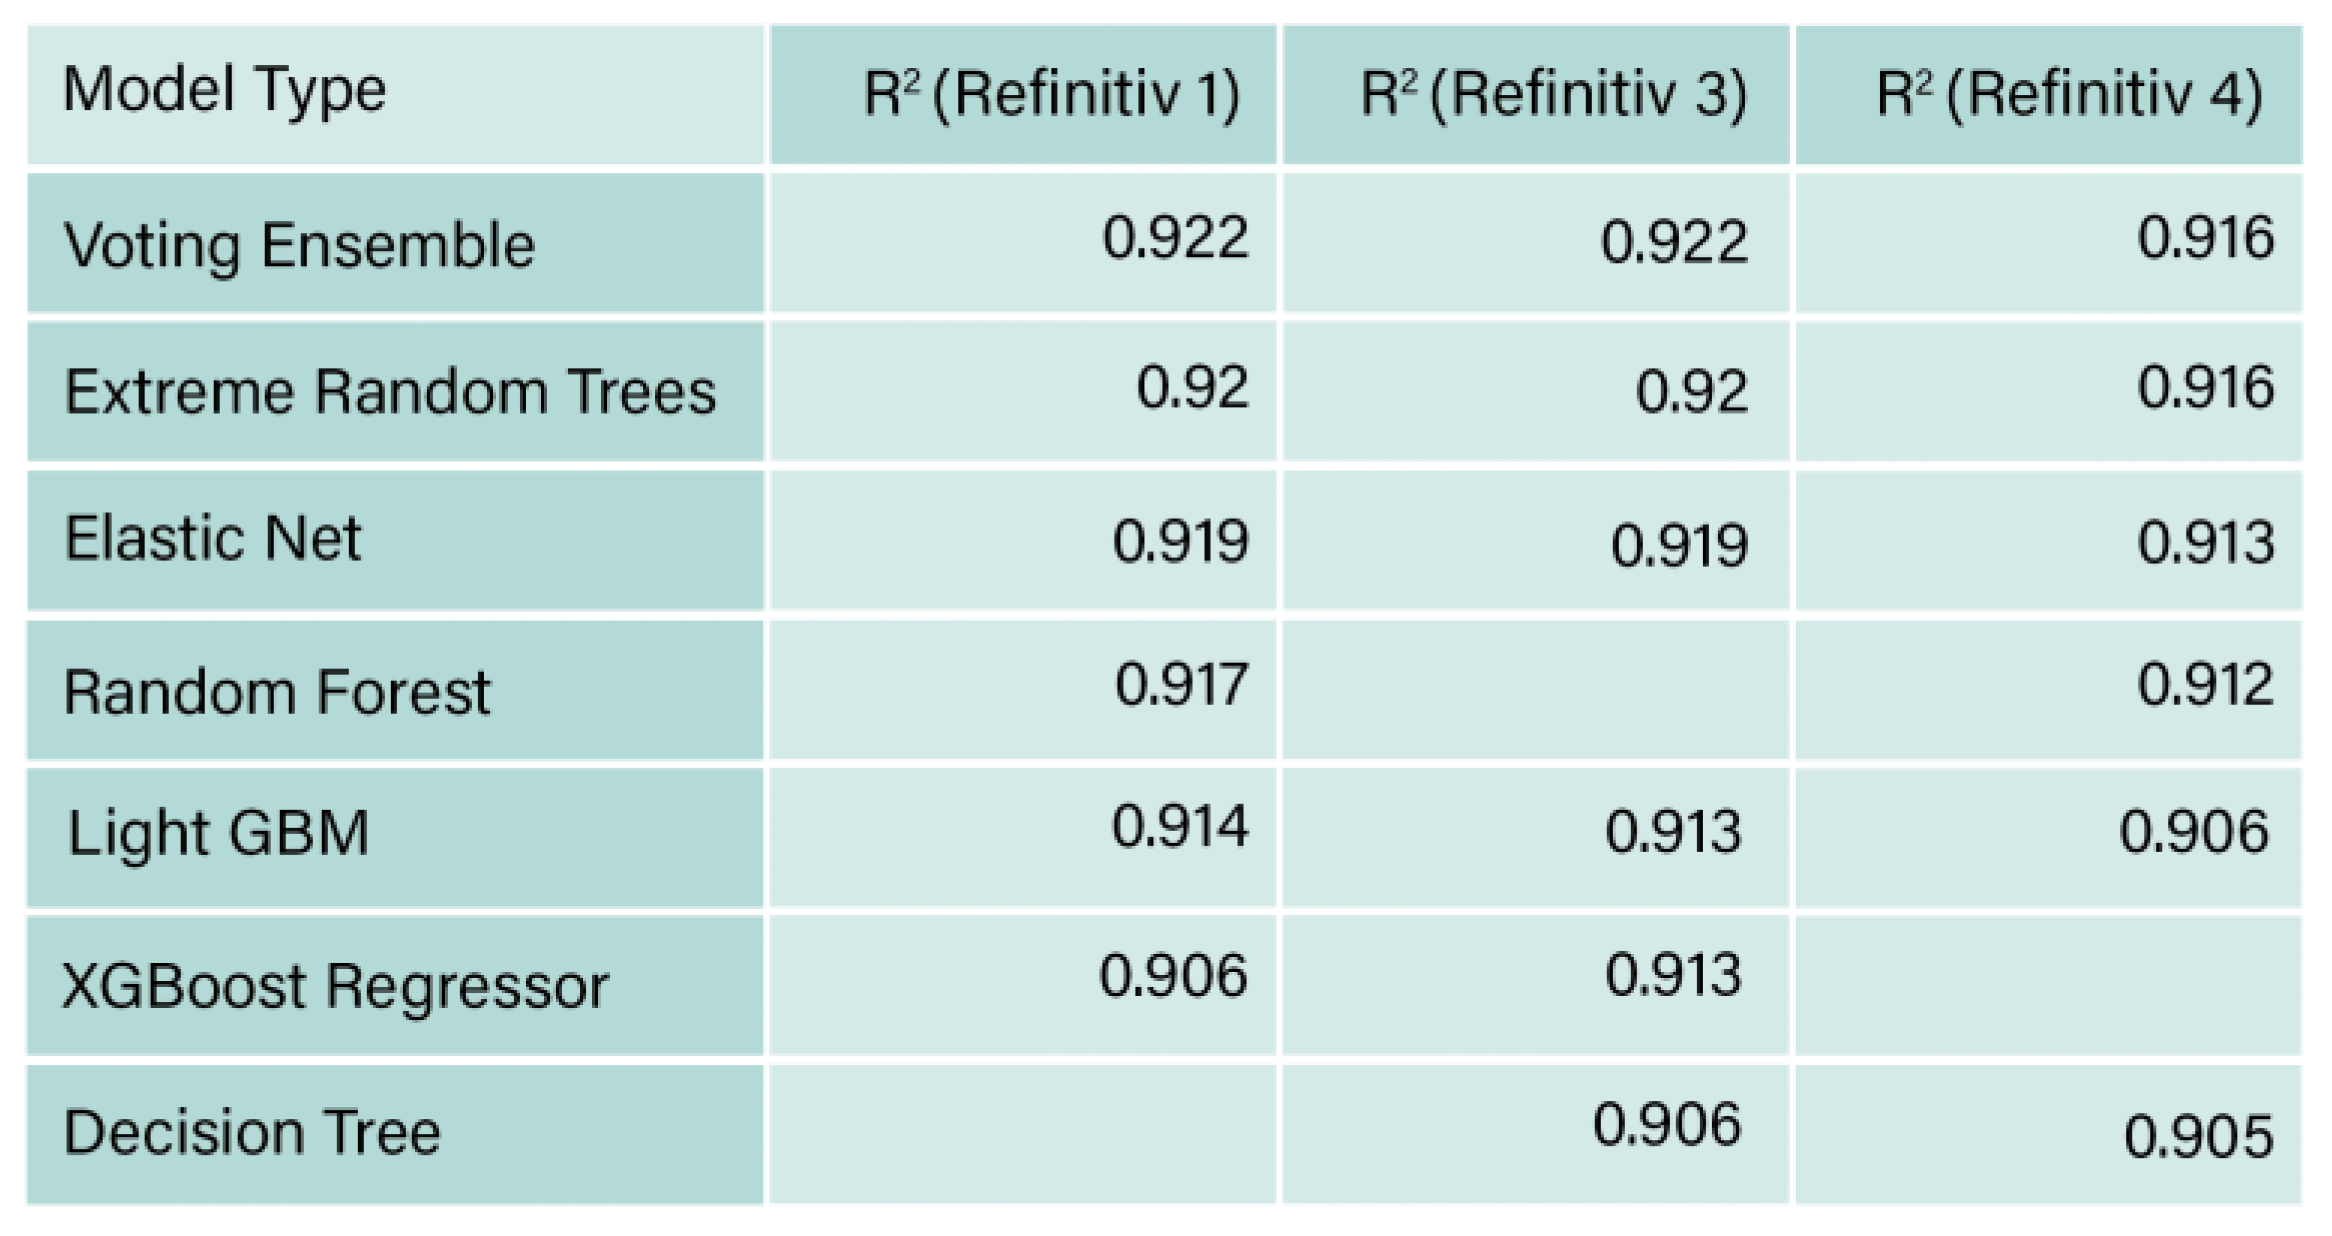 |
Table 9.
MAE and RMSE for Refinitiv 1, 3 and 4.
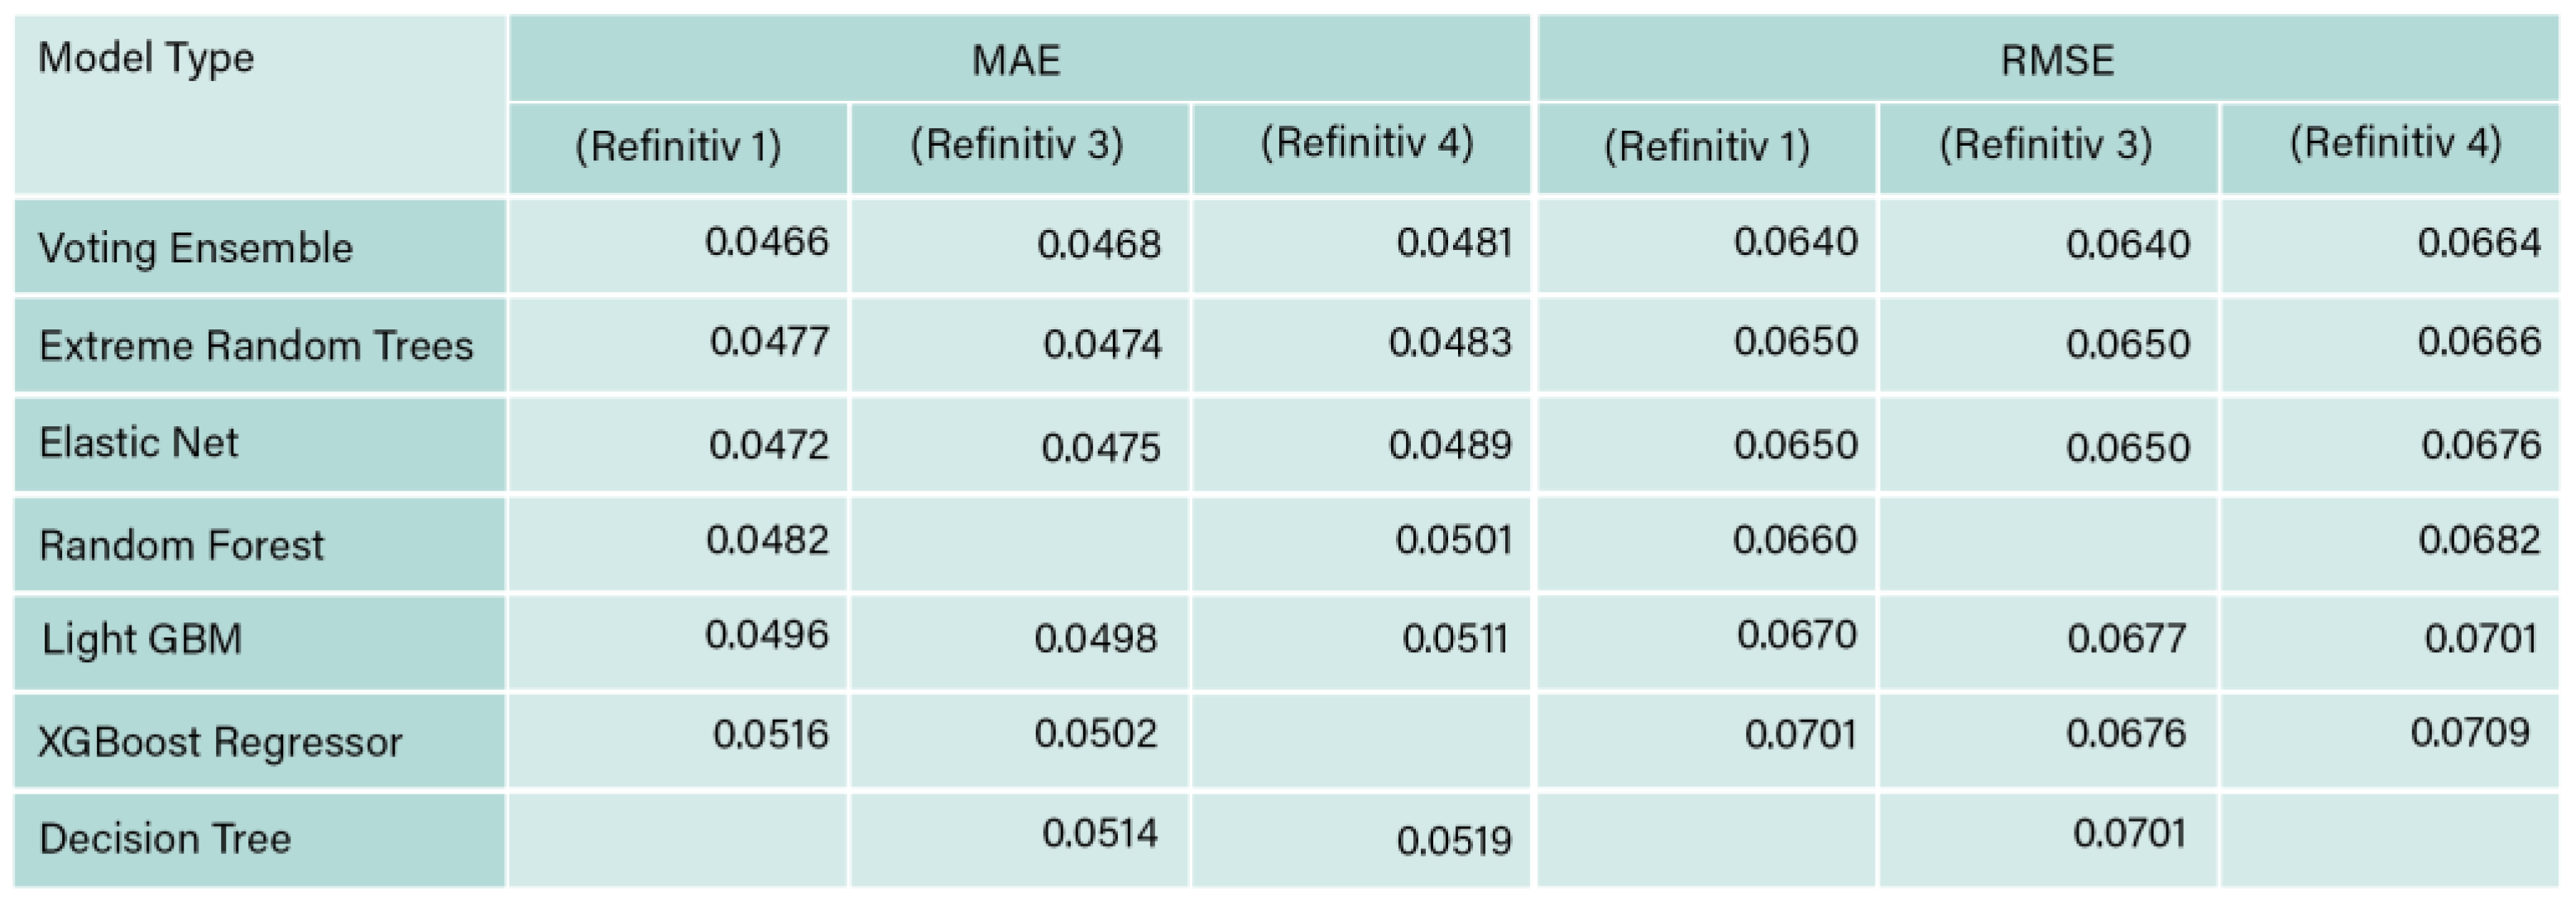 |
Table 10.
MAPE for Refinitiv 1, 3 and 4.
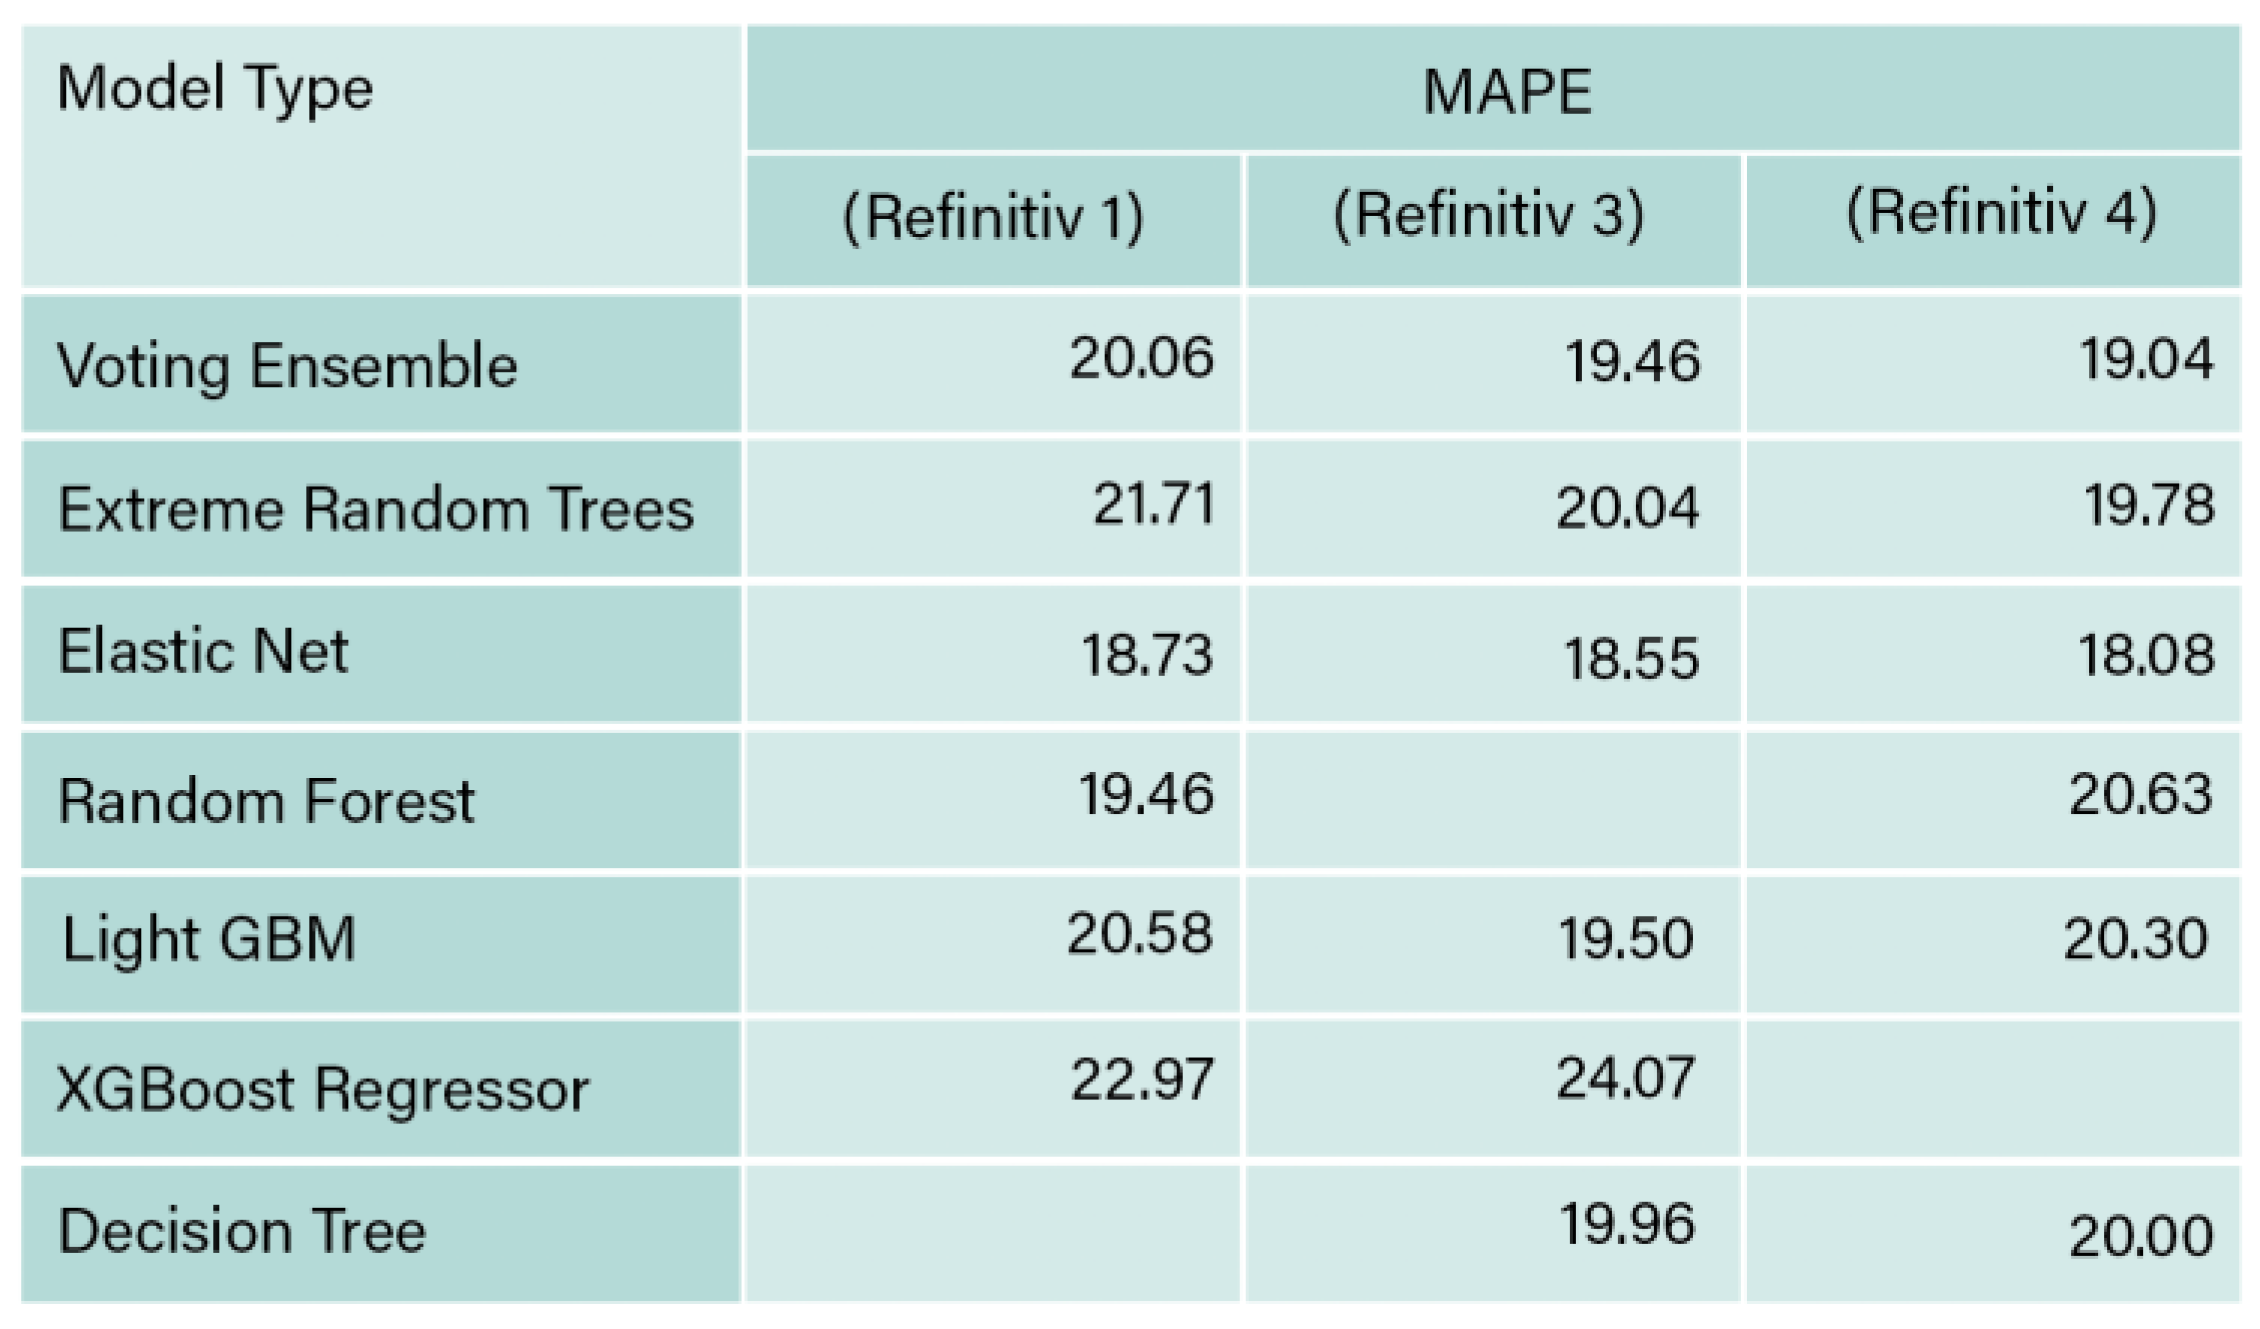 |
Table 11.
Si (2023).
 |
Table 12.
Lin and Hsu (2023).
 |
Table 13.
Lee et al. (2022).
 |
Table 14.
Krappel et al. (2021).
 |
Disclaimer/Publisher’s Note: The statements, opinions and data contained in all publications are solely those of the individual author(s) and contributor(s) and not of MDPI and/or the editor(s). MDPI and/or the editor(s) disclaim responsibility for any injury to people or property resulting from any ideas, methods, instructions or products referred to in the content. |
© 2025 by the authors. Licensee MDPI, Basel, Switzerland. This article is an open access article distributed under the terms and conditions of the Creative Commons Attribution (CC BY) license (http://creativecommons.org/licenses/by/4.0/).
Copyright: This open access article is published under a Creative Commons CC BY 4.0 license, which permit the free download, distribution, and reuse, provided that the author and preprint are cited in any reuse.


