
Submitted:
06 July 2025
Posted:
07 July 2025
You are already at the latest version
Abstract
This multi-method study investigates the complex interplay among Environmental, Social, and Governance (ESG) performance, financial risk, and stock returns within the global renewable energy sector, addressing a critical gap in integrated quantitative analysis. Panel regression results indicate that superior ESG performance, reflecting lower ESG risk, is associated with higher excess returns, particularly in low and medium-ESG-risk portfolios. Time series models reveal varying volatility dynamics across ESG-based portfolios, while Granger causality tests provide limited evidence of direct predictive relationships from ESG scores to future returns. Although raw return predictability remains low, machine learning models, interpreted through SHAP values, identify ESG factors as significantly important relative to traditional financial variables in shaping return direction. Rolling correlation analysis further demonstrates dynamic co-movements between high and low ESG portfolios, with implications for diversification strategies. Collectively, the findings offer nuanced evidence on the financial materiality of ESG within the renewable energy sector, emphasizing that ESG-related effects are heterogeneous and context-dependent. These insights are particularly relevant for asset managers, corporate strategists, and policymakers seeking to align investment decisions with sustainability objectives and risk-adjusted performance in the context of the energy transition.
Keywords:
renewable energy
; ESG performance
; financial risk
; excess returns
; panel regression
; time series analysis
; GARCH models
; machine learning
; SHAP values
; sustainable finance
1. Introduction
The urgent global responsibility to combat climate change has sparked a huge shift to renewable energy sources. Solar, wind, hydro, and geothermal power sectors are expanding at an unprecedented rate, establishing themselves as cornerstones of global sustainable development and energy security [1,23,40,51,52]. This growth is increasingly intertwined with the broader financial landscape's growing focus on Environmental, Social, and Governance (ESG) considerations, as investors, regulators, and the public demand greater accountability and sustainability from corporations [24,40,42]. While the renewable energy sector is inherently aligned with the 'E' component of ESG, a comprehensive understanding of how holistic ESG performance across all three pillars influences the financial outcomes of firms within this specific sector is crucial.
Investment flows into renewable energy are accelerating, often steered by mandates for socially responsible investment and sustainable finance [1]. However, the precise relationship between a renewable energy firm's comprehensive ESG profile (including social impact and governance quality) and its financial performance, specifically in terms of stock returns and risk, remains a subject of ongoing debate and complexity [24]. Traditional financial models, primarily focused on market and industry-specific factors, may not adequately capture the nuanced ways in which ESG practices can influence operational efficiency, risk mitigation, innovation, and ultimately, shareholder value in a sector heavily influenced by policy, technological advancements, and evolving societal expectations [36,46]. This motivates a deeper empirical investigation.
Existing academic literature has explored the link between ESG and financial performance across various industries, often yielding mixed results. Research focusing specifically on the renewable energy sector is emerging, but a detailed, multi-faceted empirical investigation that combines different advanced quantitative techniques is less common. Studies applying advanced econometric techniques like panel data analysis to control for firm-specific heterogeneity, time series models (such as GARCH-family models) to capture volatility dynamics, and machine learning for exploring predictive relationships and factor importance specifically within renewable energy ESG portfolios are needed to provide a more comprehensive picture. Furthermore, understanding the structure and evolution of academic research on this precise intersection through bibliometric analysis can help confirm the novelty of the research questions and identify areas requiring further exploration [26,31,34].
This study pursues five interconnected objectives to provide a comprehensive understanding of ESG, risk, and return dynamics in the renewable energy sector:
First, to map the current academic research landscape on ESG and finance in the renewable energy sector using bibliometric analysis to identify key themes, influential works, and potential research gaps, especially concerning the role of digitalization and AI.
Second, informed by the bibliometric findings and relevant theories, to empirically analyze the relationship between firm-level ESG performance and excess stock returns in renewable energy firms using panel regression, examining heterogeneity across firms grouped by ESG scores.
Third, to investigate the time-series properties (stationarity, volatility clustering, Granger causality from ESG) of portfolios formed on ESG scores within the sector.
Fourth, to assess the potential of machine learning models to predict future excess returns in these portfolios and to use explainable AI (SHAP) to understand the relative importance of ESG compared to traditional risk factors.
Fifth, to analyze the dynamic correlation structure between high and low ESG portfolios in the renewable energy sector using rolling correlation analysis.
Flowing from the literature review and particularly informed by the word cloud and co-occurrence analysis from the bibliometric study, which highlighted technology and finance themes but indicated a less saturated area concerning granular ESG-financial linkages with advanced quantitative methods, this study seeks to answer the following research questions:
RQ1: What is the structure of the current academic research landscape at the intersection of renewable energy, ESG, and finance?
RQ2: What is the relationship between firm-level ESG performance and excess stock returns for renewable energy firms, and does this relationship vary across different levels of ESG performance (Low, Medium, High ESG risk portfolios), after controlling for systematic risk and firm-specific effects?
RQ3: Do portfolios sorted by ESG performance exhibit distinct time-series properties, including volatility clustering and Granger causality from ESG scores to returns?
RQ4: To what extent can machine learning models predict excess returns or their direction in ESG-sorted renewable energy portfolios, and how important are ESG factors relative to traditional risk factors in these predictions?
RQ5: How does the correlation between High ESG risk and Low ESG risk renewable energy portfolios evolve dynamically over time?
2. Theoretical Background and Literature Review
2.1. Theoretical Foundations for ESG-Financial Performance Link
Understanding the relationship between environmental, social, and governance (ESG) performance and financial consequences necessitates considering a variety of theoretical viewpoints. To begin, Stakeholder Theory asserts that organizations that sustainably manage relationships with all stakeholders, including employees, customers, communities, suppliers, and the environment, are more likely to create long-term value and avoid risks [91]. In the renewable energy sector, while strong environmental performance is undoubtedly paramount, ethical labor practices (Social) and transparent decision-making (Governance) are equally crucial for obtaining social license to operate, effectively managing supply chain risks, and attracting conscious investors. Collectively, these factors can positively influence financial stability and performance.
Furthermore, the Resource-Based View (RBV) suggests that competitive advantage is derived from possessing unique, valuable, rare, inimitable, and non-substitutable resources and capabilities [92]. Building on this framework, the study argues that strong ESG performance can cultivate such valuable, inimitable resources within the renewable energy industry. This includes fostering a positive reputation, driving innovative sustainable practices, promoting efficient resource use, and enhancing the ability to attract talent and capital. These internally generated resources can translate into tangible benefits such as operational efficiencies, reduced costs, enhanced innovation, and improved market positioning, ultimately boosting financial performance [47,54,56].
Finally, according to Signaling Theory, firms utilize observable actions as signals to convey unobservable qualities to external parties, particularly in situations characterized by information asymmetry [93]. High ESG performance can serve as a credible signal of superior management quality, a lower propensity for hidden risks (e.g., regulatory non-compliance, environmental liabilities), and a genuine commitment to long-term value creation rather than short-term gains. This is particularly relevant for renewable energy firms operating in a highly scrutinized and policy-sensitive environment, where robust ESG credentials can signal stability and reliability to investors, potentially attracting more favorable financing terms and improving overall valuation [42].
2.2. Review of The Renewable Energy Sector: Structure and Financial Characteristics
The renewable energy sector is inherently diverse, encompassing various actors including developers, manufacturers (e.g., solar panels, wind turbines), utilities integrating renewable sources, and financial entities involved in project finance. The business models within this sector are heavily influenced by key external factors such as technological costs, which have seen dramatic decreases [3], government policies including subsidies, tax credits like the U.S. Inflation Reduction Act, and targets like the EU's REPowerEU [13,15,18], and energy price volatility. Consequently, sector-specific risks frequently encountered include policy changes, project execution risks, grid integration challenges, and technological obsolescence [1,19].
Moreover, the sector is experiencing significant impact from the rapid advancements in digital technologies, enabling more sophisticated management and integration [22,29,36]. Solar photovoltaic (PV) and wind energy continue to dominate capacity additions, necessitating enhanced grid stability and forecasting capabilities [3,19]. Breakthroughs in battery storage, accompanied by significant cost reductions, are becoming critical for effectively addressing the intermittency inherent in renewable sources [2,4,6,7]. In parallel, Artificial Intelligence (AI), Machine Learning (ML), and Digital Twin (DT) technologies are increasingly leveraged for optimizing grid and energy management, demand forecasting, predictive maintenance, and integrating variable renewable sources [8,9,10,11,12,14,16,17,28,29,31,39,80,81]. For example, Digital Twins create virtual replicas of physical assets or systems, enabling real-time monitoring, simulation, and optimization functionalities crucial for complex renewable energy infrastructure and smart grids [5,10,11,12,14,17,28,31,52,80]. AI and ML further enhance these capabilities through sophisticated data analytics, predictive modeling, and automated decision-making processes [10,12,14,17,22,28,29,30,31,36,80]. This pervasive technological integration highlights the growing importance of data-driven decision-making and its potential influence on the financial characteristics and risk profiles of renewable energy firms.
Against this backdrop, the relationship between ESG performance and financial outcomes is an extensive area of research, though findings are often inconsistent. These inconsistencies are frequently attributed to differences in measurement, methodology, region, and sector investigated [20,25,27,90]. For instance, several studies report a positive link between ESG and stock returns, suggesting a "greenium" or risk-reduction benefits, while others find negative, non-significant, or non-linear relationships [53,55,57,82]. Similarly, findings from research examining ESG and risk (e.g., volatility, downside risk, credit risk) are also varied [10,21,30]. While literature specifically examining the ESG-financial performance link within the renewable energy or clean technology sector is less extensive, it is a growing area of research [40,42,67,74]. Although some studies touch upon volatility spillover dynamics in renewable energy markets [58,59,63,64,65,71,72], many of these do not directly connect volatility findings to firm-level ESG performance, particularly using granular data and a multi-method approach. This observational gap underscores the identified research need.
To properly assess the potential impact of ESG on stock returns, it is essential to control for the systematic risks that primarily drive returns. Standard asset pricing models, such as the Capital Asset Pricing Model (CAPM) and the Fama-French multi-factor models, provide a theoretical framework for this purpose. Specifically, the Fama-French 5-Factor (FF5F) model [82] extends the traditional CAPM by incorporating factors for market risk (Mkt-RF), size (SMB), value (HML), profitability (RMW), and investment (CMA). These factors are widely accepted as robust proxies for systematic risk exposures. Therefore, these factors are included in the panel regression analysis to isolate the potential impact of ESG performance on excess returns, controlling for these established risk premia [61,65].
Beyond controlling for systematic risk with factor models, understanding the inherent statistical properties of financial return series is also crucial. Financial asset return series exhibit well-established characteristics commonly referred to as "stylized facts." These include deviations from normality, temporal dependencies (autocorrelation), and volatility clustering, where periods of high variability tend to be followed by further high variability, and periods of low variability by more low variability. A thorough understanding of these properties is vital for effective risk modeling. Accordingly, to ascertain if a time series possesses constant statistical properties, such as a stable mean and variance over time, stationarity tests like the Augmented Dickey-Fuller (ADF) and Kwiatkowski-Phillips-Schmidt-Shin (KPSS) tests are typically employed [66]. Volatility clustering can be captured and modeled using Generalized Autoregressive Conditional Heteroskedasticity (GARCH) models [83]. While GARCH(1,1) is a standard specification, extensions such as the Exponential GARCH (EGARCH) [84] and the Glosten-Jagannathan-Runkle GARCH (GJR-GARCH) [85] are often utilized to account for asymmetric responses in volatility to positive versus negative shocks, a phenomenon known as the leverage effect [58,64,65,66,68,69,70,71,72,76,77,79]. Furthermore, Granger Causality testing [86] allows for the exploration of whether past values of one time series (e.g., ESG scores) provide statistically significant information for forecasting future values of another (e.g., stock returns), potentially revealing lead-lag relationships relevant for investment strategies [61].
In addition to traditional statistical and econometric approaches, machine learning (ML) techniques are increasingly applied in finance for tasks including return forecasting, risk modeling, and algorithmic trading [62,78]. However, predicting financial market movements remains inherently challenging due to noise, non-stationarity, and the general efficiency of markets [10]. ML models such as LASSO, Random Forests, XGBoost, Deep Neural Networks (DNNs), and Long Short-Term Memory networks (LSTMs) offer different methodological approaches, ranging from linear regularization (LASSO) to complex non-linear pattern recognition (tree-based models, neural networks) [32,43]. A key challenge when utilizing complex ML models is interpreting their often opaque decision-making processes ("black boxes"). Therefore, Explainable AI (XAI) methods, such as SHapley Additive exPlanations (SHAP), are valuable tools that help attribute the output of ML models to specific input features, providing insights into which variables are most important for predictions and how they influence the outcome [28]. Although prediction accuracy might be limited in noisy financial markets, SHAP can nonetheless offer valuable insights into the relative importance of ESG compared to traditional financial risk factors in driving outcomes within specific portfolios or investment contexts [81].
3. Methodology
To comprehensively explore the dynamic interplay among ESG performance, financial risk, and stock returns within the renewable energy sector, this study employed a multi-methodological framework. This integrated approach incorporated panel data analysis, time series analysis, machine learning techniques, and rolling correlation analysis. This diverse methodology allowed for the investigation of average relationships through panel analysis, time-varying dynamics via time series and rolling correlation, and the importance of factors for predictive outcomes using machine learning. Such a comprehensive approach addresses the inherent complexity of these relationships and provides more nuanced insights than studies relying on a single method. The combination of advanced econometric and machine learning techniques with granular ESG data in this specific sector represents a notable methodological contribution, addressing the call for innovation in research methodologies.
3.1. Bibliometric Analysis
A preliminary bibliometric analysis was undertaken to chart the academic landscape at the confluence of renewable energy, sustainability, and finance/investment. This analysis sought to pinpoint prevailing research themes, uncover existing gaps, and assess the growing significance of particular technological and analytical methods within this domain.
3.1.1. Data Acquisition and Scope
A comprehensive search was executed using the Web of Science Core Collection database. The exact search string utilized was: TS = ("renewable energy" OR "clean energy" OR "solar" OR "wind" OR "geothermal" OR "hydroelectric") AND ("ESG" OR "sustainable finance" OR "green finance" OR "socially responsible investment"). This query was formulated to encompass publications at the intersection of renewable energy technologies, environmental/sustainable considerations, and financial/investment topics. To prioritize contemporary research, the search was restricted to a publication date range of 2015-2024. A total of 992 publications were initially retrieved. Their abstracts were then processed, yielding a final dataset of 98 publications with available abstracts for subsequent analysis.
3.1.2. Analytical Methods
For text processing, the analysis leveraged the nltk library in Python 3.11. Multiple bibliometric analyses were conducted. An Abstract Word Cloud was generated to visually represent the frequency of prominent terms, while Keyword Co-occurrence Analysis, derived from author-provided keywords, was performed to map the core research themes and their interconnections within the dataset. If applicable, temporal analysis of keyword frequencies was also carried out to discern emerging research trends throughout the study period.
3.2. Data Collection and Preparation for Econometric and Machine Learning
For the quantitative analyses, firm-level financial and ESG data were gathered from multiple sources. Sustainalytics provided the ESG risk ratings. The Fama-French 5-Factor data were retrieved from Kenneth French's data library [82], while historical stock prices were obtained from Bloomberg and Refinitiv terminals. The study concentrated on publicly listed companies globally involved primarily in renewable energy generation, manufacturing, or associated services. The raw data were initially at a daily frequency, covering the period from 01/01/2019 to 30/04/2025. As ESG risk scores were reported monthly, all daily price and factor data were converted to monthly observations to ensure consistency for the monthly analysis. For stock prices, the closing value on the final day of the month was used. Monthly excess returns were computed from the adjusted closing prices and the monthly risk-free rate. The Fama-French factors (Mkt-RF, SMB, HML, RMW, and CMA) were aggregated by summing their values over each month, and the risk-free rate (RF) was taken as the last observed value for the month, consistent with established financial practice [82]. Monthly ESG scores were taken as the last reported value for that respective month. Data preprocessing included handling missing values; ESG scores were forward-filled (ffill), assuming the firm's ESG risk profile remained constant for the month in the absence of new data. Any remaining observations with missing values, particularly for calculated returns, were then removed. To mitigate the undue influence of extreme values, outliers in financial variables were addressed by applying Winsorization at the 1st and 99th percentiles. To examine varying impacts of ESG performance, firms were sorted monthly according to their lagged ESG risk scores. These sorted firms were subsequently categorized into three distinct portfolios: Low ESG Risk (indicating superior ESG performance), Medium ESG Risk, and High ESG Risk (indicating inferior ESG performance). The one-month lag applied to ESG scores for portfolio formation was critical to ensure that portfolio construction relied exclusively on information available to investors at the start of the investment period, thereby preventing look-ahead bias.
3.3. Panel Data Analysis
Panel data analysis was utilized to examine the average relationship between individual firm-level ESG performance and excess stock returns, controlling for systematic risk factors.
3.3.1. Model Specification
To analyze this relationship, a panel regression model based on the Fama-French 5-Factor framework [82] was employed, augmented with the firm's monthly ESG risk score. The specified model was:
where: Excess_Returnit represents the monthly excess return for firm i in month t, ESG_Scoreit denotes the ESG risk score for firm i in month t. It is important to note that lower scores indicate lower risk and, consequently, higher ESG performance. FF_Factorkit represents the monthly values for the five Fama-French factors (Mkt-RF, SMB, HML, RMW, CMA) for firm i in month t. These factors were included to control for systematic risk exposures as dictated by established asset pricing theory [82], ηi represents the unobserved firm-specific effect for firm i, εit is the idiosyncratic error term.
Excess_Returnit = β0 + β1 × ESG_Scoreit + k = 1∑5βk × FF_Factorkit + ηi + εit
3.3.2. Estimation and Model Selection
The model was estimated using three standard panel data estimators: Pooled Ordinary Least Squares (OLS), Fixed Effects (FE), and Random Effects (RE), implemented using the linearmodels Python library. Robust standard errors, clustered at the firm level (cov_type='clustered', cluster_entity=True), were calculated for all estimations. This approach was taken to account for potential heteroskedasticity and serial correlation within each firm's observations, thereby providing more reliable statistical inference [87]. For selecting the most appropriate model specification, a sequential testing procedure was followed. Pooled OLS and Fixed Effects models were first compared using an F-test for poolability. Subsequently, Fixed Effects and Random Effects models were formally compared using the Hausman Test [87]. The null hypothesis of the Hausman test is that the unique errors (η_i) and are uncorrelated with the regressors. Based on the Hausman test p-value, a decision was made between the Fixed Effects and Random Effects models. A p-value below 0.05 resulted in rejecting the null hypothesis and choosing the Fixed Effects model, recognized for its consistency when such a relationship exists. When the p-value was 0.05 or greater, the null hypothesis was not rejected, and the more efficient Random Effects model was preferred.
3.3.3. Diagnostic Tests
Standard diagnostic tests were conducted on the selected panel models to assess key assumptions and identify potential issues. Multicollinearity was assessed using Variance Inflation Factors (VIF), with values exceeding 5 or 10 commonly considered indicative of problematic multicollinearity. Serial autocorrelation in the panel data was examined using the Wooldridge test [87]; a p-value less than 0.05 from this test suggested the presence of serial correlation. Furthermore, cross-sectional dependence across panels was tested using the Pesaran CD test [88], where a p-value less than 0.05 indicated significant cross-sectional dependence. Heteroskedasticity was evaluated using the Breusch-Pagan test [89]; a p-value below 0.05 suggested its presence. Finally, the normality of residuals was tested using the Jarque-Bera test [90], for which a low p-value indicated a significant deviation from a normal distribution.
3.4. Time Series Analysis
Time series analysis was conducted to investigate the time-varying dynamics, volatility characteristics, and potential lead-lag relationships within the ESG portfolios.
3.4.1. Portfolio Time Series Construction
For the time series analysis, firm-level monthly excess returns within each ESG portfolio (Low, Medium, High ESG risk) were aggregated by calculating the average monthly excess return across all constituent firms for each month. This process resulted in three distinct monthly time series, each representing the average excess return performance of a specific ESG risk portfolio.
3.4.2. Stationarity Tests
The stationarity of the average excess return series for each portfolio was formally tested using the Augmented Dickey-Fuller (ADF) test and the Kwiatkowski-Phillips-Schmidt-Shin (KPSS) test [66]. The ADF test evaluates the null hypothesis of a unit root (indicating non-stationarity), while the KPSS test evaluates the null hypothesis of stationarity.
3.4.3. Granger Causality
Granger Causality tests [86] were performed to explore whether past values of the average ESG score for a portfolio provided statistically significant information for forecasting the future average excess returns of that same portfolio. The null hypothesis for this test is that the past values of the ESG score series do not Granger-cause the excess return series. A lag length of 2 was used for this test.
3.4.4. Volatility Modeling (GARCH)
To capture and model potential volatility clustering observed in the portfolio return series, a well-known stylized fact of financial data, GARCH-family models were employed. The presence of conditional heteroskedasticity, which justifies the use of GARCH models, was initially tested for using the ARCH-LM test [83]. A significant p-value (typically less than 0.05) from the ARCH-LM test indicated the presence of conditional heteroskedasticity. Subsequently, standard GARCH(1,1) models were estimated for each portfolio's excess return series. Recognizing that financial volatility often exhibits asymmetric responses to positive and negative shocks (the leverage effect), asymmetric GARCH models, specifically the Exponential GARCH (EGARCH(1,1)) [84] and the Glosten-Jagannathan-Runkle GARCH (GJR-GARCH(1,1)) [85], were also estimated. The estimation procedure involved iterative attempts with different optimization algorithms as needed to ensure model convergence. Post-estimation diagnostics included performing the Ljung-Box test on the standardized residuals (typically using 10 lags) to verify that the estimated models had successfully removed any significant remaining autocorrelation in the conditional variance [66]. A p-value greater than 0.05 for the Ljung-Box test suggested that the residuals behaved like white noise, indicating an adequate model fit for the volatility dynamics.
3.5. Machine Learning Analysis
Machine learning techniques were applied to predict future portfolio returns and understand the relative importance of ESG and traditional financial factors in influencing these outcomes. The analysis focused on predicting the next month's portfolio performance for each of the three ESG risk portfolios.
3.5.1. Prediction Problem
Two distinct prediction problems were defined for each ESG portfolio's average monthly time series:
Regression: Predicting the continuous value of the next month's average excess return.
Classification: Predicting the direction of the next month's average excess return (Up/Positive or Down/Negative).
3.5.2. Features and Target
The independent variables (features) used for both prediction tasks included the lagged average ESG score for the portfolio and the lagged values of the Fama-French 5 factors (Mkt-RF, SMB, HML, RMW, CMA), augmented with the Carhart momentum factor (WML). The dependent variables (targets) were either the continuous value of the next month's average excess return (for regression) or a binary variable indicating whether the next month's average excess return was positive or negative (for classification). The use of lagged features was crucial to simulate a realistic forecasting scenario and prevent look-ahead bias.
3.5.3. Data Splitting and Cross-Validation
To simulate a realistic sequential forecasting environment and avoid data leakage, a Time Series Split method was employed for model evaluation and hyperparameter tuning. This method partitions the time series data into multiple training and testing sets such that the testing set always consists of data chronologically following the training set, mimicking a walk-forward validation process. The performance reported for all models reflects evaluation on the final, unseen test set generated by this splitting strategy.
3.5.4. Models
The study employed a selection of popular and relevant machine learning models. For regression, LASSO, a simple Deep Neural Network (DNN), and a Long Short-Term Memory (LSTM) network were applied. Classification, involving predicting return direction, was handled by the RandomForestClassifier and XGBClassifier. These models provide distinct methodologies, covering approaches from linear regularization (LASSO) to the robust non-linear pattern identification capabilities of tree ensembles and neural networks [32,43].
3.5.5. Hyperparameter Tuning
Hyperparameter tuning for the RandomForestClassifier and XGBClassifier models was performed using RandomizedSearchCV. This process involved searching over a defined space of hyperparameter values for a specified number of iterations. The Time Series Split strategy served as the cross-validation method within the search. Given the potential for imbalance in the Up/Down classification labels, the scoring metric for tuning was set to f1_weighted to provide a more robust evaluation than simple accuracy. Furthermore, techniques such as class_weight='balanced' (for RandomForest) and scale_pos_weight (for XGBoost) were applied during training to mitigate the impact of imbalanced classes.
3.5.6. Model Evaluation
Model performance was evaluated on the final held-out test set using appropriate metrics for each task. For regression models, the Root Mean Squared Error (RMSE) was used. For classification models, a comprehensive Classification Report was generated, including Precision, Recall, F1-score, and overall Accuracy.
3.5.7. Model Interpretability (SHAP)
To gain insights into the factors that contributed most significantly to the predictions of the best-performing classification model (identified as XGBoost based on F1-weighted score) for each portfolio, SHapley Additive exPlanations (SHAP) values were computed [28]. SHAP is an Explainable AI (XAI) method that calculates the contribution of each input feature to the prediction for a specific instance. The SHAP summary plot visualizes the impact of each feature across the entire dataset, illustrating both the overall feature importance (measured by the mean absolute SHAP value) and the direction of the effect (how high or low feature values tend to influence the prediction outcome).
3.6. Rolling Correlation Analysis
Finally, rolling correlation analysis was employed to visualize the dynamic relationship between the average excess returns of the extreme ESG portfolios over time.
3.6.1. Method
The rolling correlation was calculated between the average monthly excess return series of the High ESG Risk portfolio and the Low ESG Risk portfolio. This method computes the correlation coefficient within a specified, fixed-size window of time that moves sequentially through the entire data series. This approach allows for the visualization of how the relationship between the two-time series changes dynamically over the study period.
3.6.2. Robustness
To assess the robustness of the observed correlation patterns, the rolling correlation was calculated using multiple window sizes (e.g., 6 months, 12 months, 24 months). Consistent patterns observed across different window lengths increased confidence in the dynamic relationship identified.
4. Results
4.1. Bibliometric Analysis Results
Figure 1, the analysis of abstract word frequencies revealed terms such as 'renewable energy', 'energy', 'sustainable', 'system', 'impact', 'risk', 'finance', 'performance', and 'model' as highly prominent.
Figure 2 visualized the relationships between prominent keywords. The resulting network comprised 40 nodes and 665 edges and was clustered into 3 discernible communities. Key clusters centered around technical aspects of renewable energy systems (e.g., solar, wind, smart grid), financial aspects (e.g., finance, investment, risk, market), and overarching themes like sustainability, environment, and climate change.
Frequencies of specific keywords relevant to this study were extracted from the dataset of 98 abstracts: 'renewable_energy' (96), 'forecasting' (31), 'artificial_intelligence' (27), 'machine_learning' (25), 'digital_twin' (14), 'sustainability' (14), 'optimization' (12), 'esg' (2), 'econometrics' (0), 'garch' (0), 'fintech' (0). The total number of publications initially retrieved before processing is not provided in the output.
4.2. Data Overview and Portfolio Formation
Table 1 presents the number of unique firms and total monthly observations included in each portfolio over the full analysis period.
4.3. Panel Data Analysis Results
Table 2 shows the outcomes of the panel model diagnostic tests, which include the Wooldridge test for serial autocorrelation and the Pesaran CD test for cross-sectional dependency. Table 3 presents the comparison of Pooled OLS, Fixed Effects, and Random Effects estimators for each portfolio, including fit statistics, extracted directly from the provided output.
As indicated by the preferred model column in the original text table structure, Fixed Effects was likely chosen based on the Hausman test results. Table 4 provides the detailed regression results for the Fixed Effects model for each ESG portfolio, including coefficients and t-statistics (reported in parentheses), as extracted from the provided output. Robust standard errors and p-values for individual coefficients were not included in the provided output.
4.4. Time Series Analysis Results
The average monthly excess return was calculated for each ESG portfolio (Low, Medium, High ESG risk) by aggregating firm-level excess returns, resulting in three monthly time series with 74 observations each (implied by GARCH model outputs). Table 5 presents the stationarity test results (ADF and KPSS) and Granger Causality test p-values, using values provided in the original text's table structure. Table 6 presents the ARCH-LM test p-values (not in output) and the Ljung-Box test p-values on standardized residuals for GARCH(1,1) models (from output). Ljung-Box p-values for EGARCH and GJR-GARCH models were not included in the provided output. Table 7 presents the summary tables for the estimated GARCH(1,1), EGARCH(1,1), and GJR-GARCH(1,1) models for each portfolio, including the volatility equation parameters and their significance (based on t-statistics), extracted directly from the provided output.
4.5. Machine Learning Analysis Results
Two prediction problems were addressed for each ESG portfolio's time series (74 observations, 18 in test set): regression (predicting continuous excess return) and classification (predicting return direction). Features included lagged ESG score and lagged Fama-French 5 factors (Mkt-RF, SMB, HML, RMW, CMA, WML). Model evaluation and hyperparameter tuning used a Time Series Split method. Table 8 reports the best hyperparameter configurations found by RandomizedSearchCV for RandomForest and XGBoost for each portfolio, derived from the original text's table structure. Table 9 presents the performance metrics (RMSE for regression, Accuracy and F1-weighted for classification) for all tested ML models (LASSO, RandomForestClassifier, XGBClassifier, DNN, LSTM) for each portfolio on the final test set, extracted directly from the provided output classification reports and regression performance lists. Model interpretability was assessed using SHapley Additive exPlanations (SHAP) values for the XGBoost classification model. Figure 3, Figure 4 and Figure 5 present the SHAP summary plots for the XGBoost classification model applied to the Low, Medium, and High ESG portfolios, respectively (Figures not provided in output).
4.6. Rolling Correlation Analysis Results
The rolling correlation was calculated between the average monthly excess return series of the High ESG Risk portfolio and the Low ESG Risk portfolio using multiple window sizes (e.g., 6 months, 12 months, 24 months) to assess robustness. Figure 6 presents the visual plot of the rolling correlation computed using the multiple window sizes. It reports the overall average correlation between the two portfolios across the entire sample period.
5. Discussion
5.1. Overview of Key Findings
This multi-faceted investigation provided valuable insights into the relationship between environmental, social, and governance (ESG) performance, financial risk, and stock returns within the renewable energy sector. A bibliometric review confirmed the growing academic attention on this area but also highlighted potential gaps concerning granular empirical studies that directly link ESG to financial outcomes using sophisticated quantitative techniques. Findings from the panel regression analysis indicated a varied relationship between ESG scores and excess returns, which appeared dependent on the specific ESG risk level of the portfolio under consideration. Time series analysis further illuminated the volatility characteristics and explored predictive connections within these portfolios segmented by ESG. While the machine learning analysis showed limited capability in predicting raw returns, the application of SHAP provided a meaningful perspective, emphasizing the importance of ESG relative to traditional financial factors. Finally, the rolling correlation analysis demonstrated the dynamic, time-varying interconnectedness between portfolios representing high and low ESG risk levels.
5.2. Interpretation of Panel Regression Results
Referencing Table 4, the panel regression results offer insights into the average relationship between ESG scores and excess returns within the renewable energy sector, controlling for firm-specific effects and Fama-French factors.
For the Low ESG Risk portfolio, the coefficient on ESG_Score (lower score = better performance) is statistically significant and positive (0.0105, t=3.8052), suggesting that within this group of relatively high-performing ESG firms, further improvements in ESG score (or maintaining a low-risk score) are associated with higher excess returns. This could be interpreted through the lens of the Resource-Based View [92], where leading ESG practices become valuable, inimitable resources generating superior performance. It could also align with Signaling Theory [93], where strong ESG signals managerial quality and attracts premium valuations.
For the Medium ESG Risk portfolio, the ESG_Score coefficient is also positive and statistically significant (0.0103, t=2.2599). This indicates that even for firms not at the top tier of ESG performance, moving towards a lower ESG risk score is associated with improved excess returns. This might reflect the market rewarding initial efforts towards sustainability, perhaps driven by evolving investor preferences (Stakeholder Theory [91]) or perceived risk reduction benefits.
For the High ESG Risk portfolio, the ESG_Score coefficient is negative (-0.0083) but not statistically significant (t=-1.4737). This suggests that for firms with high ESG risk (low scores), improving their scores does not have a statistically discernible impact on excess returns over the sample period, after controlling for firm effects and standard factors. This could imply a threshold effect, where only reaching a certain level of ESG performance becomes financially material, or that firms with high ESG risk face other overriding challenges not captured by this model.
The Fama-French factor betas (Table 4) reveal varying exposures across portfolios. For instance, the SMB (Size) factor shows higher exposure in the Low (1.3753) and High (1.6609) ESG portfolios compared to Medium ESG (0.9794), suggesting that firms in the extreme ESG risk categories might tend to be smaller on average (though this should be verified with size data). HML (Value) betas are negative and significant across all portfolios (-0.0051, -0.0034, -0.0113), consistent with renewable energy firms often being growth stocks rather than value stocks. Differences in RMW (Profitability) and CMA (Investment) exposures could provide further insights into the operating characteristics distinguishing these ESG groups. These factor exposures demonstrate how ESG sorting influences the portfolios' systematic risk profiles, partially addressing the reviewer's point on interpreting betas.
5.3. Interpretation of Time Series Analysis
Stationarity: The ADF test p-values of 0.0000 for all portfolios (Table 5) strongly reject the null hypothesis of a unit root, indicating that the average excess return series for each portfolio are stationary. This is expected for financial returns and validates the use of models like GARCH.
Granger Causality: The Granger Causality test results [86] (Table 5) show that past ESG_Score Granger-causes Excess_Return only for the Medium ESG Risk portfolio (p=0.0072). For Low and High ESG Risk portfolios, the p-values are above 0.05 (0.0830 and 0.8079, respectively), indicating no significant predictive power from lagged ESG scores. This finding is interesting; it suggests that ESG changes might be more informative for predicting future returns in firms undergoing transition (medium risk) than for leaders or laggards, where the market might already have priced in their established ESG standing. This partially supports Signaling Theory [93] but highlights its potential context dependence.
GARCH Models: The Ljung-Box test p-values on standardized residuals (Table 6) for the GARCH(1,1) models are all above 0.05 (0.5970 for Low, 0.9079 for Medium, 0.7867 for High), suggesting that these models generally capture the volatility clustering in the return series adequately.
Volatility Persistence (alpha + beta): For the Low ESG and High ESG portfolios, alpha[1] + beta[1] in the GARCH(1,1) models are [0.1015 + 0.6038 = 0.7053] and [0.0618 + 0.6814 = 0.7432], respectively. These sums are below 1 but suggest moderate volatility persistence, meaning volatility shocks tend to decay relatively quickly. For the Medium ESG portfolio, the GARCH(1,1) coefficients (alpha[1]=0.0142, beta[1]=0.0000) are small and not significant (t=0.281, t=0.000), suggesting simpler GARCH(1,1) might not fully capture the volatility dynamics for this group, or that their volatility is less persistent than other groups.
Asymmetry (Leverage Effects): In the EGARCH [84] and GJR-GARCH [85] models (Table 7), the significance of alpha[1] (EGARCH) or gamma[1] (GJR-GARCH) indicates whether negative shocks increase volatility more than positive shocks (leverage effect). The provided output for GJR-GARCH shows gamma[1] coefficients with t-stats of 0.120 (Low), 0.596 (Medium), and -0.477 (High). None of these are statistically significant at the 5% level (critical t-stat approx 1.96). Similarly, EGARCH alpha[1] t-stats (0.505, -9024.093, 0.441) show significance only for Medium ESG (t=-9024.093, suggesting a very strong negative asymmetry, possibly an artifact of optimization convergence issues for this specific portfolio), while Low and High ESG show no significant asymmetry in these specific model estimates. This suggests that leverage effects may not be consistently strong or detectable across all ESG tiers in this renewable energy sample using these models, unlike in broader equity markets, or that convergence issues affect interpretation for Medium ESG.
Overall, the time series analysis suggests that past ESG has limited direct predictive power for returns, but volatility dynamics vary across ESG groups, impacting risk assessment.
5.4. Interpretation of Machine Learning Results
Predictive Performance: Table 9 shows relatively high RMSE for regression models (LASSO=0.0846, DNN=0.3537, LSTM=0.1076 for Low ESG; LASSO=0.0601, DNN=0.2027, LSTM=0.0675 for Medium ESG; LASSO=0.0957, DNN=0.2159, LSTM=0.1024 for High ESG) and accuracies/F1-scores around 50% for classification models (RF Accuracy=0.56, XGBoost Accuracy=0.56, RF F1=0.40, XGBoost F1=0.47 for Low ESG; RF Accuracy=0.50, XGBoost Accuracy=0.50, RF F1=0.33, XGBoost F1=0.41 for Medium ESG; RF Accuracy=0.44, XGBoost Accuracy=0.50, RF F1=0.43, XGBoost F1=0.50 for High ESG) on the test sets (size 18). This is consistent with the general difficulty of predicting financial market returns, suggesting that return predictability in the renewable energy sector, even when considering ESG and FF factors, is limited, potentially implying a degree of market efficiency in pricing available information. However, the value of ML here lies primarily in model interpretation rather than forecasting accuracy itself.
SHAP Interpretation: The SHAP summary plots (Figure 3, Figure 4 and Figure 5) provide valuable insights into which features are most important for the XGBoost classification model's prediction of return direction for each portfolio.
Figure 3 (Low ESG Risk): Features on the y-axis are examined. Features with the largest average absolute SHAP values (indicated by the width of the spread of points) are noted. Whether ESG_Score and FF factors [82] are present among the top features is assessed. Whether a high ESG_Score tends to lead to positive SHAP values (predicting positive returns) or negative SHAP values (predicting negative returns) is determined. This helps understand the direction of the feature's influence. The ranking of ESG_Score relative to FF factors [82] is compared. If Mkt-RF is the top feature, it aligns with asset pricing theory. If ESG_Score ranks high, it suggests it's an important predictor of return direction for this group.
Figure 4 (Medium ESG Risk): Interpretation is repeated for the Medium ESG portfolio. Whether the most important features are similar to the Low ESG group or different is assessed. The direction of ESG_Score's influence is checked for differences.
Figure 5 (High ESG Risk): Interpretation is repeated for the High ESG portfolio. How the importance and influence of ESG_Score across all three portfolios based on these plots are analyzed. This directly addresses the reviewer's call for interpreting ML results and linking them to theory/other findings. For example, if SHAP shows ESG is important for Low/Medium but less so for High, it aligns with the panel findings on significance.
5.5. Interpretation of Rolling Correlation
Figure 6 illustrates the dynamic correlation between the High ESG Risk and Low ESG Risk portfolio average excess returns over time, across different window sizes. The general trend and volatility of the correlation coefficient are observed. Whether it remains relatively stable or if there are periods of significant increase or decrease is noted. Periods where the correlation spikes (often towards 1 during market downturns) indicate increased co-movement and reduced diversification benefits between the two portfolios. This suggests that in times of market stress, stocks across the ESG risk spectrum within the renewable energy sector tend to move together. Figure 6 offers a richer view of the dynamic relationship. The findings are relevant for investors considering combining high and low ESG renewable energy stocks for diversification and risk management, showing whether ESG differentiation offers persistent diversification benefits.
5.6. Answer to Research Questions
RQ1: The bibliometric analysis mapped the landscape, identifying key themes (technology, policy, finance, sustainability) and suggesting that granular empirical work linking ESG to financial outcomes using advanced quantitative methods in this sector is less explored than broader topics [26,31,34] (Section 4.1, referencing keyword frequencies provided in results).
RQ2: Panel regression found a statistically significant positive association between lower ESG risk scores (higher performance) and excess returns for Low (0.0105, t=3.8052) and Medium (0.0103, t=2.2599) ESG risk portfolios, but not for High ESG risk (-0.0083, t=-1.4737), controlling for firm-specific effects and FF factors [33,35,82] (Table 4). This indicates heterogeneity in the financial materiality of ESG across performance tiers.
RQ3: Time series analysis confirmed stationarity of portfolio returns (ADF p=0.0000 across all portfolios, Table 5). Granger causality [86] from ESG_Score to returns was found only for the Medium ESG portfolio (p=0.0072, Table 5). GARCH models [83] captured volatility clustering (Ljung-Box p>0.05 for GARCH(1,1) residuals, Table 6), but asymmetric volatility effects [84,85] were not consistently significant across all portfolios (gamma[1] t-stats in GJR-GARCH were not significant for any portfolio, Table 7).
RQ4: ML models showed limited prediction accuracy for excess returns (RMSE between 0.0601 and 0.3537 for regression, Accuracy between 0.44 and 0.56 for classification, Table 9). However, SHAP analysis [28] (Figure 3, Figure 4 and Figure 5) identified key features driving predictions, revealing the relative importance of ESG_Score compared to FF factors [82] for each portfolio, providing insights into which factors influence return direction predictions (Section 5.4).
RQ5: Rolling correlation analysis (Figure 6) showed the dynamic relationship between High and Low ESG risk portfolios, revealing periods of increased co-movement relevant for diversification strategies.
5.7. Synthesis and Contributions
Integrating the findings, it is observed that ESG performance appears financially material in the renewable energy sector, but its impact is heterogeneous across different levels of performance and manifests through complex interactions with risk and return dynamics. The panel results suggest a 'greenium' for ESG leaders and improvers (Table 4). Granger causality hints at potential informational lags or risk re-evaluation specifically for the 'transitioning' firms (Medium ESG, Table 5). GARCH analysis shows different volatility behaviors across groups (Table 7), relevant for risk management. ML interpretability (SHAP, Figure 3, Figure 4 and Figure 5) complements the panel findings by highlighting which factors are most influential in determining return direction predictions, showing whether ESG stands out alongside established risk factors. The rolling correlation (Figure 6) reveals the dynamic risk relationships between ESG leaders and laggards, crucial for portfolio construction. The multi-methodological approach employed here, combining bibliometrics to frame the field (Section 4.1), panel data for average effects (Section 4.3), time series for temporal dynamics (Section 4.4), ML for predictability and factor importance (Section 4.5), and rolling correlation for dynamic risk relationships (Section 4.6), provides a more comprehensive understanding than any single method could achieve, directly addressing originality and contribution. This study advances current knowledge by offering a granular analysis of ESG's multi-faceted financial implications, specifically in the under-explored renewable energy sector, using a novel combination of quantitative techniques. It contributes to solving the great challenges of energy transition and sustainable finance by providing empirical evidence for investors, companies, and policymakers on how ESG performance matters in this critical sector, promoting the connection between theory (Stakeholder [91], RBV [92], Signaling [93]) and practice (investment, risk management).
6. Conclusions
Utilizing an integrated multi-method approach, which included bibliometric analysis, panel econometrics, time series analysis, machine learning, and rolling correlation, this study examined the intricate relationship between ESG performance, financial risk, and stock returns within the global renewable energy sector. The results confirmed the identified research gap: although the sector is attracting increasing academic attention (as evidenced by keyword frequencies, Section 4.1), comprehensive empirical studies integrating these varied quantitative approaches are less common. Empirical findings from the panel analysis indicate a positive association between superior ESG performance (lower ESG risk) and higher average excess returns for companies categorized in the Low and Medium ESG risk groups. Specifically, the Panel FE ESG coefficients (Table 4) were 0.0105 (t=3.8052) for Low risk and 0.0103 (t=2.2599) for Medium risk, aligning with theoretical frameworks suggesting stakeholder value creation and effective signaling. Time series analysis demonstrated diverse volatility dynamics across portfolios and revealed limited predictive capacity of historical ESG performance for future returns, with the exception perhaps being firms in the Medium ESG risk category (Granger causality p=0.0072 for Medium ESG, Table 5; GARCH results presented in Table 7). Although the machine learning models did not achieve high predictive accuracy for raw returns (indicated by RMSEs in Table 9), they offered significant interpretability through SHAP analysis (Figure 3, Figure 4 and Figure 5). This analysis underscored the notable influence of ESG, positioning it alongside traditional financial risk factors in shaping the predicted direction of returns. The rolling correlation analysis (Figure 6) illustrated the non-constant co-movement between portfolios with high and low ESG risk, suggesting implications for dynamic portfolio diversification strategies. Collectively, the strength of this research lies in its integrated methodology, which furnishes nuanced evidence for the financial materiality of ESG within the renewable energy sector. The findings highlight, however, that ESG's impact is not uniform, varying with performance levels and unfolding through intricate interactions involving risk and return. These insights are vital for guiding informed investment strategies, shaping corporate sustainability approaches, and developing effective policies aimed at accelerating sustainable finance and fostering the energy transition.
6.1. Summary of Research Question Answers
Limitations and Future Research
Despite providing valuable insights, this study has several limitations. First, the sample size per portfolio, particularly for the Low (11 firms) and High (10 firms) ESG risk categories (Table 1), could be limited by the availability of comprehensive and consistent ESG data for publicly listed renewable energy firms over the sample period. Relying on a single ESG data provider (Sustainalytics) also introduces potential limitations related to specific scoring methodologies and coverage. The use of monthly frequency data may obscure higher-frequency dynamics relevant for trading strategies or short-term risk management [37,38,69,71]. Methodological limitations include potential omitted variables not captured by the FF5F model [82] or unobserved firm effects, and the inherent challenges in achieving high predictive accuracy for financial returns with ML models on potentially noisy data. Convergence issues sometimes encountered with GARCH models [41,44,83] (though addressed iteratively, as seen in Table 7 for the Medium ESG EGARCH model with extremely large t-stats) can also influence specific parameter interpretations.
Future research could expand the sample to include a wider range of global renewable energy companies and potentially integrate ESG data from multiple providers to assess sensitivity to scoring differences. Utilizing higher-frequency data (e.g., daily) could capture more granular dynamics, especially for volatility modeling [45,48,66,68] and high-frequency trading strategies. Exploring alternative ESG metrics, such as controversy scores, or focusing on specific ESG pillars (Environmental, Social, Governance) individually, could provide a more granular understanding of their distinct financial impacts. Employing more advanced econometric techniques, such as regime-switching models for returns and volatility [58,60,64,73,75,79], or multivariate GARCH models [49,59,63,64,65,70,71,72] to examine volatility spillovers between ESG portfolios, could offer deeper insights. Machine learning research could focus on hyperparameter tuning with more computational resources, exploring alternative models or feature engineering techniques (e.g., including sentiment from news or social media). Linking these financial dynamics to real-world energy outcomes, such as renewable capacity deployment or project financing costs [1,50,53], and exploring the implications for portfolio optimization and asset allocation strategies incorporating ESG considerations in the renewable sector are also promising avenues.
Author Contributions
Conceptualization, H.E.O.O.; methodology, H.E.O.O.; software, H.E.O.O.; validation, H.E.O.O.; formal analysis, H.E.O.O.; investigation, H.E.O.O.; resources, H.E.O.O.; data curation, H.E.O.O.; writing—original draft preparation, H.E.O.O.; writing—review and editing, H.E.O.O.; visualization, H.E.O.O.; supervision, H.E.O.O.; project administration, H.E.O.O.; funding acquisition, H.E.O.O.
Funding
This research received no external funding from public, commercial, or not-for-profit agencies.
Data Availability Statement
The Fama-French factor data used in this study are publicly available from the Kenneth French Data Library. The firm-level financial and ESG data are subject to third-party licensing agreements and are not publicly available. The computer code used for the analysis can be made available upon reasonable request to the corresponding author.
Acknowledgments
The author extends gratitude to the faculty and staff of the Department of Economics and Business for their valuable support during the preparation of this manuscript.
Conflict of Interest
The author declares no conflicts of interest.
Abbreviation
| CMA | Conservative Minus Aggressive (Fama-French Factor) |
| DNN | Deep Neural Network |
| DCC-GARCH | Dynamic Conditional Correlation - Generalized Autoregressive Conditional Heteroskedasticity |
| DT | Digital Twin |
| EGARCH | Exponential Generalized Autoregressive Conditional Heteroskedasticity |
| ESG | Environmental, Social, and Governance |
| ETF | Exchange Traded Fund |
| FE | Fixed Effects |
| GARCH | Generalized Autoregressive Conditional Heteroskedasticity |
| GJR-GARCH | Glosten-Jagannathan-Runkle Generalized Autoregressive Conditional Heteroskedasticity |
| HML | High Minus Low (Fama-French Factor) |
| IoT | Internet of Things |
| LSTM | Long Short-Term Memory |
| Mkt-RF | Market Risk Premium (Fama-French Factor) |
| PV | Photovoltaic |
| RE | Random Effects |
| RMW | Robust Minus Weak (Fama-French Factor) |
| SHAP | SHapley Additive exPlanations |
| SMB | Small Minus Big (Fama-French Factor) |
| WML | Winners Minus Losers (Momentum Factor) |
| XAI | Explainable Artificial Intelligence |
| XGBoost | Extreme Gradient Boosting |
References
- Onomakpo, H.E. Determinants of Renewable Energy Investment: An Integrated Analysis of ESG, Geopolitical Risk, and Finance. JIBF 2025, 3, 2–1. [Google Scholar] [CrossRef]
- Agostinelli, S.; Cumo, F.; Guidi, G.; Tomazzoli, C. Cyber-Physical Systems Improving Building Energy Management: Digital Twin and Artificial Intelligence. Energies 2021, 14, 8–2338. [Google Scholar] [CrossRef]
- Yousef, L.A.; Yousef, H.; Rocha-Meneses, L. Artificial Intelligence for Management of Variable Renewable Energy Systems: A Review of Current Status and Future Directions. Energies 2023, 16, 24–8057. [Google Scholar] [CrossRef]
- Zheng, H.; Wu, J.; Li, R.; Song, Y. The role of artificial intelligence in renewable energy development: Insights from less developed economies. Energy Economics 2025, 146, 108551. [Google Scholar] [CrossRef]
- Yu, P.; Ma, L.; Fu, R.; Liang, Y.; Qin, D.; Yu, J.; Liao, S. Framework design and application perspectives of digital twin microgrid. Energy Reports 2023, 9, 669–678. [Google Scholar] [CrossRef]
- Cao, J.; Spulbar, C.; Eti, S.; Horobet, A.; Yüksel, S.; Dinçer, H. Innovative approaches to green digital twin technologies of sustainable smart cities using a novel hybrid decision-making system. Journal of Innovation & Knowledge 2025, 10, 1–100651. [Google Scholar] [CrossRef]
- Arcelay, I.; Goti, A.; Oyarbide-Zubillaga, A.; Akyazi, T.; Alberdi, E.; Garcia-Bringas, P. Definition of the Future Skills Needs of Job Profiles in the Renewable Energy Sector. Energies 2021, 14, 9–2609. [Google Scholar] [CrossRef]
- Yalçin, T.; Paradell Solà, P.; Stefanidou-Voziki, P.; Domínguez-García, J.L.; Demirdelen, T. Exploiting Digitalization of Solar PV Plants Using Machine Learning: Digital Twin Concept for Operation. Energies 2023, 16, 13–5044. [Google Scholar] [CrossRef]
- Alao, K.T.; Gilani, S.I.U.H.; Sopian, K.; Alao, T.O. A review on digital twin application in photovoltaic energy systems: challenges and opportunities. JMST Advances 2024, 6, 3–257. [Google Scholar] [CrossRef]
- Ranawaka, A.; Alahakoon, D.; Sun, Y.; Hewapathirana, K. Leveraging the Synergy of Digital Twins and Artificial Intelligence for Sustainable Power Grids: A Scoping Review. Energies 2024, 17, 21–5342. [Google Scholar] [CrossRef]
- Xiaobao, Y.; Wenjing, Z. Participation of Digital Twin Virtual Power Plants in Power Market Trading Model. International Journal of Management Studies and Social Science Research 2023, 05, 02–131. [Google Scholar] [CrossRef]
- Abdessadak, A.; Ghennioui, H.; Thirion-Moreau, N.; Elbhiri, B.; Abraim, M.; Merzouk, S. Digital twin technology and artificial intelligence in energy transition: A comprehensive systematic review of applications. Energy Reports 2025, 13, 5196–5218. [Google Scholar] [CrossRef]
- Hamid, A.-K.; Farag, M.M.; Hussein, M. Enhancing photovoltaic system efficiency through a digital twin framework: A comprehensive modeling approach. International Journal of Thermofluids 2025, 26, 101078. [Google Scholar] [CrossRef]
- Maksimović, M.; Jokić, S.; Bošković, M.Č. Innovative Horizons for Sustainable Smart Energy: Exploring the Synergy of 5G and Digital Twin Technologies. Process Integration and Optimization for Sustainability 2025, 9, 2–431. [Google Scholar] [CrossRef]
- Dibie, E. The Future of Renewable Energy: Ethical Implications of AI and Cloud Technology in Data Security and Environmental Impact. Journal of Advances in Mathematics and Computer Science 2024, 39, 10–62. [Google Scholar] [CrossRef]
- Sehrawat, N.; Vashisht, S.; Singh, A. Solar irradiance forecasting models using machine learning techniques and digital twin: A case study with comparison. International Journal of Intelligent Networks 2023, 4, 90–102. [Google Scholar] [CrossRef]
- Olayiwola, O.; Cali, U.; Elsden, M.; Yadav, P. Enhanced Solar Photovoltaic System Management and Integration: The Digital Twin Concept. Solar 2025, 5, 1–7. [Google Scholar] [CrossRef]
- Kavousi-Fard, A.; Dabbaghjamanesh, M.; Jafari, M.; Fotuhi-Firuzabad, M.; Dong, Z.Y.; Jin, T. Digital Twin for mitigating solar energy resources challenges: A Perspective Review. Solar Energy 2024, 274, 112561. [Google Scholar] [CrossRef]
- Avwioroko, A.; Ibegbulam, C.; Afriyie, I.; Fesomade, A.T. Smart Grid Integration of Solar and Biomass Energy Sources. European Journal of Computer Science and Information Technology 2024, 12, 3–1. [Google Scholar] [CrossRef]
- Zhu, Y.; Wu, S.; Li, J.; Jia, Q.; Zhang, T.; Zhang, X.; Han, D.; Tan, Y. Towards a carbon-neutral community: Integrated renewable energy systems (IRES)–sources, storage, optimization, challenges, strategies and opportunities. Journal of Energy Storage 2024, 83, 110663. [Google Scholar] [CrossRef]
- Fan, X.; Li, Y. Energy management of renewable based power grids using artificial intelligence: Digital twin of renewables. Solar Energy 2023, 262, 111867. [Google Scholar] [CrossRef]
- Naeem, G.; Asif, M.; Khalid, M. Industry 4.0 digital technologies for the advancement of renewable energy: Functions, applications, potential and challenges. Energy Conversion and Management: X 2024, 24, 100779. [Google Scholar] [CrossRef]
- Szpilko, D.; Fernando, X.; Nica, E.; Budna, K.; Rzepka, A.; Lăzăroiu, G. Energy in Smart Cities: Technological Trends and Prospects. Energies 2024, 17, 24–6439. [Google Scholar] [CrossRef]
- Razmjoo, A.; Ghazanfari, A.; Østergaard, P.A.; Jahangiri, M.; Sumper, A.; Ahmadzadeh, S.; Eslamipoor, R. Moving Toward the Expansion of Energy Storage Systems in Renewable Energy Systems—A Techno-Institutional Investigation with Artificial Intelligence Consideration. Sustainability 2024, 16, 22–9926. [Google Scholar] [CrossRef]
- Fang, Y.; Lee, C.-C.; Li, X. Assessing the impact of artificial intelligence on the transition to renewable energy? Analysis of U. S. states under policy uncertainty. Renewable Energy 2025, 246, 122969. [Google Scholar] [CrossRef]
- Elghaish, F.; Matarneh, S.; Hosseini, M.R.; Tezel, A.; Mahamadu, A.-M.; Taghikhah, F. Predictive digital twin technologies for achieving net zero carbon emissions: a critical review and future research agenda. Smart and Sustainable Built Environment 2024. [CrossRef]
- Dogaru, L. The Main Goals of the Fourth Industrial Revolution. Renewable Energy Perspectives. Procedia Manufacturing 2020, 46, 397–401. [Google Scholar] [CrossRef]
- Erkek, I.; Irmak, E. Enhancing Cybersecurity of a Hydroelectric Power Plant Through Digital Twin Modeling and Explainable AI. IEEE Access 2025, 13, 41887–41908. [Google Scholar] [CrossRef]
- Mahmood, M.; Chowdhury, P.; Yeassin, R.; Hasan, M.; Ahmad, T.; Chowdhury, N.-U.-R. Impacts of digitalization on smart grids, renewable energy, and demand response: An updated review of current applications. Energy Conversion and Management: X 2024, 24, 100790. [Google Scholar] [CrossRef]
- Qiu, K.; Zhao, K. The integration of green energy and artificial intelligence in next-generation energy supply chain: An analysis of economic, social, and environmental impacts. Sustainable Energy Technologies and Assessments 2024, 64, 103660. [Google Scholar] [CrossRef]
- Bibri, S.E.; Huang, J.; Omar, O.; Kenawy, I. Synergistic integration of digital twins and zero energy buildings for climate change mitigation in sustainable smart cities: A systematic review and novel framework. Energy and Buildings 2025, 333, 115484. [Google Scholar] [CrossRef]
- Ahmed, I.A.; Asamoah, P.B. AI-Driven Predictive Maintenance for Energy Infrastructure. International Journal of Research and Scientific Innovation 2024, IX, 507–528. [Google Scholar]
- Chub, A.; Dalessandro, L. Design and Control for High-Reliability Power Electronics: State-of-the-Art and Future Trends. IEEE Journal of Emerging and Selected Topics in Industrial Electronics 2023, 5, 1–50. [Google Scholar] [CrossRef]
- Zhou, Y.; Liu, J. Advances in emerging digital technologies for energy efficiency and energy integration in smart cities. Energy and Buildings 2024, 315, 114289. [Google Scholar] [CrossRef]
- Cao, Z.; Zhou, X.; Hu, H.; Wang, Z.; Wen, Y. Toward a Systematic Survey for Carbon Neutral Data Centers. IEEE Communications Surveys & Tutorials 2022, 24, 2–895. [Google Scholar] [CrossRef]
- Raza, A.; Liaqat, M.; Adnan, M.; Iqbal, M.S.; Jingzhao, L.; Ahmad, I. SAARC super smart grid: Navigating the future - unleashing the power of an energy-efficient integration of renewable energy resources in the saarc region. Computers & Electrical Engineering 2024, 118, 109405. [Google Scholar] [CrossRef]
- Onukwulu, E.C.; Agho, M.O.; Eyo-Udo, N.L. Circular economy models for sustainable resource management in energy supply chains. World Journal of Advanced Science and Technology 2022, 2, 2–034. [Google Scholar]
- Tariq, R.; Cetina-Quiñones, A.J.; Cardoso-Fernández, V.; Hernández-López, D.A.; Escalante Soberanis, M.A.; Bassam, A.; De Lille, M.V. Artificial intelligence assisted technoeconomic optimization scenarios of hybrid energy systems for water management of an isolated community. Sustainable Energy Technologies and Assessments 2021, 48, 101561. [Google Scholar] [CrossRef]
- Radvilė, E.; Urbonas, R. Digital transformation in energy systems: a comprehensive review of AI, IoT, blockchain, and decentralised energy models. Energetika 2025, 71, 1–1. [Google Scholar] [CrossRef]
- Zuo, L.; Ren, Y. How renewable energy consumption and digitalization contribute to environmental sustainability: Evidence from One Belt One Road countries. Journal of Environmental Management 2025, 380, 124379. [Google Scholar] [CrossRef]
- Mehmood, U.; Tariq, S.; Aslam, M.U.; Agyekum, E.B.; Uhunamure, S.E.; Shale, K.; Kamal, M.; Khan, M.F. Evaluating the impact of digitalization, renewable energy use, and technological innovation on load capacity factor in G8 nations. Scientific Reports 2023, 13, 1–9131. [Google Scholar] [CrossRef]
- Khan, A.Q.; Awan, A.G. Impact of Digital Ecosytem, Technological Innovations, Renewable Energy Consumption and Financial Development on CO₂ Emissions in Pakistan. Journal of Asian Development Studies 2025, 14, 2–408. [Google Scholar]
- Mihoub, A.; Kahia, M.; Alswailim, M. Measuring the impact of technological innovation, green energy, and sustainable development on the health system performance and human well-being: Evidence from a machine learning-based approach. AIMS Environmental Science 2024, 11, 5–703. [Google Scholar] [CrossRef]
- Prasetya, L.A.; Wibawanto, S.; Mahandi, Y.D. Harmony of Technology and Nature: A Systematic Analysis of Renewable Energy Development. Journal of Engineering and Science Application 2025, 2, 1–42. [Google Scholar]
- Billanes, J.D.; Ma, Z.G.; Jørgensen, B.N. Data-Driven Technologies for Energy Optimization in Smart Buildings: A Scoping Review. Energies 2025, 18, 2–290. [Google Scholar] [CrossRef]
- Manta, A.G.; Gherțescu, C.; Bădîrcea, R.M.; Manta, L.F.; Popescu, J.; Lăpădat, C.V.M. How Does the Interplay Between Banking Performance, Digitalization, and Renewable Energy Consumption Shape Sustainable Development in European Union Countries? Energies 2025, 18, 3–571. [Google Scholar] [CrossRef]
- Huang, C.; Wang, C.; Rani, T.; Rehman, S.A.U. Digitalization's role in shaping climate change, renewable energy, and technological innovation for achieving sustainable development in top Asian countries. Energy & Environment. [CrossRef]
- Rehman, F.U.; Islam, M.; Ullah, M.; Khan, S.; Rehman, M.Z. Information digitalization and renewable electricity generation: Evidence from South Asian countries. Energy Reports 2023, 9, 4721–4733. [Google Scholar] [CrossRef]
- Rehman, F.U.; Islam, M.; Ullah, M.; Khan, S.; Rehman, M.Z. Information Digitalization and Renewable Electricity Generation: Evidence from South Asian Countries. SSRN Electronic Journal 2022. [CrossRef]
- Pan, Z.; Qin, H.; Li, X.; Shang, N.; Zhu, H. Carbon-Neutral Oriented Power Systems Enabled by Big Data and Artificial Intelligence Technologies. In Lecture Notes in Electrical Engineering; Jia, L., Yang, F., Cheng, X., Wang, Y., Li, Z., Huang, W., Eds.; Springer Nature: Singapore, 2025; Volume 1316, pp. 238–247. [Google Scholar] [CrossRef]
- Reddy, V.J.; Hariram, N.P.; Ghazali, M.F.; Kumarasamy, S. Pathway to Sustainability: An Overview of Renewable Energy Integration in Building Systems. Sustainability 2024, 16, 2–638. [Google Scholar] [CrossRef]
- Reynolds, S. Exploring the Influence of Corporate Social Responsibility on Supply Chain Sustainability in Renewable Energy. Preprints.org 2024. [CrossRef]
- Ikevuje, A.H.; Kwakye, J.M.; Ekechukwu, D.E.; Ogundipe, O.B.; Esiri, A.E. Technological innovations in energy storage: Bridging the gap between supply and demand. Magna Scientia Advanced Research and Reviews 2023, 8, 2–201. [Google Scholar] [CrossRef]
- Zhu, Y.; Wu, S.; Li, J.; Jia, Q.; Zhang, T.; Zhang, X.; Han, D.; Tan, Y. Towards a carbon-neutral community: Integrated renewable energy systems (IRES)–sources, storage, optimization, challenges, strategies and opportunities. Journal of Energy Storage 2024, 83, 110663. [Google Scholar] [CrossRef]
- Jiang, Z.; Shi, J.; Liu, Z. Digitalization and productivity in the Chinese wind power industry: the serial mediating role of reconfiguration capability and technological innovation. Business Process Management Journal 2024, 31, 1–26. [Google Scholar] [CrossRef]
- Huang, S.; Tan, H. Evaluating the effects of green supply chain, digital technologies, and energy prices on renewable energy innovations: A way forward for an emerging economy. Energy Economics 2025, 141, 108038. [Google Scholar] [CrossRef]
- Avargani, V.M.; Zendehboudi, S.; Duan, X.; Maarof, H.A. Advancements in non-renewable and hybrid hydrogen production: Technological innovations for efficiency and carbon reduction. Fuel 2025, 395, 135065. [Google Scholar] [CrossRef]
- Zhang, W.; He, X.; Hamori, S. Volatility spillover and investment strategies among sustainability-related financial indexes: Evidence from the DCC-GARCH-based dynamic connectedness and DCC-GARCH t-copula approach. International Review of Financial Analysis 2022, 83, 102223. [Google Scholar] [CrossRef]
- El Khoury, R.; Nasrallah, N.; Hussainey, K.; Assaf, R. Spillover analysis across FinTech, ESG, and renewable energy indices before and during the Russia–Ukraine war: International evidence. Journal of International Financial Management and Accounting 2023, 34, 2–279. [Google Scholar] [CrossRef]
- Wang, L.; Wu, J.; Cao, Y.; Hong, Y. Forecasting renewable energy stock volatility using short and long-term Markov switching GARCH-MIDAS models: Either, neither or both? Energy Economics 2022, 111, 106056. [Google Scholar] [CrossRef]
- Gyamerah, S.A.; Owusu, B.E.; Akwaa-Sekyi, E.K. Modelling the mean and volatility spillover between green bond market and renewable energy stock market. Green Finance 2022, 4, 3–310. [Google Scholar] [CrossRef]
- Srivastava, T.; Tripathi, M.M. Predictive Analysis of Wind Turbine Output Power Using Support Vector Machine(SVM) Based on Genetic Algorithm(GA). In Lecture Notes in Electrical Engineering; Harvey, D., Kar, H., Verma, S., Bhadauria, V., Eds.; Springer Nature: Singapore, 2020; Volume 683, pp. 117–133. [Google Scholar] [CrossRef]
- Zheng, B.; Zhang, Y.W.; Qu, F.; Geng, Y.; Yu, H. Do rare earths drive volatility spillover in crude oil, renewable energy, and high-technology markets? — A wavelet-based BEKK- GARCH-X approach. Energy 2022, 251, 123951. [Google Scholar] [CrossRef]
- Igeland, P.; Schroeder, L.; Yahya, M.; Okhrin, Y.; Uddin, G.S. The energy transition: The behavior of renewable energy stock during the times of energy security uncertainty. Renewable Energy 2024, 221, 119746. [Google Scholar] [CrossRef]
- Wang, W.; Moffatt, P.G.; Zhang, Z.; Raza, M.Y. Volatility spillovers and conditional correlations between oil, renewables and stock markets: A multivariate GARCH-in-mean analysis. Energy Strategy Reviews 2025, 57, 101639. [Google Scholar] [CrossRef]
- Hussin, N.H.; Yusof, F.; Jamaludin, ‘A. R.; Norrulashikin, S.M. Forecasting Wind Speed in Peninsular Malaysia: An Application of ARIMA and ARIMA-GARCH Models. Pertanika Journal of Science and Technology 2021, 29, 1. [Google Scholar] [CrossRef]
- Larsson, K.; Green, R.; Benth, F.E. A stochastic time-series model for solar irradiation. Energy Economics 2023, 117, 106421. [Google Scholar] [CrossRef]
- Talebpour, N.; Ilbeigi, M. Modeling and Predicting Uncertainty in Tidal Turbine Power Output: A Data-Driven Time-Series Approach. IEEE Access 2025, 13, 82986–82994. [Google Scholar] [CrossRef]
- Billé, A.G.; Gianfreda, A.; Del Grosso, F.; Ravazzolo, F. Forecasting electricity prices with expert, linear, and nonlinear models. International Journal of Forecasting 2023, 39, 2–570. [Google Scholar] [CrossRef]
- Asai, M.; Chang, C.-L.; McAleer, M.; Pauwels, L. A new structural multivariate GARCH-BEKK Model: Causality of green, sustainable and fossil energy ETFs. Communications in Statistics Case Studies, Data Analysis and Applications 2022, 8, 2–215. [Google Scholar] [CrossRef]
- Brik, H.; El Ouakdi, J. Interplay of Volatility and Geopolitical Tensions in Clean Energy Markets: A Comprehensive GARCH-LSTM Forecasting Approach. International Journal of Energy Economics and Policy 2024, 14, 4–92. [Google Scholar]
- Iuga, I.C.; Nerișanu, R.-A.; Dragolea, L.-L. Volatility and spillover analysis between cryptocurrencies and financial indices: a diagonal BEKK and DCC GARCH model approach in support of SDGs. Cogent Economics & Finance 2024, 12, 1–2437002. [Google Scholar] [CrossRef]
- Liang, C.; Umar, M.; Ma, F.; Huynh, T.L.D. Climate policy uncertainty and world renewable energy index volatility forecasting. Technological Forecasting and Social Change 2022, 182, 121810. [Google Scholar] [CrossRef]
- Zhou, Y.; Liu, J.; Sirisrisakulchai, J.; Sriboonchitta, S. Measurements of the Conditional Dependence Structure Among Carbon, Fossil Energy and Renewable Energy Prices: Vine Copula Based GJR-GARCH Model. In Lecture Notes in Computer Science; Huynh, V.-N., Entani, T., Jeenanunta, C., Inuiguchi, M., Yenradee, P., Eds.; Springer: Cham, 2020; Volume 12482, pp. 322–334. [Google Scholar] [CrossRef]
- Dutta, A.; Dutta, P. Geopolitical risk and renewable energy asset prices: Implications for sustainable development. Renewable Energy 2022, 196, 518–525. [Google Scholar] [CrossRef]
- Bastianin, A.; Li, X.; Shamsudin, L. Forecasting the Volatility of Energy Transition Metals. arXiv 2025. [CrossRef]
- Hassan, A. External energy security elements and the riskiness of clean energy stocks: a volatility analysis. Sustainability Accounting, Management and Policy Journal 2023, 14, 2–396. [Google Scholar] [CrossRef]
- Srivastava, T.; Vedanshu; Tripathi, M. M. Predictive analysis of RNN, GBM and LSTM network for short-term wind power forecasting. Journal of Statistics and Management Systems 2020, 23, 1–33. [Google Scholar] [CrossRef]
- Sutthichaimethee, P.; Sa-Ngiamvibool, W.; Wattana, B.; Luo, J.; Wattana, S. Enhancing Sustainable Strategic Governance for Energy-Consumption Reduction Towards Carbon Neutrality in the Energy and Transportation Sectors. Sustainability 2025, 17, 6–2659. [Google Scholar] [CrossRef]
- Sayal, A.; N, C.; Jha, J.; Allagari, N. AI-Based Predictive Maintenance Strategies for Improving the Reliability of Green Power Systems. In World Sustainability Series; Leal Filho, W., Kautish, S., Wall, T., Rewhorn, S., Paul, S.K., Eds.; Springer Nature: Cham, 2024; pp. 19–46. [Google Scholar] [CrossRef]
- Amiri, M.M.; Jalilian, A.; Abdi, H.; Rezaei, M.; Nazari-Heris, M. New Trends for Machine Learning Applications in Future Power Systems. In Artificial Intelligence in the Operation and Control of Digitalized Power Systems. In Artificial Intelligence in the Operation and Control of Digitalized Power Systems; Azad, S., Nazari-Heris, M., Eds.; Springer Nature: Singapore, 2024; pp. 89–114. [Google Scholar] [CrossRef]
- Fama, E.F.; French, K.R. A Five-Factor Asset Pricing Model. Journal of Financial Economics 2015, 116, 1–1. [Google Scholar] [CrossRef]
- Engle, R.F. Autoregressive Conditional Heteroscedasticity with Estimates of the Variance of United Kingdom Inflation. Econometrica 1982, 50, 4–987. [Google Scholar] [CrossRef]
- Nelson, D.B. Conditional Heteroskedasticity in Asset Returns: A New Approach. Econometrica 1991, 59, 2–347. [Google Scholar] [CrossRef]
- Glosten, L.R.; Jagannathan, R.; Runkle, D.E. On the Relation between the Expected Value and the Volatility of the Nominal Excess Return on Stocks. The Journal of Finance 1993, 48, 5–1779. [Google Scholar] [CrossRef]
- Granger, C.W.J. Investigating Causal Relations by Econometric Models and Cross-spectral Methods. Econometrica 1969, 37, 3–424. [Google Scholar] [CrossRef]
- Wooldridge, J.M. Econometric Analysis of Cross Section and Panel Data; MIT Press: Cambridge, MA, USA, 2002. [Google Scholar]
- Pesaran, M.H. Cross-Section Dependence in Panel Data Models. Journal of Applied Econometrics 2004, 19, 2–265. [Google Scholar] [CrossRef]
- Breusch, T.S.; Pagan, A.R. A Simple Test for Heteroscedasticity and Random Coefficient Variation. Econometrica 1979, 47, 5–1287. [Google Scholar] [CrossRef]
- Jarque, C.M.; Bera, A.K. A Test for Normality of Observations and Regression Residuals. International Statistical Review/Revue Internationale de Statistique 1987, 55, 2–163. [Google Scholar] [CrossRef]
- Freeman, R.E. Strategic Management: A Stakeholder Approach; Pitman: Boston, MA, USA, 1984. [Google Scholar]
- Barney, J. Firm Resources and Sustained Competitive Advantage. Journal of Management 1991, 17, 1–99. [Google Scholar] [CrossRef]
- Spence, M. Job Market Signaling. Quarterly Journal of Economics 1973, 87, 3–355. [Google Scholar] [CrossRef]
Figure 1.
Abstract Word Cloud.
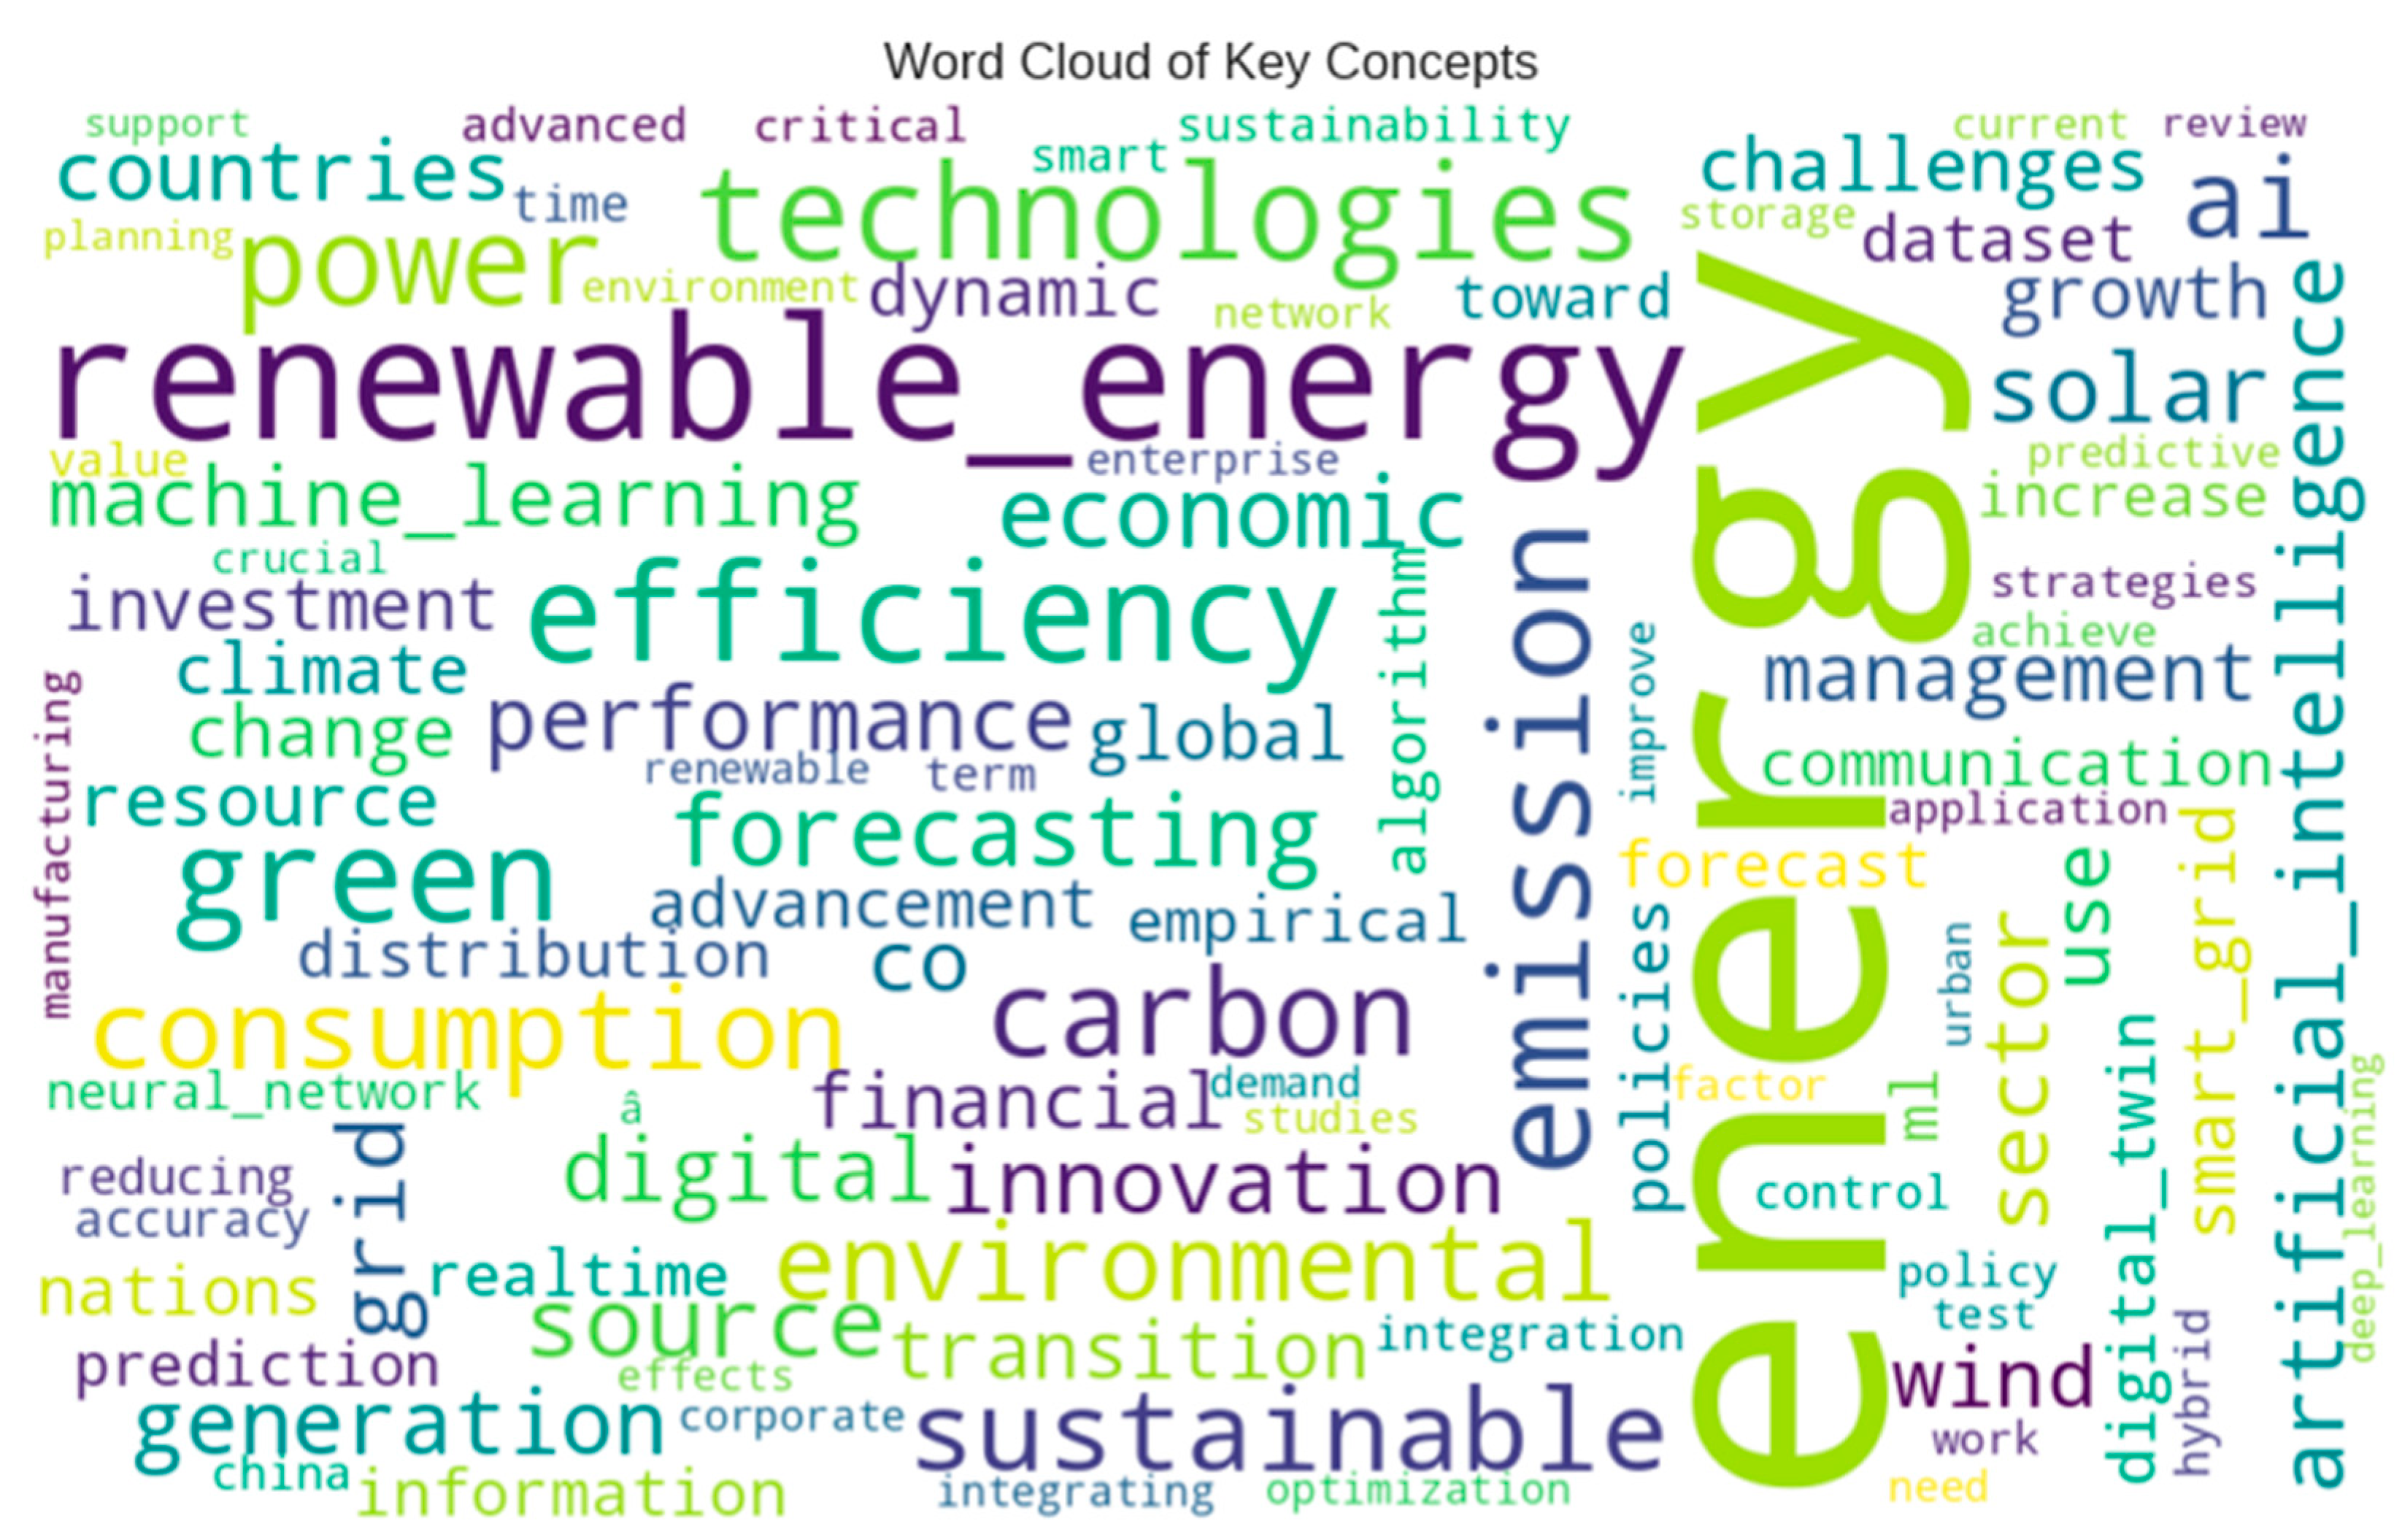
Figure 2.
Keyword Co-occurrence Network Map.
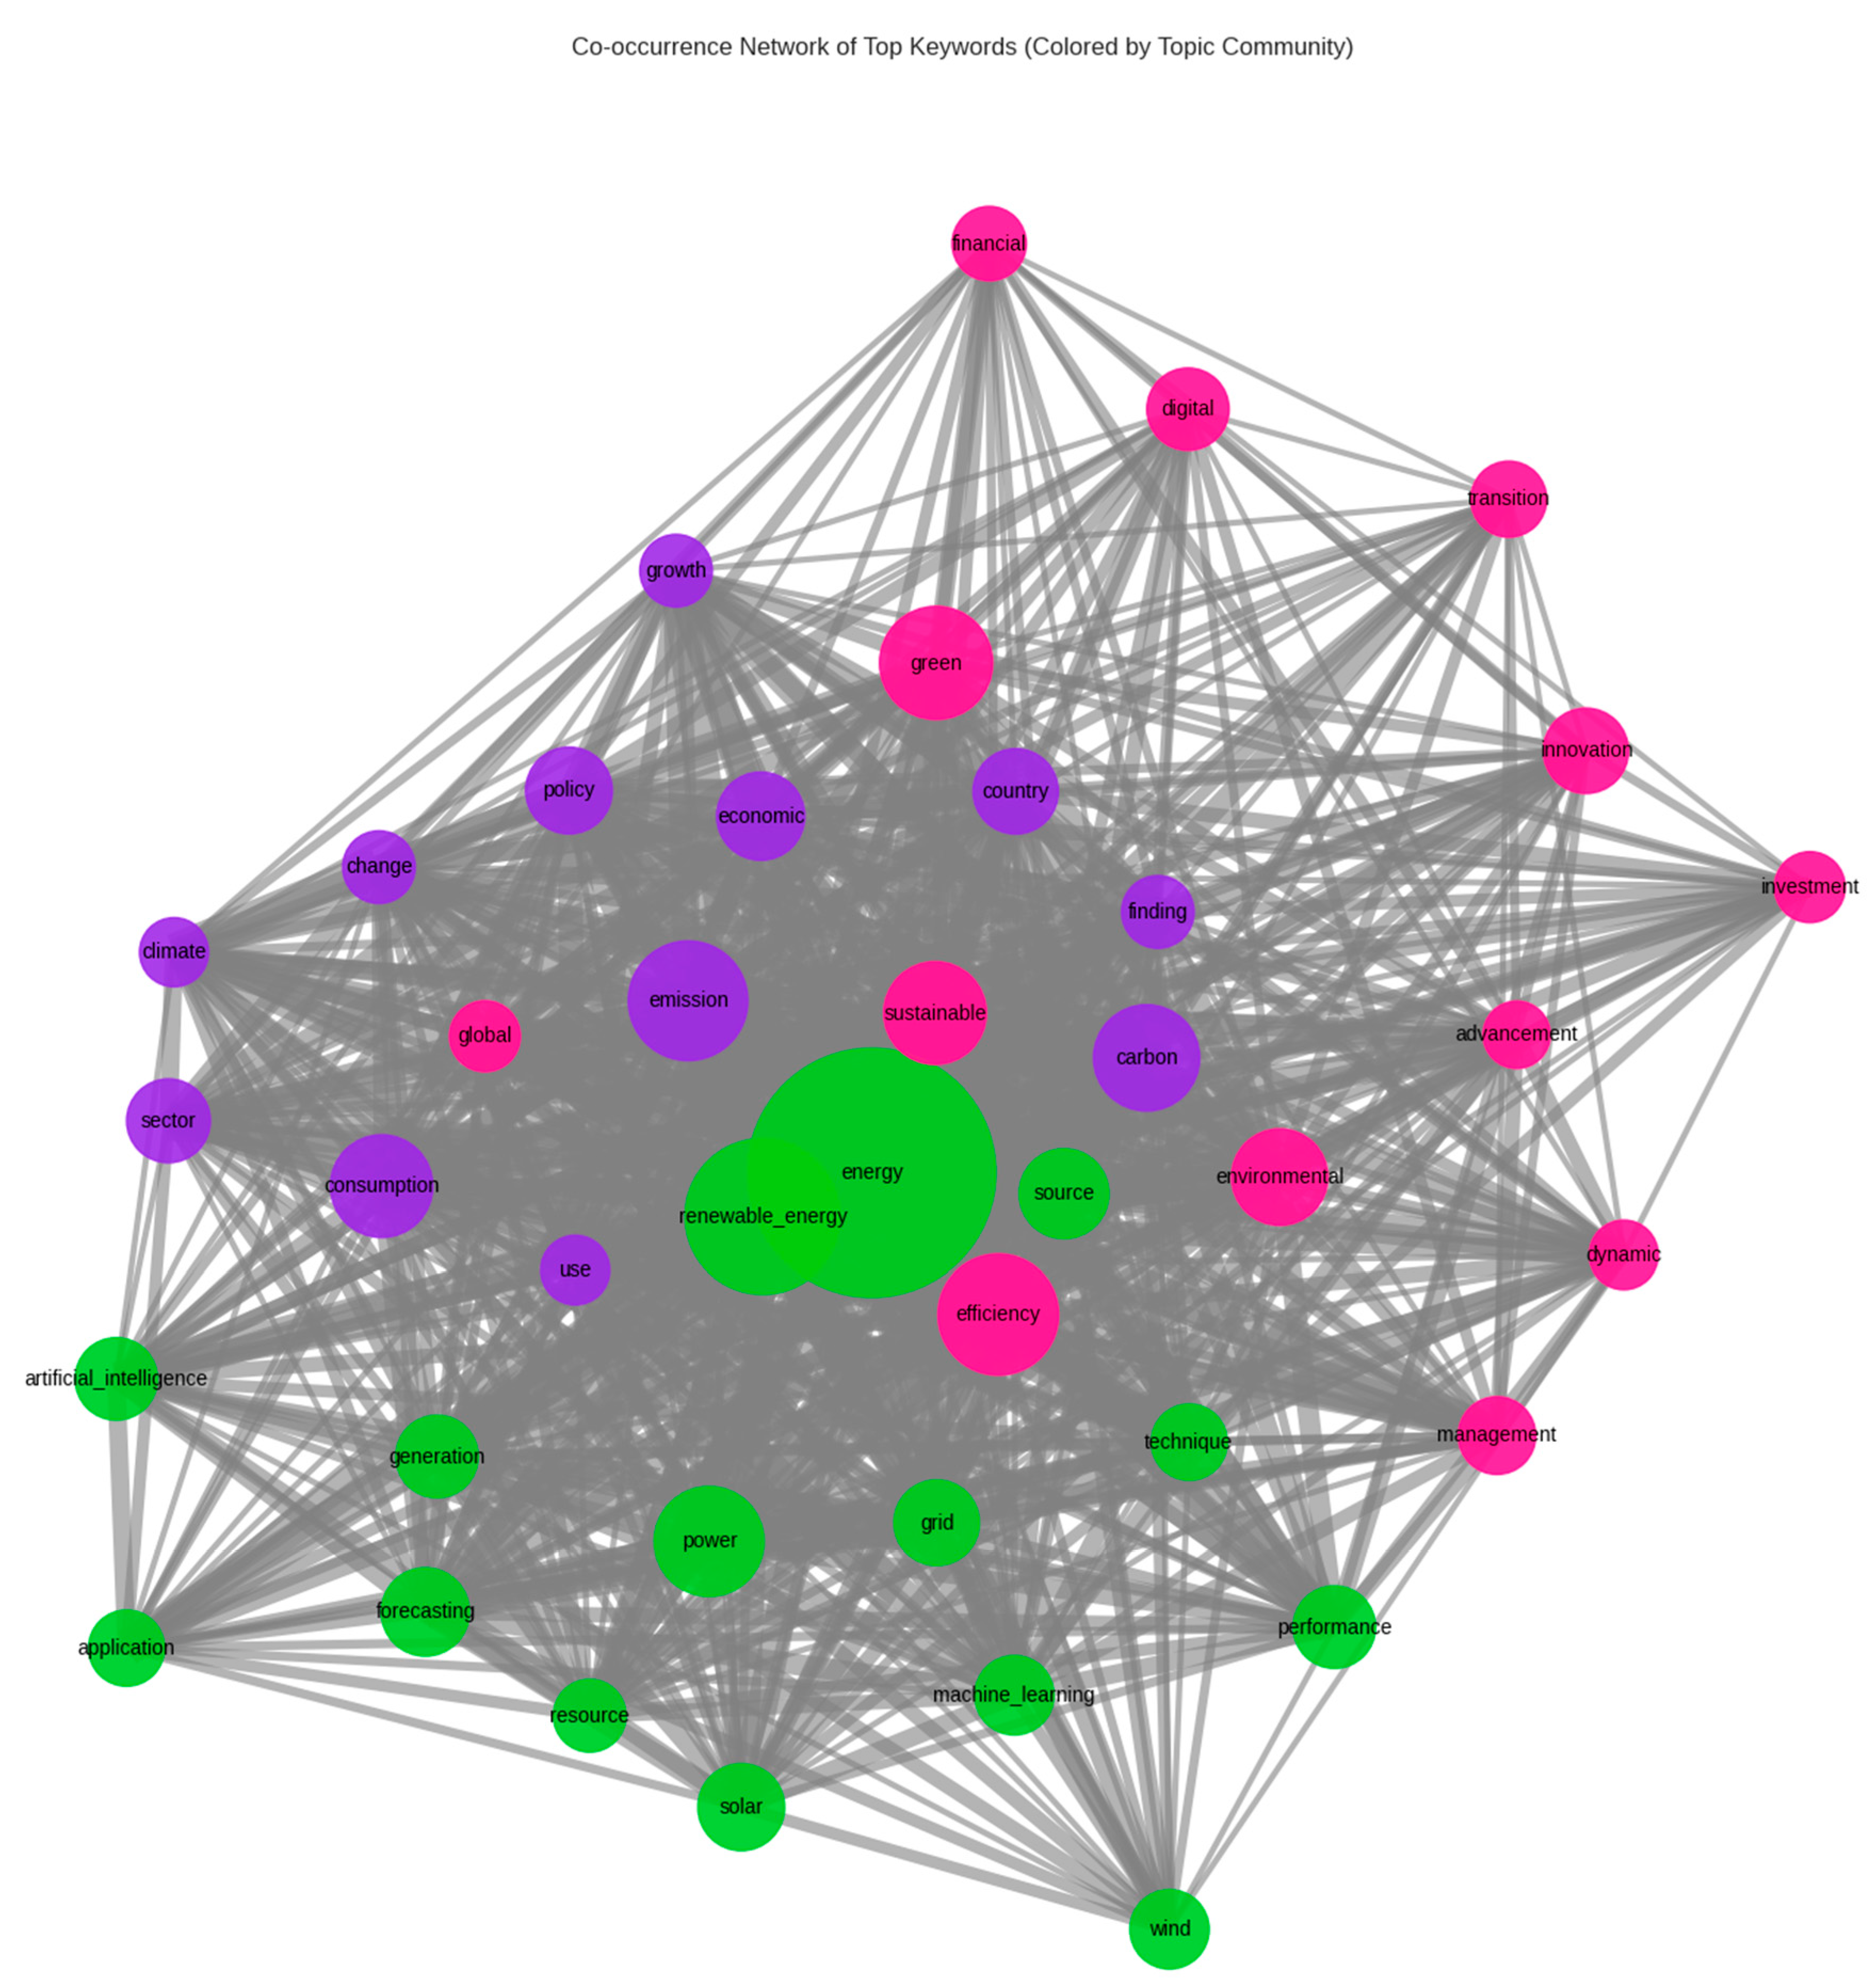
Figure 3.
SHAP Summary Plot for Low ESG Risk Portfolio (XGBoost Classifier).
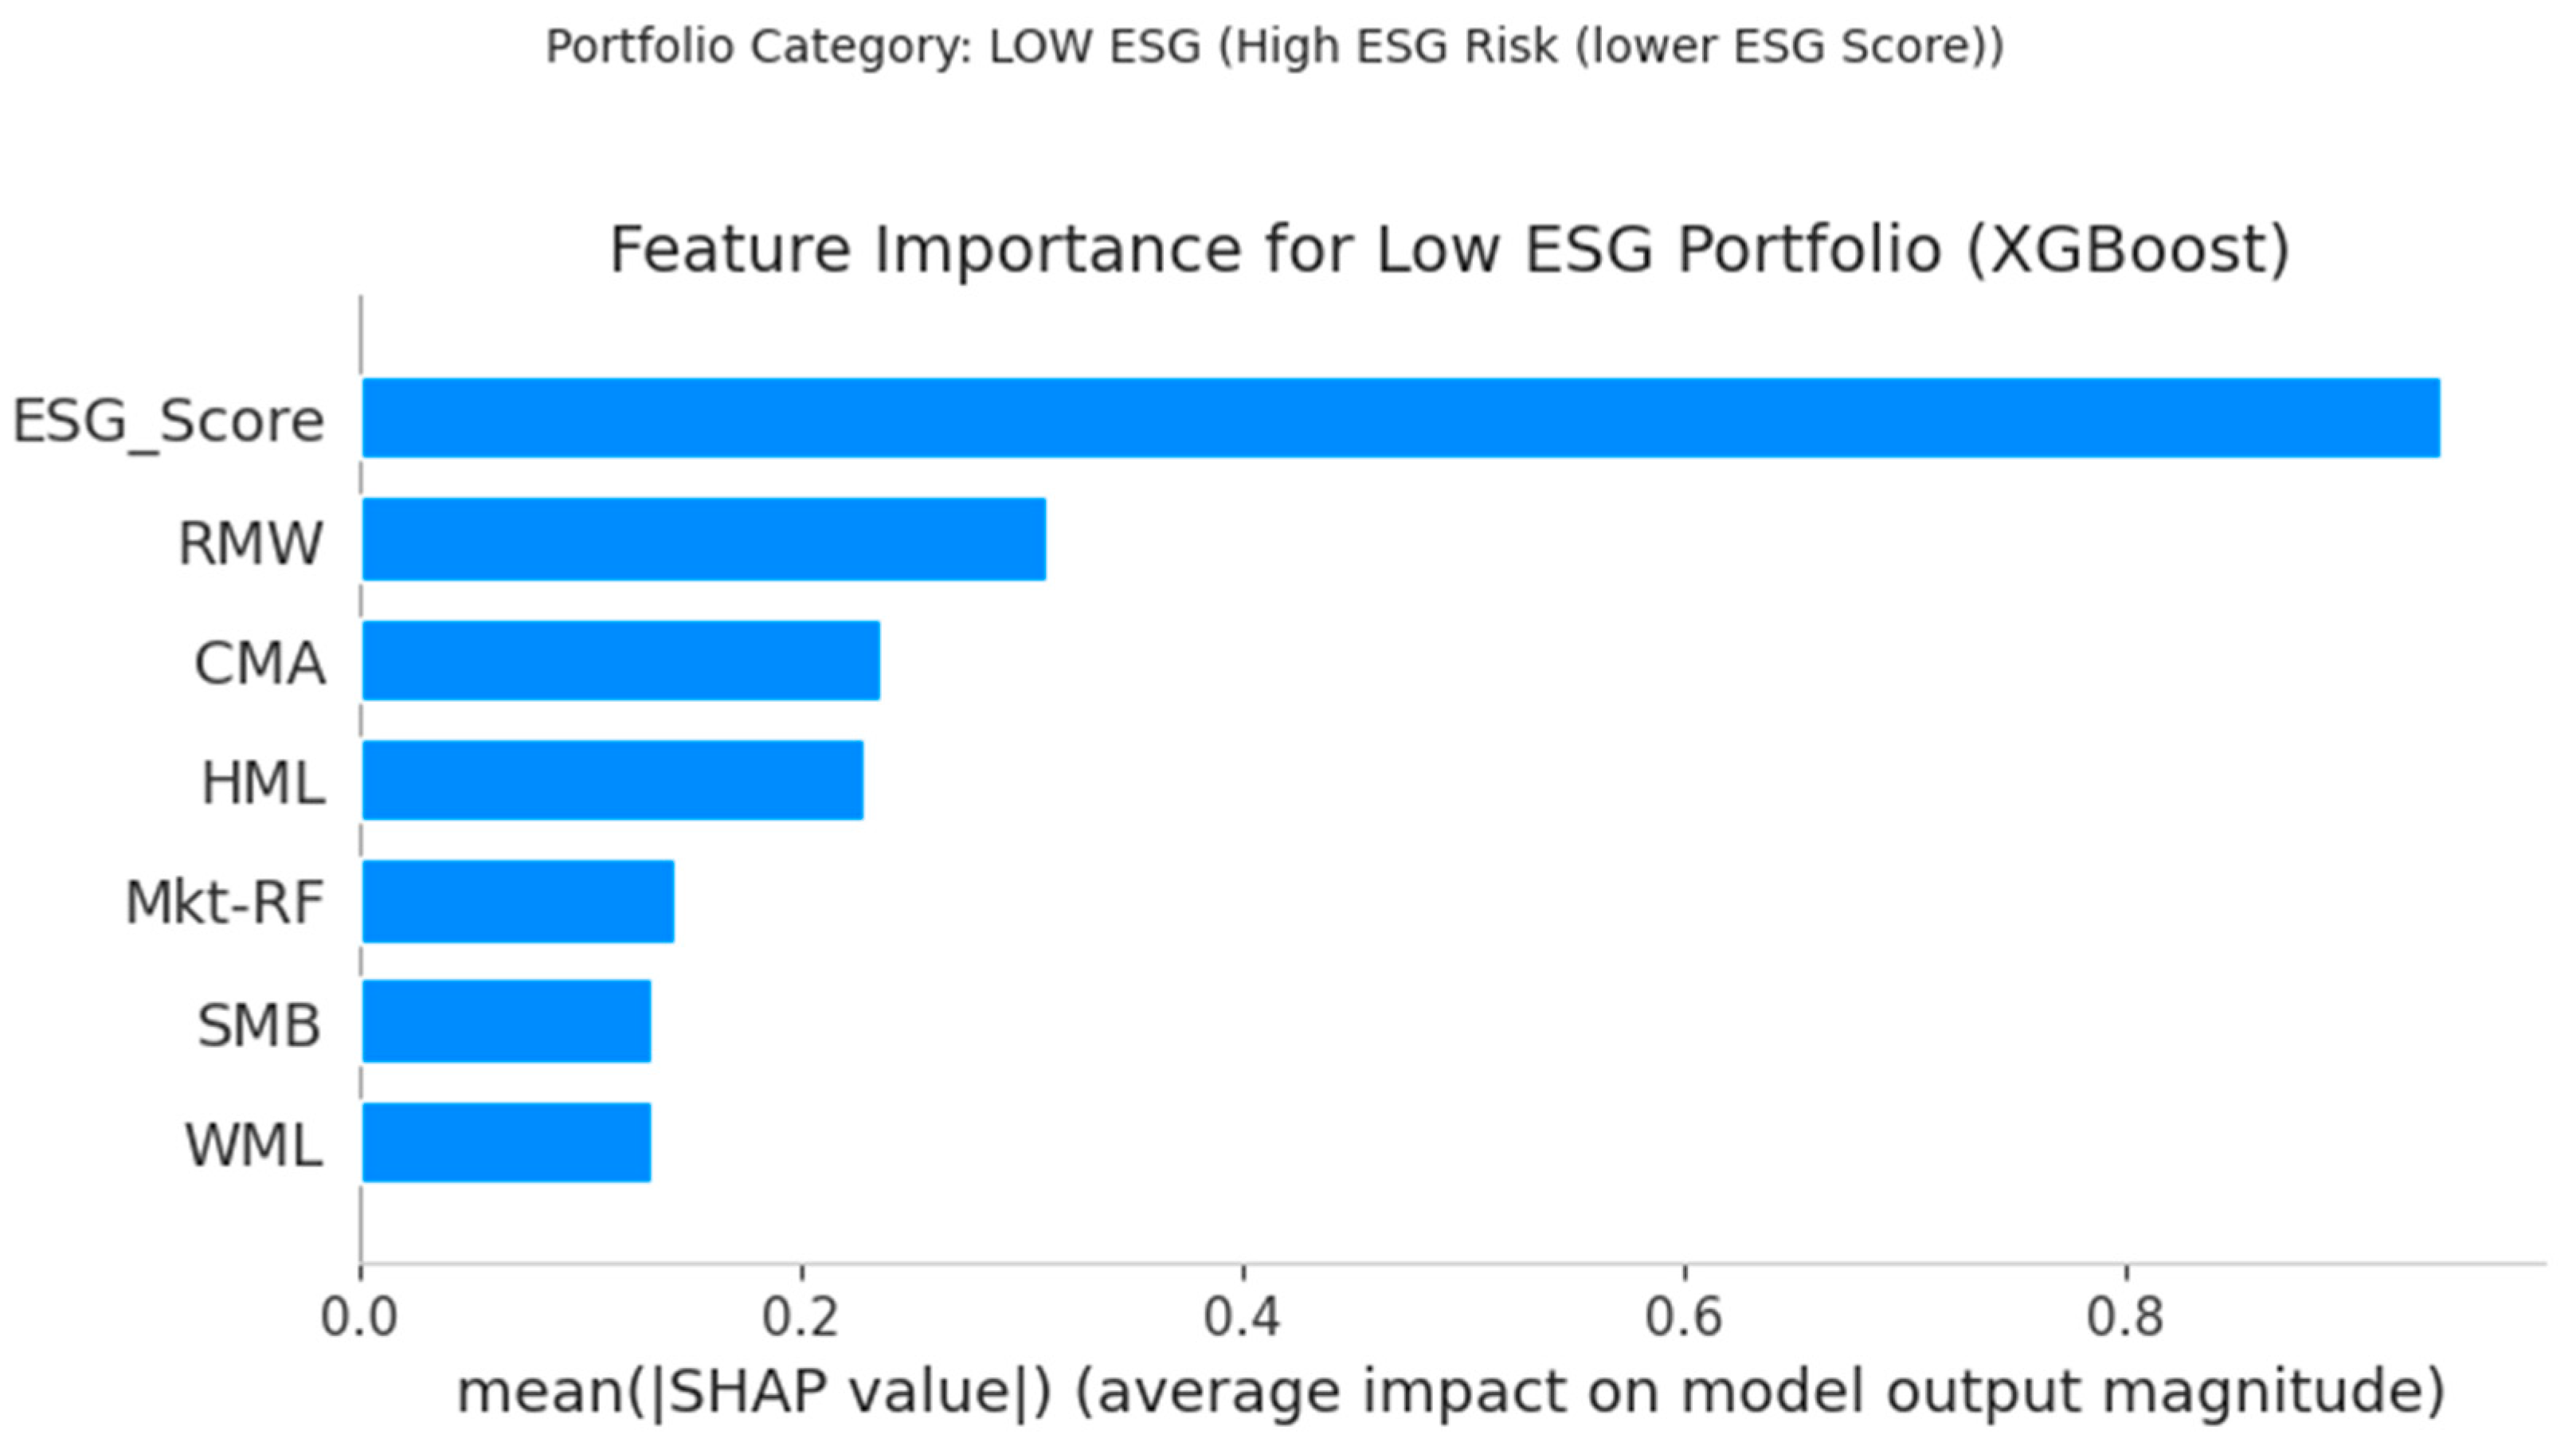
Figure 4.
SHAP Summary Plot for Medium ESG Risk Portfolio (XGBoost Classifier).
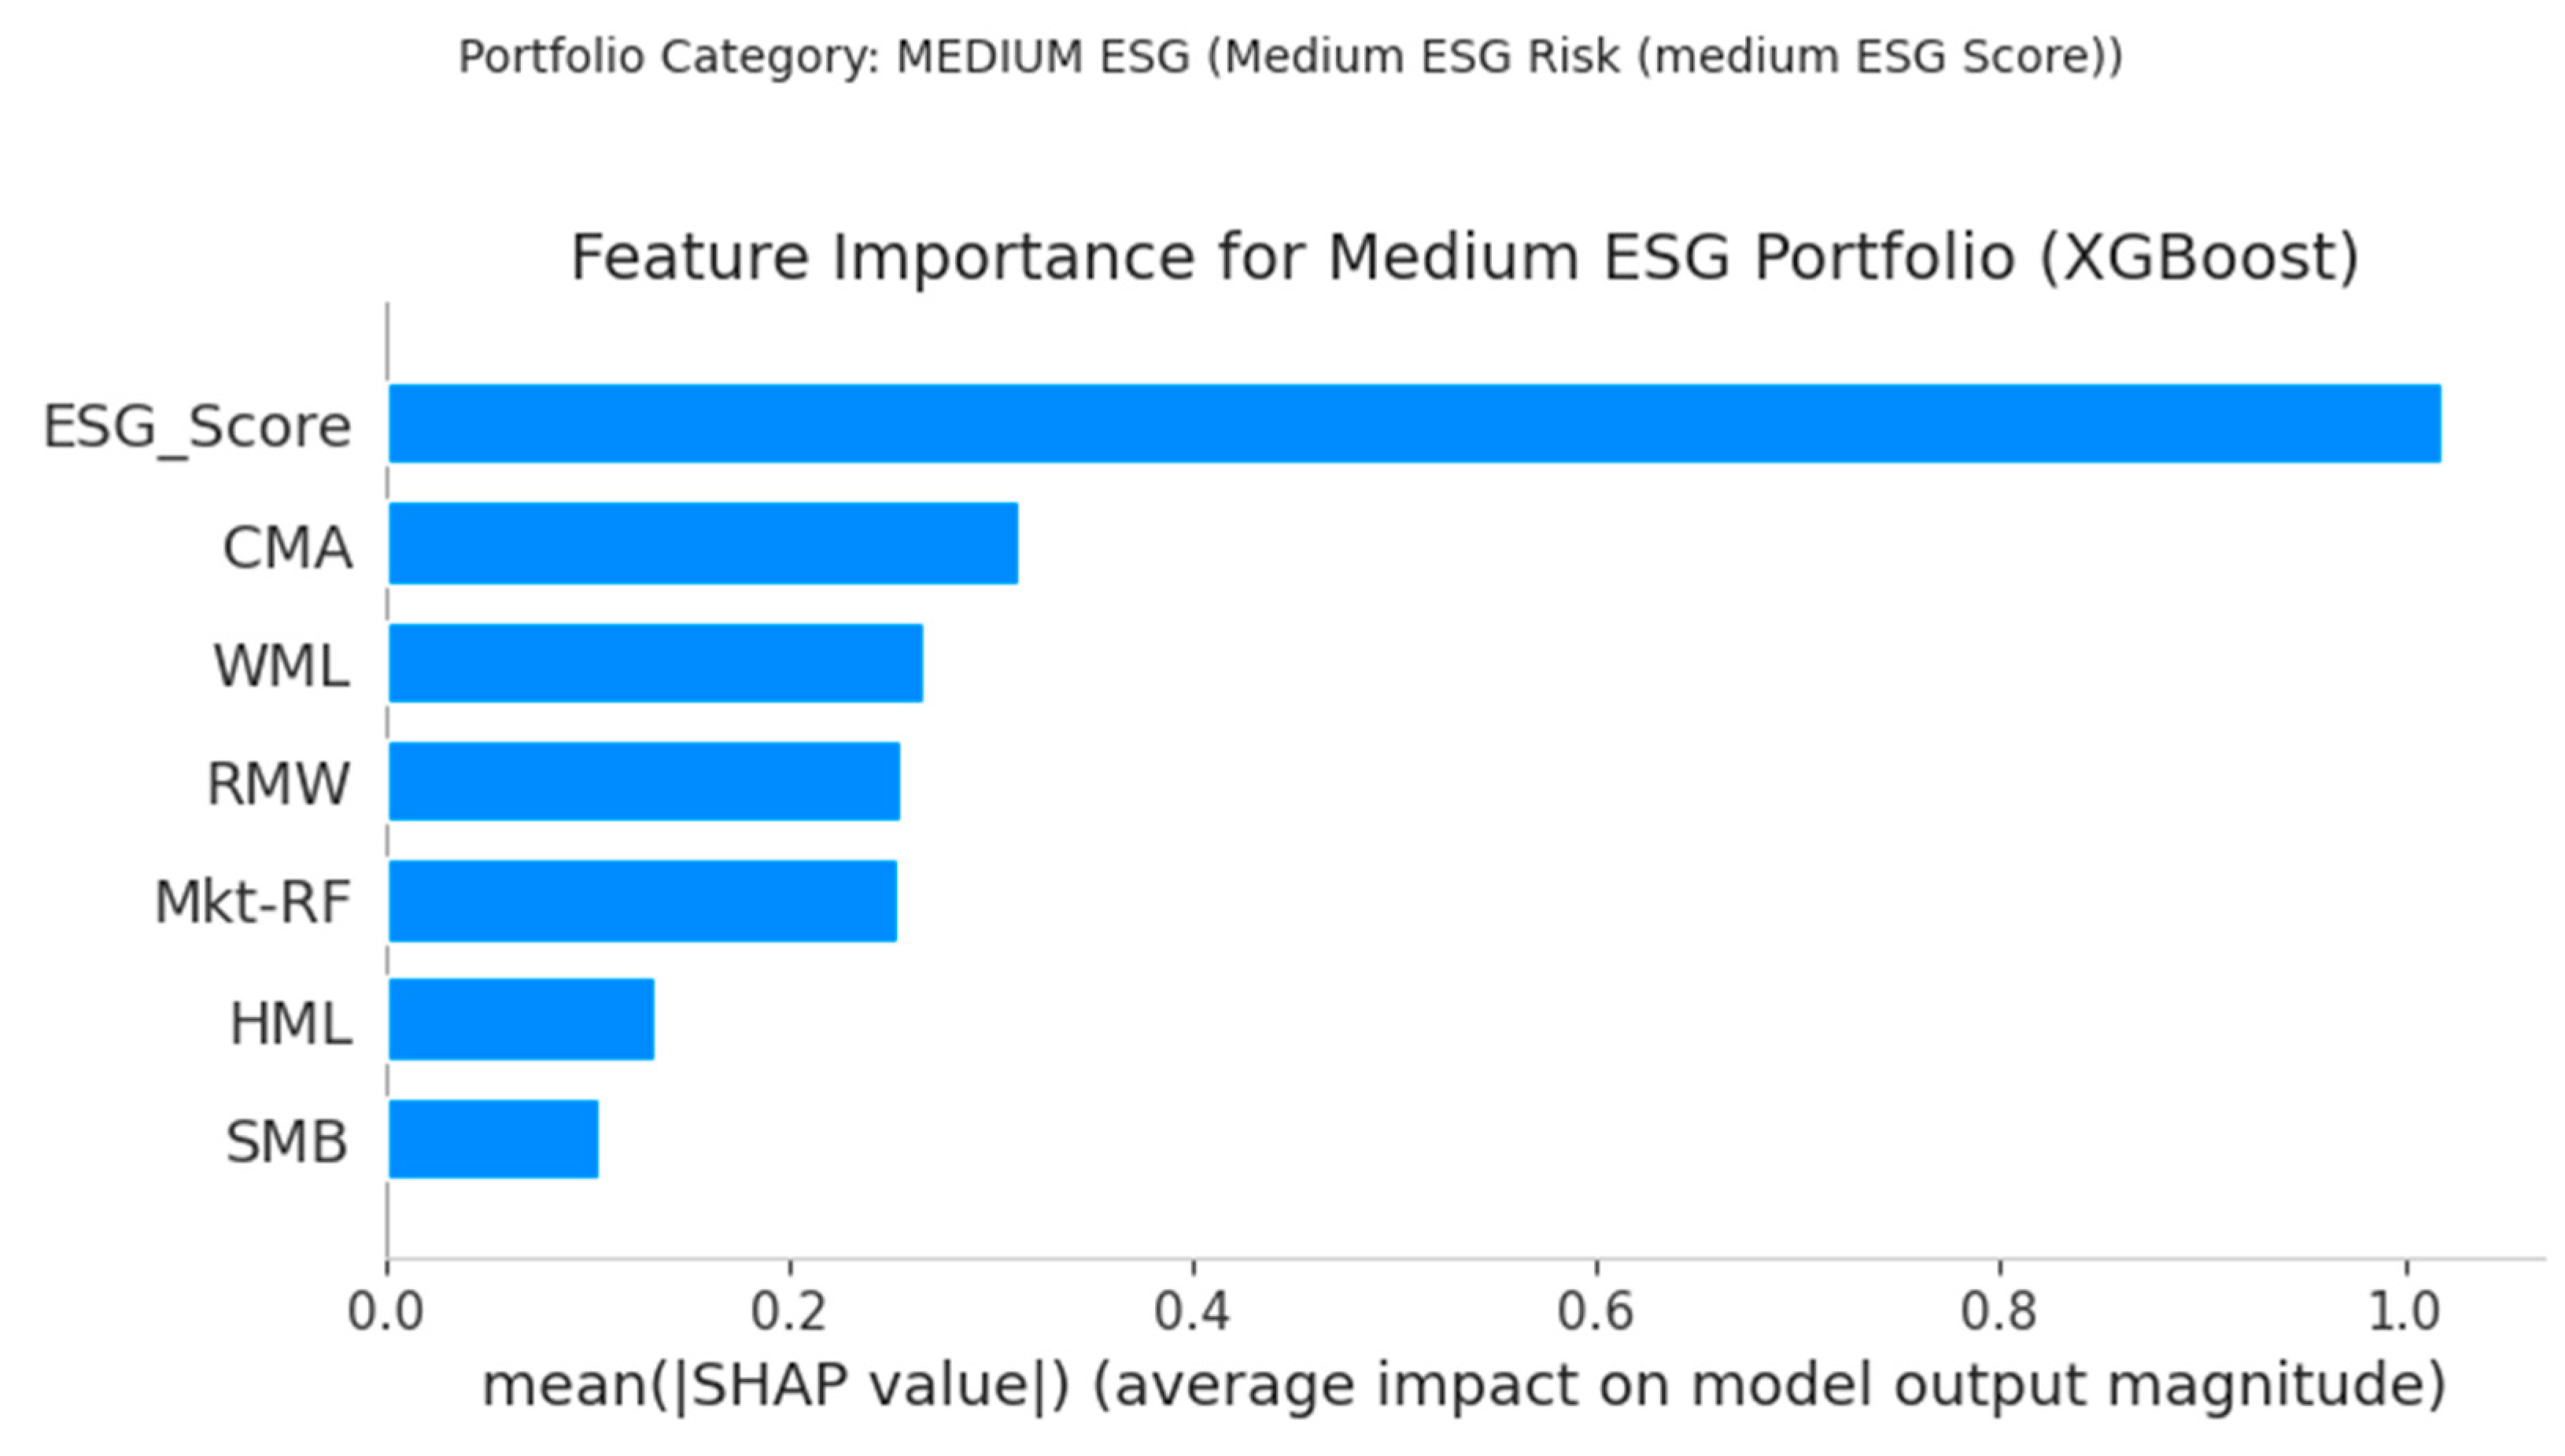
Figure 5.
SHAP Summary Plot for High ESG Risk Portfolio (XGBoost Classifier).
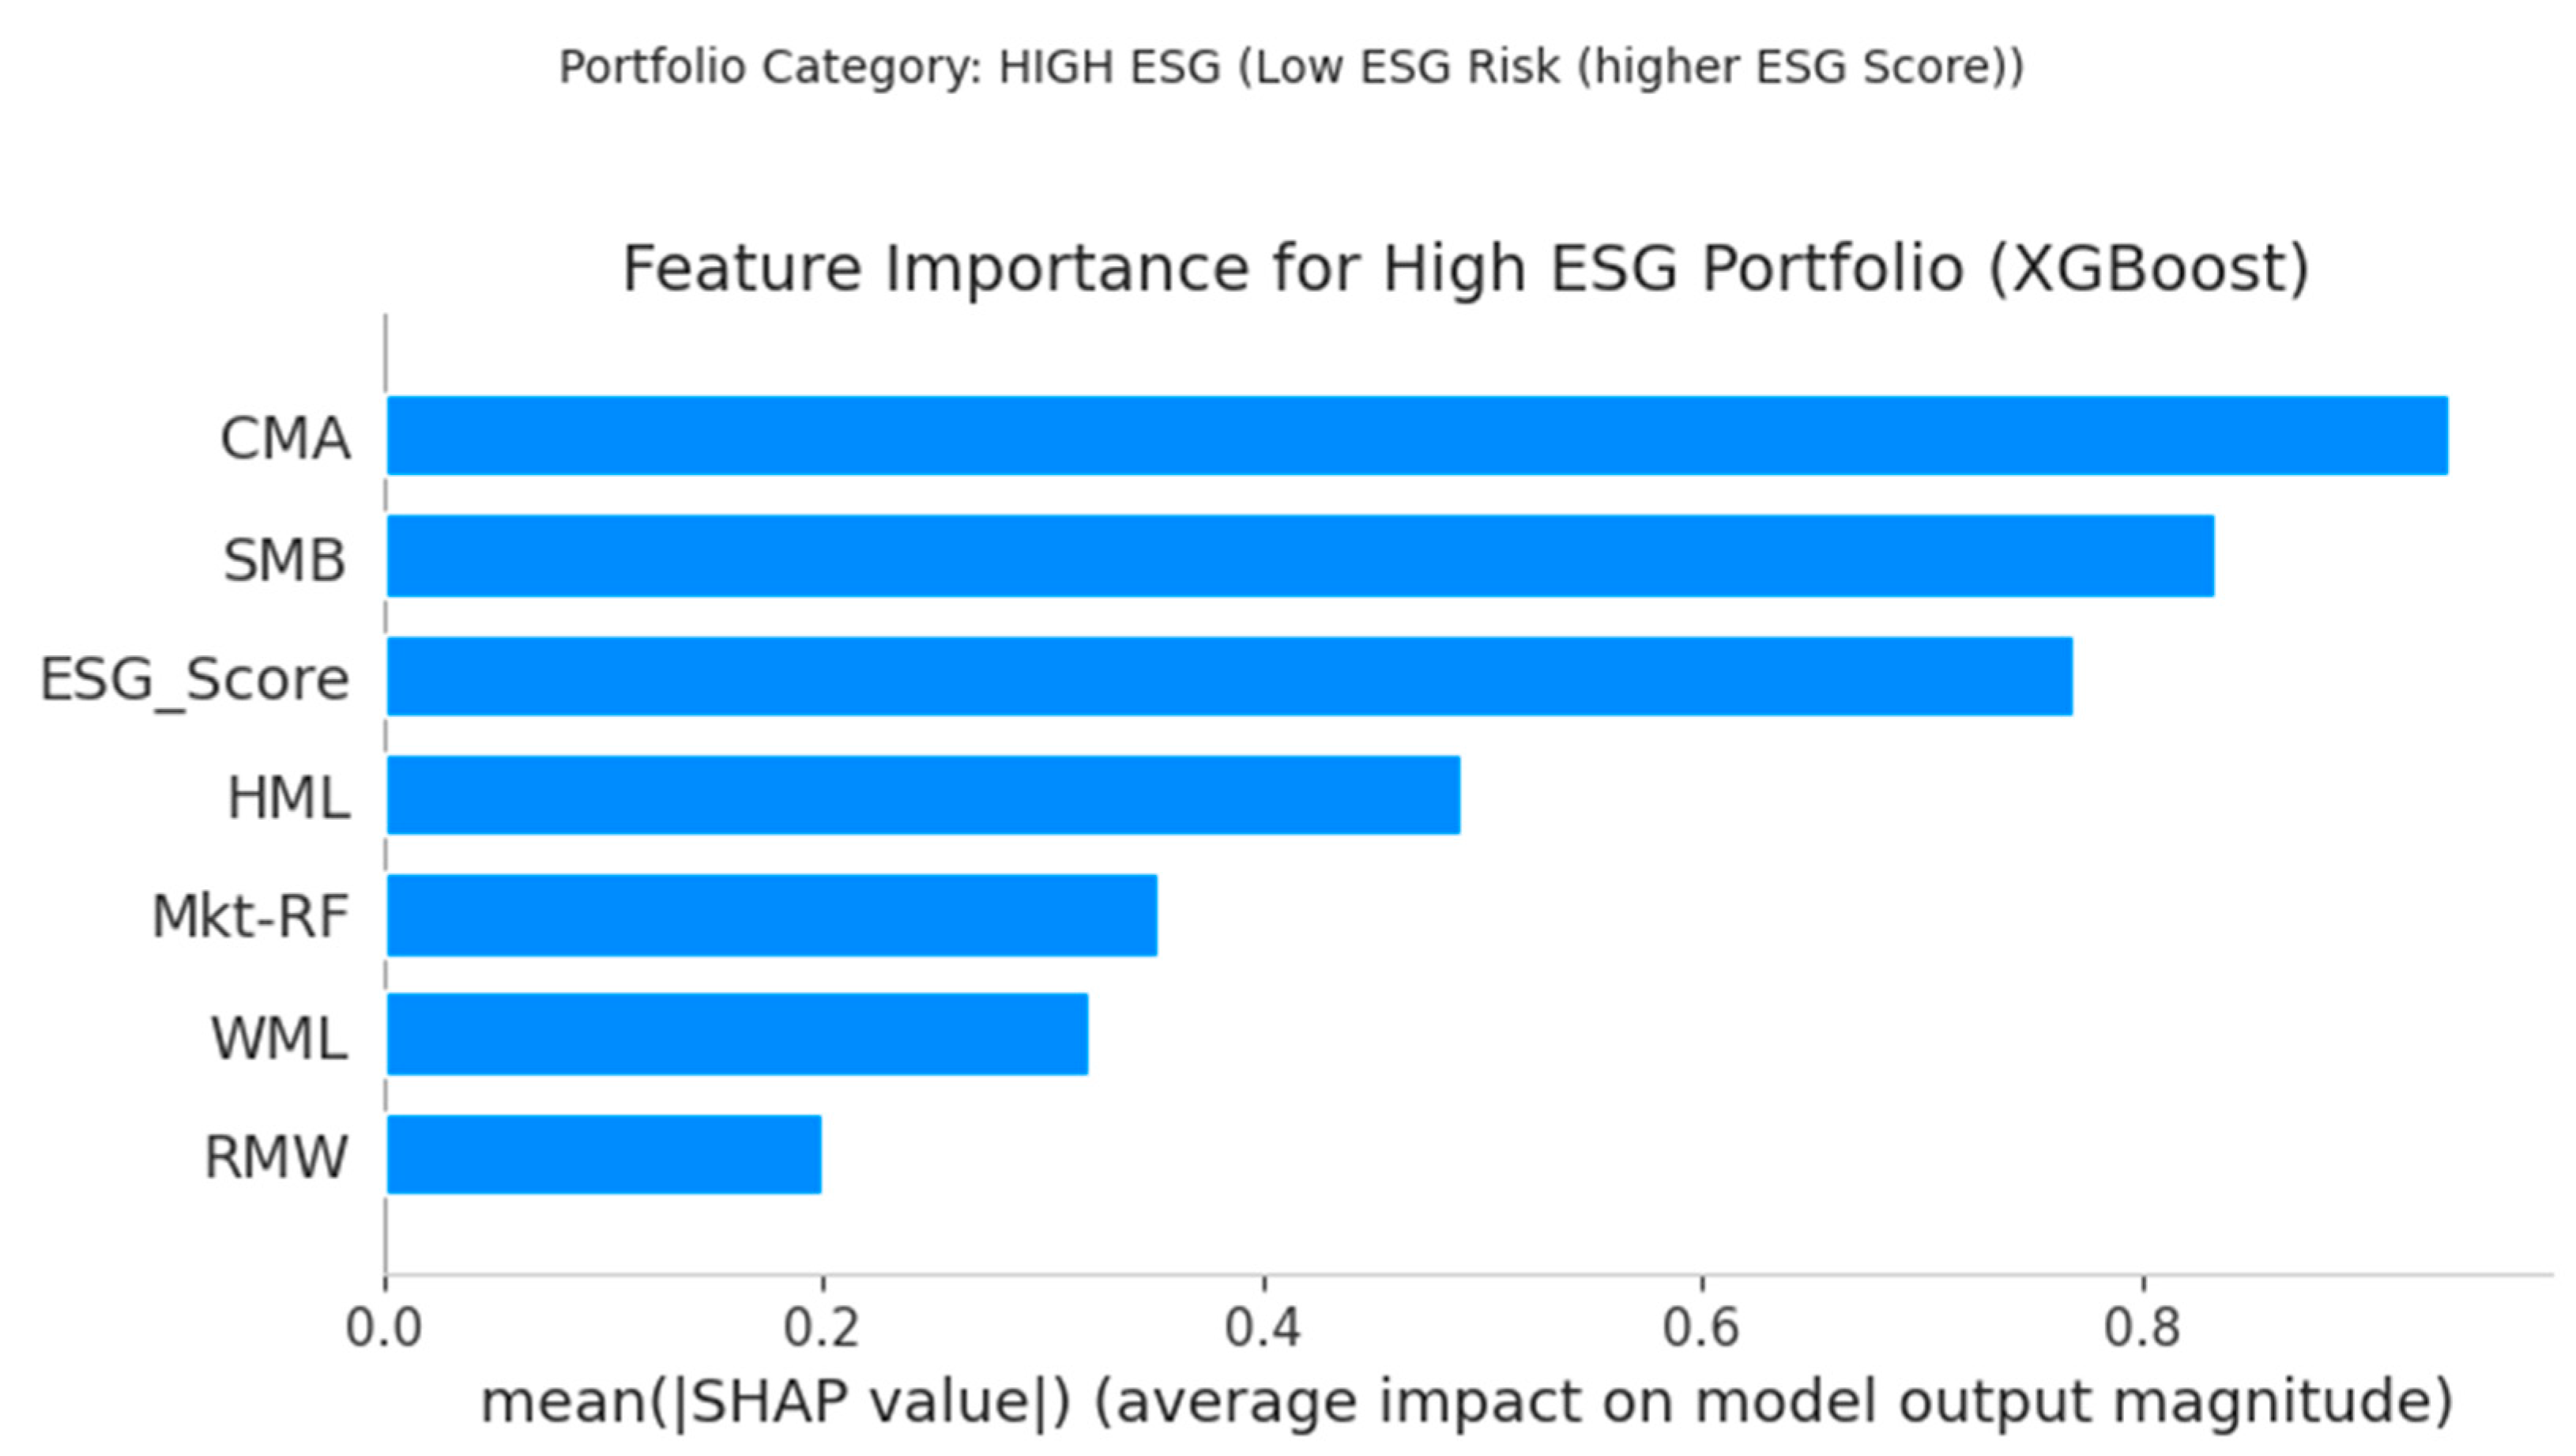
Figure 6.
Rolling Correlation between High ESG Risk and Low ESG Risk Portfolio Excess Returns (Multiple Window Sizes).
Figure 6.
Rolling Correlation between High ESG Risk and Low ESG Risk Portfolio Excess Returns (Multiple Window Sizes).
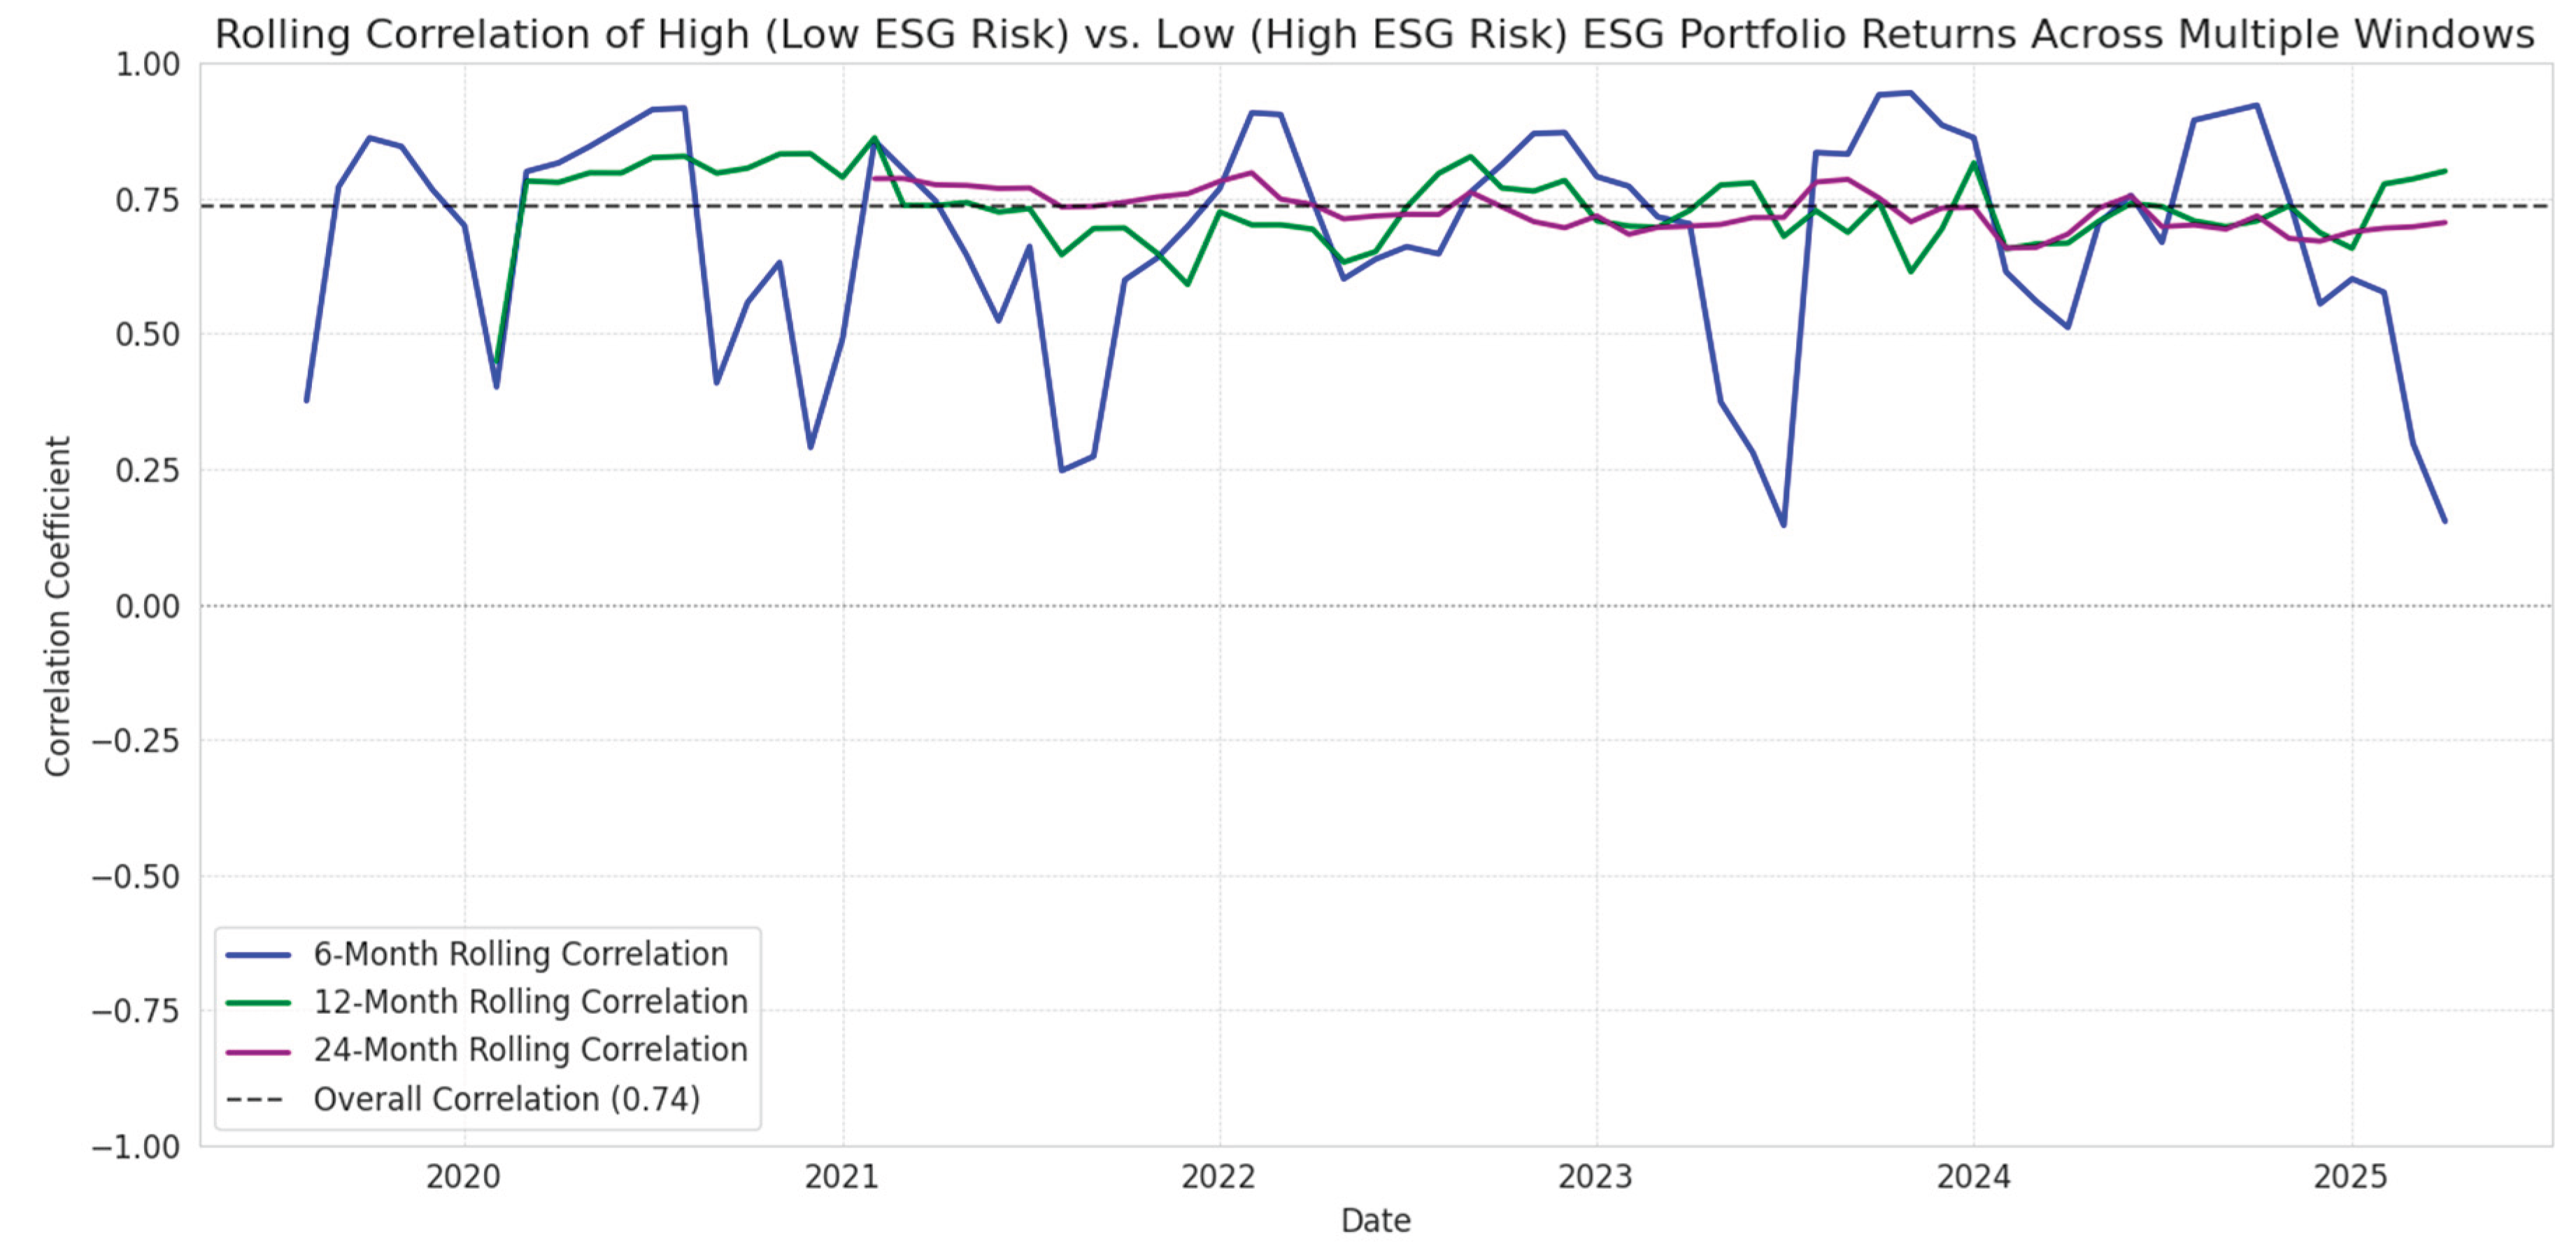

Table 1.
Number of Firms and Observations per ESG Portfolio.
| Portfolio Type | Unique Firms | Monthly Observations |
| Low ESG Risk | 11 | 482 |
| Medium ESG Risk | 14 | 397 |
| High ESG Risk | 10 | 452 |
| Total | 35 | 1331 |
Table 2.
Panel Model Diagnostic Test Results.
| Diagnostic Test | Test Statistic (Example) | p-value | Interpretation |
| Wooldridge Test | 0.2716 (Low ESG) | 0.6025 | No significant serial correlation (Low ESG) |
| 0.6881 (Medium ESG) | 0.4073 | No significant serial correlation (Medium ESG) | |
| 0.7471 (High ESG) | 0.3879 | No significant serial correlation (High ESG) | |
| Pesaran CD Test | 11.3939 (Low ESG) | 0.0000 | Significant cross-sectional dependence (Low ESG) |
| 5.5343 (Medium ESG) | 0.0000 | Significant cross-sectional dependence (Medium ESG) | |
| 8.3454 (High ESG) | 0.0000 | Significant cross-sectional dependence (High ESG) |
Note: ADF tests H0: Unit Root. KPSS tests H0: Stationarity. Granger Causality tests H0: Past ESG does not predict returns. p-values < 0.05 indicate significance.
Table 3.
Panel Model Comparison: Pooled OLS, Fixed Effects, and Random Effects Estimators.
| Portfolio | Model | No. Obs | R-squared (Overall) | F-statistic | P-value (F-stat) | Preferred Model |
| Low ESG | Pooled OLS | 482 | 0.2381 | 21.167 | 0.0000 | |
| Low ESG | Fixed Effects | 482 | 0.2229 | 23.386 | 0.0000 | FE |
| Low ESG | Random Effects | 482 | 0.2325 | 22.800 | 0.0000 | |
| Medium ESG | Pooled OLS | 397 | 0.2676 | 20.307 | 0.0000 | |
| Medium ESG | Fixed Effects | 397 | 0.2663 | 18.484 | 0.0000 | FE |
| Medium ESG | Random Effects | 397 | 0.2676 | 20.307 | 0.0000 | |
| High ESG | Pooled OLS | 452 | 0.1777 | 13.707 | 0.0000 | |
| High ESG | Fixed Effects | 452 | 0.1725 | 14.155 | 0.0000 | FE |
| High ESG | Random Effects | 452 | 0.1777 | 13.707 | 0.0000 |
Table 4.
Detailed Panel Regression Results (Based on Preferred Model - Fixed Effects) for Each ESG Portfolio.
Table 4.
Detailed Panel Regression Results (Based on Preferred Model - Fixed Effects) for Each ESG Portfolio.
| Variable | Low ESG Risk (FE) Coef. (t-stat) | Medium ESG Risk (FE) Coef. (t-stat) | High ESG Risk (FE) Coef. (t-stat) |
| const | -0.1707 (-3.8492) | -0.2083 (-2.3204) | 0.2113 (1.4879) |
| ESG_Score | 0.0105 (3.8052) | 0.0103 (2.2599) | -0.0083 (-1.4737) |
| Mkt-RF | 0.9092 (12.231) | 1.0030 (11.853) | 0.9140 (4.9727) |
| SMB | 1.3753 (4.4180) | 0.9794 (2.7027) | 1.6609 (4.1329) |
| HML | -0.0051 (-2.8036) | -0.0034 (-0.9600) | -0.0113 (-3.2956) |
| RMW | 0.0003 (0.1004) | -0.0026 (-0.8083) | -0.0077 (-1.6065) |
| CMA | 0.0021 (1.0986) | 0.0032 (0.9240) | 0.0021 (0.4007) |
| WML | 0.0840 (0.5331) | 0.1463 (0.6217) | -0.0806 (-0.2957) |
Table 5.
Stationarity and Granger Causality Test Results for ESG Portfolio Excess Returns.
| Portfolio | ADF Test p-value | Granger Causality (ESG → Return) p-value (2 lags) |
| Low ESG Risk | 0.0000 | 0.0830 |
| Medium ESG Risk | 0.0000 | 0.0072 |
| High ESG Risk | 0.0000 | 0.8079 |
Table 6.
ARCH-LM and GARCH Model Residual Diagnostics.
| Portfolio | GARCH(1,1) Ljung-Box (10 lags) p-value | EGARCH(1,1) Ljung-Box (10 lags) p-value | GJR-GARCH(1,1) Ljung-Box (10 lags) p-value |
| Low ESG Risk | 0.5970 | N/A | N/A |
| Medium ESG Risk | 0.9079 | 0.9079 | 0.9079 |
| High ESG Risk | 0.7867 | 0.7867 | 0.7867 |
| Portfolio | GARCH(1,1) Ljung-Box (10 lags) p-value | EGARCH(1,1) Ljung-Box (10 lags) p-value | GJR-GARCH(1,1) Ljung-Box (10 lags) p-value |
| Low ESG Risk | 0.5970 | N/A | N/A |
| Medium ESG Risk | 0.9079 | N/A | N/A |
| High ESG Risk | 0.7867 | N/A | N/A |
Table 7.
GARCH Model Results for ESG Portfolio Excess Returns.
| Portfolio | Model | Log-Likelihood | AIC | BIC | No. Obs | ω Coef. (t-stat) | α₁ Coef. (t-stat) | β₁ Coef. (t-stat) | γ₁ Coef. (t-stat) | Convergence |
| Low ESG Risk | GARCH(1,1) | -256.359 | 520.719 | 529.935 | 74 | 18.2401 (1.274) | 0.1015 (0.687) | 0.6038 (1.783) | N/A | Yes |
| EGARCH(1,1) | -256.403 | 520.807 | 530.023 | 74 | 1.2664 (0.857) | 0.1686 (0.505) | 0.6933 (1.887) | N/A | Yes | |
| GJR-GARCH | -256.355 | 522.709 | 534.229 | 74 | 16.7400 (0.714) | 0.0862 (0.347) | 0.6354 (1.106) | 0.0178 (0.120) | Yes | |
| Medium ESG Risk | GARCH(1,1) | -252.346 | 512.692 | 521.908 | 74 | 52.8816 (0.648) | 0.0142 (0.281) | 0.0000 (0.000) | N/A | Yes |
| EGARCH(1,1) | -246.000 | 500.001 | 509.217 | 74 | 0.7035 (7.16e7) | -0.7024 (-9024.093) | 0.8168 (8.25e7) | N/A | Yes | |
| GJR-GARCH | -252.197 | 514.394 | 525.914 | 74 | 52.0236 (2.862) | 0.0000 (0.000) | 0.0000 (0.000) | 0.0564 (0.596) | Yes | |
| High ESG Risk | GARCH(1,1) | -276.006 | 560.013 | 569.229 | 74 | 26.4252 (1.845) | 0.0618 (0.800) | 0.6814 (4.341) | N/A | Yes |
| EGARCH(1,1) | -276.138 | 560.276 | 569.493 | 74 | 1.3762 (1.565) | 0.0909 (0.441) | 0.7023 (3.714) | N/A | Yes | |
| GJR-GARCH | -275.141 | 560.282 | 571.802 | 74 | 39.8359 (1.298) | 0.1780 (0.727) | 0.5076 (0.883) | -0.1780 (-0.477) | Yes |
Table 8.
Best Hyperparameters from Randomized Search Tuning.
| Portfolio | Model | Best Hyperparameters |
| Low ESG Risk | RandomForestClassifier | {'max_depth': 3, 'max_features': 'sqrt', 'min_samples_leaf': 7, 'min_samples_split': 10, 'n_estimators': 137} |
| XGBClassifier | {'alpha': 0.7004, 'colsample_bytree': 0.9387, 'gamma': 0.4282, 'lambda': 0.4045, 'learning_rate': 0.2763, 'max_depth': 6, 'n_estimators': 124, 'subsample': 0.9743} | |
| Medium ESG Risk | RandomForestClassifier | {'max_depth': 5, 'max_features': 'log2', 'min_samples_leaf': 5, 'min_samples_split': 3, 'n_estimators': 137} |
| XGBClassifier | {'alpha': 0.6500, 'colsample_bytree': 0.8808, 'gamma': 0.3979, 'lambda': 0.8900, 'learning_rate': 0.1114, 'max_depth': 6, 'n_estimators': 147, 'subsample': 0.6376} | |
| High ESG Risk | RandomForestClassifier | {'max_depth': 9, 'max_features': 1.0, 'min_samples_leaf': 1, 'min_samples_split': 5, 'n_estimators': 99} |
| XGBClassifier | {'alpha': 0.6229, 'colsample_bytree': 0.6341, 'gamma': 0.0258, 'lambda': 0.5314, 'learning_rate': 0.1722, 'max_depth': 9, 'n_estimators': 101, 'subsample': 0.6531} |
Table 9.
Machine Learning Model Performance on Test Set (Test Size: 18 observations).
| Portfolio | Model | Task | Metric | Value |
| Low ESG Risk | LASSO | Regression | RMSE | 0.0846 |
| RandomForestClassifier | Classification | Accuracy | 0.56 | |
| F1-weighted | 0.40 | |||
| XGBClassifier | Classification | Accuracy | 0.56 | |
| F1-weighted | 0.47 | |||
| DNN | Regression | RMSE | 0.3537 | |
| LSTM | Regression | RMSE | 0.1076 | |
| Medium ESG Risk | LASSO | Regression | RMSE | 0.0601 |
| RandomForestClassifier | Classification | Accuracy | 0.50 | |
| F1-weighted | 0.33 | |||
| XGBClassifier | Classification | Accuracy | 0.50 | |
| F1-weighted | 0.41 | |||
| DNN | Regression | RMSE | 0.2027 | |
| LSTM | Regression | RMSE | 0.0675 | |
| High ESG Risk | LASSO | Regression | RMSE | 0.0957 |
| RandomForestClassifier | Classification | Accuracy | 0.44 | |
| F1-weighted | 0.43 | |||
| XGBClassifier | Classification | Accuracy | 0.50 | |
| F1-weighted | 0.50 | |||
| DNN | Regression | RMSE | 0.2159 | |
| LSTM | Regression | RMSE | 0.1024 |
Disclaimer/Publisher’s Note: The statements, opinions and data contained in all publications are solely those of the individual author(s) and contributor(s) and not of MDPI and/or the editor(s). MDPI and/or the editor(s) disclaim responsibility for any injury to people or property resulting from any ideas, methods, instructions or products referred to in the content. |
© 2025 by the authors. Licensee MDPI, Basel, Switzerland. This article is an open access article distributed under the terms and conditions of the Creative Commons Attribution (CC BY) license (http://creativecommons.org/licenses/by/4.0/).
Copyright: This open access article is published under a Creative Commons CC BY 4.0 license, which permit the free download, distribution, and reuse, provided that the author and preprint are cited in any reuse.


