
Submitted:
23 May 2025
Posted:
27 May 2025
You are already at the latest version
Abstract
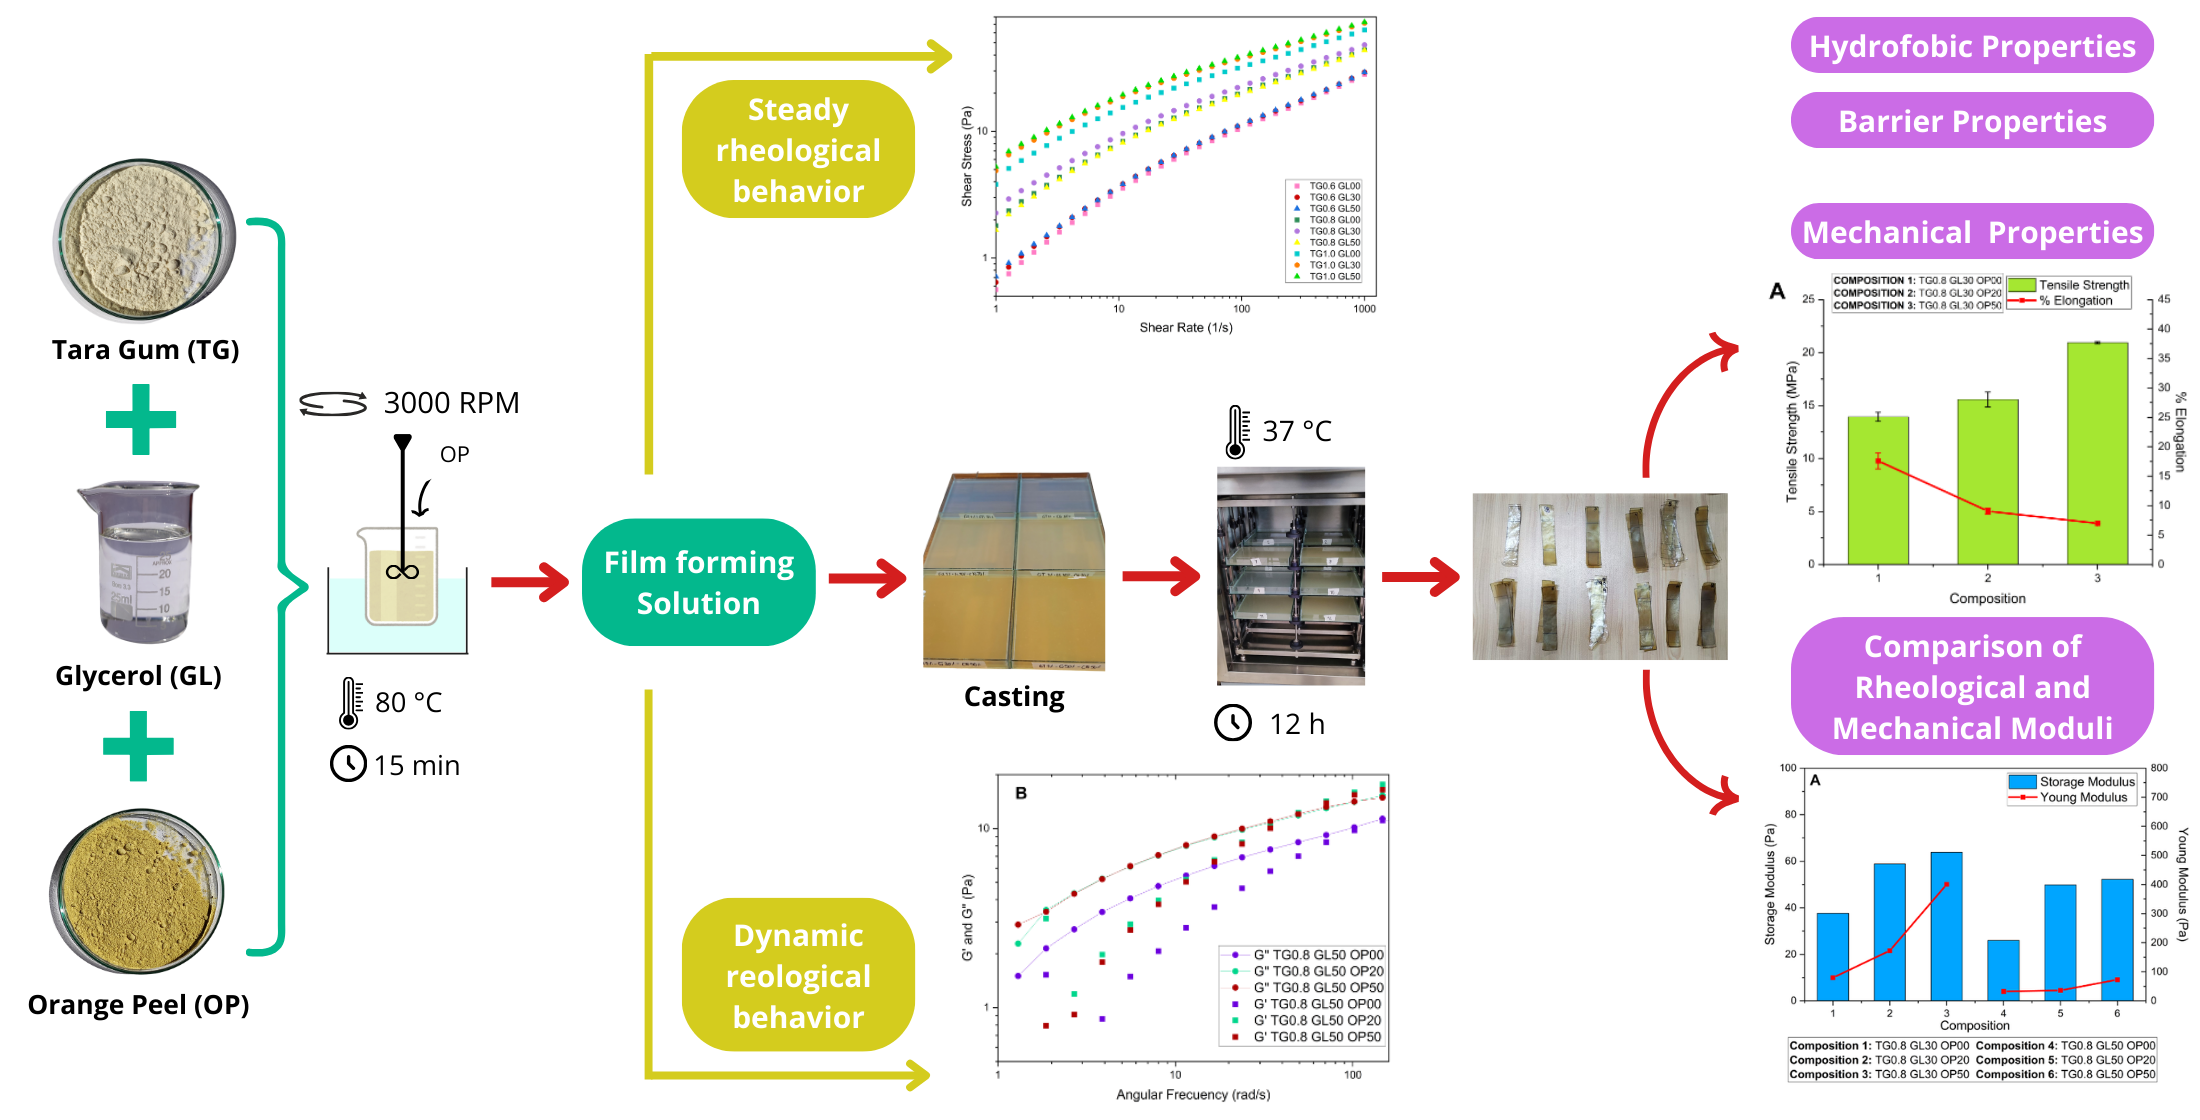
Mixtures of Glycerol (GL), Orange Peel powder (OP), and Tara Gum (TG) water solutions were formulated to investigate their rheological properties and their influence on the mechanical and barrier performance of the resulting films. The formulations included TG concentrations of 0.6%, 0.8%, and 1.0%, combined with 30% and 50% GL, and OP contents of 0%, 20%, and 50%. Rheological parameters, such as the flow behavior index, consistency coefficient, storage modulus (G′), and loss modulus (G″), were determined through flow and oscillatory tests. Mechanical properties, including Young’s modulus, elongation at break, and tensile strength, were also assessed. The results demonstrated a strong correlation (R² = 0.840) between G′ and Young’s modulus, suggesting that solutions with greater internal cohesion produce structurally stiffer films. The synergy between TG and OP played a key role in optimizing the polymeric matrix, as TG contributed to stiffness and mechanical reinforcement, while OP enhanced structural cohesion and stability. In this system, GL functioned as a plasticizer, increasing flexibility at the expense of stiffness. These interactions resulted in a reduction in film solubility by up to 62.43%, an improvement in mechanical strength by 50.21%, and an increase in flexibility by 78.86%. Furthermore, barrier properties were enhanced due to the synergistic interaction between TG and OP, leading to lower water permeability and increased hydrophobicity. A regression model (R² = 0.928) confirmed that TG contributes to film stiffness, OP reinforces the matrix, and GL modulates flexibility. These findings highlight the critical role of rheological behavior in determining the mechanical and functional properties of the films. This study provides a novel analytical framework for improving biopolymeric coatings, proposing that analogous models can be extended to other systems to develop sustainable and high-performance materials for industrial applications.
Keywords:
Film-forming solution
; Tara gum
; orange peel
; rheological properties
; mechanical properties
1. Introduction
Plastic pollution causes significant environmental damage due to its persistence and high greenhouse gas emissions during degradation, contributing to climate change and global warming. This has driven the search for sustainable alternatives, such as bioplastics, which aim to replace conventional plastics with biodegradable and environmentally friendly materials. Among these, hydrocolloid-based films have gained attention due to their ability to form biopolymeric networks with promising mechanical and barrier properties. However, the influence of the rheological behavior of film-forming solutions on the final properties of biopolymer films remains an area that requires further exploration.
Tara Gum (TG) is a galactomannan widely used as a thickening agent in the food industry and has been successfully applied in edible coatings [1]. Due to its high hydroxyl content, it exhibits a hydrophilic nature, forming hydrogen bonds with water molecules and generating a three-dimensional network with high viscosities at low concentrations [2]. Glycerol (GL) acts as a plasticizer, reducing the intermolecular forces between polymer chains and increasing their flexibility [3]. Meanwhile, Orange Peel (OP) has been studied as a filler in biopolymeric matrices due to its high cellulose and pectin content, which provide structural reinforcement and bioactive properties [4,40].
This work intents to establish that the rheological behavior of film-forming solutions directly influences the mechanical performance of the final films. Hydrocolloid-based solutions typically exhibit viscoelastic behavior and pseudoplastic flow, with viscosity decreasing under shear stress [5,6]. However, there is limited research on how these rheological properties correlate with the mechanical characteristics of biopolymeric films. Recent studies suggest that molecular interactions between hydrocolloids, plasticizers, and fillers can modify the structural integrity of the films, affecting their elasticity, strength, and barrier properties [7].
Despite advances in biopolymer research, the synergistic effect of TG, GL, and OP on the rheological properties of film-forming solutions and its influence on film mechanics has not been fully explored. Therefore, this study aims to evaluate the rheological properties of TG/GL/OP solutions and their relationship with the mechanical performance of the resulting films. By analyzing these interactions, this research seeks to provide insights into the formulation of bioplastics with improved functional properties.
2. Materials and Methods
2.1. Materials
The materials used in this research were Tara Gum (TG) (Alnicolsa, S.A., Peru), Glycerol (GL) 99.5% pure (Delta Química S.R.L., Peru) and Orange Peel powder (OP) that had 160 μm particle size. The Orange Peel used, previously was subject to the process of steam distillation in order to extract essential oil, then it was dehydrated and milled.
2.2. Preparation of Film-Forming Solutions and Film Casting
The film-forming solutions were prepared by dilution of a 10g/L Tara Gum stock solution. Previously the stock solution was refrigerated for 24 hours at 5°C. The first stage of the experiments evaluated the rheological behavior of Tara Gum (TG) solutions mixed with Glycerol (GL). Therefore, 0.6%, 0.8% and 1.0% TG dilutions were mixed with 30% and 50% Glycerol (GL). The mixtures were stirred at 3000 RPM for 15 minutes at 80°C.
The second stage of the experiments determined the impact of OP concentration on the properties of TG/GL mixtures. So, the mixtures of the first stage were combined with 20% and 50% OP (on dry basis of the hydrocolloid). In this stage was followed the same rheological protocol as in the previous one.
In the third stage the films were prepared with 500 mL of the second stage mixtures.The solutions were poured into glass plates and dried at 37 °C in a tray dryer for 12 hours to form the films.
2.3. Rheological Measurements
Rheological measurements were performed using an MCR 702 Twindrive Anton Paar rheometer provided with a concentric cylinder geometry following the ISO 3219 - 2:2021 standard [8]. The analyses were carried out in triplicate at a temperature of 25°C. The flow curves data were fitted using the Herschel-Bulkley model [9].
where, τ0 is the yield stress (Pa), k is the consistency coefficient (Pa s), n is the flow behavior index, and the shear rate (s−1).
Oscillatory strain sweeps were performed between 0.1 and 400% strain at a frequency of 1 Hz to establish the linear viscoelastic region (LVR). Then, frequency sweeps were performed at a fixed strain within the linear viscoelastic range (5%) to obtain the mechanical spectra: storage modulus, (G’), loss modulus, (G’’), and complex viscosity (η*). Dynamic tests were performed at 25 °C and fitted to the Generalized Maxwell Model for G’ and G’’ (Equation (2), Equation (3)) [10].
Where G' is the storage modulus (Pa), G'' is the loss modulus (Pa), ω is the angular frequency (rad/s) and both Gi and λi correspond to constants and parameters, which are determined from the frequency intervals included in the spectrum.
2.4. Film Characterization
2.4.1. Film Thickness
Film thickness was measured with a Mitutoyo 0-1“electronic digital micrometer having a 00005” / 0.001 mm resolution. Five random measurements were taken from the biofilms already cut and the values obtained were averaged.
2.4.2. Water Solubility (%S)
Pieces of 2 cm * 2 cm of the sample films were cut and dried at 100°C for 24 h to obtain a constant weight, after which the samples were immersed in 100 mL of distilled water for 24h. Finally, the samples were removed from the water and dried at 100°C for 24h. The water solubility of the films was reported as the weight loss of the films, following the equation (4) [11].
(%S) = W0 – W1/ W0 x 100%,
Where W0 is the initial weight and W1 is the final weight of the films.
2.4.3. Water Vapor Permeability (WVP)
Water vapor permeability (WVP) and water vapor transmission rate (WVTR) were determined in accordance with ASTM E96/ E96M-05. The films were cut into 3 cm x 3 cm squares after balancing their relative humidity. The square pieces were sealed in test tubes containing 10 mL of distilled water and placed in a desiccator containing silica gel. The weight of the tubes was checked every hour for 8 hours. The slope of each line was calculated by linear regression (R2 > 0.99) of weight change versus time and WVTR and WVP were calculated based on equations (5) and (6) [11,12]:
WVTR = Slope/Film area,
WVP = WVTR x X/(PA1-PA2),
Where X is the film thickness, PA1 is the vapor partial pressure on the outer surface of the film in the dryer, while PA2 is the vapor partial pressure on the inner surface of the film in the test tube.
2.4.4. Fourier – Transform Infrared (FTIR) Spectroscopy
The FTIR spectra of the films were determined using a Spectrum II Perkin Elmer Infrared Spectrophotometer provided with an ATR accessory. Samples of 2cm *2cm were cut and scanned in the range of 4000 cm-1 to 450 cm-1 wave number with 30 accumulations.μ
2.4.5. Contact Angle (CA)
The contact angle was determined on films following the sessile drop method. 10 μL of distilled water was carefully poured over the surface of the films (2 cm x 2 cm) through a 10 μL micropipette and the angles were measured before swelling began. Measurements were performed at 25°C. The reverse and right contact angles were automatically calculated using the software One Attention that controls the Biolin Scientific Optical Tensiometer model Theta T200.
2.5. Mechanical Properties of Films
The Multitest 0.5i Mecmesin dynamometer was used to measure the mechanical properties according to ASTM D882 - 18 with some modifications. The films were cut into 20 mm x 120 mm specimens after moisture equilibration for 72 h. The initial jaw spacing and crosshead speed used were set at 50 mm and 0.5 mm/s, respectively. Tensile strength (TS) [13], percent elongation (%E) [13] and Young's modulus (YM) [14] were calculated from the stress vs strain plot using the following equations:
TS = F/(A x X),
%E = (L-L1)/L1 x 100%,
YM = TS/((L-L1)/L1),
Where F is the tensile force (N), A is the cross sectional area (mm2), X is the thickness (mm), L1 is the initial film length and L is the film length at the breaking point (mm).
3. Results and Discussion
3.1. Analysis of the Film Forming Solutions
The solutions containing lower concentrations of TG were less viscous and the thickness of the corresponding films were thinner. The total mass of non water components in the films (TG, GL and OP) determines their thicknesses.
Plasticizer addition was carried out at concentrations of 30% and 50%, determined on the basis of preliminary tests. During these tests, plasticizer concentrations ranging from 10% to 100% (on a dry hydrocolloid basis) were evaluated. The results indicated that films obtained with levels below 30% were brittle and difficult to detach, while concentrations above 50% GL saturated the polymeric matrix, preventing proper film formation due to the accumulation of plasticizer on the surface. Therefore, a suitable plasticizer concentration ranges between 30% and 50%.
3.2. Rheological Analysis
Viscosity measurements were carried out using a 20 ml concentric cylinder system in which temperature was controlled at 25 °C by a Peltier device.
Rheological tests showed that viscosity increases with TG concentration. For a shear rate of less than 10 s-¹, the viscosity of the 0.6% TG solutions is approximately 480 mPa-s, while the 0.8% TG solutions reach a viscosity of 700 mPa.s Likewise, the solutions with a concentration of 1.0% TG presented viscosities of 1500 mPa-s, significantly higher than those obtained for the other TG concentrations.
As the shear rate increases, the viscosity decreases to 30 mPa.s for 0.6% TG, 45 mPa.s for 0.8% TG and 70 mPa.s for 1.0% TG. This is because higher concentrations of TG generate a stiffer molecular chain network via hydrogen bridges [9]. Moreover, the viscosity reduction with increasing shear rate is typical of pseudo plastic solutions [1], where macromolecular chains become disentangled and aligned in the direction of flow, decreasing the interactions between them [15]. This behavior was corroborated with the calculated parameters of the Herschel-Bulkley model (Table 1).
GL possessing three hydroxyl groups (OH-), facilitates the formation of hydrogen bridges with the side chains of TG, which strengthens the network entanglement and increases the viscosity of the film forming solutions [16,17]. However, as observed in Figure 1, varying GL content between 30% and 50% has a smaller impact on the flow curves than modifying TG concentration.
From Figure 1 it can be seen, for all cases, the Yield Stress limit is affected by the concentration of GL and TG.
In Table 1 we can see when OP was added to the mixtures, the flow coefficient (k) subtly decreased, while the flow behavior index (n) slightly increased, maintaining a shear-thinning behavior, with TG as the dominant component of the solution. Similarly, OP was observed to increase the values of the flow behavior index (n), indicating that its incorporation enhances the viscous behavior of the solution. However, since it does not exceed the threshold of 1, the fluid remains pseudoplastic.
On the other hand, the data indicate that increasing the concentration of TG (from 0.8% to 1.0% w/v) led to a decrease in the 12.7% value from 0.487 (Composition 1) to 0.428 (Composition 7), which is consistent with previous findings reported by Wu et al. [1] and Santos et al. [41], who studied the rheology of TG at different concentrations. According to these authors, the pseudoplastic nature of TG solutions becomes more pronounced as its concentration increases. This suggests that, although OP contributes to a slight increase, TG remains the predominant factor in determining the rheological behavior, reinforcing its pseudoplastic tendency at higher concentrations.
Prior to the frequency sweeps, amplitude sweeps were performed from the lowest TG concentration (0.6%) to the highest (1.0%), selecting the shear deformation value within the linear region of 5%. Frequency sweeps were then carried out with a shear deformation of 5% over a frequency range of 1 to 100 rad/s. In the first stage, TG concentrations of 0.6%, 0.8% and 1.0% were evaluated with different GL concentrations. In the second stage were tested mixtures of 0.8% and 1.0% TG, 30% and 50% GL and varying OP concentrations.
The storage modulus for the solutions with 1.0% TG shows a steep initial curve, followed by a decrease towards values close to zero. The highest peak of 62.10 Pa was recorded for the solution with 1% TG and 30% GL. Furthermore, it was observed that the storage modulus increases with angular frequency, which is attributed to the rearrangement of molecular chains due to the increase in frequency [16] as evidenced in Figure 2.
The loss modulus also increases with increasing angular frequency; however, it does not exceed the values reached by the storage modulus. The maximum value recorded was 20.454 Pa for the solution with 1.0% TG and 50% GL. In addition, the solutions with higher concentration of TG exhibit moderate growth compared to the 0.6% solutions, which show a significant linear increment. This is due to an enlargement in the energy released, which causes the viscous component of the solution to predominate over the elastic component.
Figure 3 shows the behavior of some solutions. When OP is added to the solutions containing 0.8% TG, they behave as a liquid until a crossover point appears at 3.8 rad/s after which it acquires a gelatinous character. The solutions with 1.0% TG observe a less liquid behavior, since they comprise more TG and have higher values of the storage modulus at high frequencies, due to the increased crosslinking, forming a more cohesive network that can store more energy.
The addition of orange peel does not significantly affect the rheological behavior in terms of loss and storage modulus, with TG being the dominant component. At low frequencies, the loss modulus is higher, whereas at higher frequencies, the storage modulus prevails. This behavior has been observed in previous studies [1,9], where TG solutions exhibit an entangled solution behavior at higher frequencies.
A correlation of the frequency sweeps was performed using Maxwell's equations, finding that the four-element model (n=4) is adequate to accurately describe the behavior of the solutions. The values of λi and Gi are reported in Appendix A (Table A1).
Table 2 shows the storage and loss modulus adjustment using Maxwell's equations. Solutions with 0.8 TG in their composition present better interaction between TG, GL and OP, increasing the storage modulus with increasing OP concentration. Solutions that are composed of 1.0 % TG, and high OP content show smaller storage modulus by about 35 %. This effect can be attributed, on the one hand, to the saturation of the polymer matrix due to the formation of intermolecular bonds between OP cellulose, TG and GL [18,39]. On the other hand, it could also be related to the intrinsic nature of OP as a filler material [4], since an excess of its incorporation interferes with the cohesion of the polymeric network, affecting its structural integrity.
Figure 4 shows that the storage modulus G’, which reflects the stored elastic energy and elasticity of the matrix [5], increases markedly in the compositions with higher contents of TG (1.0%). This increment suggests a more organized and cohesive polymeric network, attributed to hydrogen bonding interactions between the hydroxyl groups of the TG, the OP compounds (cellulose and pectin) and the GL. On the other hand, the loss modulus G’’, related to the energy dissipated as heat and the viscosity of the material [9], show a slight increment in the formulations with higher GL content (50%), indicating higher flow capacity and higher plasticity.
3.3. Characterization of Glycerol, Tara Gum and Orange Peel Films
3.3.1. Thickness of the Films
The thickness values were within the range of [0.08 - 0.23] mm, and were directly related to the solids concentration (TG and OP) in the film forming solutions.
3.3.2. Water Solubility
After 24 hours of immersion, films without OP lost their structural integrity and exhibited significantly higher solubility compared to OP-containing formulations. Films incorporating OP retained their structural stability and exhibited a solubility reduction of up to 62.43%, indicating that OP enhances the water resistance of the films. This effect can be attributed to the presence of cellulose, characterized by a highly ordered structure and lower hydrophilicity, that functions as a barrier restricting water penetration and consequently reducing solubility [19].
Viscoelastic properties, particularly the storage modulus, are directly associated with the cohesive strength of the polymer matrix [35], influencing both water resistance and mechanical durability. This behavior is evident in formulations reinforced with less hydrophilic components, such as cellulose [38] and chitosan [11].
3.3.3. Water Vapor Permeability
Water vapor permeability varied as a function of TG and OP concentrations. Films with the lowest concentration of OP and 1.0% TG (specifically compositions 8,9 and 12) showed the lowest permeability values. In contrast, films with higher concentration of OP and 0.8% TG exhibited the highest permeability values, reaching up to 0.0793 g mm/hm² kPa in composition 5.

Table 4.
Films permeability.
| # | Composition | Permeability (gmm/hm2kPa) | # | Composition | Permeability (gmm/hm2kPa) |
| 1 | TG0.8 GL30 OP00 | 0.0528 ± 0.0031 | 7 | TG1.0 GL30 OP00 | 0.0183 ± 0.0073 |
| 2 | TG0.8 GL30 OP20 | 0.0645 ± 0.0067 | 8 | TG1.0 GL30 OP20 | 0.0158 ± 0.0064 |
| 3 | TG0.8 GL30 OP50 | 0.0503 ± 0.0114 | 9 | TG1.0 GL30 OP50 | 0.0151 ± 0.0051 |
| 4 | TG0.8 GL50 OP00 | 0.0639 ± 0.0051 | 10 | TG1.0 GL50 OP00 | 0.0165 ± 0.0010 |
| 5 | TG0.8 GL50 OP20 | 0.0793 ± 0.0099 | 11 | TG1.0 GL50 OP20 | 0.0175 ± 0.0036 |
| 6 | TG0.8 GL50 OP50 | 0.0745 ± 0.0103 | 12 | TG1.0 GL50 OP50 | 0.0131 ± 0.0005 |
Literature suggests that the permeability of hydrocolloid-based films increases with the hydrophilicity of the polymer [11]. In this case, the interaction between the three components affects permeability, as it decreases with higher concentrations of TG and OP. This is due to the formation of a more cohesive and effective barrier against vapor diffusion, probably due to the more compact structure of the polymer matrix, which reduces water vapor diffusion through the films [31]. Pectin and cellulose present in OP have antioxidant activity and reactive oxygen species, contributing to improved barrier properties of the films [11,29,40]. On the other hand, a higher GL concentration resulted in a more hydrophilic polymeric matrix, causing a slight increase in permeability, a similar behavior was reported by Antoniou et al. [11] and Xue et al. [30]. However, the effect of TG and OP predominated in the permeability of the films.
3.3.4. Fourier Transform Infrared Spectroscopy
It is necessary to denote that the OP used has been subject to an essential oil steam distillation process. This distillation process eliminates volatile compounds and essential oils, which leads to the reduction or elimination of the bands associated with terpenes and other volatile compounds present in the essential oil.
In Figure 5, a broad band is evident between 3600 and 3200 cm⁻¹, corresponding to O–H stretching vibrations. The intensity and position of this band vary with OP concentration, suggesting hydrogen bonding between the hydroxyl groups of glycerol (GL) and tara gum (TG), and the cellulose and pectin present in the orange peel [20]. In the 3000–2850 cm⁻¹ region, C–H stretching vibrations typical of aliphatic chains are observed [16]. The peak near 1750 cm⁻¹ corresponds to C=O stretching of carbonyl groups, likely from organic acids in the orange peel [19]. The band between 1600 and 1500 cm⁻¹ may indicate aromatic structures, while those between 1300 and 1000 cm⁻¹ reflect C–O ether bonds from OP [19] and C–OH groups of GL, as well as C–O–C glycosidic linkages from TG [9]. A notable shift in this region was detected, with the band moving from 1014–1033 cm⁻¹ (in pure components) to 1018–1025 cm⁻¹ in the blended films, depending on TG and OP content. This shift likely arises from changes in the local chemical environment of C–O-related groups due to intermolecular interactions such as hydrogen bonding. Although primarily manifested near 3300 cm⁻¹, such interactions can influence other vibrational modes indirectly. Finally, the region below 1000 cm⁻¹ represents the fingerprint zone, where the films show variations in transmittance values linked to their unique structural features.
TG is mainly composed of mannose and galactose, polysaccharides rich in hydroxyl groups (-OH), which are highly polar and, due to their hydrophilic character, have a strong affinity to form hydrogen bonds [17, 33]. These interactions occur especially with flavonoids, cellulose and hemicelluloses present in OP, generating a more cohesive network that influences the mechanical strength, permeability and solubility of the films [4, 19]. The GL structure facilitates the additional formation of hydrogen bonds with the TG (Figure 5), the intensity of the OH band is directly proportional to GL concentration, which will increase the solubility, flexibility and elongation of the films. In addition, the carboxyl and hydroxyl groups of the OP compounds interact with the GL, promoting a more homogeneous distribution of its components within the polymeric matrix. This effect stabilizes the polymeric network and improves film uniformity, although it also affects hydrophobicity by increasing the surface polarity [34].
3.3.5. Contact Angle
Water resistance is a crucial property for films applied as coatings [21]. The contact angle, method is a reliable way to evaluate the degree of hydrophobicity. Films with a contact angle less than 65° are hydrophilic, while those with an angle greater than 65° are hydrophobic [21]. The results indicate intermediate behavior, with contact angles between 65° and 90°, suggesting greater liquid adhesion to the film than cohesion, congruent with hydrocolloid films [22]. The surface roughness increases with OP content, observing that the contact angles on the front side are up to 16.39% higher than on the reverse side, indicating increased hydrophobicity on that side due to its roughness.
Figure 6.
Contact Angle (A) Composition 4: TG0.8 GL50 OP00, (B) Composition 9: TG1.0 GL30 OP50 (C) Composition 11: TG 1.0 GL50 OP20.
Figure 6.
Contact Angle (A) Composition 4: TG0.8 GL50 OP00, (B) Composition 9: TG1.0 GL30 OP50 (C) Composition 11: TG 1.0 GL50 OP20.
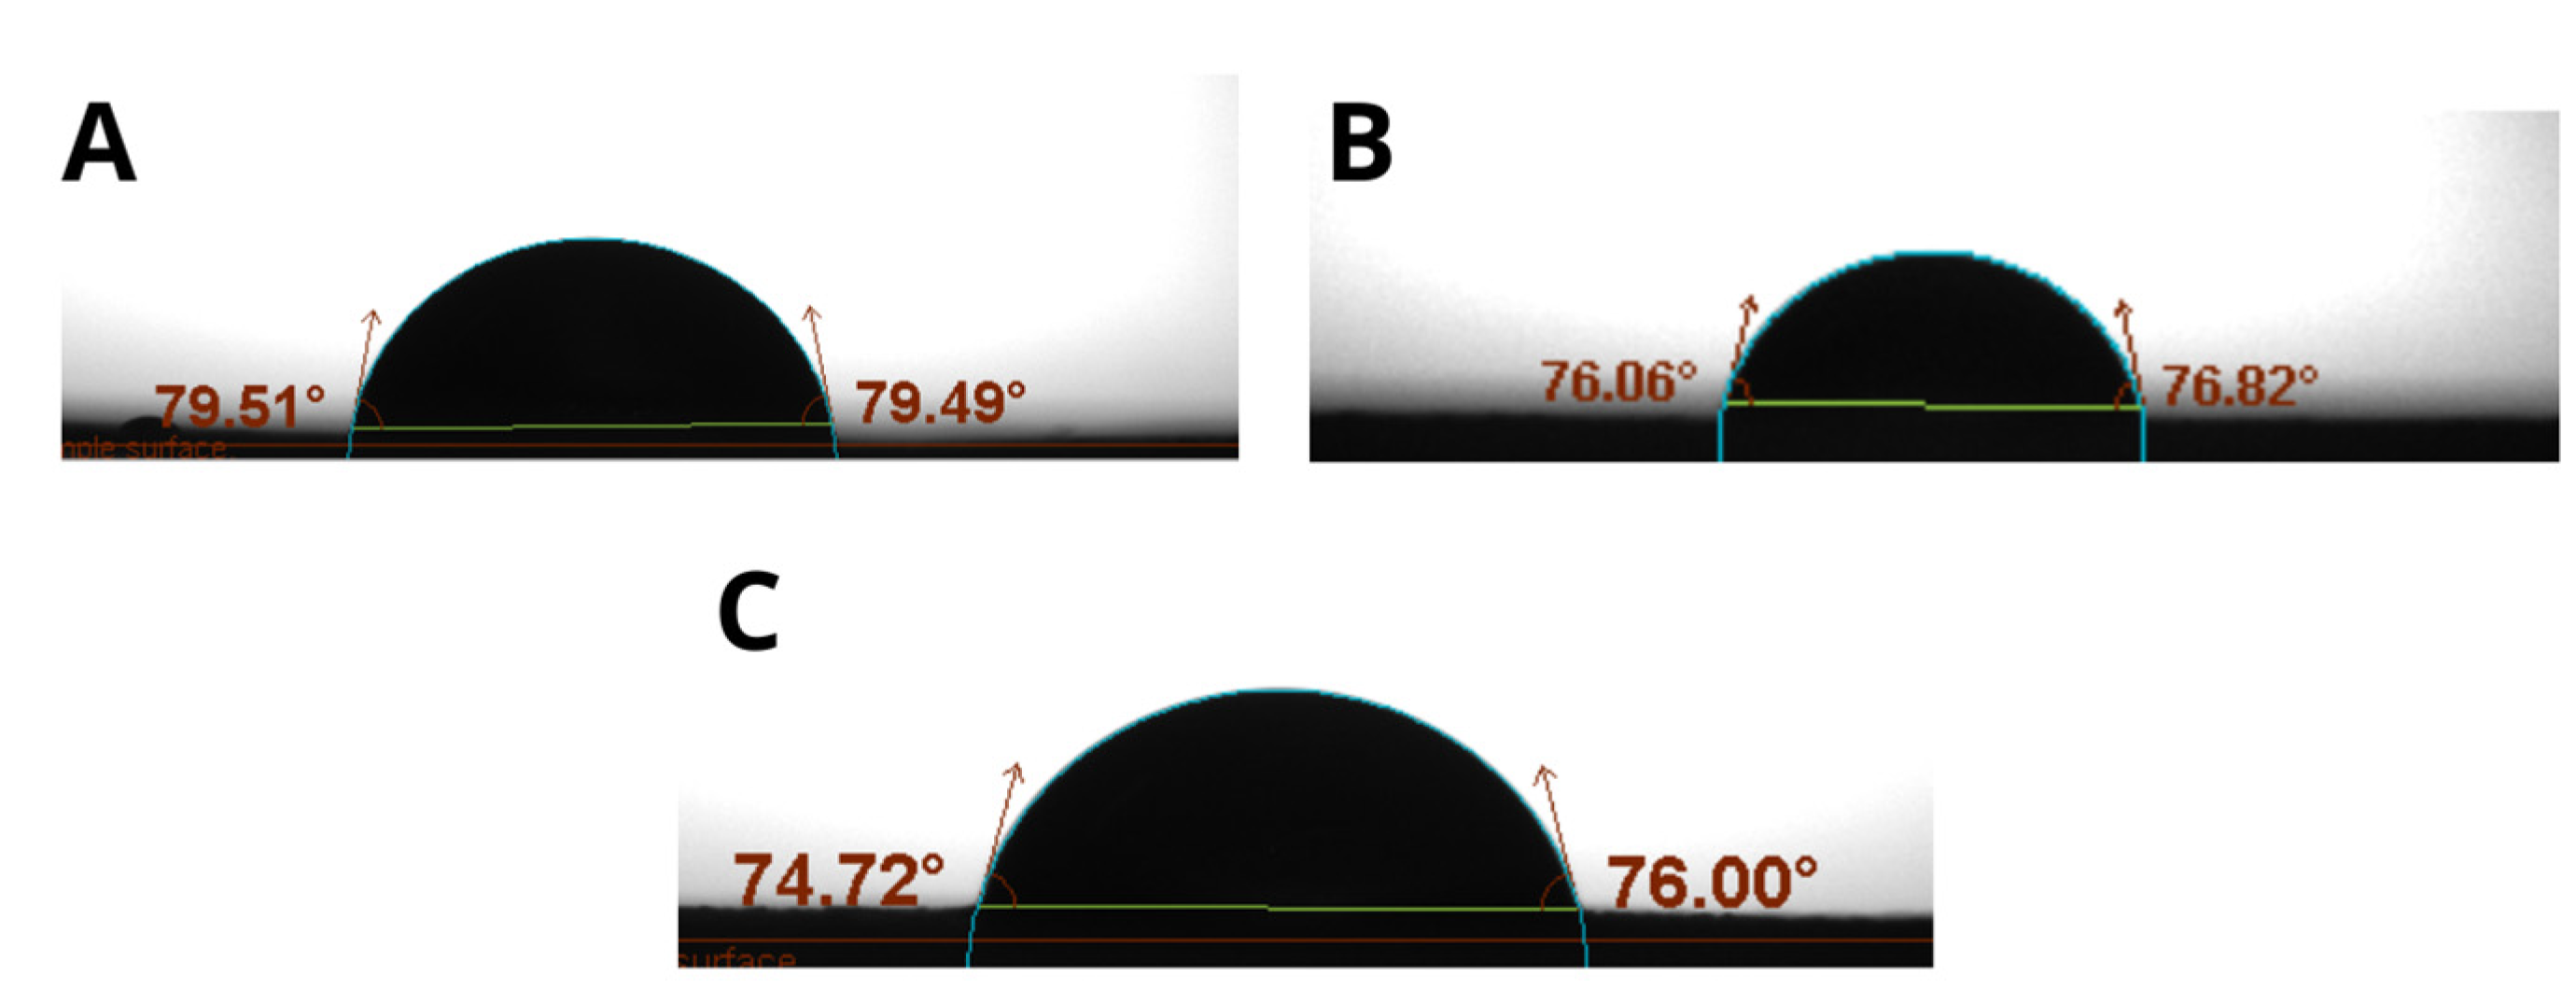
The increase in roughness, especially on the front side of the films, is related to the viscoelastic properties of the forming solutions, a higher storage modulus G' suggests a more cohesive and rigid matrix [35] which can generate a rougher surface by increasing the contact angle due to the internal stress generated along the drying process [36,37] Thus, the rheological properties are directly related to the surface structure and the hydrophobic behavior of the films.
3.4.1. Tensile Strength (TS)
The initial tensile strength of the films was 13.93 ±0.44 MPa for 0.8% TG concentration and 19.41 ±0.67 MPa for 1.0% TG, reaching a maximum of 27.93 MPa with 50% OP in the TG 0.8 G 30 formulation. It was evidenced that the combination of TG and OP strengthened the polymeric matrix, improving the mechanical resistance by up to 50.21%. The increase of GL reduced the tensile strength due to the decrease of intermolecular forces in the polymeric chains [23,32]. Tensile strength presented values between 10 and 20 MPa, being proportional to OP concentration. Previous studies containing nanocellulose, polyvinyl alcohol and glutaraldehyde showed similar results [24,39]. Typically, food films report tensile strength values between 15 to 25 MPa, ensuring durability and flexibility, which is consistent with formulations of TG between 0.8% and 1.0% with 50% OP.
3.4.2. Elongation (%)
The tests reported low elongation percentages: 2.86% for composition 9 and 6.27% for composition 8, both with 1.0% TG, suggesting a more compact polymeric matrix. In contrast, compositions with 0.8% TG and 50% GL showed higher elongations, 31.07% (composition 5) and 40.68% (composition 4), indicating that OP concentration reduces elongation due to the structural nature of cellulose [19]. GL acted as a plasticizer, increasing flexibility by 78.86%. Higher GL concentration increases elongation by weakening intermolecular forces and favoring the formation of hydrogen bonds, which improves flexibility but decreases tensile strength [25,26].
Analizing Figure 7A, Figure 7B and Figure 7D, it can be observed the important effect of OP on the Tensile Strength as well as on the Elongation of the films. That effect is diminished in the compositions presented in Figure 7C. The impact of TG on the mechanical properties can be appreciated by comparing Figure 7B and Figure 7D. The combination of high OP and TG concentrations produces an important increase in Tensile Strength and at the same time a reduction in the elongation of the films. The results suggest that important interactions take place between the film components.
3.4.3. Young Modulus (YM)
Table 5 shows that films with 1.0% TG have slightly higher Young's modulus values compared to those containing 0.8%. The highest values were 400 MPa and 402 MPa for compositions 3 and 9, which also have the highest concentrations of OP. This increase in Young's modulus is due to the increased stiffness in the film, caused by the molecular interactions between OP and TG, which strengthen the polymeric matrix [27,28].
Food coatings, showed Young's modulus between 10 and 500 MPa, with greater flexibility in those formulations with more plasticizer. Films with 0.8% TG are more flexible, which is suitable for conforming to irregular surfaces, while those containing 1.0% TG have a higher Young's modulus, suggesting higher stiffness, preferable for foods requiring a stronger barrier.
The YM exhibited a broad range from 27 to 402 MPa, indicating the significant influence of each component and their interactions. The important role of OP in increasing YM can be observed in Table 5, showing a direct proportionality to OP concentration. For instance, in formulations with 0.8% TG and 30% G, YM increased from 79.54 MPa in the absence of OP to 400.41 MPa with 50% OP. A similar trend was observed in formulations with 1.0% TG, where YM reached its highest value of 402.34 MPa.
TG also plays a key role in YM. Comparing samples 1 and 7, which do not contain OP and have the same glycerol content (30%), YM increased from 79.54 MPa to 186.99 MPa when TG increased from 0.8% to 1.0%. Furthermore, glycerol's plasticizing effect is evident when comparing samples with 30% and 50% GL, as higher GL content leads to a decrease in YM, highlighting its impact on the mechanical rigidity of the films.
3.5. Mechanical-Dynamic Analysis
For the mechanical-dynamic analysis of the solutions and films, it is noted that the storage modulus was obtained by applying a tangential force to the surface of the solution, while Young's modulus was determined by applying a normal force to the film. Both moduli are linked to the elasticity and energy stored in the material. Film forming solutions and biofilms, composed of polymeric chains, exhibit both viscous and elastic behavior, which we previously defined as viscoelastic behavior.
The relationship between storage modulus (G′) and Young modulus (YM) is a key factor to linking the rheological properties of the film-forming solutions to the mechanical properties of the corresponding films. These properties, although measured in different contexts, are connected because they describe the response of the material to deformation, either in the fluid (rheology) or the solid (mechanical) state.
The G’ is a parameter that describes how the solution components interact to form a cohesive network. During the film formation process, which involves evaporation of the solvent, these interactions determine the final structure of the polymer network, which directly influences the YM.
Figure 8 compares the G' of the liquid phase with YM of the solid films, revealing differences based on TG concentration. In solutions with 0.8% TG (Figure 8A), a direct relationship between G' and YM is observed, where higher G' values correspond to stiffer films. However, in solutions with 1.0% TG (Figure 8B), the relationship becomes more complex, suggesting a stronger synergistic effect among the components. This deviation could be attributed to more intense molecular interactions at higher TG concentrations, which, under certain mixing conditions, lead to an increase in viscosity and a transition from a dilute to a concentrated regime [42,44]. In this context, the interactions between the components become more intricate, resulting in variations in the structural rigidity of the films.
The solutions exhibit pseudoplastic behavior, characterized by a decrease in viscosity under increasing shear stresses. This behavior suggests that the matrix possesses some elasticity, which favors the formation of more uniform and flexible films due to a homogeneous distribution of polymers. High G' in solutions with higher TG concentration indicates higher flow resistance and stronger viscoelastic behavior. This attribute predicts higher stiffness in the final film, aligning with the increase in related mechanical properties as we can see in Figure 8.
SPSS software was used to analyze the correlation between the two modules. First, normality tests were performed to determine whether parametric or nonparametric statistics should be applied, concluding that the data follow a normal distribution. Subsequently, Pearson's correlation index was calculated, which showed a significant relationship between the G’ and the YM. This relationship is direct, with a positive Pearson coefficient of 0.840, indicating a high correlation between the two moduli.
Through a logarithmic multiple regression model, the relationship between Young's modulus (YM) and several predictor variables, including storage modulus (G’) and the proportions of Tara gum (TG), Glycerol (GL) and Orange Peel (OP), was evaluated. Calculations were performed with the logarithmic values of YM and G’, obtaining the following equation:
Log(YM) = 6.813 + 0.669 Log(G′) + 0.467 (TG) − 0.024 (GL) + 0.002 (OP),
In this equation, the coefficient associated to log(G’) equal to 0.669, indicates that a 1% increase in storage modulus generates an approximate 0.669% increase in Log(YM), assuming all other variables are held constant. The coefficient of 0.467 associated to TG indicates that an increase in its concentration will cause a significant raise in YM (p= 0.004). This can mean that TG, being a polysaccharide with hydroxyl groups, facilitates the interaction with other polymer chains like pectin and cellulose, which improves the mechanical strength of the films [17, 33]. Its positive effect on the mechanical properties of the films suggests that increasing TG enhances its interaction with other matrix components through hydrogen bonding, a behavior that has also been observed in other studies on gums [42,43]. On the other hand, the proportions of GL and OP have a less significant impact. For each unit increase in the GL ratio, Young modulus decreases slightly (-0.024), reflecting a softening effect of the plasticizer on the interactions between the polymer chains. In contrast, the proportion of OP has a positive effect (0.002), which strengthens the structural cohesion of the films.
The model as a whole presents an R² = 0.928, indicating that 92.8% of the variation in log(YM) can be explained by the included predictor variables. In terms of synergy, the storage modulus exhibits a strong relationship with Young’s modulus, while the specific interactions between the components (TG, OP, and GL) play a decisive role in the final material properties. In particular, an increase in TG concentration enhances these interactions, generating a synergistic effect that influences the structure and mechanical properties of the films..
Due to its strong explanatory power, this model could be applied in the design and development of other biopolymeric film systems, facilitating the engineering of materials with optimized mechanical properties. In this context, the present study not only demonstrates the interdependence between rheology and mechanics but also validates the feasibility of mathematically modeling these interactions, making a notable contribution to the biopolymer materials science.
4. Conclusions
Analysis of mechanical, rheological, and barrier properties has revealed a complex relationship between the composition of TG, OP, and GL films, highlighting a synergistic effect among these components.
A high correlation (r = 0.840) was observed between the storage modulus (G′) of film forming solutions and Young’s modulus (YM) of the corresponding films, suggesting that more cohesive solutions generate stiffer films. However, this relationship is not strictly linear, indicating that additional factors, such as polymer-plasticizer interactions, significantly influence the final material properties.
The synergy between TG and OP has proven to be a key factor in optimizing the polymeric matrix. TG, rich in mannose and galactose, contributes to the stiffness and mechanical strength of the films, while OP, primarily composed of cellulose and pectin, enhances structural cohesion and improves material stability. Within this system, GL acts as a plasticizer, increasing flexibility but reducing overall stiffness. This interaction among components resulted in a reduction in film solubility by up to 62.43%, an improvement in mechanical strength by 50.21%, and an increase in flexibility by 78.86%.
Barrier properties were also enhanced due to this synergistic interaction. The combination of TG and OP led to lower water permeability, suggesting a more compact and structurally stable matrix. FTIR analysis confirmed the formation of cohesive networks among the components, contributing to these improvements. Additionally, the contact angle measurements indicated increased hydrophobicity in formulations with higher TG and OP contents, implying greater moisture resistance.
Overall, the rheological results reveal that a higher G′ is associated with a more structured and mechanically stable matrix. This viscoelastic behavior not only influences mechanical resistance but also plays a crucial role in film barrier performance and solubility, demonstrating that more cohesive systems yield more effective materials for functional applications.
The strong correlation between rheological and mechanical properties underscores the importance of understanding the combined effect of these biopolymers in the development of sustainable and high-performance coatings.This approach not only quantifies the interdependence between viscoelasticity and stiffness but also provides a novel analytical framework for the design and optimization of biopolymers. Given the statistical robustness and applicability of the model that correlates the elastic modulus to the Young modulus it may be extended to other biopolymeric film systems, facilitating the development of sustainable and high-performance coatings for various industrial applications.
Author Contributions
Conceptualization, L.F.M.Z. and N.J.O.C.; Investigation, N.J.O.C; Writing—original draft preparation, N.J.O.C.; Writing—review and editing, L.F.M.Z. and M.A.M.; Supervision, L.F.M.Z.; Funding acquisition, N.J.O.C. All authors have read and agreed to the published version of the manuscript.
Funding
Special thanks to the Consejo Nacional de Ciencia, Tecnología e Innovación (CONCYTEC) and the Programa Nacional de Investigación y Estudios Avanzados (PROCIENCIA) for funding this project under competition E073-2023 01 “Undergraduate and graduate theses in science, technology and technological innovation” with contract PE501084540 - 2023.
Institutional Review Board Statement
Not applicable.
Acknowledgments
The authors would like to express their gratitude to PROCIENCIA – CONCYTEC for the funding provided within the framework of the research project. The authors also thank the Universidad Nacional de San Agustín de Arequipa (UNSA) and the Research Laboratory of Unit Operations for the institutional support and the infrastructure made available for the experimental work. Finally, special thanks are extended to MSc. Helbert Portugal for his valuable technical assistance and guidance in the proper use of laboratory equipment.
Conflicts of Interest
The authors declare no conflict of interest.
Appendix A
Table A1.
Parameters λi and Gi from the Four-Element Maxwell Model.
| # | Composition | G’ (Pa) | G’’ (Pa) | λ1 (s) | λ2 (s) | λ3 (s) | λ4 (s) | ||||||
| G1’ | G2’ | G3’ | G4’ | G1’’ | G2’’ | G3’’ | G4’’ | ||||||
| 1 | TG0.8 GL30 OP00 | 36.7195 | 0.8921 | 0.0470 | 0.0046 | 18.2947 | 3.0912 | 0.7153 | 0.0284 | 0.0026 | 0.0171 | 0.071 | 0.4556 |
| 2 | TG0.8 GL30 OP20 | 58.2956 | 0.4730 | 0.0750 | 0.0090 | 12.1746 | 0.7287 | 0.0362 | 0.0046 | 0.0027 | 0.0226 | 0.1024 | 0.4865 |
| 3 | TG0.8 GL30 OP50 | 62.6390 | 0.6613 | 0.3665 | 0.1658 | 15.0197 | 0.7785 | 0.0219 | 0.0018 | 0.0064 | 0.0019 | 0.0805 | 0.4436 |
| 4 | TG0.8 GL50 OP00 | 25.6624 | 0.2457 | 0.0472 | 0.0098 | 11.8080 | 0.3620 | 0.0638 | 0.0024 | 0.0125 | 0.0125 | 0.0618 | 0.3145 |
| 5 | TG0.8 GL50 OP20 | 48.8098 | 0.9989 | 0.0572 | 0.0078 | 20.6085 | 0.4081 | 0.0854 | 0.0071 | 0.0033 | 0.0650 | 0.0135 | 0.4014 |
| 6 | TG0.8 GL50 OP50 | 51.1893 | 0.8324 | 0.0939 | 0.0529 | 13.0736 | 0.9896 | 0.0683 | 0.0053 | 0.0027 | 0.0158 | 0.0893 | 0.5140 |
| 7 | TG1.0 GL30 OP00 | 85.4421 | 0.4263 | 0.0637 | 0.0032 | 32.6352 | 0.6668 | 0.0426 | 0.0015 | 0.0017 | 0.007 | 0.0451 | 0.3206 |
| 8 | TG1.0 GL30 OP20 | 53.0965 | 0.9432 | 0.0155 | 0.0016 | 29.2252 | 0.7263 | 0.0483 | 0.0053 | 0.009 | 0.009 | 0.0475 | 0.3505 |
| 9 | TG1.0 GL30 OP50 | 60.2448 | 0.4946 | 0.0457 | 0.0058 | 30.6586 | 0.4090 | 0.0405 | 0.0005 | 0.0077 | 0.0434 | 0.4452 | 0.1517 |
| 10 | TG1.0 GL50 OP00 | 31.8860 | 1.0003 | 0.37281 | 0.0029 | 12.9747 | 6.6379 | 0.1983 | 0.8805 | 0.0138 | 0.0138 | 0.0532 | 0.3594 |
| 11 | TG1.0 GL50 OP20 | 81.8514 | 0.5868 | 0.0260 | 0.0078 | 30.1794 | 0.7283 | 0.3000 | 0.0026 | 0.0029 | 0.0117 | 0.0615 | 0.4253 |
| 12 | TG1.0 GL50 OP50 | 64.0129 | 0.3839 | 0.0348 | 0.0048 | 43.0627 | 0.7227 | 0.0806 | 0.0065 | 0.0122 | 0.0276 | 0.0924 | 0.45805 |
*The parameters Gi represent the elastic moduli associated with each relaxation time λi. Values of Gi' correspond to the storage modulus (G'), while Gi'' correspond to the loss modulus (G'').
Appendix B
Table B1.
Abbreviations and Symbols Used in This Study.
| Symbol/Term | Description | Unit |
| TG | Tara Gum | % |
| GL | Glycerol | % |
| OP | Orange Peel | % |
| n | Behavior index | - |
| k | Flow coefficient | - |
| G′ | Storage Modulus | Pa |
| G″ | Loss Modulus | Pa |
| %S | Water solubility | % |
| WVP | Water vapor permebility | gmm/hm2kPa |
| WVTR | Water vapor transmision rate | g/m2h |
| CA | Contact angle | ° |
| TS | Tensile strength | MPa |
| %E | Percent elongation | % |
| YM | Young modulus | MPa |
| λi | Relaxation time | s |
References
- Wu, Y.; Ding, W.; Jia, L.; He, Q. The Rheological Properties of Tara Gum (Caesalpinia Spinosa). Food Chem. 2015, 168, 366–371. [Google Scholar] [CrossRef] [PubMed]
- Zibaei, R.; Hasanvand, S.; Hashami, Z.; Roshandel, Z.; Rouhi, M.; Guimarães, J. d. T.; Mortazavian, A.M.; Sarlak, Z.; Mohammadi, R. Applications of Emerging Botanical Hydrocolloids for Edible Films: A Review. Carbohydr. Polym. 2021, 256, 117554. [Google Scholar] [CrossRef] [PubMed]
- Cerqueira, M.A.; Souza, B.W.S.; Teixeira, J.A.; Vicente, A.A. Effect of Glycerol and Corn Oil on Physicochemical Properties of Polysaccharide Films—A Comparative Study. Food Hydrocoll. 2012, 27(1), 175–184. [Google Scholar] [CrossRef]
- Yun, D.; Liu, J. Recent Advances on the Development of Food Packaging Films Based on Citrus Processing Wastes: A Review. J. Agric. Food Res. 2022, 100316. [Google Scholar] [CrossRef]
- Gupta, B.R. Rheology Applied in Polymer Processing; CRC Press LLC, 2023. [Google Scholar]
- Rao, M.A. Rheology of Fluid, Semisolid, and Solid Foods, 2nd ed.; Springer: Boston, MA, USA, 2014. [Google Scholar] [CrossRef]
- Gloag, E.S.; Fabbri, S.; Wozniak, D.J.; Stoodley, P. Biofilm Mechanics: Implications in Infection and Survival. Biofilm 2020, 2, 100017. [Google Scholar] [CrossRef]
- General Principles of Rotational and Oscillatory Rheometry. ISO 3219-2; :. International Organization for Standardization: Geneva, Switzerland, 2021.
- Huamaní-Meléndez, V.J.; Mauro, M.A.; Darros-Barbosa, R. Physicochemical and Rheological Properties of Aqueous Tara Gum Solutions. Food Hydrocoll. 2021, 111, 106195. [Google Scholar] [CrossRef]
- Barbosa-Cánovas, G.V.; Kokini, J.L.; Ma, L.; Ibarz, A. The Rheology of Semiliquid Foods, 39th ed.; Academic Press: New York, NY, USA, 1996. [Google Scholar]
- Antoniou, J.; Liu, F.; Majeed, H.; Zhong, F. Characterization of Tara Gum Edible Films Incorporated With Bulk Chitosan and Chitosan Nanoparticles: A Comparative Study. Food Hydrocoll. 2015, 44, 309–319. [Google Scholar] [CrossRef]
- Mc Hugh, T.H.; Avena-Bustillos, R.; Krochta, J.M. Hydrophilic Edible Films: Modified Procedure for Water Vapor Permeability and Explanation of Thickness Effects. J. Food Sci. 1993, 58(4), 899–903. [Google Scholar] [CrossRef]
- ASTM D882; Standard test method for tensile properties of thin plastic sheets. American Society for Testing and Materials: Filadelfia, PA, USA, 2001.
- Hearn, E.J. Mechanics of Materials: An Introduction to the Mechanics of Elastic and Plastic Deformation of Solids and Structural Components, 2nd ed.; Pergamon Press: Oxford, UK, 1985. [Google Scholar]
- Liu, F.; Chang, W.; Chen, M.; Xu, F.; Ma, J.; Zhong, F. Film-Forming Properties of Guar Gum, Tara Gum and Locust Bean Gum. Food Hydrocoll. 2020, 98, 105007. [Google Scholar] [CrossRef]
- Antoniou, J.; Liu, F.; Majeed, H.; Qazi, H.J.; Zhong, F. Physicochemical and Thermomechanical Characterization of Tara Gum Edible Films: Effect of Polyols as Plasticizers. Carbohydr. Polym. 2014, 111, 359–365. [Google Scholar] [CrossRef]
- Mukherjee, K.; Dutta, P.; Badwaik, H.R.; Saha, A.; Das, A.; Giri, T.K. Food Industry Applications of Tara Gum and Its Modified Forms. Food Hydrocoll. Health 2022, 3, 100107. [Google Scholar] [CrossRef]
- Bátori, V.; Jabbari, M.; Åkesson, D.; Lennartsson, P.R.; Taherzadeh, M.J.; Zamani, A. Production of Pectin-Cellulose Biofilms: A New Approach for Citrus Waste Recycling. Int. J. Polym. Sci. 2017, 2017, 1–9. [Google Scholar] [CrossRef]
- Chhatariya, H.F.; Srinivasan, S.; Choudhary, P.M.; Begum, S.S. Corn Starch Biofilm Reinforced With Orange Peel Powder: Characterization of Physicochemical and Mechanical Properties. Mater. Today 2022. [Google Scholar] [CrossRef]
- Moscoso-Moscoso, E.; Ligarda-Samanez, C.A.; Choque-Quispe, D.; Huamán-Carrión, M.L.; Arévalo-Quijano, J.C.; De la Cruz, G.; Luciano-Alipio, R.; Calsina Ponce, W.C.; Sucari-León, R.; Quispe-Quezada, U.R.; et al. Preliminary Assessment of Tara Gum as a Wall Material: Physicochemical, Structural, Thermal, and Rheological Analyses of Different Drying Methods. Polymers 2024, 16. [Google Scholar] [CrossRef]
- Li, Y.; Tang, C.; He, Q. Effect of Orange (Citrus sinensis L.) Peel Essential Oil on Characteristics of Blend Films Based on Chitosan and Fish Skin Gelatin. Food Biosci. 2021, 41, 100927. [Google Scholar] [CrossRef]
- Aydogdu, A.; Radke, C.J.; Bezci, S.; Kirtil, E. Characterization of Curcumin Incorporated Guar Gum/Orange Oil Antimicrobial Emulsion Films. Int. J. Biol. Macromol. 2020, 148, 110–120. [Google Scholar] [CrossRef]
- Karakuş, E.; Ayhan, Z.; Haskaraca, G. Development and Characterization of Sustainable-Active-Edible-Bio Based Films From Orange and Pomegranate Peel Waste for Food Packaging: Effects of Particle Size and Acid/Plasticizer Concentrations. Food Packag. Shelf Life 2023, 37, 101092. [Google Scholar] [CrossRef]
- Ma, Q.; Hu, D.; Wang, L. Preparation and Physical Properties of Tara Gum Film Reinforced With Cellulose Nanocrystals. Int. J. Biol. Macromol. 2016, 86, 606–612. [Google Scholar] [CrossRef]
- Cazón, P.; Velazquez, G.; Ramírez, J.A.; Vázquez, M. Polysaccharide-Based Films and Coatings for Food Packaging: A Review. Food Hydrocoll. 2017, 68, 136–148. [Google Scholar] [CrossRef]
- Li, H.; Gao, K.; Guo, H.; Li, R.; Li, G. Advancements in Gellan Gum-Based Films and Coatings for Active and Intelligent Packaging. Polymers 2024, 16(17), 2402. [Google Scholar] [CrossRef]
- Moreira, M.N. d. L.; Moreira, F.K.V.; Prata, A.S. Effect of Adding Micronized Eggshell Waste Particles on the Properties of Biodegradable Pectin/Starch Films. J. Clean. Prod. 2023, 434, 140229. [Google Scholar] [CrossRef]
- Yun, D.; Liu, J. Recent Advances on the Development of Food Packaging Films Based on Citrus Processing Wastes: A Review. J. Agric. Food Res. 2022, 9, 100316. [Google Scholar] [CrossRef]
- Long, J.; Zhang, W.; Zhao, M.; Ruan, C.-Q. The reduce of water vapor permeability of polysaccharide-based films in food packaging: A comprehensive review. Carbohydr. Polym. 2023, 321, 121267. [Google Scholar] [CrossRef]
- Xue, W.; Zhu, J.; Sun, P.; Yang, F.; Wu, H.; Li, W. Permeability of biodegradable film comprising biopolymers derived from marine origin for food packaging application: A review. Trends Food Sci. Technol. 2023, 136, 295–307. [Google Scholar] [CrossRef]
- Long, J.; Zhang, W.; Zhao, M.; Ruan, C.-Q. The reduce of water vapor permeability of polysaccharide-based films in food packaging: A comprehensive review. Carbohydr. Polym. 2023, 321, 121267. [Google Scholar] [CrossRef]
- Wang, Y.; Meng, Y.; Ji, Z.; Meng, X.; Song, X.; Lu, P.; Chen, F. Bioinspired colored degradable starch-based films with excellent tensile strength. Ind. Crop. Prod. 2021, 167, 113525. [Google Scholar] [CrossRef]
- Raj, V.; Chun, K.-S.; Lee, S. State-of-the-art advancement in tara gum polysaccharide (Caesalpinia spinosa) modifications and their potential applications for drug delivery and the food industry. Carbohydr. Polym. 2023, 323, 121440. [Google Scholar] [CrossRef] [PubMed]
- Al-Hassan, A.A. Development and characterization of camel gelatin films: Influence of camel bone age and glycerol or sorbitol on film properties. Heliyon 2024, 10(9), e30338. [Google Scholar] [CrossRef] [PubMed]
- Wang, Z.; Zhang, X.; Li, X.; Wang, H.; Lü, Z.; Hu, H.; Wang, J. Flexible and low roughness cast films: promising candidates for capacitor applications. J. Mater. Sci. 2023, 58(42), 16372–16384. [Google Scholar] [CrossRef]
- Tiwari, A.; Dorogin, L.; Bennett, A.I.; Schulze, K.D.; Sawyer, W.G.; Tahir, M.; Heinrich, G.; Persson, B.N.J. The effect of surface roughness and viscoelasticity on rubber adhesion. Soft Matter 2017, 13(19), 3602–3621. [Google Scholar] [CrossRef]
- Song, G.; Wang, Y.; Tan, D.Q. A review of surface roughness impact on dielectric film properties. IET Nanodielectrics 2021. [CrossRef]
- Shaw, M.T.; MacKnight, W.J. Introduction to Polymer Viscoelasticity; John Wiley & Sons, Inc.: Hoboken, NJ, USA, 2005. [Google Scholar] [CrossRef]
- Masuelli, M.A.; García, M.G. Biopackaging: Tara Gum Films. En Advances in Physicochemical Properties of Biopolymers; Masuelli, M.A., Renard, D., Eds.; Bentham Science Publishers: London, UK, 2017; pp. 876–898. [Google Scholar]
- Ruano, P.; Lazo Delgado, L.; Picco, S.; Villegas, L.; Tonelli, F.; Eduardo Aguilera Merlo, M.; Rigau, J.; Diaz, D.; Masuelli, M. Extraction and Characterization of Pectins From Peels of Criolla Oranges (Citrus Sinensis): Experimental Reviews. En Pectins - Extraction, Purification, Characterization and Applications. IntechOpen. [CrossRef]
- Santos, M.B.; dos Santos, C.H.C.; de Carvalho, M.G.; de Carvalho, C.W.P.; Garcia-Rojas, E.E. Physicochemical, Thermal and Rheological Properties of Synthesized Carboxymethyl Tara Gum (Caesalpinia Spinosa). Int. J. Biol. Macromol. 2019, 134, 595–603. [Google Scholar] [CrossRef]
- Rodrigues, T.; Galindo-Rosales, F.J.; Campo-Deaño, L. Critical overlap concentration and intrinsic viscosity data of xanthan gum aqueous solutions in dimethyl sulfoxide. J. Non-Newtonian Fluid Mech. 2020, 286, 104406. [Google Scholar] [CrossRef]
- Clinckspoor, K.J.; Ferreira, V.H. d. S.; Moreno, R.B.Z.L. Bulk Rheology Characterization of Biopolymer Solutions and Discussions of Their Potential for Enhanced Oil Recovery Applications. CT&F - Cienc., Tecnol. Futuro 2021, 11(1), 123–135. [Google Scholar] [CrossRef]
- Hung, P.-Y.; Lai, L.-S. Structural Characterization and Rheological Properties of the Water Extracted Mucilage of Basella Alba and the Starch/Aqueous Mucilage Blends. Food Hydrocoll. 2019, 93, 413–421. [Google Scholar] [CrossRef]
Figure 1.
Flow curves for Tara gum solutions and Glycerol mixtures.
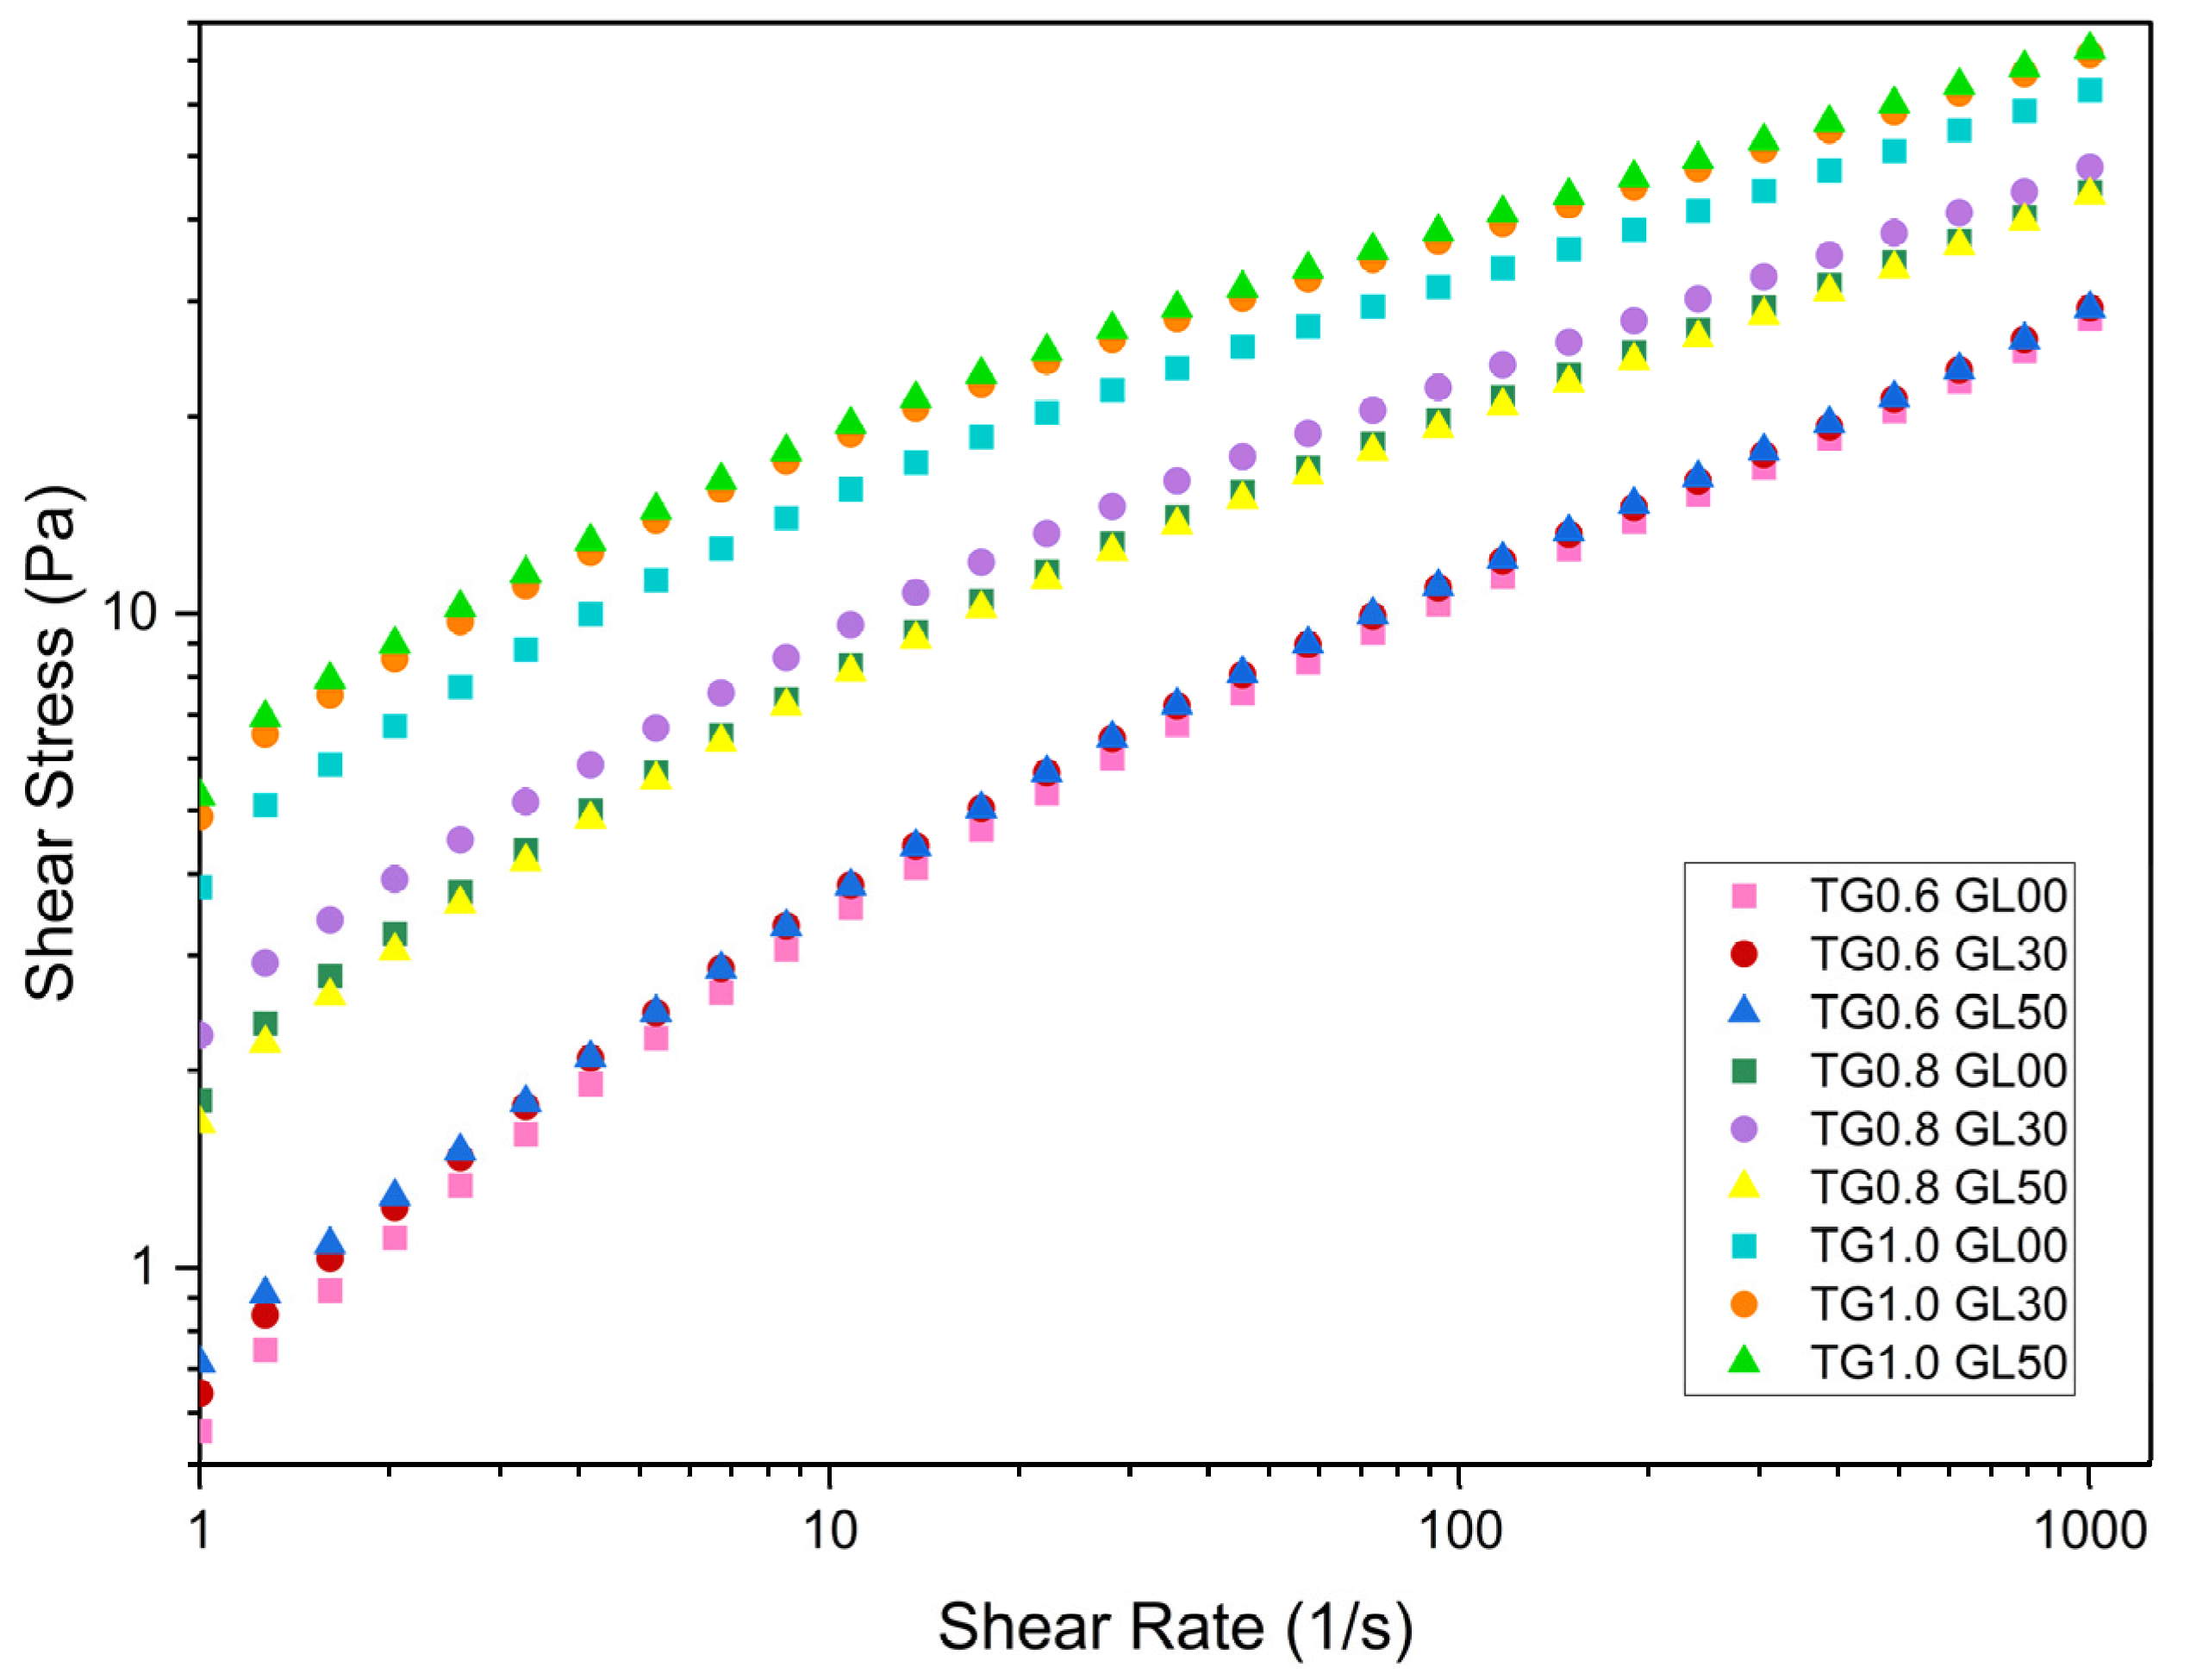
Figure 2.
Storage modulus (A) and Loss modulus (B) for TG solutions and GL mixtures.
Figure 3.
Storage Modulus (G’) and Loss Modulus (G’’): (A) Composition 1,2, and 3; (B) Composition 4,5 and 6; (C) Composition 7,8 and 9; (D) Composition 10; 11 and 12.
Figure 3.
Storage Modulus (G’) and Loss Modulus (G’’): (A) Composition 1,2, and 3; (B) Composition 4,5 and 6; (C) Composition 7,8 and 9; (D) Composition 10; 11 and 12.
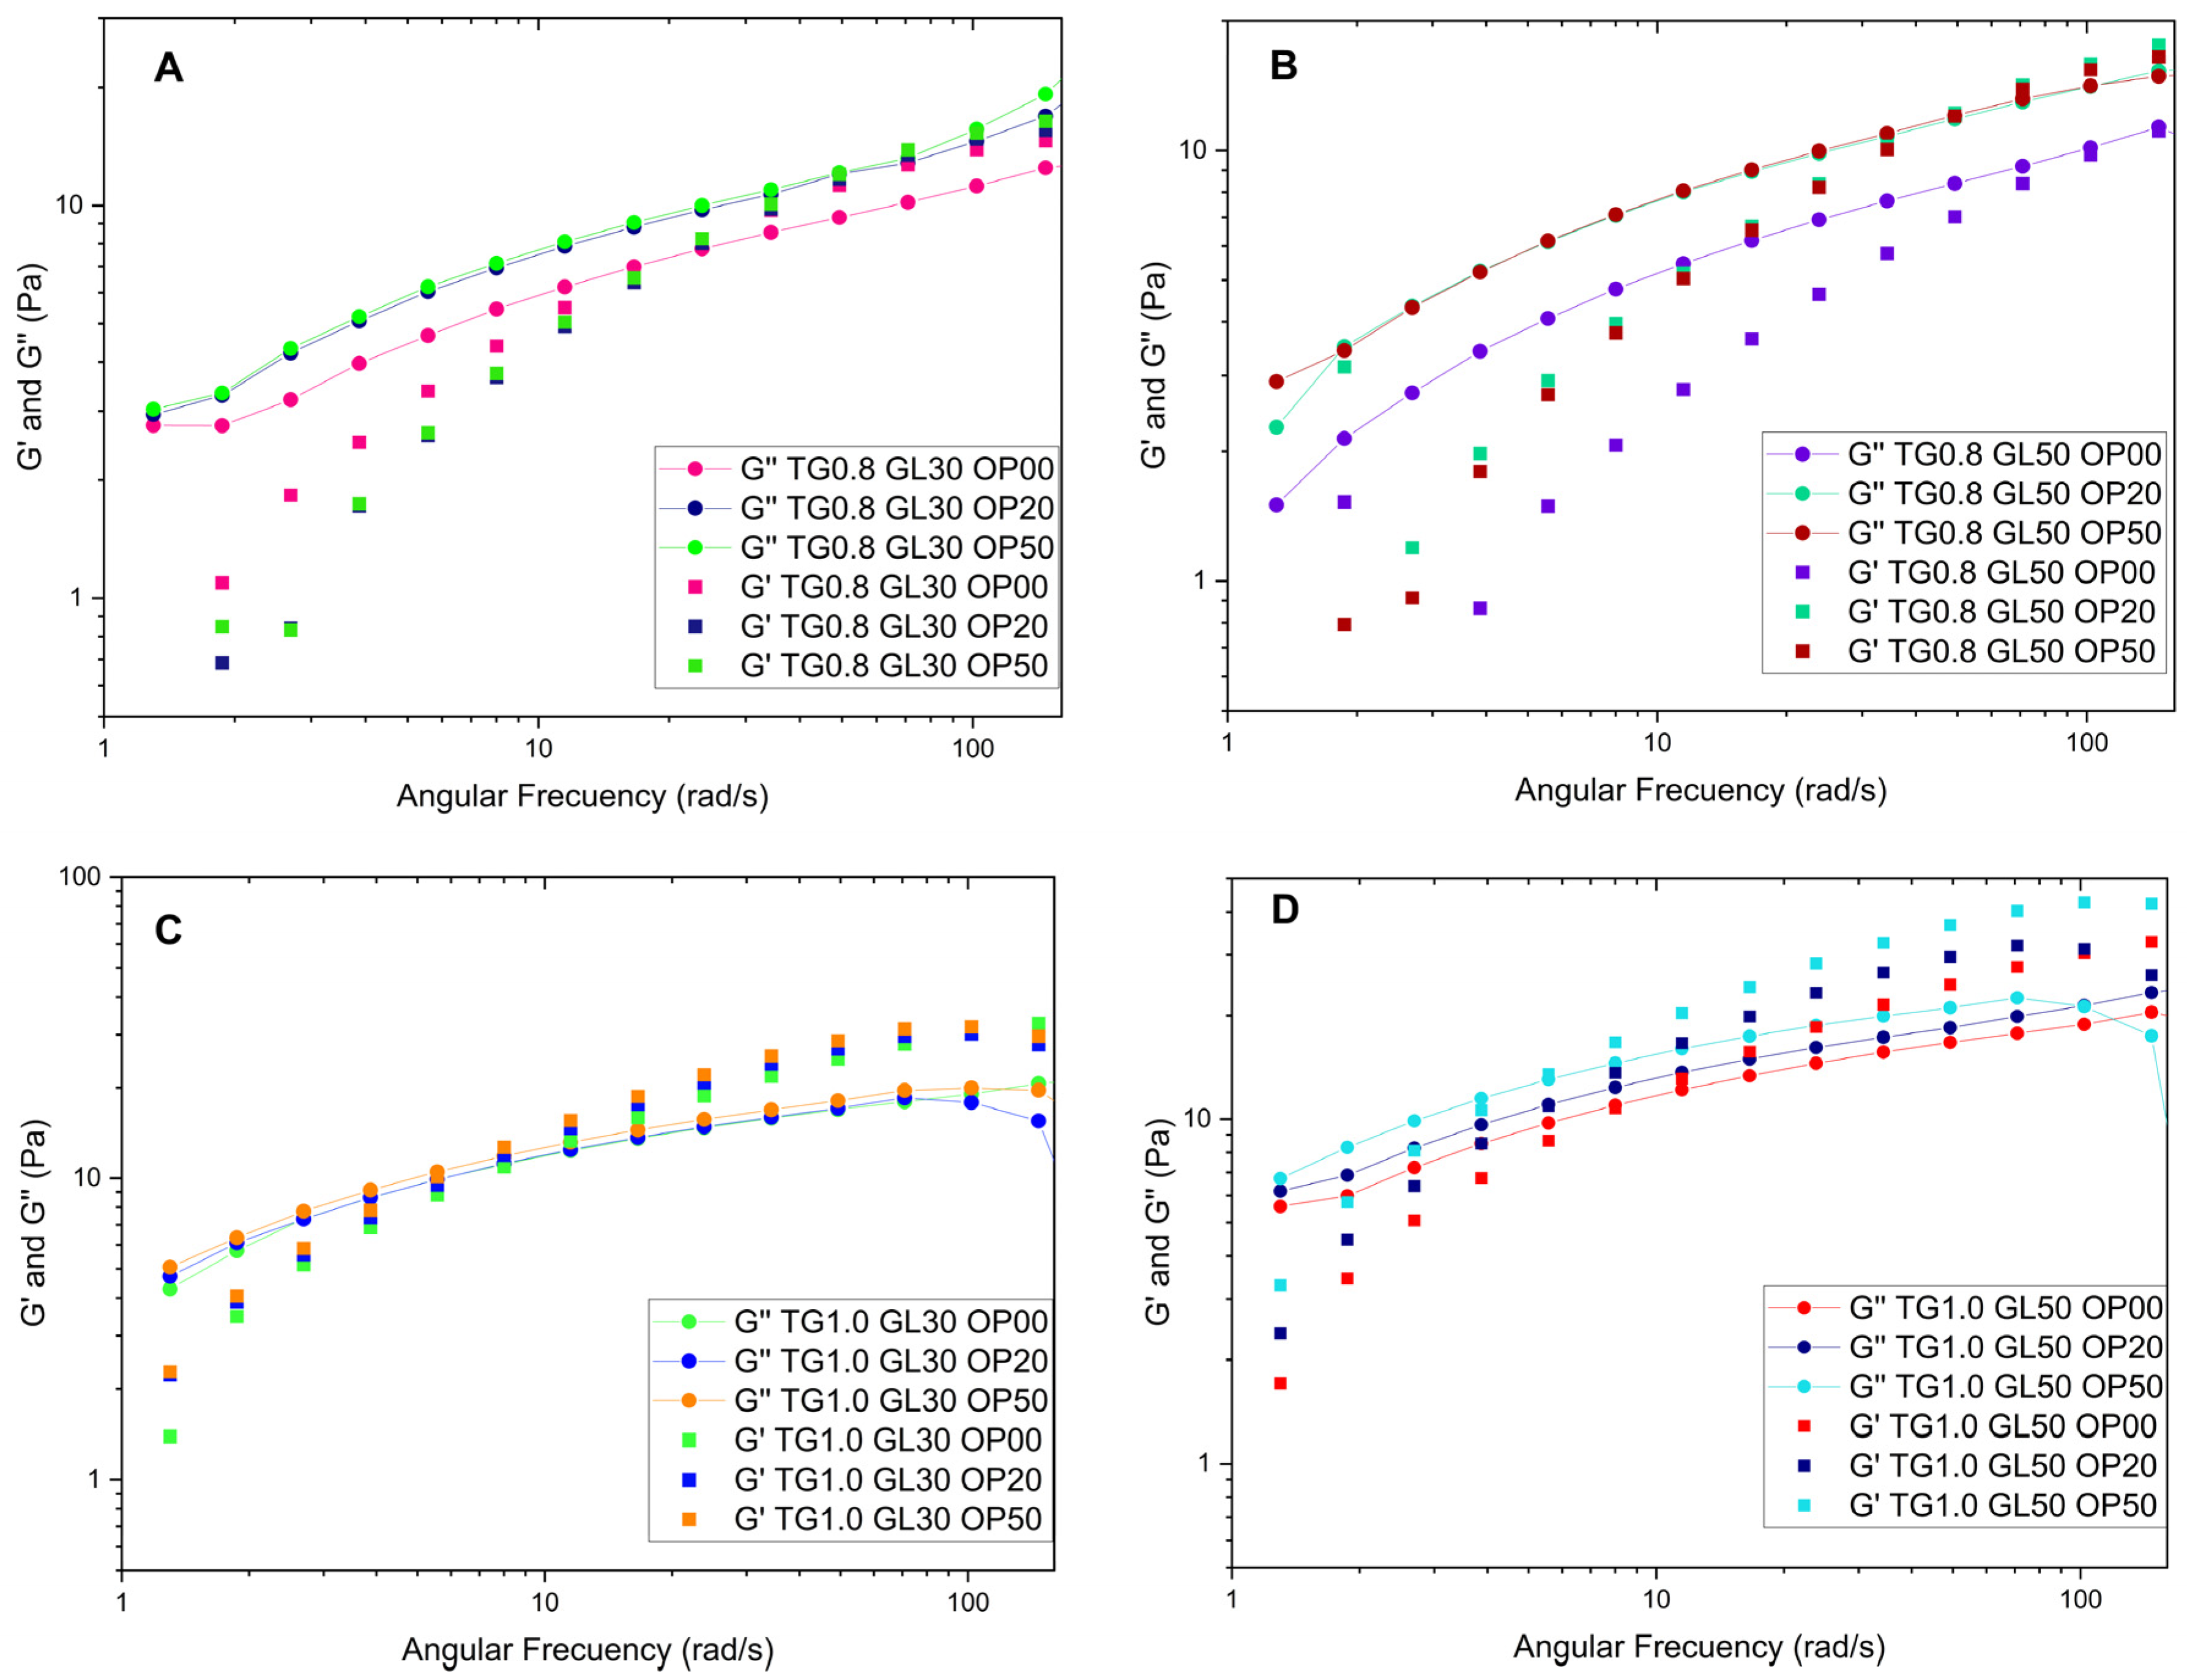
Figure 4.
Storage and loss modulus for the 12 compositions.
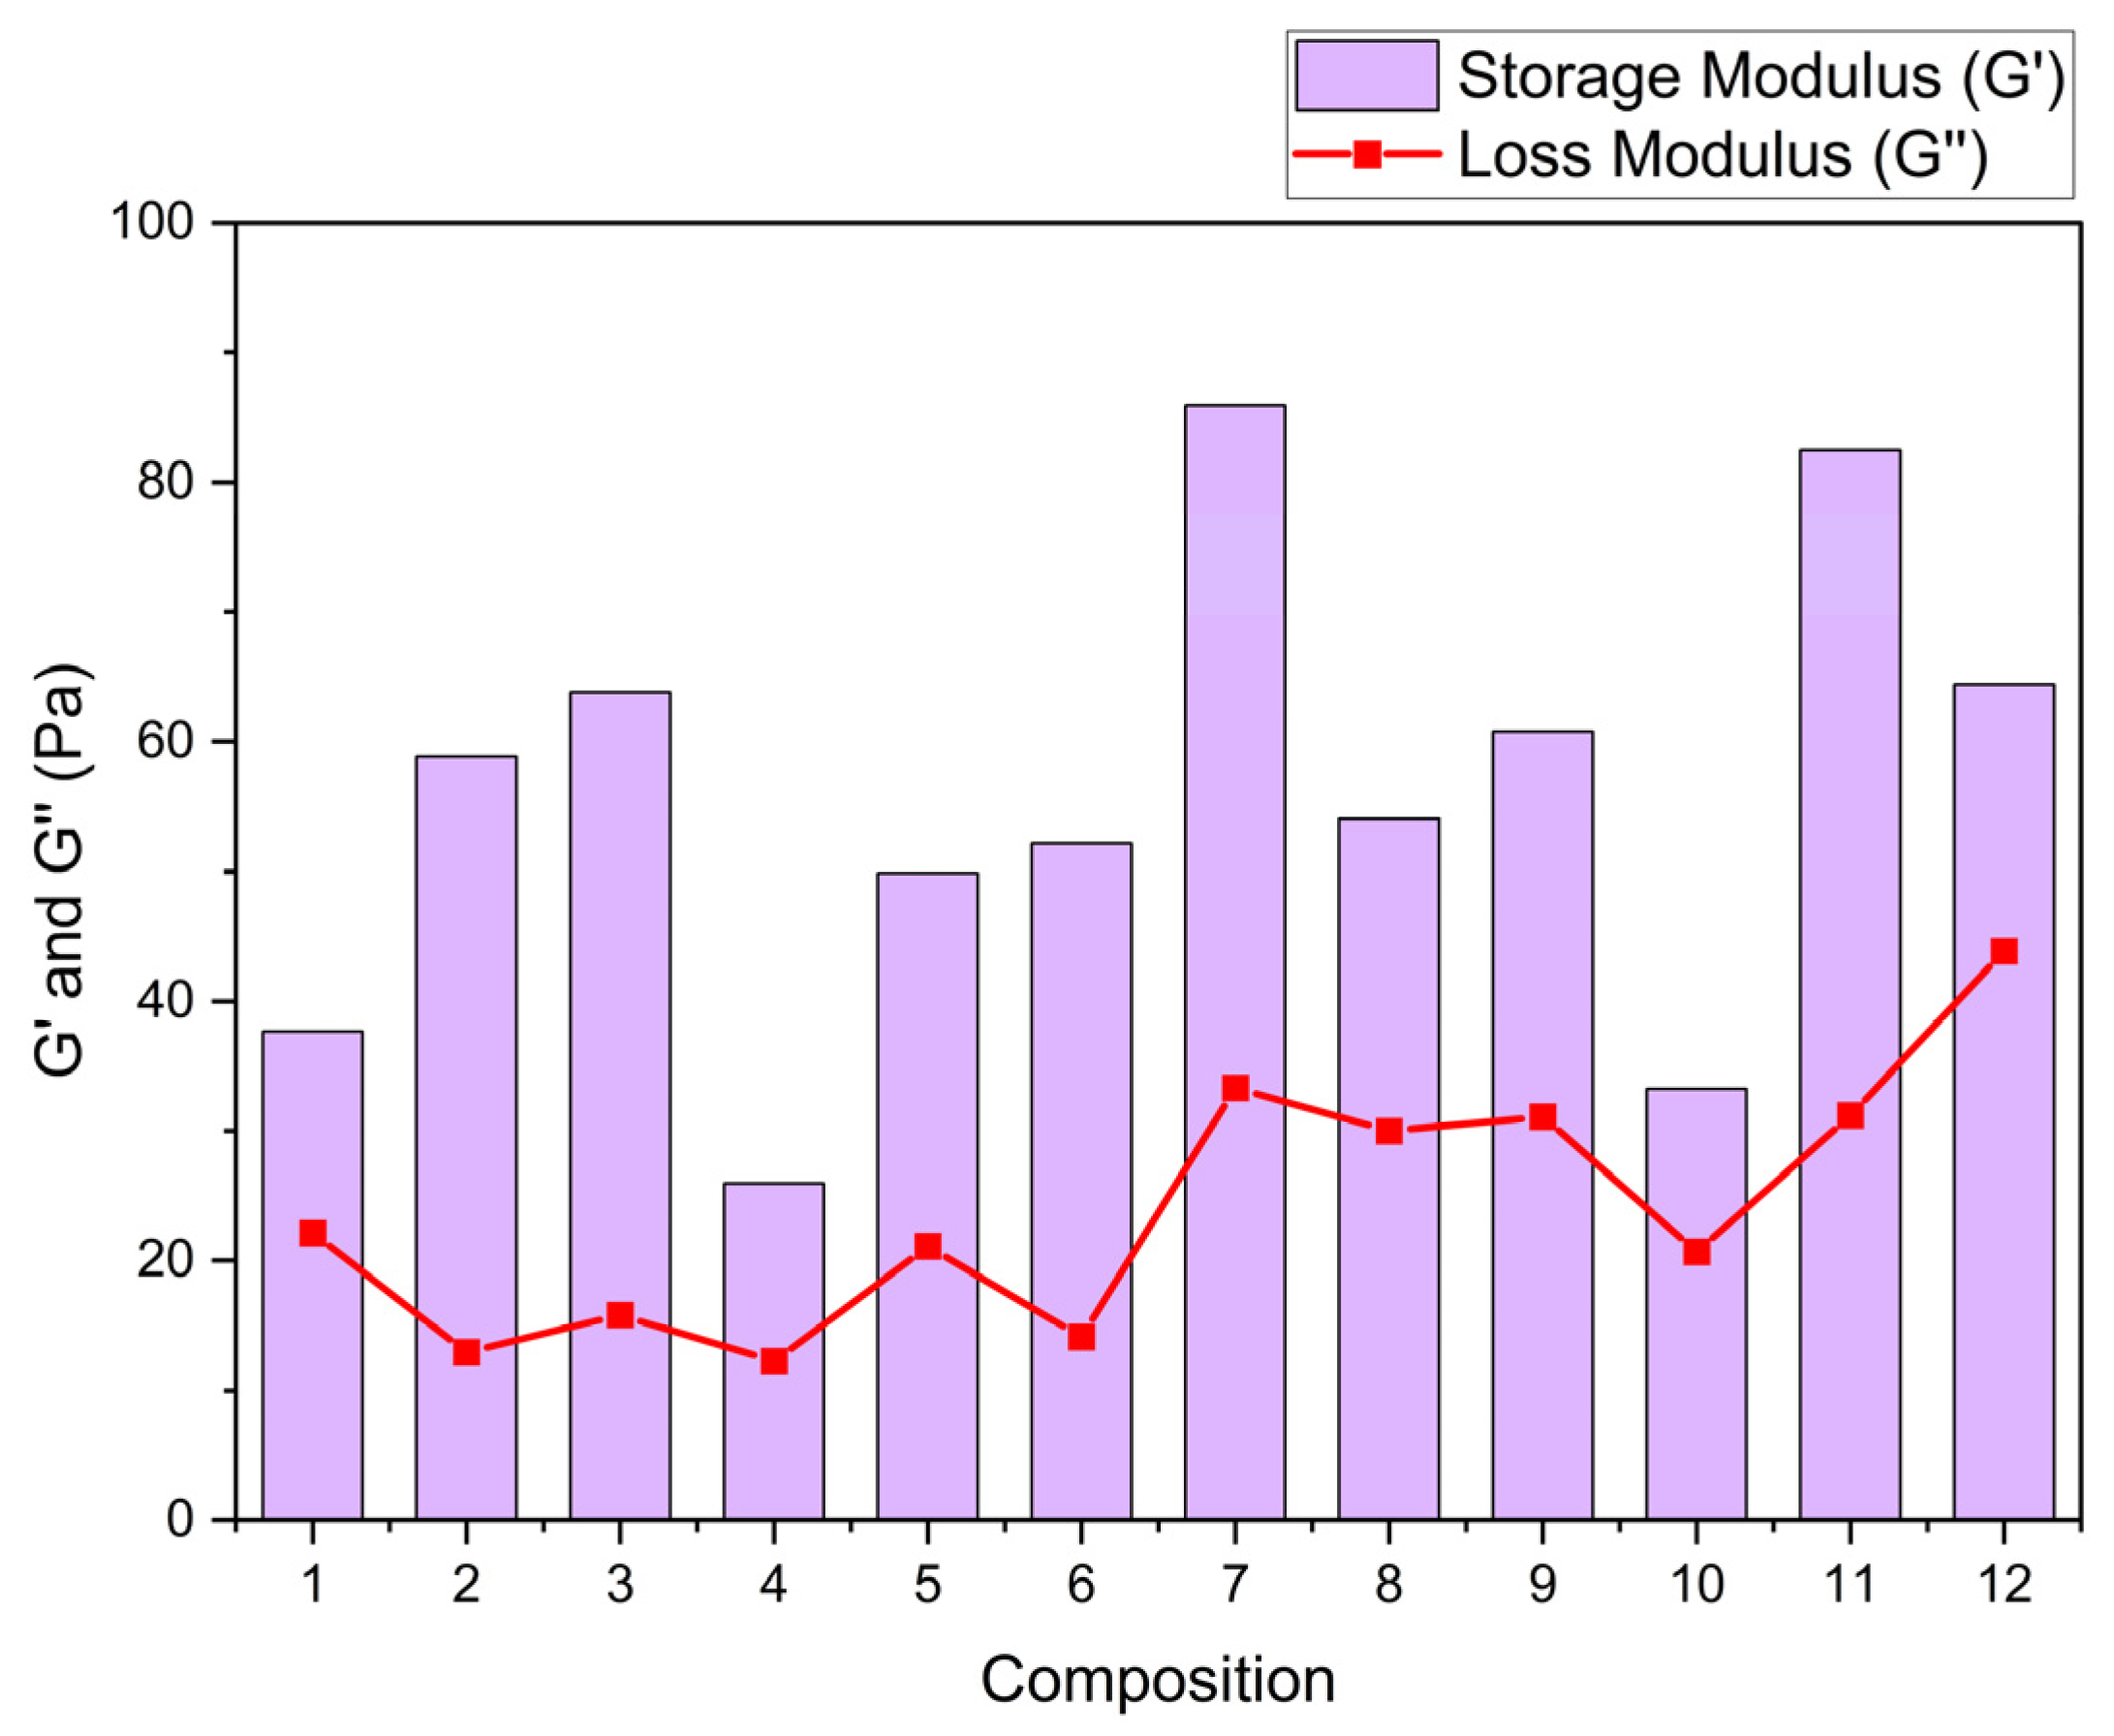
Figure 5.
FTIR spectra of the films.
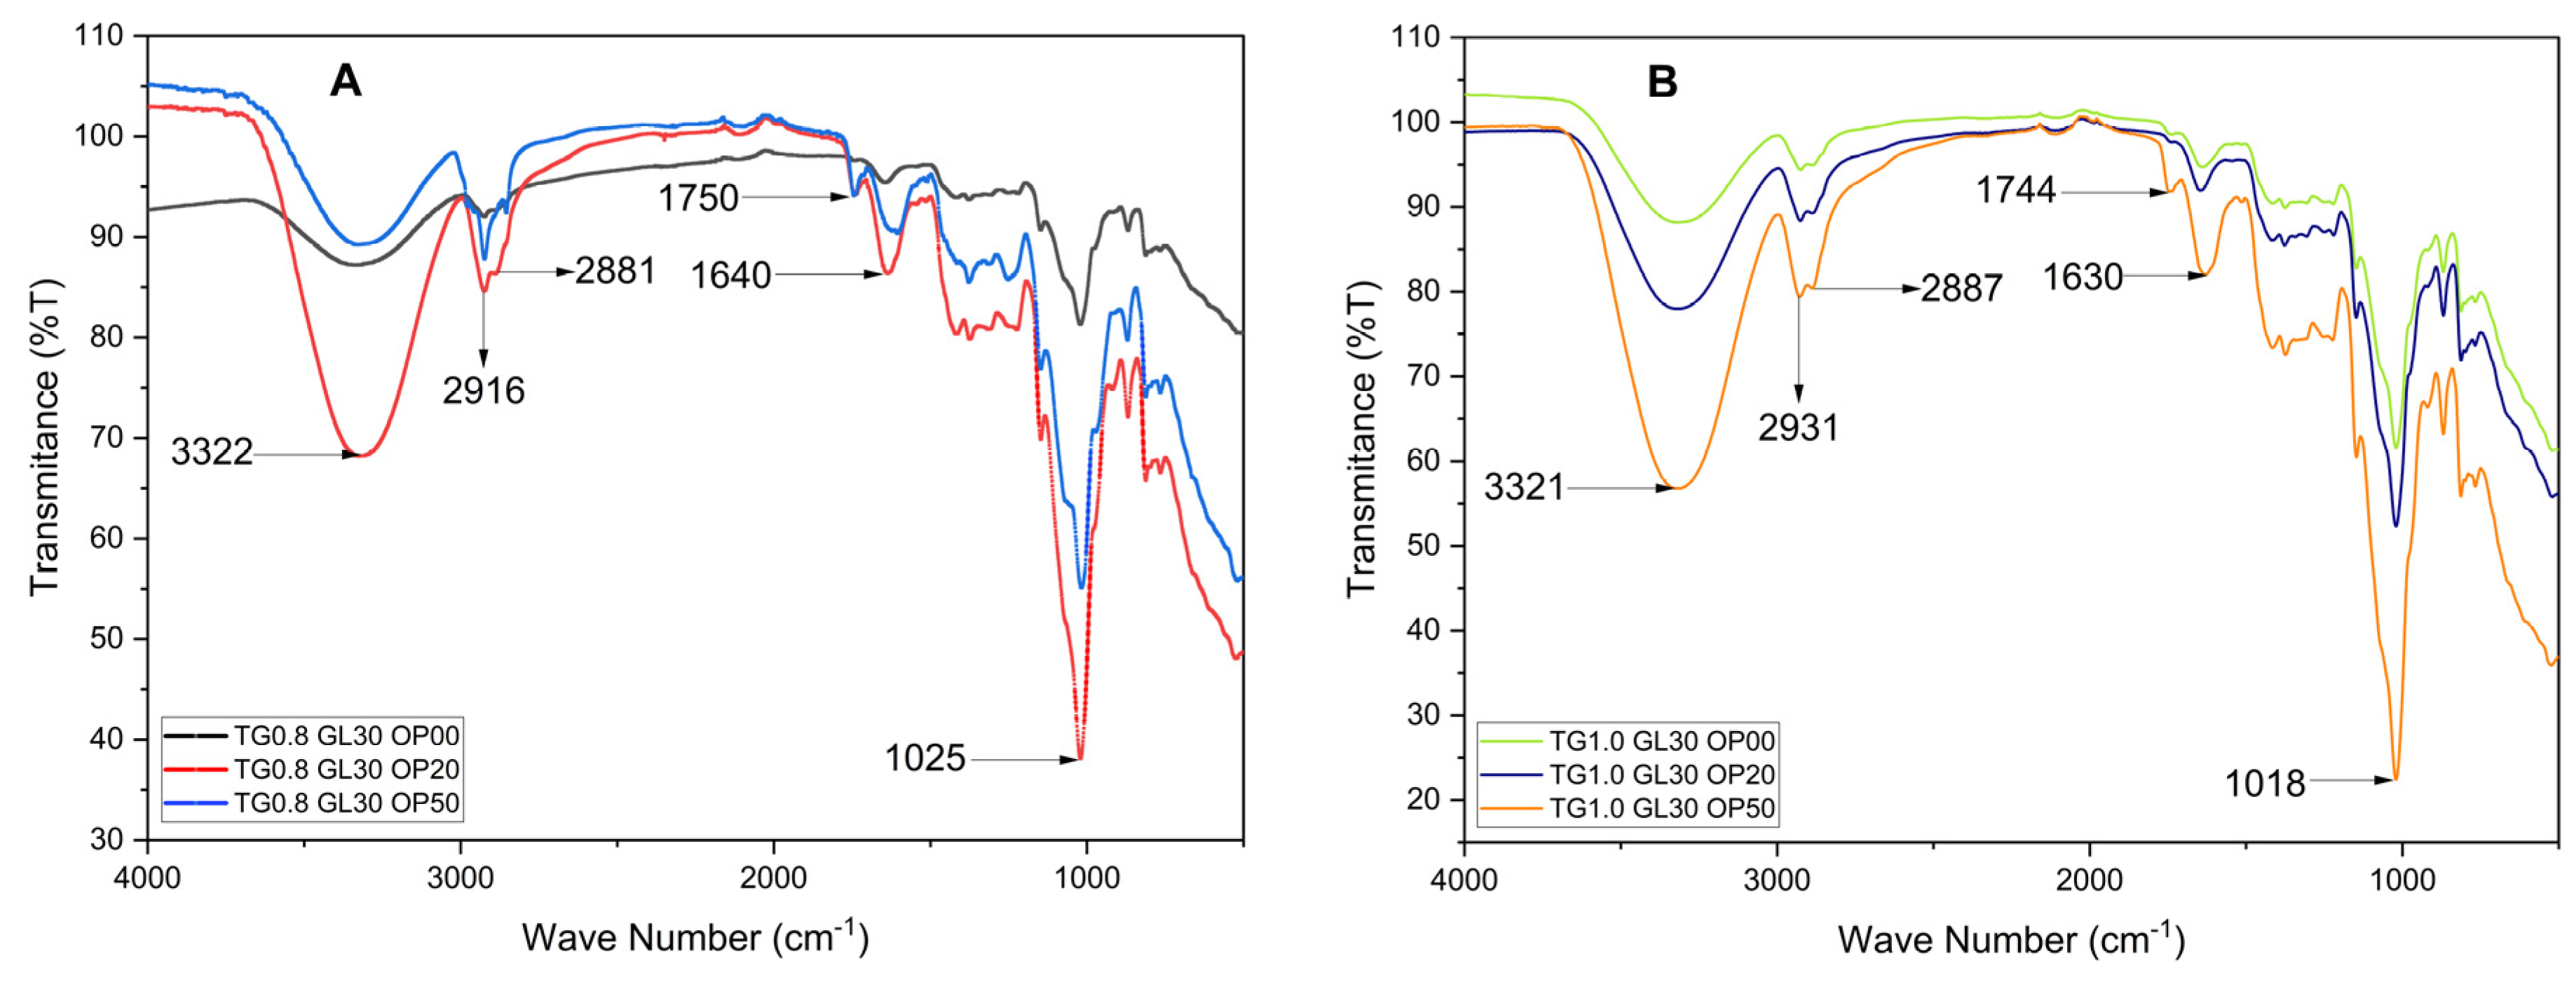
Figure 7.
Tensile Strength and Elongation for films.
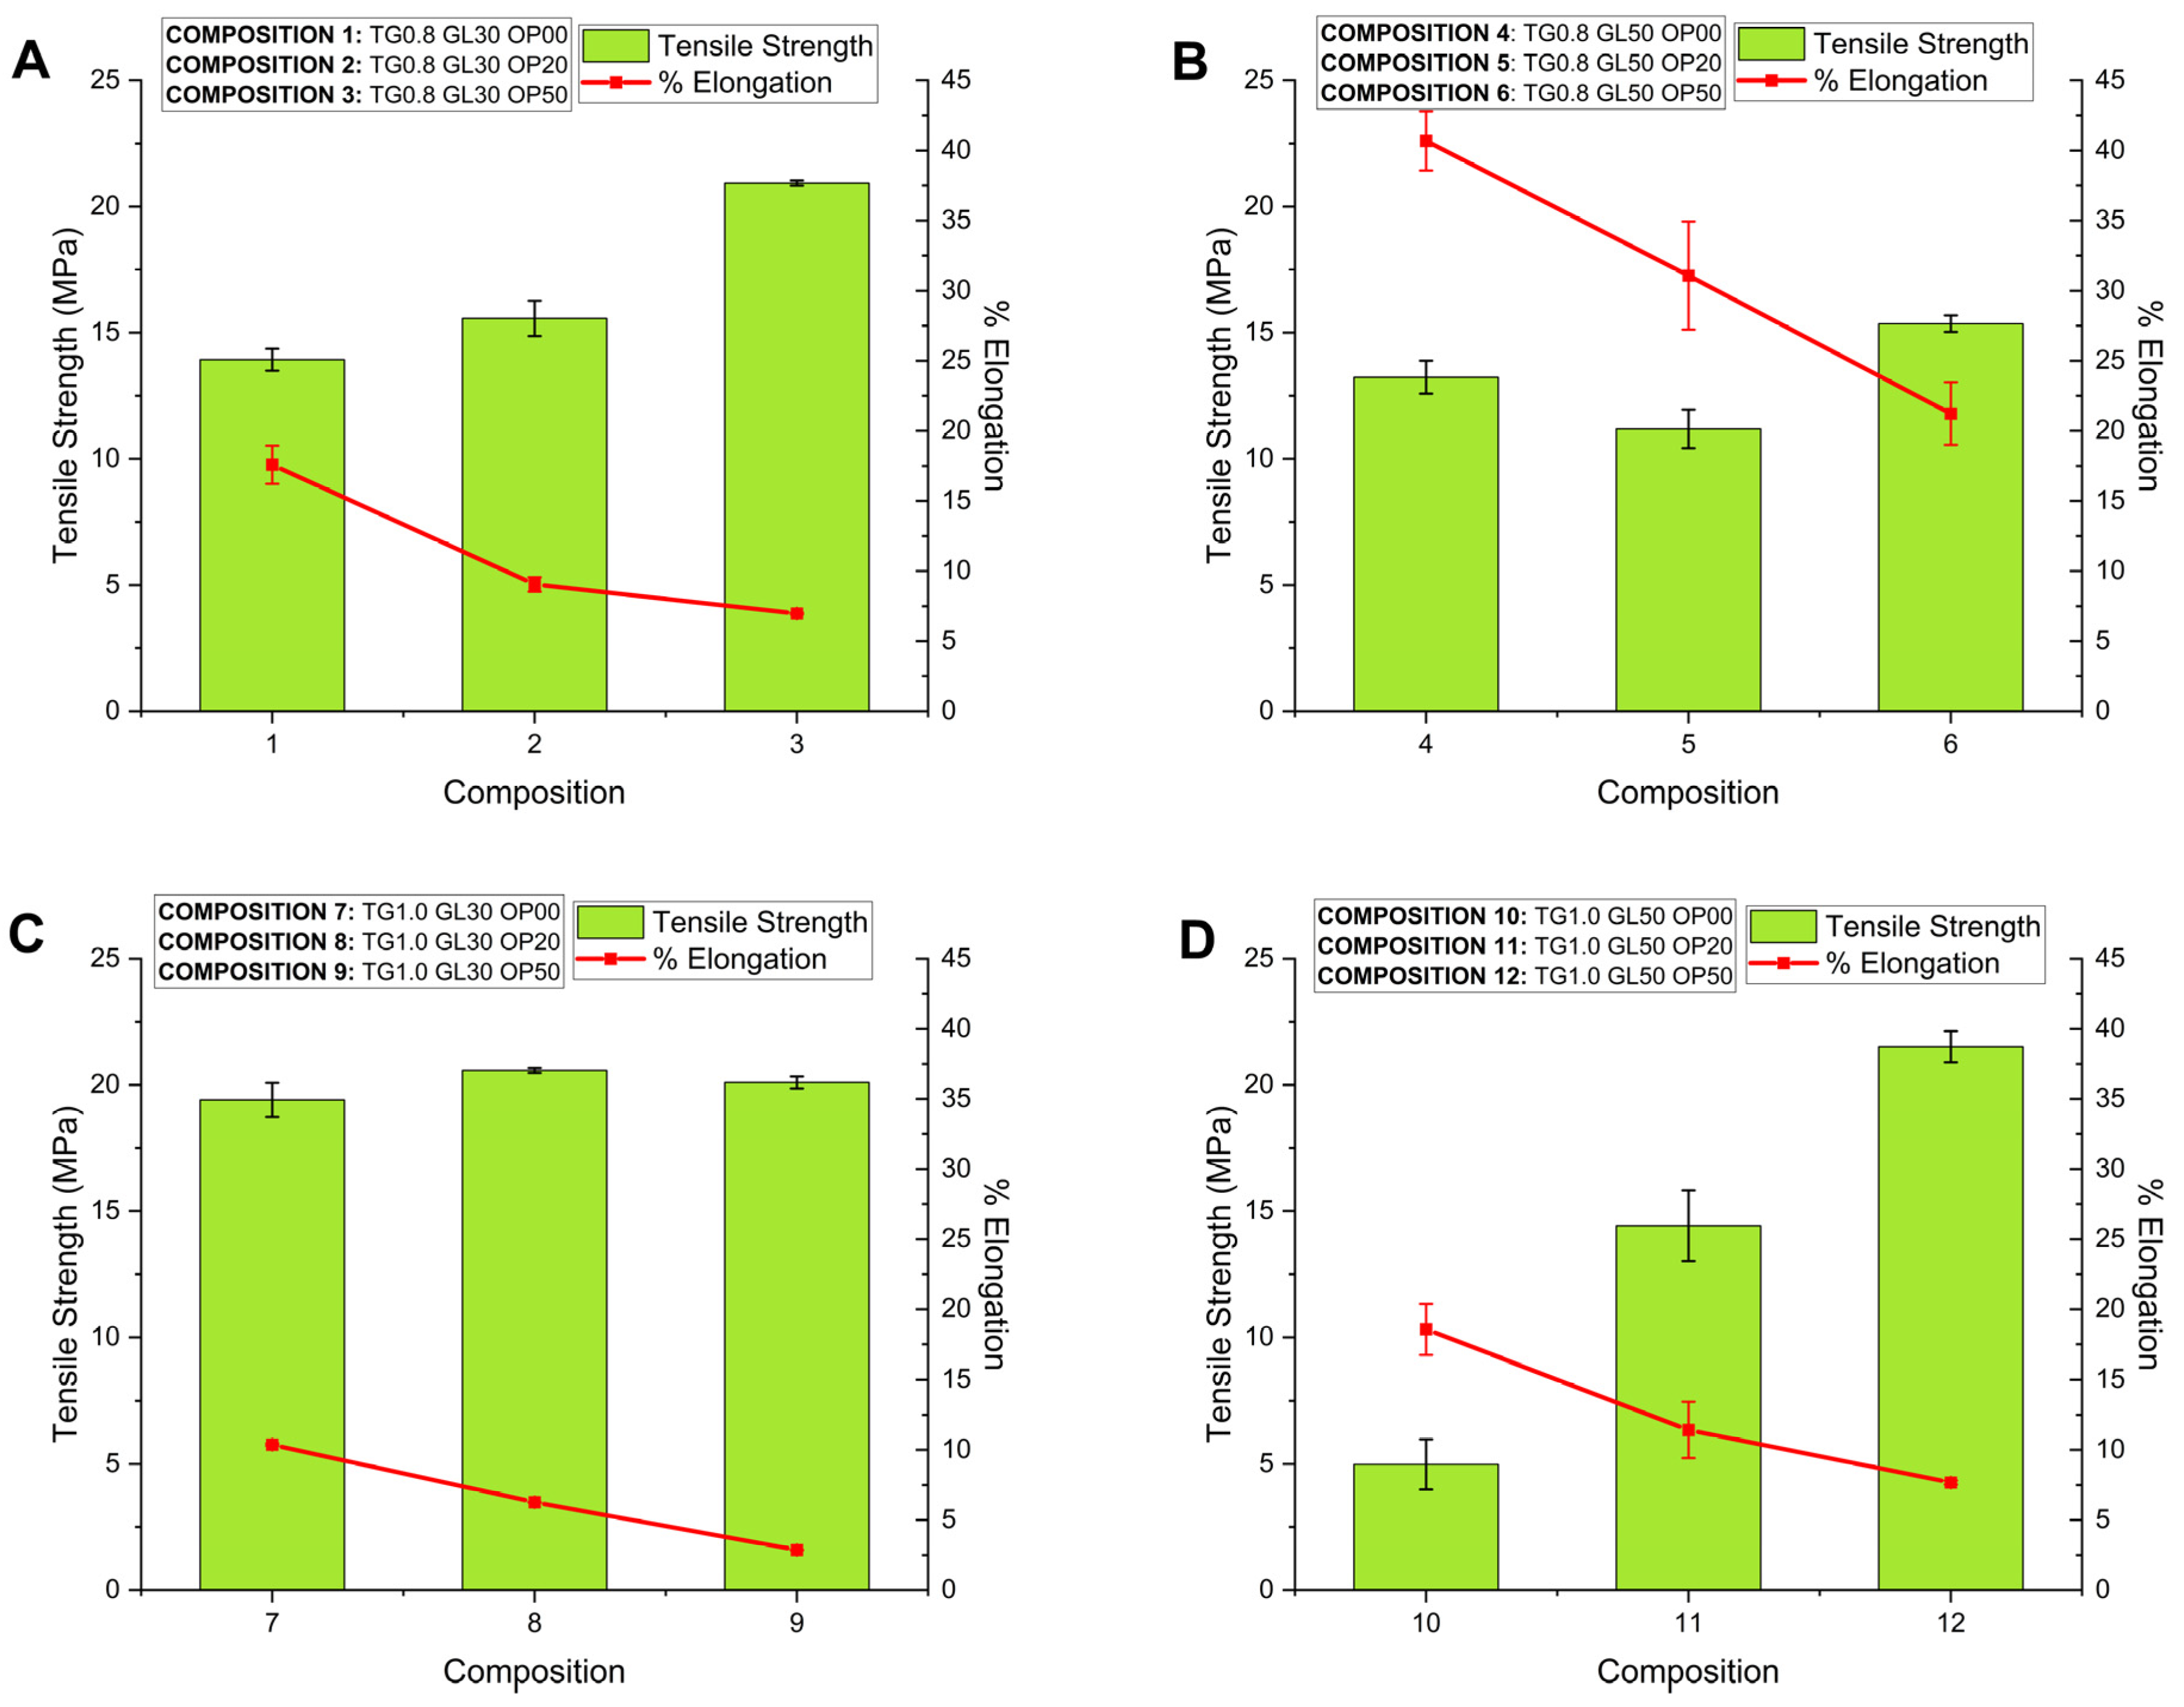
Figure 8.
Comparison of Storage Modulus (rheological) and Young's Modulus (mechanical); (A): Films with 0.8% TG; (B): Films with 1.0% TG.
Figure 8.
Comparison of Storage Modulus (rheological) and Young's Modulus (mechanical); (A): Films with 0.8% TG; (B): Films with 1.0% TG.
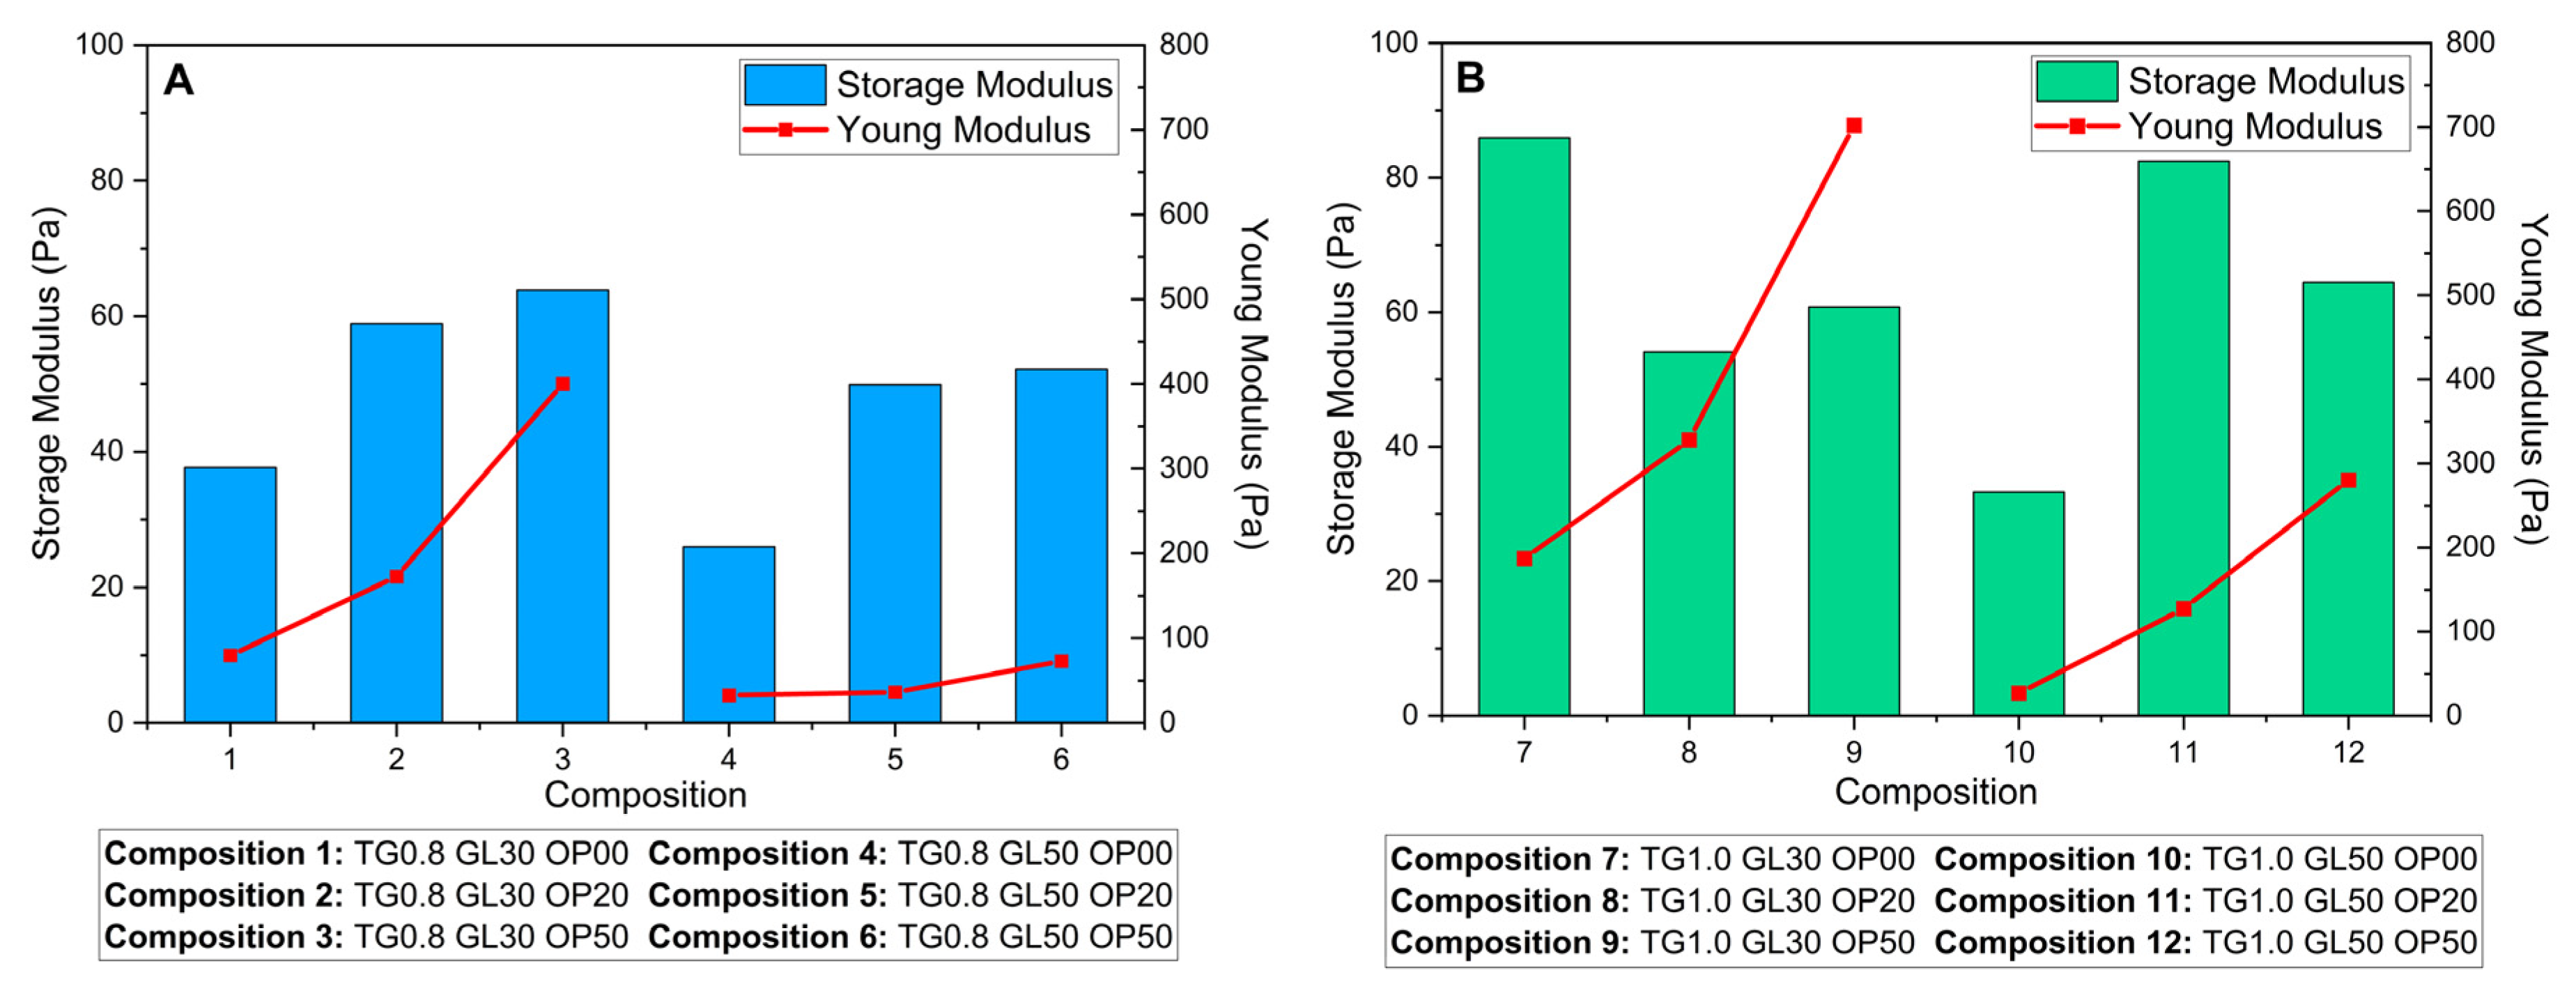
Table 1.
Herschel and Bulkley parameters for the different film-forming solutions.
| # | Composition | k (Pa.s) | n | To | R2 |
| 1 | TG0.8 GL30 OP00 | 2.113 | 0.487 | 1.238 | 0.9565 |
| 2 | TG0.8 GL30 OP20 | 1.991 | 0.580 | 1.151 | 0.9552 |
| 3 | TG0.8 GL30 OP50 | 1.942 | 0.583 | 1.269 | 0.9551 |
| 4 | TG0.8 GL50 OP00 | 1.883 | 0.487 | 0.696 | 0.9602 |
| 5 | TG0.8 GL50 OP20 | 1.868 | 0.584 | 1.058 | 0.9567 |
| 6 | TG0.8 GL50 OP50 | 1.915 | 0.579 | 1.087 | 0.9577 |
| 7 | TG1.0 GL30 OP00 | 4.582 | 0.428 | 2.890 | 0.9396 |
| 8 | TG1.0 GL30 OP20 | 3.392 | 0.545 | 2.638 | 0.9384 |
| 9 | TG1.0 GL30 OP50 | 3.489 | 0.545 | 2.789 | 0.9384 |
| 10 | TG1.0 GL50 OP00 | 4.712 | 0.426 | 3.244 | 0.9387 |
| 11 | TG1.0 GL50 OP20 | 3.726 | 0.539 | 3.125 | 0.9332 |
| 12 | TG1.0 GL50 OP50 | 4.318 | 0.529 | 3.873 | 0.9281 |
*Consider the concentrations of Tara Gum (GT) (0.8% - 1%), Glycerol (GL) (30% - 50%) and Orange Peel (OP) (0%, 20, 50%).
Table 2.
Calculated values of the Storage Modulus (G’) and Loss Modulus (G’’).
| # | Composition | Storage Modulus (Pa) | Loss Modulus (Pa) | %MSEtotal |
| 1 | TG0.8 GL30 OP00 | 37.6635 | 22.1298 | 1.0137 |
| 2 | TG0.8 GL30 OP20 | 58.8527 | 12.9443 | 3.7771 |
| 3 | TG0.8 GL30 OP50 | 63.8328 | 15.8221 | 4.1238 |
| 4 | TG0.8 GL50 OP00 | 25.9653 | 12.2364 | 0.7428 |
| 5 | TG0.8 GL50 OP20 | 49.8739 | 21.1021 | 1.2493 |
| 6 | TG0.8 GL50 OP50 | 52.1687 | 14.1370 | 2.9916 |
| 7 | TG1.0 GL30 OP00 | 85.9355 | 33.3463 | 0.5597 |
| 8 | TG1.0 GL30 OP20 | 54.0570 | 30.0054 | 0.6281 |
| 9 | TG1.0 GL30 OP50 | 60.7911 | 31.1088 | 0.4631 |
| 10 | TG1.0 GL50 OP00 | 33.2621 | 20.6917 | 0.3044 |
| 11 | TG1.0 GL50 OP20 | 82.4723 | 31.2105 | 1.7796 |
| 12 | TG1.0 GL50 OP50 | 64.4366 | 43.8726 | 0.1561 |
*Note that the tests were carried out at an angular frequency ranging from 1 to 120 rad/s. *The total mean squared error (MSE) was calculated as the sum of the individual MSE values for G’ and G’’, calculated as the total percentage error: %MSE = %MSEG’ + %MSEG’’.
Table 3.
Percentage solubility of films.
| # | Composition | % Solubility | # | Composition | % Solubility |
| 1 | TG0.8 GL30 OP00 | 72.2336 ± 0.4632 | 7 | TG1.0 GL30 OP00 | 53.4893 ± 3.0943 |
| 2 | TG0.8 GL30 OP20 | 24.3941 ± 1.8814 | 8 | TG1.0 GL30 OP20 | 49.2199 ± 3.2398 |
| 3 | TG0.8 GL30 OP50 | 41.8904 ± 4.5794 | 9 | TG1.0 GL30 OP50 | 39.8970 ± 1.7636 |
| 4 | TG0.8 GL50 OP00 | 54.1691 ± 4.1751 | 10 | TG1.0 GL50 OP00 | 41.2269 ± 2.3216 |
| 5 | TG0.8 GL50 OP20 | 22.5797 ± 2.3995 | 11 | TG1.0 GL50 OP20 | 45.6388 ± 0.6548 |
| 6 | TG0.8 GL50 OP50 | 20.3508 ± 5.7969 | 12 | TG1.0 GL50 OP50 | 40.1387 ± 1.5464 |
Table 5.
Mechanical test values.
| # | Composition | Tensile Strength (MPa) | Elongation (%) | Young Modulus (MPa) |
| 1 | TG0.8 GL30 OP00 | 13.9333 ± 0.4360 | 17.5863 ± 1.3548 | 79.5368 ± 6.5603 |
| 2 | TG0.8 GL30 OP20 | 15.5687 ± 0.6984 | 9.0451 ± 0.5165 | 172.7479 ± 17.0106 |
| 3 | TG0.8 GL30 OP50 | 20.9288 ± 0.1032 | 6.9755 ± 0.0605 | 400.4113 ± 4.5974 |
| 4 | TG0.8 GL50 OP00 | 13.2381 ± 0.6547 | 40.6834 ± 2.1129 | 32.5953 ± 2.3027 |
| 5 | TG0.8 GL50 OP20 | 11.1897 ± 7693 | 31.0786 ± 3.8572 | 36.1840 ± 2.3840 |
| 6 | TG0.8 GL50 OP50 | 15.3595 ± 0.3307 | 21.2313 ± 2.2351 | 72.7596 ± 5.9332 |
| 7 | TG1.0 GL30 OP00 | 19.4088 ± 0.6725 | 10.3780 ± 0.0813 | 186.9949 ± 5.1634 |
| 8 | TG1.0 GL30 OP20 | 20.5732 ± 0.0964 | 6.2704 ± 0.0186 | 328.1069 ± 2.4958 |
| 9 | TG1.0 GL30 OP50 | 20.0974 ± 0.2368 | 2.8614 ± 0.0180 | 402.3428 ± 3.9263 |
| 10 | TG1.0 GL50 OP00 | 4.9825 ± 0.9942 | 18.5617 ± 1.8269 | 27.0286 ± 6.1377 |
| 11 | TG1.0 GL50 OP20 | 14.4170 ± 1.3978 | 11.4221 ± 2.0106 | 127.4136 ± 11.1279 |
| 12 | TG1.0 GL50 OP50 | 21.5162 ± 0.6162 | 7.6766 ± 0.1426 | 280.4390 ± 12.9315 |
Disclaimer/Publisher’s Note: The statements, opinions and data contained in all publications are solely those of the individual author(s) and contributor(s) and not of MDPI and/or the editor(s). MDPI and/or the editor(s) disclaim responsibility for any injury to people or property resulting from any ideas, methods, instructions or products referred to in the content. |
© 2025 by the authors. Licensee MDPI, Basel, Switzerland. This article is an open access article distributed under the terms and conditions of the Creative Commons Attribution (CC BY) license (https://creativecommons.org/licenses/by/4.0/).
Copyright: This open access article is published under a Creative Commons CC BY 4.0 license, which permit the free download, distribution, and reuse, provided that the author and preprint are cited in any reuse.


