
Submitted:
28 April 2025
Posted:
29 April 2025
You are already at the latest version
Abstract
Stripe rust, caused by Puccinia striiformis f. sp. tritici (Pst), is a destructive disease of wheat worldwide. William Som (WS), an Argentinian spring wheat landrace, has consistently exhibited high level resistance to stripe rust for over 20 years in our field evaluations in Washington state, USA. A previous study showed high-temperature adult-plant (HTAP) resistance in WS. To map the HTAP resistance quantitative trait loci (QTL) in WS, 114 F5-8 recombinant inbred lines (RILs) from the cross AvS/WS were evaluated for stripe rust response in seven field environments in Washington. The RILs and parents were genotyped with the Infinium 90K SNP chip. Four stable QTL, QYrWS.wgp-1BL on chromosome 1B (669-682 Mb), QYrWS.wgp-2AL on 2A (611-684 Mb), QYrWS.wgp-3AS on 3A (9-13 Mb), and QYrWS.wgp-3BL on 3B (476-535 Mb) were identified, and they explained 10.0-19.0%, 10.2-16.7%, 7.0-15.9%, and 12.0-27.8% phenotypic variation, respectively. The resistance in WS was found to be due to additive interactions of the four QTL. For each QTL, two Kompetitive allele-specific PCR (KASP) markers were developed, and these markers should facilitate the introgression of the HTAP resistance QTL into new wheat cultivars.
Keywords:
high-temperature and adult-plant resistance
; KASP markers
; quantitative trait loci
; stripe rust
; wheat
1. Introduction
Stripe rust, or yellow rust, is one of the most significant biotic constraints affecting wheat production worldwide [1,2]. The disease can cause up to 100% yield loss in susceptible cultivars under conducive conditions [1]. Since the first detection of stripe rust in North America in 1915, numerous epidemics have been documented in the continent, some localized and others on a national or continental scale [1,2,3,4]. The most notorious stripe rust epidemics in North America are those from the United States (US) Pacific Northwest (PNW) region between 1960 and 1964 [4]. During this four-year period, the US PNW (Washington, Oregon, Idaho, and Montana) suffered substantial economic losses. For instance, in Washington state alone, estimated losses were $15 million in 1960 and $30 million in 1961 [2,4]. Following these epidemics, the deployment of stripe rust resistance genes has become one of the top priorities for breeding programs in the region, and consequently cultivars with varying degrees of resistance have been released to keep stripe rust under control [1,3,4]. However, due to the production of both spring and winter wheat crops and susceptible grass species for constant presence of host plants, the favorable weather conditions for the pathogen to infect, grow, and survive, and its ability to quickly evolve new virulence genes and combinations against widely deployed resistance genes, the PNW wheat production remains under constant Pst threat [1,3,4,5,6]. Since 2000, stripe rust has changed from a disease mainly in the western states to a major problem throughout the US [1,2]. Whenever stripe rust epidemic occurs in the Great Plains, the damage is huge. For example, yield losses were estimated as 25% in Oklahoma and 15% in Kansas, and the countrywide yield loss reached 8.7% or over 4.5 million metric tons [2].
Stripe rust can be effectively managed by growing resistant cultivars and/or applying fungicides [1,4,7]. The use of chemical fungicides incurs additional costs to growers and is hazardous to the environment. So, growing resistant cultivars is the best approach for sustainable management of the disease. There are two major types of resistance to stripe rust, all-stage resistance (ASR) and high-temperature adult-plant (HTAP) resistance [1,3,4,8]. ASR, also called seedling resistance, is expressed throughout all plant-growth stages and can be detected early at the seedling stage. While ASR genes generally provide higher levels of resistance, they are effective against only avirulent races and tend to be overcome by virulent races within a few years of deployment in cultivars [3,5,6,9]. Thus, ASR genes alone may not provide durable resistance to stripe rust.
In contrast, HTAP resistance is non-race specific and is therefore durable [3]. HTAP resistance can be controlled by one or more genes and is expressed as plants grow old and temperatures are high [1,3,4]. The expression of HTAP resistance usually begins at the stem elongation stage, gradually increasing, and becomes prominent on flag leaves. The typical resistant phenotype associated with HTAP resistance includes necrotic stripes with or without uredinia [3]. The level of HTAP resistance varies from gene to gene, depending upon the number of genes and gene combinations, and influenced by temperatures and plant growth stages. To confirm the presence of HTAP resistance in a genotype, both seedlings and adult plants should be tested with the same Pst races under controlled greenhouse conditions at low and high temperature profiles [3]. HTAP resistance has been widely used for over 60 years in wheat cultivars grown in the US PNW region [1,3,4,8]. Because HTAP resistance is quantitative and influenced by stripe rust pressure, plant growth stage, and temperature, the best approach is combining ASR and HTAP resistance genes to take advantage and overcome disadvantage of both types of resistance [3]. It is essential to identify more genes for both ASR and HTAP types of resistance to stripe rust.
To date, 87 Yr (Yellow rust resistance) genes have been permanently designated for resistance to stripe rust in wheat [10], of which Yr18, Yr29, Yr36, Yr39, Yr46, Yr48, Yr49, Yr52, Yr54, Yr55, Yr58, Yr59, Yr62, Yr71, Yr75, Yr78, and Yr79 are permanently named Yr genes that provide HTAP resistance [3,8,11]. In addition to these named Yr genes, quantitative trait loci (QTL) conferring HTAP resistance have been identified in wheat landraces, breeding materials, and cultivars [3,12,13,14,15,16,17,18]. For instance, QYrex.wgp-1BL, QYrex.wgp-3BL, and QYrex.wgp-6AS in Express [15]; QYrlo.wgp-2BS in Louise [12]; QYrlu.cau-2BS1 and QYrlu.cau-2BS2 in Luke [16]; QYrMa.wgp-3BS and QYrMa.wgp-6BS in Madsen [13]; QYrst.wgp-6BS.1 and QYrst.wgp-6BS.2 in Stephens [14]; and QYrsk.wgp-3BS and QYrsk.wgp-4BL in Skiles [17]. PNW wheat cultivars Alpowa, Luke, Madsen, and Stephens, which were released in the last quarter of the 20th century and once widely popular cultivars in this region, have continued serving as genetic stocks for HTAP resistance in wheat breeding programs in this region and other regions. Recently, Yao et al. identified 39 stripe rust resistance loci, including 21 loci for HTAP resistance, in a panel of 465 winter wheat entries presumed to have HTAP resistance [18]. More genetic stocks, genes, and useful markers are still needed to enrich stripe rust resistance sources in breeding programs.
The advancements in sequencing technologies have enabled the identification of genome-wide variants at substantially lower costs than a decade ago [19]. Single-nucleotide polymorphisms (SNPs) are the most common types of genetic variants widely distributed throughout the genomes of organisms. They are often associated with disease resistance in plants and virulence in pathogens [13,17,18,20,21,22]. Thus, the use of SNP genotype data has become common in host-pathogen interaction studies. Bi-parental mapping is a widely used technique for mapping traits of interest in plants. This genetic tool has been successfully utilized to characterize loci associated with agronomic, quality, and biotic and abiotic stress-related traits. Although time-consuming and resource intensive, the method is simple and robust. By making appropriate crosses, it can also be used to map loci controlled by rare alleles [23].
William Som (WS, PI 184597), a spring wheat landrace originally from Argentina, was identified to have HTAP resistance in a previous study [24] and has consistently displayed high level of resistance to stipe rust in our multi-year field evaluations at two different locations, Mount Vernon and Pullman, Washington. The objectives of this study were to: 1) identify and map the QTL for HTAP resistance to stripe rust in WS and 2) develop Kompetitive allele-specific PCR (KASP) markers for the identified QTL to be used in marker-assisted selection in breeding programs.
2. Results
2.1. Stripe Rust Phenotypes
The resistant parent WS (PI 184597) was resistant (IT 2-4; DS 2-20%), while AvS was susceptible (IT 8-9; DS 80-100%) at the adult-plant stages (Zadoks GS 60-71) across all seven field environments (Figure 1, Table S1). The distributions of stripe rust phenotypes among the RILs were skewed towards susceptible reactions, with some variations among environments (Figure 2). The mean IT scores of the RIL population ranged from 6.8 to 7.7; and the mean DS values ranged from 58% to 80% across the environments (Table S1). The analysis of variance (ANOVA) of the stripe rust data (IT and DS) revealed significant (P < 2 × 10-16) effects of genotype, environment, and genotype × environment interactions for the RIL population (Table 1). The broad-sense heritability values for stripe rust resistance varied from 0.85 to 0.93 across the environments, with the highest heritability obtained with the DS data in environment Mount Vernon 2024 and the lowest heritability measured with the IT data in environment Pullman 2024. Significant (P < 0.001) correlations were observed between stripe rust phenotypes recorded in different environments (Figure 3). The Spearman correlation coefficients ranged from 0.47 to 0.82 for IT and from 0.41 to 0.85 for DS between environments. Within an environment, IT and DS data were highly correlated (0.70-0.96).
2.2. Linkage Map
The linkage map of AvS/PI 184597 RIL population constructed using 1,820 markers comprised 19 linkage groups, corresponding to 19 of the 21 wheat chromosomes, with chromosomes 4D and 5D absent (Table S2). The genetic map spanned 3,067 cM, with an average distance of 0.59 cM between markers. The map lengths of sub-genomes A, B, and D were 1,267.10 cM, 1,233.24 cM, and 566.82 cM, with a density of 1.43, 1.48, and 5.56 markers per cM, respectively. Among the seven wheat homoeologous groups, the highest number of markers were mapped on group 1 (365 markers) and the lowest number of markers on group 7 (179 markers).
2.3. Stripe Rust Resistance QTL
Four QTL were detected for HTAP resistance using the IT and DS data of the RILs evaluated in the seven field environments (Table 2, Figure 4). The resistance alleles of all four QTL were contributed by the resistant parent, WS (PI 184597). These QTL were mapped to chromosome arms 1BL, 2AL, 3AS, and 3BL (Table 2, Figure 4).
The first QTL, QYrWS.wgp-1BL, was located on the long arm of chromosome 1B, within the 669 to 682 Mb interval based on the IWGSC RefSeq v2.1 and explained 10% to 19% of the phenotypic variation. The LOD scores for this QTL ranged from 4.5 in Pullman 2023 to 7.4 in Mount Vernon 2024. This QTL was consistently detected across four environments, including Mount Vernon 2015, Mount Vernon 2016, Mount Vernon 2024, and Pullman 2023. The SNP markers flanking this QTL were IWA3998 and IWB7694 to the left (proximal); and IWB40850 and IWB72918 to the right (distal).
The second QTL, QYrWS.wgp-2AL, was mapped on the long arm of chromosome 2A at 611-684 Mb and had LOD values ranging from 3.7 to 6.8 across the environments. This QTL was identified in Mount Vernon 2024, Pullman 2016, Pullman 2023, and Pullman 2024. It explained 10.2% to 16.7% of the phenotypic variation. Five SNP markers, IWB7315, IWB57371, IWB51049, IWA5640, and IWB34603, were associated with this QTL.
The third QTL, QYrWS.wgp-3AS, mapped to the 9-13 Mb genomic region on the short arm of chromosome 3A, was detected in Mount Vernon in 2015, 2016, and 2024 and in Pullman in 2023. This QTL explained 7.0% to 15.9% of the phenotypic variation, with LOD scores ranging from 3.2 to 6.2 across environments. Three SNP markers tagged the QTL with IWB34643 and IWB63656 to the left (distal) and IWB36767 to the right (proximal).
The fourth QTL, QYrWS.wgp-3BL, located on the long arm of chromosome 3B at 476-535 Mb, explained the highest phenotypic variation (12.0% to 27.8%) among the four identified QTL. It was detected in Mount Vernon in 2015 and 2024 and in Pullman in 2016 and 2024. The markers flanking the QTL were IWB11270 and IWA1898 to the left (proximal) and IWB22528 and IWB11836 to the right (distal). The LOD scores for this QTL ranged from 3.5 to 11.5 across the four environments.
2.4. KASP Markers
For each of the four QTL, two KASP markers were developed. The sequences of the eight KASP markers developed for the four QTL are provided in Table 3. All the eight KASP markers produced the same genotypes for all RILs and the parents as their SNP markers. The results showed that these KASP markers function in the same way as their original SNP markers to distinguish between the SNP genotypes of the four QTL.
2.5. Effects of QTL Combinations
The effects of individual QTL and their combinations on stripe rust phenotypes were assessed by grouping the RILs based on their QTL composition (Figure 5A). The mean disease severity values of the RIL groups carrying any individual QTL, except 3A, were significantly lower (P < 0.05) than the group lacking all four resistance QTL. Similarly, all 10 different QTL combinations resulted in statistically significant (P < 0.05) reductions in stripe rust severity. Among the two-QTL combinations, 2A+3B, 1B+3B, and 1B+3A were slightly better than 3A+3B and 2A+3A. Any combinations of three QTL were almost equally effective. On average, four, three, and two QTL combinations reduced stripe rust severities by 53%, 45%, and 22%, respectively, compared to lines with no resistance QTL, indicating additive effects of the four QTL.
A similar trend was observed for IT data, with higher levels of resistance associated with the increase in the number of QTL (Figure 5B). Any individual QTL, except 2A and 3A, and all types of QTL combinations resulted in statistically (P < 0.05) lower mean IT scores than the group lacking any of the four resistance QTL.
3. Discussion
In this study, we mapped four HTAP resistance QTL, QYrWS.wgp-1BL, QYrWS.wgp-2AL, QYrWS.wgp-3AS, and QYr.WS.wgp-3BL, to wheat chromosome arms 1BL, 2AL, 3AS, and 3BL, respectively, from WS, an Argentinian wheat landrace. These four stable QTL had additive effects, with higher resistance observed in RILs carrying more QTL. KASP markers were developed for each QTL, which should facilitate the incorporation of these loci into breeding materials through marker-assisted selection (MAS).
QYrWS.wgp-1BL (669-682 Mb) was mapped to the distal region of chromosome arm 1BL. The only permanently named Yr gene conferring HTAP resistance and residing around this position on the long arm of 1B is Yr29 (positioned at 670-680 Mb) [8,10,26,27]. As the map positions of QYrWS.wgp-1BL and Yr29 are almost the same and both are associated with HTAP resistance, it is highly likely that QYrWS.wgp-1BL is Yr29. Yr29 has been identified and mapped in different wheat cultivars and landraces worldwide suggesting that the gene is very common and widely used [8,17,28,29,30]. The prevalence of Yr29 in wheat varieties may be attributed to its selection because of pleiotropic effect, as it also confers resistance to leaf rust (as Lr46) and powdery mildew (as Pm39) at the adult-plant stages [26,27]. In the present study, the percentages of phenotypic variation explained (PVE) by QYrWS.wgp-1BL (Yr29) were 10% to 19%. These effects are comparable to the effects of Yr29 in ‘AvS/Skiles’ (PVE = 12-15%) [17] and ‘AvS/PI 181410’ (PVE = 6-14%) [31] populations both evaluated in Pullman and Mount Vernon, WA in the previous studies as in the present study.
QYrWS.wgp-2AL was mapped to the distal region of 2AL at 611-684 Mb. Three permanently designated Yr genes have been reported on chromosome arm 2AL, including two ASR genes Yr1 [32] and Yr32 [33], and one APR gene Yr86 [34]. Among these, Yr86 is the closest to QYrWS.wgp-2AL but is located ~ 40 Mb distal, at 725-737 Mb, suggesting that it may be a different gene. Within a similar genomic interval as QYrWS.wgp-2AL, two HTAP resistance genes/QTL, Yrxy2 from Chinese cultivar Xiaoyan 54 [35] and QYrPI197734.wgp-2A from Swedish cultivar Progress (PI 197734) [36] have been mapped to 2AL, and all three likely represent the same resistance locus. Other APR QTL mapped near QYrWS.wgp-2AL include Qyr.gaas.2A.1 [37], QYr.lrdc-2A.2 [38], and QYr.Sicau-2AL [39]. Further studies are needed to determine the relationships of QYrWS.wgp-2AL and these QTL.
QYrWS.wgp-3AS (9-13 Mb) was discovered on chromosome arm 3AS. To date, no permanently named APR or HTAP resistance genes have been identified on 3AS. However, an ASR gene, Yr76, spanning 16-22 Mb [40], resides on this arm in the US club wheat cultivar Tyee. Because of the different resistance types, QYrWS.wgp-3AS should be distinct from Yr76. Previously, an APR QTL, QYrto.swust-3AS, was mapped to 3AS at 7.9-10.21 Mb from Chinese wheat cv. Toni using the ‘Mingxian 169/Toni’ RIL population [41]. The genomic coordinates of QYrWS.wgp-3AS and the previously identified QYrto.swust-3AS nearly overlap. However, the latter explained a relatively high phenotypic variation (31-48%) compared to our 3AS QTL (7-16%). It is not uncommon for the same QTL to exhibit varying effects across genetic studies, as QTL effects can be influenced by genetic background, interactions between QTL, size of mapping population, and the mapping method used. Further genetic studies are needed to confirm the relationship between these QTL. Additionally, a marker-trait association (MTA) has also been identified within the QYrWS.wgp-3AS confidence interval in a genome-wide association study (GWAS) of Chinese common wheat varieties [42].
On chromosome 3B, five permanently designated Yr genes have been identified so far, of which Yr80 [43], an APR gene, and Yr82 [44], an ASR gene, are located on the short arm of the chromosome. Yr80 identified from an Australian wheat landrace Aus27284 was mapped to a 60 Mb interval on 3BL at 565-625 Mb [43]. We mapped QYrWS.wgp-3BL approximately 30 Mb proximally from the boundary of Yr80 in the 476-535 Mb region. At this point, it is not clear whether Yr80 provides HTAP resistance. So, phenotypic assessment of Yr80 line at different temperatures along with further genetic studies could clarify whether QYrWS.wgp-3BL is the same as or different from Yr80. Previously, an HTAP resistance QTL, QYrPI197734.wgp-3B, was located on 3B at 423 to 559 Mb [36], which is within the confidence interval of our 3BL QTL. Interestingly, in their study QYrPI197734.wgp-3B was identified as the major locus explaining 13-46% of the phenotypic variation like QYrWS.wgp-3BL being a major QTL explaining up to 28% of the phenotypic variation in the present study. Taking together, it appears that this genomic segment of 3BL probably contains an important HTAP resistance gene that is different from currently described Yr genes on 3BL, and future studies could focus on further genetic and molecular characterization of this locus. Multiple GWAS studies from different countries have also identified MTAs within the similar region of QYrWS.wgp-3BL further confirming the role of the locus in stripe rust resistance in diverse environments [45,46,47,48].
The HTAP resistance QTL identified in the present study exhibited additive interaction effects and were highly effective in reducing stripe rust IT and severity when any three or all four QTL were present together than individually in the RILs. This is consistent with the previous findings that most HTAP resistance genes provide only partial or incomplete resistance when present alone [3,8,11,13,31,36]. However, when combined with other HTAP resistance or ASR genes in a gene pyramid scheme, they offer stronger protection, either by enhancing the effects of other genes or through additive interactions [3,8,11,13,44]. With the aid of KASP markers developed in the present study, incorporating three to four of these QTL into lines containing effective ASR genes should be feasible. Combining genes or QTL for HTAP resistance and ASR genes into individual cultivars takes the advantages of both types of resistance. Thus, such a gene pyramid approach ensures that if predominant race evolves virulence to overcome one to two resistance genes, the remaining genes can still provide some protection and help reduce crop losses [3]. The wheat breeding program at the International Maize and Wheat Improvement Center (CIMMYT) has successfully combined multiple minor- to intermediate-effect genes to achieve higher levels of stripe rust resistance in wheat cultivars [49]. A similar strategy of integrating HTAP resistance genes with ASR genes in wheat cultivars in the US, especially the PNW, has proven highly effective in providing durable resistance to stripe rust, preventing major losses in the past 60 years [3,4,13,18,47,50]. The present study demonstrates the effectiveness of the gene combination approach for high level of durable type of resistance in an Argentinian wheat landrace and provides the information of resistance loci and their KASP markers useful in breeding for wheat cultivars with high level, durable resistance to stripe rust.
4. Materials and Methods
4.1. Plant Materials and Population Development
A cross was made between William Som (WS, PI 184597) and Avocet S (AvS), with AvS used as the female parent. WS is a spring wheat landrace collected from Argentina, deposited in the US National Plant Germplasm System (NPGS) in 1949, and maintained by the USDA-ARS National Small Grains Collection (NSGC) in Abeerdeen, Idaho (https://npgsweb.ars-grin.gov/gringlobal/accessiondetail?id=1159680). We found that WS has effective HTAP resistance and ineffective ASR based on reactions in the fields and seedling and adult-plant tests at low and high temperatures in the greenhouse [24]. AvS is an Australian wheat line that is susceptible at all growth stages to most races of Puccinia striiformis f. sp. tritici (Pst) from the US. From the cross, 114 F5 to F8 recombinant inbred lines (RILs) were developed using the single seed descent method in the greenhouse and field.
4.2. Stripe Rust Phenotyping
In the present study, the parents, F6, F7, and F8 RILs of the AvS/WS were evaluated for stripe rust response in seven field environments at two locations, Pullman and Mount Vernon, Washington, under natural infection of Pst. These seven environments included field experiments in 2016, 2023, and 2024 in both Pullman and Mount Vernon and 2015 in Mount Vernon. Pullman in eastern Washington and Mount Vernon in western Washington are approximately 500 km apart, separated by the Cascade Range, and thus have different weather patterns and Pst race compositions. Each year, planting was done between the first and third weeks of April, depending on weather conditions. Five-gram seeds of each line were manually sown in a 50-cm long row with 20-cm spacing between adjacent rows. The susceptible parent, AvS, was planted after every 20 rows and as spreader rows around the nurseries to increase stripe rust pressure and promote uniform disease development. The nurseries were arranged in a randomized complete block design with two replications. Infection type (IT) and disease severity (DS) data were recorded twice, first at the stem elongation stage (GS 31; [51]) and second at the flowering stage (GS 60) in Mount Vernon while at the flowering stage (GS 60) and the kernel watery ripe stage (GS 71) in Pullman. ITs were recorded using the 0-9 scale [52], and DS were assessed on a 0 to 100% scale based on the modified Cobb’s scale [53,54].
4.3. Stripe Rust Data Analyses
The distributions of the IT and DS data of the RILs across the field environments were visualized using histograms generated with the ggplot2 package in R v4.3.1 [55]. To test the effects of genotype, environment, and their interactions, ANOVA was performed on the IT and DS data using the ‘aov’ function in R. Broad-sense heritability was calculated using the ‘AOV’ functionality in IciMapping software v4.2 (https://isbreedingen.caas.cn/software/qtllcimapping/294607.htm). Correlation coefficients between the stripe rust data in different environments were computed using the ‘cor’ function with the Spearman method implemented in the ‘corrplot’ package in R [56].
4.4. DNA Extracting, Genotyping, and SNP Calling
For DNA extraction, leaf samples approximately 3 cm in length were collected from the F7 RILs, as well as the two parents, at the two-leaf stage grown in the greenhouse. Genomic DNA was extracted using the MagMaxTM Plant DNA Isolation Kit (ThermoFisher Scientific, Waltham, MA, USA) on a KingFisher Flex Purification system, following the manufacturer’s instructions. The concentration and purity of DNA were measured using a NanoDrop 1000 spectrophotometer (ThermoFisher Scientific, Waltham, MA, USA). The RILs and parents were genotyped using the Illumina 90K Infinium iSelect Wheat SNP Array at the USDA-ARS Cereal Crops Genotyping Laboratory, Fargo, ND, USA.
SNP calling was performed with the software GenomeStudio v2.0 (Illumina, Inc., San Diego, CA, USA). When necessary, alleles were manually assigned to genotype groups (AA, AB, and BB) based on visual assessment of genotype cluster plots. Monomorphic SNPs and SNPs missing > 10% of data were removed. For the remaining SNP genotypes, imputation was done using the LD KNNi imputation algorithm implemented in the TASSEL software v5.0 [57].
4.5. Linkage Map Construction and QTL Analysis
A Chi-squared goodness-of-fit test was performed to evaluate deviations of marker genotypes from the expected 1:1 segregation ratio at each marker locus, using an alpha level of 0.05. Linkage maps were constructed using 1,820 high-quality SNP markers with the MAP functionality in the IciMapping software v4.2 [58]. Markers were grouped into linkage groups based on recombination frequency, using the default threshold value of 0.3. Within each linkage group, markers were ordered using the 2-OptMap algorithm. The marker order was further refined using the ripple function with a window size of 5, also based on recombination frequency. QTL mapping was performed using the Inclusive Composite Interval Mapping (ICIM) method with a step size of 1 cM in IciMapping v4.2, and Kosambi’s mapping function [59] was used to estimate genetic distances. A total of 1,000 permutations were conducted using a Type I error rate of 0.05 to determine the LOD significance threshold for QTL detection.
4.6. KASP Marker Development and Genotyping
KASP markers were designed based on SNPs tagging the QTL. DNA sequences of 150-200 bp in length containing the SNPs were submitted to 3cr Biosciences (Harlow, UK) to design two allele-specific forward primers and one common reverse primer for each SNP marker. The resulting KASP marker sequences were then sent to Millipore Sigma (Sigma-Aldrich, St. Louis, MO, USA) for oligonucleotide synthesis. Eight KASP markers were developed, with two markers for each of the four QTL.
PCR amplification for KASP genotyping was done in a 384-well format Biometra TAdvanced thermocycler (Analytik Jena, Jena, Germany) to reduce reaction volume. Each KASP reaction had a volume of 5 µl per well, comprising 2.5 µl 2× KASP master mix (3cr Biosciences, Harlow, UK), 0.07 µl primer mix, 2 µl DNA at 20 ng/µl, and 0.5 µl of nuclease-free water. The PCR cycling conditions included an initial hot-start activation at 94 °C for 15 min; followed by 12 cycles of touch down PCR (94 °C for 20 s, 68 °C for 1 min, temperature decreasing by 0.9 °C per cycle); and then 35 amplification cycles (94 °C for 20 s, 57 °C for 1 min for annealing and elongation). After PCR amplification, fluorescence signals were read in a LightCycler 480 II machine (Roche Sequencing & Life Science, Indianapolis, IN, USA), and genotype cluster graphs were generated with the LightCycler 480 software v1.5.1.62.
Supplementary Materials
The following supporting information can be downloaded at the website of this paper posted on Preprints.org. Table S1: Stripe rust data of the 114 recombinant inbred lines from cross AvS/WS tested at the adult-plant stages in seven field environments in WA, USA; Table S2: Map length, number of SNP markers, and marker density for the linkage groups constructed for the AvS/WS recombinant inbred line population; Table S3: Genotypes of SNP markers associated with four quantitative trait loci in the 114 recombinant inbred lines from cross AvS/WS.
Author Contributions
Conceptualization, X.C. and A.U.; methodology, A.U., C.X., M.W., S.R., T.R.; software, A.U.; validation, A.U.; formal analysis, A.U.; investigation, A.U., C.X.; resources, X.C., M.W., M.P., D.R.S.; data curation, A.U.; writing—original draft preparation, A.U.; writing—review and editing, A.U., M.W., X.C., N.F., S.R., T.R., D.R.S., M.P., X.C; visualization, A.U.; supervision, X.C; project administration, A.U. and X.C.; funding acquisition, X.C. All authors have read and agreed to the published version of the manuscript.
Funding
This research was funded by the U.S. Department of Agriculture, Agricultural Research Service (Project No. 2090-22000-020-00D), Washington Grain Commission (Award No. AWD004698), Idaho Wheat Commission (Award No. AWD001302), and Oregon Wheat Commission (Award No. AWD005512).
Institutional Review Board Statement
Not applicable.
Informed Consent Statement
Not applicable.
Data Availability Statement
All data generated in this study are available in the main text and in supplementary files.
Acknowledgments
The authors would like to thank Dr. Shiaoman Chao for genotyping the mapping population and Dr. Kent Evans for assistance in field trial set up and maintenance.
Conflicts of Interest
The authors declare no conflict of interest. The funders had no role in the design of the study; in the collection, analyses, or interpretation of data; in the writing of the manuscript, or in the decision to publish the results.
Disclaimer: Mention of trade names or commercial products in this publication is solely for the purpose of providing specific information and does not imply recommendation or endorsement by the US Department of Agriculture. USDA is an equal opportunity provider and employer.
Abbreviations
The following abbreviations are used in this manuscript:
| Pst | Puccinia striiformis f. sp. tritici |
| Yr | Yellow rust |
| HTAP | High-temperature and adult-plant resistance |
| ASR | All-stage resistance |
| QTL | Quantitative trait loci |
| PNW | Pacific Northwest |
| WS | William Som |
| AvS | Avocet S |
| RILs | Recombinant inbred lines |
| KASP | Kompetitive allele-specific PCR |
| SNPs | Single nucleotide polymorphisms |
| NPGS | National Plant Germplasm System |
| NSGC | National Small Grains Collection |
| IT | Infection type |
| DS | Disease severity |
| GS | Growth stage |
| cM | Centimorgan |
| wgp | Wheat genetics at Pullman |
| PVE | Phenotypic variation explained |
References
- Chen, X.M. Epidemiology and control of stripe rust [Puccinia striiformis f. sp. tritici] on wheat. Can. J. Plant Pathol. 2005, 27, 314–337. [Google Scholar] [CrossRef]
- Chen, X.M. Pathogens which threaten food security: Puccinia striiformis, the wheat stripe rust pathogen. Food Secur. 2020, 12, 239–251. [Google Scholar] [CrossRef]
- Chen, X.M. High-temperature adult-plant resistance, key for sustainable control of stripe rust. Am. J. Plant Sci. 2013, 4, 608–627. [Google Scholar] [CrossRef]
- Line, R.F. Stripe rust of wheat and barley in North America: a retrospective historical review. Annu. Rev. Phytopathol. 2002, 40, 75–118. [Google Scholar] [CrossRef]
- Liu, T.L.; Wan, A.M.; Liu, D.C.; Chen, X.M. Changes of races and virulence genes in Puccinia striiformis f. sp. tritici, the wheat stripe rust pathogen, in the United States from 1968 to 2009. Plant Dis. 2017, 101, 1522–1532. [Google Scholar] [CrossRef]
- Wang, M.N.; Wan, A.M.; Chen, X.M. Race characterization of Puccinia striiformis f. sp. tritici in the United States from 2013 to 2017. Plant Dis. 2022, 106, 1462–1473. [Google Scholar] [CrossRef]
- Wang, M.N.; Chen, X.M. Stripe rust resistance. In Stripe Rust; Chen, X.M., Kang., Z.S., Eds.; Springer: Dordrecht, Netherlands, 2017; pp. 353–558. [Google Scholar]
- Chen, X.M. Integration of cultivar resistance and fungicide application for control of wheat stripe rust. Can. J. Plant Pathol. 2014, 36, 311–326. [Google Scholar] [CrossRef]
- Upadhaya, A.; Upadhaya, S.G.; Brueggeman, R. The wheat stem rust (Puccinia graminis f. sp. tritici) population from Washington contains the most virulent isolates reported on barley. Plant Dis. 2022, 106, 223–230. [Google Scholar] [CrossRef]
- McIntosh, R.A. Catalogue of Gene Symbols of Wheat. 2024, https://wheat.pw.usda.gov/GG3/wgc. Accessed 20 March 2025.
- Feng, J.Y.; Wang, M.N.; See, D.R.; Chao, S.M.; Zheng, Y.L.; Chen, X.M. Characterization of novel gene Yr79 and four additional quantitative trait loci for all-stage and high-temperature adult-plant resistance to stripe rust in spring wheat PI 182103. Phytopathology 2018, 108, 737–747. [Google Scholar] [CrossRef]
- Carter, A.H.; Chen, X.M.; Garland-Campbell, K.; Kidwell, K.K. Identifying QTL for high-temperature adult-plant resistance to stripe rust (Puccinia striiformis f. sp. tritici) in the spring wheat (Triticum aestivum L.) cultivar ‘Louise’. Theor. Appl. Genet. 2009, 119, 1119–1128. [Google Scholar] [CrossRef]
- Liu, L.; Wang, M.N.; Feng, J.Y.; See, D.R.; Chao, S.M.; Chen, X.M. Combination of all-stage and high-temperature adult-plant resistance QTL confers high-level, durable resistance to stripe rust in winter wheat cultivar Madsen. Theor. Appl. Genet. 2018, 131, 1835–1849. [Google Scholar] [CrossRef] [PubMed]
- Santra, D.K.; Chen, X.M.; Santra, M.; Campbell, K.G.; Kidwell, K.K. Identification and mapping QTL for high-temperature adult-plant resistance to stripe rust in winter wheat (Triticum aestivum L.) cultivar ‘Stephens’. Theor. Appl. Genet. 2008, 117, 793–802. [Google Scholar] [CrossRef]
- Lin, F.; Chen, X.M. Quantitative trait loci for non-race-specific, high-temperature adult-plant resistance to stripe rust in wheat cultivar Express. Theor. Appl. Genet. 2009, 118, 631–642. [Google Scholar] [CrossRef] [PubMed]
- Guo, Q.; Zhang, Z.J.; Xu, Y.B.; Li, G.H.; Feng, J.; Zhou, Y. Quantitative trait loci for high-temperature adult-plant and slow-rusting resistance to Puccinia striiformis f. sp. tritici in wheat cultivars. Phytopathology 2008, 98, 803–809. [Google Scholar] [CrossRef] [PubMed]
- Liu, L.; Yuan, C.Y.; Wang, M.N.; See, D.R.; Zemetra, R.S.; Chen, X.M. QTL analysis of durable stripe rust resistance in the North American winter wheat cultivar Skiles. Theor. Appl. Genet. 2019, 132, 1677–1691. [Google Scholar] [CrossRef]
- Yao, F.J.; Wang, M.N.; See, D.R.; Yang, E.N.; Chen, G.Y.; Chen, X.M. Identification of 39 stripe rust resistance loci in a panel of 465 winter wheat entries presumed to have high-temperature adult-plant resistance through genome-wide association mapping and marker-assisted detection. Front. Plant Sci. 2025, 15, 1514926. [Google Scholar] [CrossRef]
- Satam, H.; Joshi, K.; Mangrolia, U.; Waghoo, S.; Zaidi, G.; Rawool, S.; Thakare, R.P.; Banday, S.; Mishra, A.K.; Das, G.; Malonia, S.K. Next-generation sequencing technology: current trends and advancements. Biol. 2023, 12, 997. [Google Scholar] [CrossRef]
- Brooke, M.; Upadhaya, A.; Clare, S.; Brueggeman, R. QTL analysis of a novel source of barley seedling resistance effective against virulent North American stem rust isolates. Phytopathology 2025. [Google Scholar] [CrossRef]
- Upadhaya, A.; Upadhaya, S.G.; Brueggeman, R. Identification of candidate avirulence and virulence genes corresponding to stem rust (Puccinia graminis f. sp. tritici) resistance genes in wheat. Mol. Plant-Microbe Interact. 2024, 37, 635–649. [Google Scholar] [CrossRef]
- Upadhaya, A.; Upadhaya, S.G.; Brueggeman, R. Association mapping with a diverse population of Puccinia graminis f. sp. tritici identified avirulence loci interacting with the barley Rpg1 stem rust resistance gene. BMC Genomics 2024, 25, 751. [Google Scholar] [CrossRef]
- Xu, Y.; Li, P.; Yang, Z.; Xu, C. Genetic mapping of quantitative trait loci in crops. Crop J. 2017, 5, 175–184. [Google Scholar] [CrossRef]
- Wang, M.N.; Chen, X.M.; Xu, LS. .; Cheng, P.; Bockelman, H.E. Registration of 70 common spring wheat germplasm lines resistant to stripe rust. J. Plant Regist. 2012, 6, 104–110. [Google Scholar] [CrossRef]
- Zhu, T.; Wang, L.; Rimbert, H.; Rodriguez, J.C.; Deal, K.R.; De Oliveira, R.; Choulet, F.; Keeble-Gagnere, G.; Tibbits, J.; Rogers, J.; Eversole, K.; Appels, R.; Gu, Y.Q.; Mascher, M.; Dvorak, J.; Luo, M.C. Optical maps refine the bread wheat Triticum aestivum cv. Chinese Spring genome assembly. Plant J. 2021, 107, 303–314. [Google Scholar] [CrossRef]
- William, M.; Singh, R.P.; Huerta-Espino, J.; Islas, S.O.; Hoisington, D. Molecular marker mapping of leaf rust resistance gene Lr46 and its association with stripe rust resistance gene Yr29 in wheat. Phytopathology 2003, 93, 153–159. [Google Scholar] [CrossRef]
- William, H.M.; Singh, R.P.; Huerta-Espino, J.; Palacios, G.; Suenaga, K. Characterization of genetic loci conferring adult plant resistance to leaf rust and stripe rust in spring wheat. Genome 2006, 49, 977–990. [Google Scholar] [CrossRef] [PubMed]
- Bansal, U.K.; Kazi, A.G.; Singh, B.; Hare, R.A.; Bariana, H. S. Mapping of durable stripe rust resistance in a durum wheat cultivar Wollaroi. Mol. Breed. 2014, 33, 51–59. [Google Scholar] [CrossRef]
- Baranwal, D.K.; Bariana, H.; Bansal, U. Genetic dissection of stripe rust resistance in a Tunisian wheat landrace Aus26670. Mol. Breed. 2021, 41, 54. [Google Scholar] [CrossRef]
- Rosewarne, G.M.; Singh, R.P.; Huerta-Espino, J.; Rebetzke, G.J. Quantitative trait loci for slow-rusting resistance in wheat to leaf rust and stripe rust identified with multi-environment analysis. Theor. Appl. Genet. 2008, 116, 1027–1034. [Google Scholar] [CrossRef]
- Liu, Y.; Qie, Y.M.; Li, X.; Wang, M.N.; Chen, X.M. Genome-wide mapping of quantitative trait loci conferring all-stage and high-temperature adult-plant resistance to stripe rust in spring wheat landrace PI 181410. Int. J. Mol. Sci. 2020, 21, 478. [Google Scholar] [CrossRef]
- Bansal, U.K.; Hayden, M.J.; Keller, B.; Wellings, C.R.; Park, R.F.; Bariana, H.S. Relationship between wheat rust resistance genes Yr1 and Sr48 and a microsatellite marker. Plant Pathol. 2009, 58, 1039–1043. [Google Scholar] [CrossRef]
- Eriksen, L.; Afshari, F.; Christiansen, M.J.; McIntosh, R.A.; Jahoor, A.; Wellings, C.R. Yr32 for resistance to stripe (yellow) rust present in the wheat cultivar Carstens V. Theor. Appl. Genet. 2004, 108, 567–575. [Google Scholar] [CrossRef]
- Zhu, Z.; Cao, Q.; Han, D.; Wu, J.; Wu, L.; Tong, J.; Xu, X.; Yan, J.; Zhang, Y.; Xu, K.; Wang, F.; Dong, Y.; Gao, C.; He, Z.; Xia, X.; Hao, Y. Molecular characterization and validation of adult-plant stripe rust resistance gene Yr86 in Chinese wheat cultivar Zhongmai 895. Theor. Appl. Genet. 2023, 136, 142. [Google Scholar] [CrossRef]
- Zhou, X.L.; Wang, W.L.; Wang, L.L.; Hou, D.Y.; Jing, J.X.; Wang, Y. , Xu, Z.Q.; Yao, Q.; Yin, J.L.; Ma, D.F. Genetics and molecular mapping of genes for high-temperature resistance to stripe rust in wheat cultivar Xiaoyan 54. Theor. Appl. Genet. 2011, 123, 431–438. [Google Scholar] [CrossRef]
- Liu, L.; Yuan, C.Y.; Wang, M.N.; See, D.R.; Chen, X.M. Mapping quantitative trait loci for high-temperature adult-plant resistance to stripe rust in spring wheat PI 197734 using a doubled haploid population and genotyping by multiplexed sequencing. Front. Plant Sci. 2020, 11, 596962. [Google Scholar] [CrossRef] [PubMed]
- Cheng, B.; Gao, X.; Cao, N.; Ding, Y.; Chen, T.; Zhou, Q.; Gao, Y.; Xin, Z.; Zhang, L. QTL mapping for adult plant resistance to wheat stripe rust in M96-5 × Guixie 3 wheat population. J. Appl. Genet. 2022, 63, 265–279. [Google Scholar] [CrossRef] [PubMed]
- Farzand, M.; Dhariwal, R.; Hiebert, C.W.; Spaner, D.; Randhawa, H.S. QTL mapping for adult plant field resistance to stripe rust in the AAC Cameron/P2711 spring wheat population. Crop Sci. 2022, 62, 1088–1106. [Google Scholar] [CrossRef]
- Wang, Y.; Hu, Y.; Gong, F.; Jin, Y.; Xia, Y.; He, Y.; Jiang, Y.; Zhou, Q.; He, J.; Feng, L.; Chen, G.; Zheng, Y.; Liu, D.; Huang, L.; Wu, B. Identification and mapping of QTL for stripe rust resistance in the Chinese wheat cultivar Shumai126. Plant Dis. 2022, 106, 1278–1285. [Google Scholar] [CrossRef]
- Xiang, C.; Feng, J.Y.; Wang, M.N.; Chen, X.M.; See, D.R.; Wan, A.M.; Wang, T. Molecular mapping of stripe rust resistance gene Yr76 in winter club wheat cultivar Tyee. Phytopathology 2016, 106, 1186–1193. [Google Scholar] [CrossRef] [PubMed]
- Zhou, X.; Hu, T.; Li, X.; Yu, M.; Li, Y.; Yang, S.; Huang, K.; Han, D.; Kang, Z. Genome-wide mapping of adult plant stripe rust resistance in wheat cultivar Toni. Theor. Appl. Genet. 2019, 132, 1693–1704. [Google Scholar] [CrossRef]
- Yang, F.; Liu, J.; Guo, Y.; He, Z.; Rasheed, A.; Wu, L.; Cao, S.; Nan, H.; Xia, X. Genome-wide association mapping of adult-plant resistance to stripe rust in common wheat (Triticum aestivum). Plant Dis. 2020, 104, 2174–2180. [Google Scholar] [CrossRef]
- Nsabiyera, V.; Bariana, H.S.; Qureshi, N.; Wong, D.; Hayden, M.J.; Bansal, U.K. Characterization and mapping of adult plant stripe rust resistance in wheat accession Aus27284. Theor. Appl. Genet. 2018, 131, 1459–1467. [Google Scholar] [CrossRef] [PubMed]
- Pakeerathan, K.; Bariana, H.; Qureshi, N.; Wong, D.; Hayden, M.; Bansal, U. Identification of a new source of stripe rust resistance Yr82 in wheat. Theor. Appl. Genet. 2019, 132, 3169–3176. [Google Scholar] [CrossRef] [PubMed]
- Habib, M.; Awan, F.S.; Sadia, B.; Zia, M.A. Genome-wide association mapping for stripe rust resistance in Pakistani spring wheat genotypes. Plants 2020, 9, 1056. [Google Scholar] [CrossRef]
- Mahmood, Z.; Ali, M.; Mirza, J.I.; Fayyaz, M.; Majeed, K.; Naeem, M.K.; Aziz, A.; Trethowan, R.; Ogbonnaya, F.C.; Poland, J.; Quraishi, U.M.; Hickey, L.T.; Rasheed, A.; He, Z. Genome-wide association and genomic prediction for stripe rust resistance in synthetic-derived wheats. Front. Plant Sci. 2022, 13, 788593. [Google Scholar] [CrossRef]
- Mu, J.M.; Liu, L.; Liu, Y.; Wang, M.N.; See, D.R.; Han, D.J.; Chen, X.M. Genome-wide association study and gene specific markers identified 51 genes or QTL for resistance to stripe rust in U.S. winter wheat cultivars and breeding lines. Front. Plant Sci. 2020, 11, 998. [Google Scholar] [CrossRef]
- Yang, F.; Liu, J.; Guo, Y.; He, Z.; Rasheed, A.; Wu, L.; Cao, S.; Nan, H.; Xia, X. Genome-wide association mapping of adult-plant resistance to stripe rust in common wheat (Triticum aestivum). Plant Dis. 2020, 104, 2174–2180. [Google Scholar] [CrossRef]
- Bhavani, S.; Singh, R.P.; Hodson, D.P.; Huerta-Espino, J.; Randhawa, M.S. Wheat rusts: current status, prospects of genetic control and integrated approaches to enhance resistance durability. In Wheat improvement: Food Security in a changing climate; Reynolds, M.P., Braun, H.J., Eds.; Springer: Cham, Switzerland, 2022; pp. 125–141. [Google Scholar]
- Liu, L.; Wang, M.N.; Zhang, Z.W.; See, D.R.; Chen, X.M. Identification of stripe rust resistance loci in U.S. spring wheat cultivars and breeding lines using genome-wide association mapping and Yr gene markers. Plant Dis. 2020, 104, 2181–2192. [Google Scholar] [CrossRef] [PubMed]
- Zadoks, J.C.; Chang, T.T.; Konzak, C.F. A decimal code for the growth stages of cereals. Weed Res. 1974, 14, 415–421. [Google Scholar] [CrossRef]
- Line, R.F.; Qayoum, A. Virulence, aggressiveness, evolution and distribution of races of Puccinia striiformis (the cause of stripe rust of wheat) in North America, 1968-87. U.S. Department of Agriculture Technical Bulletin No. 1788, the National Technical Information Service, Springfield, USA, 1992; pp 44.
- Peterson, R.F.; Campbell, A.B.; Hannah, A.E. A diagrammatic scale for estimating rust intensity on leaves and stems of cereals. Can. J. Res. 1948, 26, 496–500. [Google Scholar] [CrossRef]
- Chen, X.M.; Line, R.F. Gene action in wheat cultivars for durable, high-temperature, adult-plant resistance and interaction with race-specific, seedling resistance to Puccinia striiformis. Phytopathology 1995, 85, 567–572. [Google Scholar] [CrossRef]
- Wickham, H. Ggplot2: elegant graphics for data analysis, 2nd ed.; Springer: South Carolina, USA, 2016; pp. 241–253. [Google Scholar]
- Wei, T.; Simko, V.; Levy, M.; Xie, Y.; Jin, Y.; Zemla, J. Corrplot: Visualization of a correlation matrix. R package version 0.73 2013, 230, 1–26. [Google Scholar]
- Bradbury, P.J.; Zhang, Z.; Kroon, D.E.; Casstevens, T.M.; Ramdoss, Y.; Buckler, E.S. TASSEL: software for association mapping of complex traits in diverse samples. Bioinformatics 2007, 23, 2633–2635. [Google Scholar] [CrossRef] [PubMed]
- Meng, L.; Li, H.; Zhang, L.; Wang, J. QTL IciMapping: Integrated software for genetic linkage map construction and quantitative trait locus mapping in biparental populations. Crop J. 2015, 3, 269–283. [Google Scholar] [CrossRef]
- Kosambi, D.D. The estimation of map distances from recombination values. Ann. Eugen. 1944, 12, 172–175. [Google Scholar] [CrossRef]
Figure 1.
Stripe rust phenotypes on the resistant parent, William Som (PI 184597), and the susceptible parent, Avocet S, observed in the nursery at Mount Vernon, WA, in 2023.
Figure 1.
Stripe rust phenotypes on the resistant parent, William Som (PI 184597), and the susceptible parent, Avocet S, observed in the nursery at Mount Vernon, WA, in 2023.
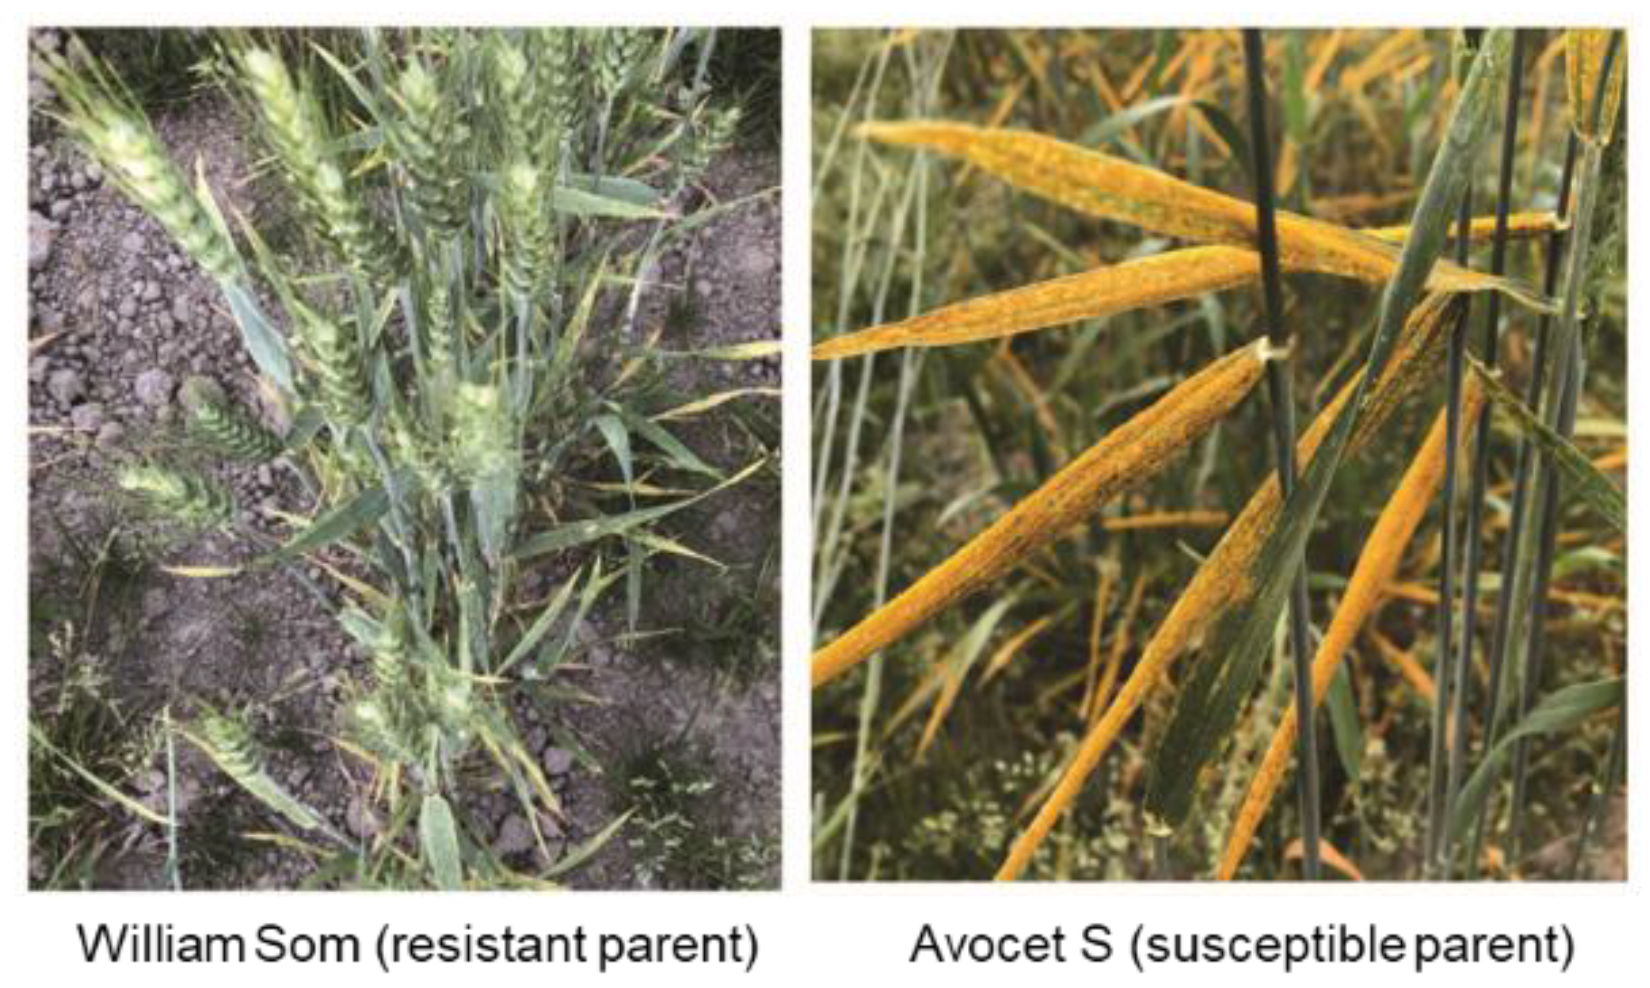
Figure 2.
Histograms showing the distributions of stripe rust phenotypes of the recombinant inbred lines from cross AvS/WS tested in seven field environments. A) Infection type (IT) and B) disease severity (DS). The RILs were evaluated for stripe rust response in Mount Vernon (MV) in 2015, 2016, 2023, and 2024; and in Pullman (PU) in 2016, 2023, and 2024. RP = resistant parent (William Som, PI 184597), and SP = susceptible parent (AvS).
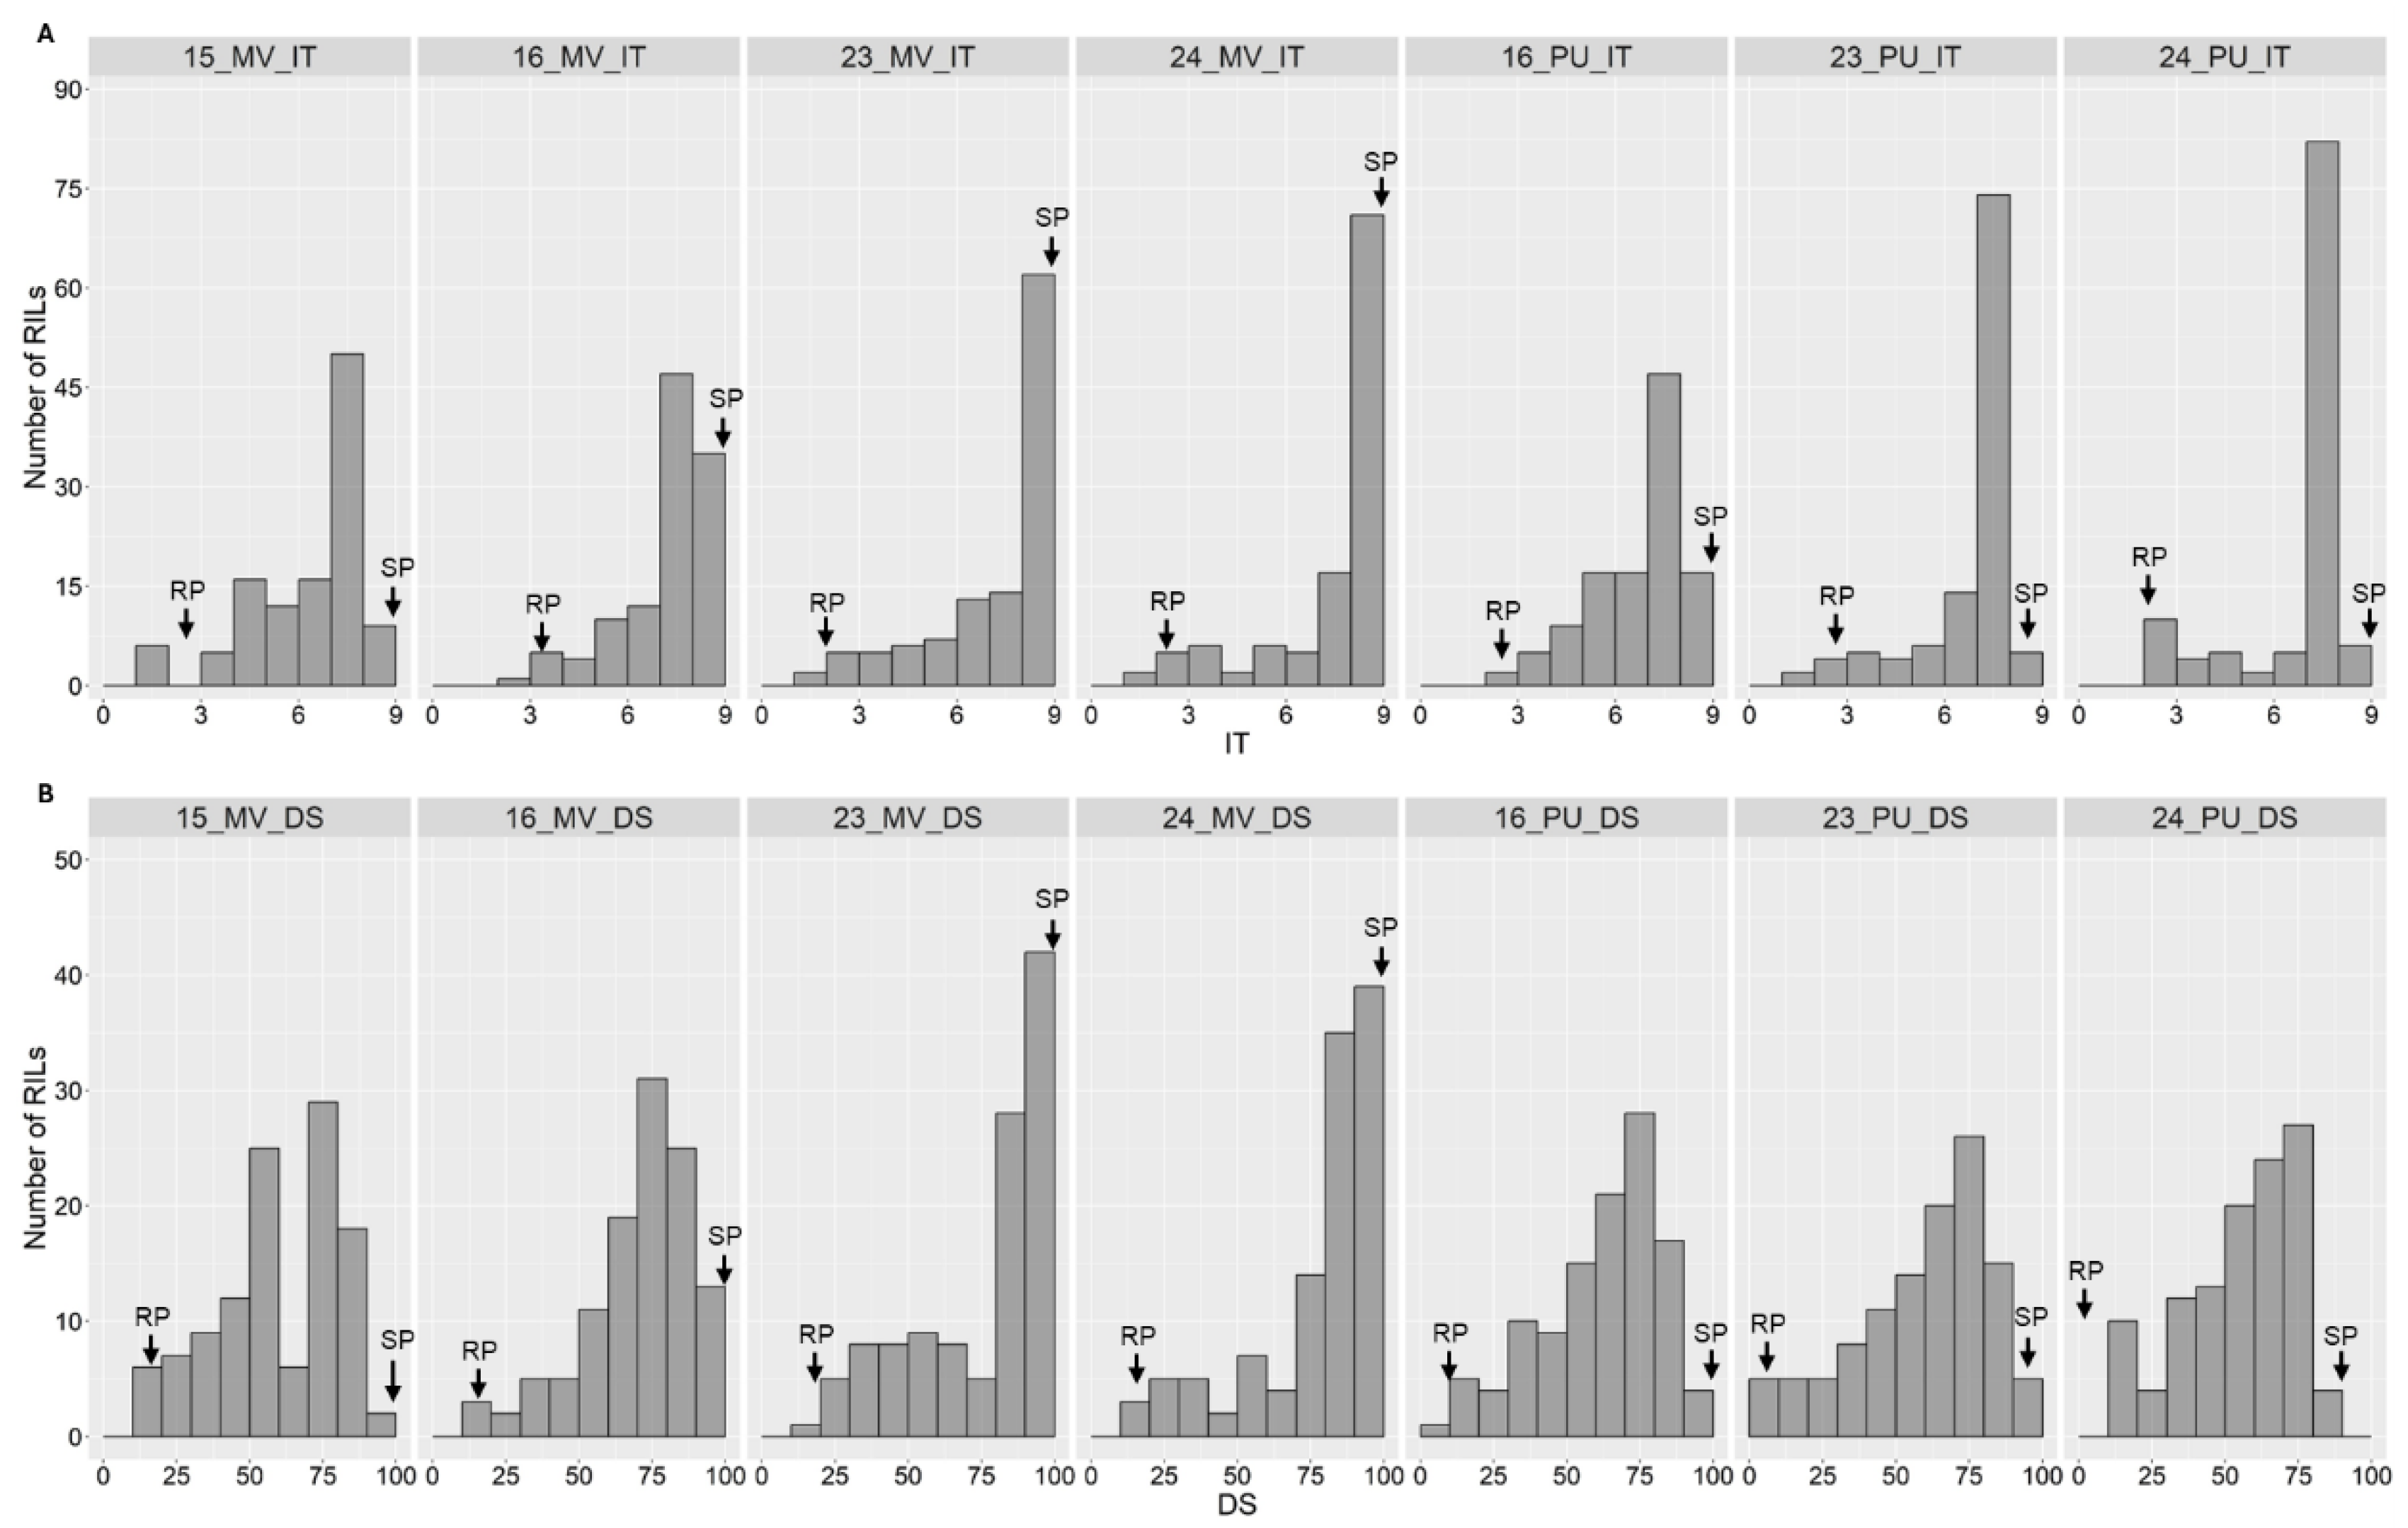
Figure 3.
Correlation coefficients between stripe rust phenotypes across seven field environments. The numbers inside the circles are Spearman correlation coefficients, significant at P < 0.001. 15 = 2015, 16 = 2016, 23 = 2023, and 24 = 2024. MV = Mount Vernon and Pu = Pullman, WA. IT = infection type and DS = disease severity.
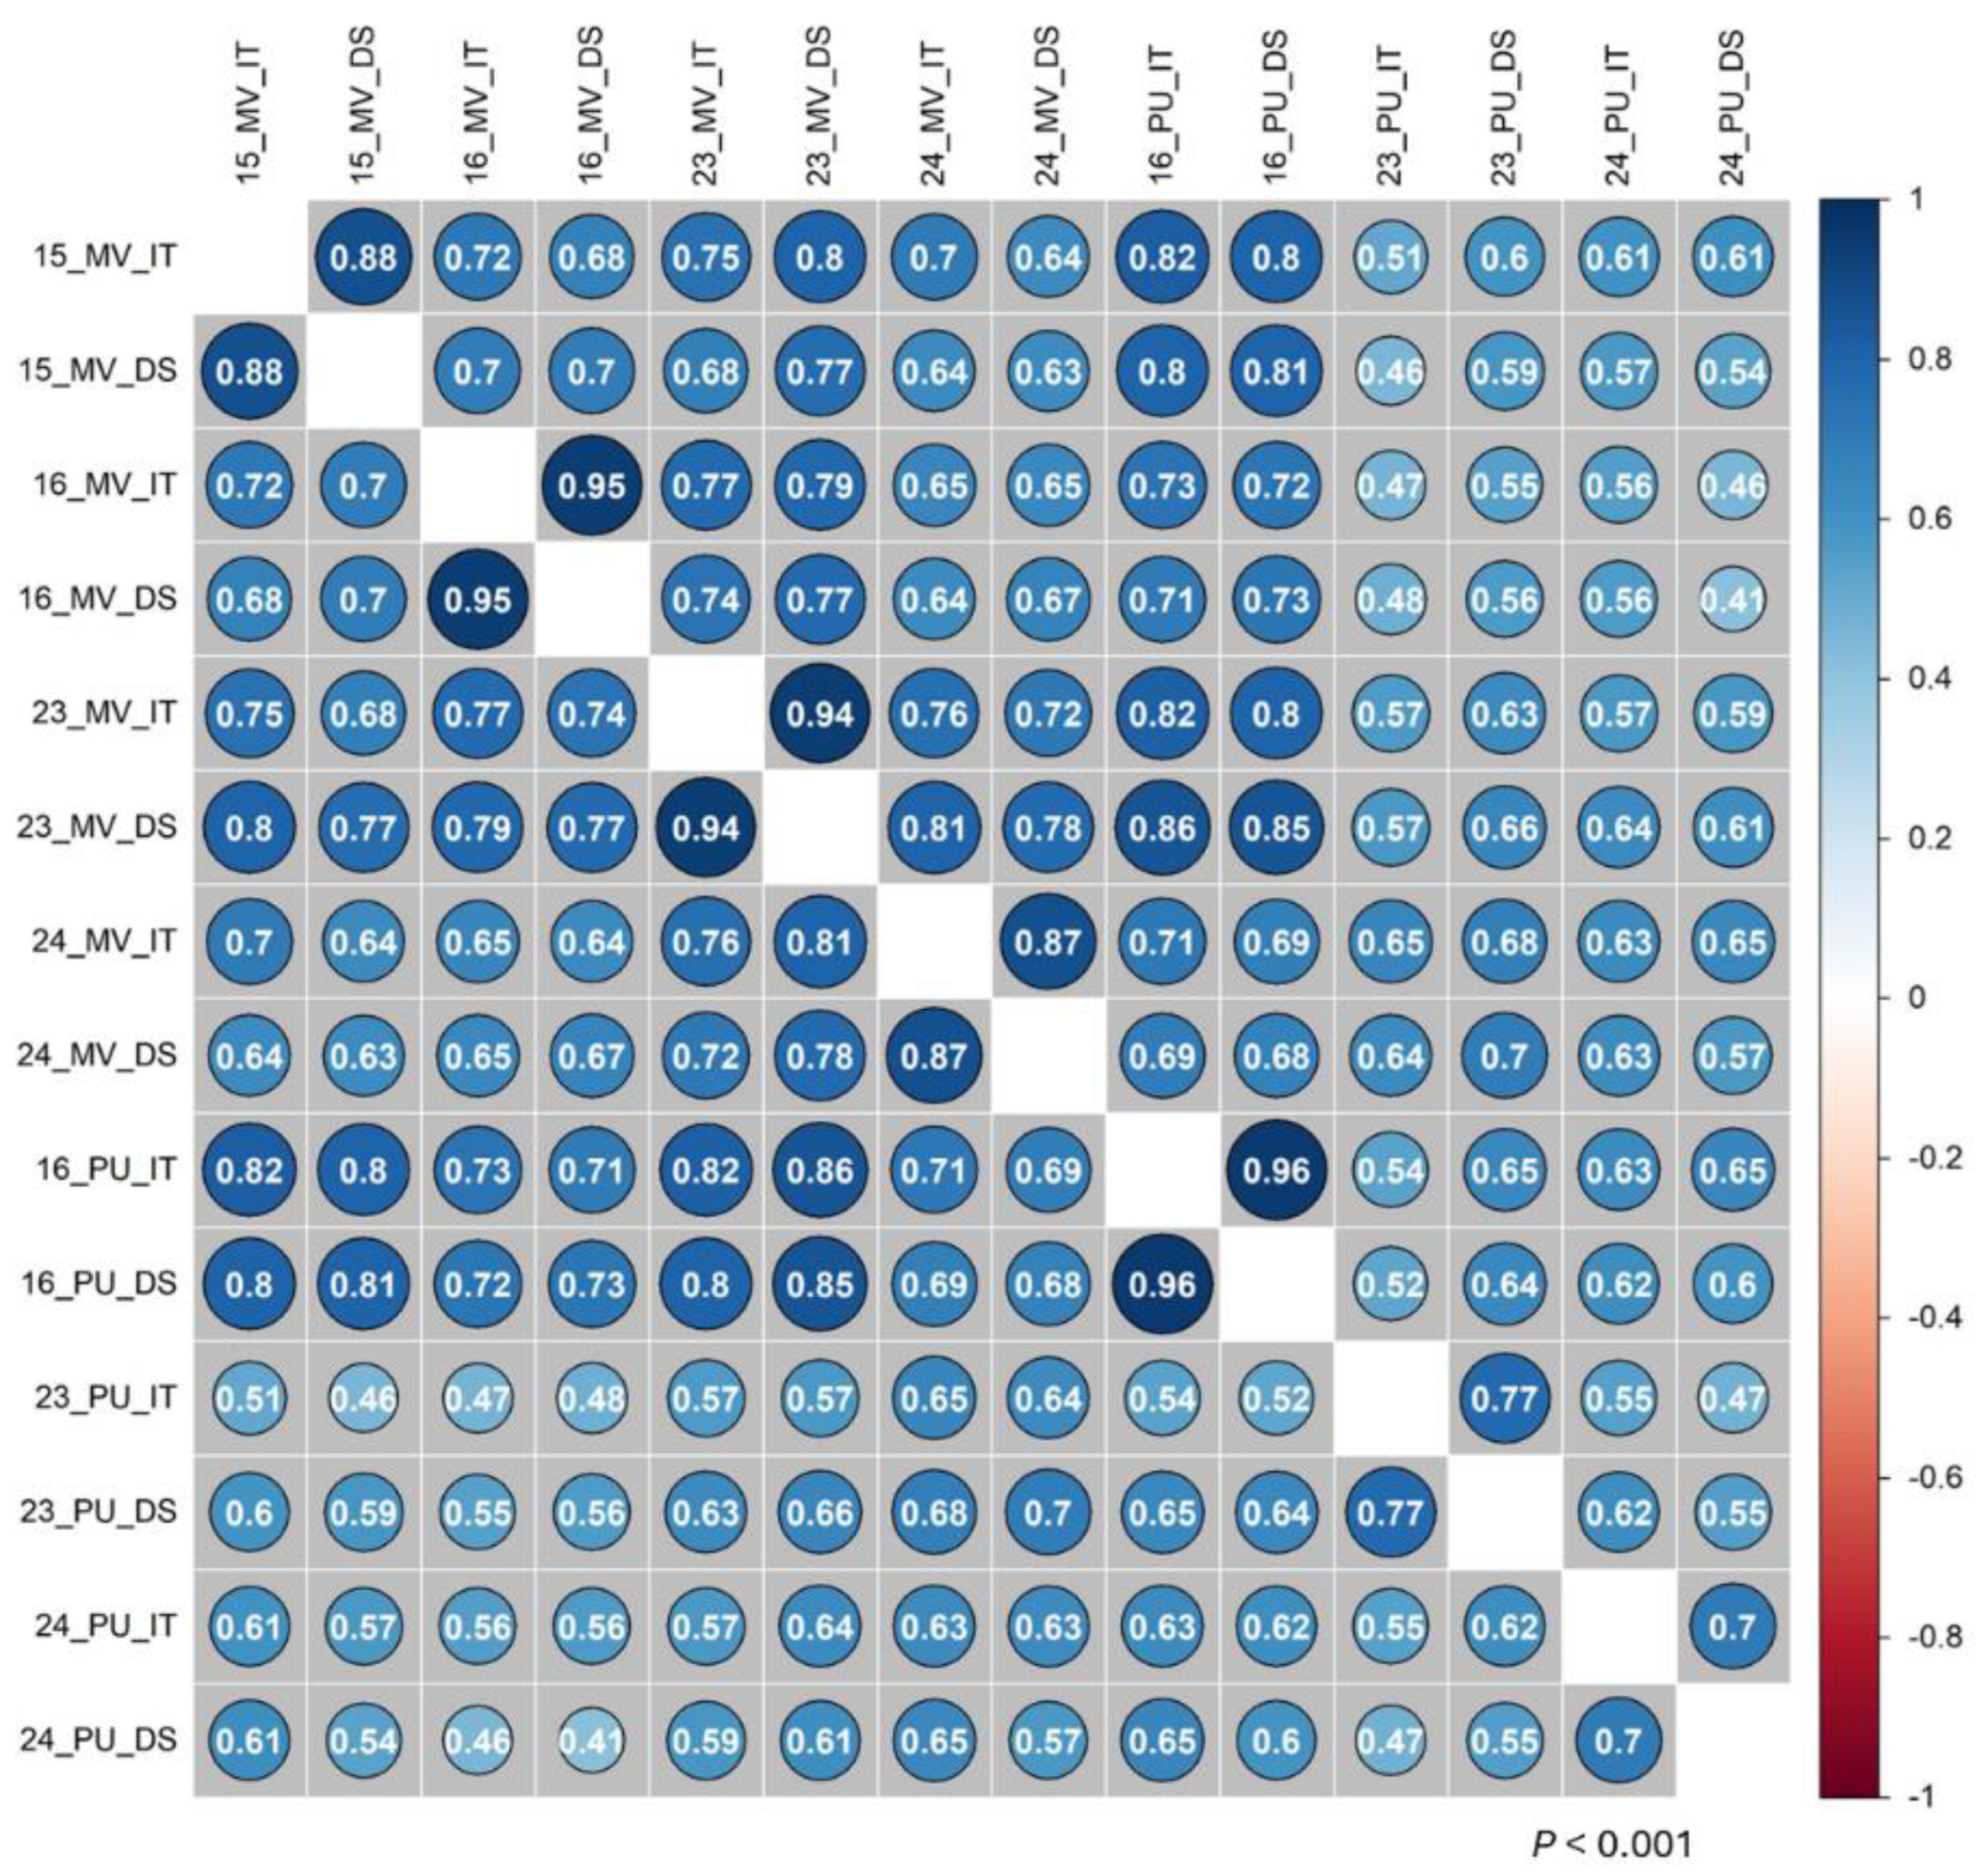
Figure 4.
Chromosomal maps of the four quantitative trait loci (QTL) for high-temperature and adult-plant resistance identified in this study. QTL names and the environments in which they were identified are shown on the right side of the chromosomes, while markers associated with each QTL are shown on the left.
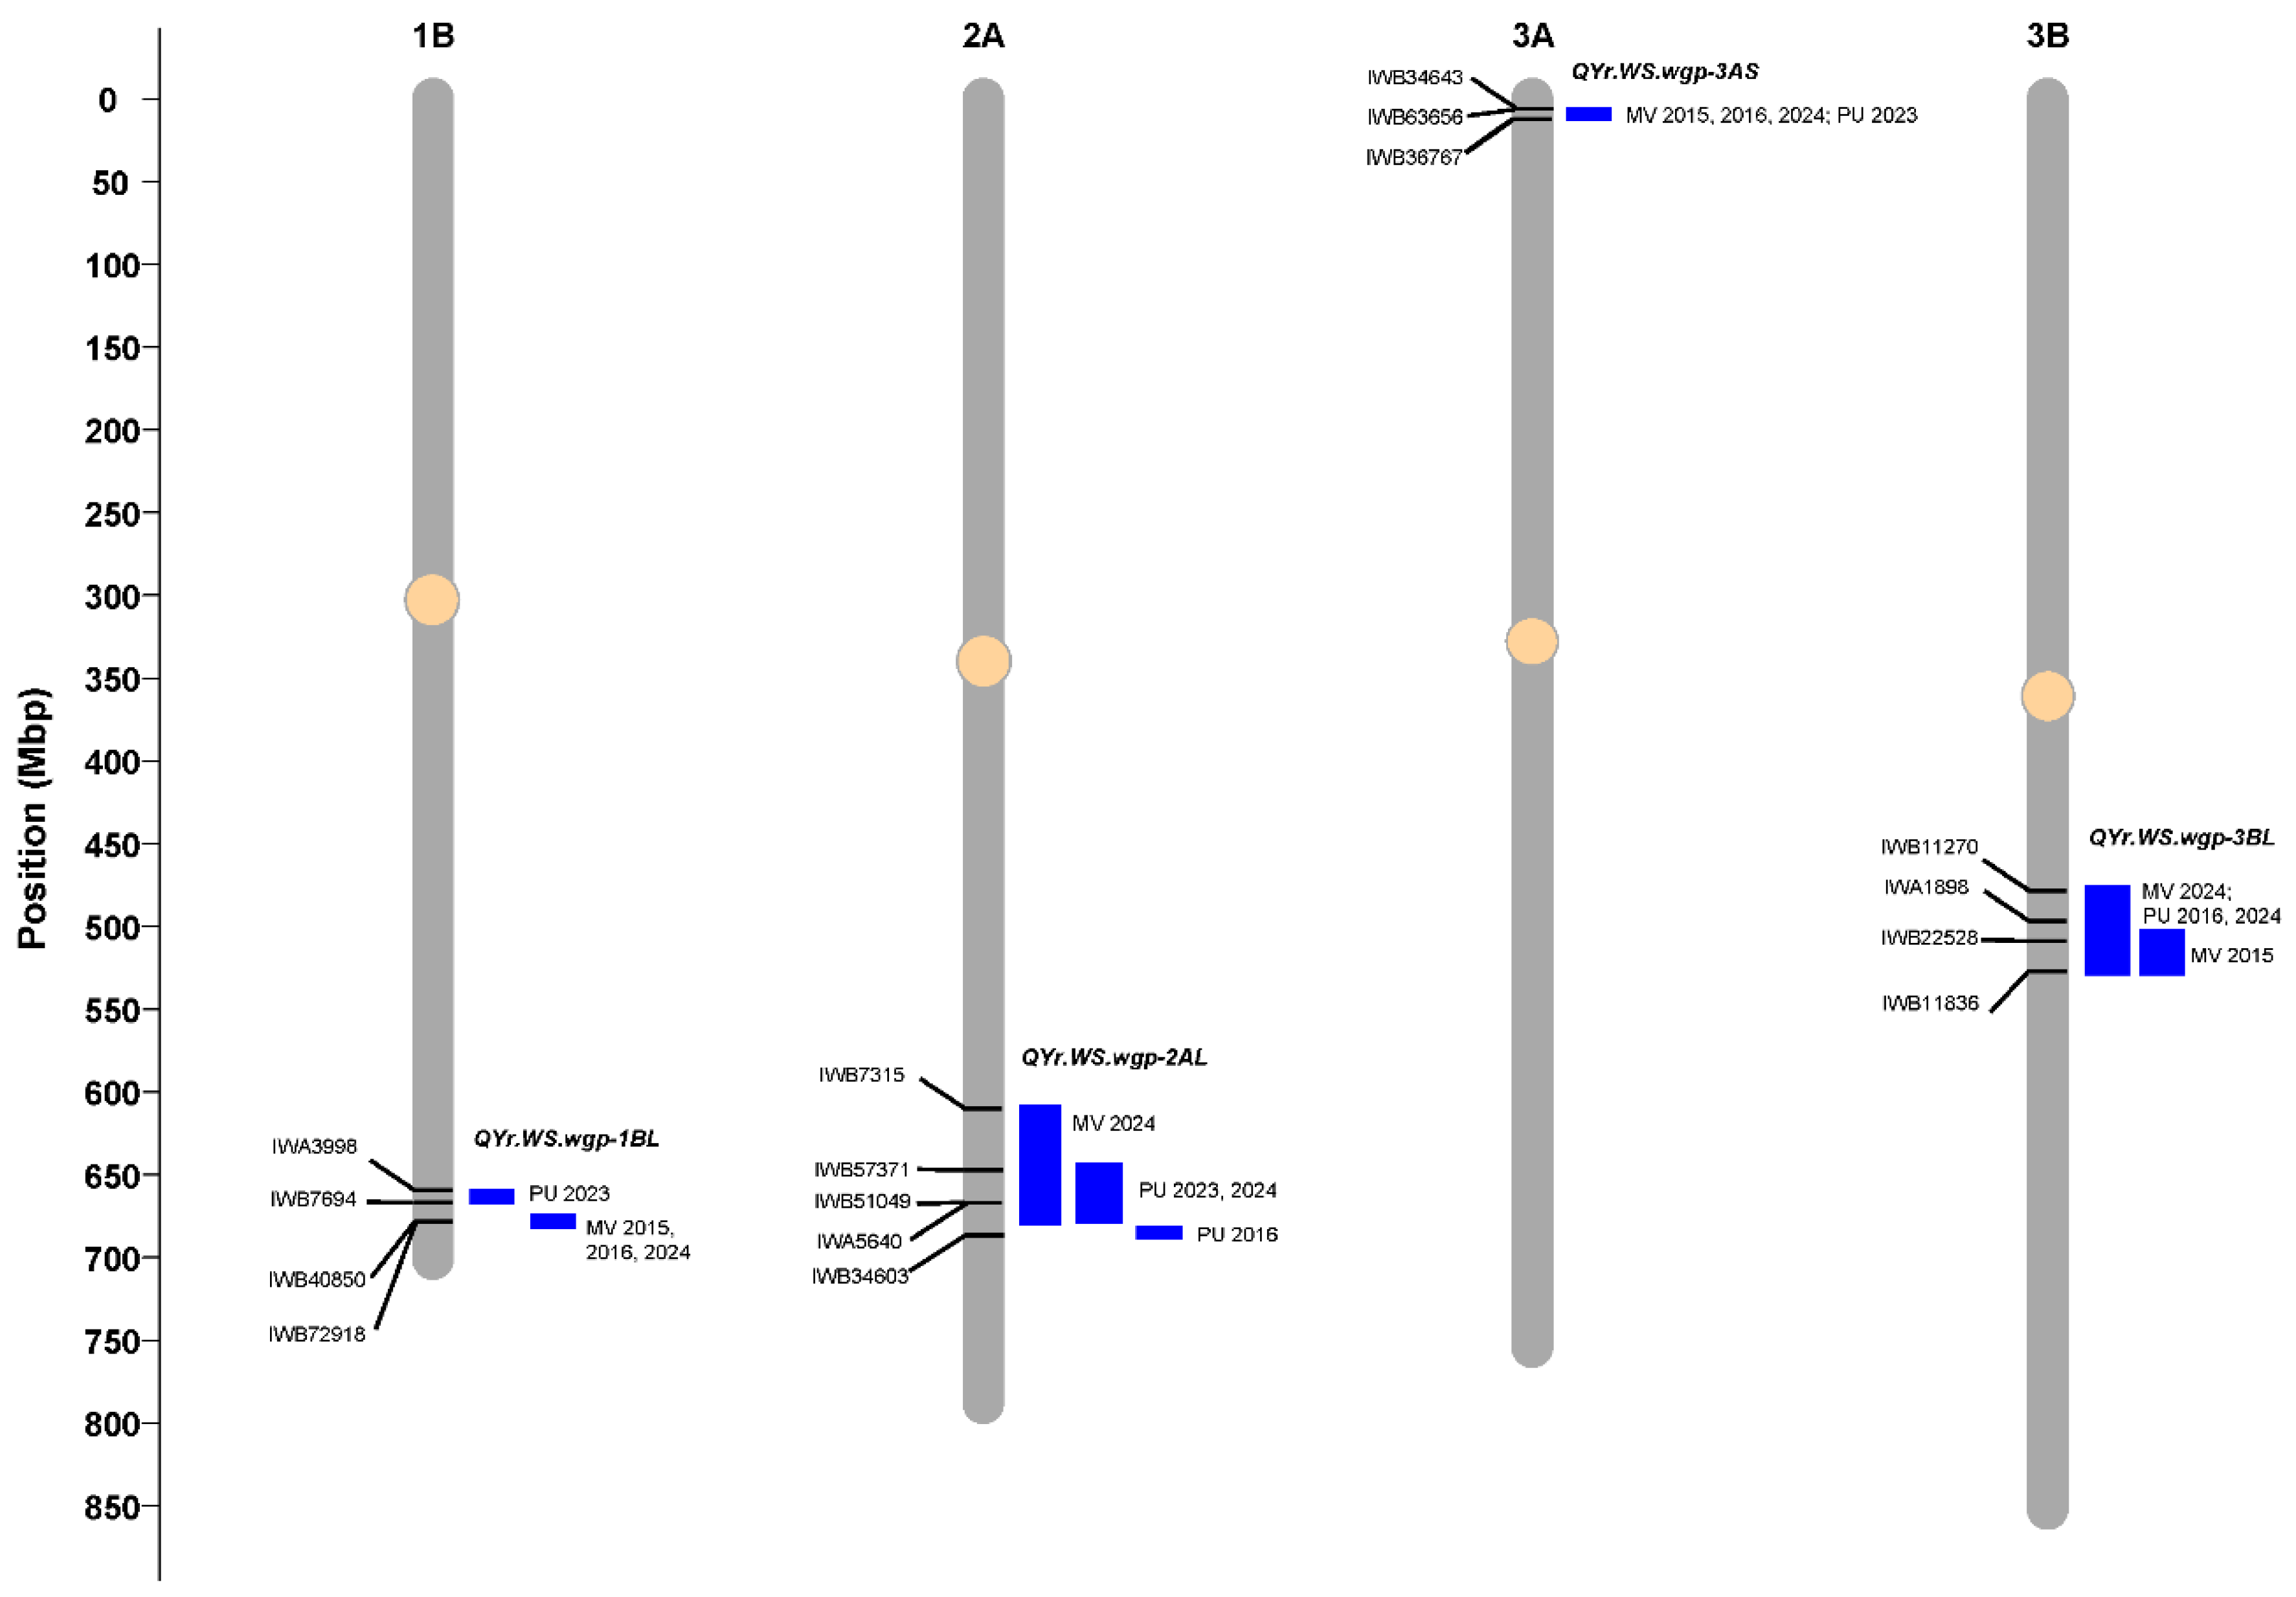
Figure 5.
Bar graphs showing the effects of individual QTL and QTL combinations on stripe rust disease severity (A) and infection type (B) of the recombinant inbred lines from cross AvS/WS.
Figure 5.
Bar graphs showing the effects of individual QTL and QTL combinations on stripe rust disease severity (A) and infection type (B) of the recombinant inbred lines from cross AvS/WS.
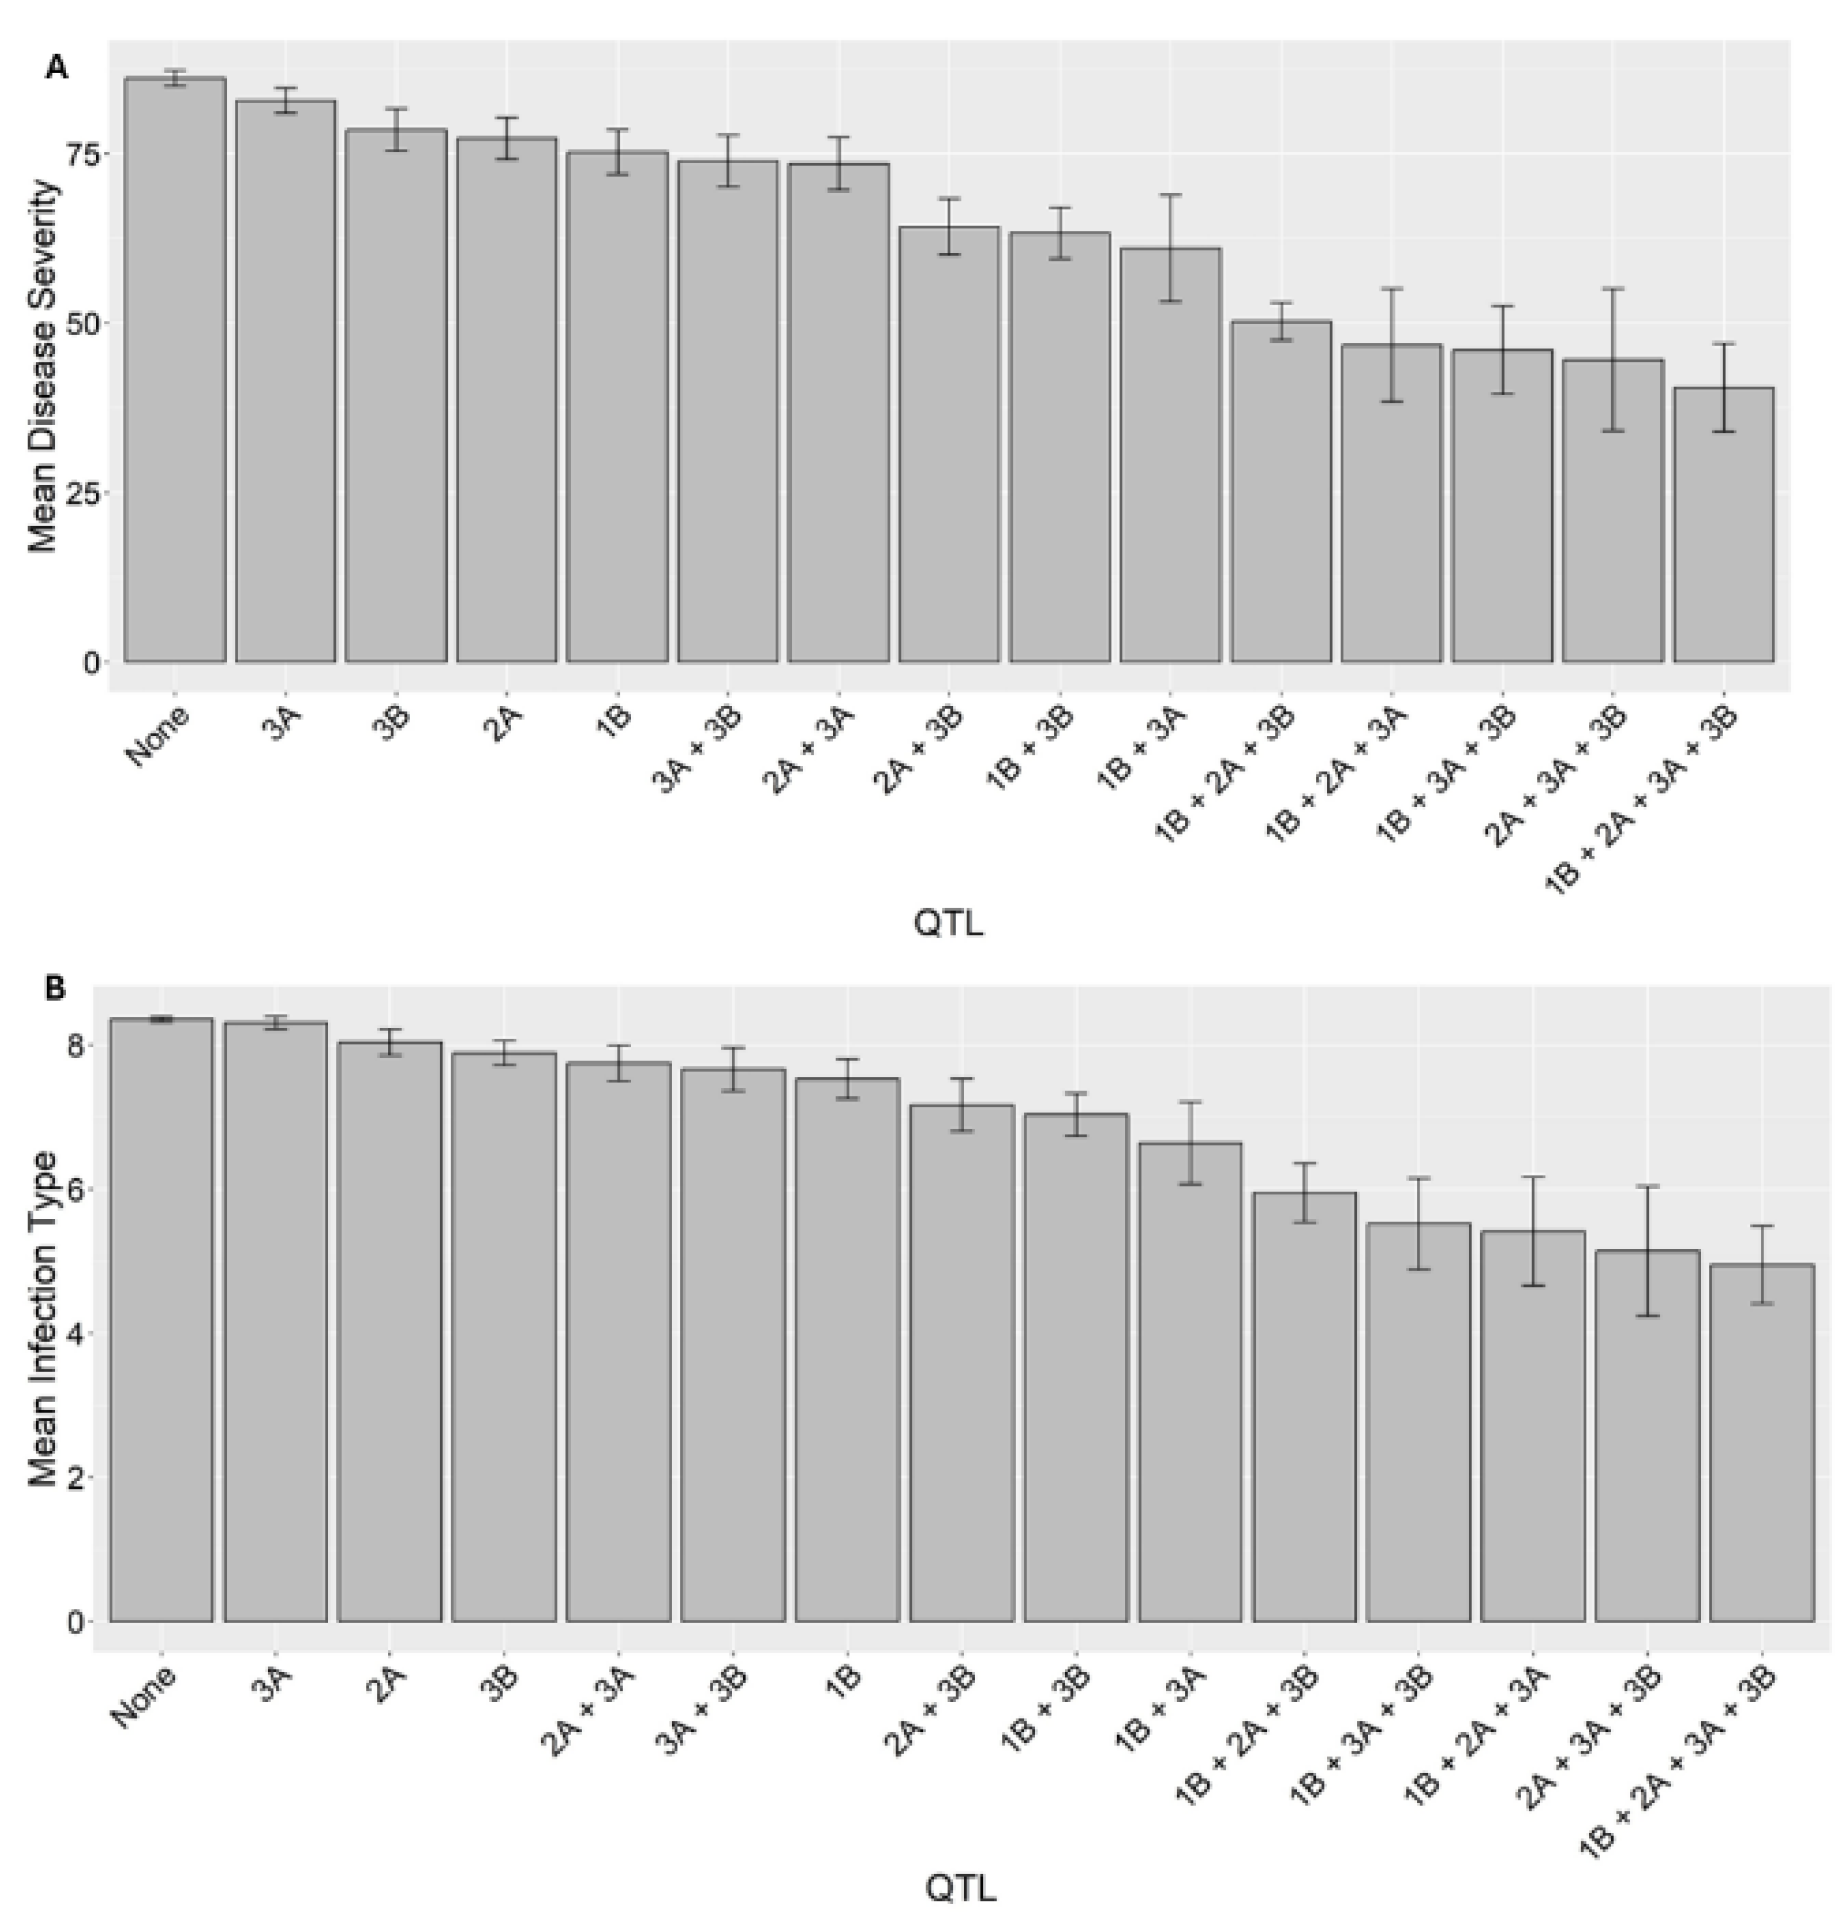

Table 1.
Analysis of variance for the infection type and disease severity of the 114 recombinant inbred lines from cross AvS/WS tested in seven field environments at Pullman and Mount Vernon, Washington.
Table 1.
Analysis of variance for the infection type and disease severity of the 114 recombinant inbred lines from cross AvS/WS tested in seven field environments at Pullman and Mount Vernon, Washington.
| Data | Source of variations | Df | Sum Sq. | Mean Sq. | F-value | Pr (>F) |
| Infection type | Genotype (G) | 113 | 3315 | 29.33 | 45.83 | <2e-16 |
| Environment (E) | 6 | 174 | 28.98 | 45.28 | <2e-16 | |
| G×E | 669 | 1246 | 1.86 | 2.9 | <2e-16 | |
| Error | 789 | 505 | 0.64 | |||
| Disease severity | Genotype (G) | 113 | 546121 | 4833 | 39.86 | <2e-16 |
| Environment (E) | 6 | 132776 | 22129 | 182.52 | <2e-16 | |
| G×E | 669 | 195494 | 292 | 2.41 | <2e-16 | |
| Error | 789 | 95661 | 121 |
Table 2.
Four quantitative trait loci (QTL) identified for high-temperature adult-plant resistance to stripe rust in spring wheat William Som (PI 184597) from field evaluations.
Table 2.
Four quantitative trait loci (QTL) identified for high-temperature adult-plant resistance to stripe rust in spring wheat William Som (PI 184597) from field evaluations.
| QTL | Chr. | Interval (Mbp)a |
Left marker | Position (bp) |
Right marker | Position (bp) |
LOD | PVEb | Traitc |
| QYrWS.wgp-1BL | 1B | 669 - 682 | IWA3998 | 669,136,631 | IWB7694 | 675,532,521 | 4.5 | 13.5 | PU_2023_DS |
| IWB7694 | 675,532,521 | IWB40850 | 681,737,056 | 5.2 | 15.4 | MV_2024_IT | |||
| IWB7694 | 675,532,521 | IWB40850 | 681,737,056 | 7.4 | 19.0 | MV_2024_DS | |||
| IWB7694 | 675,532,521 | IWB72918 | 682,339,545 | 4.7 | 10.0 | MV_2015_DS | |||
| IWB7694 | 675,532,521 | IWB72918 | 682,339,545 | 4.7 | 12.2 | MV_2016_DS | |||
| QYrWS.wgp-2AL | 2A | 611 - 684 | IWB7315 | 611,614,334 | IWB57371 | 643,705,482 | 3.7 | 10.2 | MV_2024_IT |
| IWB57371 | 643,705,482 | IWB51049 | 678,678,971 | 4.0 | 11.0 | PU_2023_DS | |||
| IWB57371 | 643,705,482 | IWB51049 | 678,678,971 | 5.7 | 16.7 | PU_2024_DS | |||
| IWB57371 | 643,705,482 | IWB51049 | 678,678,971 | 4.9 | 12.0 | MV_2024_DS | |||
| IWA5640 | 679,489,440 | IWB34603 | 684,696,382 | 6.8 | 11.9 | PU_2016_IT | |||
| QYrWS.wgp-3AS | 3A | 9 -13 | IWB34643 | 8,940,939 | IWB36767 | 13,212,163 | 3.5 | 7.0 | PU_2023_DS |
| IWB63656 | 8,942,306 | IWB36767 | 13,212,163 | 6.2 | 15.9 | MV_2016_DS | |||
| IWB63656 | 8,942,306 | IWB36767 | 13,212,163 | 3.2 | 6.9 | MV_2024_DS | |||
| IWB63656 | 8,942,306 | IWB36767 | 13,212,163 | 3.3 | 7.3 | MV_2015_DS | |||
| QYrWS.wgp-3BL | 3B | 476 - 535 | IWB11270 | 476,376,513 | IWB22528 | 512,777,195 | 11.5 | 27.8 | PU_2016_DS |
| IWB11270 | 476,376,513 | IWB11836 | 535,559,634 | 8.7 | 15.7 | PU_2016_IT | |||
| IWB11270 | 476,376,513 | IWB11836 | 535,559,634 | 3.7 | 12.0 | PU_2024_DS | |||
| IWB11270 | 476,376,513 | IWB11836 | 535,559,634 | 3.5 | 12.9 | MV_2024_DS | |||
| IWA1898 | 499,086,813 | IWB11836 | 535,559,634 | 5.8 | 12.6 | MV_2015_DS |
a The physical positions of QTL and markers are based on the IWGSC RefSeq v2.1 genome assembly of bread wheat (Triticum aestivum) cv. Chinese Spring [25]; b PVE refers to phenotypic variance explained by a QTL in percentage. c The parents and recombinant inbred lines (RIL) populations (F6, F7, and F8) were tested for stripe rust reaction near Mount Vernon and Pullman, WA, in 2016, 2023, and 2024, and additionally in Mount Vernon in 2015. Pullman and Mount Vernon are abbreviated as PU and MV, respectively. IT and DS refer to infection type and disease severity, respectively.
Table 3.
Kompetitive allele-specific PCR markers developed for the four stable QTL in spring wheat William Som (PI 184597).
Table 3.
Kompetitive allele-specific PCR markers developed for the four stable QTL in spring wheat William Som (PI 184597).
| KASP marker | SNP marker | Primer | Sequence (5' - 3')a | QTL |
| IWA3998 | wsnp_Ex_c4774_8519623 | Forward1 | GAAGGTGACCAAGTTCATGCTGAGTTTTCAGGCCTTGGAGGG | QYrWS.wgp-1BL |
| Forward2 | GAAGGTCGGAGTCAACGGATTGGAGTTTTCAGGCCTTGGAGGA | |||
| Common reverse | CTGGGTCGTCAGTTTGACTTAAGCAT | |||
| IWB7694 | BS00028747_51 | Forward1 | GAAGGTGACCAAGTTCATGCTGGACTGGAGCAAAATTTCAAGTGTAA | QYrWS.wgp-1BL |
| Forward2 | GAAGGTCGGAGTCAACGGATTGGACTGGAGCAAAATTTCAAGTGTAG | |||
| Common reverse | CCCAGCTGCACATTGTAAATTCCGTT | |||
| IWA5640 | wsnp_EX_rep_c69799_68761171 | Forward1 | GAAGGTGACCAAGTTCATGCTAGCCCTTCACCTTGATCACCTT | QYrWS.wgp-2AL |
| Forward2 | GAAGGTCGGAGTCAACGGATTAGCCCTTCACCTTGATCACCTC | |||
| Common reverse | TCCTTAACGAGGAGCTTGCAGACAT | |||
| IWB34603 | IAAV2718 | Forward1 | GAAGGTGACCAAGTTCATGCTGAAGTTTCAAGATATAAACCAAGTGCATG | QYrWS.wgp-2AL |
| Forward2 | GAAGGTCGGAGTCAACGGATTGAAGTTTCAAGATATAAACCAAGTGCATA | |||
| Common reverse | CTGCCTAGCCAATCTGTTTATATCTTGTA | |||
| IWB63656 | RFL_Contig1488_671 | Forward1 | GAAGGTGACCAAGTTCATGCTTCCAGTCCAACGCAAGCTGGA | QYrWS.wgp-3AS |
| Forward2 | GAAGGTCGGAGTCAACGGATTCCAGTCCAACGCAAGCTGGG | |||
| Common reverse | AGGAACAGGCTCAGGGCAGGAT | |||
| IWB36767 | Jagger_c8039_67 | Forward1 | GAAGGTGACCAAGTTCATGCTATGTTAAACATAGGAGTATCACAAAAGATG | QYrWS.wgp-3AS |
| Forward2 | GAAGGTCGGAGTCAACGGATTATAATGTTAAACATAGGAGTATCACAAAAGATA | |||
| Common reverse | CTTTTGTAGTAACATTTTCTGCTATTGGTA | |||
| IWB11270 | BS00082644_51 | Forward1 | GAAGGTGACCAAGTTCATGCTCAAACCGTATACATGTATGTCTATCCT | QYrWS.wgp-3BL |
| Forward2 | GAAGGTCGGAGTCAACGGATTAAACCGTATACATGTATGTCTATCCC | |||
| Common reverse | GCTCCGAACCAATCGCCGGTA | |||
| IWB22528 | Excalibur_c14999_712 | Forward1 | GAAGGTGACCAAGTTCATGCTCCTTGTTGATTCTCTCTTCAGAGC | QYrWS.wgp-3BL |
| Forward2 | GAAGGTCGGAGTCAACGGATTCCCTTGTTGATTCTCTCTTCAGAGT | |||
| Common reverse | CGCTACTCTCCAATGTTTTTGCGAAAATT |
a The allele-specific primers (Forward1 and Forward2) contain 21 bp FAM or HEX tail sequences attached to the 5’ end.
Disclaimer/Publisher’s Note: The statements, opinions and data contained in all publications are solely those of the individual author(s) and contributor(s) and not of MDPI and/or the editor(s). MDPI and/or the editor(s) disclaim responsibility for any injury to people or property resulting from any ideas, methods, instructions or products referred to in the content. |
© 2025 by the authors. Licensee MDPI, Basel, Switzerland. This article is an open access article distributed under the terms and conditions of the Creative Commons Attribution (CC BY) license (http://creativecommons.org/licenses/by/4.0/).
Copyright: This open access article is published under a Creative Commons CC BY 4.0 license, which permit the free download, distribution, and reuse, provided that the author and preprint are cited in any reuse.


