
Submitted:
27 April 2025
Posted:
28 April 2025
You are already at the latest version
Abstract
Genomic selection (GS) has advanced plant breeding by predicting complex traits using genome-wide markers. Integrating genome-wide association study (GWAS) results in GS can further improve accuracy, but most methods rely on static marker selection that does not adapt well to diverse trait architectures. In addition, reported gains are often inflated due to flawed validation, where data leakage, or the unintended sharing of information between training and testing sets, leads to overestimated prediction accuracy. This study addresses these gaps by introducing GWAS_GS2, a novel method that dynamically weights genome-wide markers based on GWAS-derived effect sizes and p-values, enhancing GS models while preserving genome-wide variation. We compared GWAS_GS2 with standard GS (genomic best linear unbiased prediction), marker-assisted selection, and GWAS_GS1 (fixed GWAS effects), using a wheat dataset of 136 lines and 32,412 single nucleotide polymorphisms. Under strict validation, which involved a three-way data split with 50 lines for GWAS, 60 for training, and 26 for testing, GWAS_GS1 performed best for Mendelian traits (R² = 0.1920), while GWAS_GS2 outperformed other methods for polygenic traits (R² = 0.1365). In addition, 5-fold cross-validation overestimated R² for GWAS-informed methods by up to 57.6%. These findings confirm the importance of rigorous validation to avoid bias and highlight GWAS_GS2 as a scalable, unbiased approach to improve selection for complex traits in wheat breeding.
Keywords:
Dynamic weighting
; Genomic selection
; GWAS integration
; Trait architecture
; Validation bias
; Wheat
1. Introduction
Plant breeding has been transformed by genomic selection (GS), a method that uses genome-wide markers to predict breeding values and select superior individuals without the need for extensive phenotyping (Meuwissen et al., 2001). This approach accelerates genetic gain, reduces breeding cycle times, and is particularly valuable in crops like wheat, where complex traits such as yield, and disease resistance are critical for global food security (Tester & Langridge, 2010). By leveraging high-throughput genotyping technologies, GS captures both large and small effect loci, offering a significant advantage over traditional marker assisted selection (MAS), which focuses on sparse, significant single nucleotide polymorphisms (SNPs) identified through genome wide association studies (GWAS) or linkage analysis (Budhlakoti, 2016).
Although GS shows strong potential, its effectiveness depends critically on how prediction accuracy is validated. In particular, methodological flaws can lead to inflated performance estimates. Incorporating GWAS results into GS has been proposed to enhance prediction accuracy by prioritizing trait-associated markers, with studies reporting gains of two to five-fold (Ravelombola et al., 2020; Medina et al. 2021). For example, Spindel et al. (2016) integrated GWAS-identified SNPs as fixed covariates in rice, while Zhang et al. (2014) used GWAS-associated markers to construct kinship matrices in maize, both claiming improved predictions. However, these gains were often calculated using cross-validation schemes that reused the same individuals for GWAS, model training, and testing, thereby violating the independence assumption required for reliable prediction.
Such flawed validation can result in data leakage, a phenomenon where information from the validation set inadvertently influences the training process, inflating prediction accuracy estimates (McGowan et al., 2021). Data leakage obscures the true performance of GWAS-informed GS, creating a critical gap in assessing its genuine benefits over standard GS or MAS (Daetwyler et al., 2010). McGowan et al. (2021) highlighted this issue and proposed conducting GWAS solely on the training population to mitigate validation bias. However, they did not address how to correct this bias while preserving the advantages of GWAS integration, leaving a significant challenge unresolved.
Beyond validation bias, the genetic architecture of traits also complicates method selection. The varying number and effect sizes of quantitative trait loci (QTLs) across traits mean that no single method performs optimally for all scenarios, requiring approaches tailored to the underlying genetics. For example, Mendelian traits, driven by a few large-effect QTLs, are well-suited to MAS or GWAS-informed methods that target major loci (Lande & Thompson, 1990). In contrast, polygenic traits, influenced by many small-effect QTLs, align with GS’s kinship-based approach, which captures genome-wide variation (Goddard & Hayes, 2009).
Despite growing interest, current GWAS-GS strategies, while promising, are limited to static integration methods. Approaches like those of Spindel et al. (2016) and Zhang et al. (2014) either fit significant SNPs as fixed covariates or subset markers for kinship matrices, neglecting dynamic, data-driven weighting of all markers to adapt to trait complexity. Dynamic weighting here involves assigning weights to all SNPs based on their GWAS-derived effect sizes and p-values, scaled to reflect their relative importance, rather than treating a subset as fixed effects or limiting kinship adjustments to significant markers. This allows for a more nuanced integration that can adjust to the genetic architecture of the trait, potentially capturing both large- and small-effect loci more effectively.
Moreover, many existing GWAS-GS methods have not been evaluated using validation schemes that ensure strict independence between GWAS, training, and testing sets. Without this separation, it is difficult to determine whether reported gains truly reflect improved prediction or are artifacts of data leakage. As noted by Crossa et al. (2017), rigorous validation is essential to assess whether GWAS integration consistently outperforms standard GS or MAS under unbiased conditions.
Thus, this study addresses two critical gaps: the validation bias in GWAS-GS integration claims, which inflates reported accuracy gains, and the underexplored potential of dynamic, data-driven weighting schemes for integrating GWAS results, where weights for all markers are derived from GWAS effect sizes and p-values, adjusted dynamically to reflect trait complexity. We address these gaps by comparing four methods: standard GS (genomic best linear unbiased prediction, gBLUP), MAS, GWAS_GS1 (GWAS SNPs as fixed effects), and a novel GWAS_GS2 in a wheat population. Our objectives are to quantify prediction accuracy under flawed (5-fold CV) and strict (three-way split) validations to assess the extent of bias; to evaluate whether GWAS-GS methods improve over GS and MAS under unbiased conditions; and to test method stability across Mendelian and polygenic traits. These findings aim to validate the true benefits of GWAS integration and introduce a novel weighting approach to enhance genomic selection in wheat breeding.
2. Materials and Methods
2.1. Data Acquisition
Genotypic data for Triticum aestivum (bread wheat) were obtained from the T3 Wheat Database (https://wheat.triticeaetoolbox.org/breeders/download; Morales et al., 2022). The dataset comprised 136 accessions from the HapMap2019 panel, genotyped using the Infinium 90K v2.1 protocol and provided in Variant Call Format (VCF). This panel was selected for its diversity and marker density, suitable for genomic selection studies in wheat breeding.
2.2. Data Processing
The VCF file was processed to create a numeric genotype matrix compatible with the Genome Association and Prediction Integrated Tool (GAPIT) package in R (Lipka et al., 2012; Tang et al., 2016; Wang et al., 2021). Using the data.table package, the file was parsed while skipping metadata headers. SNP map information, including chromosome, position, and SNP identifier (ID), was extracted into a myGM file. Genotype data were transformed into numeric values (0 = homozygous reference, 1 = heterozygous, 2 = homozygous alternate) using a custom R function, with missing data coded as NA. The initial genotype matrix (myGD) contained 136 individuals and 41,528 SNPs, while the myGM file included SNPs with chromosome and position information.
SNPs with greater than 50% missing data were filtered out leaving 32,412 SNPs for analysis. Remaining missing values in myGD were imputed by replacing NA with the mean of each SNP column, reducing missing entries to zero. Chromosomes were mapped numerically to meet GAPIT’s requirements. Finally, genotype quality metrics including minor allele frequency (MAF) and heterozygosity were evaluated across 32,412 SNPs. MAF ranged from 0 to 0.5, with 56.67% of SNPs below the 0.2 threshold, indicating a high proportion of rare variants. Heterozygosity values spanned from 0 to 0.69, suggesting variable allelic diversity across loci.
2.3. Phenotype Simulation
Phenotypes were simulated to represent two genetic architectures using the GAPIT.Phenotype.Simulation function in R sourced from http://zzlab.net/GAPIT/gapit_functions.txt. For Mendelian traits, binary outcomes were simulated with a heritability (h²) of 0.5 and 3 quantitative trait nucleotides (NQTN). For polygenic traits, continuous outcomes were simulated with h² = 0.5 and 50 NQTN. Simulations were conducted over 30 replications with different random seeds to ensure robustness and account for stochastic variation, mimicking trait architectures relevant to wheat breeding.
2.4. Genomic Selection Methods
To assess performance across Mendelian and polygenic traits, four genomic prediction methods were compared. First, standard GS (gBLUP) was implemented using 3 principal components (PCA = 3) to account for population structure, modeling additive effects via a kinship matrix from all markers.
The second method, MAS used linear regression with top GWAS-identified SNPs, selected at a p-value threshold of < 5e-5 to balance significance and practicality. This threshold provides strong evidence of association while retaining enough markers to support effective MAS in wheat. If insufficient SNPs met this threshold, the top 3 SNPs were used for Mendelian traits and the top 10 for polygenic traits, reflecting their underlying genetic architecture. Mendelian traits, controlled by a few major loci, can be addressed with fewer markers targeting key QTLs. Polygenic traits, influenced by many small-effect loci, benefit from broader marker coverage to capture more genetic variation.
The third method, GWAS_GS1 extended gBLUP by incorporating GWAS-identified SNPs as fixed covariates, with effect sizes capped at ±10. This means values greater than 10 were set to 10, and values less than -10 were set to -10. This step prevents single markers with unstable estimates from dominating the prediction model. Effect size capping serves as a regularization mechanism. By limiting the influence of outlier SNPs, it reduces model sensitivity to noise and ensures more stable predictions on independent data, which is especially important in small or unbalanced datasets.
In the fourth approach, GWAS_GS2, a novel approach, applied gBLUP using a kinship matrix weighted by GWAS-derived signals. This dynamic weighting prioritizes SNPs with larger effect sizes and stronger associations by scaling their contribution to the kinship matrix, computed as
where βi is the GWAS effect size, pi is the p-value, λ = 0.9 applies shrinkage, and max(combined) is the maximum value of the product log (1 + βᵢ²) × (–log₁₀pᵢ) across all SNPs, where log (1 + βᵢ²) transforms the effect size and –log₁₀pᵢ reflects significance.
Our GWAS_GS2 approach shares conceptual similarities with the trait-specific relationship matrix (TA) method from Zhang et al. (2010), in which marker weights derived from RRBLUP or BayesB posterior variances were used to build a weighted kinship matrix that incorporated identity-by-descent (IBD) information. In contrast, GWAS_GS2 uses a combination of GWAS effect sizes and p-values to define marker weights, applies a log-based transformation, and normalizes these across all SNPs. Kinship is then computed using VanRaden’s method, without IBD correction. This approach enables trait-specific prioritization of informative markers while maintaining computational scalability and compatibility with the gBLUP framework.
2.5. Validation Procedures
Validation accuracy was evaluated using two strategies while testing for validation bias: In the Flawed Validation, GWAS was performed on the full dataset of 136 lines, followed by 5-fold cross-validation for prediction. In each fold, approximately 109 lines (~80%) were used for training and 27 lines (~20%) for testing, repeated five times, risking inflated accuracy due to data overlapping between GWAS and prediction stages. To avoid this, Strict Validation was used, with a three-way split being implemented, with 50 lines (~37%) allocated for GWAS, 60 lines (~44%) for training, and 26 lines (~19%) for testing. These groups were kept fully independent, ensuring that SNPs selected during GWAS had no influence from training or testing data. This setup mirrors real-world breeding, where marker effects are estimated in one population and then applied to another.
2.6. Data Analysis and Visualization
Prediction accuracy (R²) was calculated using the hold-out method, where R² was computed within each test set and then averaged over 30 simulation replicates for both flawed and strict validation. Additional metrics including root mean square error (RMSE), residual variance, and coefficient of variation (CV) were calculated for Strict Validation, as these metrics are designed to assess true model performance and consistency, which are compromised in Flawed Validation due to data leakage inflating prediction errors. Paired t-tests were also applied to Strict R² to compare model performance across methods. These tests were not applied to Flawed Validation because overlapping data can lead to inflated accuracy and unreliable statistical comparisons. Visualization includes bar plots for flawed vs. strict R² generated to illustrate the results.
2.7. Software and Code Availability
Analyses were conducted in R version 4.3.0 (R Core Team, 2023) using GAPIT for GWAS and phenotypic simulation, alongside data.table (v1.14.8), ggplot2 (v3.4.2), reshape2 (v1.4.4), openxlsx (v4.2.5), and cowplot (v1.1.1). Custom R scripts can be requested from authors.
3. Results
3.1. Summary of Method Performance Across Validations
This study evaluated the prediction accuracy of four methods: standard GS (gBLUP), MAS, GWAS_GS, and GWAS_GS2 across Mendelian and Polygenic traits in a wheat population, using both Flawed and Strict Validation schemes over 30 replications. Results indicated that the flawed validation inflated R² for GWAS-informed methods by 25.6–57.6%, while strict validation provided reliable estimates. The relative inflation was quantified as the percentage increase of flawed R² over strict R², calculated as ((Flawed R² − Strict R²) / Strict R²) × 100. GWAS_GS1 achieved the highest accuracy for Mendelian traits (strict R² = 0.1920, p < 0.05 vs. all methods) and GWAS_GS2 exceled for polygenic traits (strict R² = 0.1365, p < 0.001 vs. MAS and GWAS_GS1) (Figure 1).
3.2. Mendelian Trait
For the Mendelian trait (binary, h² = 0.5, NQTN = 3), GWAS_GS1 achieved the highest strict R² of 0.1920, significantly outperforming GS (0.0940, p = 0.0010), MAS (0.0478, p = 0.0007), and GWAS_GS2 (0.0906, p = 0.0010) across 30 replications (Figure 1). This represents a 104.3% improvement in strict R² over GS. MAS recorded the lowest RMSE (2.2440) and residual variance (5.0418), while GWAS_GS1 had an RMSE of 2.6640 and residual variance of 6.6223 (Table 1). GWAS_GS1 showed the lowest CV for strict R² at 0.9919, compared to GS (1.3765), MAS (1.0500), and GWAS_GS2 (1.3882) (Table 1). Paired t-tests confirmed GWAS_GS1’s significance (p < 0.05), with no difference between GS and GWAS_GS2 (p = 0.6062).
3.3. Polygenic Trait
For the polygenic trait (continuous, h² = 0.5, NQTN = 50), GWAS_GS2 achieved the highest strict R² of 0.1365, significantly outperforming MAS (0.0295, p = 4.14 x e-05) and GWAS_GS1 (0.0749, p = 0.0002), a 362.7% improvement over MAS (Figure 1). GS recorded a strict R² of 0.1256 (p = 0.1561 vs. GWAS_GS2), differing by 8.7%. GWAS_GS2 had the lowest RMSE (6.1794) and residual variance (38.2113), compared to GS (6.2314, 38.8328), while MAS and GWAS_GS1 showed higher RMSE (26.7025, 22.1835) and residual variance (712.4898, 492.3881) (Table 1). GWAS_GS2 exhibited the lowest CV for strict R² at 0.8562, followed by GS (0.9684), MAS (0.9690), and GWAS_GS1 (1.4096) (Table 1). T-tests confirmed significance for GWAS_GS2 and GS over MAS and GWAS_GS1 (p < 0.05).
3.4. Validation Comparison
Prediction accuracy under flawed and strict validation was compared to assessing the degree of inflation due to data leakage. Flawed validation overestimated R² for GWAS_GS1 and GWAS_GS2, with drops under Strict validation (Mendelian GWAS_GS1: 0.2582 to 0.1920, -25.6%; Polygenic GWAS_GS2: 0.3220 to 0.1365, -57.6%) (Figure 1). GS and MAS showed higher Strict R² than Flawed R² for both traits (Mendelian GS: 0.0940 vs. 0.0690, +36.2%; MAS: 0.0478 vs. 0.0050, +856%; Polygenic GS: 0.1256 vs. 0.0934, +34.5%; MAS: 0.0295 vs. 0.0075, +293.3%) (Figure 1). Strict validation provided reliable estimates, with GWAS_GS1 and GWAS_GS2 maintaining higher performance (p < 0.05 vs. most methods) and lower CV (Table 1).
Prediction metrics averaged over 30 replications for Mendelian (binary, h² = 0.5, 3 quantitative trait nucleotides) and Polygenic (continuous, h² = 0.5, 50 quantitative trait nucleotides) traits under strict validation, using a three-way split (50 lines for GWAS, 60 for training, 26 for testing) to ensure independence. RMSE (root mean square error) measures prediction error, Residual Variance indicates model fit, CV (coefficient of variation of residuals) reflects the relative variability of prediction errors, and Standard Error (SE) of residuals quantifies the precision of the mean prediction errors, with lower values suggesting better performance and consistency.
Bar plots show R² (coefficient of determination) averaged over 30 replications for four methods: GS (genomic selection), MAS (marker-assisted selection), GWAS_GS1 (fixed GWAS effects), and GWAS_GS2 (dynamic GWAS-weighted kinship). Mendelian traits are binary (h² = 0.5, 3 quantitative trait nucleotides), and Polygenic traits are continuous (h² = 0.5, 50 quantitative trait nucleotides). Flawed R² uses 5-fold cross-validation with GWAS on the full dataset (136 lines), risking data leakage. Strict R² uses a three-way split (50 lines for GWAS, 60 for training, 26 for testing) to ensure independence. GWAS_GS1 leads for Mendelian traits (Strict R² = 0.1920), and GWAS_GS2 for Polygenic traits (Strict R² = 0.1365).
4. Discussion
4.1. Validation Bias and Method Performance
This study demonstrates the critical role of validation procedures in assessing GS accuracy, confirming that flawed validation inflates prediction accuracy for GWAS-informed methods while a strict, independent split provides reliable estimates. GWAS_GS1, which incorporates GWAS-identified SNPs as fixed effects, excelled for Mendelian traits with a Strict R² of 0.1920 (p < 0.001 vs. all methods), reflecting its ability to prioritize the few large-effect QTLs characteristic of such traits. This aligns with prior work showing that inclusion of fixed GWAS effects improves prediction for traits governed by major loci, particularly when marker-trait associations are strong and stable across environments (Bernardo, 2014).
In contrast, GWAS_GS2, employing a novel dynamic weighting scheme (λ = 0.9) that adjusts kinship matrices using GWAS effect sizes and p-values, achieved the highest Strict R² for polygenic traits at 0.1365 (p < 0.001 vs. MAS and GWAS_GS1), outperforming standard GS (R² = 0.1256) by 8.7%. These results validate the hypothesis that flawed validation overestimates GWAS-GS accuracy, evident in the substantial R² drops from Flawed to Strict validation (e.g., GWAS_GS2 Polygenic: 0.3220 to 0.1365, -57.6%) and support the hypothesis that dynamic weighting enhances predictions for polygenic traits under unbiased conditions, aligning with the need for rigorous validation protocols identified by McGowan et al. (2021).
4.2. Suitability of Methods for Different Trait Architectures
The performance differences across methods highlight their suitability for distinct genetic architectures. GWAS_GS1’s success with Mendelian traits (104.3% improvement over GS) stems from its focus on major QTLs, a strategy effective when few loci dominate trait variation. Conversely, GWAS_GS2’s edge for polygenic traits (362.7% improvement over MAS) arises from its ability to balance GWAS signals with genome-wide variation, adapting to the complexity of many small-effect loci. However, MAS and GWAS_GS1 underperformed for polygenic traits (R² = 0.0295 and 0.0749, respectively), with high RMSE (26.7025 and 22.1835) and residual variance (712.4898 and 492.3881), indicating their inability to capture distributed genetic effects.
Similarly, MAS’s low Mendelian R² (0.0478) despite the lowest RMSE (2.2440) and residual variance (5.0418) suggests consistent but inaccurate predictions, likely due to noisy SNP selection failing to target true QTLs. These findings underscore that method choice must align with trait architecture, with GWAS_GS1 suited for Mendelian traits and GWAS_GS2 for polygenic ones, while MAS remains limited in both contexts.
4.3. Unexpected Patterns in GS and MAS Performance
An unexpected pattern emerged for GS and MAS, where Strict R² exceeded Flawed R² for both Mendelian (GS: 0.0940 vs. 0.0690, +36.2%; MAS: 0.0478 vs. 0.0050, +856%) and polygenic traits (GS: 0.1256 vs. 0.0934, +34.5%; MAS: 0.0295 vs. 0.0075, +293.3%). For GS, the small sample size (136 lines) and variability in 5-fold CV likely introduced noise in Flawed validation, as repeated splitting into small training sets (~109 lines) may have destabilized the kinship matrix, lowering R². The fixed training set in Strict validation (60 lines) provided a more stable estimate, yielding higher R².
For MAS, despite leakage in Flawed validation, the GWAS on the full dataset selected noisy SNPs, particularly for the polygenic trait, due to small sample size and trait complexity, resulting in poor predictions (e.g., Mendelian Flawed R² = 0.0050). In Strict validation, the smaller GWAS set (50 lines) may have reduced false positives, selecting more reliable SNPs (e.g., Mendelian Strict R² = 0.0478). These differences, though small, are within the range of variability (CV: 0.8562–1.4096, Table 1), suggesting a statistical artifact, but they highlight the challenges of small datasets in genomic prediction.
4.4. Implications for Wheat Breeding
The implications of these findings for wheat breeding are significant. GWAS_GS1 and GWAS_GS2 offer reliable improvements over standard GS and MAS under strict validation, with GWAS_GS2’s dynamic weighting providing a scalable approach for complex traits like yield or disease resistance in wheat. Compared to prior work, our accuracy gains are modest, GWAS_GS2’s 8.7% improvement over GS for polygenic traits contrasts with the two- to five-fold gains reported by Zhang et al. (2014), likely because their studies used flawed validation methods, as critiqued by McGowan et al. (2021). Similarly, Spindel et al. (2016) reported higher gains in rice using fixed covariates, but their validation also risked leakage, inflating R². Our strict validation ensures unbiased estimates, providing a more realistic assessment of GWAS-GS benefits, which is crucial for practical breeding applications where true prediction accuracy drives selection decisions.
4.5. Limitations and Future Directions
Several limitations attenuate these findings. The small dataset (136 lines) constrained absolute R² values, lower than those in larger wheat studies (R² ~0.4–0.5), and likely contributed to overfitting, evident in the Flawed-to-Strict R² drops for GWAS_GS1 and GWAS_GS2. The Mendelian trait simulation, with a binary outcome, introduced bias (estimated at ~0.69 for GS, GWAS_GS1, and GWAS_GS2), potentially due to binarization artifacts, though this did not affect relative method rankings. Phenotypes were simulated, omitting real-world complexities like population structure, epistasis, and environmental interactions, which may reduce prediction accuracy in applied settings. Fixed GWAS thresholds (p < 5e-5) and shrinkage parameters (λ = 0.9) were used; optimizing these could further enhance performance. Additionally, the GS/MAS anomaly (Strict R² > Flawed R²) highlights the instability of small-sample cross-validation, a limitation that larger datasets could mitigate.
Future research should focus on larger populations to increase R² and reduce variability, as well as testing GWAS_GS2 on real wheat datasets to account for population structure and epistasis. Exploring alternative validation methods, such as repeated random sub-sampling, could further validate our findings. Additionally, optimizing GWAS thresholds and shrinkage parameters through cross-validation or Bayesian approaches may improve GWAS_GS2’s performance, particularly for polygenic traits. These steps would enhance the applicability of GWAS-informed GS in wheat breeding, ensuring robust predictions for complex traits under real-world conditions.
5. Conclusion
This study demonstrates that integrating GWAS results into GS enhances prediction accuracy, with distinct methods excelling based on trait architecture. GWAS_GS1 achieved the highest accuracy for Mendelian traits (Strict R² = 0.1920), while GWAS_GS2 outperformed others for polygenic traits (Strict R² = 0.1365). Strict validation, using an independent three-way data split, proved essential to avoid overestimation of accuracy, as flawed 5-fold cross-validation inflated R² for GWAS-informed methods by up to 57.6%. The dynamic weighting approach in GWAS_GS2, which adjusts the kinship matrix based on GWAS effect sizes and p-values, improved Strict R² by 8.7% compared to standard GS (from 0.1256 to 0.1365). This result highlights the benefit of incorporating GWAS signals into kinship construction for predicting complex traits. These findings support the adoption of GWAS-informed GS in wheat breeding, provided that rigorous validation protocols are used to ensure reliable and unbiased prediction outcomes. Applying such strategies can improve selection accuracy and accelerate the development of high-performing wheat varieties, contributing to global food security.
Acknowledgement
This research was completed for the Statistical Genomics 545 course during Spring 2025 at Washington State University. We extend our appreciation to Dr. Zhiwu Zhang, the course instructor, and Meijing Liang for their direction and constructive comments throughout the project.
References
- Bernardo, R. (2014). Genomewide selection when major genes are known. Crop Science, 54(1), 68-75. [CrossRef]
- Budhlakoti, N., Kushwaha, A. K., Rai, A., Chaturvedi, K. K., Kumar, A., Pradhan, A. K.,... & Kumar, S. (2022). Genomic selection: A tool for accelerating the efficiency of molecular breeding for development of climate-resilient crops. Frontiers in Genetics, 13, 832153. [CrossRef]
- Crossa, J., Pérez-Rodríguez, P., Cuevas, J., Montesinos-López, O., Jarquín, D., De Los Campos, G., ….. & Varshney, R. K. (2017). Genomic selection in plant breeding: methods, models, and perspectives. Trends in Plant Science, 22(11), 961-975. [CrossRef]
- Daetwyler, H. D., Calus, M. P. L., Pong-Wong, R., de los Campos, G., & Hickey, J. M. (2010). The impact of genetic architecture on genome-wide evaluation methods. Genetics, 185(3), 1021-1031. [CrossRef]
- Goddard, M. E., & Hayes, B. J. (2009). Mapping genes for complex traits in domestic animals and their use in breeding programmes. Nature Reviews Genetics, 10(6), 381–391. [CrossRef]
- Lande, R., & Thompson, R. (1990). Efficiency of marker-assisted selection in the improvement of quantitative traits. Genetics, 124(3), 743–756. [CrossRef]
- Lipka, A. E., Tian, F., Wang, Q., Peiffer, J., Li, M., Bradbury, P. J.,... & Zhang, Z. (2012). GAPIT: genome association and prediction integrated tool. Bioinformatics, 28(18), 2397-2399. [CrossRef]
- McGowan, M., Wang, J., Dong, H., Liu, X., Jia, Y., Wang, X., Iwata, H., Li, Y., Lipka, A. E., & Zhang, Z. (2021). Ideas in genomic selection with the potential to transform plant molecular breeding: A review. Plant Breeding Reviews, 45, 273–343. [CrossRef]
- Medina, C. A., Kaur, H., Ray, I., & Yu, L. X. (2021). Strategies to increase prediction accuracy in genomic selection of complex traits in alfalfa (Medicago sativa L.). Cells, 10(12), 3372. [CrossRef]
- Meuwissen, T. H. E., Hayes, B. J., & Goddard, M. E. (2001). Prediction of total genetic value using genome-wide dense marker maps. Genetics, 157(4), 1819–1829. [CrossRef]
- Morales, N., Ogbonnaya, F. C., & Dreisigacker, S. (2022). T3/Wheat Database: A comprehensive resource for wheat breeding and genomics. Wheat Science Journal, 8(2), 45–56.
- R Core Team. (2023). R: A Language and Environment for Statistical Computing. R Foundation for Statistical Computing, Vienna, Austria. https://www.R-project.org/.
- Ravelombola, W. S., Qin, J., Shi, A., Nice, L., Bao, Y., Lorenz, A.,... & Chen, S. (2020). Genome-wide association study and genomic selection for tolerance of soybean biomass to soybean cyst nematode infestation. PLoS One, 15(7), e0235089. [CrossRef]
- Spindel, J. E., Begum, H., Akdemir, D., Collard, B., Redoña, E., Jannink, J. L., & McCouch, S. (2016). Genome-wide prediction models that incorporate de novo GWAS are a powerful new tool for tropical rice improvement. Heredity, 116(4), 395-408.
- Tang, Y., Liu, X., Wang, J., Li, M., Wang, Q., Tian, F.,... & Zhang, Z. (2016). GAPIT version 2: an enhanced integrated tool for genomic association and prediction. The plant genome, 9(2), plantgenome2015-11. [CrossRef]
- Tester, M., & Langridge, P. (2010). Breeding technologies to increase crop production in a changing world. Science, 327(5967), 818–822. [CrossRef]
- Wang, J., & Zhang, Z. (2021). GAPIT version 3: boosting power and accuracy for genomic association and prediction. Genomics, proteomics & bioinformatics, 19(4), 629-640. [CrossRef]
- Zhang, Z., Liu, J., Ding, X., Bijma, P., de Koning, D. J., & Zhang, Q. (2010). Best linear unbiased prediction of genomic breeding values using a trait-specific marker-derived relationship matrix. PloS one, 5(9), e12648. [CrossRef]
- Zhang, Z., Ober, U., Erbe, M., Zhang, H., Gao, N., He, J.,... & Simianer, H. (2014). Improving the accuracy of whole genome prediction for complex traits using the results of genome wide association studies. PloS one, 9(3), e93017. [CrossRef]
Figure 1.
Comparison of Flawed and Strict R² for Mendelian (a) and Polygenic (b) traits.
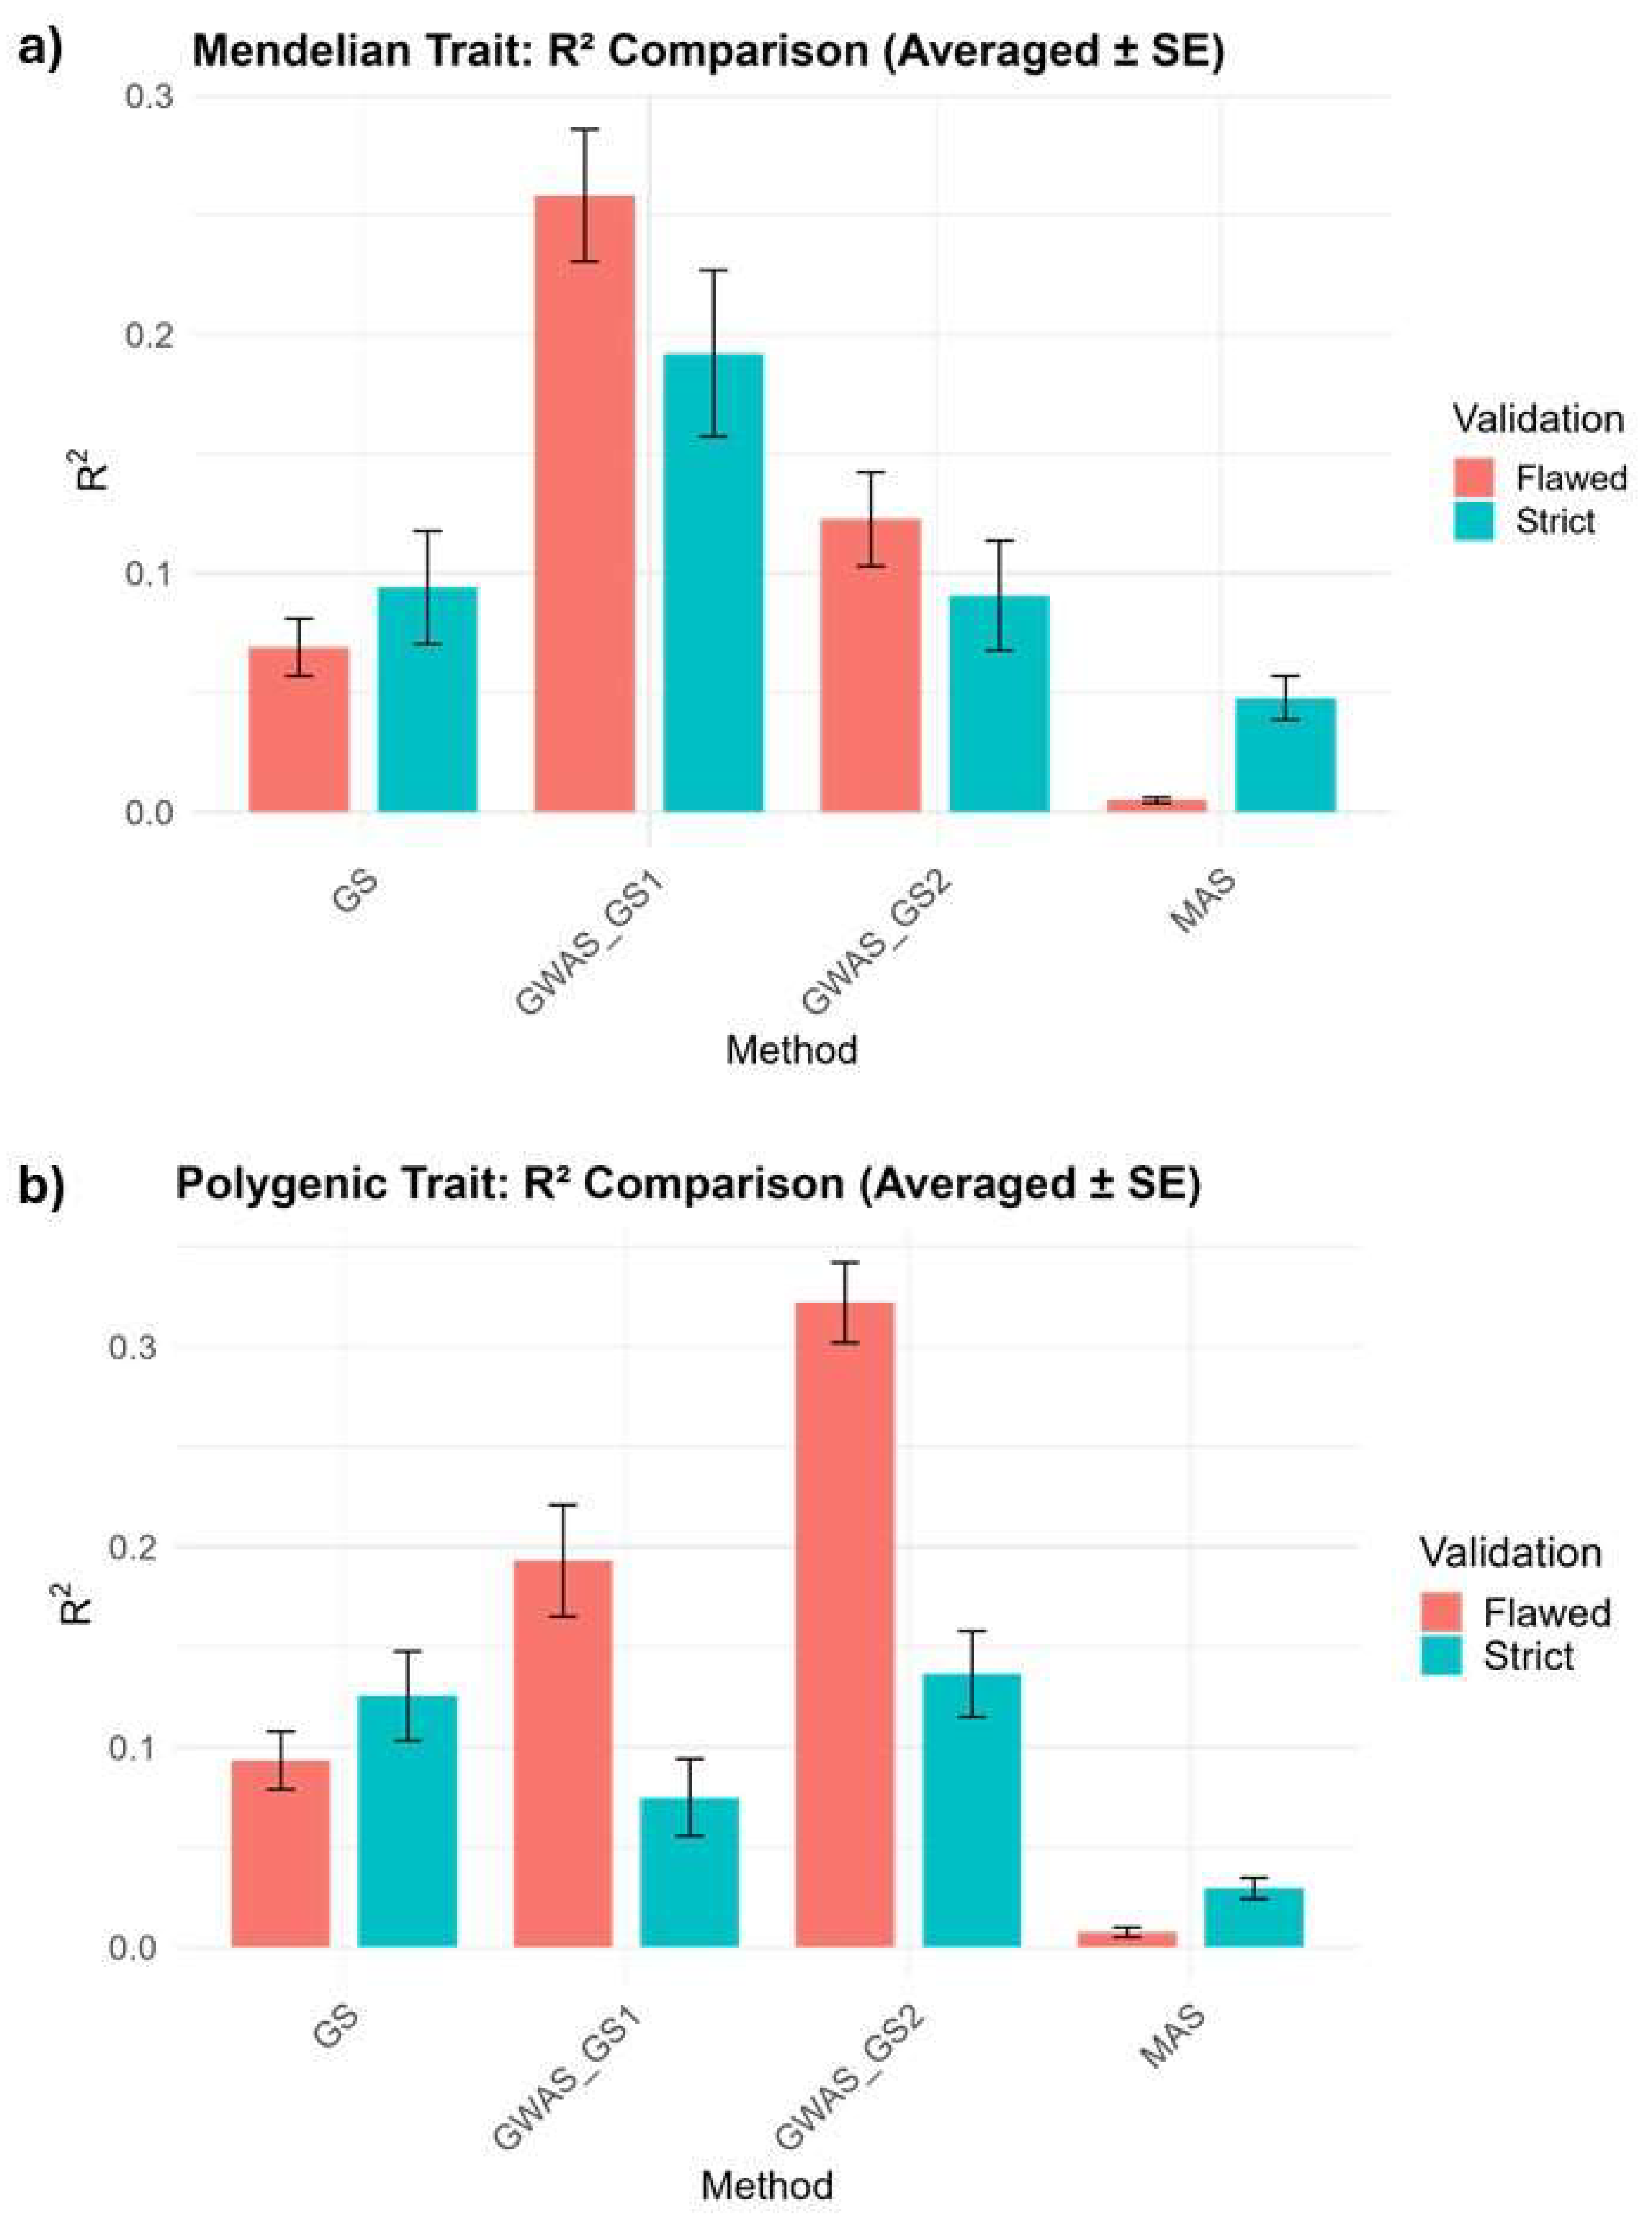

Table 1.
Prediction Metrics for Mendelian and Polygenic Traits under Strict validation.
| Trait | Method | RMSE | Residual Variance | CV | SE |
|---|---|---|---|---|---|
| Mendelian | GS | 2.7084 | 6.8628 | 1.3765 | 0.0236 |
| MAS | 2.2440 | 5.0418 | 1.0500 | 0.0091 | |
| GWAS_GS1 | 2.6640 | 6.6223 | 0.9919 | 0.0347 | |
| GWAS_GS2 | 2.7124 | 6.8818 | 1.3882 | 0.0229 | |
| Polygenic | GS | 6.2314 | 38.8328 | 0.9684 | 0.0221 |
| MAS | 26.7025 | 712.4898 | 0.9690 | 0.0052 | |
| GWAS_GS1 | 22.1835 | 492.3881 | 1.4096 | 0.0192 | |
| GWAS_GS2 | 6.1794 | 38.2113 | 0.8562 | 0.0213 |
Disclaimer/Publisher’s Note: The statements, opinions and data contained in all publications are solely those of the individual author(s) and contributor(s) and not of MDPI and/or the editor(s). MDPI and/or the editor(s) disclaim responsibility for any injury to people or property resulting from any ideas, methods, instructions or products referred to in the content. |
© 2025 by the authors. Licensee MDPI, Basel, Switzerland. This article is an open access article distributed under the terms and conditions of the Creative Commons Attribution (CC BY) license (http://creativecommons.org/licenses/by/4.0/).
Copyright: This open access article is published under a Creative Commons CC BY 4.0 license, which permit the free download, distribution, and reuse, provided that the author and preprint are cited in any reuse.


