
Submitted:
18 March 2025
Posted:
19 March 2025
You are already at the latest version
Abstract
The electrode materials from spent lithium-ion batteries consist of graphite and lithium cobalt oxides (LCO), which cannot be efficiently separated by conventional flotation technique due to fine size distributions of graphite and LCO. In this work, nanobubbles were introduced to the flotation system of electrode materials. Nanobubbles were produced with the method of temperature difference. The different degrees of gas over-saturation in water/slurry were created by increasing temperature of cold water stored in a 4℃ environment at least 72 h to the terminal 20℃, 25℃, 30℃ respectively. It was founded that height and lateral distance of nanobubbles increased with the degree of gas oversaturation of water. Besides, the larger graphite agglomerations were observed to form in the presence of nanobubbles. The D50 (chord length) of graphite agglomerations increased by 8 μm, 11 μm and 21 μm respectively compared with the D50 of graphite in natural water. More graphite agglomerations adhered to a captive bubble with aid of nanobubbles than the case of no nanobubbles, which was indicated by increased wrapping angles of graphite (agglomerations) adhering to a captive bubble. Furthermore, the maximum adhesion force between a captive bubble and substrate increases to 220, 270, 300 μN as cold water temperature increases to 20, 25 and 30℃. The frost of nanobubbles on graphite surface and thus resulting in graphite agglomerations by bridging effect of nanobubbles together should be responsible for the improved flotation performance of electrode materials. The present results indicate that flotation performance of fine minerals can be regulated by regulating gas oversaturation degree of slurry.
Keywords:
flotation
; nanobubbles
; agglomerations
; adhesion force
; electrode materials
1. Introduction
Lithium ion batteries (LIBs) has been widely applied as a power source in laptops, personal mobile phones and electric vehicles et al due to high energy density, small volume, light weight since they were successfully commercialized in the last century[1]. In China a large number of electric vehicles have been being produced by automobile manufacturers such as Tesla, BYD, Geely et al. It was reported that China’s new electric vehicles sales increased by 82% in 2022, accounting for nearly 60% of global electric vehicles purchases. As the power heart of electric vehicles, LIBs usually have 3-12 years lifetime therefore China will soon have to face a surge in lithium ion batteries scrapping in the future. Therefore necessary measures will have to be taken to recycle these batteries after reaching their end of life. LIBs normally consist of outer shell, copper/aluminum current collectors, a separator, a negative electrode made of graphite and a positive electrode based on layered transition metal oxide such as LiCoO2 and LiNiO2 or mixtures thereof and so on[2]. The first step of recycling chain of spent LIBs is discharging and crushing operation. It was reported that several components such as metallic outer shell and copper/aluminum current collectors were respectively enriched in specific coarse size fractions and therefore were separated by sieving with a screen[3]. However a huge challenge was posed for separation of anode and cathode powders due to their similar fine size distribution.
Froth flotation is an effectively method to separate fine minerals based on the differences in surface hydrophobicity[4,5]. During a flotation process, hydrophobic particles tend to adhere to rising bubbles and finally report to the froth layer while hydrophilic particles are left as tailings in slurry. Graphite shows a natural hydrophobicity while lithium cobalt oxide shows a natural hydrophilicity, which provide a possibility of separating electrode materials with froth flotation. Aliza et al [6] reported flotation experiments of electrode materials after pyrolysis pretreatment, and the recovery of graphite in the overflow product reached 91%. It was reported that polyvinylidene fluoride (PVDF) polymers are widely used to stick electrode materials to current collector of batteries, which resulted in decreased difference in surface hydrophobicity between cathode and anode materials. For example, the grade of cobalt increased from 24.21% to only 28.08% in flotation products as the electrode materials were subjected to flotation without any pretreatment[3]. Many pretreatment measures were proposed to remove PVDF from electrode materials including pyrolysis[7,8,9,10], dissolution with chemicals[11], grinding [12,13] and so on. Pretreatment with pyrolysis and chemicals usually cause the release of poisonous gas or residual of chemical in liquid, posing a huge challenge to environment protection. Grinding is an green and eco-friendly pretreatment technique and has been widely applied in minerals processing. However attrition operation will inevitably lower size distribution of electrode materials, which pose a huge challenge to conventional flotation technology for separation these materials.
Nanobubbles are tiny bulk bubbles with a diameter of less than 1 μm[14] or spherical-cap-shaped nanostructures present at solid-liquid interfaces with one to tens of nanometers in maximum height and tens to hundreds of nanometers or even several microns in lateral diameter[15]. Nanobubbles were firstly proposed to explain discontinuities or steps present in the force curves[16] and have attracted much attention since they were imaged successfully by Lou et al[17] with AFM at the beginning of this century. Now the existence of surface nanobubbles at solid-liquid interface has been widely recognized and numbers of techniques have been developed to generate nanobubbles including alcohol-water exchange[18,19], cold water warming method[20,21,22] depressurization[23] electrolysis[24,25] and cavitation[26,27]. Nanobubbles show a potential application in minerals flotation. Based on fundamental flotation theory, flotation performance of fine minerals can be improved by formation of agglomerations. A number of studies have revealed that nucleation or adhesion of nanobubbles on particle surface significantly influences flotation behavior of fine particles, which is due to the ability of nanobubbles influencing the sub-processes (collision, adhesion) of flotation. Liu et al[28] reported agglomeration behavior of ultrafine coal particles with different hydrophobicity in the presence of nanobubbles, which was one of the reasons for improving flotation performance of fine coal in the presence of nanobubbles. Knüpfer[19] reported that nanobubble enhanced agglomeration of hydrophobic alumina powders. Li et al [29,30] reported improved flotation performance of fine coal in the presence of surface nanobubbles. In our previous studies, we systematically studied nanobubbles nucleation behavior[31], and the removal of ultrafine graphite by nanobubbles-assisted flotation technique from graphite slime slurry[32], where the method of gas oversaturation by rising temperature of cold water was frequently adopted. This method is expected to be of popularization and application in an industrial scale while necessary information that effect gas oversaturation degree on flotation behavior of fine particles is still lacking.
In this work, the effects of gas supersaturation degree on the nucleation behavior of nanobubbles, particle agglomeration behavior and particle-bubble interactions were studied by combining atomic force microscopy, colloidal probe technology and FBRM particle size measurement technology. Furthermore, interaction force measurement and flotation performance were explored with different gas oversaturation degrees. The present results is expected to provide a technical reference for separation of other fine particles with flotation.
2. Experimental
2.1. Materials
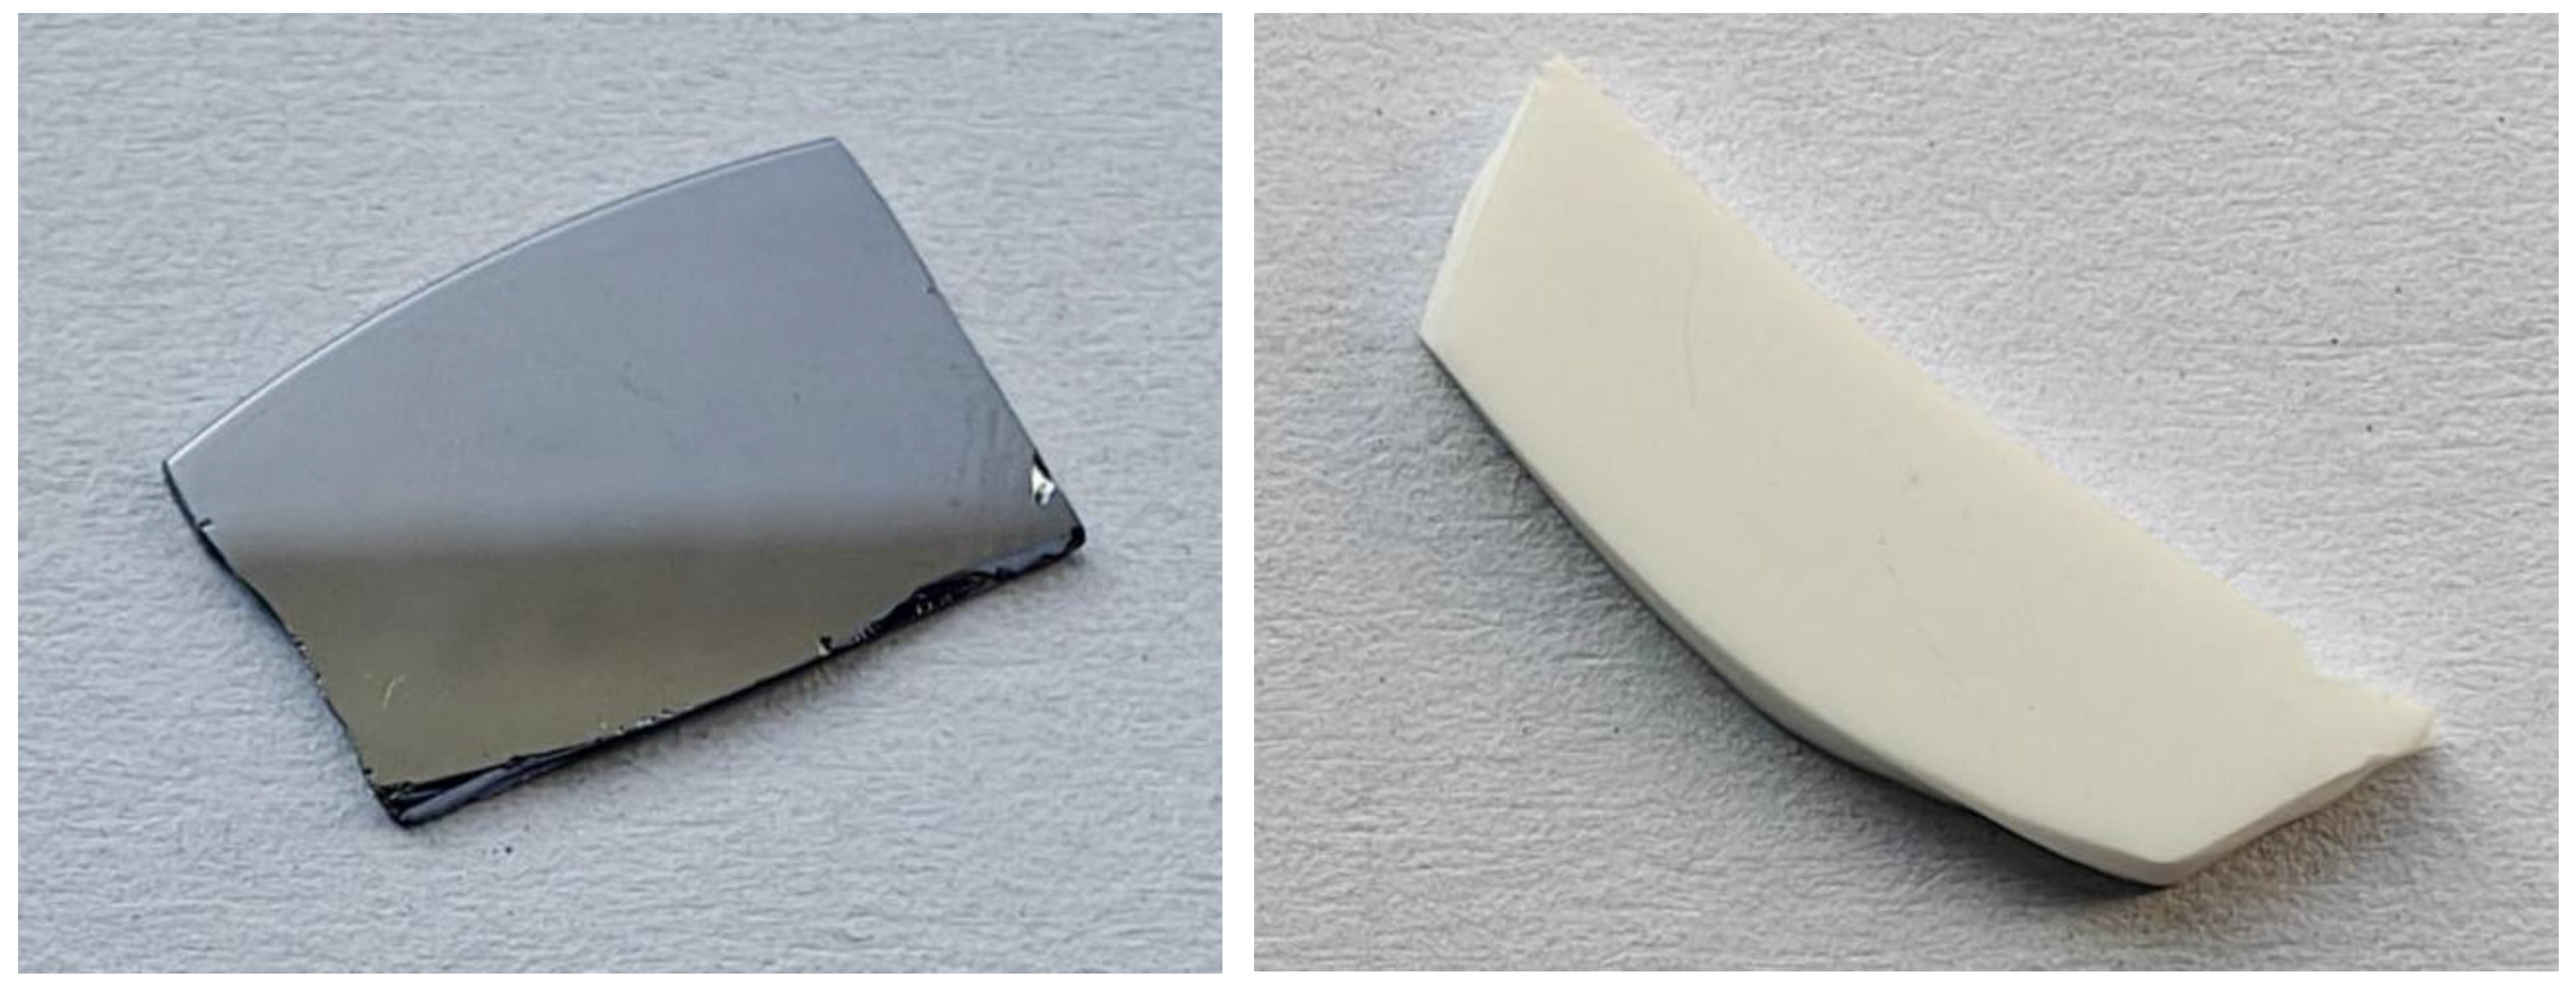
Considering varied surface hydrophobicity and surface roughness of real graphite, alumina wafer and silicon wafer were used to replace graphite as the standard model substrate for AFM measurement. Alumina wafer shows rather rough surface while silicon wafer has relatively smooth surface. Before imaging, the two substrates were hydrophobized by silanization treatment, the detailed procedure was described in ref. 32 in detail[32]. The substrate was fixed in liquid cell with a piece of double sides tap for AFM imaging. Ultrapure water prepared with a Milli-Q unit (18.2 MΩ·cm, TOC less than 5 ppm) was transferred into glass bottles respectively and were stored at 4°C in a refrigerator for at least three days to reach an equilibrium state with air before use. New and commercial graphite powders and LCO powders were used as representative electrode materials replacing real those from spent lithium-ion batteries. The size distributions of the two kinds of powders measured with laser size analyzer are shown in Figure 2.
Figure 1.
Photos of silicon wafer (left) and alumina (right) hydrophobic modification by gaseous deposition.
Figure 1.
Photos of silicon wafer (left) and alumina (right) hydrophobic modification by gaseous deposition.
2.2. The Production and Characterization of Nanobubbles
Nanobubbles were produced respectively on a silanized alumina and a silicon wafer substrate, which are two representative materials-smooth and rough surface, by depositing about 1.5 ml of cold water into the self-made liquid cell with a glass injector. Gas oversaturation was created as the temperature of cold water increased to the target temperature and hence nanobubbles were produced on a substrate surface. The characterization of surface nanobubbles was done by using an AFM (XE-100, South Korea) in an intermittent mode. A cantilever (ContGD-G, Budget Sensors) with a nominal spring constant of 0.2 N/m and a nominal resonant frequency of 13 kHz in air was used. The real resonant frequency and spring constant were calibrated with the method described in ref[34]. After the cantilever was immersed in the liquid, about 20 minutes were given to reach an equilibrium state for the system, which was indicated by a stable position of a laser dot on the position sensitive detector (PSD). The values of scan rate and amplitude ratio were set to be 0.5 Hz and no less than 80% respectively prior to imaging. To reduce the possible pollution from experimental tools and glass vessels to AFM imaging, substrates, tweezers and injector and other stuffs were cleaned thoroughly in an ultrasonic bath in an order of ultrapure water, ethanol, and ultrapure water successively before measurement.
2.3. Morphological Observation of Graphite Aggregates
In order to study the morphological differences of hydrophobic graphite aggregates in nanobubble systems and evaluate their degree of agglomeration, the samples were observed using optical microscopy. A graphite slurry solution was prepared with cold water, then placed on a magnetic stirrer, connected to a heating device, and the final temperatures were set to 20°C, 25°C, and 30°C respectively, with a stirring speed of 800 r/min for 15 minutes. After stirring, a small amount of the solution was taken with a pipette and dropped onto a glass slide, with the magnification set to 40 times, to observe the dispersion state of graphite in different solutions.
2.4. Formation and Measurement of Graphite Agglomerations with Focused Beam Reflectance Measurement (FBRM)
To quantify influence of nanobubbles as a result of gas oversaturation degree on the interaction between graphite particles, the distributions of chord length of graphite agglomerations acquired at different gas oversaturation degrees were measured with focused beam reflectance measurement (FBRM, Figure 3). The working principle of FBRM can be found in ref [35]. Briefly, a laser beam launched by a laser diode embedded in FBRM’s probe is projected into particle suspension with a high rotation speed (2-6 m/s). When the rotated laser beam encounters a particle, the laser will be reflected by the particle and the reflected laser signal will be received and recorded by the optical detector. Chord length of a particle is calculated by the product of time in which the laser travels the particle surface and scan speed of the focused beam. The advantages of measurement of graphite agglomerations in-situ are to protect agglomerations from potential destruction as possible. For specific procedures, firstly circulation water with expected temperature (20, 25, 30°respectively) was pumped into circulation system. Then graphite slurry was transferred into the inner liquid cell and was subjected to conditioning treatment after the temperature of circulation water was constant. After the temperature of circulation water was constant again, the measurement controller was turned on and graphite size distribution information was recorded and analyzed.
2.5. Particle-Bubble Collision and Adhesion Experiment
The behavior of particle-bubble collision and adhesion is partly determined by particle size distribution and surface hydrophobicity. To explore and compare qualitatively effect of gas oversaturation degree on particle-bubble collision and adhesion performance, nanobubbles were induced to nucleate on graphite particle surface in slurry with different gas oversaturation degrees and graphite frosted with surface nanobubbles was forced to collide with each other under agitation. The specific procedures are as follows (Figure 4 and Figure 5): 1g of graphite was dispersed in 100 ml of ultrapure water and the slurry was stirred at an agitation speed of 400 r/min for 30 min. Then the agitation was stopped and a captive bubble with a fixed volume was produced at the terminal of needle. The slurry was agitated again for 20 s to motivate graphite particles (agglomerations) to collide with the captive bubble. The agitation speed was set as 300 r/min. Too high agitation speed will result in detachment of captive bubble from needle while too low agitation speed is not enough for graphite particles to collide with the captive bubble. After 20 s the agitation was stopped again and the final attachment state was recorded and analyzed.
2.6. Interaction Force Measurement
A self-made device was developed for the interaction force measurement between a captive bubble and substrate, as shown in Figure 6. The measurement device consists of a high sensitivity micro-balance, a automatic lifting platform, a high speed digital camera and a monitor. A capillary connected with a micro-injection pump was embedded in the high sensitivity microbalance module. A captive bubble was generated at the terminal of capillary by micro-injection pump and then the substrate was lifted to approach to the captive bubble. The separation distance between the bubble and the substrate was monitored by the high speed camera. The interaction force information was recorded as a function of separation distance. Compared with AFM, the present device has a higher force measurement upper limit but lower force accuracy and resolution.
2.7. Flotation Test
Graphite flotation under different gas over-saturation degrees was performed in a self-made Hallimond tube. Graphite and LCO was mixed at a mass ration of 0.8g : 0.2g to model mixed electrode materials. The model materials were prewetted with 100 ml of room temperature water or cold water in a baker on a magnetic stirrer at a stirring speed of 500 r/min. Then the slurry was carefully transferred into Hallimond tube with a self-made funnel. Extra room temperature water or cold water was replenished to 180 ml to keep the volume of slurry constant for each flotation. A sleeve structure as part of this tube was specially designed so that the temperature of slurry can be kept near the target value with aid of water bath, as shown in Figure 7. The circulated water that was heated to target temperature in a large tank prior to use was injected to the sleeve with a peristaltic pump from the inlet at the bottom of tube body and then was discharged from outlet of tube to tank.
3. Results and Discussion
3.1. Imaging
Nanobubbles nucleated on smooth silicon wafer and rough alumina surfaces at different terminal temperature were imaged with an intermittent AFM. The height and lateral size of surface nanobubbles were counted with a MATLAB program, as shown in Figure 8 and Figure 9. Both on smooth silicon wafer surface and on rough alumina surface, the height and lateral size of nanobubbles acquired at the higher gas oversaturation degree are always higher than those acquired at the lower gas oversaturation degree. For example, the height of 50% of nanobubbles acquired on smooth silicon wafer surface at a terminal temperature of 20 degrees is about 7 nm while the value is increased to 10 nm at 30 degrees. Similarly, the lateral size of 80% of nanobubbles acquired on smooth silicon wafer surface at a terminal temperature of 20 degrees is about 70 nm while the value is increased to 90 nm at 30 degrees. Similar conclusion can also be drawn as alumina acted as substrate for AFM imaging. The size distribution of nanobubbles nucleated both on smooth silicon wafer surface and on rough alumina surface increased with gas oversaturation degree at the present researched temperature range. It is speculated that nanobubbles could merge with their neighboring ones to be the larger nanobubbles even microbubbles as the degree of gas oversaturation is increased further from 30 degrees. Large nanobubbles or microbubbles could detach from substrate surface, resulting in appearance of nonlinear correlativity between size of nanobubbles and gas oversaturation degree. It is worth noting that nanobubbles nucleated on rough alumina surface at 20 degrees are larger both in height and in lateral size than those on smooth silicon wafer surface at the same terminal temperature in the case of similar surface hydrophobicity, which means that high surface roughness is more beneficial for nanobubbles nucleation than relative smooth silicon wafer surface. This observation is consistent with our previous research conclusions[31].
3.2. The Effect of Gas Supersaturation on the Morphology of Graphite Aggregates
As shown in Figure 10, it can be observed that graphite is very dispersed in the solution at room temperature and does not form aggregates. However, as the temperature of the solution increases, the graphite particles begin to aggregate with each other, and the morphology and size of the graphite aggregates correspond to the final temperature. At the final temperature of 30 °C, the graphite aggregates are the largest and most numerous, followed by those at 25 °C, while the aggregates at 20 °C are the smallest among the three. The higher the final temperature, the more aggregates are formed, and the more graphite particles are present in each aggregate. This indicates that fine particles will agglomerate into aggregates under the influence of nanobubbles, and this phenomenon becomes more pronounced with increasing gas supersaturation.
3.3. Effect of Gas Oversaturation Degree on Size Distribution of Graphite Agglomerations
Size distributions of graphite (agglomerations) at different gas oversaturation degrees were measured in-situ with FBRM, the results are shown in Figure 11. The D50 of chord length of graphite in room temperature water (in the absence of nanobubbles) is about 11 μm. This value is lower than that measured previously with laser particle size analyzer, which could be ascribed to the difference in measurement principles between FBRM and laser particle size analyzer. As graphite powders were dispersed in cold ultrapure water stored in a 4 ℃ environment for at least 72 h, nanobubbles were expected to nucleate on graphite surface as a result of gas oversaturation, as observed on HOPG surface with AFM. The D50 of chord length of graphite agglomerations increased to 19, 22 and 32 μm respectively as the temperature of graphite slurry increased from 4 ℃ to 20 ℃, 25 ℃ and 30 ℃ respectively. The degree of gas oversaturation of graphite slurry was expected to increase with terminal target temperature. The larger nanobubbles were nucleated on graphite surface at the higher gas oversaturation degree, resulting in formation of the larger graphite agglomerations. It is possible for the nanobubble to grow up by gas diffusion or coalescence behavior and eventually detach from solid surface if the degree of gas oversaturation of graphite slurry is further increased, as was reported by[36]. However, this phenomenon was not observed in the present temperature range.
3.4. Effect of Nanobubbles on Collision and Adhesion Performance Between Graphite (Agglomerations) and a Captive Bubble
The adhesion conditions of graphite particles (or agglomerations) under different gas oversaturation degrees were captured by a camera and the wrapping angles were measured and recorded one by one, as shown in Figure 12. It was found that more graphite particles adhered to the captive bubble as surface nanobubbles were introduced on graphite surface, which is indicated by both the thickness and wrapping angle of graphite adhered on the bubble. Furthermore, the wrapping angle of graphite particles increase with gas oversaturation degree. It means that more and more graphite particles aggregated to form agglomerations and adhered to captive bubble. For the case of well dispersed graphite particles in the absence of nanobubbles, collision probability between graphite and the captive bubble is significantly limited by the low inertia of graphite. As surface nanobubbles were induced to nucleate on graphite surface, one hand fine or single graphite particle aggregated with each other to form large sized graphite agglomerations, which should be responsible for improved collision probability between graphite and the captive bubble. On the other hand, adhesion behavior between a particle and a bubble is partly determined by surface force between them. It was reported that Van der Waals force between a particle and a bubble was changed as a result of microbubble nucleation on solid surface. A higher adhesion efficiency between particles and bubbles in the presence of surface nanobubbles is expected. It is worth noting that only collision and adhesion behavior between graphite (agglomerations) and a captive bubble was studied while detachment as one of key sub-process of flotation process was not reflected, detachment of particles with weak hydrophobicity could happen during rising of mineralized bubbles. Therefore, the visualization results between graphite and a captive bubble could be not consistent with flotation results.
3.5. Effect of Nanobubbles on Interaction Force Between a Bubble and Substrate
Force curves between a captive bubble and a substrate at different gas oversaturation degrees are shown in Figure 13. It can be found that jump-in phenomenon in advancing force curve was observed during approaching of the captive bubble to substrate, which is caused by the extension deformation of captive bubble in the presence of attractive interaction force. With the further approach, the separation distance between the captive bubble and substrate decreased and therefore the deformation degree of the captive decreased, which is reflected by the decreased attractive force. As the substrate was lifted to the targeted position coordinates (that is, intersection point in Figure 13), the substrate was retracted and the maximum adhesion force was observed before thorough separation of the captive bubble from substrate surface. It can be seen that the maximum adhesion force increases with gas oversaturation degree. In other words, the bigger the nanobubbles, the higher the maximum adhesion force. The present results are consistent with aforementioned size distribution results shown in Figure 11. The bridging effect of nanobubbles is responsible for the formation of graphite agglomerations. It was reported that a weak repulsive force in the advancing force curve was observed due to nanobubbles nucleation on substrate surface[32], while this phenomenon was not observed in the present work, which is due to low force resolution of the present measurement device.
3.6. Effect of Nanobubbles on Flotation Performance of Electrode Materials
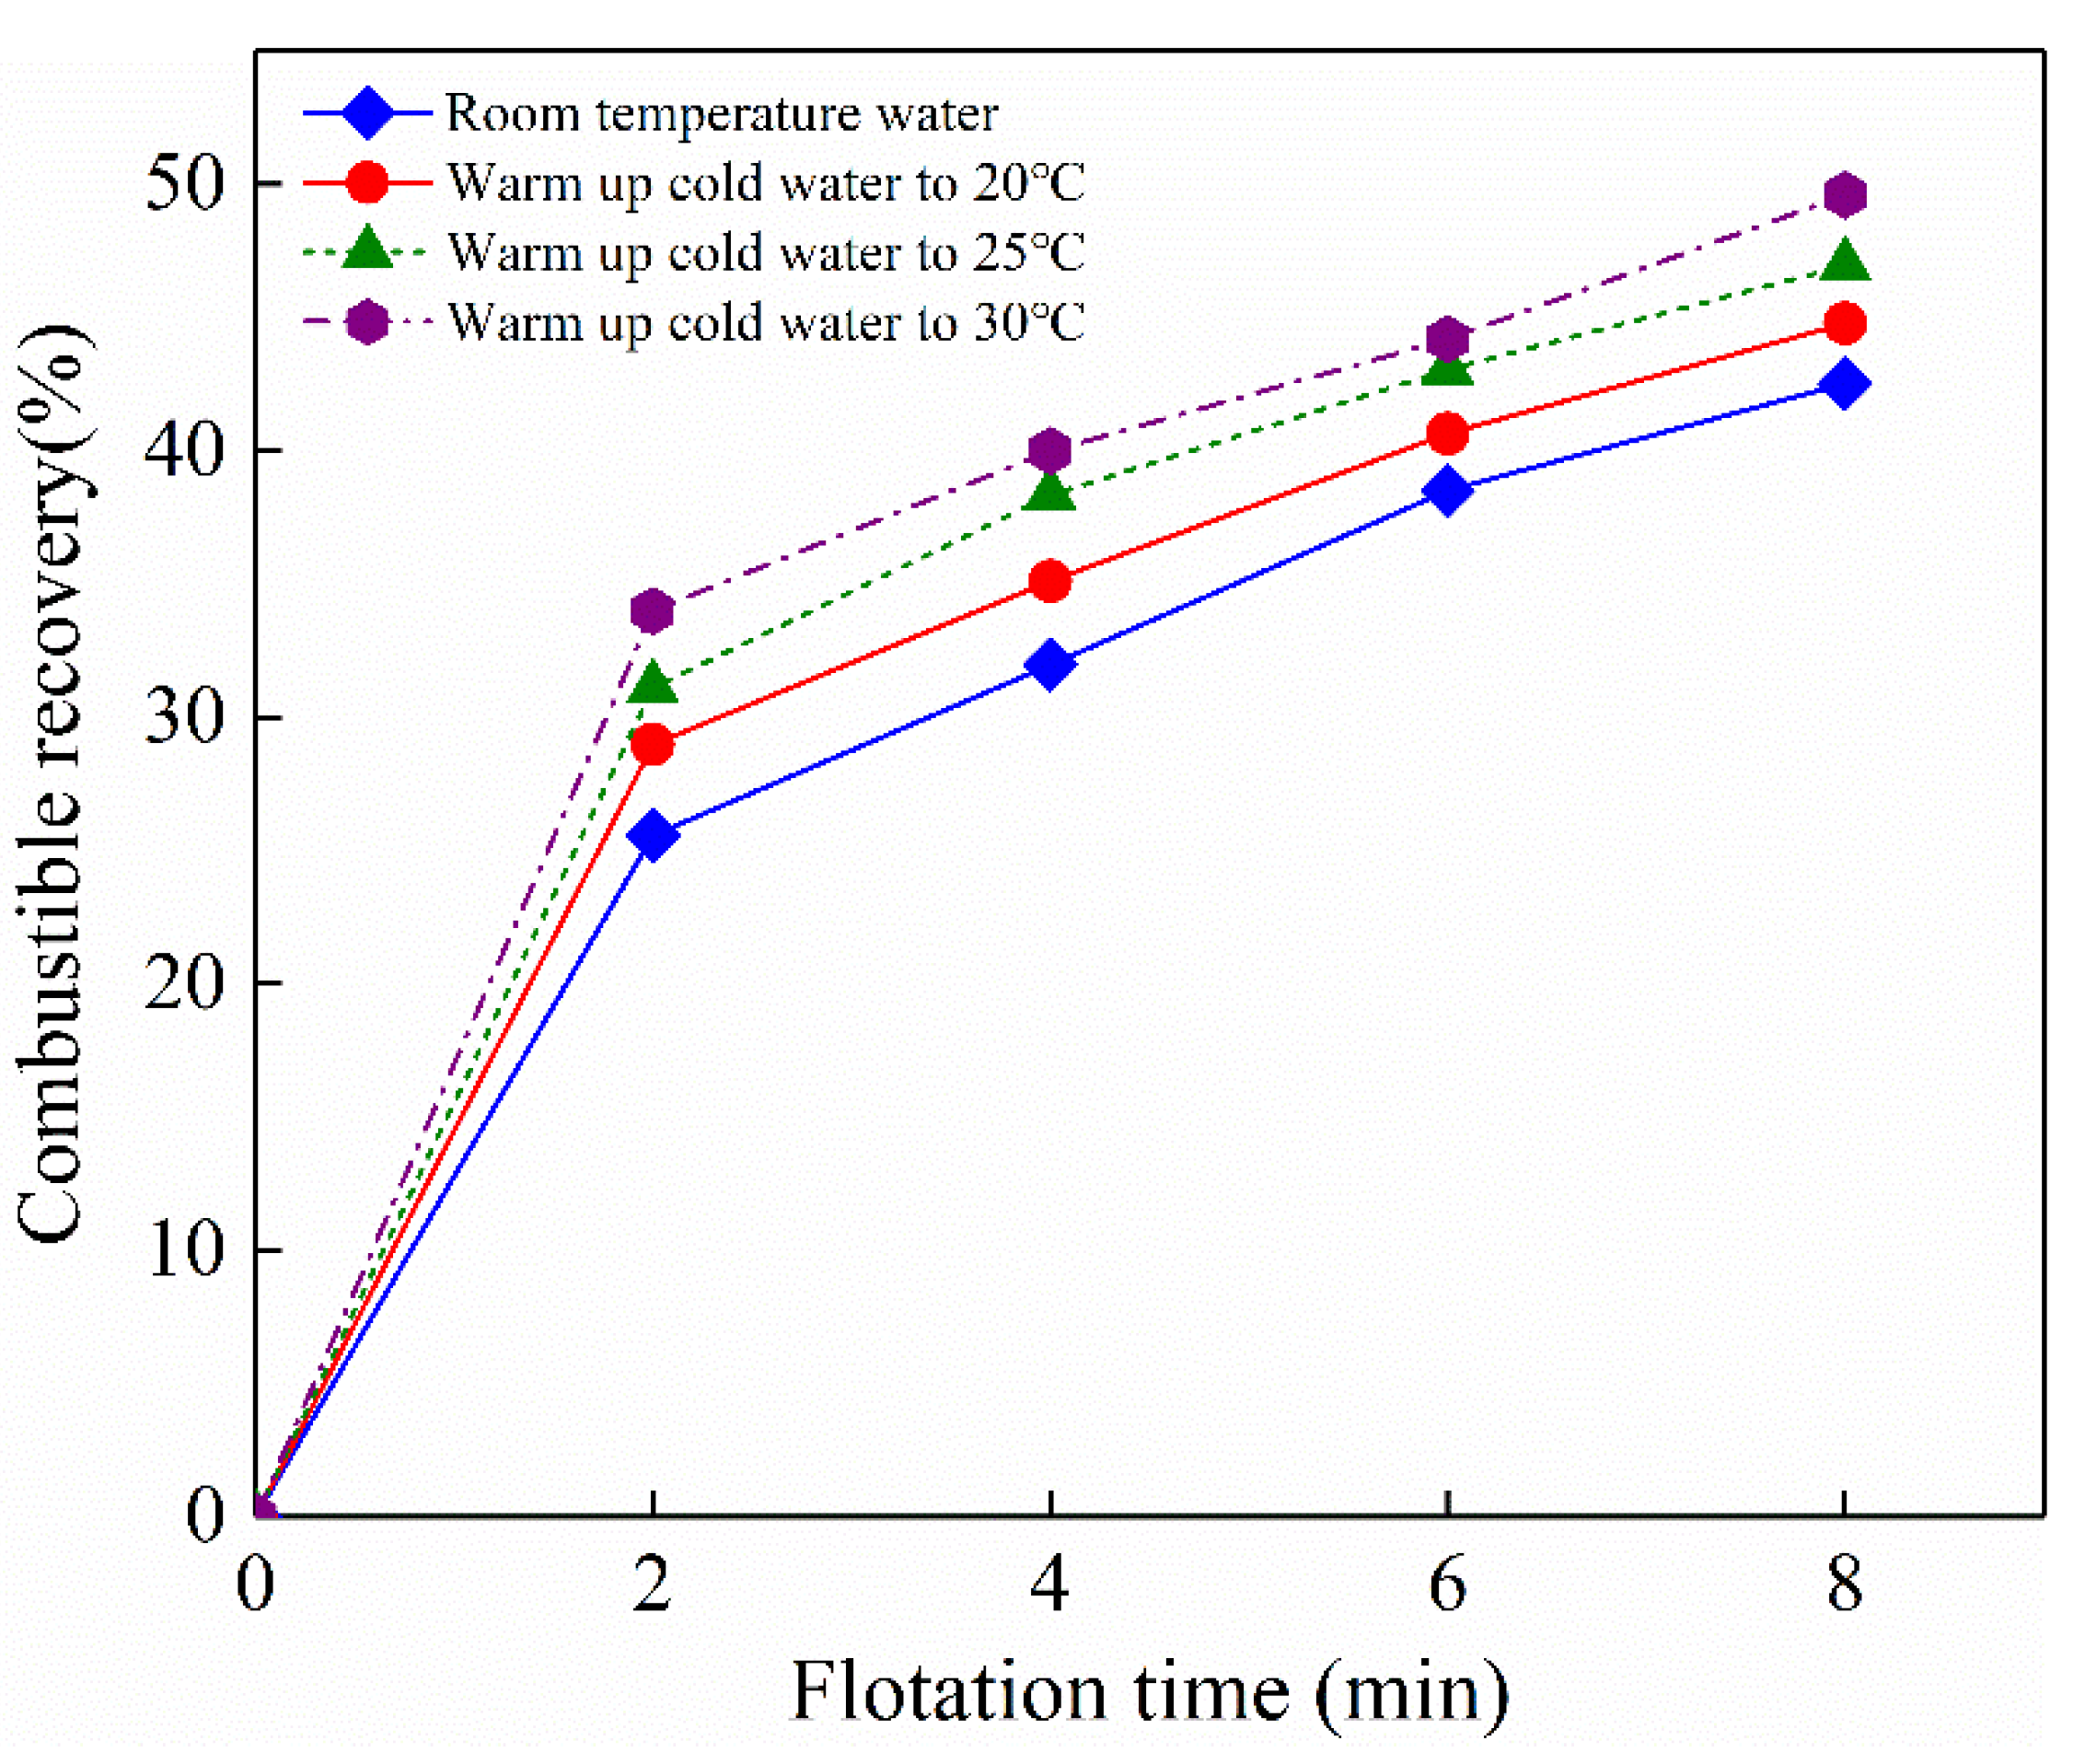
Cumulative combustible recovery at different flotation time and gas oversaturation degrees is shown in Figure 14. As expected, cumulative combustible recovery related to graphite recovery increases with flotation time. For example, the cumulative recovery increases from 26.32% to 43.02% in room temperature water (that is, in the absence of nanobubbles) as flotation time increases from 2 min to 8 min. The flotation recovery of graphite at each flotation time was improved in the presence of nanobubbles, which is indicated by the upward shifted combustible recovery curve. The enhanced flotation performance of graphite in the presence of nanobubbles can be attributed to the following two reasons, ⅰ) single graphite particle was induced to accumulate with each other to form graphite agglomerations, resulting in an increase in collision probability between graphite agglomerations and flotation bubbles during flotation process; ⅱ) The properties of solid-liquid interface was changed due to nucleation of nanobubbles on graphite surface. It is worth noting that ash content of flotation concentration is also increased with gas oversaturation degree (data not shown). It is speculated that micro and/or nanobubbles were also nucleated on LCO surface, which resulted in an increase in LCO recovery. Further technical measures should be taken in the future to guarantee a favorable flotation selectivity as possible.
4. Conclusions
The present work explored influence of degree of gas over-saturation on flotation separation performance of electrode materials from lithium-ion batteries by combining AFM imaging, FBRM measurement, collision and adhesion interaction visualization between graphite and a captive bubble, flotation test. The results show that surface nanobubbles can be effectively induced on hydrophobic silicon, alumina, and graphite surface with the method of gas oversaturation. The height distribution and lateral size distribution of surface nanobubbles nucleated both on smooth silicon wafer surface and on rough alumina surface increased with gas oversaturation degree. Fine graphite particles were induced by surface nanobubbles nucleation to form large agglomerations, as indicated by the increased chord length of particles in the presence of nanobubbles. More graphite agglomerations adhered to a captive bubble with aid of nanobubbles than the case of no nanobubbles. The frost of nanobubbles on graphite surface and thus resulting in graphite agglomerations by bridging effect of nanobubbles together should be responsible for the improved flotation performance of electrode materials. The present results suggest that controlling gas oversaturation degree of slurry by varying temperature or compression could be an effective method to improve flotation performance of fine mineral particles. It should be noted that normally there is a wider range of surface hydrophobicity in real raw minerals than that in the binary materials used in the present work. We have been expecting that nanobubbles only nucleate on objective particles surface while not on gangue particles. However, it isn’t the case in a real nanobubble assisted flotation. More measures may be taken to promise a satisfactory flotation selectivity.
Acknowledgements
The work was supported by the National Natural Science Foundation of China (No. 52204291, 52225405), the Basic Research Program of Jiangsu Province (No. BK20221127).
References
- Bertuol, D.A.; Toniasso, C.; Jiménez, B.M.; Meili, L.; Dotto, G.L.; Tanabe, E.H.; Aguiar, M.L. Application of spouted bed elutriation in the recycling of lithium ion batteries. Journal of Power Sources 2015, 275, 627–632. [Google Scholar] [CrossRef]
- Al-Thyabat, S.; Nakamura, T.; Shibata, E.; Iizuka, A. Adaptation of minerals processing operations for lithium-ion (LiBs) and nickel metal hydride (NiMH) batteries recycling: Critical review. Minerals Engineering 2013, 45, 4–17. [Google Scholar] [CrossRef]
- Li, H.; He, Y.; Zhang, T.; et al. Floatability of Co-enriched crushed products of spent lithium-ion batteries. The Chinese Journal of Nonferrous Metals 2014, 24, 2530–2538. [Google Scholar]
- Nguyen, A.V.; Schulze, H.J. Colloidal Science of Flotation; Marcel Dekker Inc.: New York, America, 2004. [Google Scholar]
- Yoon, R.H. The role of hydrodynamic and surface forces in bubble-particle interaction. International Journal of Mineral Processing 2000, 58, 129–143. [Google Scholar] [CrossRef]
- Salces, A.M.; Bremerstein, I.; Rudolph, M.; Vanderbruggen, A. Joint recovery of graphite and lithium metal oxides from spent lithium-ion batteries using froth flotation and investigation on process water re-use. Minerals Engineering 2022, 184, 107670. [Google Scholar] [CrossRef]
- Zhang, T.; He, Y.; Ge, L.; Fu, R.; Zhang, X.; Huang, Y. Characteristics of wet and dry crushing methods in the recycling process of spent lithium-ion batteries. Journal of Power Sources 2013, 240, 766–771. [Google Scholar] [CrossRef]
- Zhang, G.; He, Y.; Feng, Y.; Wang, H.; Zhang, T.; Xie, W.; Zhu, X. Enhancement in liberation of electrode materials derived from spent lithium-ion battery by pyrolysis. Journal of Cleaner Production 2018, 199, 62–68. [Google Scholar] [CrossRef]
- Li, J.; Su, P.; Li, J.; Liu, Y.; Wang, J.; Khoshdast, H.; He, Y.; Nazari, S. Effect of pyrolysis pretreatment combined with micro-nanobubbles on the eco-friendly recycling of spent lithium-ion batteries. Journal of Power Sources 2024, 611, 234773. [Google Scholar] [CrossRef]
- Zhang, G.; He, Y.; Feng, Y.; Wang, H.; Zhang, T.; Xie, W.; Zhu, X. Enhancement in liberation of electrode materials derived from spent lithium-ion battery by pyrolysis. Journal of Cleaner Production 2018, 199, 62–68. [Google Scholar] [CrossRef]
- He, Y.; Zhang, T.; Wang, F.; Zhang, G.; Zhang, W.; Wang, J. Recovery of LiCoO2 and graphite from spent lithium-ion batteries by Fenton reagent-assisted flotation. Journal of Cleaner Production 2017, 143, 319–325. [Google Scholar] [CrossRef]
- Yu, J.; He, Y.; Ge, Z.; Li, H.; Xie, W.; Wang, S. A promising physical method for recovery of LiCoO 2 and graphite from spent lithium-ion batteries: Grinding flotation. Separation and Purification Technology 2018, 190, 45–52. [Google Scholar] [CrossRef]
- Liu, J.; Wang, H.; Hu, T.; Bai, X.; Wang, S.; Xie, W.; Hao, J.; He, Y. Recovery of LiCoO2 and graphite from spent lithium-ion batteries by cryogenic grinding and froth flotation. Minerals Engineering 2020, 148, 106223. [Google Scholar] [CrossRef]
- Alheshibri, M.; Qian, J.; Jehannin, M.; Craig, V.S.J. A History of Nanobubbles. Langmuir 2016, 32, 11086–11100. [Google Scholar] [CrossRef] [PubMed]
- Lohse, D.; Zhang, X. Surface nanobubbles and nanodroplets. Reviews of Modern Physics 2015, 87, 981–1035. [Google Scholar] [CrossRef]
- Parker, J.L.; Claesson, P.M.; Attard, P. Bubbles, cavities, and the long-ranged attraction between hydrophobic surfaces. The Journal of Physical Chemistry 1994, 98, 8468–8480. [Google Scholar] [CrossRef]
- Lou, S.; Ouyang, Z.; Zhang, Y.; Li, X.; Hu, J.; Li, M.; Yang, F. Nanobubbles on solid surface imaged by atomic force microscopy. Journal of Vacuum Science & Technology B: Microelectronics and Nanometer Structures 2000, 18, 2573–2575. [Google Scholar]
- Zhang, X.; Lhuissier, H.; Sun, C.; Lohse, D. Surface Nanobubbles Nucleate Microdroplets. Physical Review Letters 2014, 112. [Google Scholar] [CrossRef]
- Knüpfer, P.; Ditscherlein, L.; Peuker, U.A. Nanobubble enhanced agglomeration of hydrophobic powders. Colloids and Surfaces A 2017, 530, 117–123. [Google Scholar] [CrossRef]
- Yang, S.; Dammer, S.M.; Bremond, N.; Zandvliet, H.J.W.; Kooij, E.S.; Lohse, D. Characterization of Nanobubbles on Hydrophobic Surfaces in Water. Langmuir 2007, 23, 7072–7077. [Google Scholar] [CrossRef]
- Ditscherlein, L.; Fritzsche, J.; Peuker, U.A. Study of nanobubbles on hydrophilic and hydrophobic alumina surfaces. Colloids and Surfaces A 2016, 497, 242–250. [Google Scholar] [CrossRef]
- Owens, C.L.; Schach, E.; Rudolph, M.; Nash, G.R. Surface nanobubbles on the carbonate mineral dolomite. RSC Advances 2018, 8, 35448–35452. [Google Scholar] [CrossRef] [PubMed]
- Fang, Z.; Wang, L.; Wang, X.; Zhou, L.; Wang, S.; Zou, Z.; Tai, R.; Zhang, L.; Hu, J. Formation and Stability of Surface/Bulk Nanobubbles Produced by Decompression at Lower Gas Concentration. The Journal of Physical Chemistry C 2018, 122, 22418–22423. [Google Scholar] [CrossRef]
- Zhang, Y.; Zhang, X.; Li, Z.; Shen, G.; Ye, M.; Fan, C.; Fang, H.; Hu, J. Electrochemically Controlled Formation and Growth of Hydrogen Nanobubbles. Langmuir 2006, 22, 8109–8113. [Google Scholar] [CrossRef]
- Zhang, L.; Zhang, X.; Zhang, Y.; Hu, J.; Fang, H. The length scales for stable gas nanobubbles at liquid/solid surfaces. Soft Matter 2010, 6, 4515–4519. [Google Scholar] [CrossRef]
- Nirmalkar, N.; Pacek, A.W.; Barigou, M. Interpreting the interfacial and colloidal stability of bulk nanobubbles. Soft Matter 2018, 14, 9643–9656. [Google Scholar] [CrossRef] [PubMed]
- Nazari, S.; Shafaei, S.Z.; Gharabaghi, M.; Ahmadi, R.; Shahbazi, B.; Maoming, F. Effects of nanobubble and hydrodynamic parameters on coarse quartz flotation. International Journal of Mining Science and Technology 2019, 29, 289–295. [Google Scholar] [CrossRef]
- Liu, L.; Hu, S.; Wu, C.; Liu, K.; Weng, L.; Zhou, W. Aggregates characterizations of the ultra-fine coal particles induced by nanobubbles. Fuel 2021, 297, 120765. [Google Scholar] [CrossRef]
- Li, C.; Xu, M.; Zhang, H. Efficient separation of high-ash fine coal by the collaboration of nanobubbles and polyaluminum chloride. Fuel 2020, 260, 116325. [Google Scholar] [CrossRef]
- Li, C.; Xu, M.; Xing, Y.; Zhang, H.; Peuker, U.A. Efficient separation of fine coal assisted by surface nanobubbles. Separation and Purification Technology 2020, 249, 117163. [Google Scholar] [CrossRef]
- Li, C.; Li, D.; Li, X.; Xu, M.; Zhang, H. Surface nanobubbles on the hydrophobic surface and their implication to flotation. International Journal of Minerals, Metallurgy and Materials 2022, 29, 1493–1501. [Google Scholar] [CrossRef]
- Li, C.; Zhang, Y.; Zhang, H. Study on removal of ultrafine graphite by nanobubbles-assisted flotation technique from graphite slime slurry. Separation and Purification Technology 2024, 328, 125079. [Google Scholar] [CrossRef]
- Li, C.; Zhang, H. Influence of nanobubbles on flotation behavior of electrode materials from spent lithium ions batteries. Journal of China Coal Society 2022, 47, 257–264. [Google Scholar]
- Butt, H.; Cappella, B.; Kappl, M. Force measurements with the atomic force microscope: Technique, interpretation and applications. Surface Science Reports 2005, 59, 1–152. [Google Scholar]
- Liang, L.; Peng, Y.; Tan, J.; Xie, G. A review of the modern characterization techniques for flocs in mineral processing. Minerals Engineering 2015, 84, 130–144. [Google Scholar] [CrossRef]
- Zhang, X.H.; Li, G.; Maeda, N.; Hu, J. Removal of Induced Nanobubbles from Water/Graphite Interfaces by Partial Degassing. Langmuir 2006, 22, 9238–9243. [Google Scholar] [CrossRef]
Figure 2.
Size distributions of graphite and LCO[33].
Figure 2.
Size distributions of graphite and LCO[33].
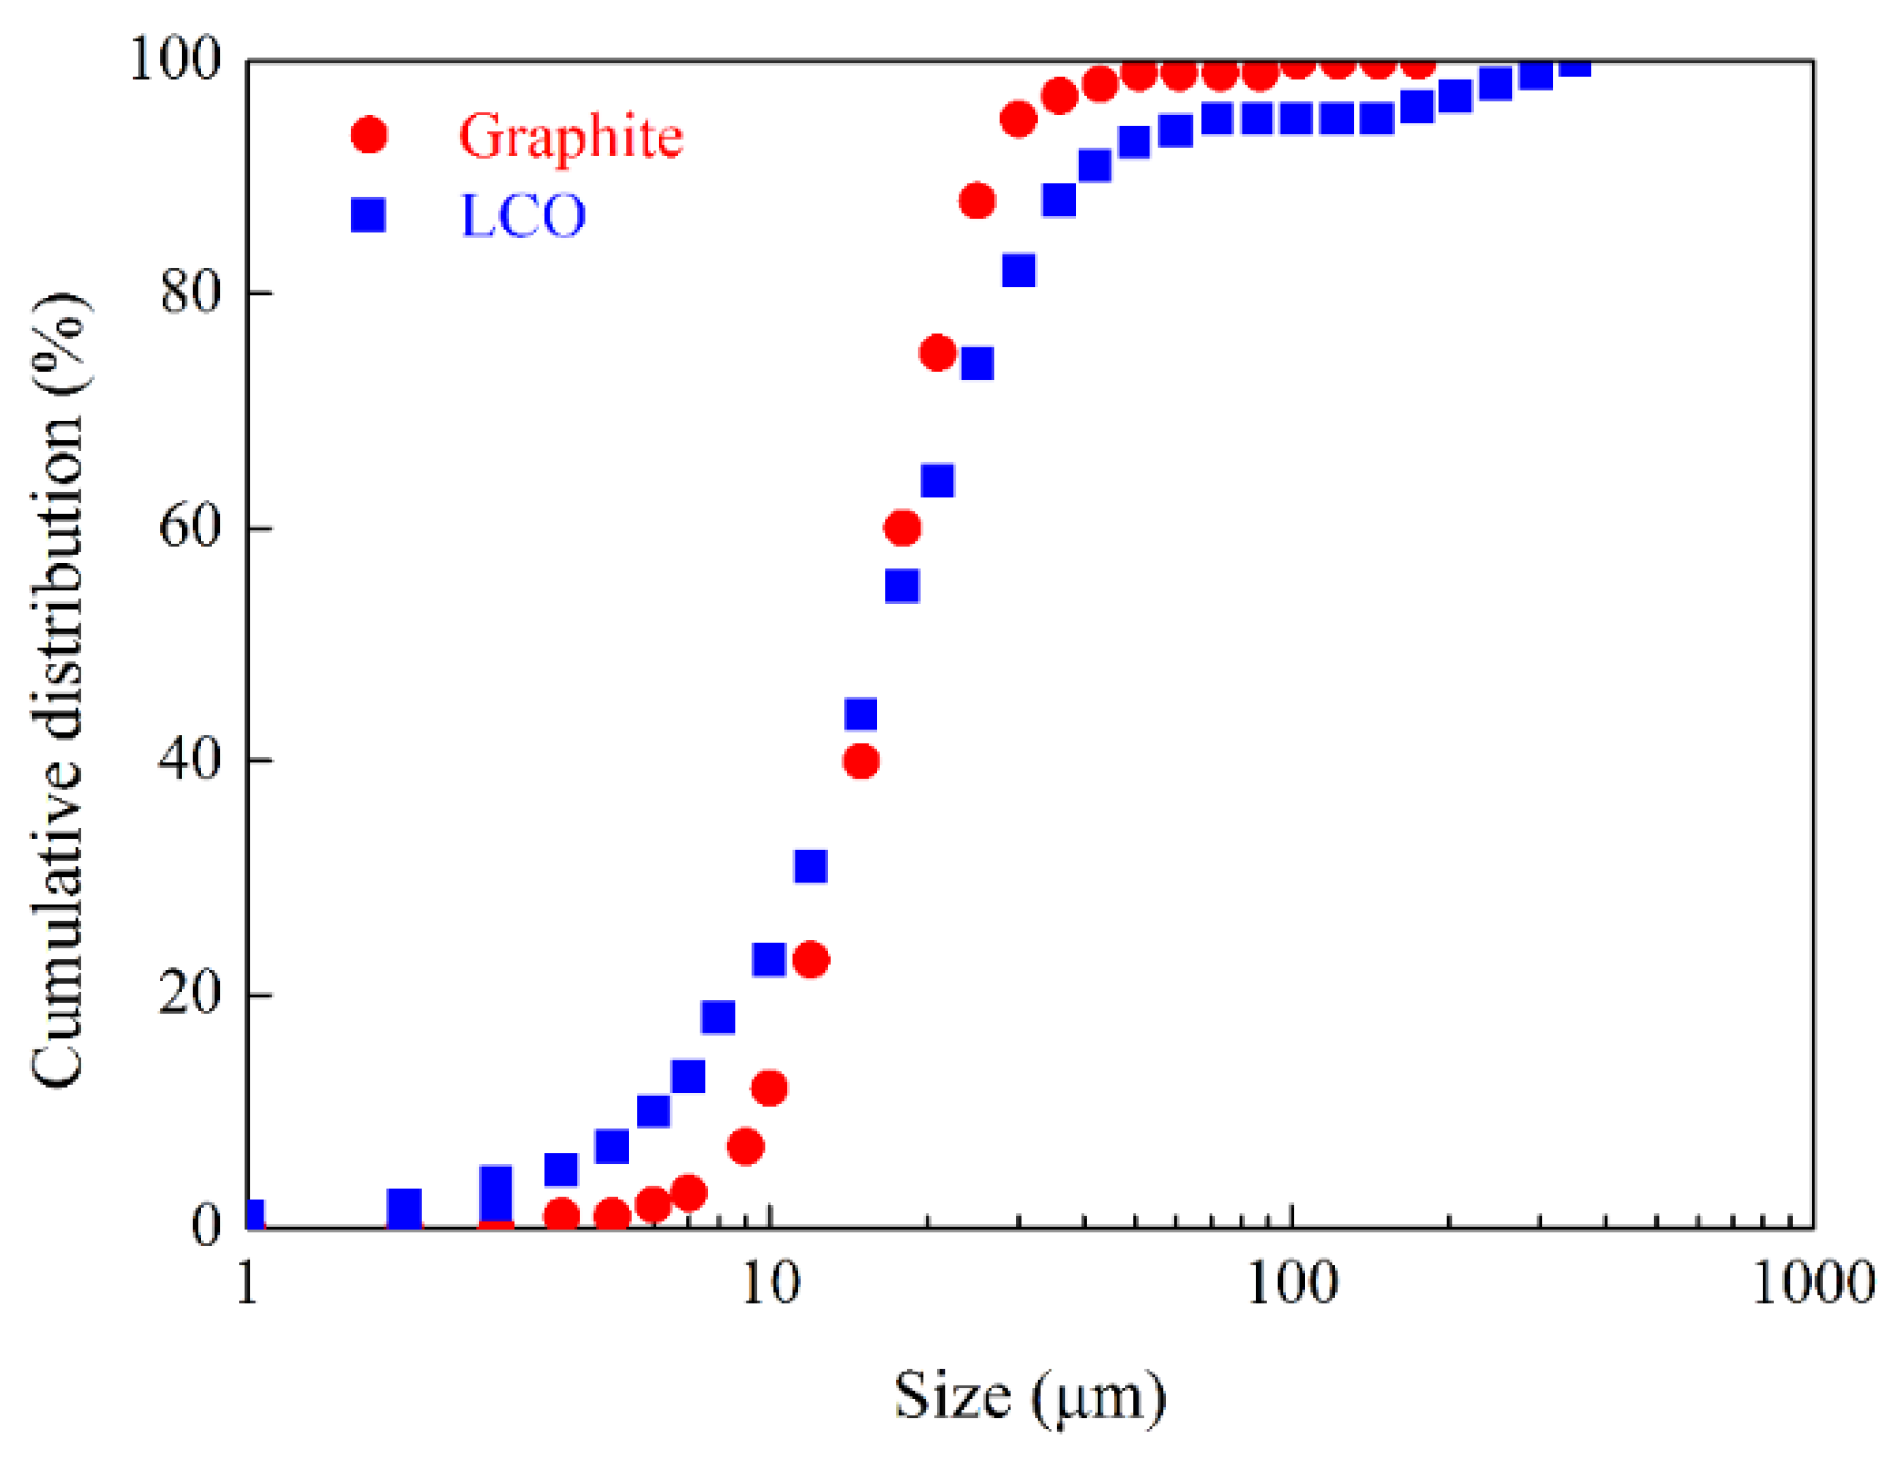
Figure 3.
graphical representation for FBRM measurement.
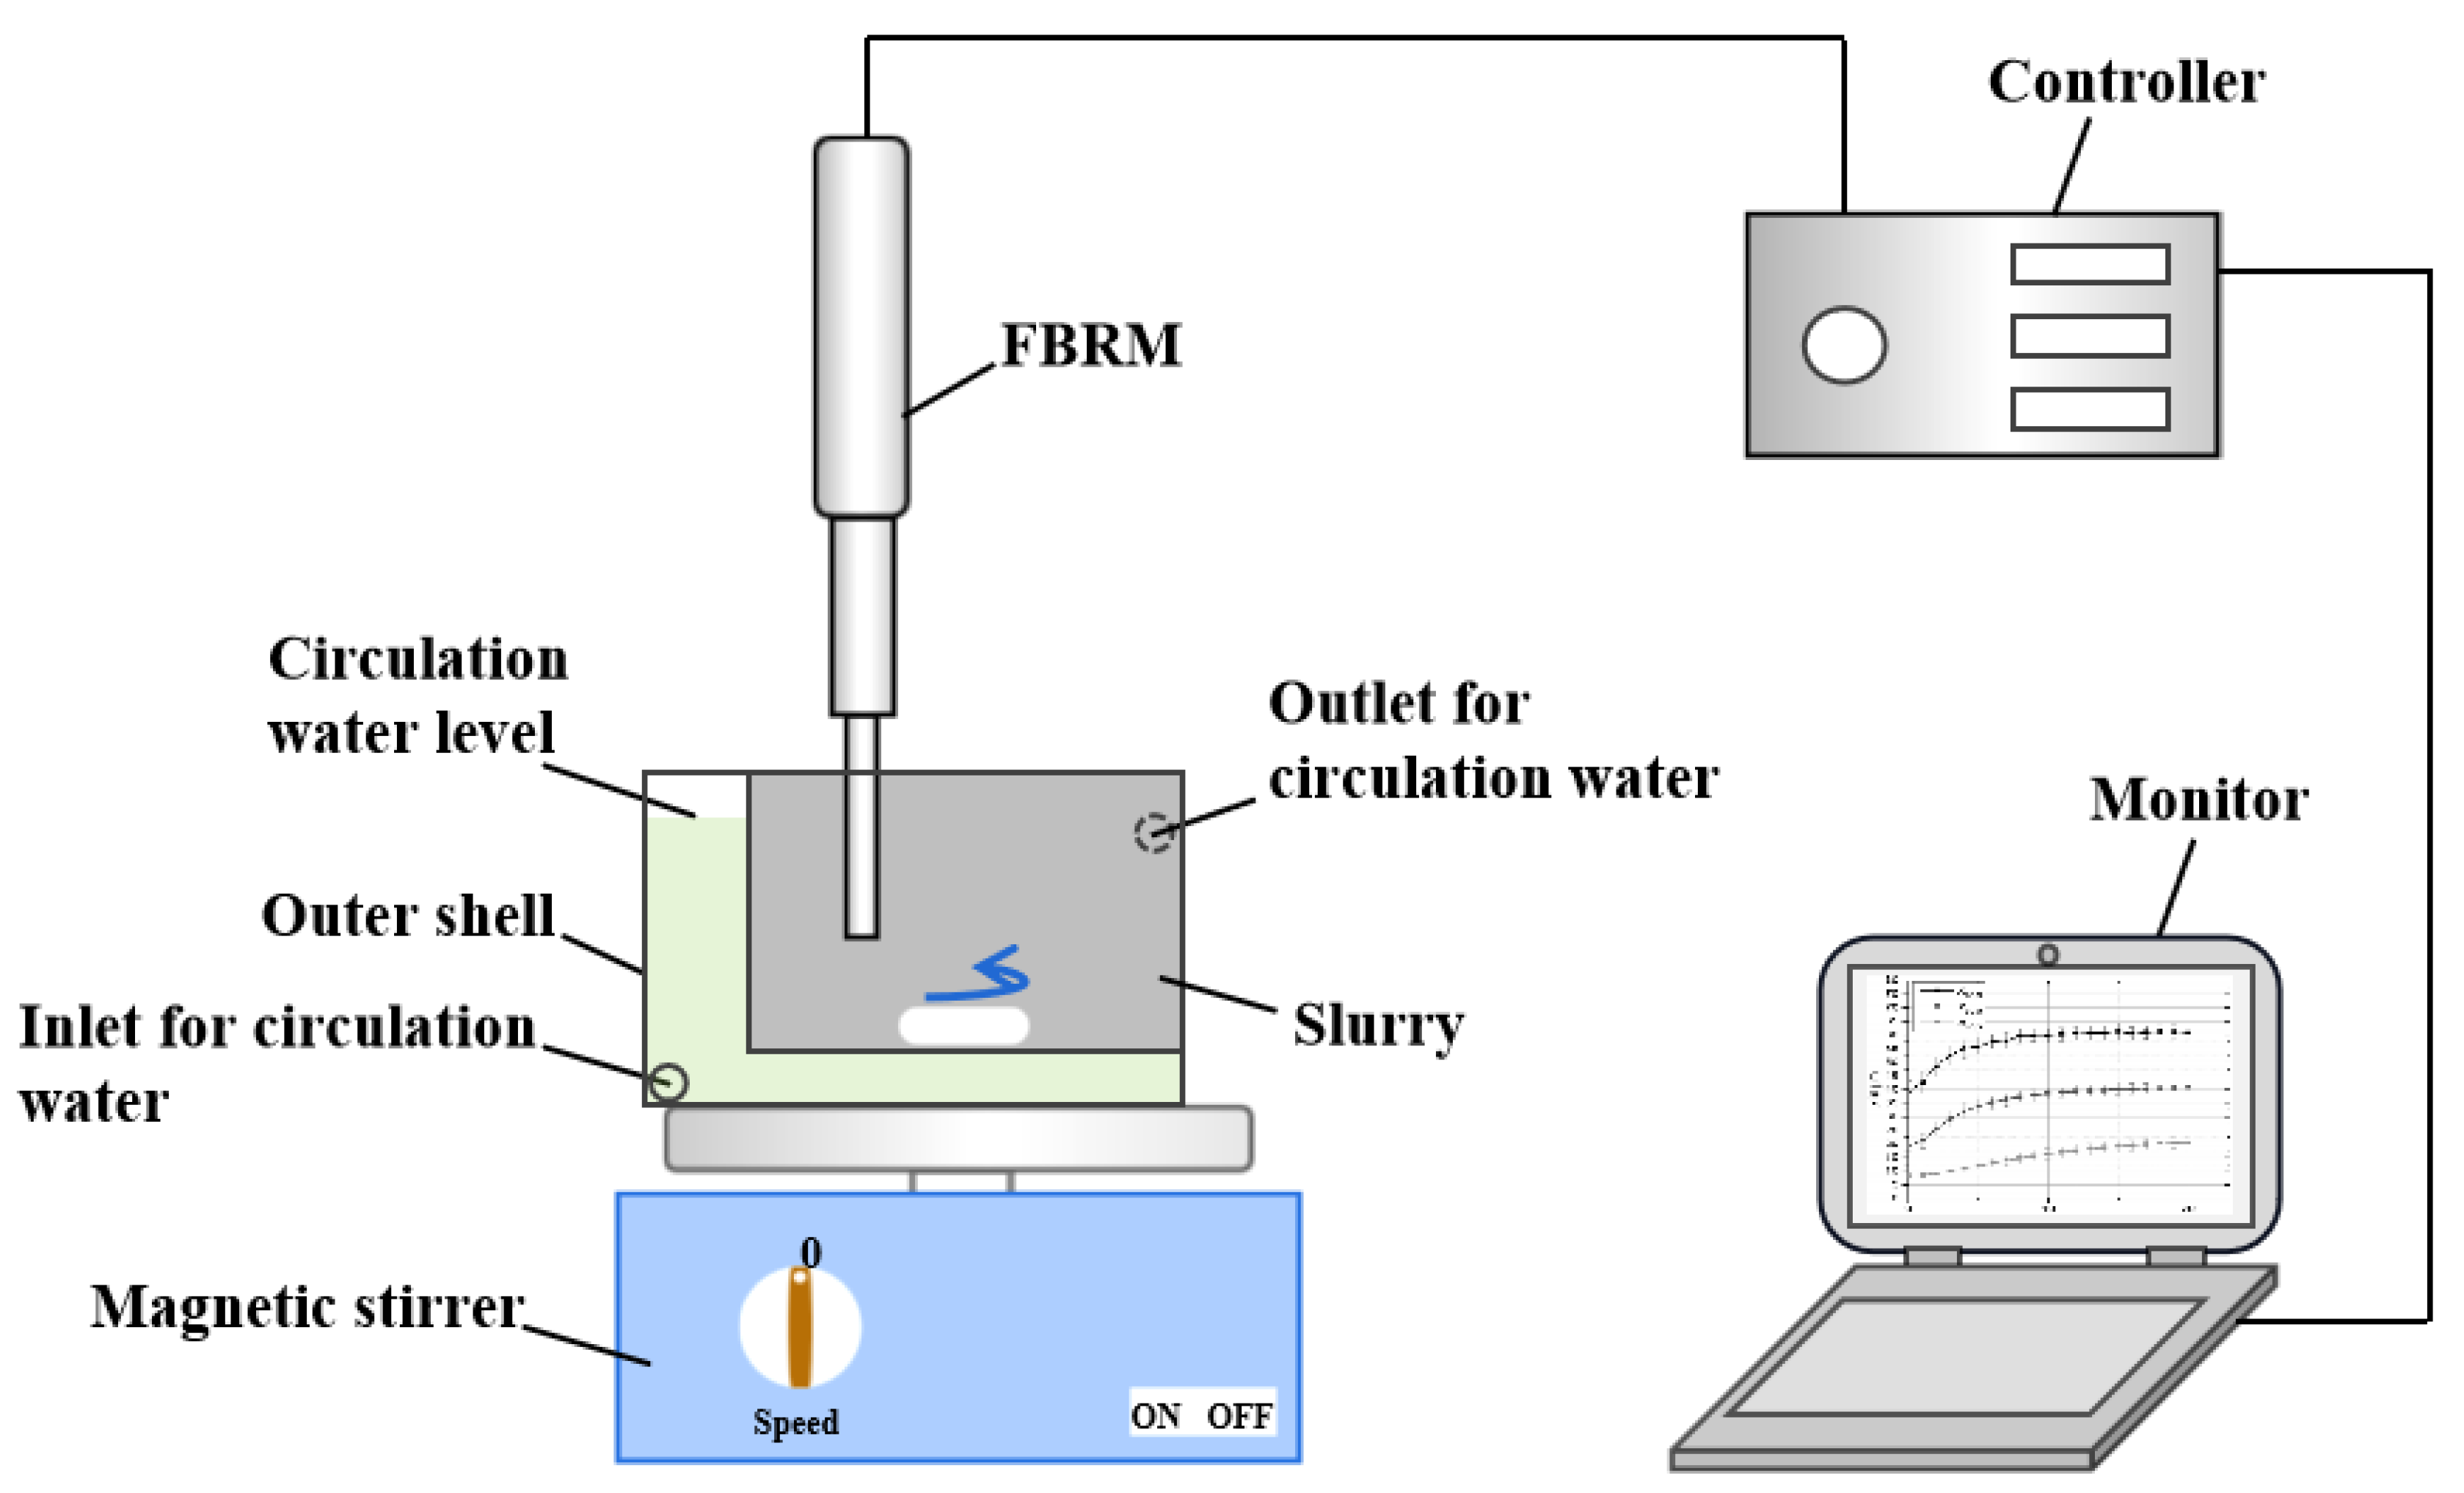
Figure 4.
Observation liquid cell designed specially for particle-bubble collision and adhesion.
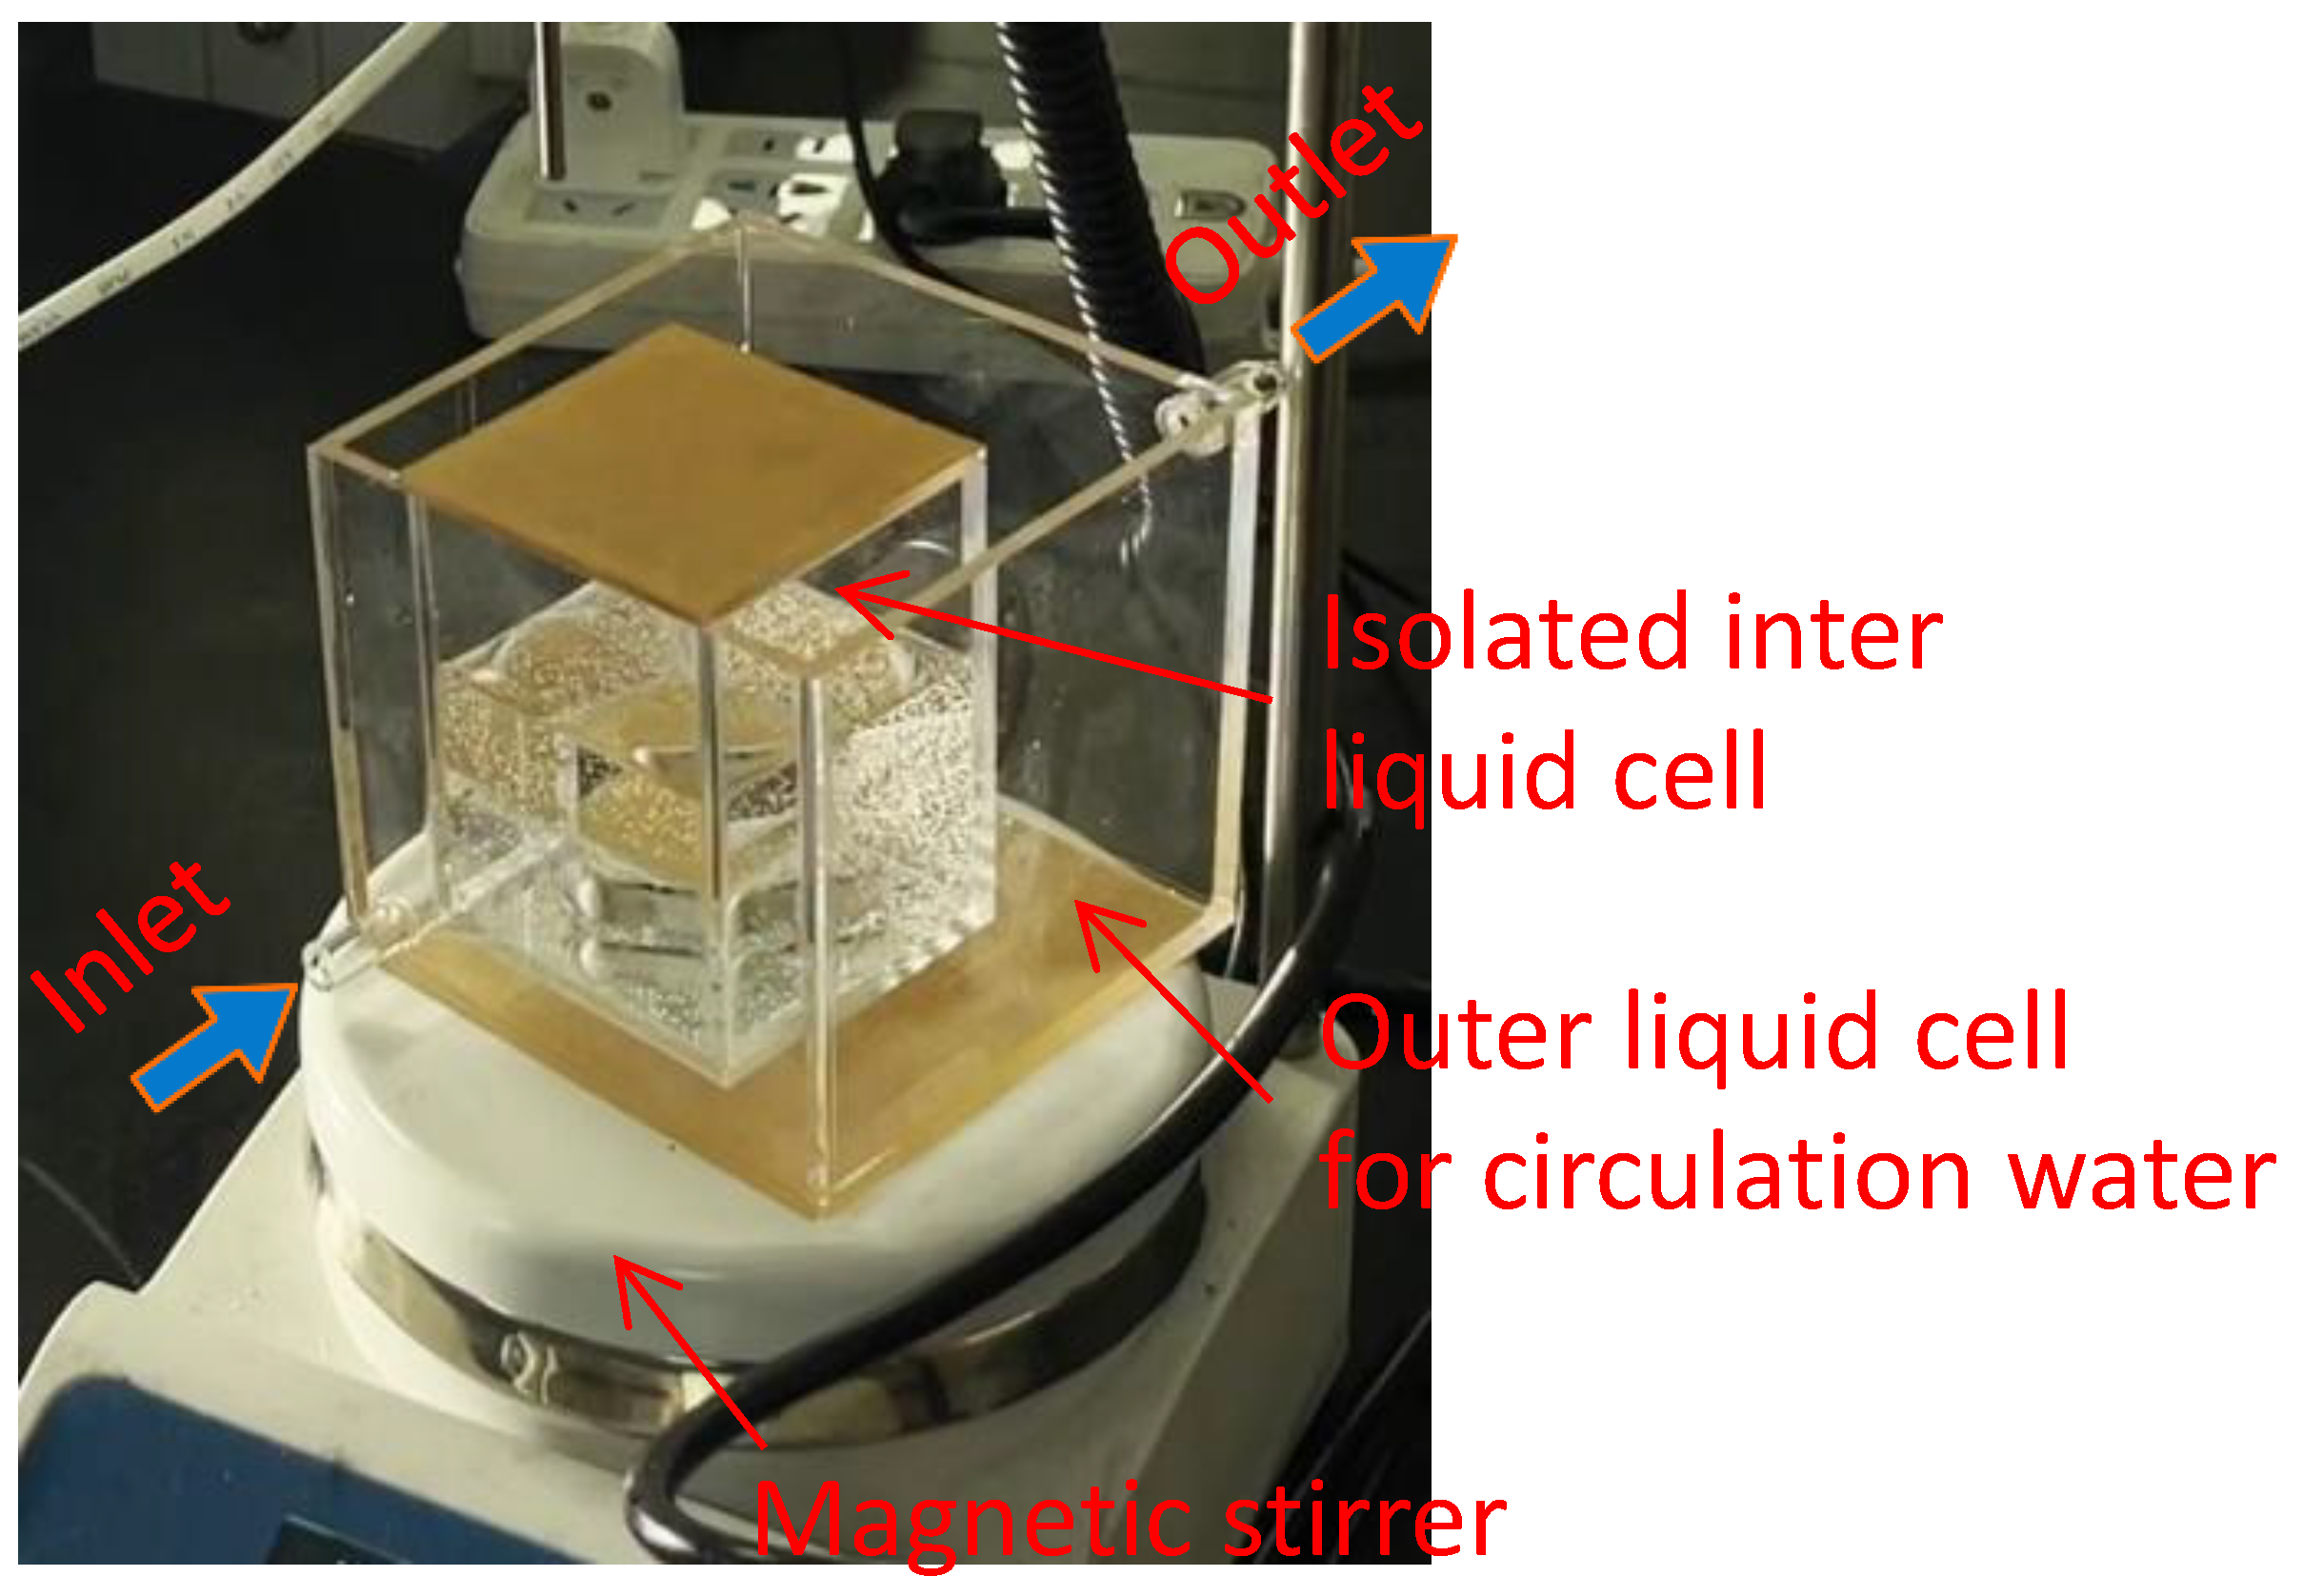
Figure 5.
Procedures for particle-bubble collision and adhesion experiment[33].
Figure 5.
Procedures for particle-bubble collision and adhesion experiment[33].
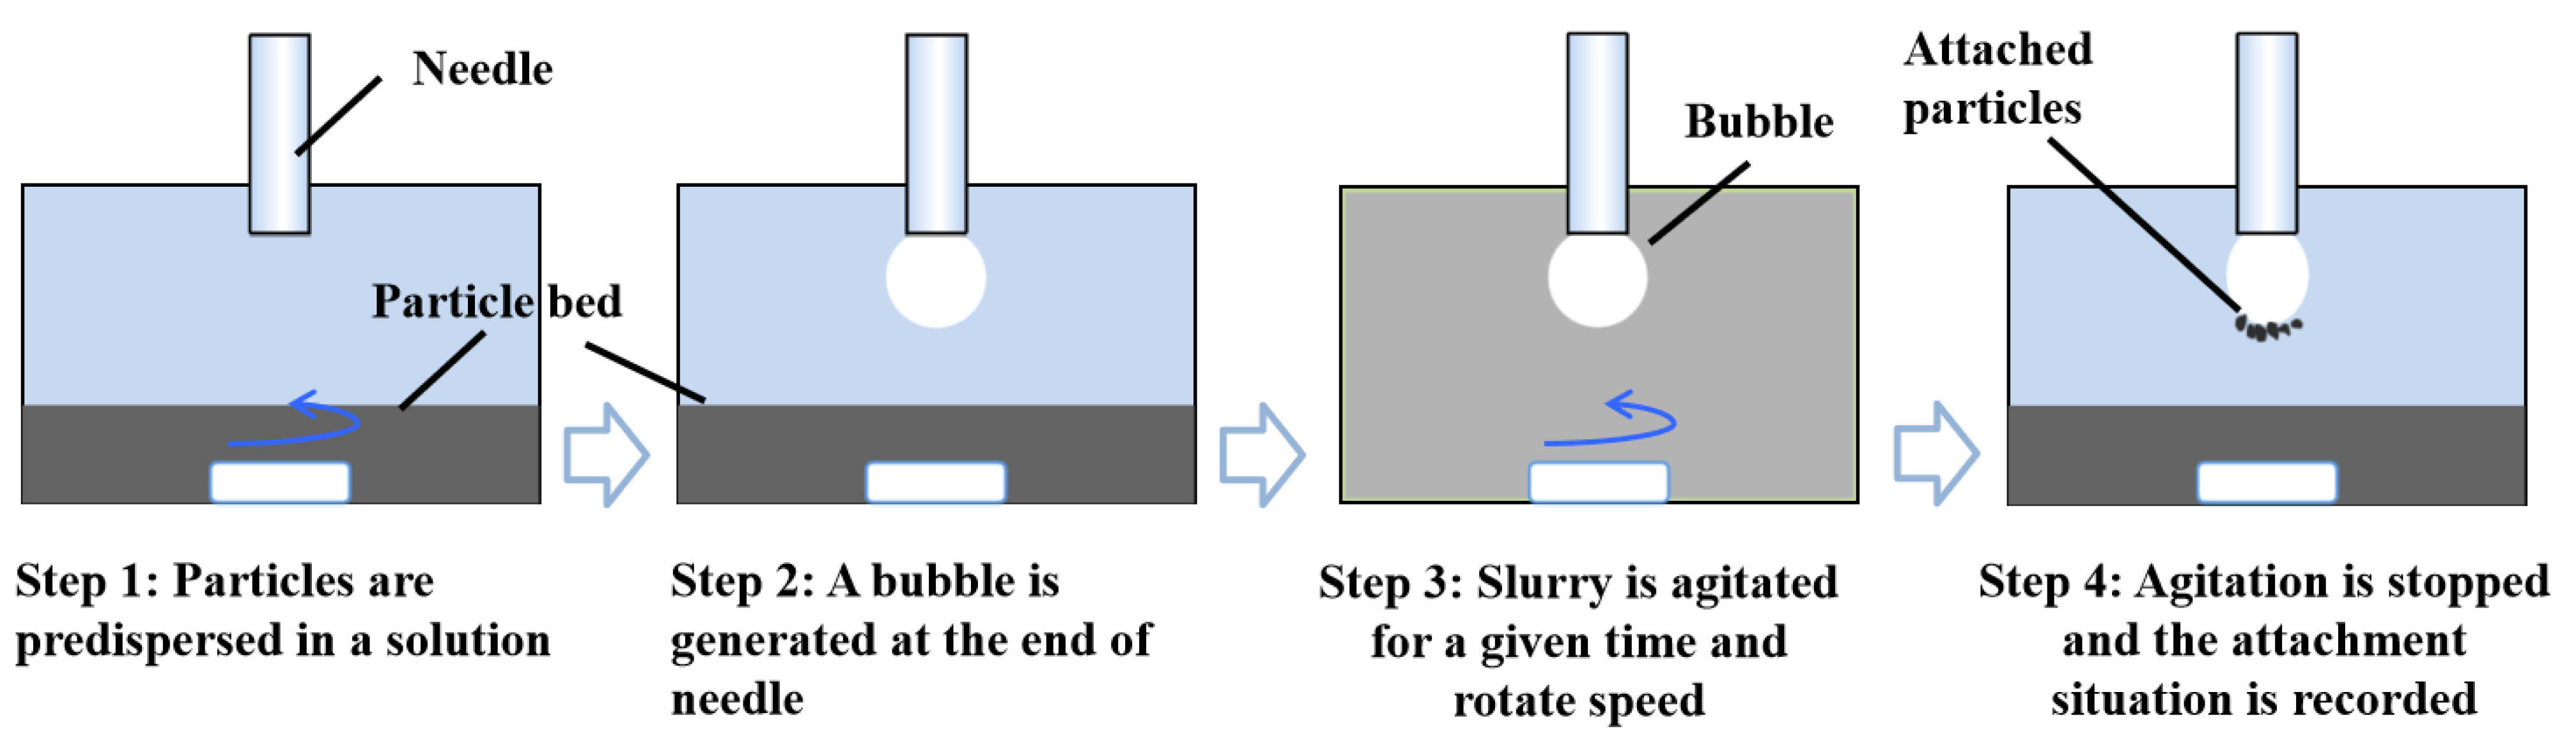
Figure 6.
Apparatus for interaction force measurement.
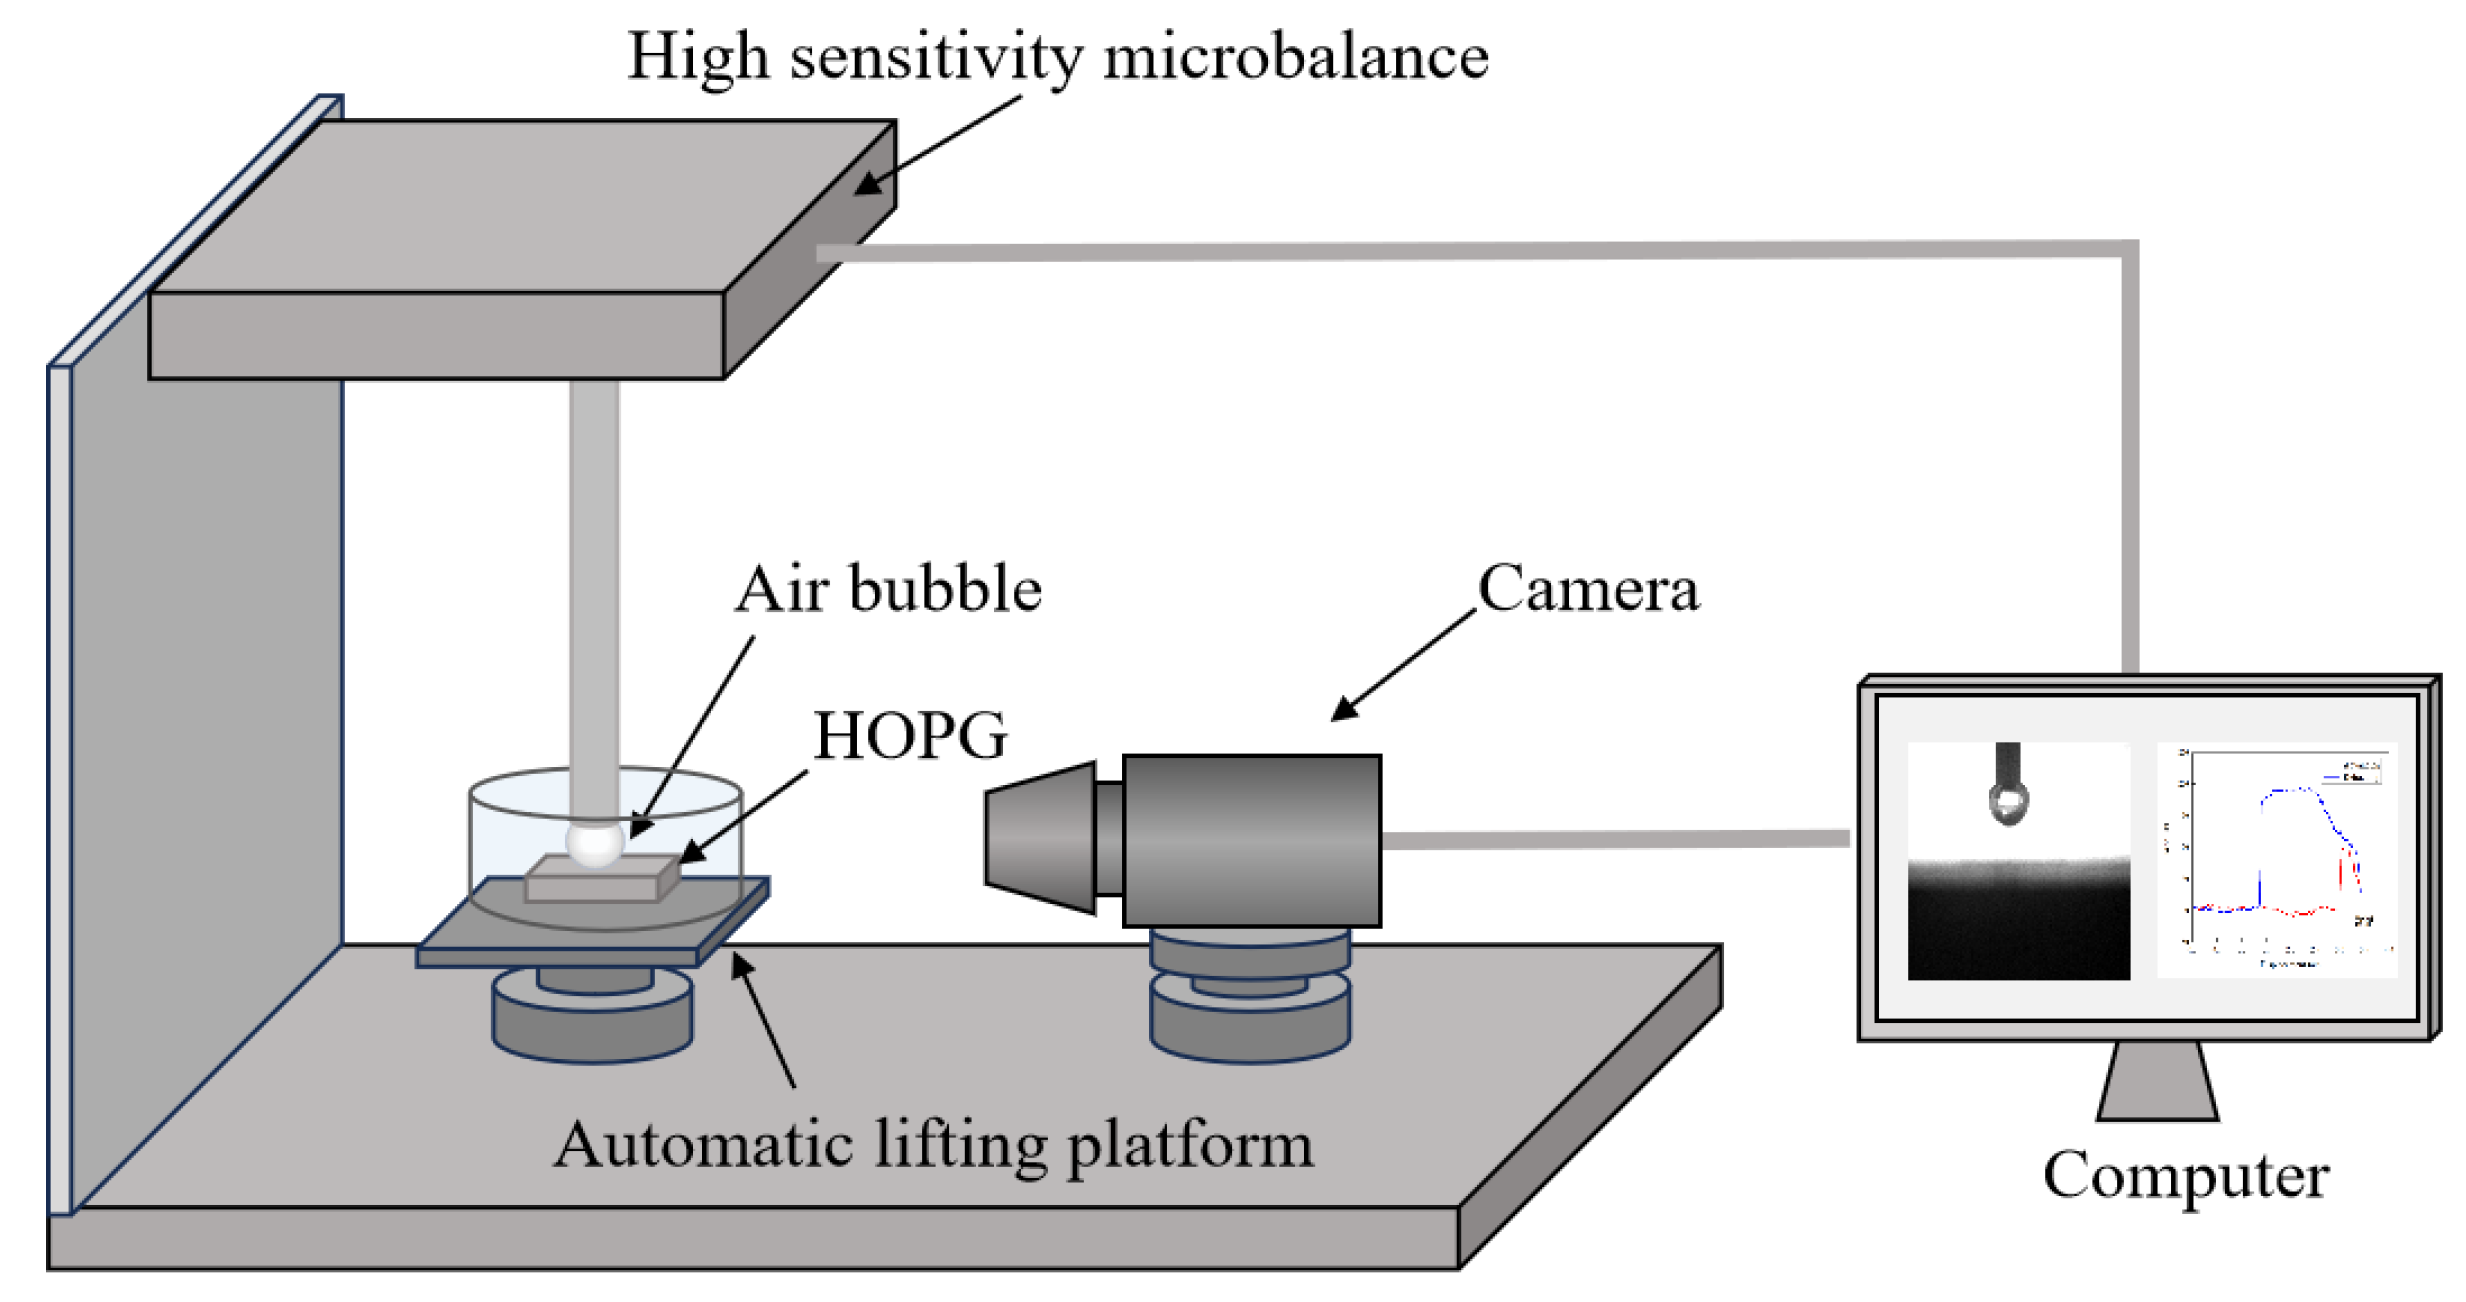
Figure 7.
Photo of Hallimond flotation tube.
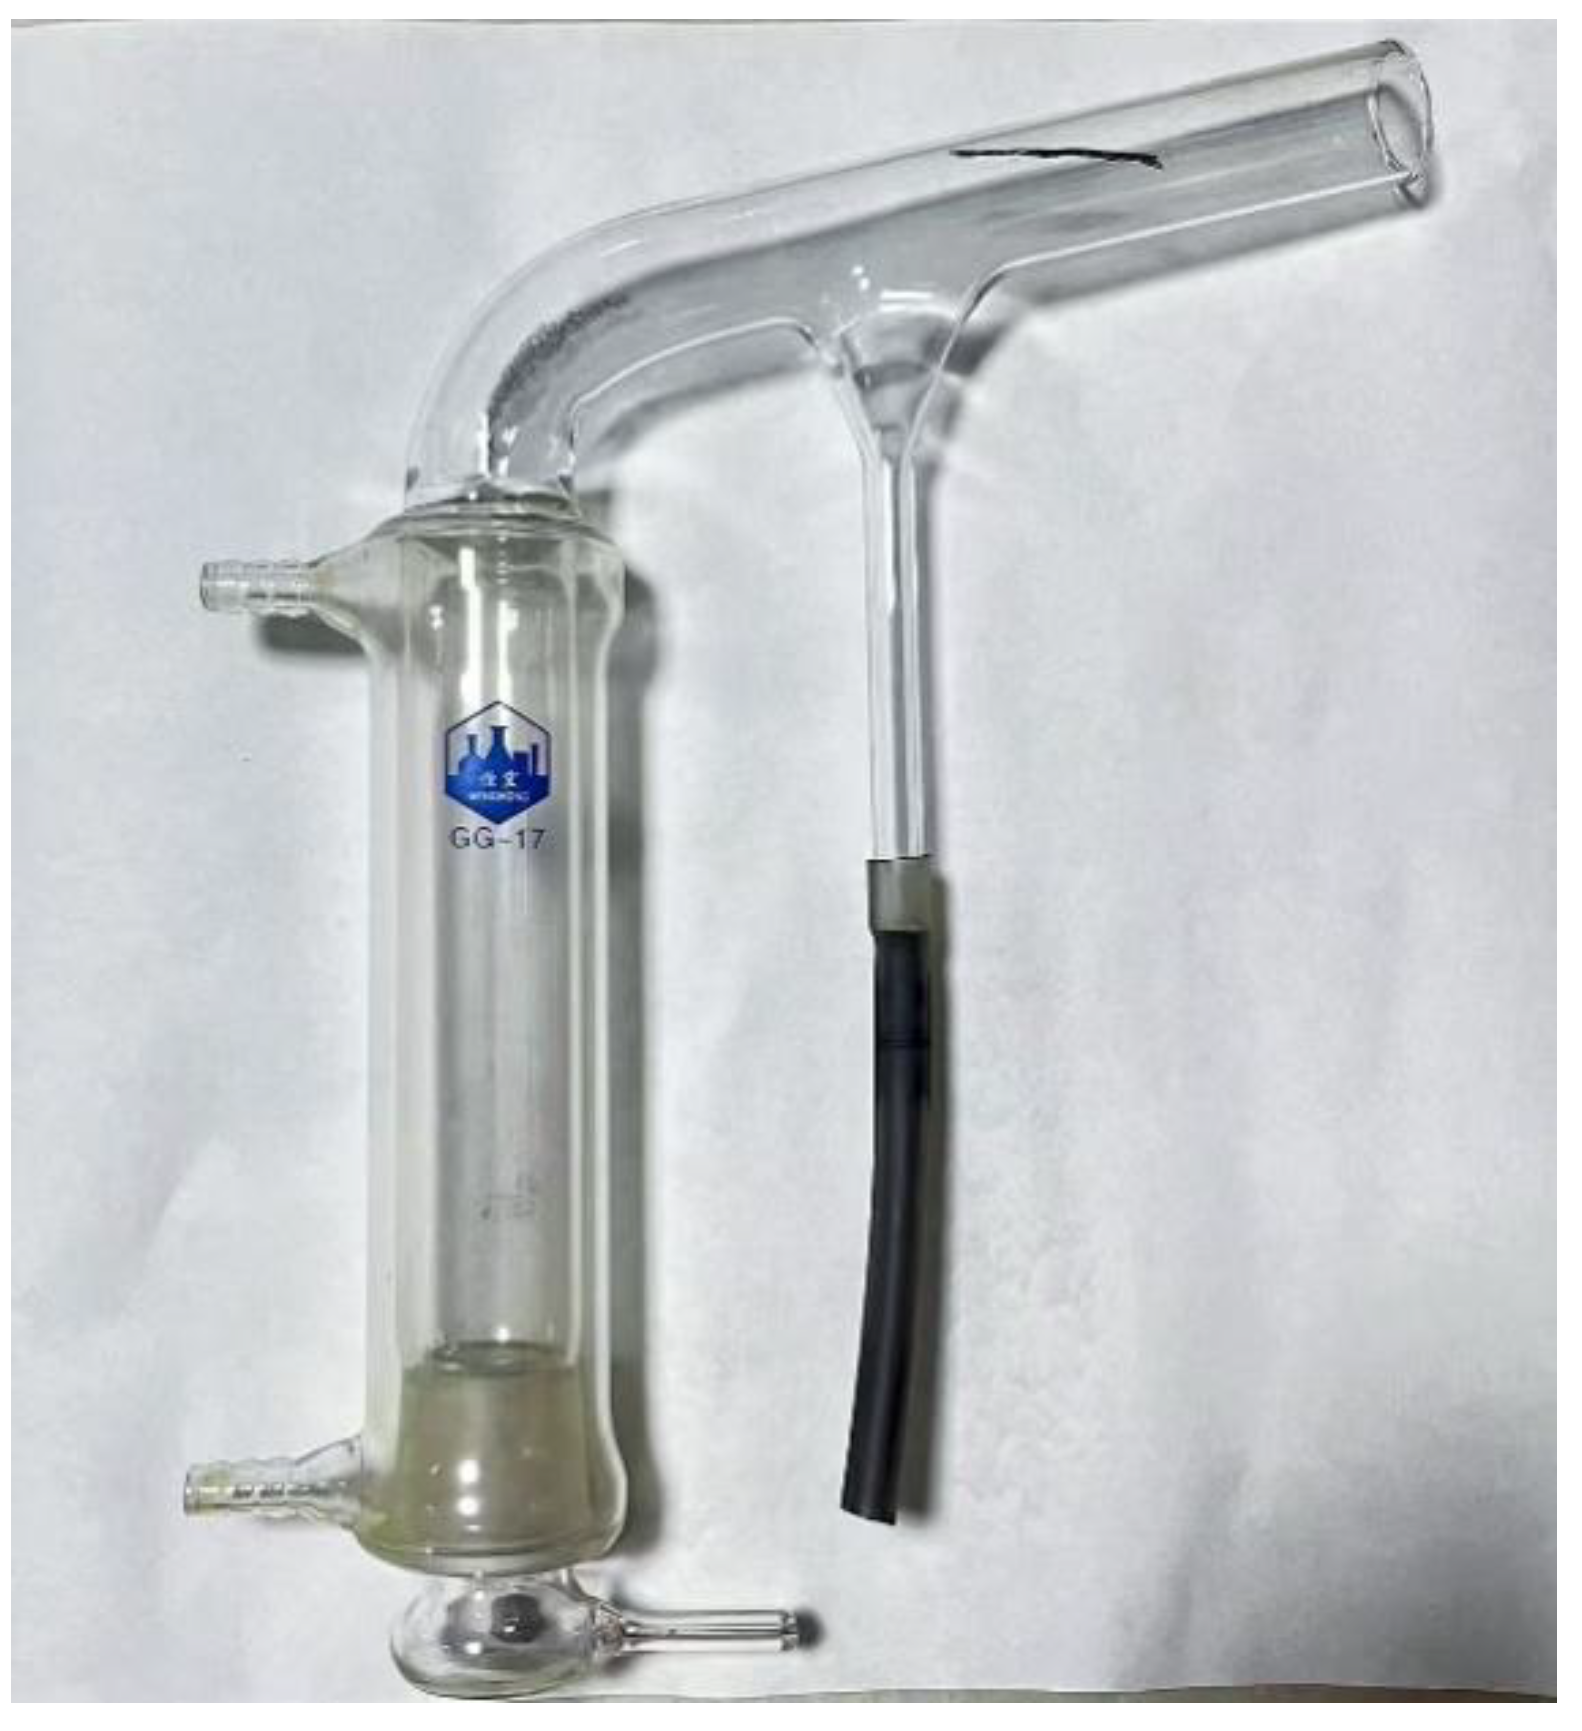
Figure 8.
Influence of temperature on nanobubbles nucleation on hydrophobized silicon wafer.
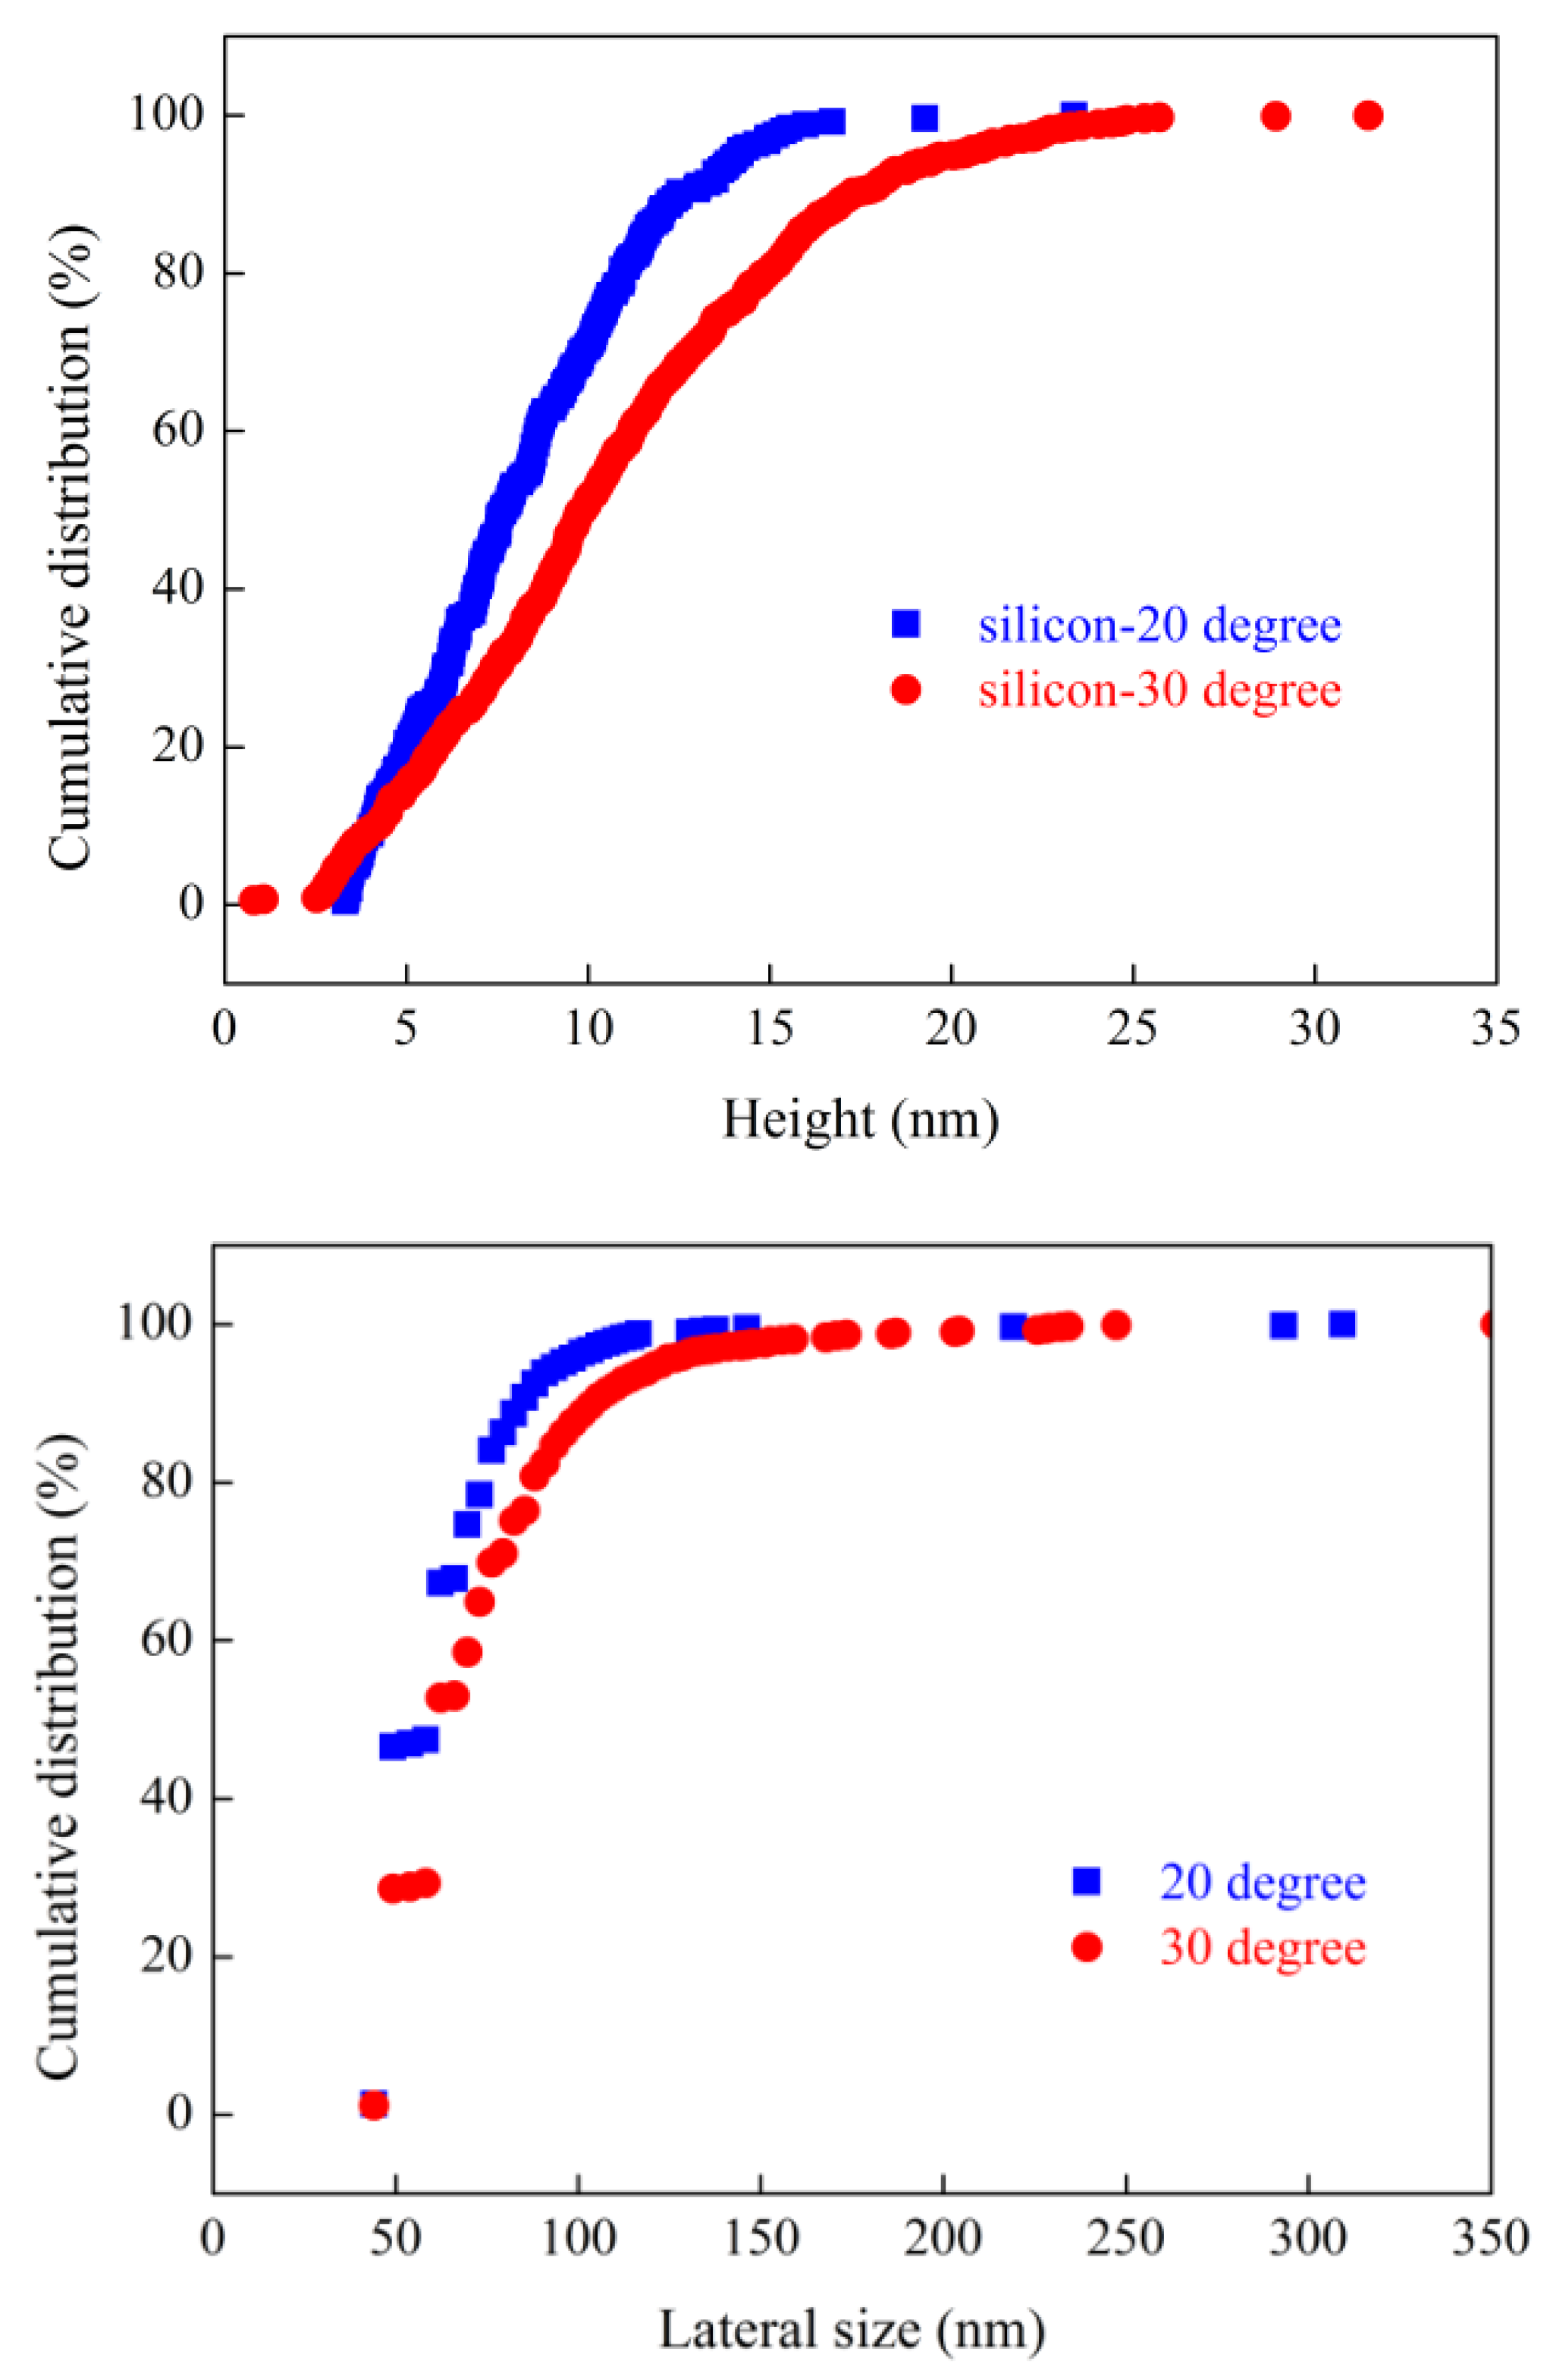
Figure 9.
Influence of temperature on nanobubbles nucleation on hydrophobized alumina surface.
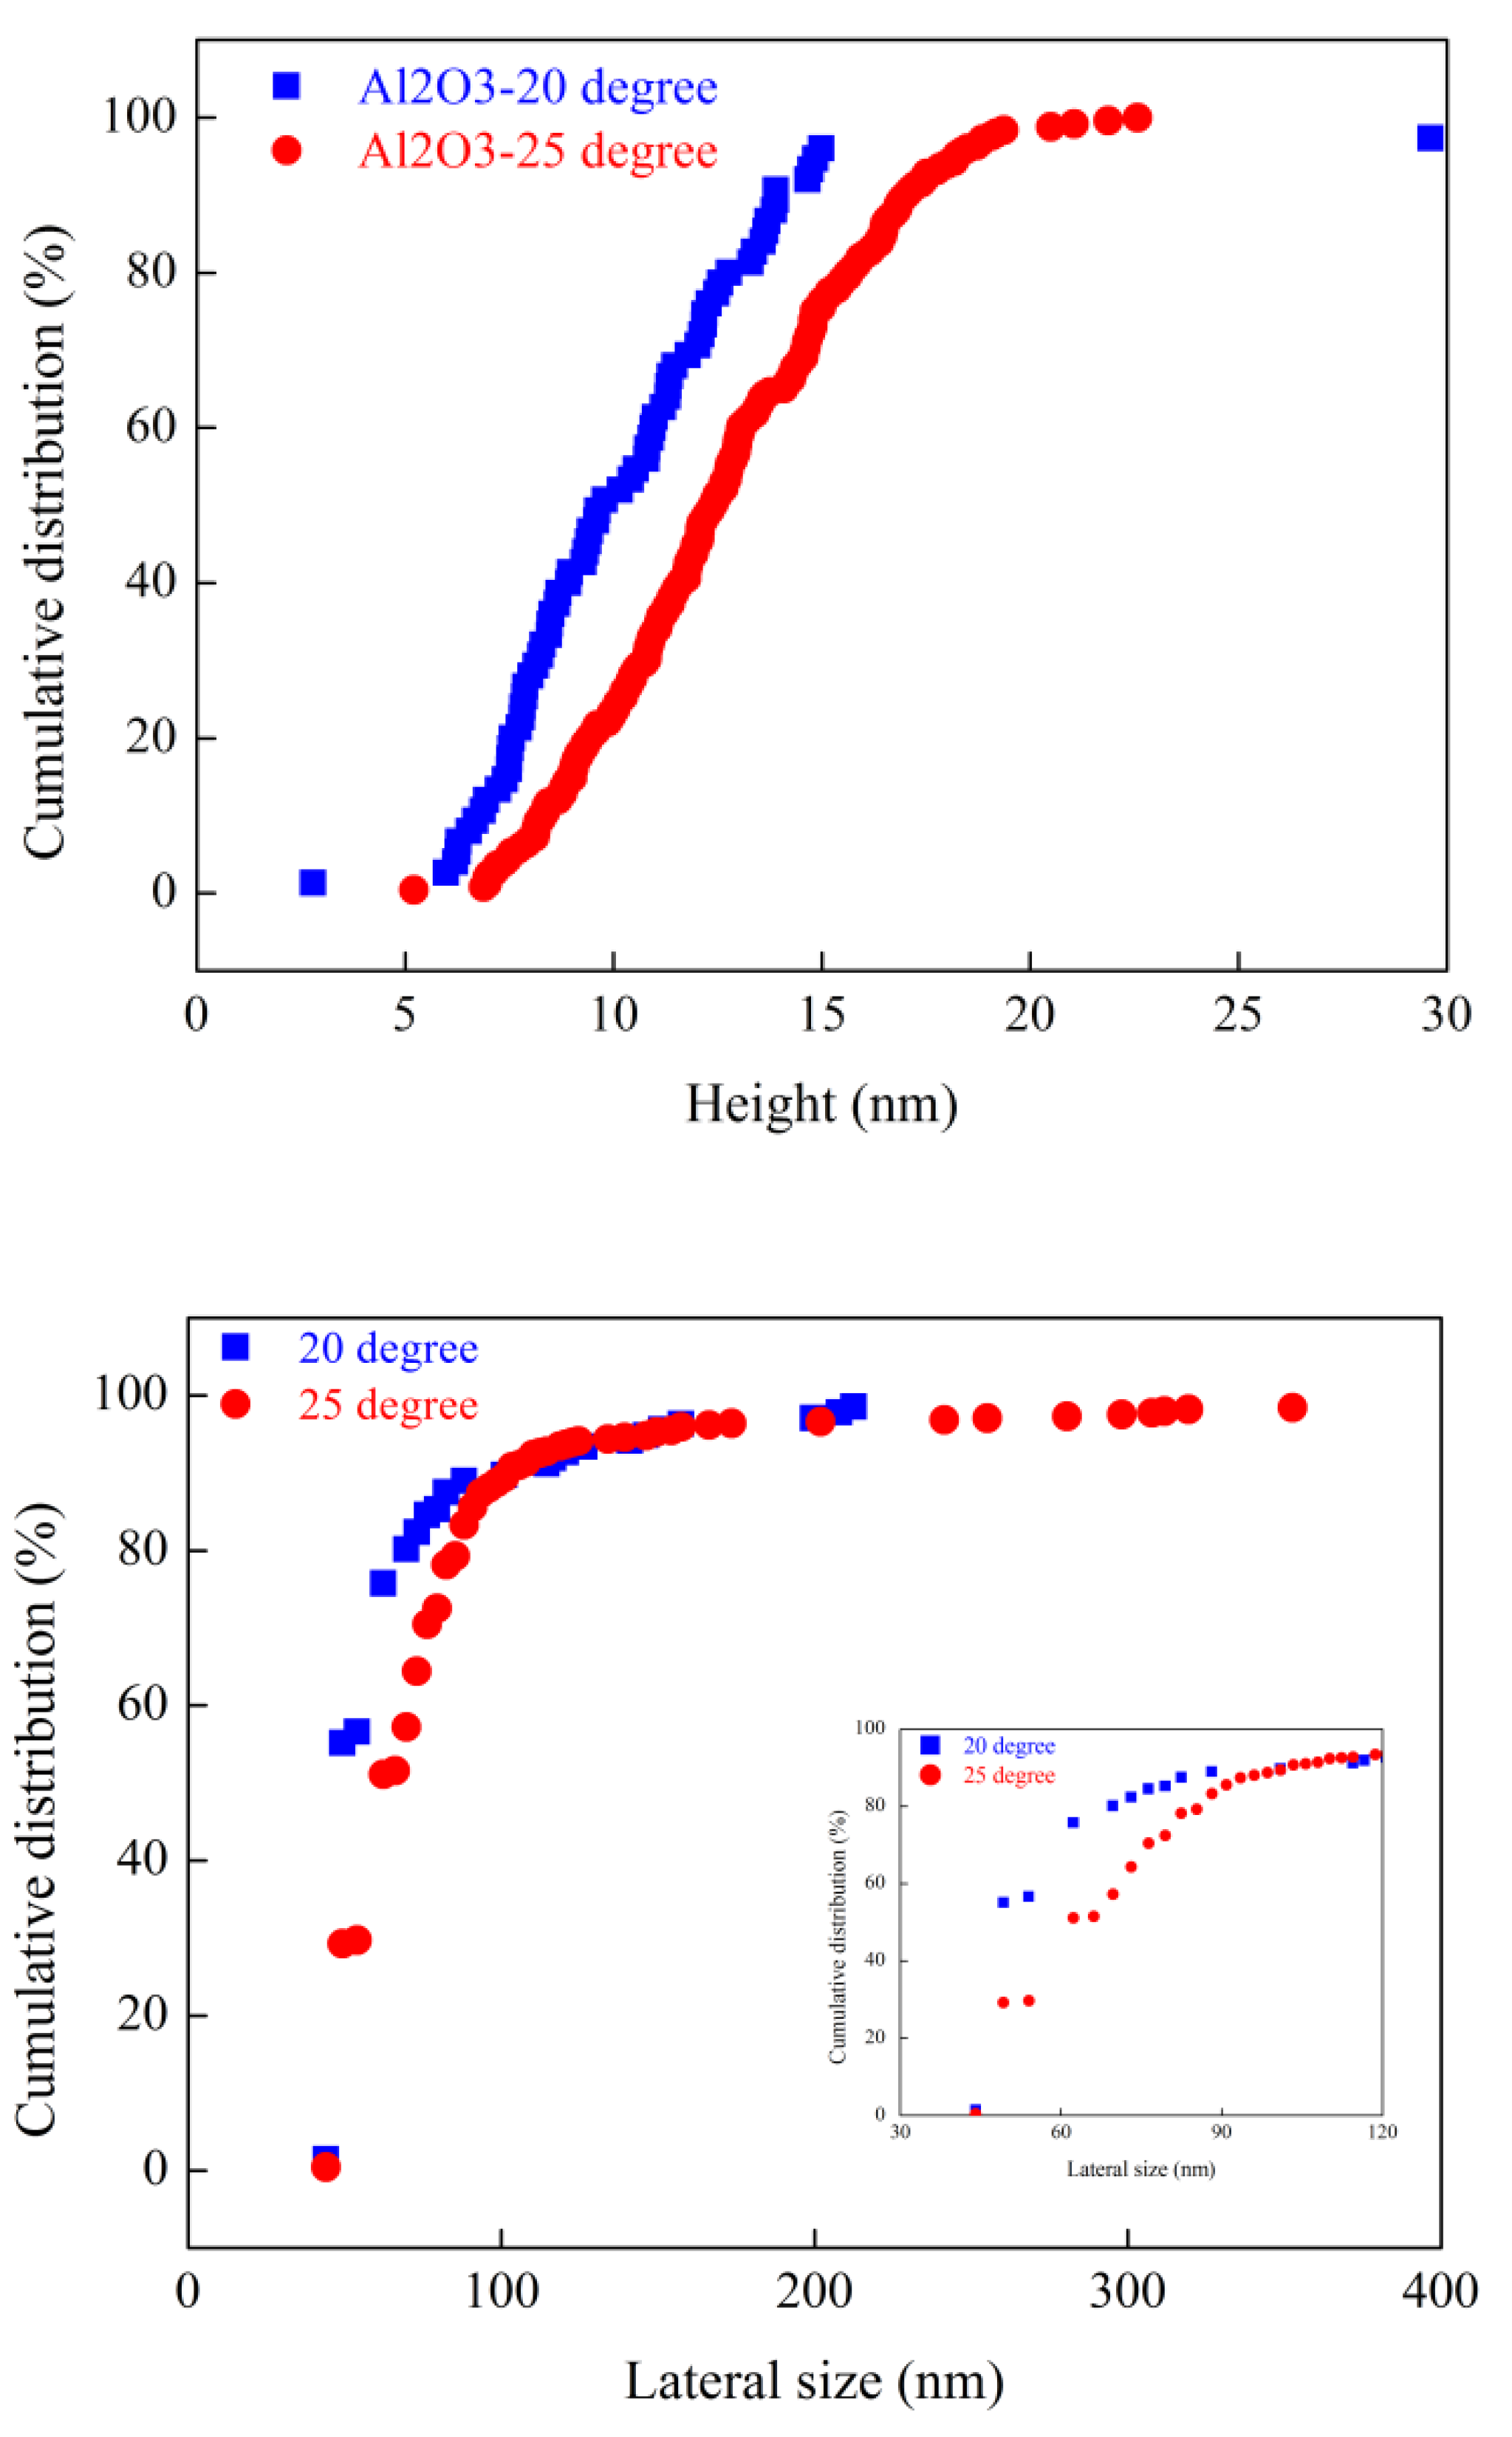
Figure 10.
Morphology of graphite aggregates under different gas saturation conditions.

Figure 11.
Size distributions of graphite agglomerations at different gas oversaturation degrees.
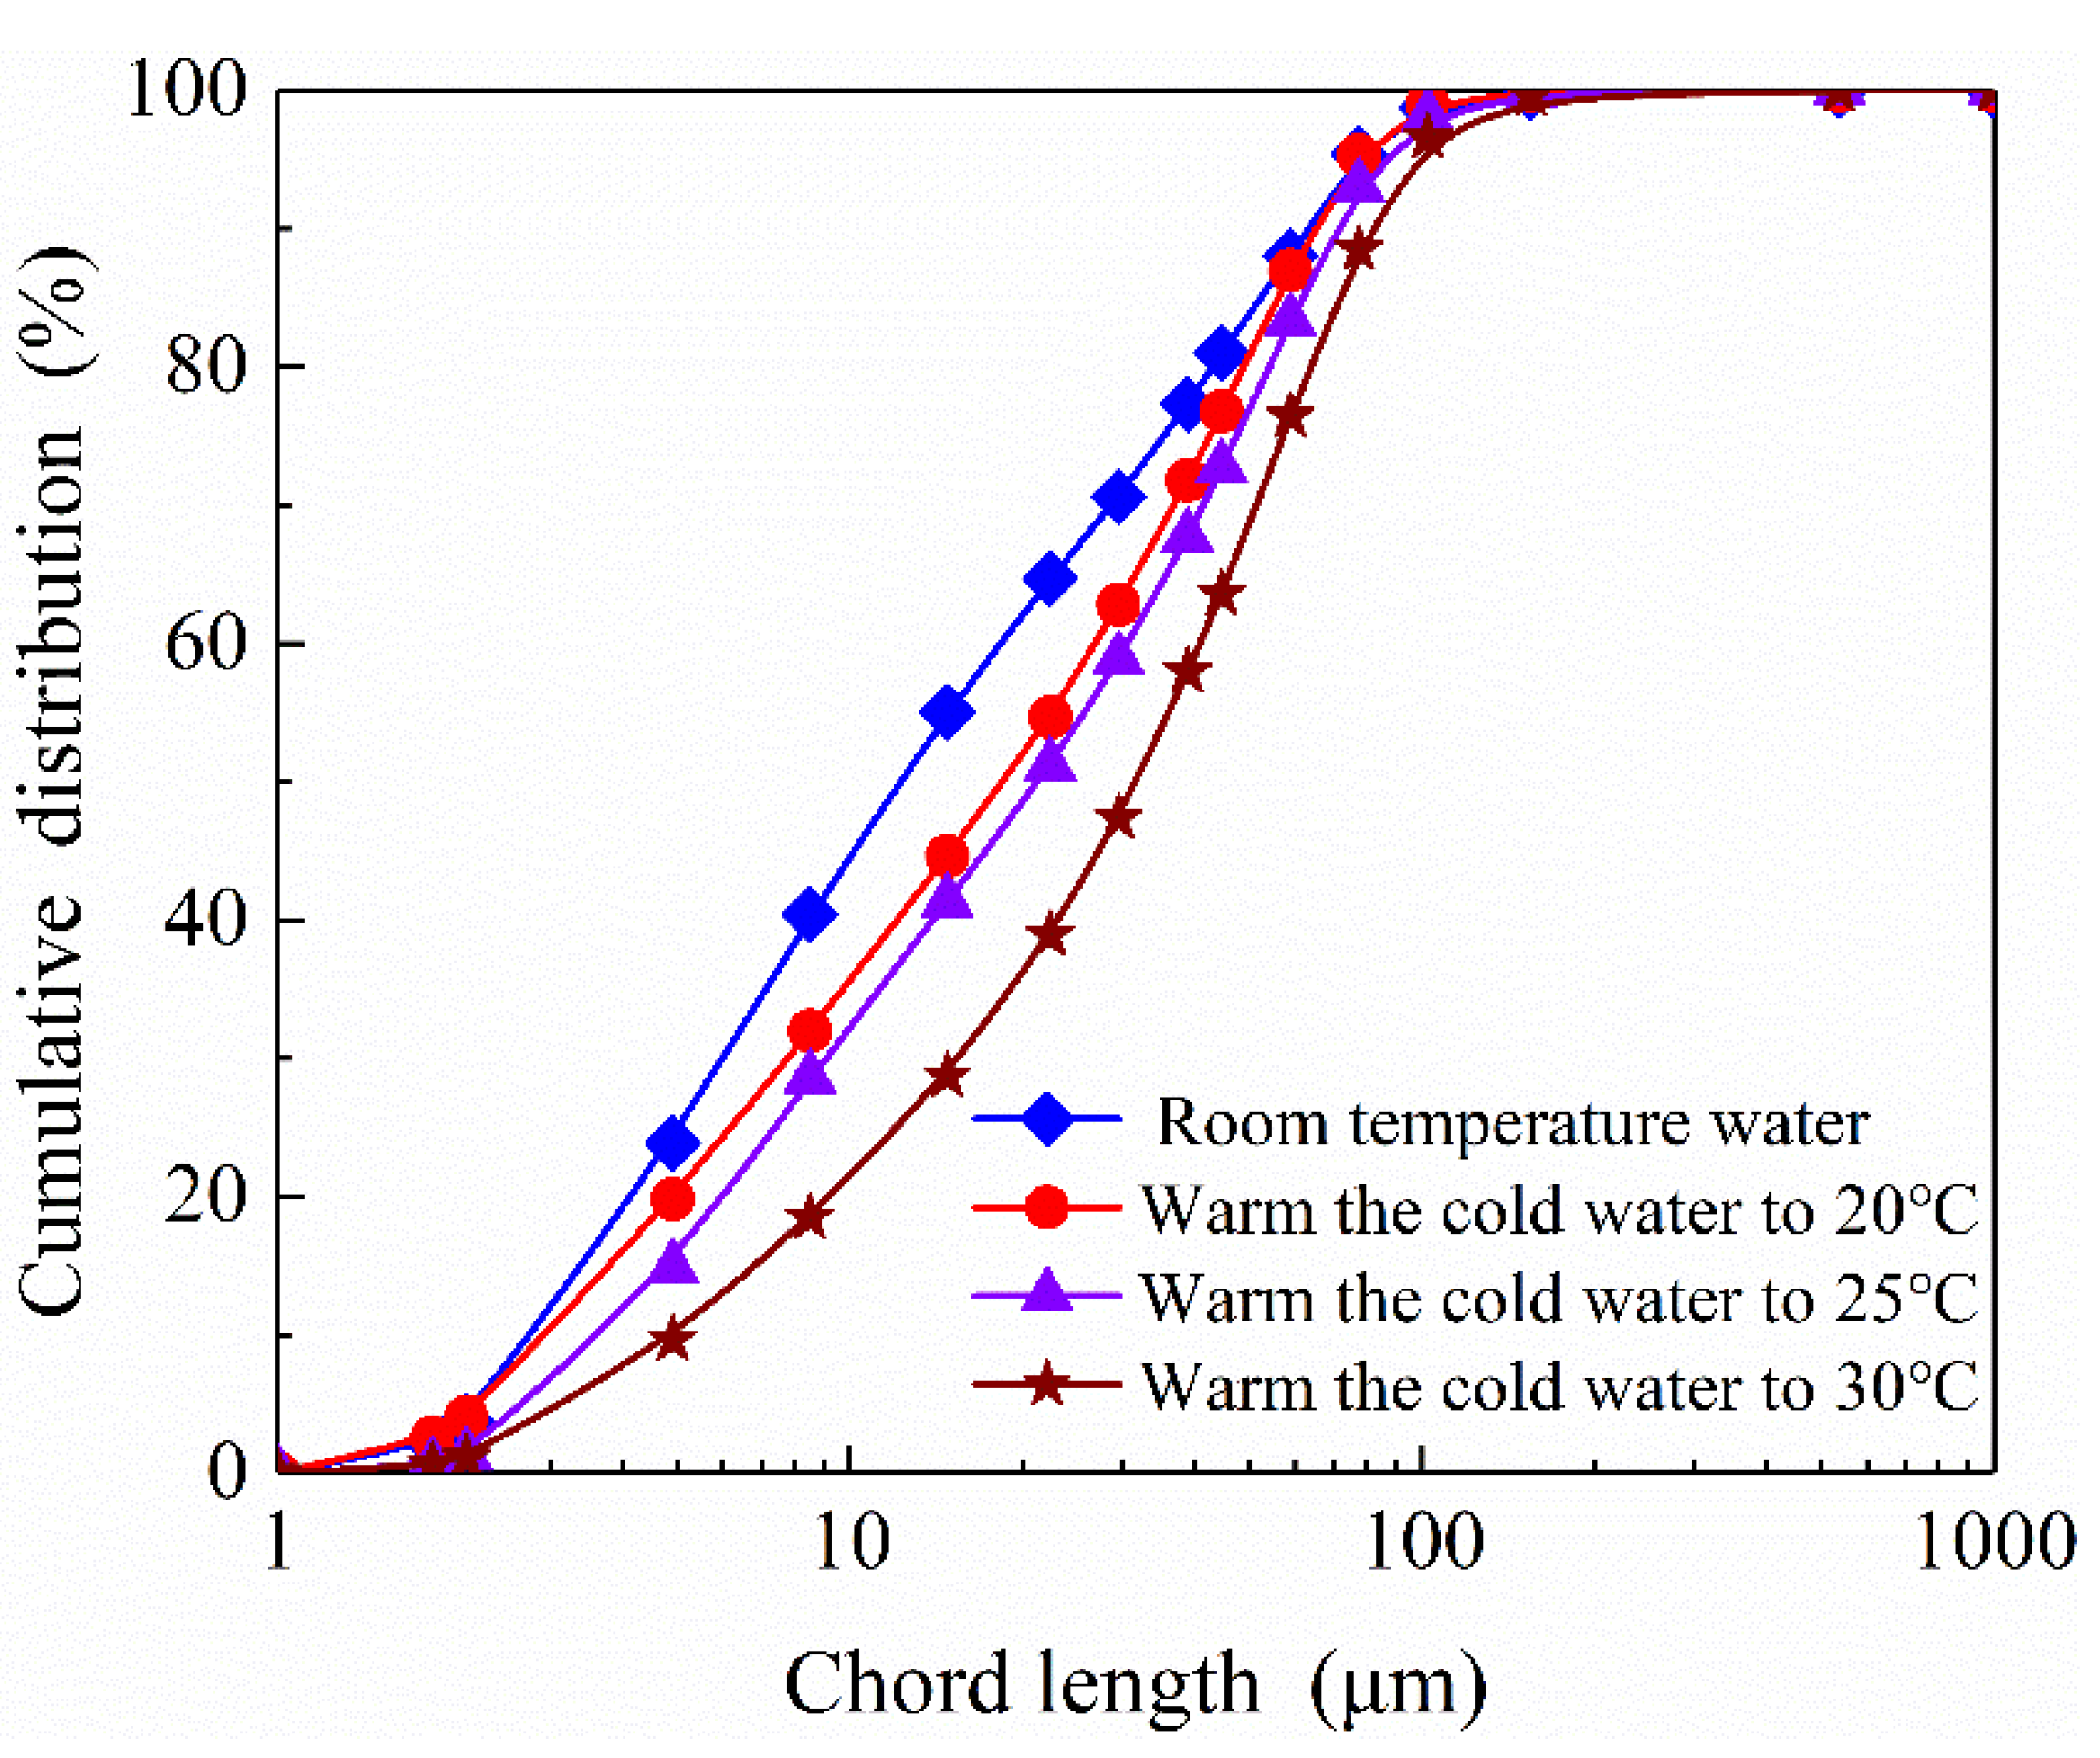
Figure 12.
Wrapping angles between graphite (agglomerations) and a captive bubble.
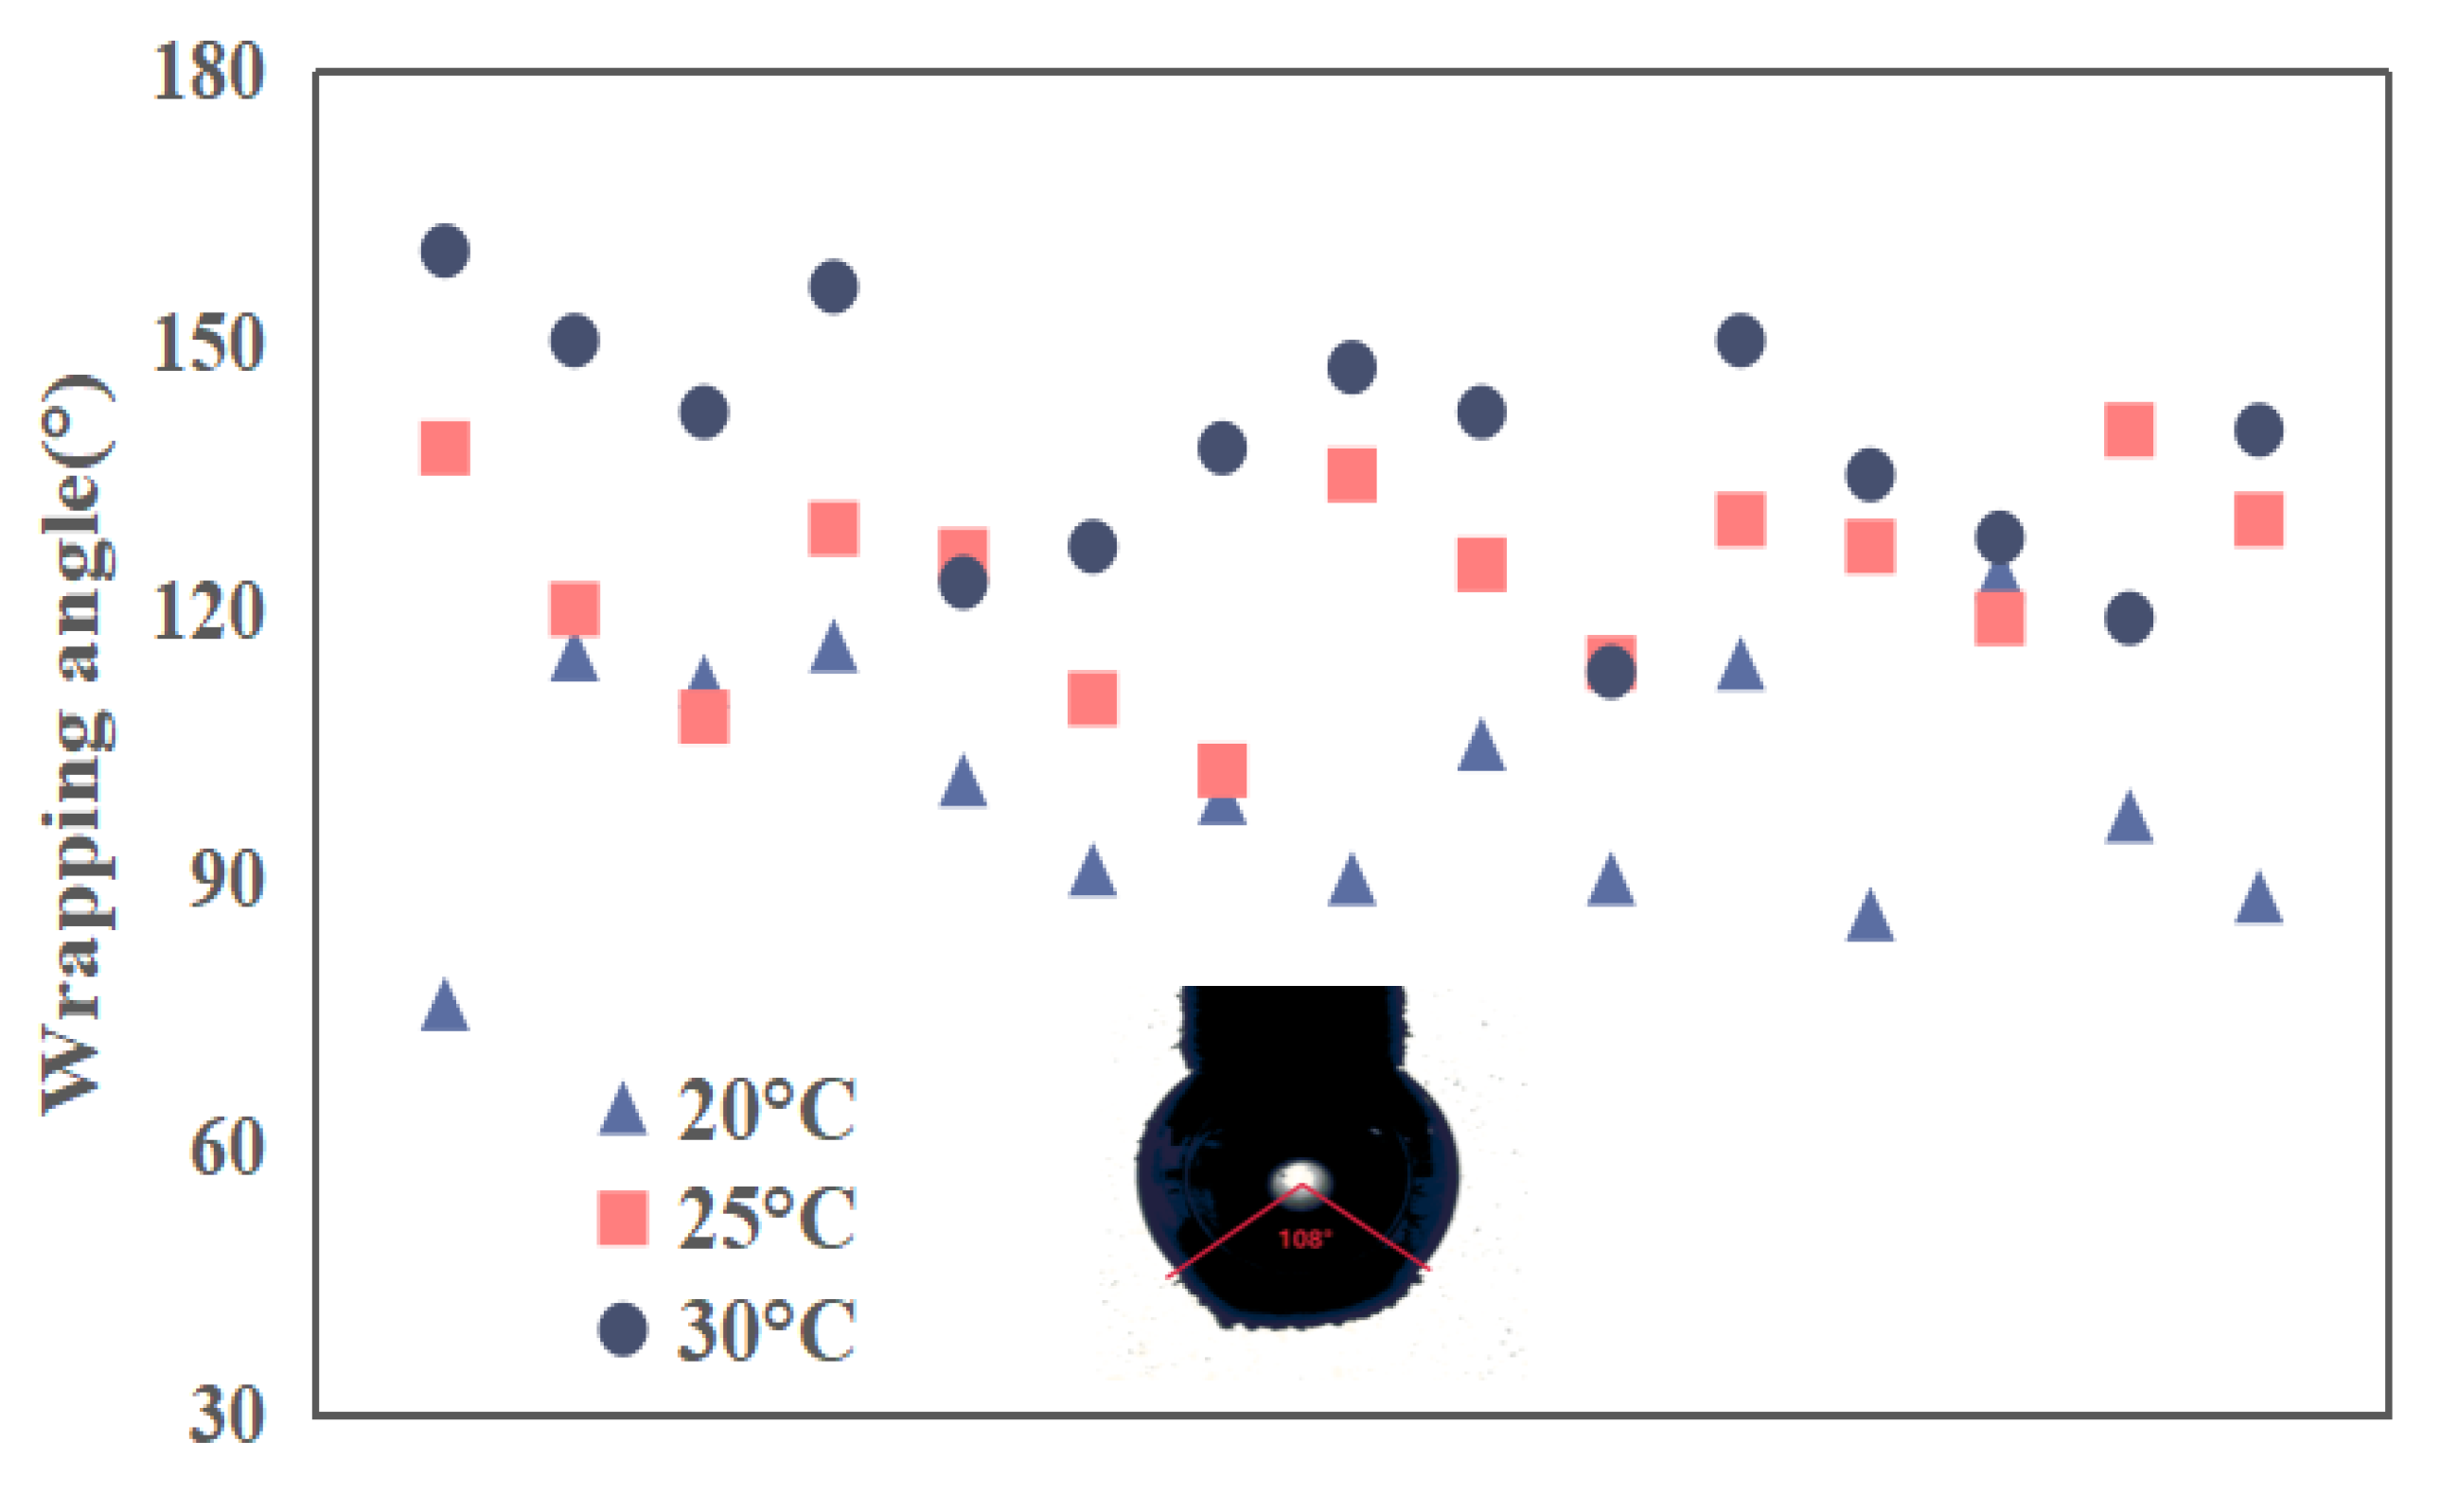
Figure 13.
Force curves between a captive bubble and a substrate at different gas oversaturation degrees.
Figure 13.
Force curves between a captive bubble and a substrate at different gas oversaturation degrees.

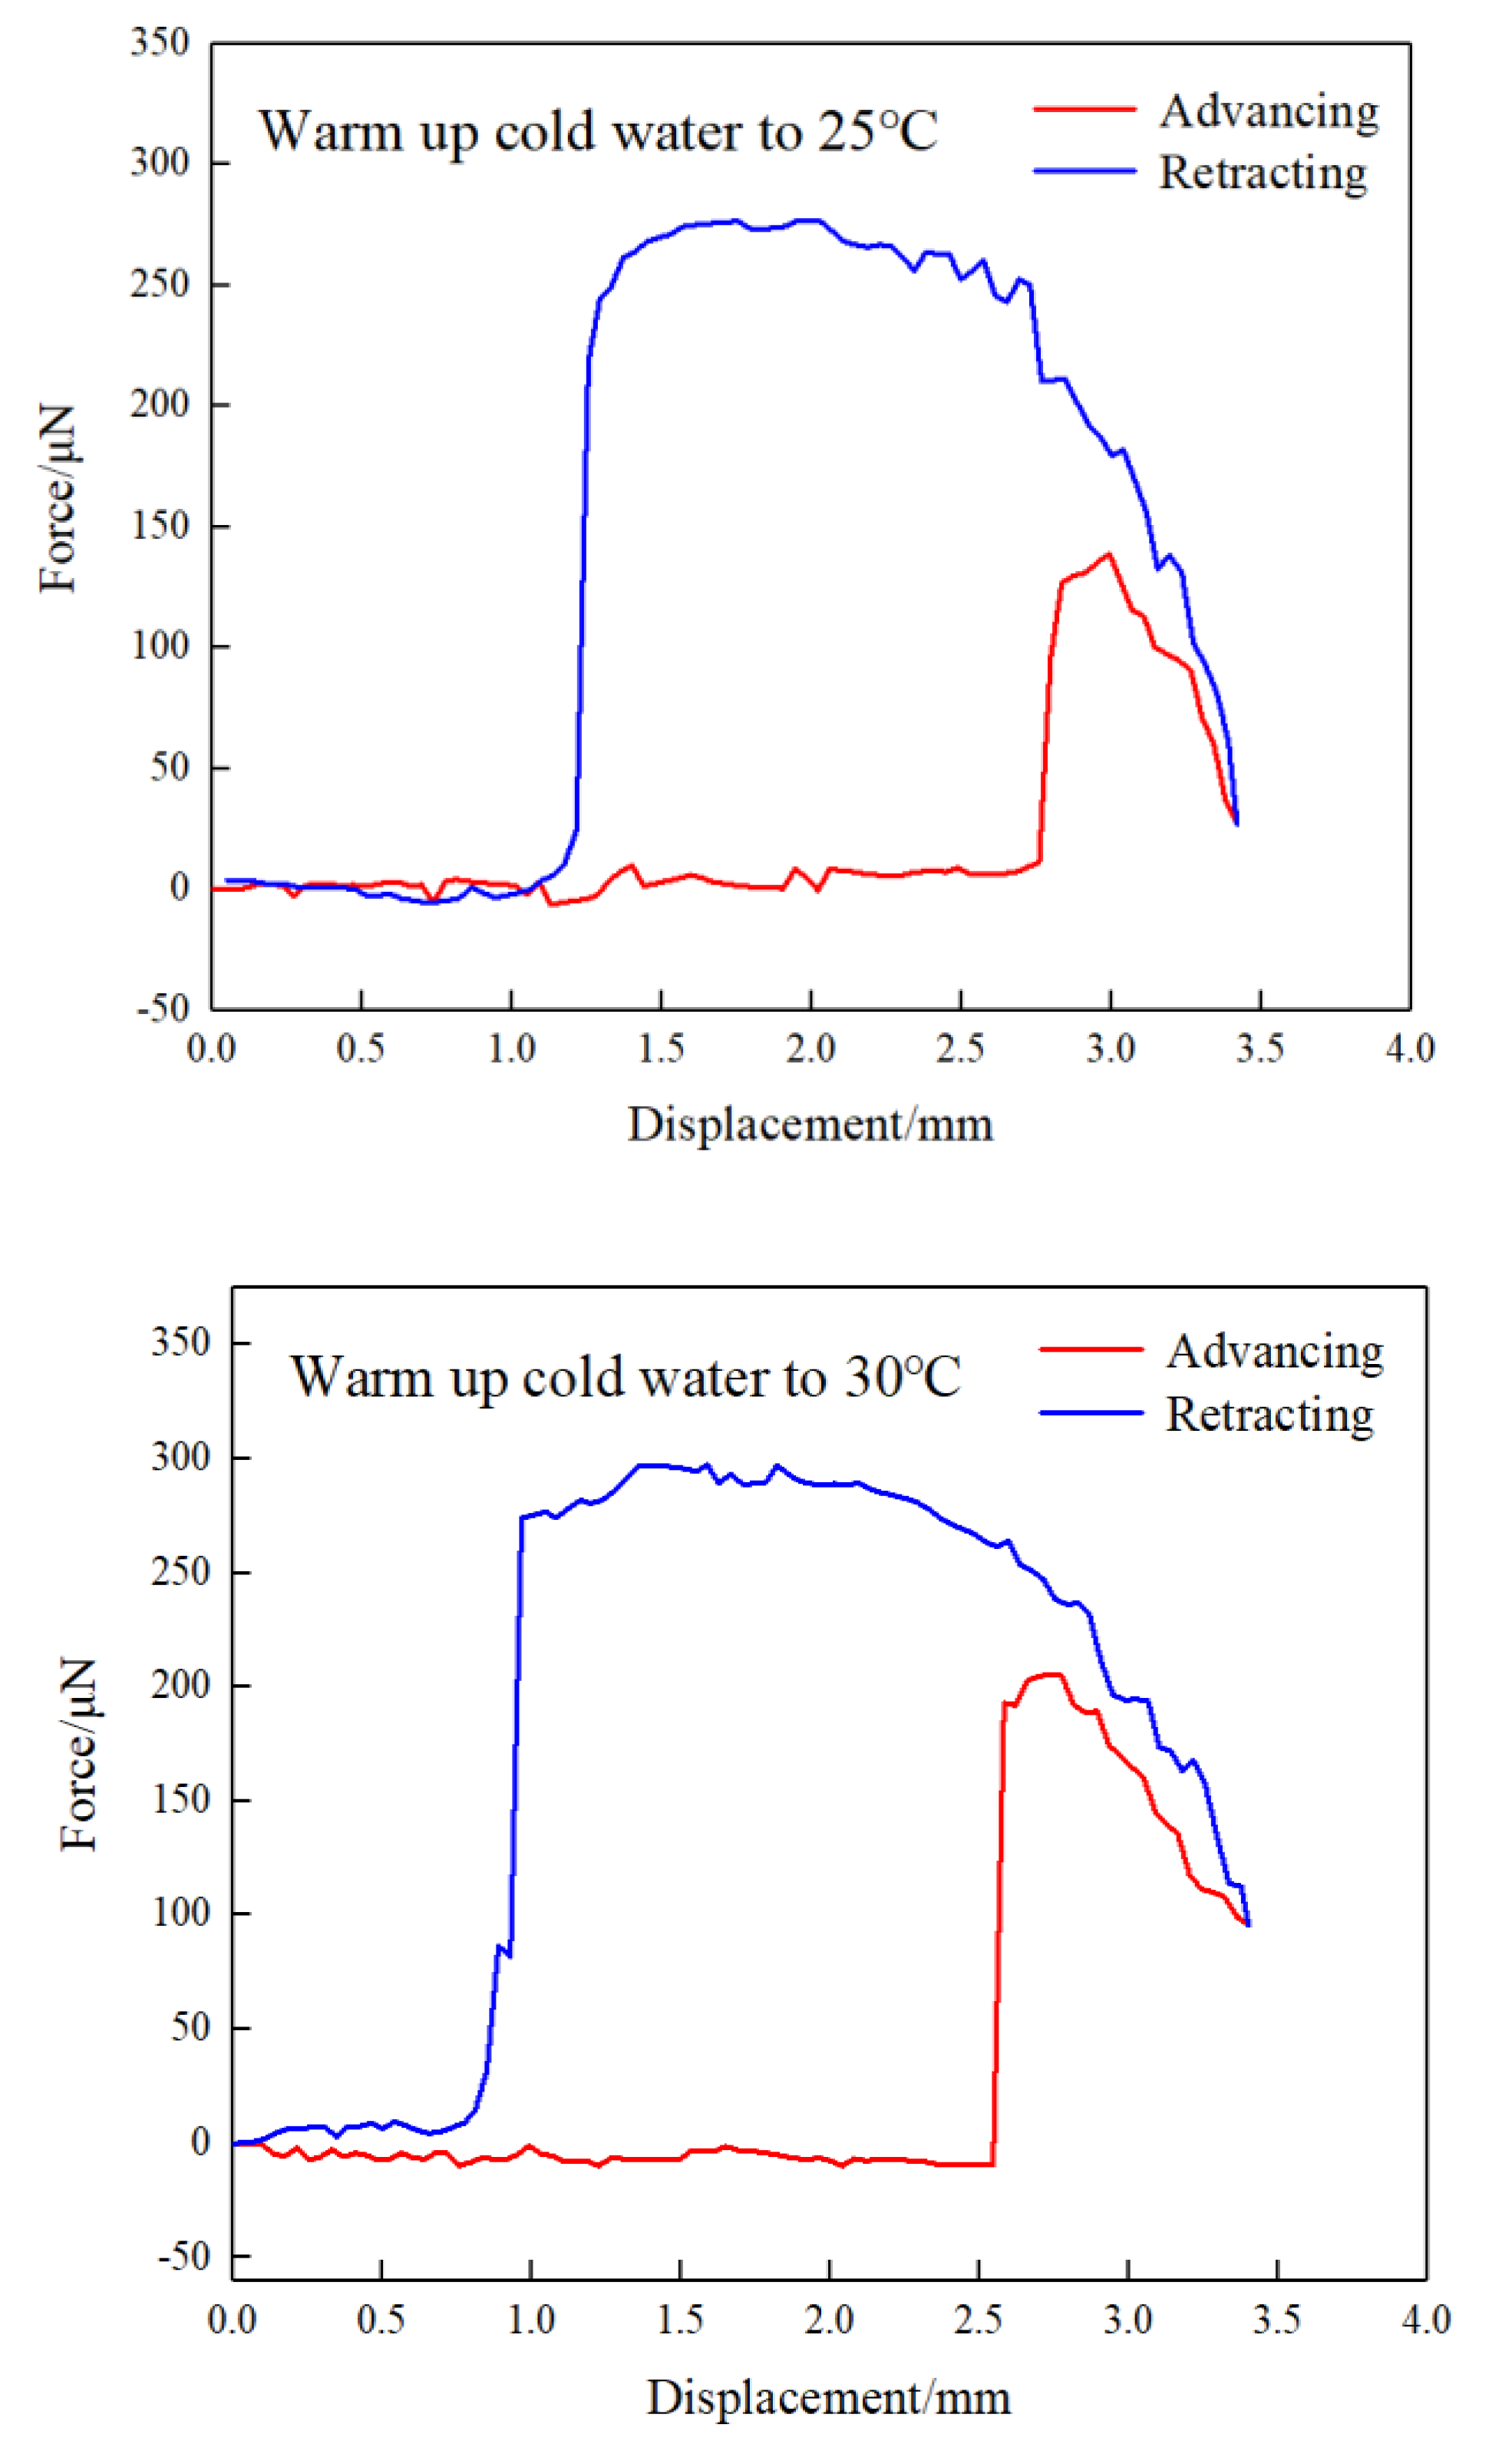
Figure 14.
Cumulative combustible recovery at different gas oversaturation degrees as a function of flotation time.
Figure 14.
Cumulative combustible recovery at different gas oversaturation degrees as a function of flotation time.
Disclaimer/Publisher’s Note: The statements, opinions and data contained in all publications are solely those of the individual author(s) and contributor(s) and not of MDPI and/or the editor(s). MDPI and/or the editor(s) disclaim responsibility for any injury to people or property resulting from any ideas, methods, instructions or products referred to in the content. |
© 2025 by the authors. Licensee MDPI, Basel, Switzerland. This article is an open access article distributed under the terms and conditions of the Creative Commons Attribution (CC BY) license (http://creativecommons.org/licenses/by/4.0/).
Copyright: This open access article is published under a Creative Commons CC BY 4.0 license, which permit the free download, distribution, and reuse, provided that the author and preprint are cited in any reuse.


