
Submitted:
28 February 2025
Posted:
03 March 2025
You are already at the latest version
Abstract
Background: The egg-laying performance of hens is primarily regulated by ovarian follicle growth and development, which are susceptible to oxidative damage caused by excessive reactive oxygen species (ROS). Oxidative damage can lead to follicular atresia and impaired reproductive performance. Melatonin (MT), a known endogenous antioxidant, plays a role in regulating oxidative damage, but its precise mechanisms in mitigating H₂O₂-induced oxidative damage via mitophagy regulation in granulosa cells remain unclear. Methods: An in vitro oxidative damage model was established by determining the optimal H₂O₂ concentration using CCK-8 fluorescence quantification. The optimal MT concentration was identified through fluorescence quantification and catalase (CAT) activity assays. The protective effects of MT against H₂O₂-induced oxidative damage in follicular granulosa cells were investigated using flow cytometry, Western blotting, ELISA, and quantitative fluorescence analysis. Results: An in vitro oxidative damage model was established using H₂O₂-induced granulosa cells, characterized by P53 and LC3-II upregulation and LC3-I and BCL-2 downregulation. The optimal MT concentration for reducing cellular injury was determined. MT co-treatment enhanced CAT, GSH, and SOD activities, decreased LC3-II/LC3-I conversion, and increased P62 expression. Furthermore, MT reduced autophagic vesicle formation and restored mitochondrial membrane potential (ΔΨm), demonstrating its protective effect against H₂O₂-induced oxidative damage. Conclusions: Melatonin alleviates H₂O₂-induced oxidative damage in chicken follicular granulosa cells by modulating antioxidant defense, autophagy, and mitochondrial function. These findings provide newer insights to our understanding of the regulatory mecha-nisms underlying the alleviation of the H₂O₂-induced oxidative damage in the granulosa cells during ovarian follicle development in chicken.
Keywords:
Chicken
; Melatonin
; Granulosa cells
; Oxidative damage
; Mitochondrial autophagy
1. Introduction
Follicular development is vital for poultry reproduction, with granulosa cells (GCs) playing a key role in follicular growth, hormone synthesis, and oxidative damage regulation [1,2,3]. The current research suggests that autophagy in granulosa cells may be an important process in follicular atresia induced by oxidative damage [4]. Excessive ROS disrupts the balance between oxidative damage and antioxidant defense, causing granulosa cell apoptosis and follicular dysfunction [5,6]. Studies suggest that oxidative damage may affect granulosa cell survival by triggering mitochondrial dysfunction, apoptosis, and autophagy dysregulation [7]. Key regulators like P53, LC3, and BCL-2 are involved in oxidative damage-induced apoptosis and autophagy, impacting ovarian function [8]. Hydrogen peroxide is widely used to create oxidative damage models in vitro due to its ability to induce controllable damage [9]. In granulosa cells, H2O2 upregulates LC3-II and P53 while downregulating LC3-I and BCL-2, leading to excessive autophagy and apoptosis [10]. In goose granulosa cells, oxidative damage increases LC3-II/LC3-I and Beclin-1 but decreases P62 [11]. However, optimal H2O2 concentration and duration vary by cell type and culture conditions [12], making a reliable oxidative damage model essential for studying antioxidants.
Melatonin (MT) regulates circadian rhythms and ovarian functions, including follicular formation, oocyte maturation, and reducing oxidative damage in granulosa cells [13,14]. It lowers ROS levels and boosts antioxidant enzymes like SOD, CAT, and GSH [15]. Melatonin also maintains mitochondrial function through its antioxidant, anti-apoptotic, and free radical-scavenging properties [16,17]. Xu’s research showed melatonin mitigates mitochondrial membrane potential decline in oxidative- damaged bovine granulosa cells [18].
Although previous poultry studies have highlighted melatonin’s potential in combating oxidative damage, its role in protecting hen follicular granulosa cells remains unclear. This study cultured chicken follicular granulosa cells in vitro, inducing oxidative damage with H2O2 to establish a model and then identified the optimal exogenous melatonin concentration. It explores how melatonin alleviates granulosa cell damage under oxidative damage by regulating mitochondrial autophagy. The findings provide insights into melatonin’s effects on poultry ovarian function.
2. Materials and Methods
2.1. Cell Culture
After euthanizing the hens, abdominal feathers were removed and the area was disinfected the area. The follicles were extracted and placed in pre-cooled sterile PBS dishes. The outer membrane, connective tissue, and vascular network of the follicles were carefully peeled away, and the yolk was gently removed. Using forceps, the outer follicle membrane was held to release the granulosa cell layer. The tissue was thoroughly rinsed with PBS, transferred to a sterile beaker, and finely minced. The minced tissue was placed into a 15 ml centrifuge tube, centrifuged, and the supernatant was discarded. Seven ml of type II collagenase was added, and digestion was carried out for 15 minutes. The digestion was terminated by adding an equal volume of complete medium, and the mixture was centrifuged for 15 minutes to collect the cell pellet. The cells were filtered, resuspended in complete medium, and seeded into 6-well plates. The plates were incubated at 37°C with 5% CO₂ for 24 hours [19].
2.2. Oxidative Damage Model Cell Treatment
The isolated granulosa cells were seeded into 96-well plates and incubated at 37°C with 5% CO₂. After 12 hours of adherence, an H₂O₂ concentration gradient screening was performed. For the control group, 0 μmol/L H₂O₂ was added; for the experimental groups, 5, 10, 20, 40, 80, 160, 320, μmol/L H₂O₂ (diluted with complete medium) were added to treat the cells. The appropriate concentration range was determined by assessing cell viability, and further screening was conducted to identify the optimal treatment concentration and duration within this range.
2.3. Cell Viability Assay
The isolated granulosa cells were seeded into 96-well plates and incubated at 37°C with 5% CO₂. After 12 hours of adherence, media containing different concentrations of H₂O₂, as described in section 2.2, were prepared to treat the cells. Twenty microliters of CCK-8 solution (APExBIO, Houston, USA) were added to each well, and the plates were incubated at 37°C for 1 hour, protected from light. After removing any bubbles, the optical density at 450 nm was measured using a microplate reader (Bio-Rad, Hercules, CA, USA) to evaluate the effect of various H₂O₂ concentrations and exposure times on cell viability.
2.4. ELISA Assay
Competitive ELISA kits were used to detect levels of superoxide dismutase (SOD), glutathione (GSH), and catalase (CAT) in granulosa cells (Lengton Bioscience Co., Shanghai, China). After treatment, the cells were collected and prepared into a PBS-diluted cell suspension at a concentration of 1×10⁶ cells/ml. The cells were lysed through repeated freeze-thaw cycles to release intracellular components. The suspension was then centrifuged for 15 minutes, and the supernatant was collected. The assay was performed according to the kit instructions. Absorbance was read at 450 nm using a microplate reader, and the results were calculated using ELISAcale software, with the data fitted to a four-parameter logistic curve.
2.5. RNA Isolation and Quantitative Reverse Transcription PCR (qRT-PCR) Analysis
Total RNA was extracted from follicular granulosa cells using Trizol reagent (Biosharp, Anhui, China). The isolated RNA was subsequently reverse transcribed into cDNA in a 20 µL reaction volume using the ToloScript All-in-one RT EasyMix for qPCR kit (Tolobio, Shanghai, China). The synthesized cDNA was then amplified in a 20 µL reaction volume with SYBR Green qPCR Mix (Biosharp, Anhui, China). Real-time quantitative PCR (qRT-PCR) was employed to assess the relative mRNA expression levels of target genes. Primers for the target genes were designed using Primer Premier 5 software and synthesized by Sangon Biotech (Shanghai, China). β-actin served as the internal reference gene, and the primer sequences are listed in Table 1. The amplification protocol included an initial denaturation at 95°C for 10 minutes, followed by 40 cycles of 95°C for 15 seconds and annealing at 60°C for 60 seconds. Both β-actin and the target genes were amplified in the same reaction for each sample, with each reaction performed in triplicate wells, and each sample was analyzed in two independent experiments. Threshold cycle (Ct) values for target genes were adjusted to the Ct of the housekeeping gene and determined using the 2−(∆Ct sample − ∆Ct control) method [20].
2.6. Western Blotting
After treatment, cells were collected from the culture plates, and the culture medium was discarded. The cells were washed with 1 mL PBS. Subsequently, 200 µL of RIPA lysis buffer containing protease and phosphatase inhibitors was added. Cells were scraped using a cell scraper and transferred to a 1.5 mL centrifuge tube. The lysate was centrifuged at 12,000 rpm for 10 minutes at 4°C, and the supernatant was collected. Protein concentration was determined using a BCA protein assay kit. An appropriate amount of protein sample was mixed with 5× loading buffer and heated at 95°C for 5 minutes to denature the proteins. The denatured protein samples were loaded onto an SDS-PAGE gel for electrophoretic separation. After electrophoresis, proteins were transferred to a PVDF membrane. The membrane was blocked with TBST containing 5% non-fat milk at room temperature for 2 hours. Primary antibodies against P62, LC3-I, LC3-II, and GAPDH were incubated overnight. The membrane was washed with TBST and incubated with secondary antibodies at room temperature for 2 hours. Chemiluminescent substrate was applied to the membrane, and the signal was detected using a multifunctional gel imaging system. Band intensities were analyzed using AlphaEaseFC software, and quantitative analysis was performed by plotting histograms.
2.7. Autophagy Detection
After treatment, cells were harvested using trypsin, centrifuged at 1,200 rpm for 3 minutes, and the supernatant was removed. The cell pellet was then suspended in PBS, washed once, and subjected to another round of centrifugation under identical conditions. The AO staining buffer was prepared according to the manufacturer’s instructions. A 95 µL aliquot of the cell suspension was mixed with 5 µL of AO staining solution, gently mixed, and incubated at 4°C in the dark for 15 minutes. After incubation, cells were washed twice with staining buffer, centrifuged at 1,200 rpm for 3 minutes at 4°C, and resuspended in staining buffer.
2.8. Mitochondrial Membrane Potential Detection
After treatment, cells were collected by trypsinization, centrifuged at 1,200 rpm for 3 minutes, and the supernatant was discarded. The cell pellet was resuspended in PBS, washed once, and centrifuged again under the same conditions. The JC-1 dye was diluted by adding 50 µL of 200× JC-1 stock solution to 8 mL of ultrapure water, mixed thoroughly, and then 2 mL of 5× JC-1 staining buffer was added to prepare the working solution. The cell pellet was resuspended in 0.5 mL of the JC-1 working solution and incubated at 37°C for 20 minutes. After incubation, cells were washed twice with 1× JC-1 staining buffer, centrifuged at 1,200 rpm for 3 minutes at 4°C, and resuspended in 1× JC-1 staining buffer.
2.9. Data Analysis
All data are presented as mean ± standard error (SE). Statistical analyses were performed using SPSS 23.0 software, employing one-way analysis of variance (ANOVA) to assess the significance of differences between groups. All experiments were conducted with at least three biological replicates. Statistical significance is indicated by the following symbols: * p < 0.05, ** p < 0.01.
3. Results
3.1. H2O2-Induced Granulosa Cell Oxidative Damage Model
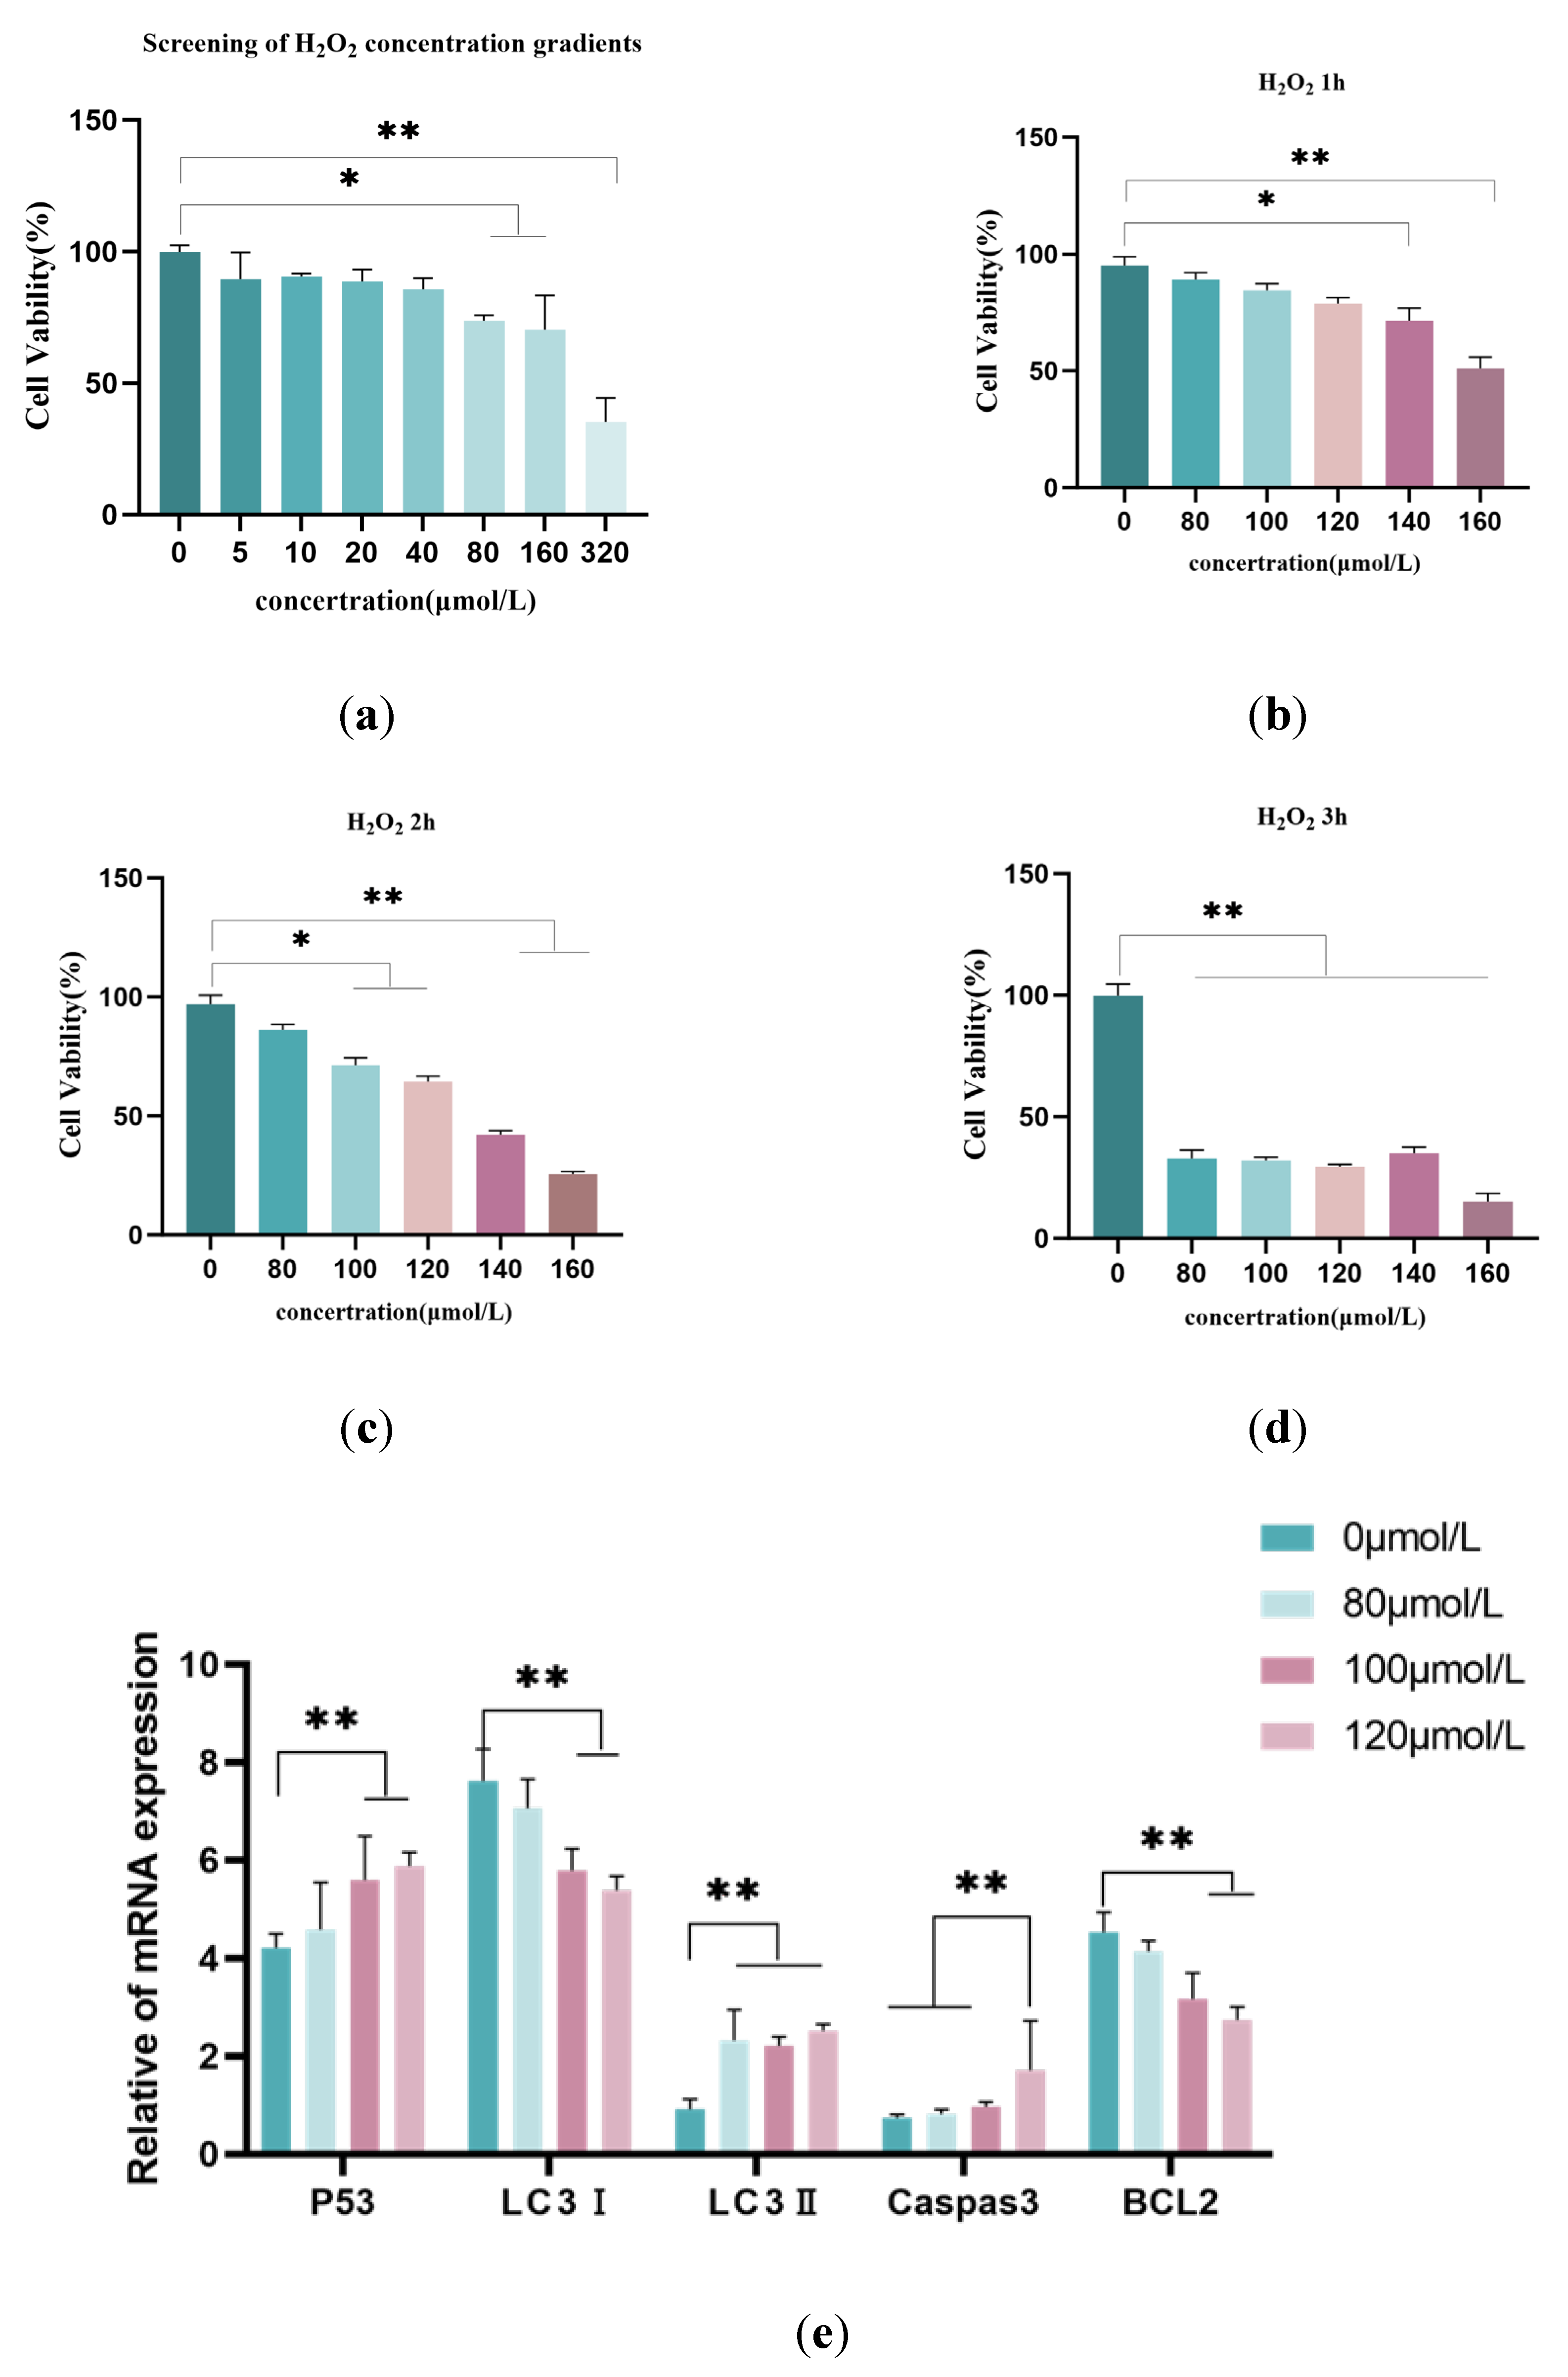
To establish an oxidative damage model, this study used the CCK-8 assay to evaluate follicular granulosa cell viability and qRT-PCR to measure autophagy- and apoptosis-related gene expression. Results showed that 80–160 μmol/L H₂O₂ significantly reduced cell viability (p < 0.05), with 320 μmol/L causing a severe decline (p < 0.01, survival <50%). After 2 hours, 100–120 μmol/L H₂O₂ significantly decreased viability (p <0.05), while 140–160 μmol/L caused a more pronounced reduction (p < 0.01, survival <50%). qRT-PCR revealed that 100 μmol/L H₂O₂ substantially upregulated p53 and LC3-II (p < 0.05) and downregulated LC3-Ⅰ (p < 0.05), with no significant changes in Caspase-3 or BCL-2 (p > 0.05). Thus, 100 μmol/L H₂O₂ for 2 hours was selected as the optimal condition for the oxidative damage model.
Figure 1.
Establishment of the H2O2-induced Granulosa Cell Oxidative Damage Model. Screening of the optimal H2O2 treatment concentration and time for inducing oxidative damage in granulosa cells. Granulosa cells were cultured with different concentrations of H2O2 gradients. Panels (a-d) show the results from the CCK-8 assay, with cell viability measured by absorbance at 450 nm using a microplate reader. Cell viability was calculated using the formula, and panel (e) shows the expression levels of autophagy-related factors (P53, LC3-Ⅰ, LC3-II) and apoptosis-related factors (Caspase-3 and anti-apoptotic BCL-2) by quantitative PCR at different H2O2 concentrations. The 0 μmol/L H2O2 treatment group was used as the blank control. β-actin was used as the internal reference gene. The experiments were repeated three times, and the data are expressed as mean ± S.E; n = 3. * indicates p < 0.05 compared to the control group, ** indicates p < 0.01 compared to the control group.
3.2. Screening of the Optimal Melatonin Concentration for Relieving Oxidative Damage in Model Cells
To determine the optimal melatonin (MT) concentration for alleviating oxidative damage in the oxidative damage model cells, the 100 μmol/L H2O2-treated cells were used as the control group. qRT-PCR was used to detect the expression of autophagy-related factors (P53, LC3-Ⅰ, LC3-Ⅱ), and an ELISA kit was used to measure the changes in catalase (CAT) levels in the cells. As shown in Figure 2a, the 50 μmol/L MT treatment group showed no significant differences in autophagy-related factors (P53, LC3-Ⅰ, LC3-Ⅱ) compared to the model group (p > 0.05). The 100 μmol/L and 200 μmol/L MT groups markedly downregulated Caspase-3 (p < 0.01), while both 200 μmol/L and 400 μmol/L MT treatment groups significantly upregulated the anti-apoptotic factor BCL-2 (p < 0.01). Autophagy-related factors were noticeably downregulated in the 100 μmol/L, 200 μmol/L, and 400 μmol/L MT treatment groups. Figure 2b, The ELISA results indicated that the intracellular CAT content was remarkably reduced in the 200 μmol/L and 400 μmol/L MT groups compared to the model group (p < 0.05). Therefore, the 200 μmol/L MT treatment group was chosen as the optimal melatonin concentration for further experiments.
3.3. Melatonin Alleviates the Initiation of Autophagy in Granulosa Cells
To further explore the potential regulatory role of melatonin, we investigated whether melatonin could mitigate the onset of autophagy in granulosa cells under oxidative damage. Cells were subjected to repeated freeze-thaw cycles to induce cell lysis, and oxidative damage markers in granulosa cells were detected using an ELISA kit. The results, as shown in Figure 3a–c, indicate that H2O2 treatment significantly reduced the levels of SOD and CAT, and GSH was markedly lower than in the control group. In contrast, H2O2 and MT co-treatment group increased the levels of SOD, CAT, and GSH. Western blotting results Figure 3d–h showed that LC3-II expression was decreased, while P62 expression increased, and the conversion of LC3-I to LC3-II was suppressed in the H2O2-treated group. However, H2O2 and MT co-treatment group reversed these changes in the relative protein levels. These findings suggest that melatonin can alleviate the initiation of autophagy in granulosa cells.
3.4. Melatonin Alleviates Mitochondrial Autophagy-Induced Oxidative Damage in Granulosa Cells (GCs)
To investigate whether melatonin can mitigate mitochondrial autophagy in granulosa cells (GCs) under oxidative damage. As shown in Figure 4a–c, H₂O₂ treatment substantially enhanced fluorescence intensity in the PC5.5 channel compared to the control group, whereas melatonin treatment Notably decreased (p < 0.01) fluorescence intensity in the same channel. Figure 4h, shows that compared to the control group, the mitochondrial membrane potential in the H₂O₂-treated group was significantly reduced, and the G/R ratio was Markedly increased (p < 0.01). However, H2O2 and MT co-treatment group Remarkably alleviated mitochondrial depolarization, and the G/R ratio was significantly decreased compared to the H₂O₂ group (p < 0.01). These results suggest that melatonin can alleviate mitochondrial dysfunction induced by H₂O₂.
4. Discussion
Oxidative damage plays a role in physiological processes and disease onset [21]. H2O2 easily penetrates cell membranes, causing oxidative damage and is widely used in models [22,23]. Excessive ROS during follicle development reduces follicle numbers and reproductive performance in poultry [24]. H2O2 concentrations and exposure times vary by cell type and culture conditions. Zheng et al. established an oxidative damage model in goose granulosa cells using 250 μmol/L H2O2 for 6 hours [7]. ROS accumulation induced apoptosis, blocked autophagic flux, and led to follicular atresia. The aim of this study was to induce autophagy while maintaining cell viability. Minimal effects were observed with low H2O2 (50 μmol/L), while higher concentrations (150–250 μmol/L) led to significant downregulation of BCL-2, upregulation of Caspase-3, and a reduction in viability below 50%, causing irreversible cell death. Based on viability and autophagy factor expression, 100 μmol/L H2O2 for 2 hours was selected as the optimal condition for oxidative damage modeling in chicken granulosa cells.
Changes in the antioxidant system reflect cellular damage [5,19,25]. Mitochondrial H2O2 removal relies on the glutathione peroxidase system (Gpx1, mGpx4) and peroxiredoxins (Prx3, Prx5) [26]. Bai et al. found melatonin inhibits oxidative damage and enhances antioxidant enzyme activity (SOD, CAT, GSH-Px), consistent with this study [27]. H2O2 treatment significantly reduced SOD, CAT activity, and GSH levels in GCs, indicating oxidative damage. However, these parameters were restored by melatonin co-treatment, suggesting that oxidative damage induced by H2O2 is counteracted by melatonin through the enhancement of cellular antioxidant capacity.
Poultry egg production depends on follicle numbers, with follicular atresia primarily caused by granulosa cell (GC) apoptosis [28]. Autophagy supports follicular development but, when excessive, induces cell death and atresia. Increased GC autophagy is observed during follicular atresia in mice and geese [29,30,31]. As a key metabolic process, autophagy prevents damage by degrading waste but can also cause cell death if excessive [32]. The results showed that the number of autophagic vacuoles in GCs was significantly increased by H2O2 treatment, whereas the number of autophagic vacuoles was significantly reduced by the addition of melatonin, indicating that H2O2-induced autophagy was partially suppressed by melatonin.
Additionally, P62, a key autophagy receptor, recognizes phosphorylated polyubiquitin chains on mitochondrial proteins and binds LC3-II to initiate autophagosome formation [33,34]. P62 accumulates when autophagic flux is inhibited and decreases when activated. Wang et al. [35] found bovine GC autophagy marked by increased Beclin-1 and LC3-II/LC3-I levels and decreased p62. This result demonstrated that p62 was reduced by H2O2, while the LC3-II/LC3-I ratio was increased, indicating that autophagy was induced. These effects were reversed by melatonin, suggesting that the excessive autophagy induced by H2O2 is mitigated. Autophagy includes both selective and non-selective processes.
Mitochondria, the main ROS source, play a key role in oxidative damage, autophagy, and apoptosis [36,37]. Mitochondrial autophagy selectively removes damaged mitochondria [38], and its extent is linked to the reproductive decline in laying hens [39,40]. Excessive ROS damages the mitochondrial membrane, reducing membrane potential (MMP, ΔΨm), causing depolarization, increasing permeability, and disrupting redox balance [41,42]. MMP changes signal early mitochondrial dysfunction [43].JC-1 staining and flow cytometry showed that an increase in green fluorescence in GCs was induced by H2O2, indicating mitochondrial damage, while depolarization was alleviated by melatonin, protecting GCs through the inhibition of mitochondrial autophagy. A foundation for exploring the role of melatonin in mitochondrial regulation is provided by this study.
5. Conclusions
It was demonstrated in this study that oxidative damage induced by hydrogen peroxide in chicken follicular granulosa cells is alleviated by melatonin. This effect is achieved through the mitigation of intracellular antioxidant enzyme activities (SOD, CAT, GSH), a reduction in the LC3-II/LC3-I ratio, an increase in P62 protein expression, a decrease in the formation of intracellular autophagic vesicles, and an enhancement of mitochondrial membrane potential.
Author Contributions
Conceptualization, S.W. and R.X.; methodology, S.W., Y.O. and S.C.; data curation and formal analysis, S.W., X.S. and N.Q.; writing the original draft, S.W., Y.O. and S.C.; writing, reviewing, and editing the manuscript, R.X. and S.L.; funding acquisition and supervision, R.X. All authors have read and agreed to the published version of the manuscript.
Funding
This work was supported by grants from the National Natural Science Foundation of China (Grant No. 32172714 and 31902145); the China Agriculture Research System of MOF and MARA (Grant No. CARS-41) and the Project of Science and Technology Development Plan of Jilin Province (Grant No. 20220101306JC).
Institutional Review Board Statement
All animal care and handling procedures used in this study were approved by the Institutional Animal Care and Use Committee of Jilin Agricultural University [Approval No. GR (J) 19-89].
Informed Consent Statement
Not applicable.
Data Availability Statement
The original contributions presented in this study are included in this article/the Supplementary Materials. Further inquiries can be directed to the corresponding authors.
Conflicts of Interest
The authors declare no conflicts of interest.
Abbreviations
| H₂O₂ | Hydrogen Peroxide |
| ΔΨm | Mitochondrial Membrane Potential |
| LC3-I | Microtubule-associated Protein 1A/1B-light Chain 3-I |
| LC3-II | Microtubule-associated Protein 1A/1B-light Chain 3-II |
| CAT | Catalase |
| GSH | Glutathione |
| SOD | Superoxide Dismutase |
| MT | Melatonin |
| ROS | Reactive Oxygen Species |
| P62 | Sequestosome 1 |
| GCs | Follicular granulosa cells |
| Ct | Cycle Threshold |
References
- Huang, Y.M.; Shi, Z.D.; Liu, Z.; Liu, Y.; Li, X.W. Endocrine Regulations of Reproductive Seasonality, Follicular Development and Incubation in Magang Geese. Anim Reprod Sci 2008, 104, 344–358. [Google Scholar] [CrossRef] [PubMed]
- Rimon-Dahari, N.; Yerushalmi-Heinemann, L.; Alyagor, L.; Dekel, N. Ovarian Folliculogenesis. In Molecular Mechanisms of Cell Differentiation in Gonad Development; Piprek, R.P., Ed.; Springer International Publishing: Cham, 2016; pp. 167–190. ISBN 978-3-319-31973-5. [Google Scholar]
- Johnson, A.L.; Bridgham, J.T.; Witty, J.P.; Tilly, J.L. Expression of Bcl-2 and Nr-13 in Hen Ovarian Follicles during Development1. Biology of Reproduction 1997, 57, 1096–1103. [Google Scholar] [CrossRef] [PubMed]
- Shen, M.; Jiang, Y.; Guan, Z.; Cao, Y.; Li, L.; Liu, H.; Sun, S.-C. Protective Mechanism of FSH against Oxidative Damage in Mouse Ovarian Granulosa Cells by Repressing Autophagy. Autophagy 2017, 13, 1364–1385. [Google Scholar] [CrossRef]
- Liu, S.; Jia, Y.; Meng, S.; Luo, Y.; Yang, Q.; Pan, Z. Mechanisms of and Potential Medications for Oxidative Stress in Ovarian Granulosa Cells: A Review. IJMS 2023, 24, 9205. [Google Scholar] [CrossRef]
- Goud, A.P.; Goud, P.T.; Diamond, M.P.; Gonik, B.; Abu-Soud, H.M. Reactive Oxygen Species and Oocyte Aging: Role of Superoxide, Hydrogen Peroxide, and Hypochlorous Acid. Free Radical Biology and Medicine 2008, 44, 1295–1304. [Google Scholar] [CrossRef]
- Zheng, Y.; Qiu, Y.; Wang, Q.; Gao, M.; Cao, Z.; Luan, X. ADPN Regulates Oxidative Stress-Induced Follicular Atresia in Geese by Modulating Granulosa Cell Apoptosis and Autophagy. International Journal of Molecular Sciences 2024, 25, 5400. [Google Scholar] [CrossRef]
- Zhu, M.; Miao, S.; Zhou, W.; Elnesr, S.S.; Dong, X.; Zou, X. MAPK, AKT/FoxO3a and mTOR Pathways Are Involved in Cadmium Regulating the Cell Cycle, Proliferation and Apoptosis of Chicken Follicular Granulosa Cells. Ecotoxicology and Environmental Safety 2021, 214, 112091. [Google Scholar] [CrossRef] [PubMed]
- Zhang, G.-M.; An, S.-Y.; El-Samahy, M.A.; Zhang, Y.-L.; Wan, Y.-J.; Wang, Z.-Y.; Xiao, S.-H.; Meng, F.-X.; Wang, F.; Lei, Z.-H. Suppression of miR-1197-3p Attenuates H2O2-Induced Apoptosis of Goat Luteinized Granulosa Cells via Targeting PPARGC1A. Theriogenology 2019, 132, 72–82. [Google Scholar] [CrossRef]
- Luo, J.; Shi, R. Acrolein Induces Oxidative Stress in Brain Mitochondria. Neurochemistry International 2005, 46, 243–252. [Google Scholar] [CrossRef]
- Yu, J.; Lou, Y.; He, K.; Yang, S.; Yu, W.; Han, L.; Zhao, A. Goose Broodiness Is Involved in Granulosa Cell Autophagy and Homeostatic Imbalance of Follicular Hormones. Poult Sci 2016, 95, 1156–1164. [Google Scholar] [CrossRef]
- Oroojan, A.A.; Chenani, N.; An’aam, M. Antioxidant Effects of Eugenol on Oxidative Stress Induced by Hydrogen Peroxide in Islets of Langerhans Isolated from Male Mouse. International Journal of Hepatology 2020, 2020, 1–5. [Google Scholar] [CrossRef]
- Tan, D.; Manchester, L.C.; Terron, M.P.; Flores, L.J.; Reiter, R.J. One Molecule, Many Derivatives: A Never-ending Interaction of Melatonin with Reactive Oxygen and Nitrogen Species? Journal of Pineal Research 2007, 42, 28–42. [Google Scholar] [CrossRef] [PubMed]
- Talpur, H.S.; Chandio, I.B.; Brohi, R.D.; Worku, T.; Rehman, Z.; Bhattarai, D.; Ullah, F.; JiaJia, L.; Yang, L. Research Progress on the Role of Melatonin and Its Receptors in Animal Reproduction: A Comprehensive Review. Reprod Domest Anim 2018, 53, 831–849. [Google Scholar] [CrossRef] [PubMed]
- Xu, G.; Zhao, J.; Liu, H.; Wang, J.; Lu, W. Melatonin Inhibits Apoptosis and Oxidative Stress of Mouse Leydig Cells via a SIRT1-Dependent Mechanism. Molecules 2019, 24, 3084. [Google Scholar] [CrossRef] [PubMed]
- Liu, D.; Ma, Z.; Di, S.; Yang, Y.; Yang, J.; Xu, L.; Reiter, R.J.; Qiao, S.; Yuan, J. AMPK/PGC1α Activation by Melatonin Attenuates Acute Doxorubicin Cardiotoxicity via Alleviating Mitochondrial Oxidative Damage and Apoptosis. Free Radical Biology and Medicine 2018, 129, 59–72. [Google Scholar] [CrossRef]
- Leon, J.; Acuña-Castroviejo, D.; Sainz, R.M.; Mayo, J.C.; Tan, D.-X.; Reiter, R.J. Melatonin and Mitochondrial Function. Life Sci 2004, 75, 765–790. [Google Scholar] [CrossRef]
- Xu, G.; Dong, Y.; Wang, Z.; Ding, H.; Wang, J.; Zhao, J.; Liu, H.; Lv, W. Melatonin Attenuates Oxidative Stress-Induced Apoptosis of Bovine Ovarian Granulosa Cells by Promoting Mitophagy via SIRT1/FoxO1 Signaling Pathway. IJMS 2023, 24, 12854. [Google Scholar] [CrossRef]
- Wang, L.; Tang, J.; Wang, L.; Tan, F.; Song, H.; Zhou, J.; Li, F. Oxidative Stress in Oocyte Aging and Female Reproduction. Journal of Cellular Physiology 2021, 236, 7966–7983. [Google Scholar] [CrossRef]
- Talpur, H.S.; Chandio, I.B.; Brohi, R.D.; Worku, T.; Rehman, Z.; Bhattarai, D.; Ullah, F.; JiaJia, L.; Yang, L. Research Progress on the Role of Melatonin and Its Receptors in Animal Reproduction: A Comprehensive Review. Reprod Domest Anim 2018, 53, 831–849. [Google Scholar] [CrossRef]
- Li, J.; Pan, L.; Pan, W.; Li, N.; Tang, B. Recent Progress of Oxidative Stress Associated Biomarker Detection. Chem. Commun. 2023, 59, 7361–7374. [Google Scholar] [CrossRef]
- Kaczara, P.; Sarna, T.; Burke, J.M. Dynamics of H2O2 Availability to ARPE-19 Cultures in Models of Oxidative Stress. Free Radical Biology and Medicine 2010, 48, 1064–1070. [Google Scholar] [CrossRef]
- Tao, X.; Zhang, X.; Ge, S.-Q.; Zhang, E.-H.; Zhang, B. Expression of SIRT1 in the Ovaries of Rats with Polycystic Ovary Syndrome before and after Therapeutic Intervention with Exenatide. Int J Clin Exp Pathol 2015, 8, 8276–8283. [Google Scholar]
- Devine, P.J.; Perreault, S.D.; Luderer, U. Roles of Reactive Oxygen Species and Antioxidants in Ovarian Toxicity. Biol Reprod 2012, 86, 27. [Google Scholar] [CrossRef]
- Shadel, G.S.; Horvath, T.L. Mitochondrial ROS Signaling in Organismal Homeostasis. Cell 2015, 163, 560–569. [Google Scholar] [CrossRef] [PubMed]
- Ren, X.; Zou, L.; Zhang, X.; Branco, V.; Wang, J.; Carvalho, C.; Holmgren, A.; Lu, J. Redox Signaling Mediated by Thioredoxin and Glutathione Systems in the Central Nervous System. Antioxid Redox Signal 2017, 27, 989–1010. [Google Scholar] [CrossRef] [PubMed]
- Bai, K.; Hao, E.; Huang, C.; Yue, Q.; Wang, D.-H.; Shi, L.; Chen, Y.; Chen, H.; Huang, R. Melatonin Alleviates Ovarian Function Damage and Oxidative Stress Induced by Dexamethasone in the Laying Hens through FOXO1 Signaling Pathway. Poultry Science 2023, 102, 102745. [Google Scholar] [CrossRef] [PubMed]
- Inoue, N.; Matsuda, F.; Goto, Y.; Manabe, N. Role of Cell-Death Ligand-Receptor System of Granulosa Cells in Selective Follicular Atresia in Porcine Ovary. J Reprod Dev 2011, 57, 169–175. [Google Scholar] [CrossRef]
- Martin, D.N.; Baehrecke, E.H. Caspases Function in Autophagic Programmed Cell Death in Drosophila. Development 2004, 131, 275–284. [Google Scholar] [CrossRef]
- Boya, P.; González-Polo, R.-A.; Casares, N.; Perfettini, J.-L.; Dessen, P.; Larochette, N.; Métivier, D.; Meley, D.; Souquere, S.; Yoshimori, T.; et al. Inhibition of Macroautophagy Triggers Apoptosis. Molecular and cellular biology 2005, 25, 1025–1040. [Google Scholar] [CrossRef]
- Escobar, M.L.; Echeverría, O.M.; Ortíz, R.; Vázquez-Nin, G.H. Combined Apoptosis and Autophagy, the Process That Eliminates the Oocytes of Atretic Follicles in Immature Rats. Apoptosis 2008, 13, 1253–1266. [Google Scholar] [CrossRef]
- Zhang, J. Autophagy and Mitophagy in Cellular Damage Control. Redox Biology 2013, 1, 19–23. [Google Scholar] [CrossRef] [PubMed]
- Padman, B.S.; Nguyen, T.N.; Uoselis, L.; Skulsuppaisarn, M.; Nguyen, L.K.; Lazarou, M. LC3/GABARAPs Drive Ubiquitin-Independent Recruitment of Optineurin and NDP52 to Amplify Mitophagy. Nat Commun 2019, 10, 408. [Google Scholar] [CrossRef]
- Deng, D.; Yan, J.; Wu, Y.; Wu, K.; Li, W. Morroniside Suppresses Hydrogen Peroxide-Stimulated Autophagy and Apoptosis in Rat Ovarian Granulosa Cells through the PI3K/AKT/mTOR Pathway. Hum Exp Toxicol 2021, 40, 577–586. [Google Scholar] [CrossRef] [PubMed]
- Wang, Y.; Zhao, Y.; Ling, Z.; Luan, D.; Kang, J.; Dong, X.; Quan, F. HD-sEVs in Bovine Follicular Fluid Regulate Granulosa Cell Apoptosis and Estradiol Secretion through the Autophagy Pathway. Theriogenology 2023, 212, 91–103. [Google Scholar] [CrossRef] [PubMed]
- Spees, J.L.; Olson, S.D.; Whitney, M.J.; Prockop, D.J. Mitochondrial Transfer between Cells Can Rescue Aerobic Respiration. Proc. Natl. Acad. Sci. USA 2006, 103, 1283–1288. [Google Scholar] [CrossRef] [PubMed]
- Kowaltowski, A.J.; de Souza-Pinto, N.C.; Castilho, R.F.; Vercesi, A.E. Mitochondria and Reactive Oxygen Species. Free Radical Biology and Medicine 2009, 47, 333–343. [Google Scholar] [CrossRef]
- Jiang, Y.; Shen, M.; Chen, Y.; Wei, Y.; Tao, J.; Liu, H. Melatonin Represses Mitophagy to Protect Mouse Granulosa Cells from Oxidative Damage. Biomolecules 2021, 11, 968. [Google Scholar] [CrossRef]
- Bai, J.; Wang, X.; Chen, Y.; Yuan, Q.; Yang, Z.; Mi, Y.; Zhang, C. Nobiletin Ameliorates Aging of Chicken Ovarian Prehierarchical Follicles by Suppressing Oxidative Stress and Promoting Autophagy. Cells 2024, 13, 415. [Google Scholar] [CrossRef]
- Liu, X.; Lin, X.; Zhang, S.; Guo, C.; Li, J.; Mi, Y.; Zhang, C. Lycopene Ameliorates Oxidative Stress in the Aging Chicken Ovary via Activation of Nrf2/HO-1 Pathway. Aging (Albany NY) 2018, 10, 2016–2036. [Google Scholar] [CrossRef]
- Kim, H.S.; Kim, Y.J.; Seo, Y.R. An Overview of Carcinogenic Heavy Metal: Molecular Toxicity Mechanism and Prevention. J Cancer Prev 2015, 20, 232–240. [Google Scholar] [CrossRef]
- Wang, J.; Jia, R.; Gong, H.; Celi, P.; Zhuo, Y.; Ding, X.; Bai, S.; Zeng, Q.; Yin, H.; Xu, S.; et al. The Effect of Oxidative Stress on the Chicken Ovary: Involvement of Microbiota and Melatonin Interventions. Antioxidants (Basel) 2021, 10, 1422. [Google Scholar] [CrossRef]
- Yang, F.; Pei, R.; Zhang, Z.; Liao, J.; Yu, W.; Qiao, N.; Han, Q.; Li, Y.; Hu, L.; Guo, J.; et al. Copper Induces Oxidative Stress and Apoptosis through Mitochondria-Mediated Pathway in Chicken Hepatocytes. Toxicology in Vitro 2019, 54, 310–316. [Google Scholar] [CrossRef] [PubMed]
Figure 2.
Screening the Optimal Treatment Concentration for H2O2-Induced Granulosa Cells.(a) Quantitative fluorescence detection of the changes in expression levels of autophagy-related factors (P53, LC3-I, LC3-II), anti-apoptotic factor (BCL-2), and apoptotic factor (Caspase-3), with β-actin as the internal reference gene.(b) Catalase (CAT) content was detected using the ELISA kit. The experiment was repeated three times, and the data are presented as mean ± S.E; n = 3. * indicates a significant difference compared to the control group (p < 0.05), ** indicates a highly significant difference compared to the control group (p < 0.01).
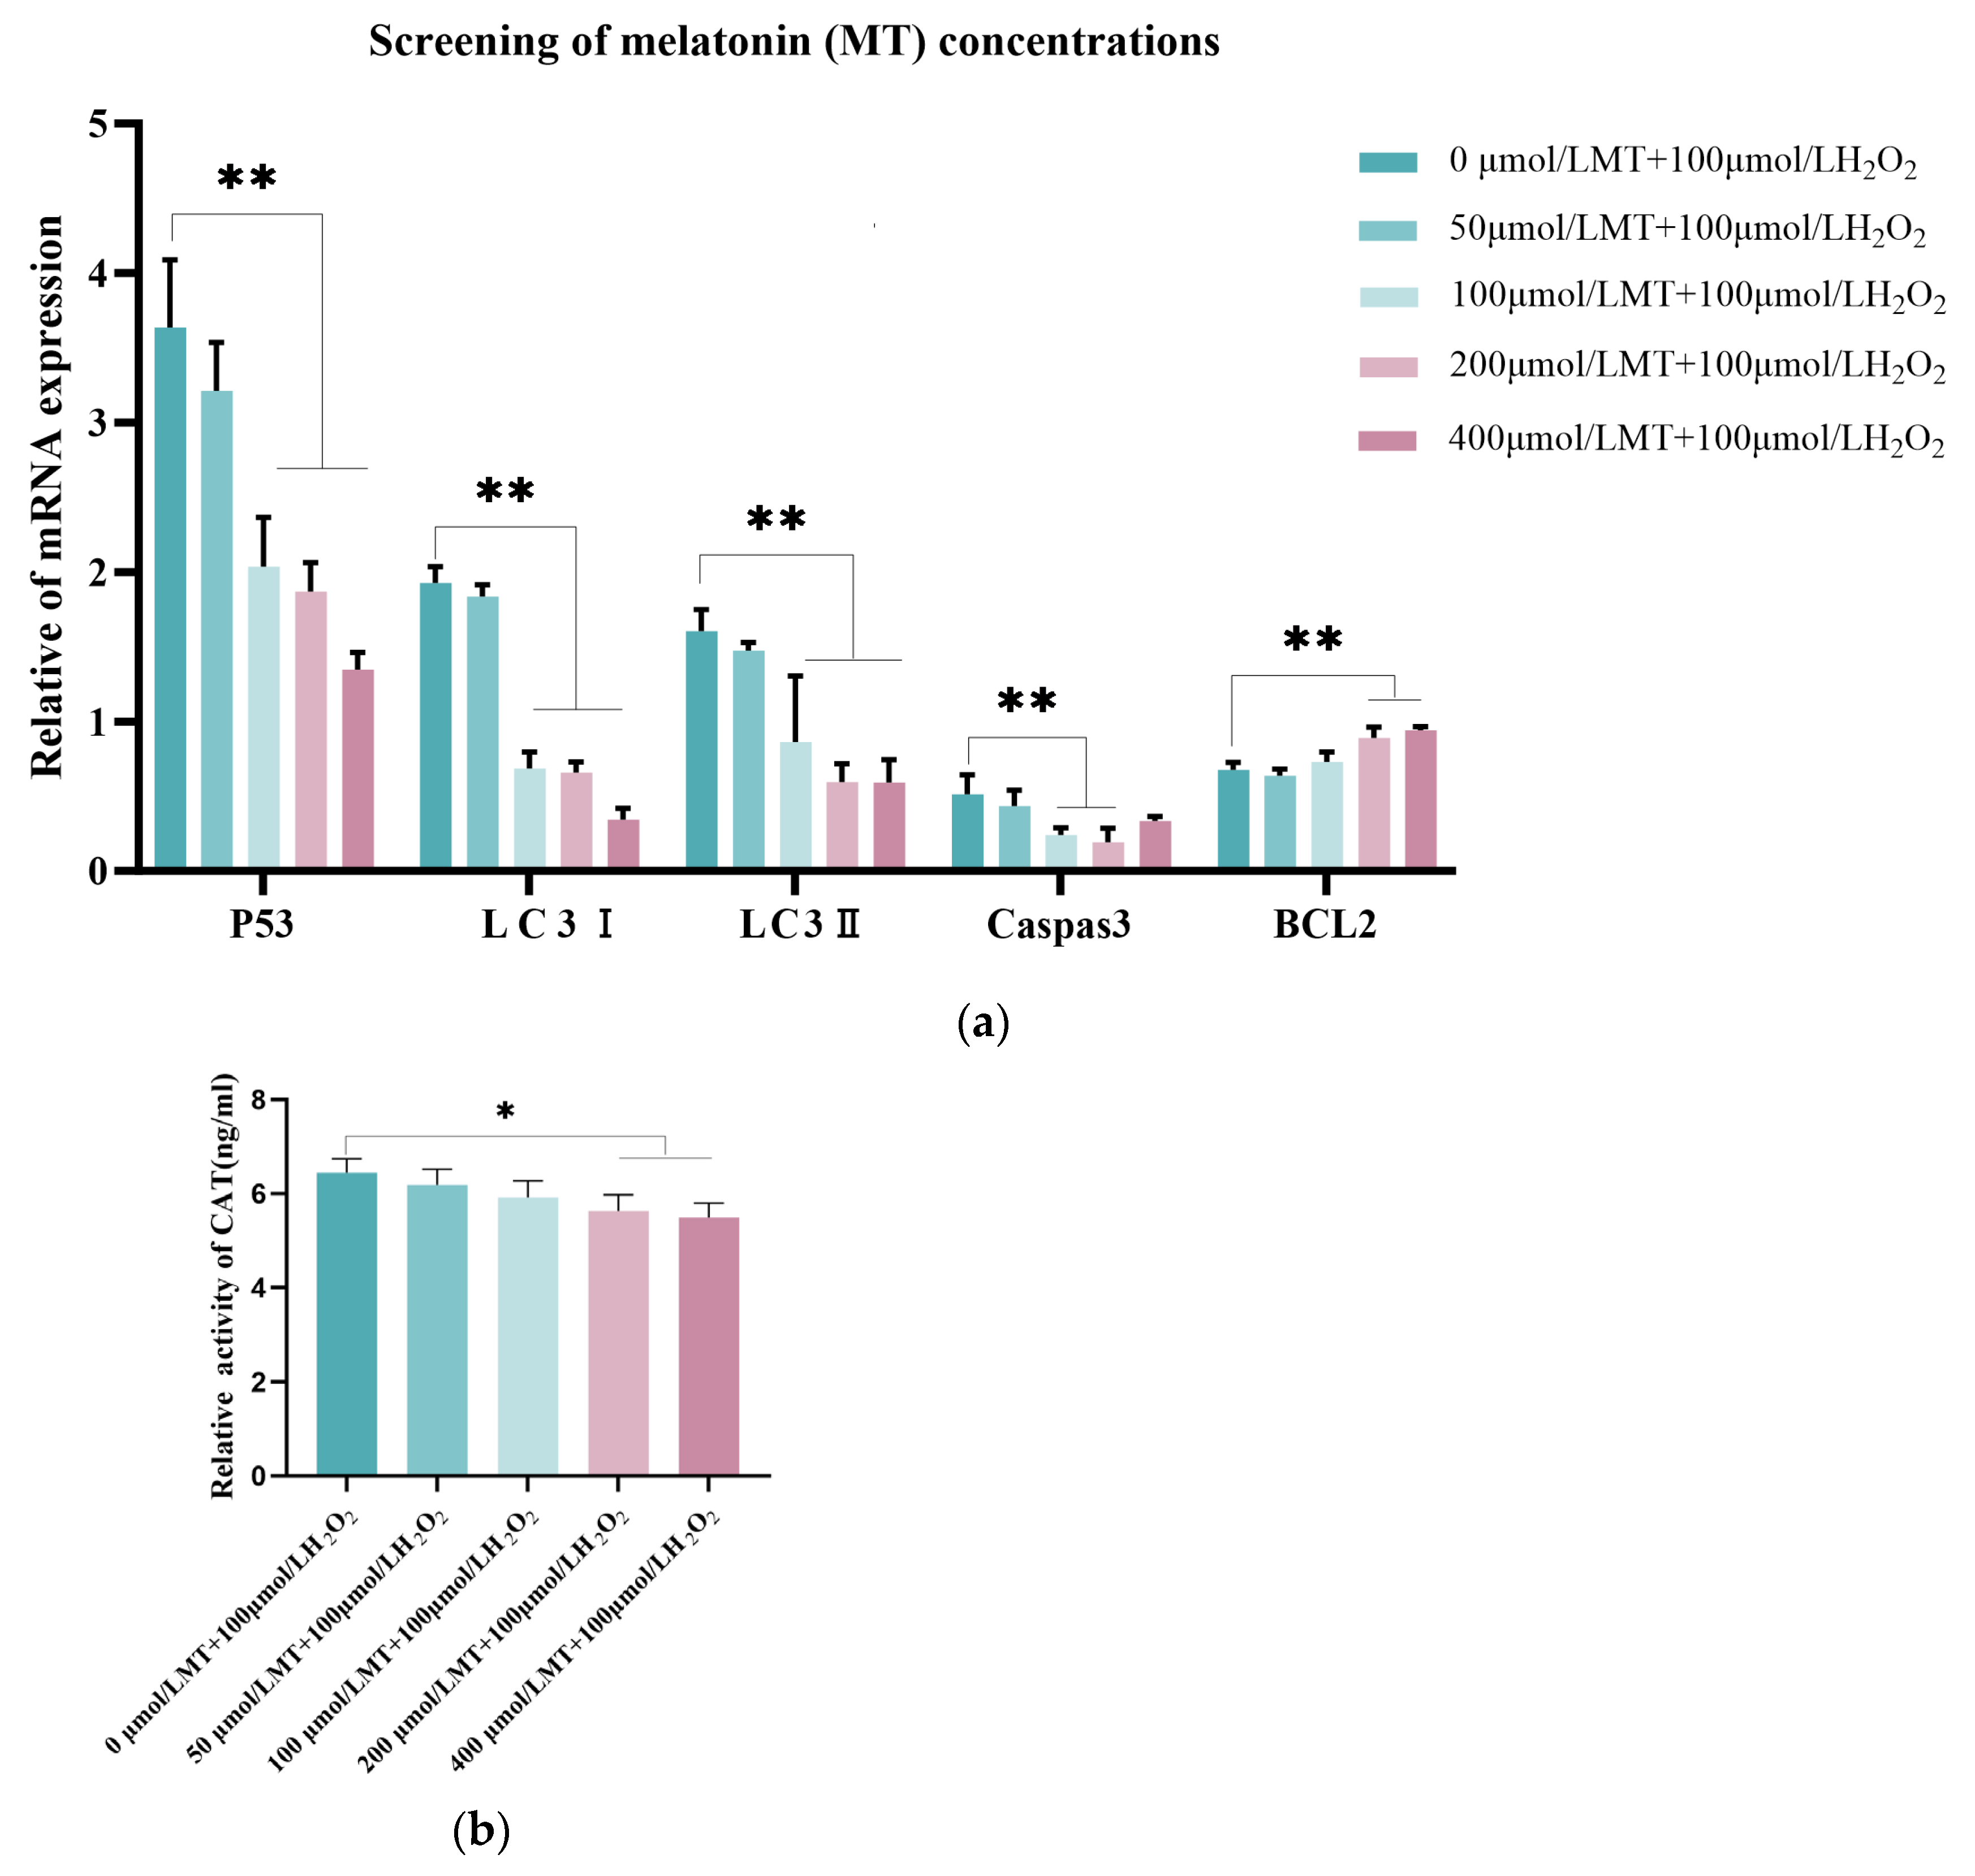
Figure 3.
Melatonin Inhibits Autophagy in Granulosa Cells Under Oxidative damage. Granulosa cells were cultured for 12 hours, followed by treatment with 100 μmol/L H2O2 for 2 hours as the oxidative damage model group. The treatment group received 200 μmol/L MT co-treated with H2O2 for 2 hours, representing the optimal melatonin concentration. (a-c)ELISA was used to measure oxidative damage markers such as CAT, SOD, and GSH, with the blank group serving as the control. The experiment was repeated 3 times. (d-h) Autophagy-related proteins, including P62, LC3-I, and LC3-II, were detected in granulosa cells, with GAPDH serving as the internal reference protein. Data are expressed as the mean ± SE; n = 3. ** indicates a significant difference from the control group (p < 0.01), * indicates a significant difference from the control group (p < 0.05).
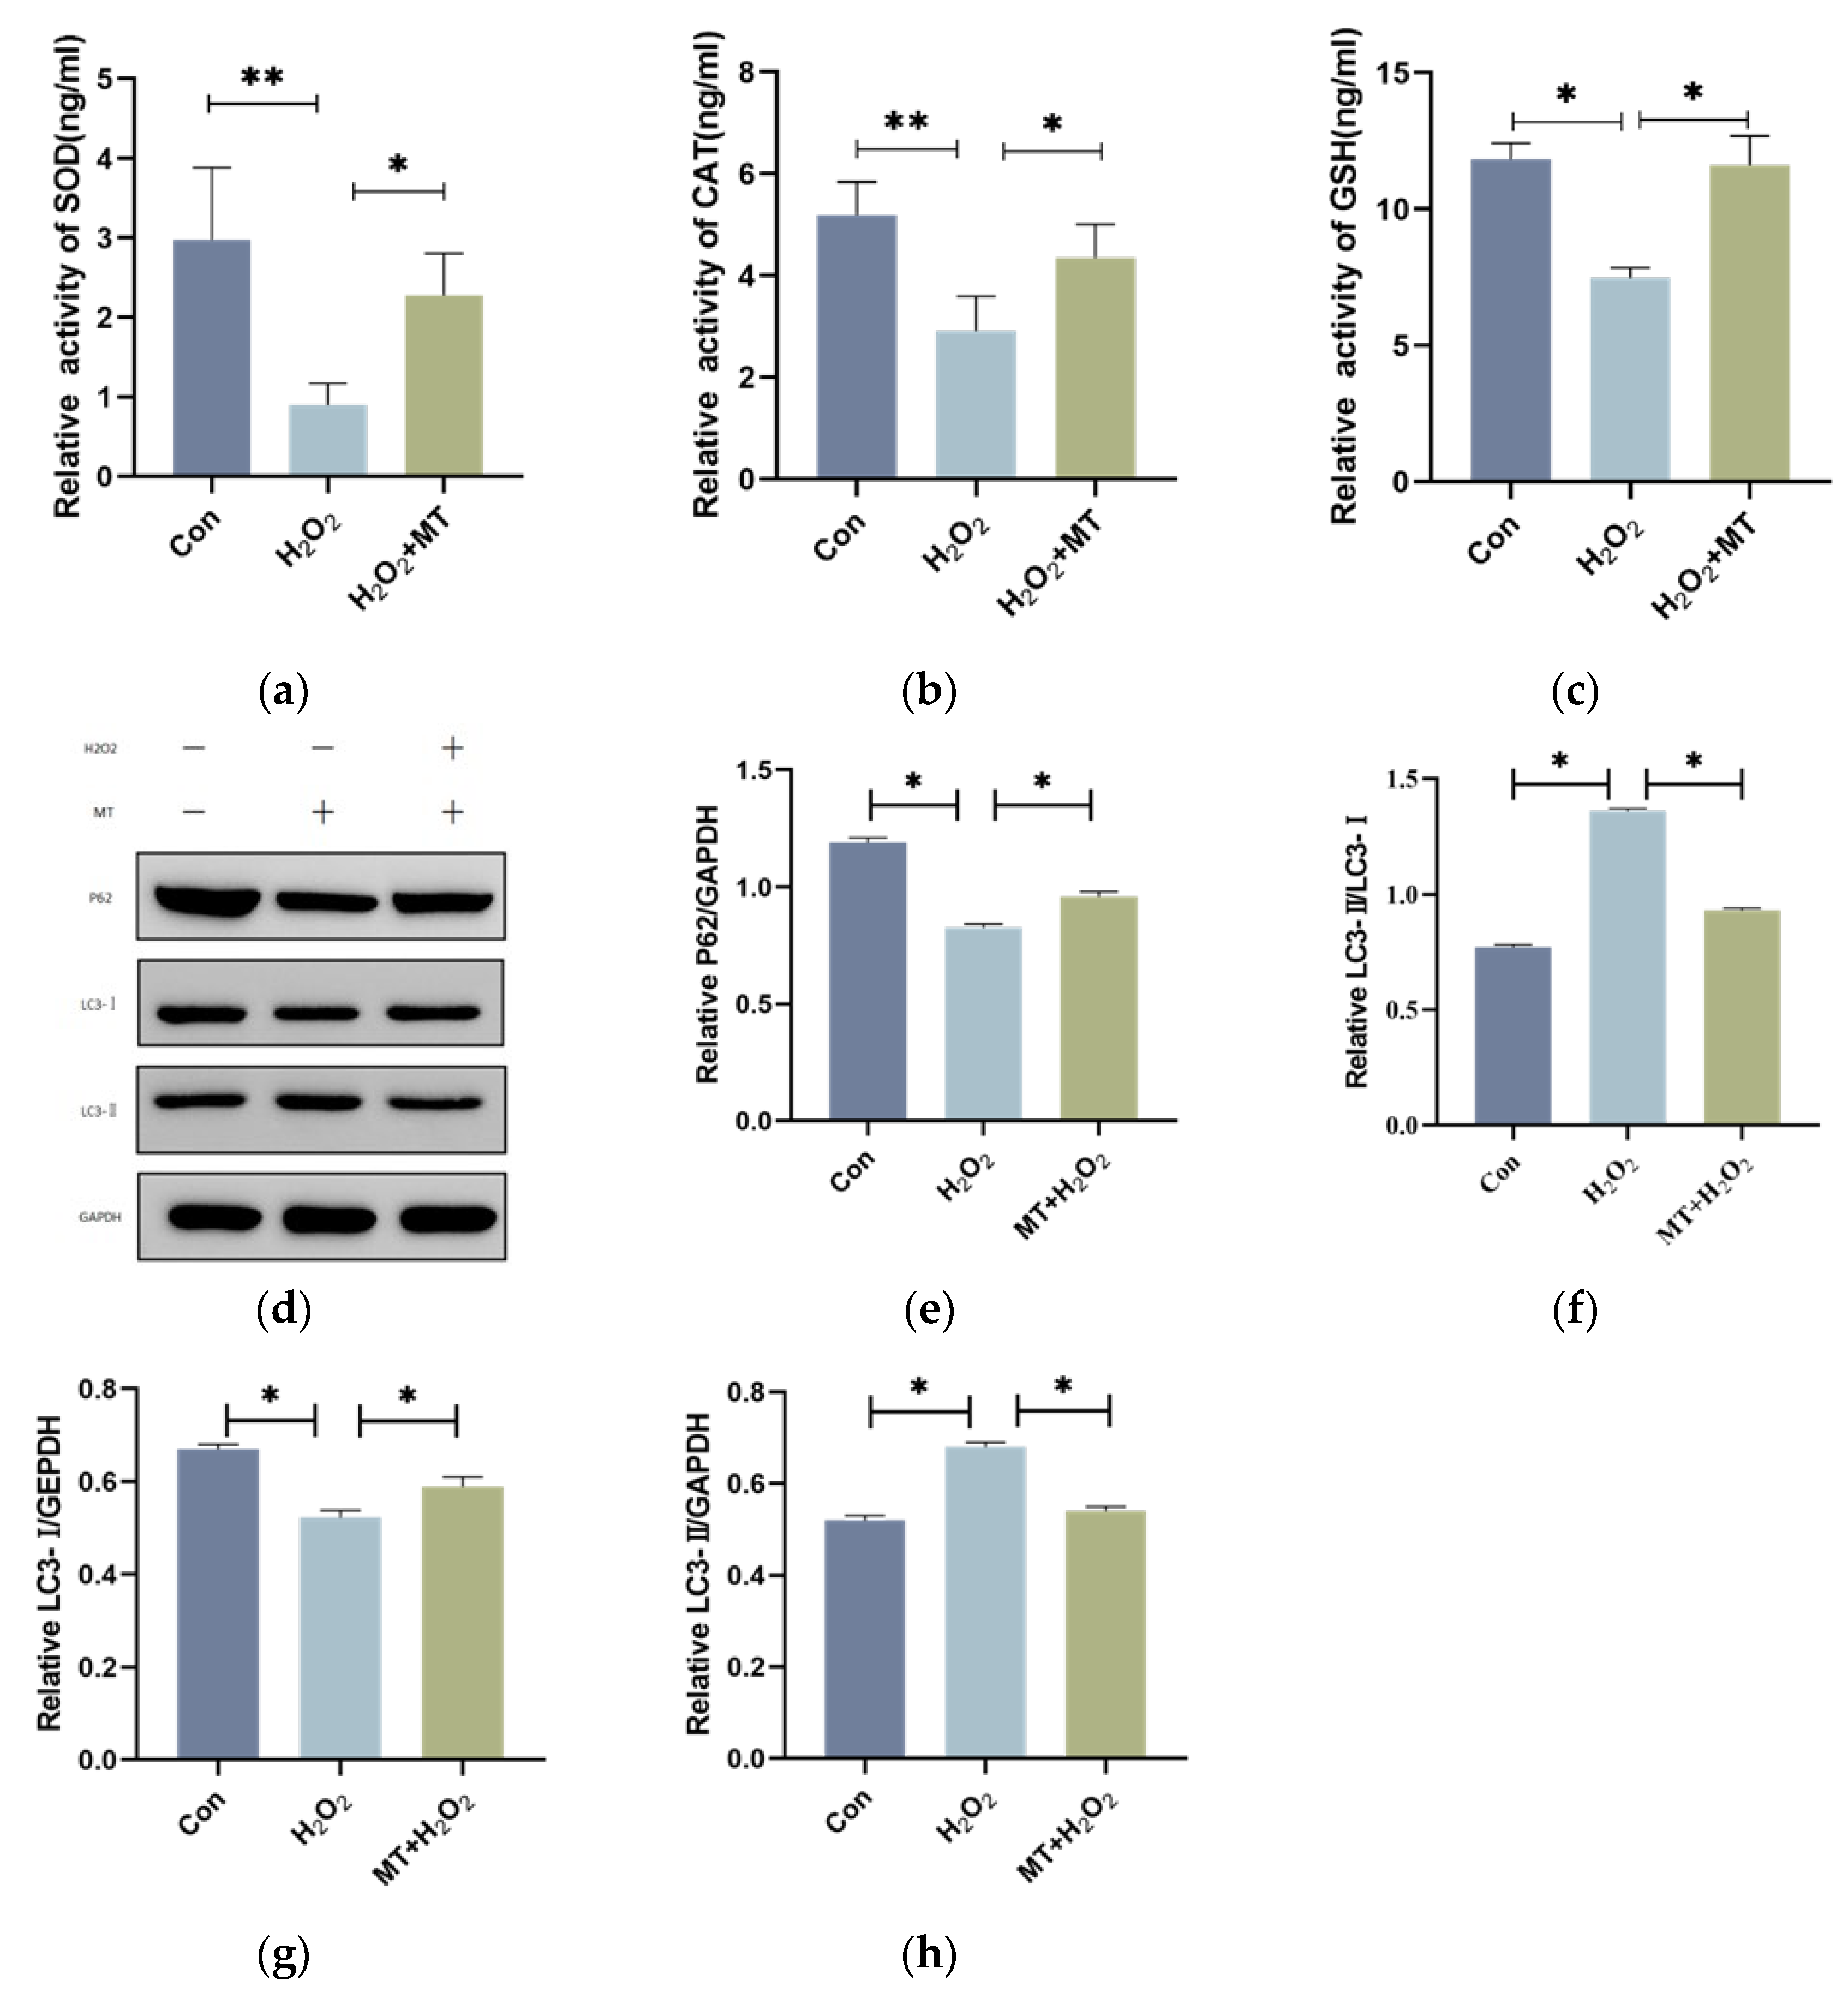
Figure 4.
Melatonin Alleviates H₂O₂-Induced Mitochondrial Damage in Granulosa Cells.Acridine orange staining and flow cytometry were used to detect acidic autophagic vacuoles within the cells. (a-c) The flow cytometry plot shows the X-axis representing the FITC channel signal (green fluorescence) and the PC5.5 channel signal (red fluorescence). The density of the red scatter points reflects the change in the number of autophagic vacuoles in the cells. After H₂O₂ treatment, the fluorescence signal significantly increased, while melatonin treatment reduced the signal intensity. (d) JC-1 staining was used to assess the mitochondrial membrane potential (ΔΨm) by flow cytometry. The X-axis represents the FITC channel (green fluorescence), and the Y-axis represents the PE channel (red fluorescence). (e-g) The autophagy rate is represented by the sum of the values in the Q2-UL and Q2-UR quadrants. (h) The JC-1 red/green fluorescence intensity ratio (G/R) of different treatment groups is shown to reflect changes in mitochondrial membrane potential. The experiment was repeated three times, and data are presented as mean ± SEM. p < 0.01.
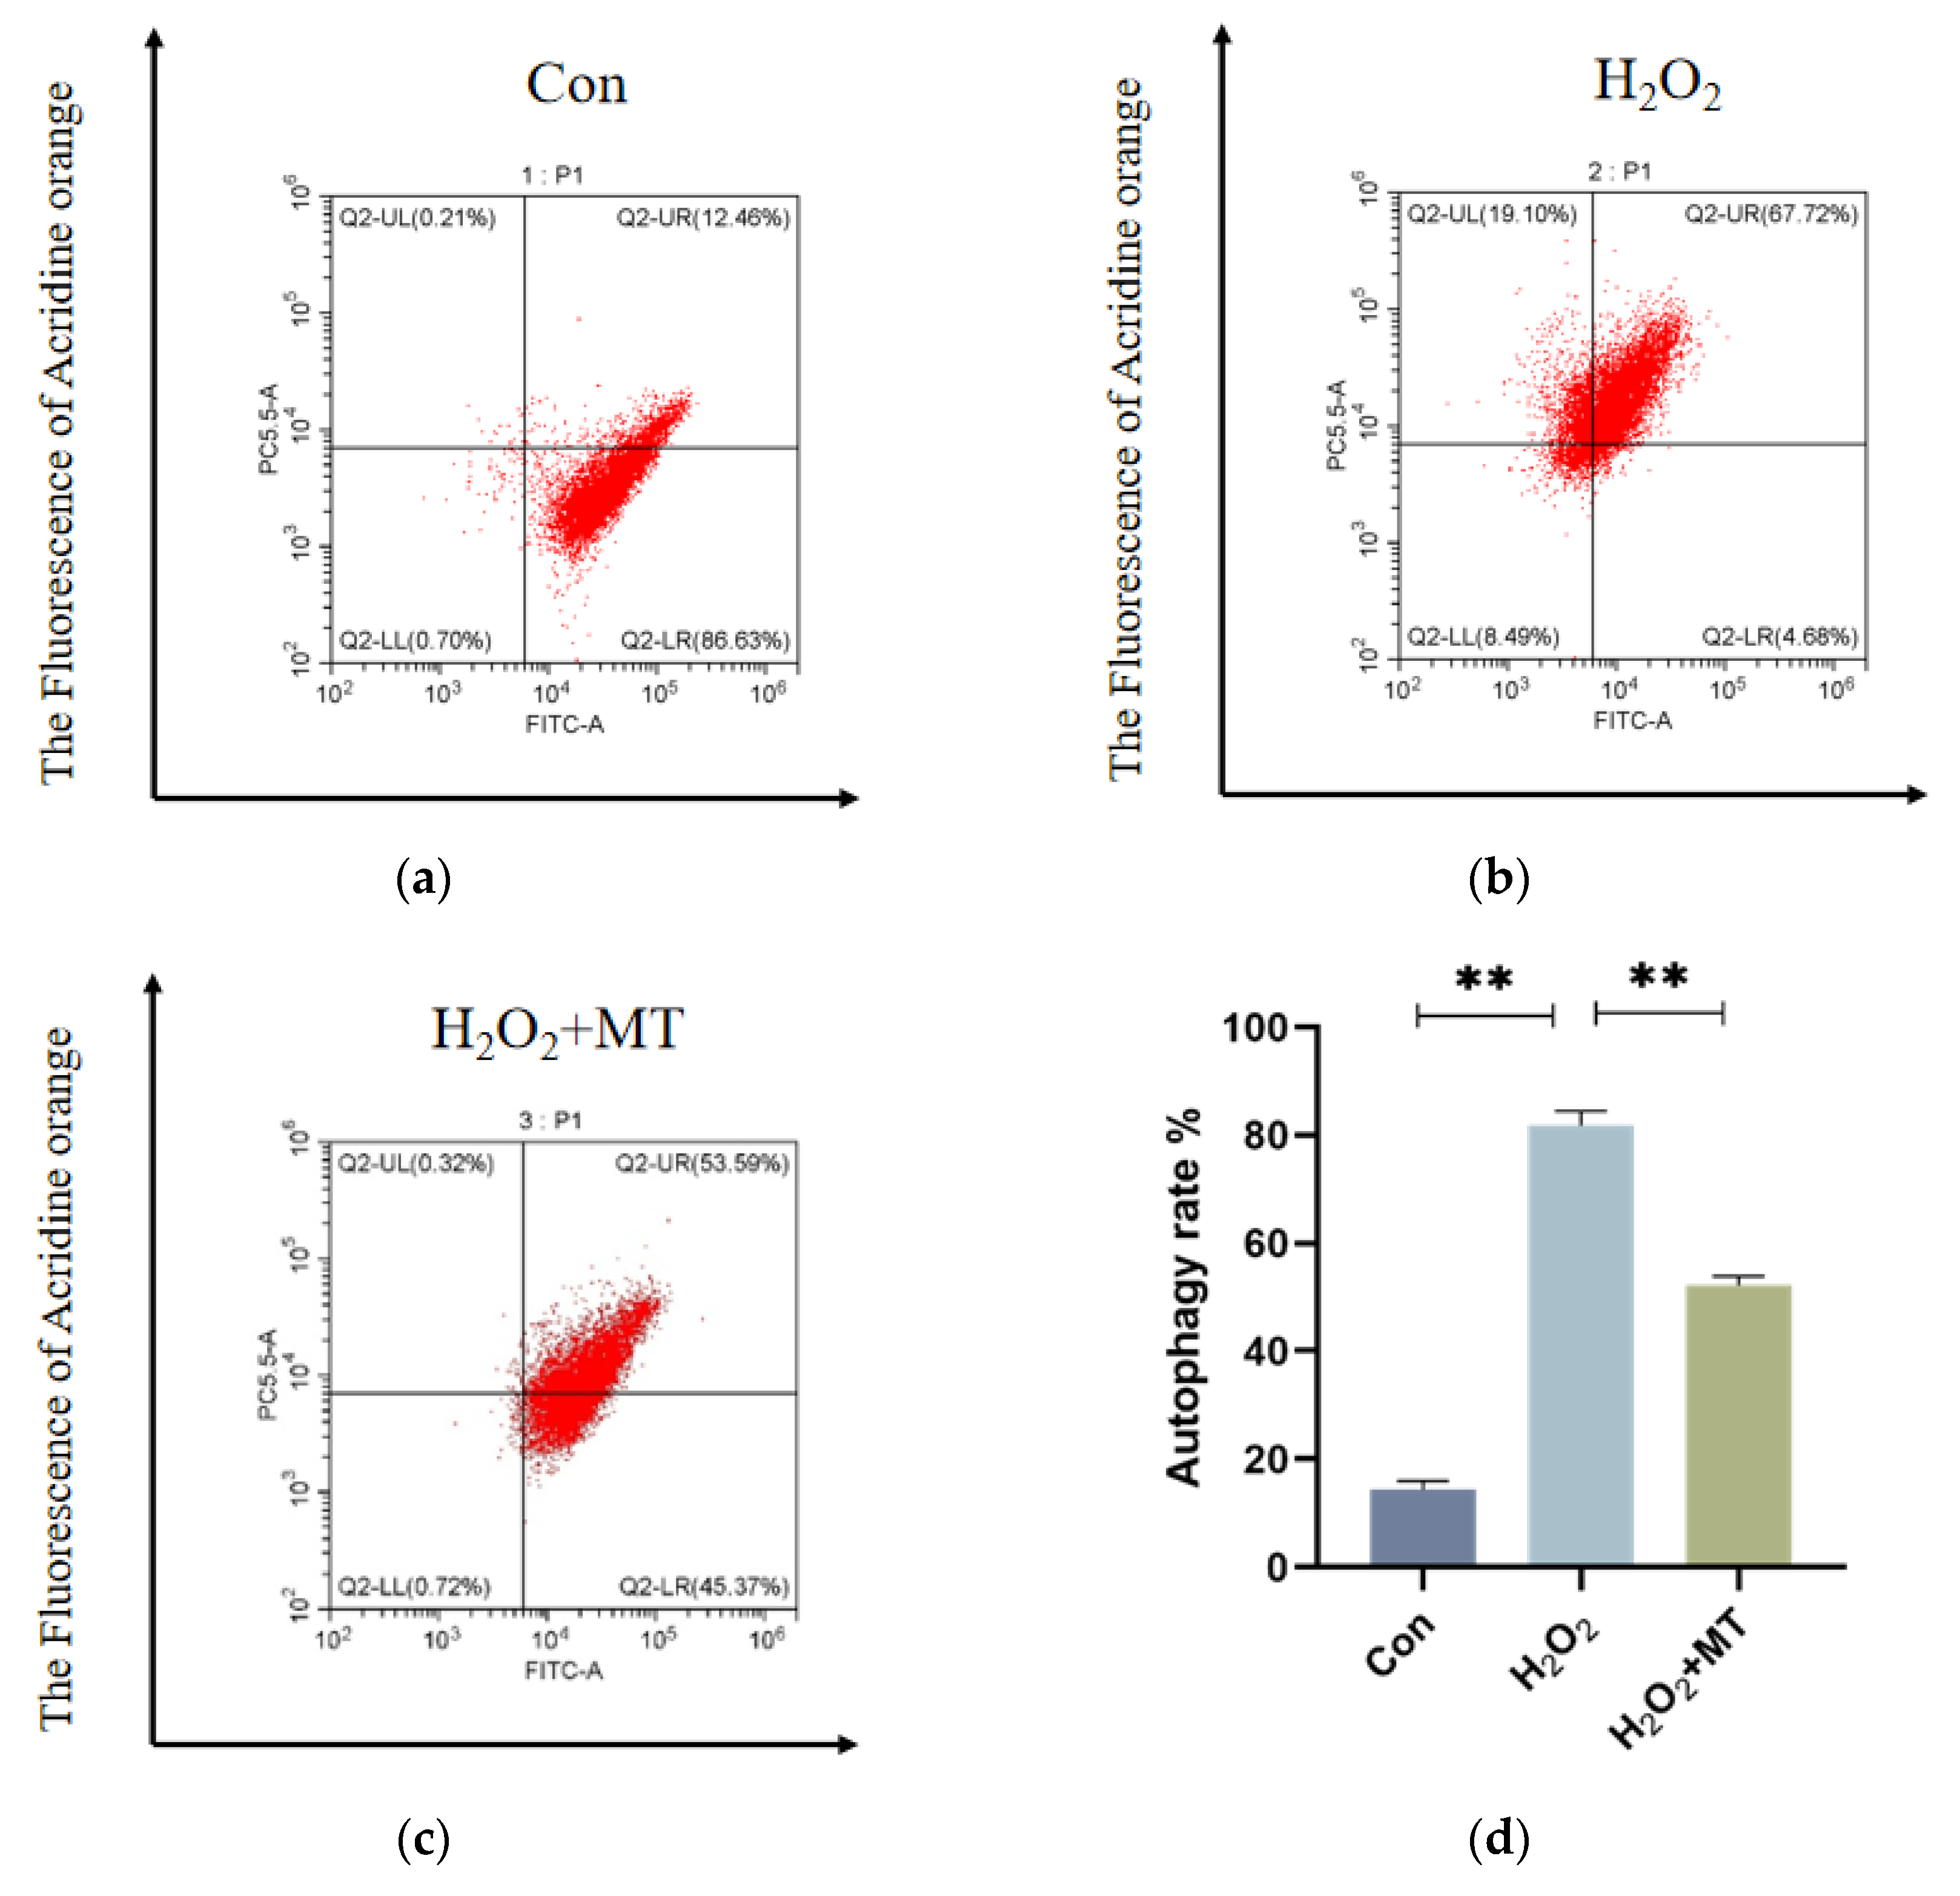
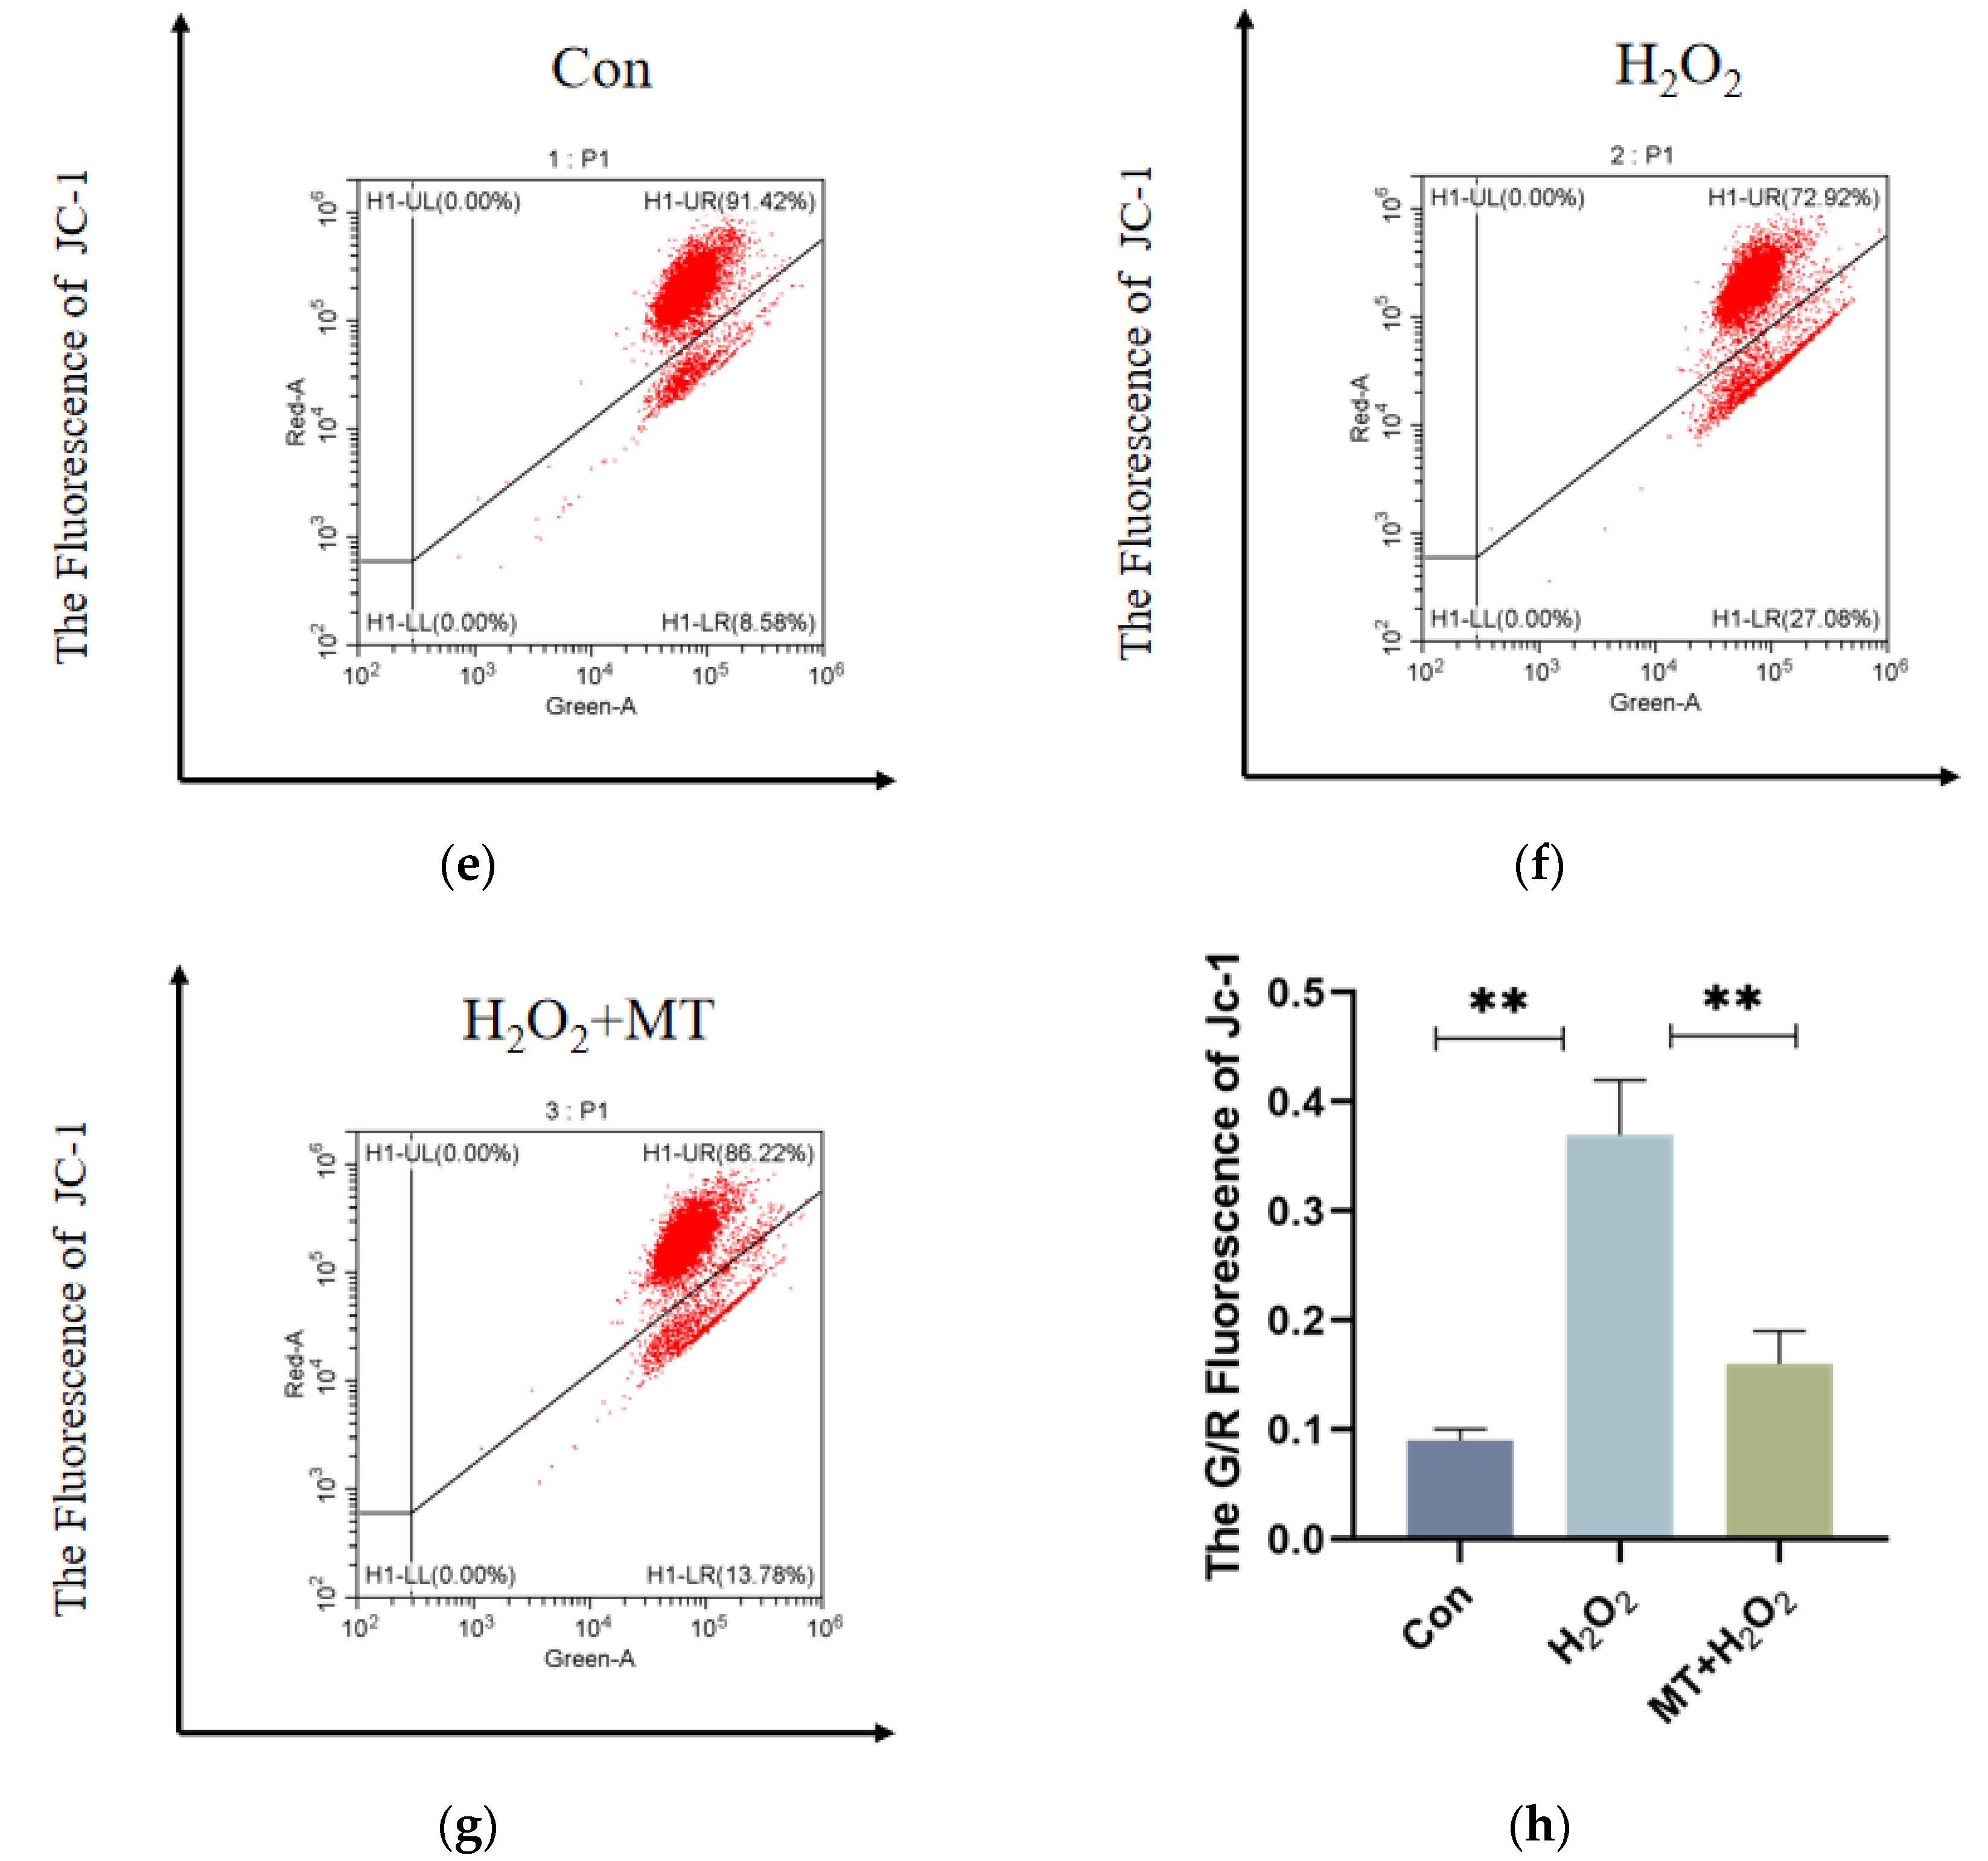

Table 1.
Primers for PCR analysis.
| Gene | Forward | Reverse |
| BCL2 | GGACGCTTGGCTATCCCTAC | CTATGATGCGATGGCACGAC |
| Caspase3 | GCTGAAGGCTCCTGGTTTAT | TTCTGCCACTCTGCGATTTA |
| LC3-I | TTACACCCATATCAGATTCTTG | ATTCCAACCTGTCCCTCA |
| LC3-II | AGTGAAGTGTAGCAGGATGA | AAGCCTTGTGAACGAGAT |
| P53 | GCAAGATCGAGGAGGAGAACT | ATCTCATTGTCGGGGTTCAG |
| β-actin | GCCAACAGAGAGAAGATGACACAG | CATCACCAGAGTCCATCACAATACC |
Disclaimer/Publisher’s Note: The statements, opinions and data contained in all publications are solely those of the individual author(s) and contributor(s) and not of MDPI and/or the editor(s). MDPI and/or the editor(s) disclaim responsibility for any injury to people or property resulting from any ideas, methods, instructions or products referred to in the content. |
© 2025 by the authors. Licensee MDPI, Basel, Switzerland. This article is an open access article distributed under the terms and conditions of the Creative Commons Attribution (CC BY) license (https://creativecommons.org/licenses/by/4.0/).
Copyright: This open access article is published under a Creative Commons CC BY 4.0 license, which permit the free download, distribution, and reuse, provided that the author and preprint are cited in any reuse.


