
Submitted:
09 February 2025
Posted:
10 February 2025
You are already at the latest version
Abstract
Aging increases oxidative stress (OS) in the ovaries, leading to infertility-related dis-orders. Granulosa cells (GCs), which support folliculogenesis in the ovaries, are chron-ically exposed to excessive OS under pathological conditions. Here, we demonstrate the significant role of Rubicon, an autophagy suppressor, as a DNA damage mediator in GCs under OS. Hydrogen peroxide (H2O2) decreased cell viability in the human GC cell line, HGrC1, due to DNA damage, without affecting autophagic activity. However, activation of autophagy increased OS resistance in HGrC1 cells, and vice versa. Among several materials that are considered safer for clinical use, trehalose, a disaccharide, exerted a protective effect as an autophagy activator against H2O2-induced cytotoxici-ty. Trehalose significantly increased autophagic activity, accompanied by a reduction in Rubicon, compared to other carbohydrates. It also reduced the expression of DNA damage-responsive proteins and the production of reactive oxygen species. The reduc-tion in Rubicon expression by siRNA mitigated DNA damage caused by OS, while overexpression of Rubicon enhanced DNA damage and decreased HGrC1 cell viability. Trehalose enhanced OS resistance by activating autophagy and suppressing Rubicon in a bidirectional manner. As Rubicon expression increases in aged human ovaries, tre-halose may improve ovarian function in patients with infertility and other OS-related diseases.
Keywords:
Autophagy
; Granulosa cell
; Infertility
; Oxidative stress
; Rubicon
; Trehalose
1. Introduction
Primordial follicles formed until birth enter a state of reduced metabolic activity, halting the development of oocytes and granulosa cell precursors. Once activated, oocyte-secreted factors initiate granulosa cell proliferation, leading to secondary follicle development, in which the oocyte is surrounded by multiple layers of granulosa cells. Secondary follicles are initially less responsive to follicle-stimulating hormone (FSH), but become more sensitive to FSH as they develop more granulosa cell layers. This process occurs when the suppressed expression of FSH receptor (FSHR) by oocyte-secreted factors is reversed, allowing the outer granulosa cells to express FSHR. As follicles transition from multilayered secondary to early antral follicles, granulosa cells differentiate into mural and cumulus cells. The former converts testosterone to 17β-estradiol, resulting in expressing luteinizing hormone receptors as preovulatory follicles develop [1]; the latter, which does not express high levels of luteinizing hormone receptors, helps to transport nutrients to the oocyte for enhancing oocyte meiotic progression [2]. Therefore, the proper maintenance of granulosa cell homeostasis is essential for healthy follicular development.
Ovarian aging leads to a decline in both the number and quality of primordial follicles, thereby contributing to reduced pregnancy rates [3]. Clinically, fertility rates begin to decline in women in their late 30s, largely because of poor ovarian response (POR), a condition in which the ovaries exhibit diminished responsiveness to FSH [4]. Oxidative stress increases with age and is the primary cause of ovarian dysfunction [5]. It induces DNA damage, mitochondrial dysfunction, protein oxidation, and lipid peroxidation, all of which contribute to a decline in ovarian function [6]. As oocytes become more vulnerable to external stressors, such as chemotherapy and radiation therapy, their DNA damage repair capacity diminishes [7]. Although a certain amount of oxidative stress is necessary for ovulation, excessive oxidative stress is implicated in infertility-related disorders such as premature ovarian failure, polycystic ovary syndrome (PCOS), and endometriosis. Studies have shown that granulosa cells from women over 38 years of age express lower levels of antioxidant enzymes such as superoxide dismutase 1 and 2 than those from younger women, resulting in reduced antioxidant capacity [8]. FSH administration stimulates follicular development by targeting granulosa cells expressing FSHR to revive POR ovaries. However, among patients with POR, including aged women, the number of FSHR-expressing follicles is limited, which leads to fewer developed follicles, reduced oocyte retrieval, and lower pregnancy rates. Therefore, alternative treatment methods for FSH administration are required in the clinical setting.
Autophagy is a key cellular mechanism responsible for maintaining homeostasis by producing energy and ensuring the quality control of proteins. Autophagy enables cells to counteract various stressors, such as nutrient deprivation, hypoxia, oxidative stress, and endoplasmic reticulum stress, contributing to enhanced cell survival, anti-inflammatory effects, and proper cellular function [9]. Studies have shown that ovaries lacking Autophagy related 5 (Atg5), a gene essential for autophagy, exhibit increased follicular atresia, luteal insufficiency, and ovarian atrophy accompanied by p62 accumulation. Similarly, Atg5-deficient testes show elevated levels of p62 and its phosphorylated form [10]. These findings underscore the importance of autophagy in reproductive function. FSH stimulates the degradation of lipid droplets in porcine granulosa cells through the activation of autophagy via Beclin1 to enhance progesterone production [11], and conditional knockdown of Beclin1 in granulosa cells impairs mitochondrial progesterone production [12]. Autophagy also facilitates granulosa cell differentiation by degrading WT1 transcription factor, a protein that suppresses FSHR and aromatase expression [9]. Additionally, mice deficient in ectopic P-granule 5 autophagy tethering factor, which is involved in the regulation of autophagy, serve as models for POR, indicating that autophagy is essential for the differentiation of granulosa cells [13]. We also identified bone morphogenetic protein-2 as a factor that promotes follicular development independent of FSH by increasing granulosa cell proliferation in early follicles [14]. Additionally, p62, an autophagy receptor protein, accumulates in the ovarian tissues of patients with PCOS or preeclamptic placenta [15,16]. Exposure to palmitic acid in combination with the autophagy inhibitor chloroquine significantly increases reactive oxygen species (ROS) in bovine theca cells [16]. Autophagy failure in ovarian cells may cause ovarian dysfunction.
Autophagic function declines gradually with age. Rubicon, a key protein that inhibits autophagy, plays a central role in this decline [17]. Decreased Rubicon expression has been shown to prevent the deterioration of autophagy, suppress kidney fibrosis, and reduce the accumulation of α-synuclein in the brain, contributing to a longer lifespan in model organisms. In the present study, we identified Rubicon as a regulator of oxidative stress resistance in granulosa cells. Furthermore, the non-reducing disaccharide trehalose, which activates autophagy and downregulates Rubicon expression, has been proposed as a potential means to protect granulosa cells from oxidative stress, potentially helping maintain ovarian function.
2. Materials and Methods
2.1. Cell Culture
A human granulosa cell line, HGrC1 cells, were used as non-luteinized ovarian granulosa cells [18]. The cells were cultured in DMEM (08490-5, Nakalai tesque Inc., Kyoto, Japan) supplemented with 10% FBS, 100 µg/mL penicillin, 100 µg/mL streptomycin, and 584 µg/mL L-glutamine (56-85-9, Fujifilm Wako, Tokyo, Japan). Cell culture was conducted under conditions of 37℃, 5% CO₂, 21% O₂, and 95% humidity. For drug treatments, cells were seeded at 1.0 x 10⁶ cells/6 cm dish or 4.0 x 10⁵ cells/3.5 cm dish, and reagents were added 24 hours after seeding.
2.2. Reagents and Antibodies
Tat-Beclin1 D11 (T-B1, NBP2-49888, Novus Biologicals, CO, USA) was used as an autophagy activator. Bafilomycin A1 (Baf, 11038, Cayman Chemical, MI, USA), Chloroquine (CQ, C6628, Sigma-Aldrich, MO, USA), and Wortmannin (Wort, 10010591, Cayman Chemical) were used as autophagy inhibitors. The saccharides were glucose (Glu, 047-31161, Fujifilm Wako), maltose (Mal, 136-00612, Fujifilm Wako), and trehalose (Tre, 206-18455, Fujifilm Wako). Hydrogen peroxide (H₂O₂, 081-04215, Fujifilm Wako) was used as an oxidative stress inducer. Primary antibodies used in western blotting were follows; Actin (1:10000, 3700, Cell Signaling Technology (CST), MA, USA), ATG3 (1:2000, TA503346, OriGene, MD, USA), ATG5 (1:2000, M153-3MS, MBL Life science, Tokyo, Japan), ATG14 (1:2000, 5504, CST), Ataxia Telangiectasia Mutated (ATM, 1:5000, 2873, CST), p-ATM (Ser1981, 1:5000, 5883, CST), Beclin1 (1:2000, sc48381, Santa Cruz Biotechnology, TX, USA), BNIP3L (1:2000, 12986-1-AP, Proteintech, IL, USA), γH2A histone family member X (γH2AX Ser139, 1:2000, 9718, CST), Microtubule Associated Protein 1 Light Chain 3 beta (LC3, 1:2000, 76446, Proteintech), MFN1 (1:4000, 14739, CST), MFN2 (1:4000, 11925, CST), mTOR (1:4000, 2972, CST), p-mTOR (1:4000, 2971, CST), p62 (1:5000, M162-3, MBL Life science), p-p62 (Ser403, 1:2000, GTX128171, GeneTex, CA, USA), p95 (1:5000, 14956, CST), p-p95 (Ser343, 1:4000, 3001, CST), Rubicon (1:5000, 8465, CST), Tom20 (1:2000, 42406, CST), ULK1 (1:2000, 8054, CST), UVRAG (1:2000, M160-3MS, MBL Life science) were used.
2.3. Immunofluorescence Staining
This experiment was carried out in the same way as the previous report [19]. Cells were fixed with 4% paraformaldehyde for 10 minutes, followed by permeabilization with PBS containing 1% Triton X-100 for 20 minutes. The staining procedure was performed following the manual of the DNA Damage Detection Kit-γH2AX Green (343-09421, DOJINDO, Kumamoto, Japan). Subsequently, the samples, whose nuclei were stained with Hoechst 33342 (1:10000, 346-07951, Fujifilm Wako), were observed by fluorescence microscopy (BZ-X800, Keyence, Osaka, Japan) at 20x magnification.
2.4. Western Blotting
This experiment was carried out in the same way as the previous report [15]. After washing the cells with cold PBS, cells were lysed and sonicated in RIPA buffer with protease and phosphatase inhibitors. The lysates were centrifuged at 14,000 rpm for 30 minutes at 4℃, and protein concentrations were measured using the Bradford method. Blocking was performed with 5% skim milk in Tris-buffered saline with Tween-20 (TBST) at room temperature for 1 hour. After washing with TBST, the membrane was incubated overnight at 4℃ with the primary antibody. Following TBST washes, the membrane was incubated with secondary antibodies (anti-mouse IgG HRP-conjugated antibody, 7076, CST or anti-rabbit IgG HRP-conjugated antibody, 7074, CST) overnight at 4℃. Visualization was performed using a Multi Imager Ⅱ Chemi Box (H-674ICE-Ⅱ, BioTools, Gunma, Japan) and MISVS Ⅱ software. ImageJ was used for analysis (https://imagej.net/ij/).
2.5. Cell Proliferation Assay
This experiment was carried out in the same way as the previous report [20]. To assess the cytotoxicity and cell proliferation, the Premix WST-1 Cell Proliferation Assay System (MK400, Takara, Shiga, Japan) was used following the manual. HGrC1 cells, which were seeded at 8.0 x 10³ cells/well in a 96-well plate, were treated with some reagents after 24 hours of seeding. After removal of the medium, absorbance was measured after 4 hours of WST-1 reagent treatment.
2.6. Reactive Oxygen Species (ROS) Assay
HGrC1 cells were seeded at 4.0 x 10³ cells/well in a 96-well black chimney plate (655209, Greiner Bio-One, Kremsmünster, Austria) and cultured for 24 hours. The procedure was performed following the manual of The ROS Assay Kit-Highly Sensitive DCFH-DA (R252, DOJINDO). After washing the cells with HBSS, fluorescence intensity was measured using a fluorescence plate reader (Spectra Max i3, 5025027A, Molecular Devices, CA, USA).
2.7. Transfection of siRNA or Plasmids
HGrC1 cells were seeded at 4.0 x 10⁵ cells/3.5 cm dish. After 24 hours, Rubicon knockdown siRNA (s18716, s18717, s18718, Thermo Fisher Scientific, MA, USA) or control siRNA (4390843, Thermo Fisher Scientific) was introduced by Lipofectamine RNAiMAX (13778030, Thermo Fisher Scientific) at 10nM concentrations. As for the Rubicon overexpression, pEGFP-Rubicon plasmid (21636, Addgene, MA, USA) or pEGFP as a control was introduced into HGrC1 cells by Lipofectamine 3000 Reagent (L3000015, Thermo Fisher Scientific) [21]. After 48 hours of treatment, cells were harvested for the experiments.
2.8. Colleciton of Ovarian Tissue
This study was approved by the Ethics Review Committee of the University of Toyama (R2020134) for research using patient specimens. Written informed consent was obtained from patients scheduled to undergo bilateral oophorectomy as part of standard treatment for endometrial or cervical cancer. After oophorectomy, research specimens were collected in a manner that did not interfere with pathological examination. The samples were centrifuged, washed with PBS to remove blood components, and assigned identification numbers. Finally, they were recorded and stored at -80°C.
2.9. Statistical Analysis
Statistical analyses were performed using GraphPad Prism version 10 (GraphPad Software, San Diego, CA, USA). The Mann-Whitney U test was used for comparisons of cell viability. A p-value of <0.05 was considered statistically significant (*: p <0.05, **: p <0.01, ****: p <0.0001).
3. Results
3.1. Autophagy Activity Unaffected by H₂O₂ Treatment
We first analyzed the effects of H₂O₂ on HGrC1 cell viability. Cell numbers were gradually decreased with H₂O₂ concentrations, and dramatically declined at concentrations of 500 µM after 24 h of exposure (Figure 1A). Consistent with the decreased cell viability, ROS levels were elevated with 125 µM H₂O₂ treatment (Figure 1B). As a mechanism, H₂O₂-induced oxidative stress triggered DNA damage in HGrC1 cells, which was confirmed by elevated levels of γH2AX expression (Figure 1C). The expression of DNA damage-responsive proteins, such as p-ATM and p-p95, was also induced by H₂O₂ treatment (Figure 1C). Although the impact of ROS on granulosa cells is often related to mitochondrial dysfunction, mitochondrial and mitophagy-related proteins did not change in HGrC1 cells (Supplementary Figure 1). Subsequently, autophagic activity and autophagy-related proteins were evaluated in HGrC1 cells. Autophagy flux assays, which measured the increase in LC3-II by blocking the autophagic flow with CQ, a lysosomal inhibitor, for a short time [22], showed that H₂O₂ did not alter autophagic activity (Figure 1D). Short-time exposure of H₂O₂, for 3 h, also did not affect autophagic activity (Supplementary Figure S2). In addition, it did not affect the expression of other autophagy markers such as p-mTOR, mTOR, UVRAG, Beclin1, Rubicon, ULK1, ATG3, ATG5, ATG14, and p62. (Figure 1E). Taken together, H₂O₂ decreased cell viability due to DNA damage without altering the autophagic activity in HGrC1 cells.
3.2. Autophagic Activation Enhanced HGrC1 Viability Against H₂O₂-Induced Oxidative Stress
Next, we investigated whether modulation of autophagic activity affects HGrC1 cell viability under oxidative stress caused by H₂O₂. As shown in Figure 1A, though cell numbers were gradually decreased with the increase of H₂O₂ concentration, co-treatment with T-B1, an autophagy inducer, significantly increased the cell viability in a dose-dependent manner (Figure 2A). When the cells were co-treated with autophagy inhibitors, Baf and CQ, that are involved in autolysosome suppression by suppressing lysosome function, or Wort, which inhibits autophagosome formation, Baf as well as CQ enhanced cell growth inhibition at 125 µM H₂O₂, and almost no viable cells were observed at 250 µM H₂O₂ (Figure 2B, 2C). Additionally, Wort showed similar results at 250 µM H₂O₂ as seen in CQ or Baf (Figure 2D). Subsequently, we confirmed the effects of these reagents on autophagy. T-B1 treatment significantly increased LC3-II expression levels in the absence of CQ, and this increased LC3-II was further elevated in the presence of CQ, confirming autophagic activation in HGrC1 cells (Figure 2E, 2F). Wort treatment decreased the expression levels of LC3-II, indicating autophagy-suppressing activity (Figure 2G). The inhibitory activity of CQ is shown in Figure 1D. Considering these results together, autophagic activation boosted resistance to oxidative stress, whereas its inhibition heightened vulnerability, ultimately aiding cell survival under H₂O₂ exposure.
3.3. Trehalose Activated Autophagy and Decreased Rubicon Expression
To explore safer alternatives to T-B1 for clinical use, we searched for a natural product that could activate autophagy to minimize reproductive toxicity (Figure 3A). Trehalose increased the LC3-II level the most, even more than T-B1. Although trehalose is commonly used as a preservative and cryoprotectant for oocyte preservation among carbohydrates [23], its cytotoxicity was first evaluated in HGrC1 cells. Trehalose inhibited the growth of HGrC1 cells at 200 mM, and no viable cells were observed at 400 mM trehalose (Figure 3B). Therefore, 100 mM trehalose was used in subsequent experiments. Trehalose consists of two molecules of α-glucose linked by their hydroxy groups at the 1st position, whereas maltose consists of two α-glucose molecules linked by their hydroxy groups at the 1st and 4th positions. Maltose was used as a counterpart to trehalose as reported previously [24]. Among the carbohydrates tested—trehalose, maltose, and an equal amount of glucose—trehalose significantly increased LC3-II expression levels, while glucose and maltose had little effect on autophagy activation (Figure 3C). The flux assay showed that trehalose further increased LC3-II levels following CQ treatment, confirming trehalose-mediated autophagic activation in HGrC1 cells (Figure 3D). To elucidate the mechanism of trehalose-induced autophagy, we evaluated the mTOR-dependent translocation of transcription factor EB (TFEB) to the nucleus.
However, TFEB expression levels remained stable (Figure 3E), and trehalose did not affect the p-mTOR/mTOR ratio in HGrC1 cells (Supplementary Figure S3). Subsequently, we comprehensively examined protein expression in trehalose-treated cells. The expression levels of Rubicon, a known inhibitor of the autophagy pathway, decreased dramatically (Figure 3E). Among the carbohydrates tested, the reduction in Rubicon expression was greatest with trehalose (Figure 3F). These results revealed that trehalose activated autophagy and reduced Rubicon expression in HGrC1 cells.
3.4. Trehalose Enhanced Cell Viability Against H₂O₂-Mediated Oxidative Stress
Because T-B1 enhanced HGrC1 cell survival under oxidative stress (Figure 2A), we tested whether trehalose had similar effects. Trehalose significantly recovered cell viability at 500 µM of H₂O₂ (Figure 4A) and decreased ROS levels (Figure 4B). Additionally, trehalose attenuated the expression of DNA damage-responsive proteins, such as γH2AX and p-ATM, p-p95 (Figure 4C). Immunocytochemistry showed that γH2AX-positive nuclei were reduced by trehalose treatment (Figure 4D). This intensity was also significantly suppressed by trehalose treatment (Figure 4E). Taken together, these results suggest that trehalose mitigated H₂O₂-induced oxidative stress by reducing DNA damage, resulting in improved cell viability.
3.5. Decreased Rubicon Expression, but Not Autophagic Activation, Was Involved in Reducing DNA Damage
It is unclear whether the reduction in trehalose-mediated DNA damage is due to a decrease in Rubicon expression, autophagy activation, or both. In addition to the activation of autophagy by trehalose, we investigated whether Rubicon knockdown affected the activation of autophagy and oxidative stress resistance. Using Rubicon-specific siRNAs, we confirmed that siRub2 and 3 decreased Rubicon expression levels by > 90% after 48 hours (Figure 5A). The inhibitory effects of the siRNAs persisted for 120 hours after siRNA induction (Supplementary Figure 4). The decrease in Rubicon expression, which was mediated by siRub2 or 3, did not activate autophagic flux (Figure 5B). Since starvation reduces Rubicon expression by activating autophagy in mouse fibroblasts [25], we also investigated whether activation of autophagy by T-B1 decreased Rubicon expression in this cell line. T-B1 did not alter Rubicon expression (Supplementary Figure 5A), suggesting that trehalose influenced activation of autophagy independently of Rubicon downregulation in HGrC1 cells. Next, we evaluated the relationship between the decreased Rubicon expression and oxidative stress resistance. Decreasing Rubicon expression levels significantly improved cell viability when treated with 250 µM and 500 µM H₂O₂ (Figure 5C). Consistent with this, the expression levels of the DNA damage-responsive proteins p-ATM, p-p95, and γH2AX, were lower in the Rubicon knockdown group than in the control group (Figure 5D). Finally, as for reducing DNA damage by T-B1 treatment, T-B1 did not change the expression levels of DNA damage-responsive proteins (Supplementary Figure 5B). Taken together, these results suggest that the decrease in Rubicon expression rather than autophagic activation was responsible for the attenuating DNA damage in HGrC1 cells.
3.6. Increased Rubicon Expression Enhanced DNA Damage in Granulosa Cell Line
To clarify the relationship between Rubicon expression and H₂O₂-induced cytotoxicity, we evaluated the impact of Rubicon overexpression on oxidative stress resistance. When H₂O₂ treatment was performed for 24 hours after the transfection of the Rubicon-EGFP plasmid, which induced Rubicon overexpression (Figure 6A), cell viability was significantly decreased, compared to the control (Figure 6B). The expression levels of p-ATM, p-p95, and γH2AX were enhanced by Rubicon overexpression (Figure 6C). These results showed that increased Rubicon expression enhanced H₂O₂-mediated DNA damage, resulting in the increase of cytotoxicity by oxidative stress in HGrC1 cells.
3.7. Increased Rubicon Expression in Ovaries of Postmenopausal Women
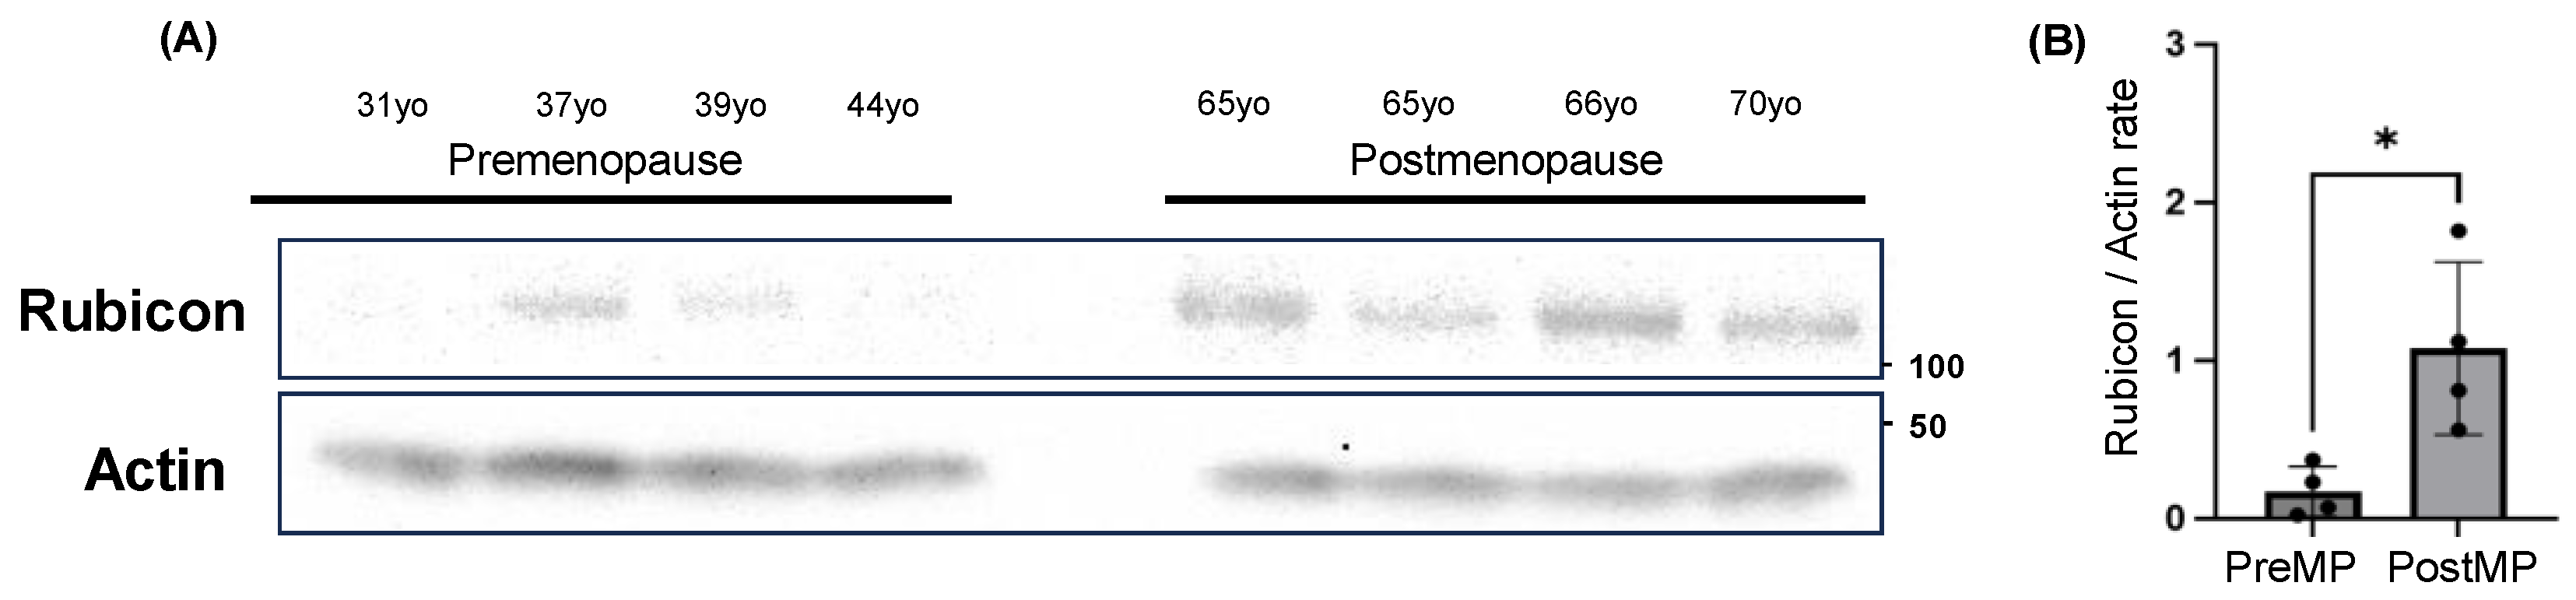
Rubicon expression increases in some organs with aging. The genetic loss of Rubicon prevents the accumulation of misfolded proteins, which are degraded through the autophagy pathway, in neurons, leading to the amelioration of aging phenotypes [17]. Since it is unknown whether Rubicon expression increases in the ovaries with aging, we compared the expression levels of Rubicon in human ovaries between postmenopausal and menstruating women. As expected, Rubicon levels in whole ovarian tissues were significantly higher in postmenopausal women than in menstruating women (Figure 7A, 7B). Thus, aging affects Rubicon expression in human ovaries.
4. Discussion
In the present study, we identified four key findings regarding oxidative stress in granulosa cells. First, both long-term and short-term oxidative stress caused by H₂O₂ did not affect autophagic activity; however, autophagic activation enhanced resistance to oxidative stress in the granulosa cell line. Second, trehalose boosts oxidative stress resistance by suppressing Rubicon expression and activating autophagy. Third, Rubicon suppression plays a crucial role in reducing DNA damage, thereby restoring of granulosa cell viability against oxidative stress. Finally, Rubicon expression increased in aged human ovaries. Thus, trehalose contributes to granulosa cell homeostasis by suppressing Rubicon expression in the ovaries. Based on these findings, strategies targeting Rubicon suppression may offer potential treatments for ovarian dysfunction caused by oxidative stress.
Oxidative stress-induced dysfunction in granulosa cells, particularly ROS production, has been well documented. Previous studies have focused on the damage or depletion of mitochondrial DNA [26], showing that lower mitochondrial DNA copy numbers in unfertilized eggs can affect fertility [27]. Additionally, mitochondrial DNA copy numbers in the granulosa cells of patients with PCOS were significantly reduced, likely due to oxidative stress. However, as this study did not show any changes in the mitochondria-related proteins in response to H₂O₂ treatment (Supplementary Figure 1), we focused on DNA damage as a cause of cytotoxicity induced by oxidative stress in the granulosa cell line.
Aging exacerbates oxidative stress through DNA damage accumulation [28]. This study showed an increase of Rubicon expression in the ovaries of postmenopausal women. Rubicon levels increase with age in organs such as the kidneys and liver, where they inhibit autophagy [17]. In the gonadal regulation of spermatogenesis, autophagy enhances the degradation of GATA-binding protein 4 (GATA4) to maintain spermatogonial stem cells and germ cell homeostasis in Sertoli cells. The absence of Rubicon in testis resulted in defective spermatogenesis due to the enhanced GATA4 degradation by autophagy [29]. Applying this finding to ovaries, as GATA4 expression increases with granulosa cell differentiation, increased Rubicon expression, and autophagy inhibition in aging ovaries may lead to aberrant folliculogenesis, which in turn progresses to follicular depletion, or may induce excessive oxidative stress following granulosa cell death, leading to ovarian dysfunction. Trehalose may counteract these effects by suppressing Rubicon and enhancing antioxidant defenses. Oxidative stress suppresses Sirtuin 1 (SIRT1) expression, a key regulator of oxidative stress in granulosa cells [30]. SIRT1 suppression also enhances the Beclin1-Rubicon interaction, which inhibits autophagy in tumor cells [31]. Taken together, these results indicate that oxidative stress can inhibit autophagy by enhancing Beclin1-Rubicon binding through SIRT1 suppression in granulosa cells. Applying this hypothesis to our study, we found that oxidative stress did not affect autophagic flux, but trehalose attenuated DNA damage by reducing Rubicon expression without altering Beclin1 levels. Thus, the Beclin1-Rubicon complex may play a central role in the cytotoxicity of oxidative stress in granulosa cells. In other words, disruption of the Beclin1-Rubicon complex attenuated cytotoxicity in the granulosa cell line. The activation of autophagy by T-B1 did not alter the expression of DNA damage-responsive proteins or Rubicon (Supplementary Figure 5A, 5B), but enhanced oxidative stress resistance. Rubicon contributes to the DNA damage response induced by H₂O₂; T-B1-mediated activation of autophagy may enhance oxidative stress resistance through a different mechanism. Therefore, trehalose strongly opposes oxidative stress via dual autophagic regulation.
We focused on DNA damage to explore the mechanisms underlying H₂O₂-induced cell death. H₂O₂ induces not only single-strand DNA breaks but also double-strand breaks at high concentrations [32]. In cancer cells, the ATM-CHK2-FOXK pathway activates autophagy to mitigate DNA damage, whereas autophagic inhibition exacerbates DNA damage [33]. In the present study, H₂O₂ increased double-strand DNA damage, as indicated by ATM phosphorylation, and this damage was exacerbated by autophagy inhibitors such as CQ or Baf. These results suggest that autophagy plays a protective role against DNA damage in granulosa cells. As trehalose or Rubicon knockdown suppressed γH2AX expression accompanied by reduced ATM phosphorylation, inhibition of Rubicon mitigated H₂O₂-mediated DNA damage. However, the mechanism by which trehalose decreases Rubicon expression remains unclear.
Although it is difficult to fully distinguish these two effects of trehalose, both are likely to work in tandem to maintain granulosa cell homeostasis. Previous studies have shown that Beclin1 knockout in the ovaries results in steroid production failure due to defects in lipid metabolism [12]. Rubicon overexpression in the liver leads to lipid accumulation and organ failure [34]. In humans, Rubicon accumulation, which can occur with aging, may elicit lipid metabolic disorders through autophagy inhibition in the ovaries. Clinically, the senescence markers p16, p21, γH2AX, senescence-associated β-galactosidase, and IL-6, which exhibit the senescence-associated secretory phenotype, were increased in granulosa cells of patients with PCOS [35]. We hypothesize that Rubicon overexpression contributes to ovarian aging; thus, we are currently evaluating Rubicon expression in aged ovaries or granulosa cells derived from patients with PCOS as a part of future research.
Studies have shown that starvation decreases Rubicon expression levels in mouse cells [36]. However, treatment with autophagy inhibitors such as CQ did not alter Rubicon expression in the current study. Other studies have indicated that DNA damage can increase Rubicon expression levels and that factors contributing to lifespan extension in Drosophila, such as the transcription factor, MondoA, may regulate this process [37]. In Drosophila, decreased expression of HLH-30, a homolog of TFEB, reduced MondoA expression. Conversely, a decrease in MondoA expression inhibits the nuclear translocation of TFEB, and both are required for autophagy activation [38]. Since trehalose activates TFEB in an mTOR-independent manner [39], it may decrease Rubicon expression via MondoA regulation, a hypothesis that requires further investigation.
Various substances such as melatonin, resveratrol, and metformin have been shown to activate autophagy and reduce oxidative stress [26]. Furthermore, resveratrol and metformin increase SIRT1 expression in granulosa cells [40]. However, resveratrol, which increases SIRT1 expression, also exhibits growth-inhibitory effects on granulosa cells. In contrast, trehalose had the strongest autophagy-activating effect and reduced Rubicon expression without affecting cell viability. Unlike other drugs, trehalose activates autophagy via the Class III PI3K-Beclin1-Rubicon pathway, thereby bypassing the mTOR pathway.
5. Conclusions
Oxidative stress from both endogenous and exogenous sources, such as PCOS, aging, and anticancer drugs, can lead to ovarian dysfunction. The expression of Rubicon is increased in aged human ovaries compared to that in women of reproductive age. In this regard, we identified Rubicon as a key regulator of oxidative stress resistance in granulosa cells. Trehalose enhances antioxidant defense by decreasing Rubicon expression and activating autophagy. These findings provide new insights into oxidative stress resistance mechanisms and open the door for the development of ovarian function-preserving treatments using Rubicon-targeted therapies.
Supplementary Materials
The following supporting information can be downloaded at the website of this paper posted on Preprints.org, Figure S1: No changes in the mitochondrial proteins in HGrC1 cells treated with H₂O₂.; Figure S2: Short-term H₂O₂ treatment (3 hours) did not induce autophagic activation in HGrC1 cells; Figure S3: Effects of mTOR activation in HGrC1 cells with Trehalose treatment; Figure S4: Sustained knockdown of Rubicon following siRNA treatment in HGrC1 cells; Figure S5: The expressions of Rubicon and DNA damage responsive proteins in cells with Tat-Beclin1.
Author Contributions
Conceptualization, K.Y. M.I. and A.N.; methodology, K.Y. and A.Y..; formal analysis, K.Y. H.N. and M.Y.; investigation, K.Y. and T.N1.; resources, T.N2. and A.I.; writing—original draft preparation, K.Y.; writing—review and editing, T.S. and A.N.; visualization, K.Y. and A.F.; supervision, A.I.; funding acquisition, M.I. and A.N. All authors have read and agreed to the published version of the manuscript.
Funding
Please add: This study was supported by JST Moonshot R&D Grant Number JPMJMS2021, grants from Yamaguchi Endocrine Research Foundation, and JSPS KAKENHI Grant Numbers, JP23K24482, JP22K16855, JP20K09614, and JP22KK0287.
Institutional Review Board Statement
This study was performed in compliance with the Declaration of Helsinki. Two Ethics Committees, University of Toyama and the National Center for Child Health and Development, approved this study (Approval No. R2020134).
Informed Consent Statement
Written informed consent was obtained from all participants in this study prior to tissue sampling. The sampling was excluded from the participating women who refused to give informed consent or one with younger than 18 years old, HIV, hepatitis B virus, or hepatitis C virus-positive.
Data Availability Statement
All data generated or analyzed during this study are included in this published article (and its supplementary information files).
Acknowledgments
The author would like to express their gratitude to the members of the Department of Obstetrics and Gynecology at Toyama University. They contributed through the sharing of experimental protocols, constructive discussions, and information related to the research.
Conflicts of Interest
The authors declare no conflicts of interest.
Abbreviations
The following abbreviations are used in this manuscript:
| ATM | Ataxia Telangiectasia Mutated |
| Baf | Bafilomycin A1 |
| CQ | Chloroquine |
| FSH | Follicle-stimulating Hormone |
| FSHR | FSH Receptor |
| GATA4 | GATA-binding protein 4 |
| GCs | Granulosa Cells |
| γH2AX | γH2A histone family member X |
| H2O2 | Hydrogen Peroxide |
| LC3 | Microtubule Associated Protein 1 Light Chain 3 beta |
| OS | Oxidative Stress |
| PCOS | Polycystic Ovary Syndrome |
| POR | Poor Ovarian Response |
| ROS | Reactive Oxygen Species |
| SIRT1 | Sirtuin 1 |
| T-B1 | Tat-Beclin1 D11 |
| TFEB | Transcription Factor EB |
| Wort | Wortmannin |
References
- Fitzpatrick, S.L.; Richards, J.S. Identification of a cyclic adenosine 3',5'-monophosphate-response element in the rat aromatase promoter that is required for transcriptional activation in rat granulosa cells and R2C leydig cells. Mol Endocrinol 1994, 8, 1309–19. [Google Scholar] [PubMed]
- Jeppesen, J.V.; Kristensen, S.G.; Nielsen, M.E.; Humaidan, P.; Dal, Canto, M. ; Fadini, R. LH-receptor gene expression in human granulosa and cumulus cells from antral and preovulatory follicles. J Clin Endocrinol Metab 2012, 97, E1524–31. [Google Scholar] [CrossRef]
- Broekmans, F.J.; Soules, M.R.; Fauser, B.C. Ovarian aging: mechanisms and clinical consequences. Endocr Rev 2009, 30, 465–93. [Google Scholar] [CrossRef] [PubMed]
- Ferraretti, A.P. ; La, Marca, A.; Fauser, B.C.; Tarlatzis, B.; Nargund, G.; Gianaroli, L. ESHRE consensus on the definition of 'poor response' to ovarian stimulation for in vitro fertilization: the Bologna criteria. Hum Reprod, 1616. [Google Scholar]
- Buffenstein, R.; Edrey, Y.H.; Yang, T.; Mele, J. The oxidative stress theory of aging: embattled or invincible? Insights from non-traditional model organisms. Age (Dordr) 2008, 30, 99–109. [Google Scholar] [CrossRef]
- Ra, K.; Park, S.C.; Lee, B.C. Female Reproductive Aging and Oxidative Stress: Mesenchymal Stem Cell Conditioned Medium as a Promising Antioxidant. Int J Mol Sci 2023, 24. [Google Scholar] [CrossRef]
- Immediata, V.; Ronchetti, C.; Spadaro, D.; Cirillo, F.; Levi-Setti, P.E. Oxidative Stress and Human Ovarian Response-From Somatic Ovarian Cells to Oocytes Damage: A Clinical Comprehensive Narrative Review. Antioxidants (Basel) 2022, 11. [Google Scholar] [CrossRef]
- Tatone, C.; Carbone, M.C.; Falone, S.; Aimola, P.; Giardinelli, A.; Caserta, D. Age-dependent changes in the expression of superoxide dismutases and catalase are associated with ultrastructural modifications in human granulosa cells. Mol Hum Reprod 2006, 12, 655–60. [Google Scholar] [CrossRef]
- Nakashima, A.; Furuta, A.; Yamada, K.; Yoshida-Kawaguchi, M.; Yamaki-Ushijima, A.; Yasuda, I. The Role of Autophagy in the Female Reproduction System: For Beginners to Experts in This Field. Biology (Basel) 2023, 12. [Google Scholar] [CrossRef]
- Yoshii, S.R.; Kuma, A.; Akashi, T.; Hara, T.; Yamamoto, A.; Kurikawa, Y. Systemic Analysis of Atg5-Null Mice Rescued from Neonatal Lethality by Transgenic ATG5 Expression in Neurons. Dev Cell 2016, 39, 116–30. [Google Scholar] [CrossRef]
- Liu, Q.; Gao, H.; Yang, F.; Zhang, H.; Zeng, S. FSH Promotes Progesterone Synthesis by Enhancing Autophagy to Accelerate Lipid Droplet Degradation in Porcine Granulosa Cells. Front Cell Dev Biol 2021, 9, 626927. [Google Scholar] [CrossRef]
- Gawriluk, T.R.; Ko, C.; Hong, X.; Christenson, L.K.; Rucker, E.B. Beclin-1 deficiency in the murine ovary results in the reduction of progesterone production to promote preterm labor. Proc Natl Acad Sci U S A 2014, 111, E4194–203. [Google Scholar] [CrossRef] [PubMed]
- Liu, W.; Chen, M.; Liu, C.; Wang, L.; Wei, H.; Zhang, R. EPG5 deficiency leads to primary ovarian insufficiency due to WT1 accumulation in mouse granulosa cells. Autophagy 2023, 19, 644–59. [Google Scholar] [CrossRef] [PubMed]
- Ito, M.; Yoshino, O.; Ono, Y.; Yamaki-Ushijima, A.; Tanaka, T.; Shima, T. Bone morphogenetic protein-2 enhances gonadotropin-independent follicular development via sphingosine kinase 1. Am J Reprod Immunol 2021, 85, e13374. [Google Scholar] [CrossRef] [PubMed]
- Nakashima, A.; Yamanaka-Tatematsu, M.; Fujita, N.; Koizumi, K.; Shima, T.; Yoshida, T. Impaired autophagy by soluble endoglin, under physiological hypoxia in early pregnant period, is involved in poor placentation in preeclampsia. Autophagy 2013, 9, 303–16. [Google Scholar] [CrossRef]
- Kobayashi, M.; Yoshino, O.; Nakashima, A.; Ito, M.; Nishio, K.; Ono, Y. Inhibition of autophagy in theca cells induces CYP17A1 and PAI-1 expression via ROS/p38 and JNK signalling during the development of polycystic ovary syndrome. Mol Cell Endocrinol 2020, 508, 110792. [Google Scholar] [CrossRef]
- Nakamura, S.; Oba, M.; Suzuki, M.; Takahashi, A.; Yamamuro, T.; Fujiwara, M. Suppression of autophagic activity by Rubicon is a signature of aging. Nat Commun 2019, 10, 847. [Google Scholar] [CrossRef]
- Bayasula., *!!! REPLACE !!!*; Iwase, A.; Kiyono, T.; Takikawa, S.; Goto, M.; Nakamura, T. Bayasula.; Iwase, A.; Kiyono, T.; Takikawa, S.; Goto, M.; Nakamura, T. Establishment of a human nonluteinized granulosa cell line that transitions from the gonadotropin-independent to the gonadotropin-dependent status. Endocrinology, 2851. [Google Scholar]
- Nakashima, A.; Cheng, S.B.; Ikawa, M.; Yoshimori, T.; Huber, W.J.; Menon, R. Evidence for lysosomal biogenesis proteome defect and impaired autophagy in preeclampsia. Autophagy 2020, 16, 1771–85. [Google Scholar] [CrossRef]
- Furuta, A.; Shima, T.; Yoshida-Kawaguchi, M.; Yamada, K.; Yasuda, I.; Tsuda, S.; Nakashima, A. Chloroquine is a safe autophagy inhibitor for sustaining the expression of antioxidant enzymes in trophoblasts. J Reprod Immunol 2023, 155, 103766. [Google Scholar] [CrossRef]
- Nakashima, A.; Shiozaki, A.; Myojo, S.; Ito, M.; Tatematsu, M.; Sakai, M. Granulysin produced by uterine natural killer cells induces apoptosis of extravillous trophoblasts in spontaneous abortion. Am J Pathol 2008, 173, 653–64. [Google Scholar] [CrossRef]
- Nakashima, A.; Cheng, S.B.; Kusabiraki, T.; Motomura, K.; Aoki, A.; Ushijima, A. Endoplasmic reticulum stress disrupts lysosomal homeostasis and induces blockade of autophagic flux in human trophoblasts. Sci Rep 2019, 9, 11466. [Google Scholar] [CrossRef]
- Zheng, Y.X.; Ma, L.Z.; Liu, S.J.; Zhang, C.T.; Meng, R.; Chen, Y.Z. Protective effects of trehalose on frozen-thawed ovarian granulosa cells of cattle. Anim Reprod Sci 2019, 200, 14–21. [Google Scholar] [CrossRef] [PubMed]
- Huang, Z.; Cheng, S.; Jash, S.; Fierce, J.; Agudelo, A.; Higashiyama, T. Exploiting sweet relief for preeclampsia by targeting autophagy-lysosomal machinery and proteinopathy. Exp Mol Med 2024, 56, 1206–20. [Google Scholar] [CrossRef] [PubMed]
- Yamamuro, T.; Kawabata, T.; Fukuhara, A.; Saita, S.; Nakamura, S.; Takeshita, H. Age-dependent loss of adipose Rubicon promotes metabolic disorders via excess autophagy. Nat Commun 2020, 11, 4150. [Google Scholar] [CrossRef] [PubMed]
- Trujillo, M.; Odle, A.K.; Aykin-Burns, N.; Allen, A.R. Chemotherapy induced oxidative stress in the ovary: drug-dependent mechanisms and potential interventions†. Biol Reprod 2023, 108, 522–37. [Google Scholar] [CrossRef]
- Santos, T.A.; El, Shourbagy, S. ; St, John, J.C. Mitochondrial content reflects oocyte variability and fertilization outcome. Fertil Steril 2006, 85, 584–91. [Google Scholar] [CrossRef]
- Stringer, J.M.; Alesi, L.R.; Winship, A.L.; Hutt, K.J. Beyond apoptosis: evidence of other regulated cell death pathways in the ovary throughout development and life. Hum Reprod Update 2023, 29, 434–56. [Google Scholar] [CrossRef]
- Yamamuro, T.; Nakamura, S.; Yamano, Y.; Endo, T.; Yanagawa, K.; Tokumura, A. Rubicon prevents autophagic degradation of GATA4 to promote Sertoli cell function. PLoS Genet 2021, 17, e1009688. [Google Scholar] [CrossRef]
- Zhang, M.; Zhang, Q.; Hu, Y.; Xu, L.; Jiang, Y.; Zhang, C. miR-181a increases FoxO1 acetylation and promotes granulosa cell apoptosis via SIRT1 downregulation. Cell Death Dis 2017, 8, e3088. [Google Scholar] [CrossRef]
- Sun, T.; Li, X.; Zhang, P.; Chen, W.D.; Zhang, H.L.; Li, D.D. Acetylation of Beclin 1 inhibits autophagosome maturation and promotes tumour growth. Nat Commun 2015, 6, 7215. [Google Scholar] [CrossRef]
- Dahm-Daphi, J.; Sass, C.; Alberti, W. Comparison of biological effects of DNA damage induced by ionizing radiation and hydrogen peroxide in CHO cells. Int J Radiat Biol 2000, 76, 67–75. [Google Scholar] [CrossRef]
- Chen, Y.; Wu, J.; Liang, G.; Geng, G.; Zhao, F.; Yin, P. CHK2-FOXK axis promotes transcriptional control of autophagy programs. Sci Adv 2020, 6, eaax5819. [Google Scholar] [CrossRef] [PubMed]
- Tanaka, S.; Hikita, H.; Tatsumi, T.; Sakamori, R.; Nozaki, Y.; Sakane, S. Rubicon inhibits autophagy and accelerates hepatocyte apoptosis and lipid accumulation in nonalcoholic fatty liver disease in mice. Hepatology 2016, 64, 1994–2014. [Google Scholar] [CrossRef] [PubMed]
- Tanaka, T.; Urata, Y.; Harada, M.; Kunitomi, C.; Kusamoto, A.; Koike, H. Cellular senescence of granulosa cells in the pathogenesis of polycystic ovary syndrome. Mol Hum Reprod 2024, 30. [Google Scholar] [CrossRef] [PubMed]
- Yamamuro, T.; Nakamura, S.; Yanagawa, K.; Tokumura, A.; Kawabata, T.; Fukuhara, A. Loss of RUBCN/rubicon in adipocytes mediates the upregulation of autophagy to promote the fasting response. Autophagy 2022, 18, 2686–96. [Google Scholar] [CrossRef]
- Yamamoto-Imoto, H.; Minami, S.; Shioda, T.; Yamashita, Y.; Sakai, S.; Maeda, S. Age-associated decline of MondoA drives cellular senescence through impaired autophagy and mitochondrial homeostasis. Cell Rep 2022, 38, 110444. [Google Scholar] [CrossRef]
- Nakamura, S.; Karalay, Ö.; Jäger, PS.; Horikawa, M.; Klein, C.; Nakamura, K. Mondo complexes regulate TFEB via TOR inhibition to promote longevity in response to gonadal signals. Nat Commun 2016, 7, 10944. [Google Scholar] [CrossRef]
- Palmieri, M.; Pal, R.; Nelvagal, H.R.; Lotfi, P.; Stinnett, G.R.; Seymour, M.L. mTORC1-independent TFEB activation via Akt inhibition promotes cellular clearance in neurodegenerative storage diseases. Nat Commun 2017, 8, 14338. [Google Scholar] [CrossRef]
- Reverchon, M.; Cornuau, M.; Cloix, L.; Ramé, C.; Guerif, F.; Royère, D. Visfatin is expressed in human granulosa cells: regulation by metformin through AMPK/SIRT1 pathways and its role in steroidogenesis. Mol Hum Reprod 2013, 19, 313–26. [Google Scholar] [CrossRef]
Figure 1.
H₂O₂ treatment reduced cell viability due to DNA damage, but didn’t affect autophagy in HGrC1 cells. (A) Cell viability assessed using the WST-1 assay in HGrC1 cells treated with various concentrations of H₂O₂ for 24 hours. The Y-axis represented absorbance normalized to the control (set as 1), and the X-axis indicated H₂O₂ concentration (µM). (B) Reactive oxygen species (ROS) levels of HGrC1 cells treated with H₂O₂ treatment at either 0 or 125 µM for 2 hours. The Y-axis shows fluorescence intensity normalized to the average value at 0 µM of H₂O₂. The X-axis indicates H₂O₂ concentration (µM). (C) Western blotting (WB) analysis of DNA damage responsive proteins in HGrC1 cells treated with 0 or 125 µM H₂O₂ for 24 hours. WB were shown as follows: p-ATM, ATM, p-p95, p95, γH2AX, and Actin. Actin was used as the control. (D) Autophagy flux assay in HGrC1 cells. Cells were treated with H₂O₂ (µM) for 24 hours, followed by chloroquine (CQ, 100 µM) for 2 hours before the harvest. (E) WB analysis of autophagy-related proteins in HGrC1 cells treated with 0, 125, or 250 µM H₂O₂ for 24 hours. Western blots were shown as follows: p-mTOR, mTOR, UVRAG, Beclin1, Rubicon, ULK1, ATG3, ATG5, ATG14, p62, and Actin. Results were obtained from at least three independent experiments. Significant difference tests were also performed. Data are expressed as the mean ± S.D. **p<0.01, ****p<0.0001.
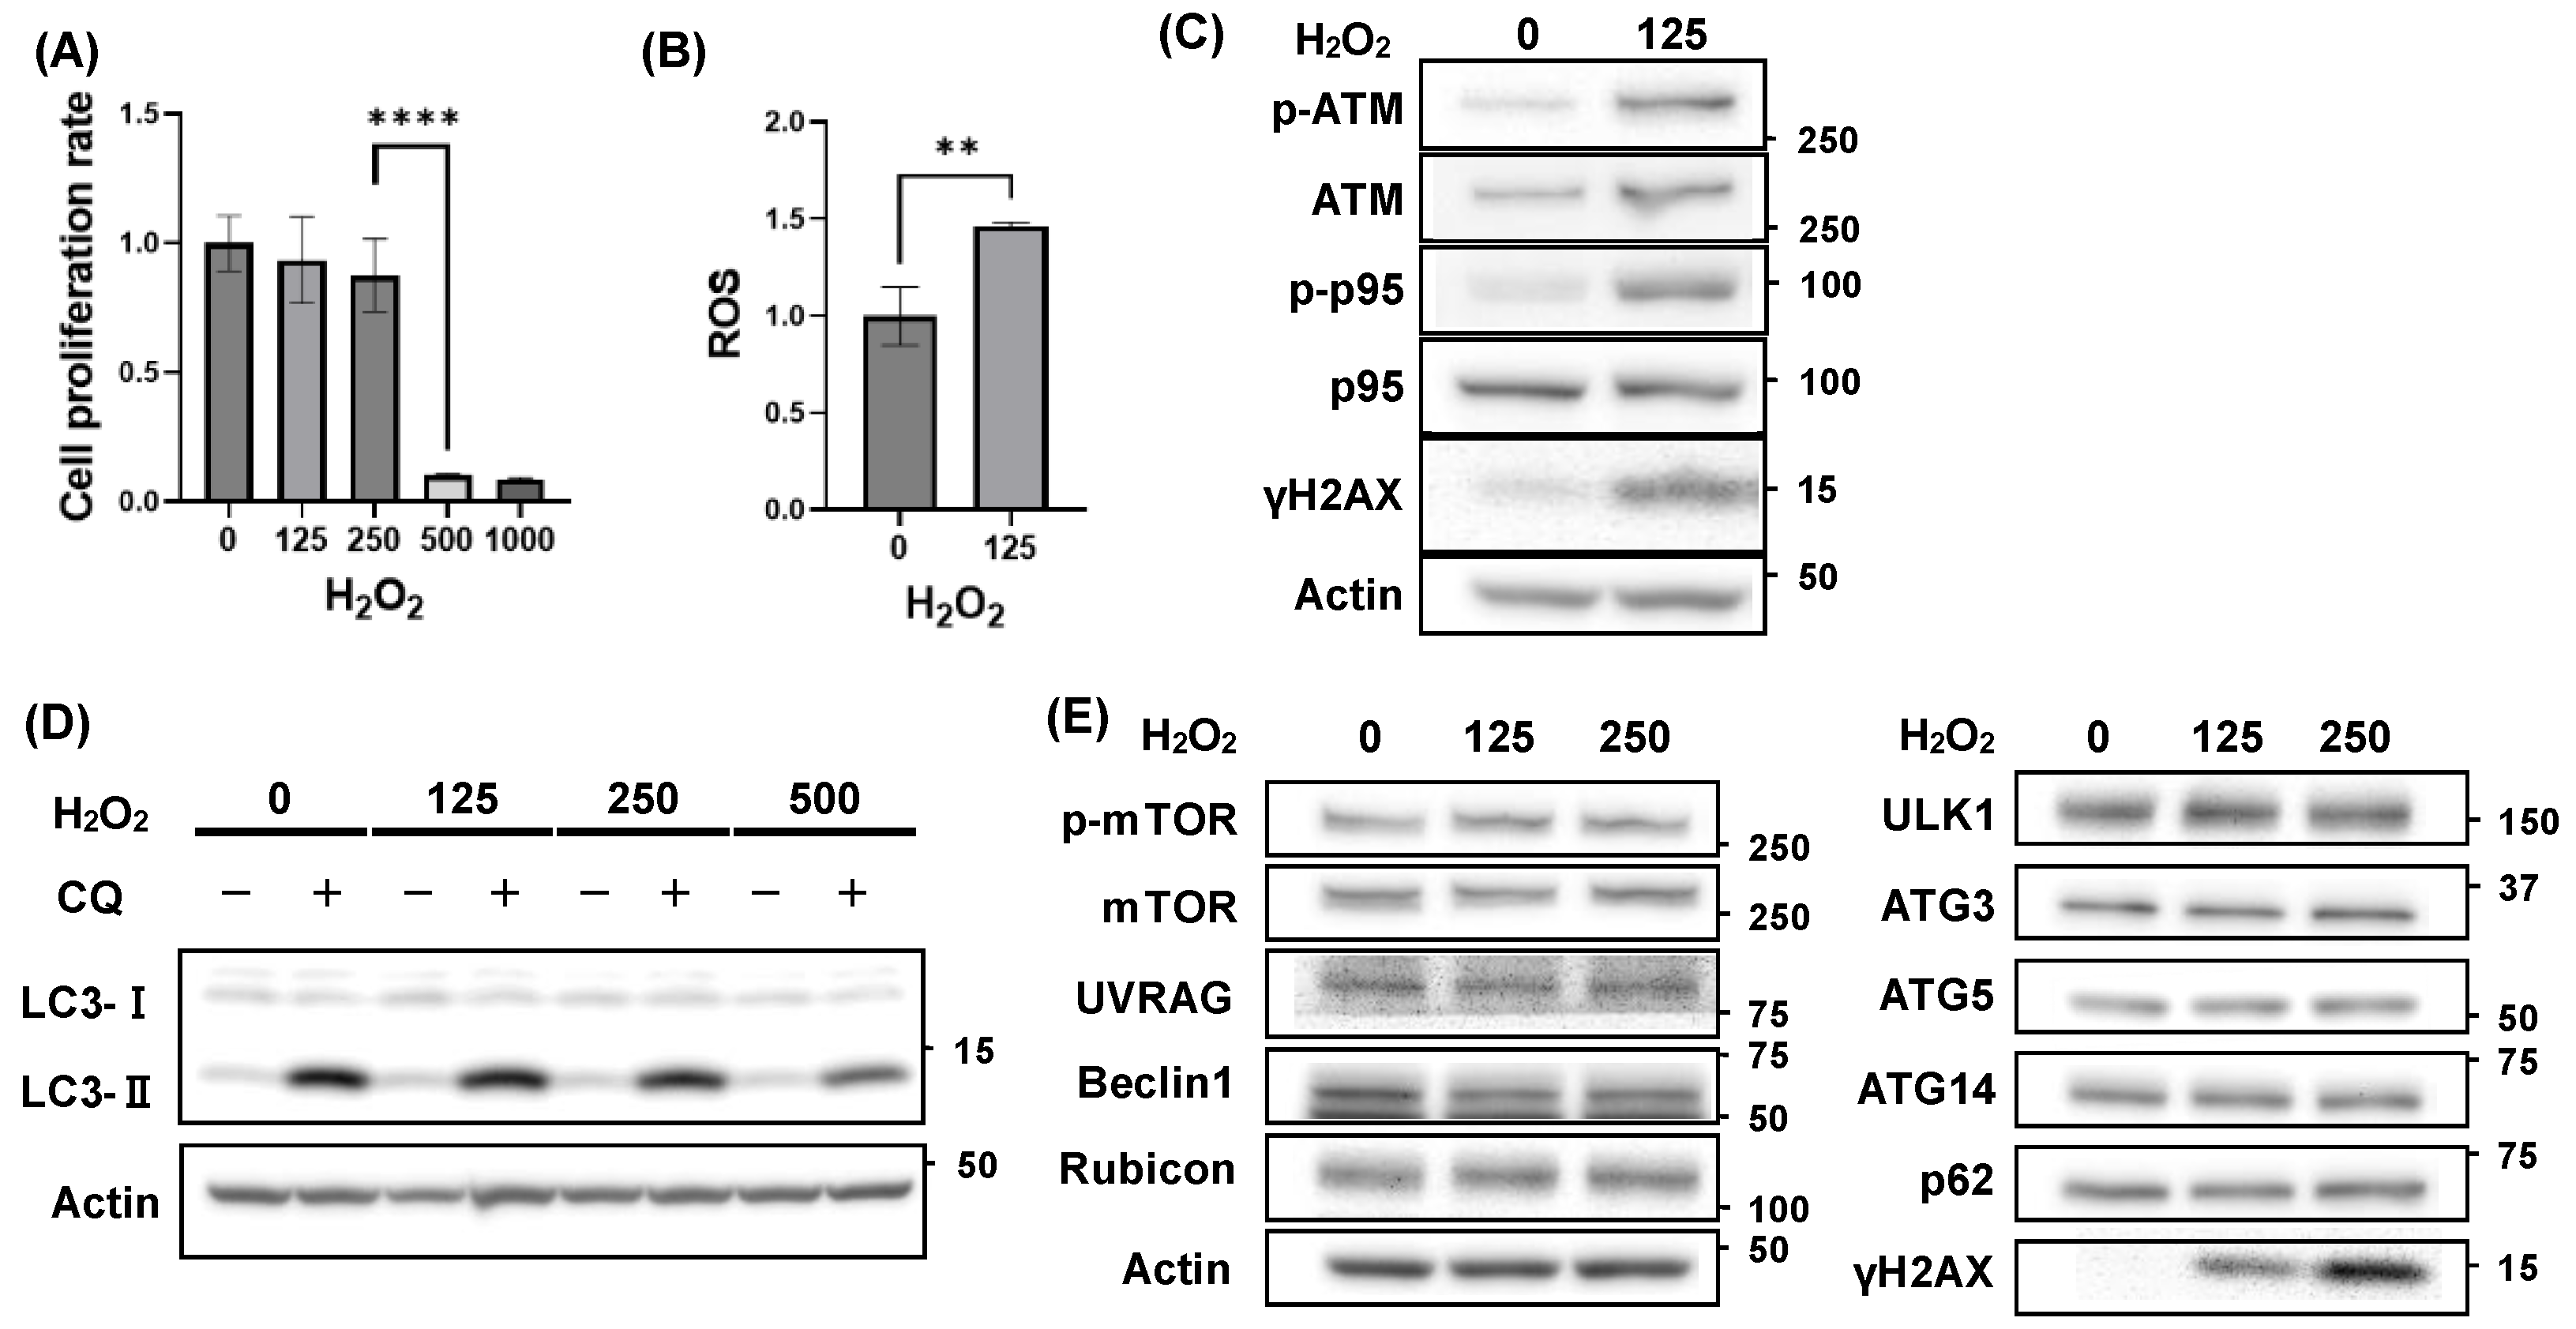
Figure 2.
Alternation of autophagic status affected cell viability in HGrC1 treated with H₂O₂. (A-D) Cell viability of HGrC1 cells with H₂O₂ (µM) co-treated with Tat-Beclin1 (T-B1) (µM), an autophagy activator, (A), or autophagy inhibitors, bafilomycin A1 (Baf, nM) (B), chloroquine (CQ, µM) (C), or wortmannin (Wort, nM) (D) for 24 hours. The Y-axis represented absorbance normalized to the control (set as 1). (E) Autophagy flux assay in HGrC1 cells treated with T-B1 for 24 hours. Cells were treated with T-B1 (µM) for 24 hours, followed by chloroquine (CQ, 100 µM) for 2 hours before the harvest. (F) The graphs showed the expression levels of LC3-II, which were normalized to that of actin in the treated HGrC1 cells in (E). Expression levels were evaluated as the median of three independent experiments. Statistical significance was assessed using the Mann-Whitney U test. (G) Western blotting analysis of LC3-II in HGrC1 cells treated with Wortmannin (nM) for 24 hours. Actin was used as an internal control. Results were obtained from at least three independent experiments. Significant difference tests were also performed. Data are expressed as the mean ± S.D. *p<0.05.
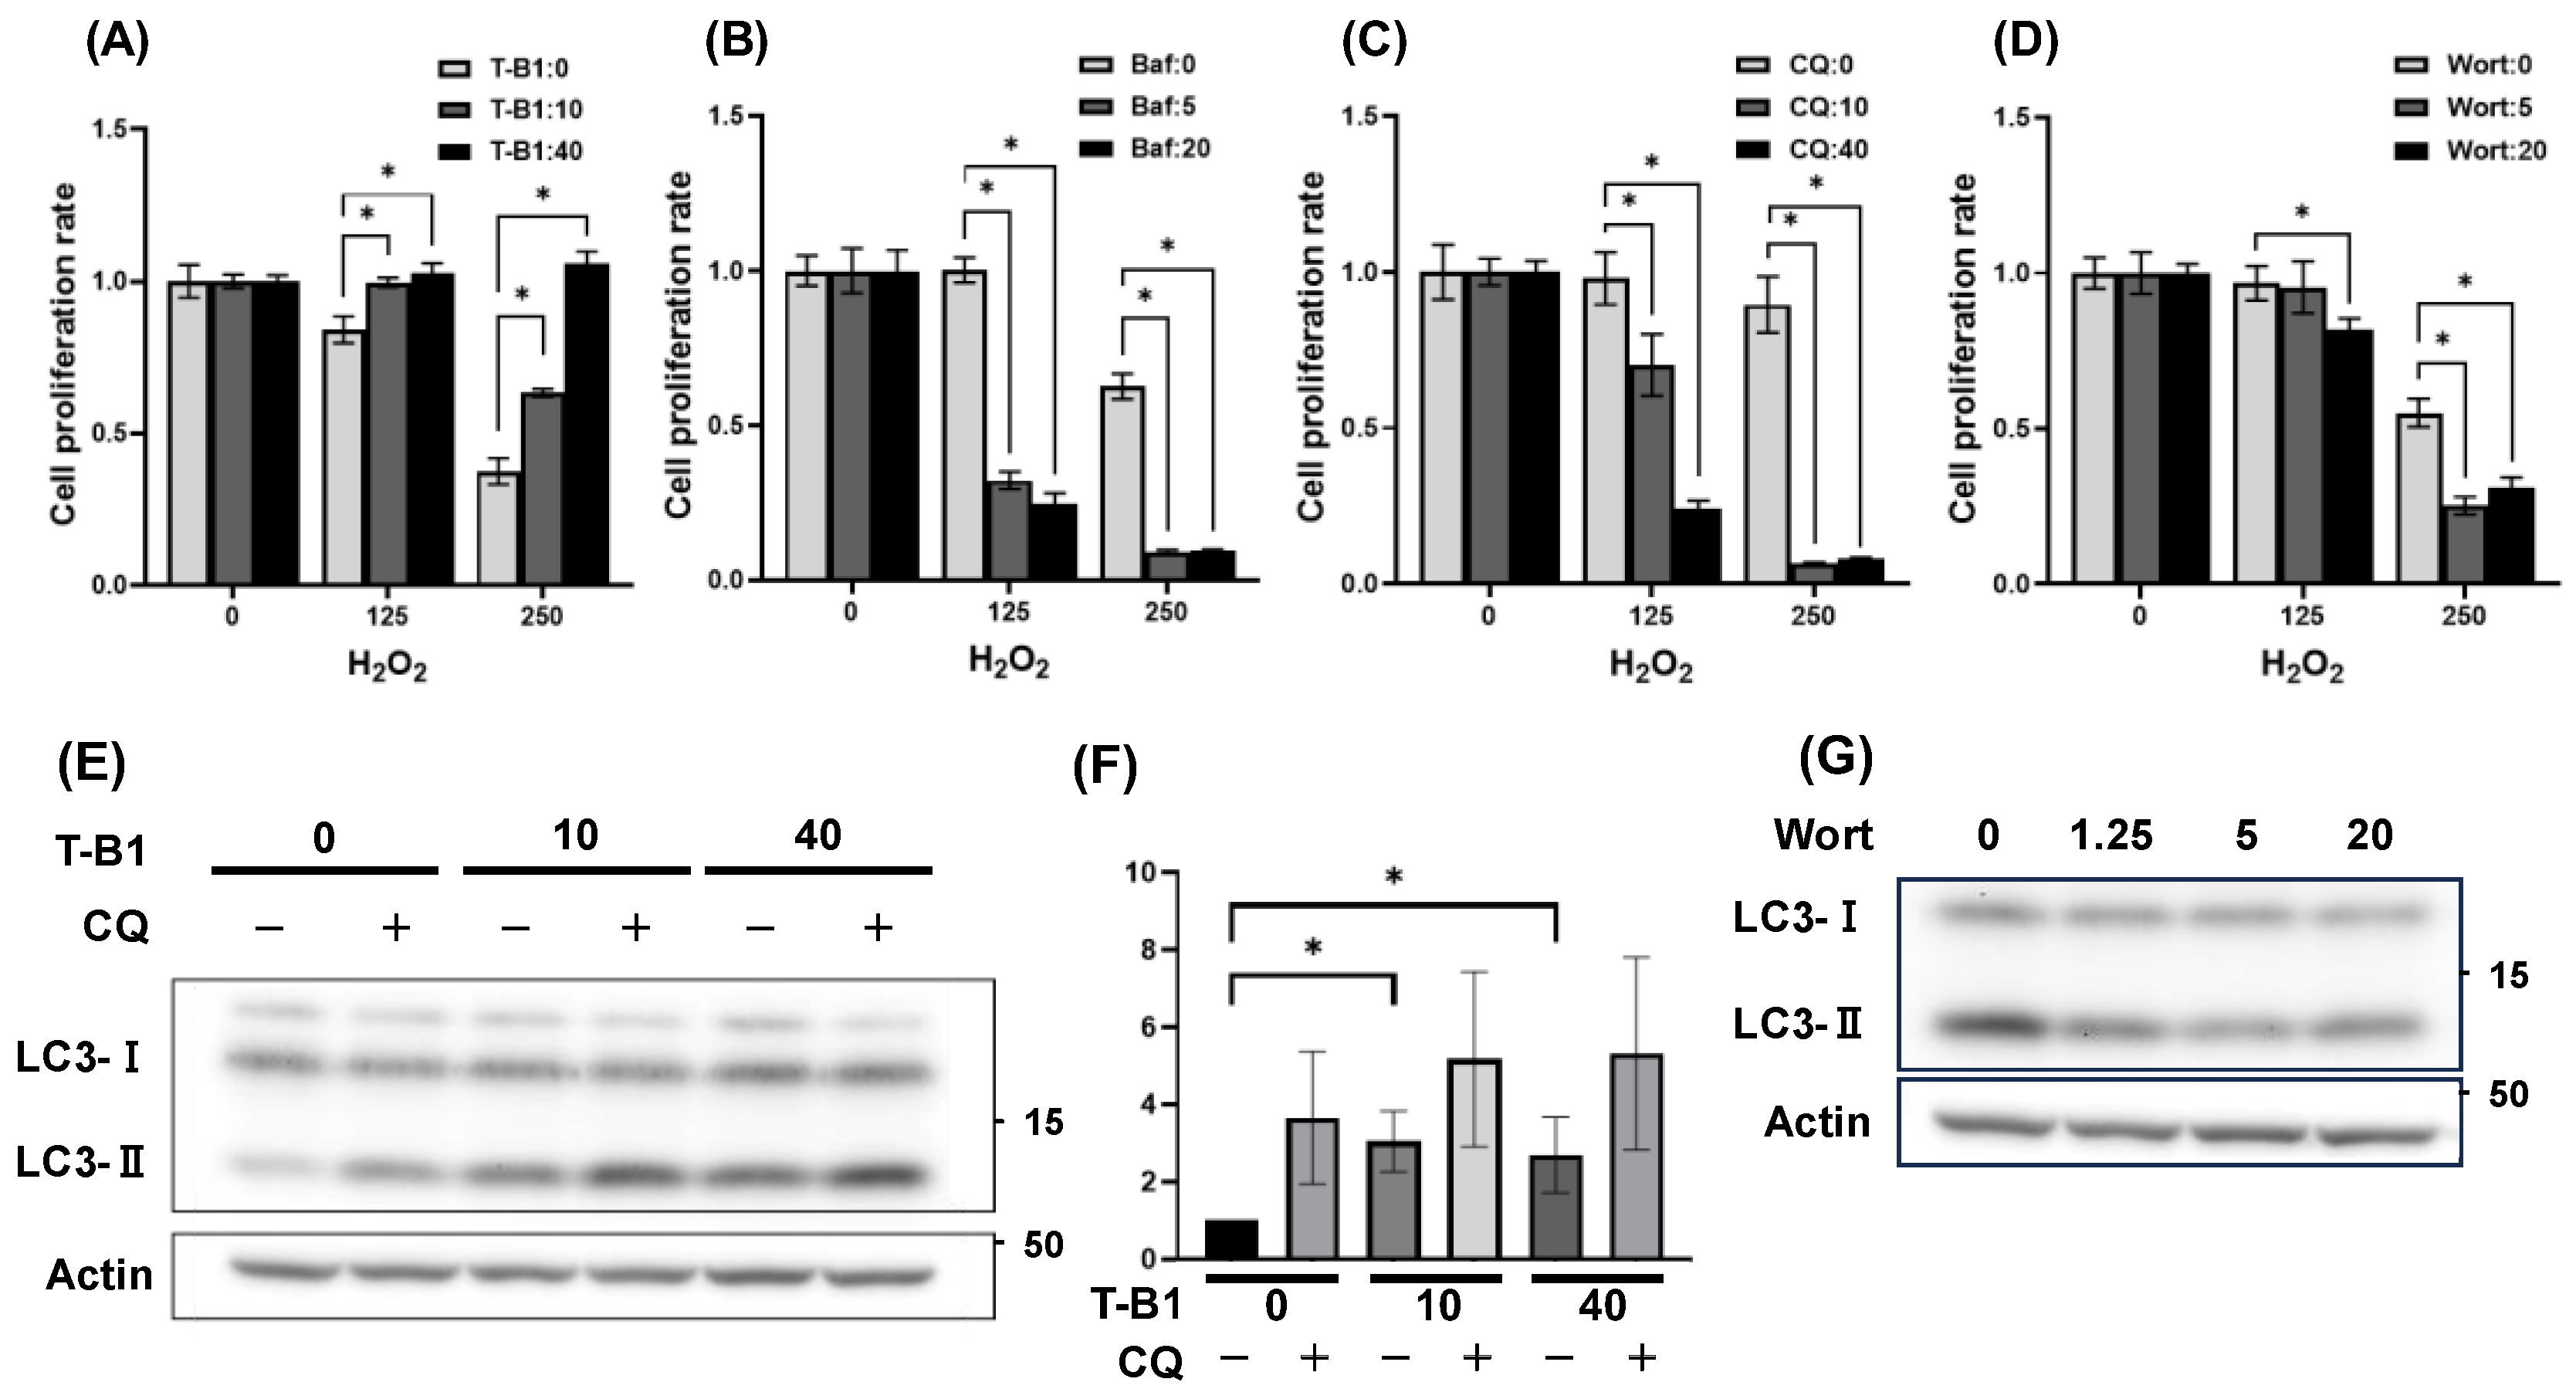
Figure 3.
Effects of Trehalose treatment on autophagy-related proteins in HGrC1 cells. (A) Westerm blotting (WB) analysis evaluating LC3 expression levels in response to various autophagy activators in HGrC1 cells. The cells were treated for 24 hours with Torin1 (1 nM), T-B1 (40 µM), Rapamycin (Rapa, 1 µM), Resveratrol (Resv, 100 µM), Curcumin (CCM, 10 µM), and Trehalose (Tre, 100 mM). (B) Cell viability assessed using the WST-1 assay in HGrC1 cells with various concentrations of Tre for 24 hours. The Y-axis represented the mean fluorescence intensity, and the X-axis showed the Tre concentration (mM). (C) WB analysis of LC3 expression in HGrC1 cells treated with 100mM maltose (Mal), 100mM Tre, or 200/100mM glucose (Glu) (mM) for 24 hours. Actin was used as the control. The control cells were cultured in a medium only. (D) Autophagy flux assay in HGrC1 cells treated with Tre for 24 hours. Cells were treated with 100mM Tre for 24 hours, followed by chloroquine (CQ, 100 µM) for 2 hours before the harvest. (E) WB analysis of autophagy-related proteins in HGrC1 cells treated with 100mM Tre for 24 hours. WB were shown as follows: Rubicon, Beclin1, LC3, p62, UVRAG, Ulk1, TFEB, ATG3, ATG5, ATG14, and actin. (F) WB analysis of Rubicon expression in HGrC1 cells treated with 100mM Mal, 100mM Tre, or 200/100mM Glu (mM) for 24 hours. Actin was used as the control. The control cells were cultured in a medium only. Results were obtained from at least three independent experiments. Significant difference tests were also performed. Data are expressed as the mean ± S.D. **p<0.01, ****p<0.0001.
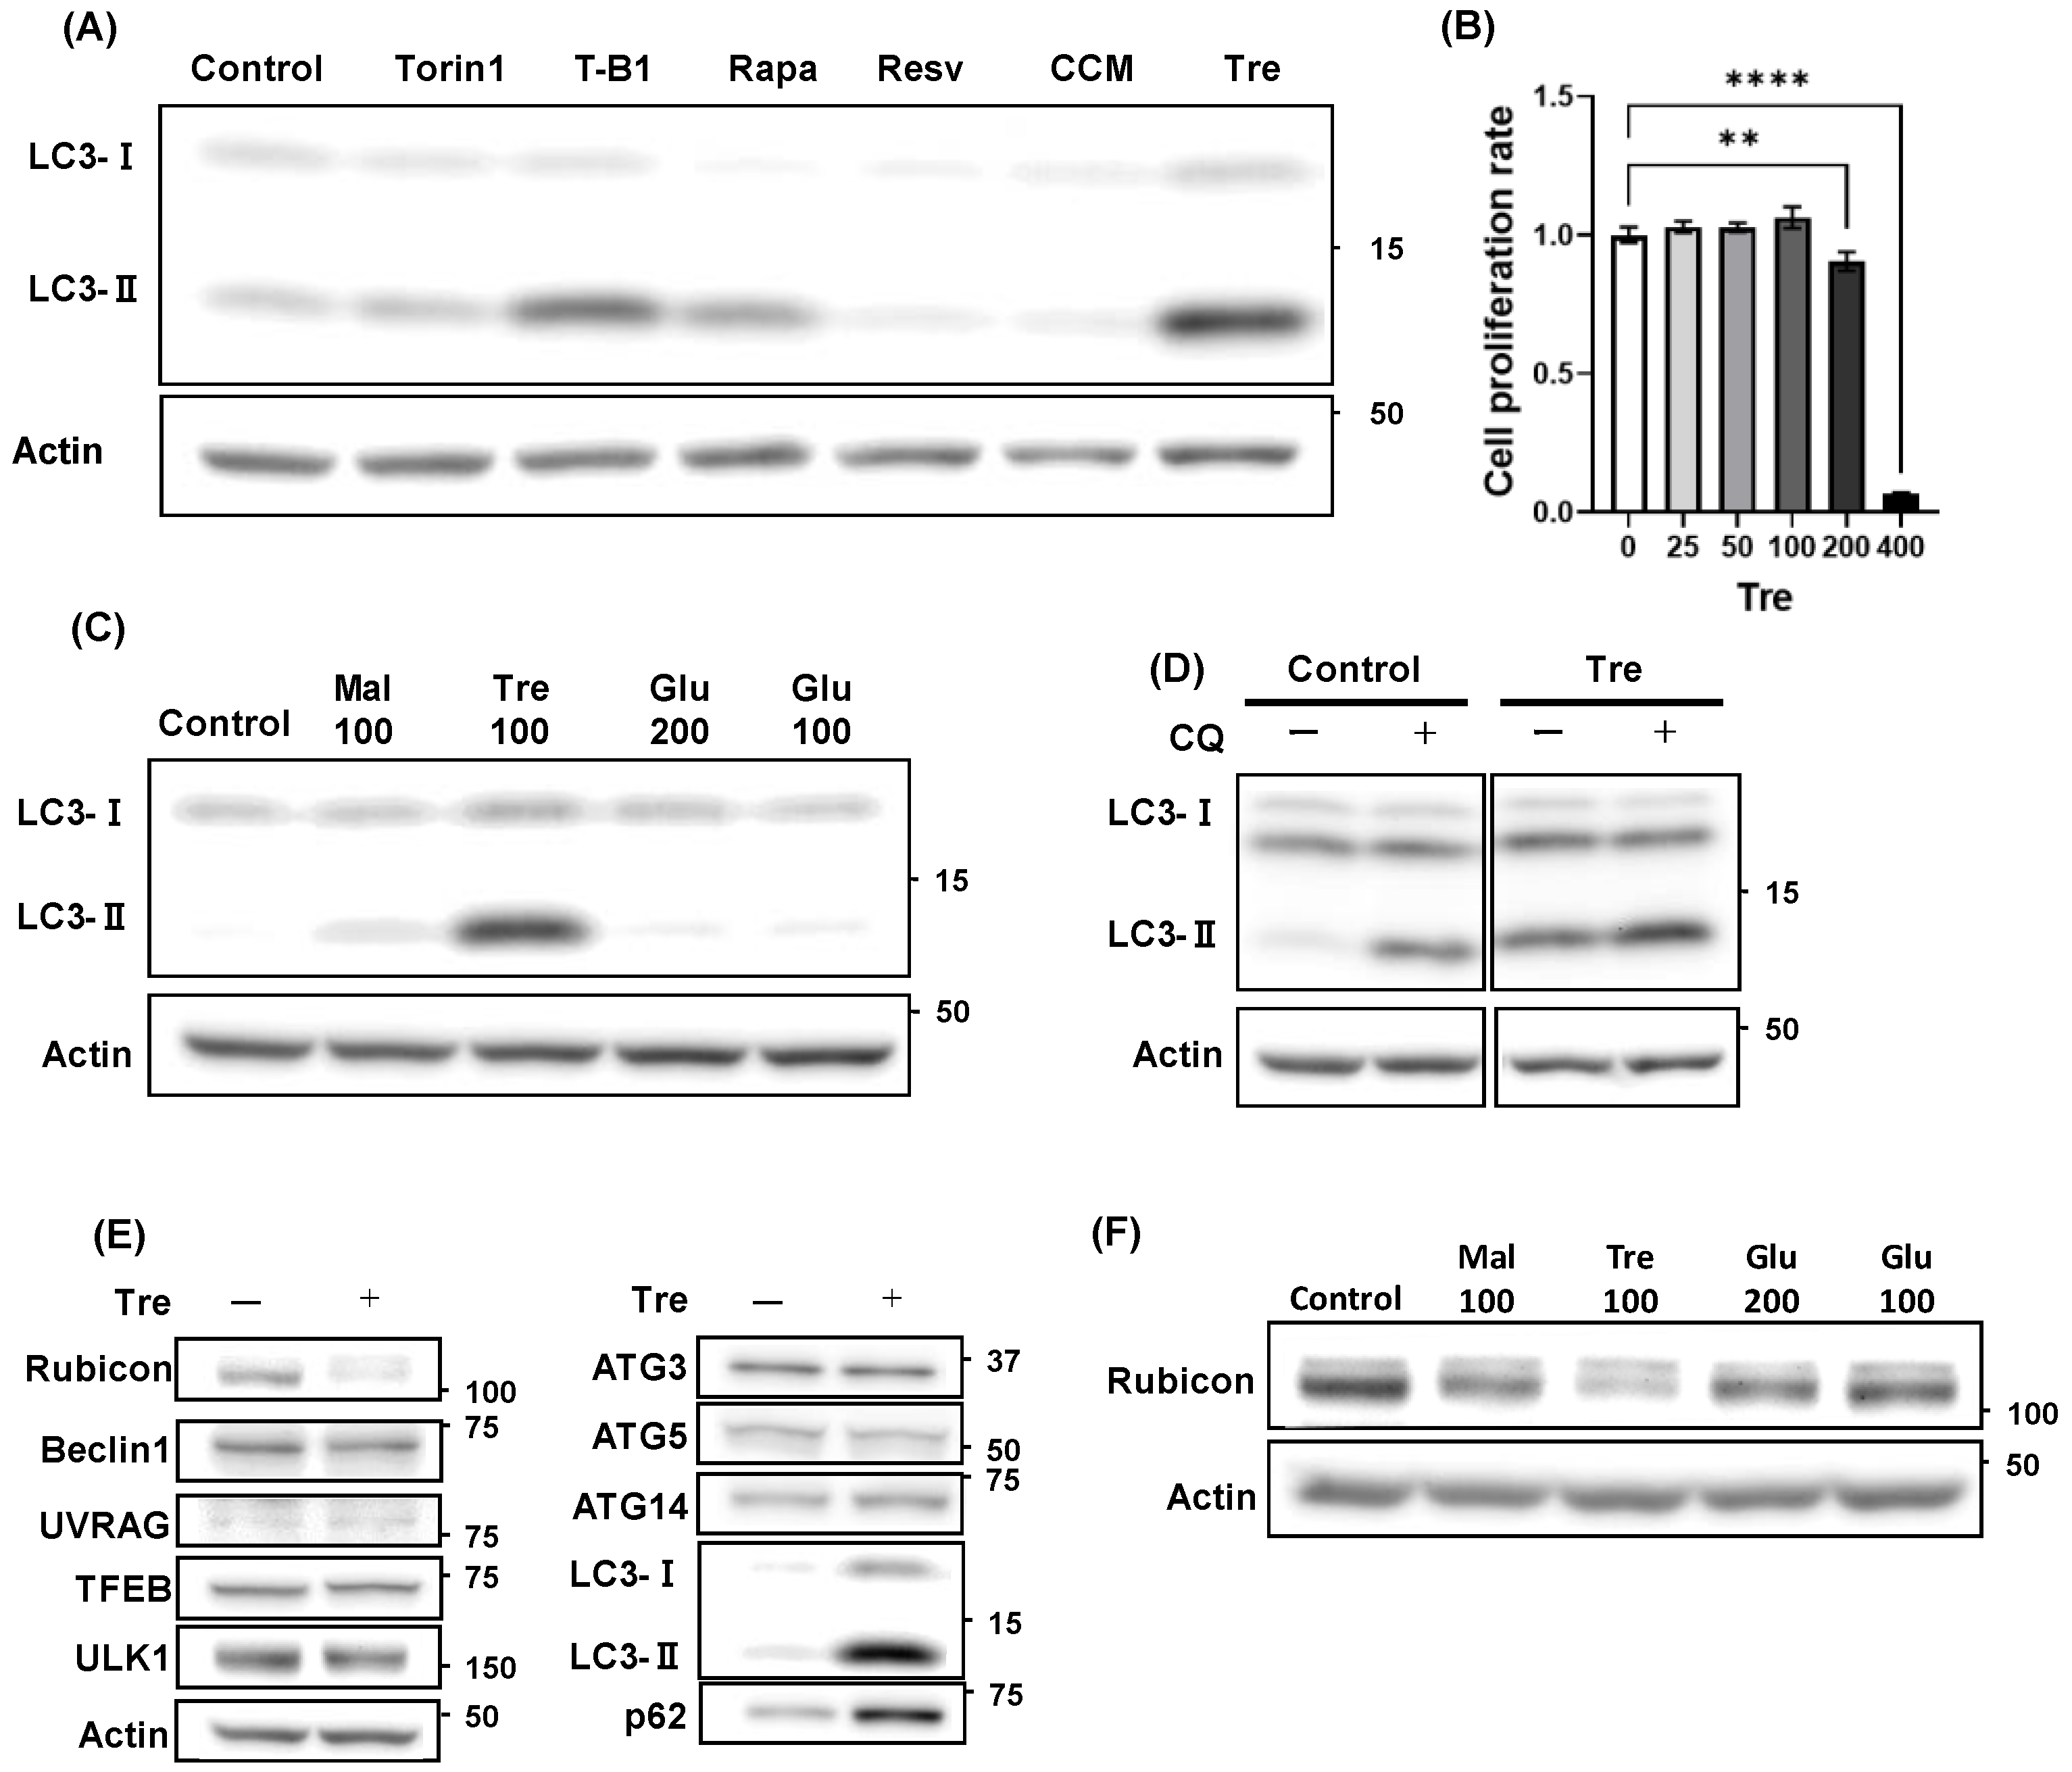
Figure 4.
Trehalose-enhanced oxidative stress resistance in HGrC1 cells. (A) Cell viability assessed using the WST-1 assay in HGrC1 cells with various concentrations of H₂O₂ in the presence of 100mM trehalose (Tre) for 24 hours. The Y-axis represented the mean fluorescence intensity, and the X-axis showed the H₂O₂ concentration (mM). B) ROS levels of HGrC1 cells treated with H₂O₂ treatment at either 0 or 125 µM for 2 hours. The Y-axis shows fluorescence intensity normalized to the average value at 0 µM H₂O₂. The X-axis indicates H₂O₂ concentration (µM). (C) WB analysis of DNA damage responsive proteins in HGrC1 cells treated with 125 µM H₂O₂ in the presence or absence of 100mM Tre for 24 hours. Western blots were shown as follows: p-ATM, ATM, p-p95, p95, γH2AX, and actin. Actin was used as the control. (D) Immunofluorescence staining of γH2AX in HGrC1 cells treated with 250 µM H₂O₂ in the presence or absence of 100mM Tre for 24 hours. Scale bar, 200µm. (E) The graphs showed the fluorescence intensity of γH2AX based on the images in (D). The X-axis showed H₂O₂ concentration (µM), and the Y-axis represented the fluorescence intensity. Results were obtained from at least three independent experiments. Significant difference tests were also performed. Data are expressed as the mean ± S.D. *p<0.05.
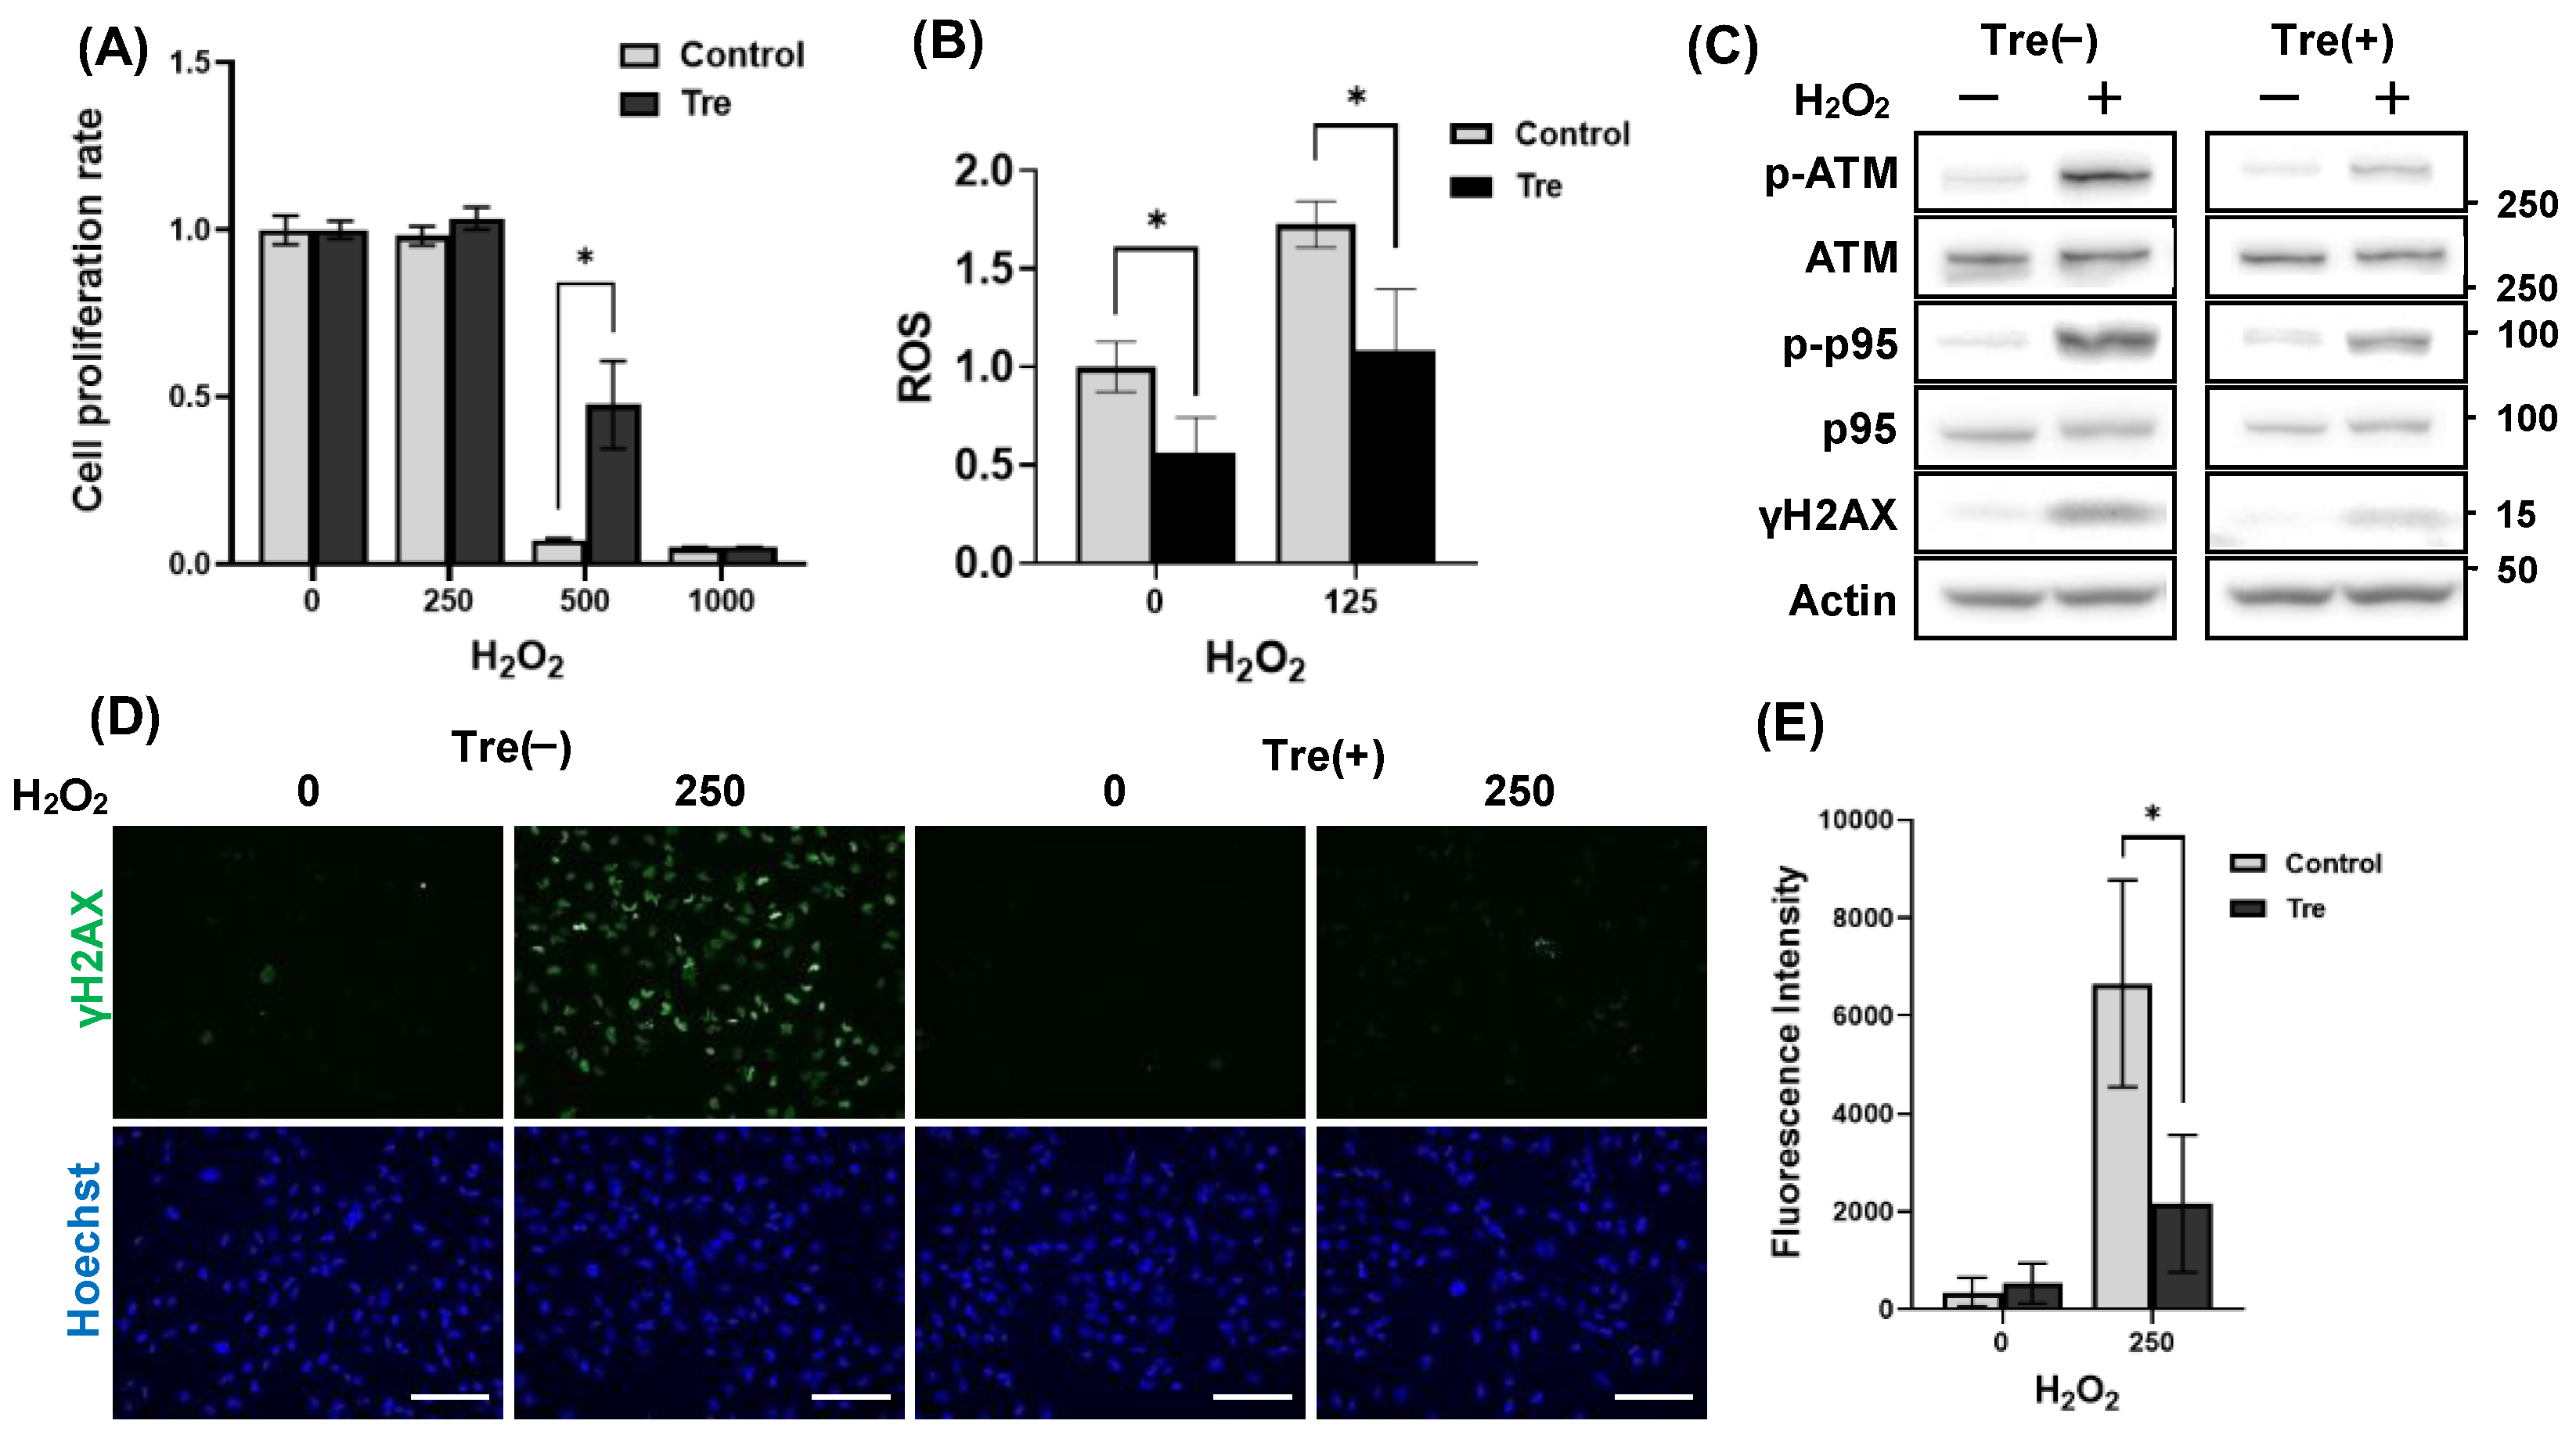
Figure 5.
Effects of Rubicon knockdown on autophagy activity and oxidative stress resistance. (A) WB analysis of Rubicon in HGrC1 cells to evaluate the levels of Rubicon-knockdown using siRNA. Cells were treated with each siRNA at a final concentration of 10nM for 48 hours. siNC represented the negative control; while, siRub1, siRub2, and siRub3 corresponded to siRNAs targeting Rubicon. (B) Autophagy flux assay in HGrC1 cells, which were introduced with siNC, siRub2, or siRub3. After 48 hours of siRNA transduction, cells were treated with 100 µM chloroquine (CQ) for 2 hours before the harvest. Actin was used as an internal control. (C) Cell viability assessed using the WST-1 assay in HGrC1 cells, which were introduced with siNC, siRub2, or siRub3, with various concentrations of H₂O₂. The Y-axis represented the mean fluorescence intensity, and the X-axis showed the H₂O₂ concentration (µM). (D) WB analysis of DNA damage responsive proteins in HGrC1 cells, which were introduced with siNC, siRub2, or siRub3, treated with 250 µM H₂O₂ for 24 hours. Western blots were shown as follows: Rubicon, p-ATM, ATM, p-p95, p95, γH2AX, and actin. Actin was used as the control. Results were obtained from at least three independent experiments. Significant difference tests were also performed. Data are expressed as the mean ± S.D. *p<0.05.
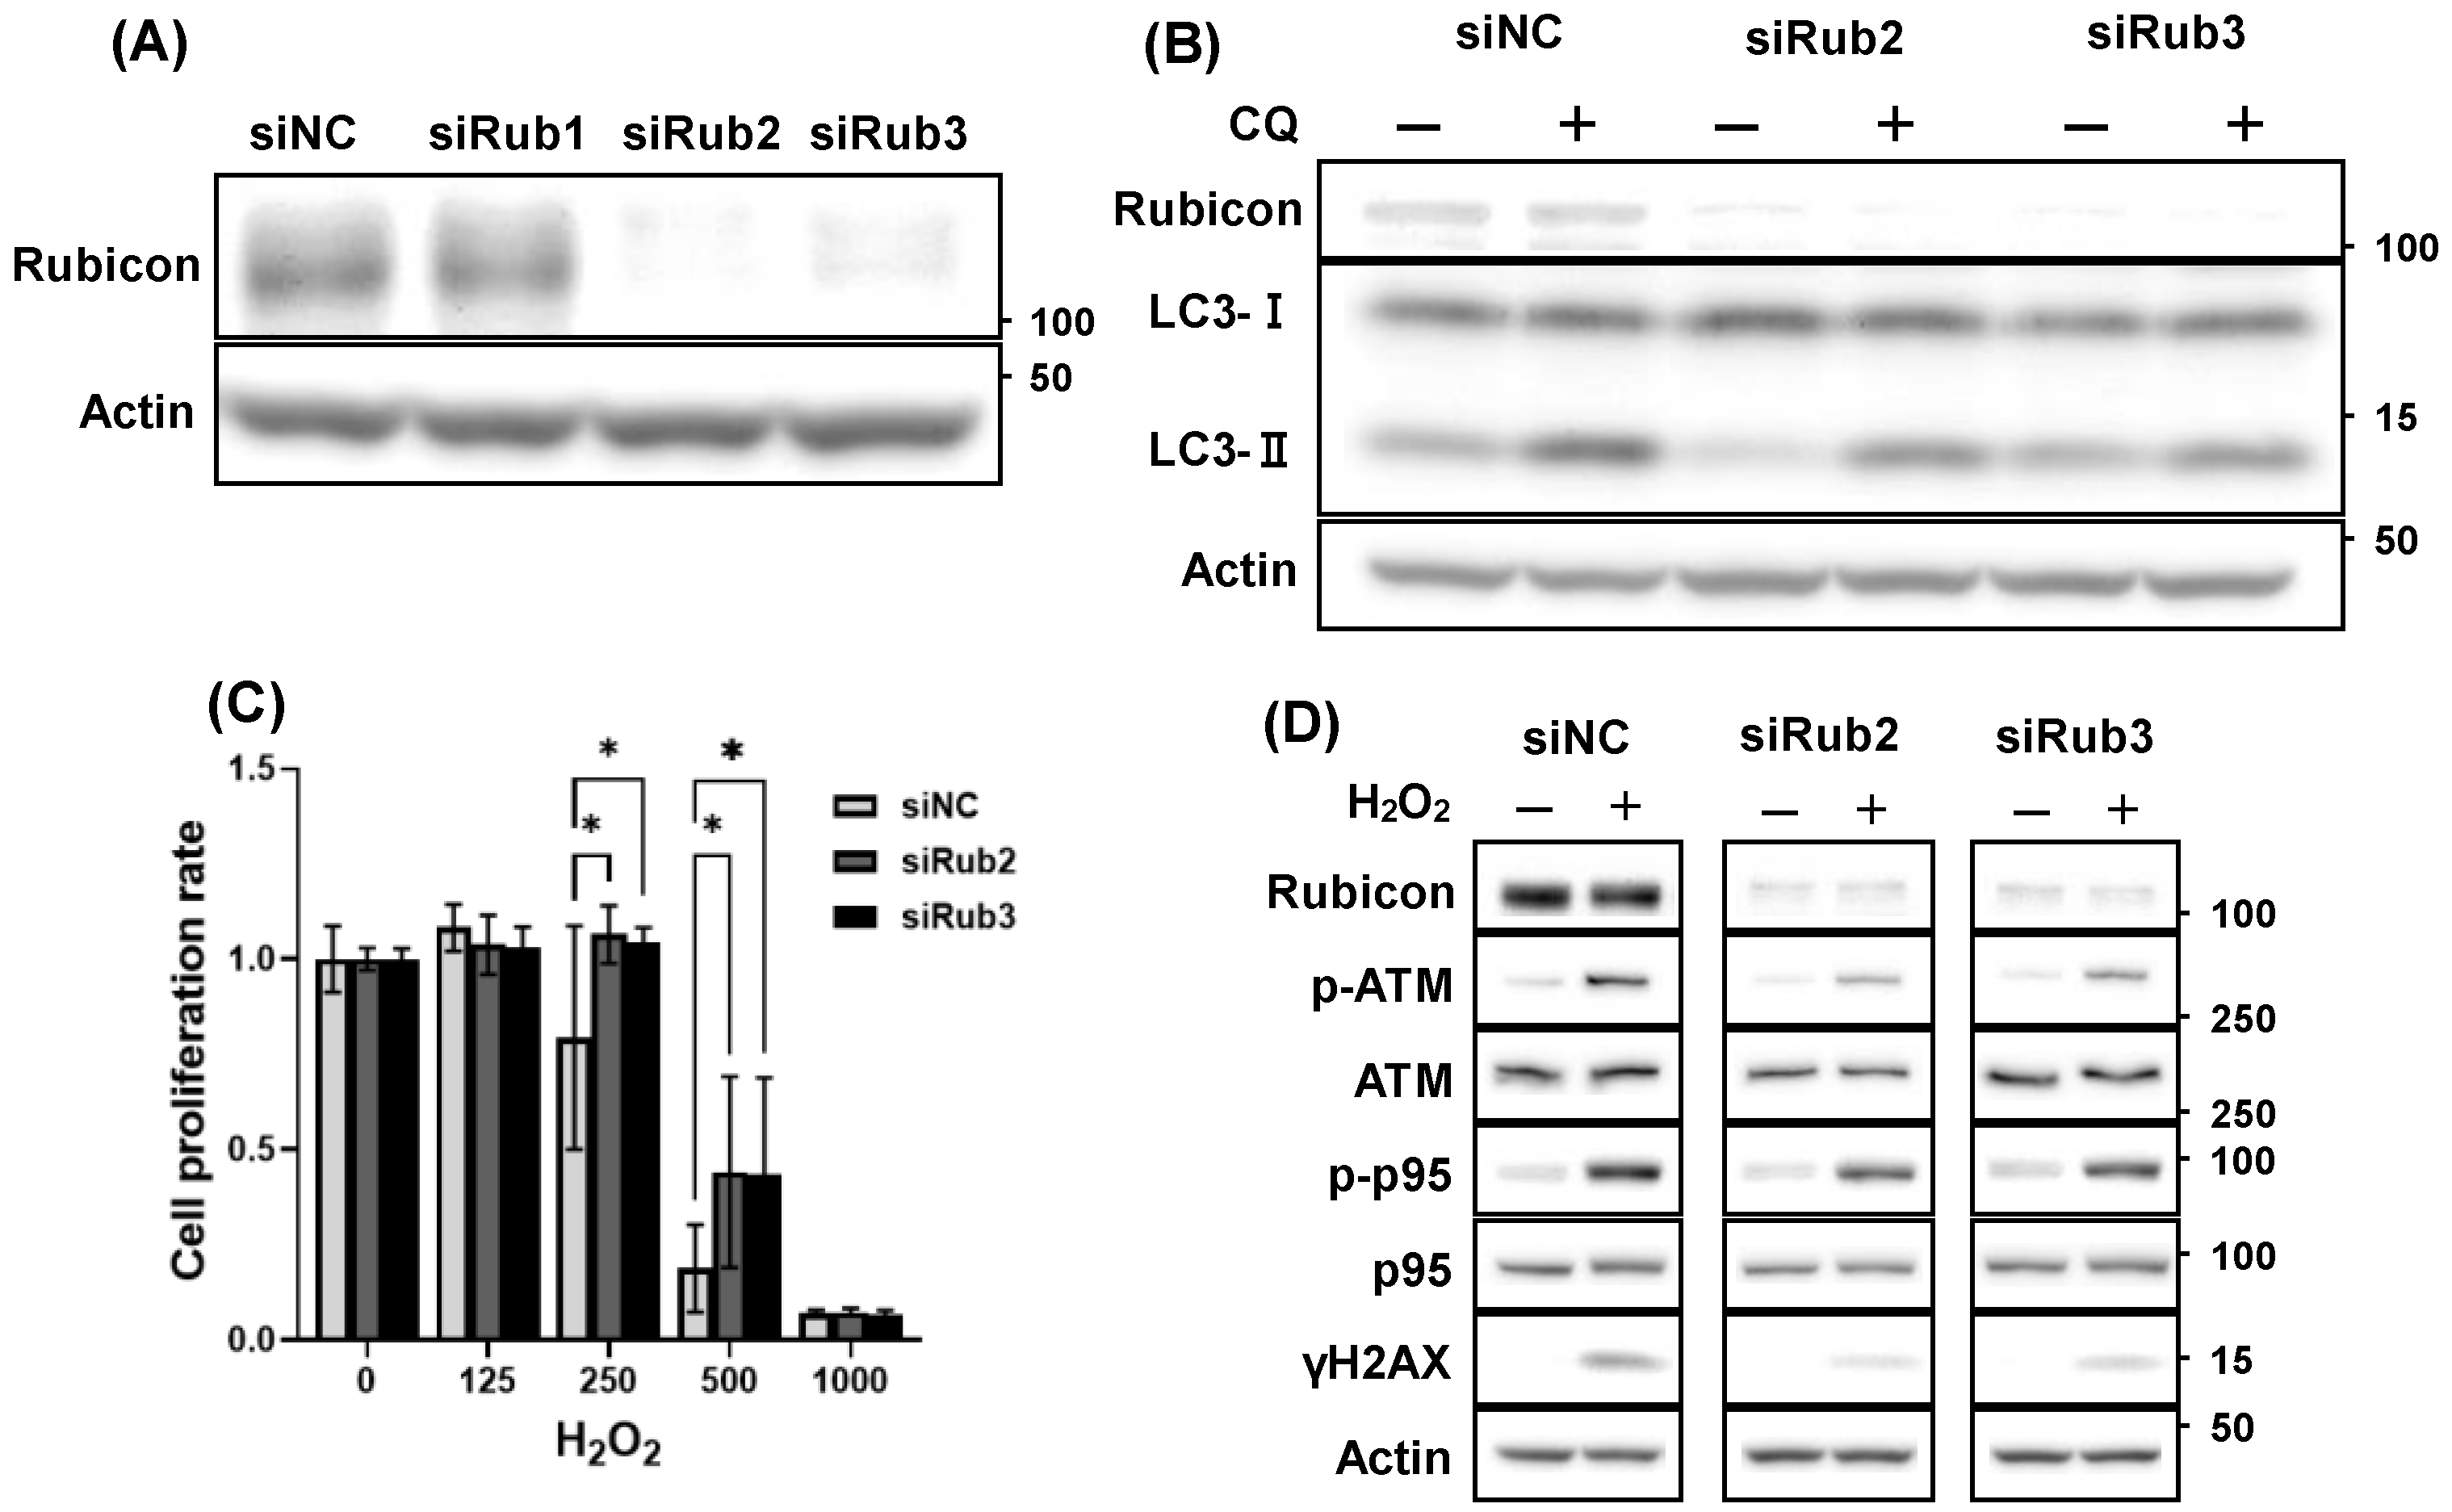
Figure 6.
Enhancement of the oxidative stress by Rubicon overexpression. (A) WB analysis of Rubicon expression in human ovarian tissue. The left four lanes represent premenopausal samples, while the right four lanes correspond to postmenopausal samples. (B) Quantification of Rubicon expression in human ovarian tissue. Rubicon expression levels were evaluated as a ratio relative to Actin. Significant difference tests were also performed. Data are expressed as the mean ± S.D. *p<0.05.
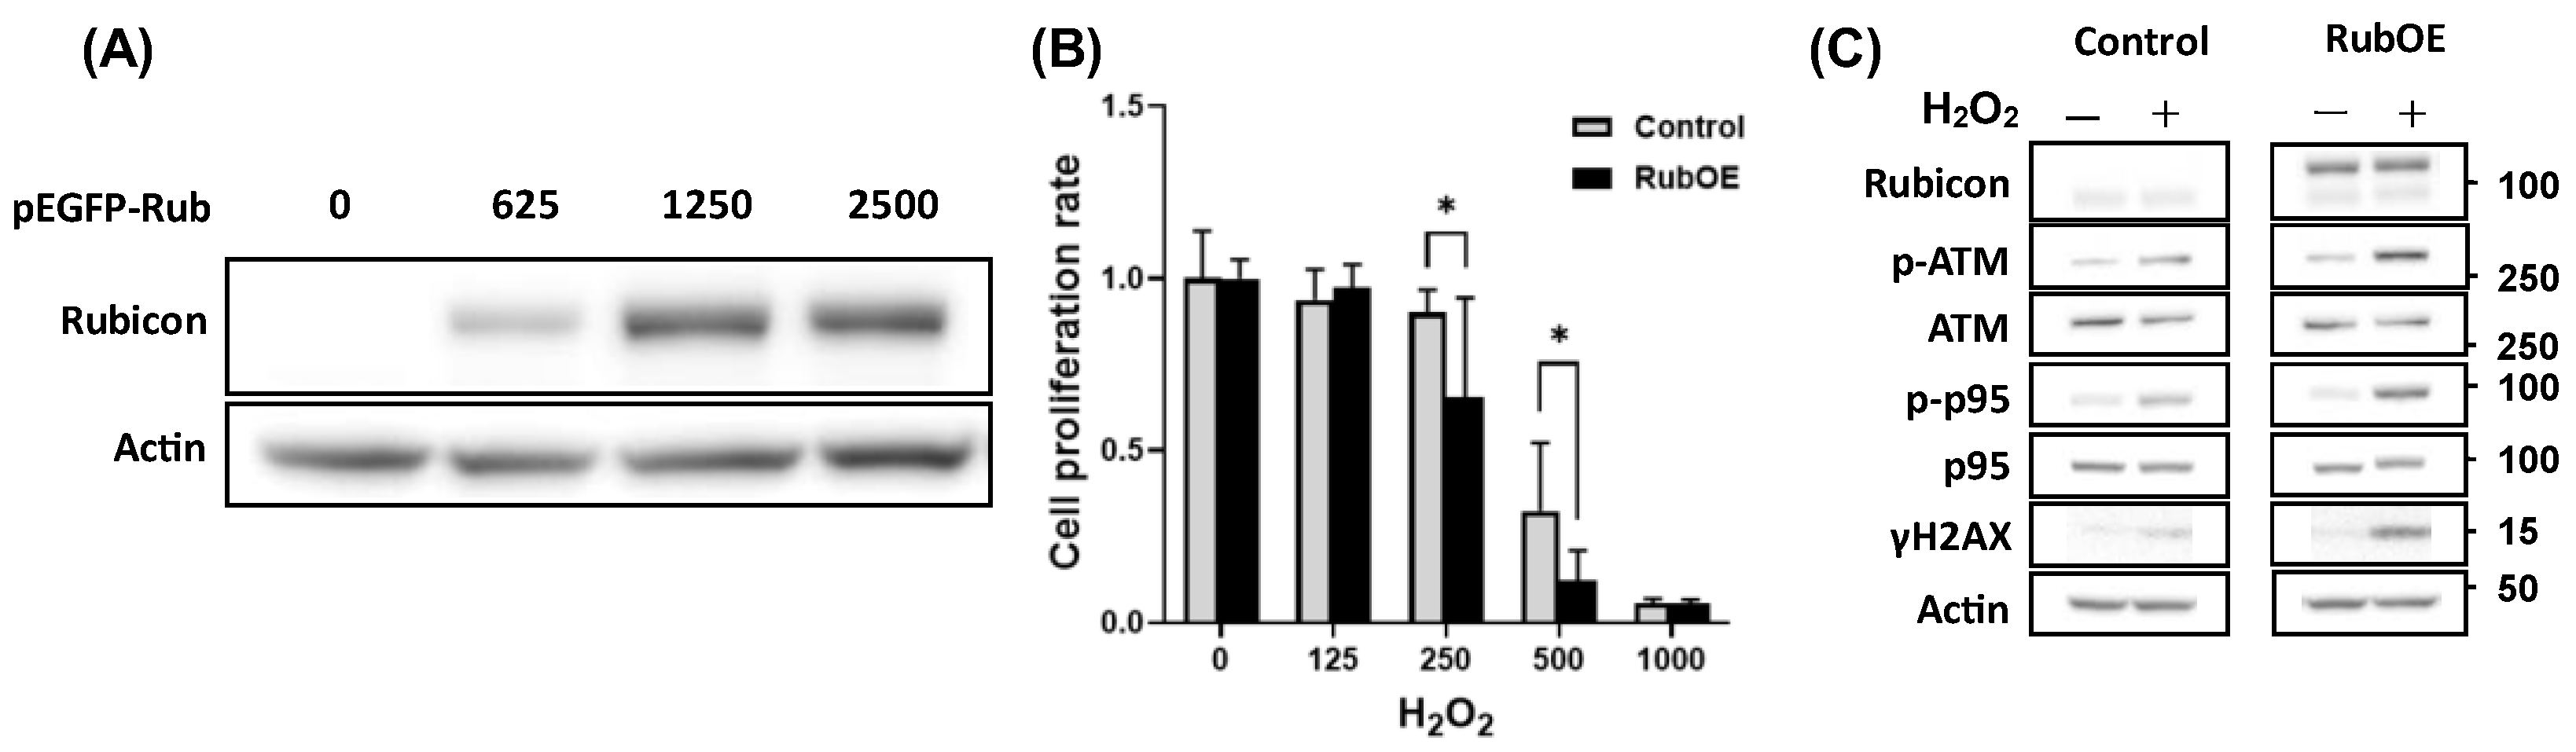
Figure 7.
Comparison of Rubicon Expression in Human Ovary Pre and Post Menopause. (A) WB analysis of Rubicon in human ovarian tissue. The left four lanes represent premenopausal samples, while the right four lanes correspond to postmenopausal samples. (B) The graphs showed the expression levels of Rubicon, which were normalized to that of Actin. PreMP means premenopausal group, and PostMP means postmenopausal group. Significant difference tests were also performed. Data are expressed as the mean ± S.D. *p<0.05.
Disclaimer/Publisher’s Note: The statements, opinions and data contained in all publications are solely those of the individual author(s) and contributor(s) and not of MDPI and/or the editor(s). MDPI and/or the editor(s) disclaim responsibility for any injury to people or property resulting from any ideas, methods, instructions or products referred to in the content. |
© 2025 by the authors. Licensee MDPI, Basel, Switzerland. This article is an open access article distributed under the terms and conditions of the Creative Commons Attribution (CC BY) license (http://creativecommons.org/licenses/by/4.0/).
Copyright: This open access article is published under a Creative Commons CC BY 4.0 license, which permit the free download, distribution, and reuse, provided that the author and preprint are cited in any reuse.


