
Submitted:
14 October 2024
Posted:
16 October 2024
You are already at the latest version
Abstract
The development of pre-hierarchical follicle (PHF), especially small yellow follicles (SYFs), directly affects the recruitment of dominant follicles and thus affects the egg-laying performance of chickens. However, the development of PHF, especially the development of SYF, and its regulatory mechanism remain unclear. Therefore, we performed transcriptomic and metabolomic analyses of large white follicles (LWFs) and SYFs in chickens. Transcriptome sequencing revealed 258 differentially expressed genes (DEGs) between SYF and LWF, of which 172 were upregulated and 86 were downregulated. The DEGs were mapped to 17 KEGG pathways, mainly the gap junction, calcium signaling, and neuroactive ligand-receptor interaction pathways. The results of the metabolome analysis revealed 129 significant differential metabolites (DMs), including 36 upregulated DMs and 93 downregulated DMs. The DMs were mapped to 9 KEGG pathways for follicle tissue, which included mainly glutathione metabolism, alpha-linolenic acid metabolism, and tryptophan metabolism, etc. The combined transcriptional and metabolic analysis revealed significantly enriched pathways, and four metabolically related pathways, including glutathione metabolism, alpha-linolenic acid metabolism, linoleic acid metabolism, and pyrimidine metabolism, were identified. Glutathione metabolism is a critical signaling pathway that may affect ovarian follicle development to regulate the SYF reserve process in chickens. These results can act as a reference for improving the egg-laying performance of Tengchong snow chickens.
Keywords:
egg laying chickens
; follicle
; transcriptome analysis
; reverse transcription-qPCR
; metabolome analysis
1. Introduction
Egg-laying performance is an important economic index in the chicken breeding process and has attracted much attention from researchers. The Tengchong snow chicken is a famous domestic chicken breed in China. It is a very valuable chicken resource. It has the advantages of black flesh, a fresh taste, and beautiful feathers. However, the egg production of Tengchong snow chickens is low, and the egg-laying cycle of some chickens is shortened [1]. Therefore, improving the egg production of Tengchong snow chickens has become a matter of concern for the chicken industry. Improving the genetic potential of egg production is an important strategy for increasing egg production.
Egg-laying performance depends on the development and selection of ovarian follicles in chickens [2]. The development and selection of follicles is an extremely complex process that eventually atresia or develops until ovulation [3]. Follicles in chickens start developing with the recruitment of the original follicle, which continues to grow, undergoes selection, and finally matures and ovulates [4]. After hens become sexually mature, their ovaries get filled with many follicles at different stages of development, which are usually arranged according to the strict hierarchy of follicles and are generally divided into the PHF and hierarchical follicle (HF) stages [5]. According to the volume (from small to large) and yolk color, the former can be divided into the small white follicle (SWF, diameter 1–4 mm) stage, large white follicle (LWF, diameter 4–6 mm) stage, and small yellow follicle (SYF, diameter 6–8 mm) stage. The latter is divided into F5 to F1 stages according to the volume from small to large; the follicles in the F1 stage are about to ovulate, followed by the F2 stage, and so on. Each stage is a tightly controlled process [6]. The follicle reserve at each stage may affect the ovulation cycle, and ultimately, ovulation efficiency, especially in the SYF stage [7]. To maintain sustained ovulation, 1–2 SYFs are selected from the HF stage every day to enter the rank follicle stage, and then they start growing rapidly and eventually differentiate to become the dominant follicle, a process also known as follicle selection [8]. The greater the number of 6–8 mm SYFs selected to enter the HF, the longer the laying cycle and the better the egg-laying performance. Thus, the development of PHF, especially SYF, directly affects the recruitment of dominant follicles; therefore, the development of PHF and their regulatory mechanism need to be studied to improve egg-laying performance.
In this study, we focused on the LWF and SYF stages. These are the critical stages of follicle selection and represent the follicles before and after selection. We aimed to identify regulatory genes and metabolites involved in the development and selection of follicles in chickens. Our findings may provide new insights into the morphological changes and molecular mechanisms underlying follicle selection.
2. Results
2.1. Histological Observation of Follicles
One or two layers of GCs were found in the LWF (Figure 1 A) and two layers of GCs were found in the SYF (Figure 1B). During follicle development, the layers of SYF GCs (9.92–1.20 μm; Figure 1B) were significantly thicker than those of LWF GCs (7.92–1.30 μm; Figure 1A). The area of single GCs in the SYF was significantly greater than that in the LWF, and the GCs in the LWF were more densely arranged (Figure 1 A and B). Figure 1. This is a figure. Schemes follow the same formatting.
2.2. Transcriptome Analysis
2.2.1. Data Summary of the Transcriptome
- Eight cDNA libraries were constructed using the samples obtained from the SYF and LWF groups. A total of 379.34 million raw reads were obtained. After removing adaptors and low-quality reads, 374.79 million clean reads were obtained. The average number of clean reads was 97.92% for Q20 and 94.21% for Q30. The average GC content of the clean reads was 49.05%. Eight cDNA library sequences were mapped to the genome, and the comparison range was 88.25–90.52% (Table 1). FASTQ files were submitted to the NCBI database, and when the article is accepted and the data is released immediately.
2.2.2. Analysis of DEGs
A total of 258 DEGs were identified in SYF vs. LWF, of which 172 were upregulated and 86 were downregulated (Figure 2A, Table S2). In the heat map, the color difference reflects the information of the DEGs. The samples from the same group were clustered together to visualize the gene expression patterns of each group (Figure 2B).
2.2.3. KEGG Analysis of DEGs
2.2.4. Verification of DEGs by RT-qPCR
We randomly selected the DEGs (GRXCR2, AVPR1B, BMP15, DMRT2, STRA6, and GP9) for RT-qPCR validation. The results showed that the relative levels of expression of three genes (DMRT2, STRA6, and GP) were greater in SYF than in LWF. The relative expression levels of three genes (GRXCR2, AVPR1B, and BMP15) were lower in SYF than in LWF (Figure 2D). The relative mRNA levels of the selected genes were consistent with the results of the transcriptome analysis.
2.3. Metabolomics Analysis
2.3.1. Analysis of PCA and OPLS-DA
- Principal component analysis (PCA) is an unsupervised multivariate statistical analysis method used to determine overall metabolic differences between groups as well as changes in samples within each group. The PCA score plot results showed that the overall trend of metabolite distribution in the SYF and LWF samples was separated in the negative model (Figure 3A) and the positive model (Figure 3D). Additionally, by plotting the OPLS-DA score, a clear separation of metabolites between the SYF and LWF groups was found in the negative model (Figure 3B) and the positive model (Figure 3E). Displacement tests were conducted to determine the accuracy of the OPLS-DA model (Figure 3C and F).
2.3.2. Analysis of DMs
In the negative mode, 77 significant DMs were identified, including 13 upregulated DMs and 64 downregulated DMs (Figure 4A and Table S4). In the positive mode, 52 significant DMs were identified, including 23 upregulated DMs and 29 downregulated DMs (Figure 4D and Table S5). In the heat map, the color difference reflects the information of the DMs. The samples from the same group clustered together, and the heat map visually reflected the metabolomic expression patterns of the three groups (Figure 4B and E).
2.3.3. KEGG Analysis of DMs
The functional enrichment of DMs in the SYF and LWF groups was performed using KEGG. In total, seven and two significantly enriched pathways were identified in the negative model (Figure 4C and Table S6) and the positive model (Figure 4F, Table S7), respectively. The pathways mainly included glutathione metabolism, alpha-linolenic acid metabolism, tryptophan metabolism, linoleic acid metabolism, etc.
2.4. Integrated Analysis of Transcriptomics and Metabolomics
The KEGG analysis of the DEGs and DMs showed that the metabolome and transcriptome shared seven KEGG pathways (Figure 5A and B). Four pathways associated with metabolism, including glutathione metabolism, alpha-linolenic acid metabolism, linoleic acid metabolism, and pyrimidine metabolism, were enriched (Figure 5B). We examined the correlations between DMs and DEGs related to glutathione metabolism, alpha-linolenic acid metabolism, linoleic acid metabolism, and pyrimidine metabolism. A Pearson correlation analysis of 10 metabolites and 14 genes showed that the 13 genes were significantly positively or negatively correlated with one or more of the 10 metabolites (Figure 5C and D).
Based on the above results, we identified a network that may regulate follicular development in Tengchong snow chickens (Figure 6), which involves mainly glutathione metabolism pathways associated with SDMs and DEGs. However, the regulatory network of follicular development in chickens is very complex, and only a small part of this network is understood. Therefore, further studies are needed to investigate and confirm these findings.
3. Discussion
As the development of SYF directly affects the recruitment of dominant follicles, it is important to study the development of SYF and its regulatory mechanism for improving egg-laying production performance. As a key component of ovarian follicles, GCs proliferate rapidly during follicular development to provide nutrients to these follicles [[10[M1] ,11]. Second, GCs proliferate rapidly and differentiate into grade GCs that can secrete various factors to regulate the maturation of oocytes and the production of steroid hormones [12]. We made paraffin sections of chicken follicles and observed their morphological characteristics. We found that the GC layer of SYF was significantly thicker than that of LWF during the selection of follicles. The thickness of the GC layer increased due to the proliferation of GCs, which promotes the transition from pre-layered follicles to layered follicles [13,14]. With the development of the GC layer, the area of a single GC increased, and the layer showed a loose arrangement. Therefore, the development of SYF and its regulatory mechanism are highly important for improving egg-laying performance. However, the specific molecular regulatory mechanism involved needs to be elucidated.
The KEGG pathway analysis revealed that the DEGs identified in the SYF and LWF groups were associated with 17 significant signaling pathways, such as the calcium signaling pathway, gap junction, neuroactive ligand-receptor interaction, etc. The calcium signaling pathway that initiates development in many mammalian and non-mammalian follicles has been extensively studied [15,16,17]. The calcium signaling pathway stimulates the maturation of the oocyte [18]. This pathway involves the GRIN2A, EGF, and FGF8 genes. Ovarian steroid hormones can increase GRIN2A expression, thus affecting follicle development [19]. Additionally, GRIN2A may be used as a biomarker to predict oocyte maturation in CCs [20]. EGF directly affects follicle development [21]. FGF8 directly affects the number of bovine ovarian sinus follicles [22]. Gap junctions affect the development of ovarian folliculation [23]. This pathway involves the TUBA1C, ADCY7, and EGF genes. No study has reported the connection between the TUBA1C and ADCY7 genes and follicle development. As EGF is closely related to the development of follicles, the EGF gene may play an important role in ovarian development. The neuroactive ligand-receptor interaction pathway also plays an important role in the development of follicles. Studies have indicated that neuroactive ligand-receptor interactions are related to ovarian follicle development and egg production in poultry [24,25,26]. This pathway involves the P2RY8, P2RX2, and GRIN2A genes. No study has reported the relationship between the P2RY8, P2RX2, and GRIN2A genes and follicle development. These unreported genes need to be further investigated.
Metabolomics is a relatively new field that has emerged in response to genetics and proteomics. It can provide information on the physiological state of organisms by monitoring changes in endogenous metabolites. Metabolomics is extensively used in various fields to study a wide range of animals. In this study, the metabolome analysis revealed 129 significant DMs, including 36 upregulated and 93 downregulated DMs. These DMs may also play important roles in the development of chicken follicles.
The DMs were mapped to nine KEGG pathways in the SYF and LWF groups, which included glutathione metabolism, alpha-linolenic acid metabolism, pyrimidine metabolism, etc. Glutathione is an antioxidant and electrophilic toxicant that prevents the destruction of ovarian follicles and oocytes by toxicants [27,28]. Glutathione helps protect mature ovarian follicles from apoptotic stimuli, including PAHs [29,30]. Additionally, glutathione deficiency affects germ cell apoptosis in cultured embryonic mouse ovaries [31]. These findings suggest that glutathione metabolism may significantly affect follicle development in chickens. In cattle, alpha-linolenic acid significantly affects oocyte development [32]. High alpha-linolenic acid intake can promote ovulation in rats [33]. Therefore, alpha-linolenic acid metabolism also plays an important role in follicular development in chickens. Pyrimidine metabolism is closely related to follicle development in Chinese hamsters [34]. Our results suggested that these pathways were enriched, indicating that they regulate follicle development in chickens.
The Venn diagram plotted in this study indicated that the DMs and DEGs that shared four pathways were associated with glutathione metabolism. Our findings also showed that glutathione metabolism plays a role in regulating follicle development.
4. Materials and Methods
4.1. Animals and Sample Collection
Tengchong snow chickens obtained from Baoshan, Yunnan Province, China, were raised at the experimental chicken farm of Kunming University. All chickens were kept isolated in the same environment under a 10-h/14-h light/dark cycle. Egg-laying in chickens reaches peak performance when they are 26 weeks old. The hens were euthanized, and follicles were collected at 26 weeks of age. The follicles used for RNA sequencing and RT-qPCR were immediately frozen in liquid nitrogen and then stored at -80 °C.
4.2. Histological Observation of Follicles
At the age of 26 weeks, 24 hens (n = 12 from each group) were slaughtered, and their ovaries were collected and dissected. The follicles were fixed in a 4% (volume/volume) buffered formaldehyde solution for 24 h, routinely dried, and embedded in paraffin wax. The sections were stained with hematoxylin and eosin. All sections were observed under a microscope.
4.3. Transcriptome Analysis
4.3.1. RNA Extraction, cDNA Library Construction, and Sequencing
Total RNA was extracted from LWFs and SYFs of chickens (n = 4, each group) using TRIzol reagent (Invitrogen, CA, USA) following the manufacturer's instructions. Quality control of RNA was performed using an Agilent 2100 bioanalyzer (Agilent Technologies, CA, USA) to detect the integrity and total volume of RNA. A cDNA library was constructed, high-throughput sequencing was performed on the Illumina HiSeq 5000 platform of Beijing Novo Technology Co., Ltd., and the paired-end 150 bp sequencing platform was used for sequencing. By capturing the fluorescence signal and converting the light signal into a sequencing peak using computer software, the sequencer can obtain the sequence information of the fragment to be tested. Eight biological samples were used for RNA-seq.
4.3.2. Bioinformatics Analyses
The sequence fragments were converted into sequence data (reads) by CASAVA (Version 1.8) base recognition. The RNA-seq data were pretreated with fastq (version 0.19.7) to remove adapters and low-quality sequences. The clean reads were mapped to the chicken reference genome using the HISAT2 software (version 2.0.5) (ftp://ftp.ncbi.nlm.nih.gov/genomes/all/GCF_000002315.4_Gallus_gallus-5.0_genomic.gff.gz). The result obtained by the Hisat2 software was a sam format file, and we converted it into a bam format file using samtools (Version 1.5). We visually browsed the bam file with the Integrative Genomics Viewer (IGV) browser. The featureCounts tool in subreads was used to quantify gene expression. The Cufflinks (version 2.2.1) software was used to normalize gene expression levels based on the number of transcript fragments per kilobase per million mapped reads (FPKM). The number of reads per gene map was counted using the HTSeq (Version 0.6.1) software. DEGs were identified using the DESeq2 (version 1.32.0) software. The screening criteria for DEGs were a |log2-fold fold change| ≥1 and padj < 0.05. The DEGs of all comparison groups were collected and combined into differential gene sets. GO functional enrichment analysis and KEGG pathway enrichment analysis were performed using clusterProfiler.
4.3.3. Quantitative Reverse Transcription PCR (qRT-PCR)
To determine the accuracy and repeatability of the RNA-seq results, six genes were selected for RT-qPCR to measure their expression levels in different follicles. Primers for the amplification of candidate genes, including NPC intracellular cholesterol transporter 2 (NPC2), glutaredoxin and cysteine rich domain containing 2 (GRXCR2), arginine vasopressin receptor 1B (AVPR1B), bone morphogenetic protein 15 (BMP15), doublesex and mab-3 related transcription factor 2 (DMRT2), stimulated by retinoic acid gene 6 (STRA6), and glycoprotein IX platelet (GP9), were designed using Prime-Blast tools from the NCBI database. These primers are listed in Supplemental Table S1.
Total RNA was extracted from the follicle tissue of chickens in each group (n = 6) using a method identical to that used for transcriptome analysis, and cDNA was synthesized using a reverse transcription kit (TaKaRa, Dalian, China). RT-qPCR was performed on a CFX96TM Real-Time System (Bio-Rad, CA, USA) using a SYBR premix Ex TaqTM II kit (Tiangen, Beijing, China). The 2-ΔΔCT method was used to determine gene expression levels, and beta-actin was used as the endogenous reference gene for normalization.
4.4. Metabolomics Analysis
4.4.1. Metabolite Extraction
Metabolites were extracted from chicken SYF and LWF tissues. Four replicates were used for each group, and eight libraries were constructed. The tissue samples (100 mg) were mixed with liquid nitrogen and placed in an EP tube, and 500 μL of 80% methanol aqueous solution was added. The mixture was incubated in an ice bath for 5 min and then centrifuged at 15,000 ×g at 4 °C for 20 min. Then, a certain amount of the supernatant was collected and diluted with ultrapure water until the methanol content decreased to 53%. The mixture was centrifuged at 15,000 ×g at 4 °C for 20 min, the supernatant was collected, and LC-MS/MS analysis was performed.
4.4.2. LC-MS/MS Conditions
The metabolites were separated using a Vanquish UHPLC (Thermo Fisher, MA, USA) Hypesil Gold column (Thermo Fisher, MA, USA). The column temperature was 40 °C, and the flow rate was 0.2 mL/min. The mobile phase consisted of buffer A (0.1% formic acid) and buffer B (methanol). Throughout the analysis, the samples (2 µL) were placed in an automatic injector at 4 °C. QC samples were inserted into the sample queue to monitor and evaluate the stability of the system and the reliability of the test data. The samples were analyzed by a high-resolution mass spectrometer (Q Exactive™ HF-X; Thermo Fisher, MA, USA) in both positive and negative ion modes of electrospray ionization (ESI).
4.4.3. Metabolomics Data Analysis
The KEGG database (https://www.genome.jp/kegg/pathway.html), HMDB (https://hmdb.ca/metabolites), and LIPIDMaps database (http://www.lipidmaps.org/) were used to identify the metabolites.
For multivariate statistical analysis, the metabolomics data processing software metaX [9] was used to transform the data, and then principal component analysis (PCA) and partial least square discriminant analysis (PLS-DA) were performed to obtain the VIP value of each metabolite. In the univariate analysis, the statistical significance (P value) of each metabolite between the two groups was calculated by conducting t-tests, and the fold change (FC value) of the metabolite between the two groups was calculated. The default criteria for differential metabolite screening were VIP > 1, P < 0.05, and FC ≥ 2 or FC ≤ 0.5. The volcano map was drawn using the R package (version 3.4.3) ggplot 2, and three parameters of the VIP value, log2 (fold change) and -log10 (P value), of the metabolites were integrated to screen the metabolites of interest.
A bubble map was drawn using ggplot2, and the KEGG database was used to study the functions and metabolic pathways of the metabolites. When x/n>y/n, the metabolic pathway was considered to be enriched. The metabolic pathway was considered to be significantly enriched when the P-value was <0.05.
4.5. Conjoint Analysis of the Metabolome and Transcriptome
The metabolome and transcriptome were analyzed together. Common significant signaling pathways between the transcriptome and metabolome were identified and displayed using the online Wien tool (https://www.omicstudio.cn/tool). In order to investigate the correlation between DEGs and DMs, a combined analysis of the selected DEGs and DMs from both the metabolome and transcriptome was performed, followed by the construction of a transcriptional-metabolite network with a Pearson correlation coefficient exceeding 0.7 (https://www.omicstudio.cn/tool).
4.6. Statistical Analyses
All data were statistically analyzed using SPSS 22.0. The data were presented as the mean ±standard error. The differences in parameters between the two groups of samples were determined by conducting Student’s t-tests. All differences among and between groups were considered to be statistically significant at P < 0.05; one asterisk (*) indicates P < 0.05, and two asterisks (**) indicate P < 0.01.
5. Conclusions
To summarize, in this study, we analyzed the genetic landscape of ovarian follicle development and selection in chickens. In total, 258 DEGs were identified in SYF vs. LWF. Functional annotation analysis revealed that gap junctions, the calcium signaling pathway, neuroactive ligand-receptor interactions, etc., were involved in chicken follicle selection and development. In total, 129 significant DMs were identified in SYF vs. LWF. The results of a functional annotation analysis showed that glutathione metabolism, alpha-linolenic acid metabolism, and pyrimidine metabolism were involved in chicken follicle selection and development. By performing an association analysis between transcriptomics and metabolomics, four metabolically related pathways, including glutathione metabolism, alpha-linolenic acid metabolism, linoleic acid metabolism, and pyrimidine metabolism, were identified. Glutathione metabolism is a critical signaling pathway that may affect ovarian follicle development to regulate the SYF reserve in chickens. However, the genetic mechanisms underlying follicle development and selection in chickens are very complex, and the functions and regulatory networks associated with these important metabolites and genes need to be further studied. The results of this study help us understand the molecular processes of follicle development and selection in chickens and provide a theoretical basis for studying the molecular regulatory mechanisms underlying the development of chicken follicles.
Supplementary Materials
The following supporting information can be downloaded at the website of this paper posted on Preprints.org.
Author Contributions
Conceptualization, Yanli Du; software, Yanli Du; validation, Yanli Du; formal analysis, Yanli Du; investigation, Yanli Du and Xiannian Zi; resources, Jinshan Ran; data curation, Yanli Du; writing—original draft preparation, Yanli Du and Kun Wang; writing—review and editing, Yanli Du and Kun Wang; visualization, Yanli Du and Kun Wang; supervision, Yanli Du and Yong Liu; project administration, Jinshan Ran; funding acquisition, Yanli Du and Yong Liu. All authors have read and agreed to the published version of the manuscript
Funding
This research was funded by the Yunnan Basic Research Special Youth Project [202301AU070138, 202301AU070139], the Kunming University Talent Introduction Project [YJL23004], the Innovation and Entrepreneurship Training Program for College Students [S202311393024].
Institutional Review Board Statement
All animal experimental procedures were approved and guided by the Kunming University Animal Care and Use Committee (approval ID: kmu2024042).
Informed Consent Statement
Not applicable
Conflicts of Interest
The authors declare that they have no conflict of interest
References
- Wang, K; Ge, C.R.Current situation and protection of local chicken resources in Yunnan Province. Chinese livestock and poultry breeding industry. 2023,19(12):129-139.
- Kui, H; Li, P; Wang, T; Luo, Y; Ning, C; Li, M; Liu, S; Zhu, Q; Li, J; Li, D. Dynamic mRNA expression during chicken ovarian follicle development. G3 (Bethesda, Md.).2023,14(1), jkad237.
- Quirk, S. M. Hedgehog signaling pathway in ovarian follicle development. 39th Annual Meeting of the Society-for-the-Study-of-Reproduction.January 1, 2006.
- Shen, M; Sun, H; Qu, L; Ma, M; Dou, T; Lu, J; Guo, J; Hu, Y; Wang, X; Li, Y; Wang, K; Yang, N. Genetic Architecture and Candidate Genes Identified for Follicle Number in Chicken. Sci Rep. 2017, 7(1), 16412.
- Deng, Y; Gan, X; Chen, D; Huang, H; Yuan, J; Qiu, J; Hu, S; Hu, J; Wang, J. Comparison of growth characteristics of in vitro cultured granulosa cells from geese follicles at different developmental stages. Biosci Rep.2018, 38(2), BSR20171361.
- Nie, R;Zhang, W; Tian, H; Li, J; Ling, Y; Zhang, B; Zhang, H; Wu, C. Regulation of Follicular Development in Chickens: WIF1 Modulates Granulosa Cell Proliferation and Progesterone Synthesis via Wnt/β-Catenin Signaling Pathway. Int J Mol Sci.2024, 25(3), 1788.
- Onagbesan, O; Bruggeman, V; Decuypere, E. Intra-ovarian growth factors regulating ovarian function in avian species: a review. Anim Reprod Sci. 2009,111(2-4), 121–140.
- Johnson, A. L; Woods, D. C. Dynamics of avian ovarian follicle development: cellular mechanisms of granulosa cell differentiation. Gen Comp Endocrinol. 2009, 163(1-2), 12–17.
- Wen, B; Mei, Z; Zeng, C; Liu, S. metaX: a flexible and comprehensive software for processing metabolomics data. BMC bioinformatics.2017, 18(1), 183.
- Sugiura, K; Pendola, F. L; Eppig, J. J. Oocyte control of metabolic cooperativity between oocytes and companion granulosa cells: energy metabolism. Dev Biol.2005, 279(1), 20–30.
- Fitzharris, G; Baltz, J. M. Granulosa cells regulate intracellular pH of the murine growing oocyte via gap junctions: development of independent homeostasis during oocyte growth. Development .2006, 133(4), 591–599.
- Shao, T; Ke, H; Liu, R; Xu, L; Han, S., Zhang, X., Dang, Y., Jiao, X., Li, W., Chen, Z. J., Qin, Y., & Zhao, S. Autophagy regulates differentiation of ovarian granulosa cells through degradation of WT1. Autophagy,.2022,18(8), 1864–1878.
- Johnson A. L. Ovarian follicle selection and granulosa cell differentiation. Poult Sci. 2015, 94(4), 781–785.
- Braw-Tal R. The initiation of follicle growth: the oocyte or the somatic cells?. Mol Cell Endocrinol. 2002, 187(1-2), 11–18.
- Horner, V. L; Wolfner, M. F. Transitioning from egg to embryo: triggers and mechanisms of egg activation. Dev Dyn.2008,237(3), 527–544.
- Wakai, T; Vanderheyden, V; Yoon, S. Y; Cheon, B; Zhang, N; Parys, J. B; Fissore, R. A. Regulation of inositol 1,4,5-trisphosphate receptor function during mouse oocyte maturation. J Cell Physiol.2012, 227(2), 705–717.
- Deguchi, R; Kondoh, E; Itoh, J. Spatiotemporal characteristics and mechanisms of intracellular Ca(2+) increases at fertilization in eggs of jellyfish (Phylum Cnidaria, Class Hydrozoa). Dev Biol. 2005, 279(2), 291–307.
- Wakai, T; Mehregan, A; Fissore, R. A. Ca2+ Signaling and Homeostasis in Mammalian Oocytes and Eggs. Cold Spring Harb Perspect Biol.2019, 11(12), a035162.
- Bethea, C. L; Reddy, A. P. Ovarian steroids increase glutamatergic related gene expression in serotonin neurons of macaques. Mol Cell Neurosci.2012, 49(3), 251–262.
- Huang, X; Hao, C; Shen, X; Liu, X; Shan, Y; Zhang, Y; Chen, L. Differences in the transcriptional profiles of human cumulus cells isolated from MI and MII oocytes of patients with polycystic ovary syndrome. Reproduction .2013, 145(6), 597–608.
- Silva, C. M; Castro, S. V; Faustino, L. R; Rodrigues, G. Q; Brito, I. R; Rossetto, R; Saraiva, M. V; Campello, C. C; Lobo, C. H; Souza, C. E; Moura, A. A; Donato, M. A; Peixoto, C. A; Figueiredo, J. R. The effects of epidermal growth factor (EGF) on the in vitro development of isolated goat secondary follicles and the relative mRNA expression of EGF, EGF-R, FSH-R and P450 aromatase in cultured follicles. Res Vet Sci. 2013, 94(3), 453–461.
- Santos-Biase, W. K., Biase, F. H., Buratini, J., Jr, Balieiro, J., Watanabe, Y. F., Accorsi, M. F., Ferreira, C. R., Stranieri, P., Caetano, A. R., Meirelles, F. V. Single nucleotide polymorphisms in the bovine genome are associated with the number of oocytes collected during ovum pick up. Anim Reprod Sci.2012, 134(3-4), 141–149.
- Kidder, G. M; Mhawi, A. A. Gap junctions and ovarian folliculogenesis. Reproduction .2002, 123(5), 613–620.
- Yang, L; Fan, X; Tian, K; Yan, S; Xu, C; Tian, Y; Xiao, C; Jia, X; Shi, J; Bai, Y; Li, W. Dynamic Expression Profile of Follicles at Different Stages in High- and Low-Production Laying Hens. Genes.2023, 15(1), 40.
- He, Z; Chen, Q; Ouyang, Q; Hu, J; Shen, Z; Hu, B; Hu, S; He, H; Li, L; Liu, H; Wang, J. Transcriptomic analysis of the thyroid and ovarian stroma reveals key pathways and potential candidate genes associated with egg production in ducks. Poult Sci.2023, 102(1), 102292.
- Yan, X; Liu, H; Hu, J; Han, X; Qi, J; Ouyang, Q; Hu, B; He, H; Li, L; Wang, J; Zeng, X. Transcriptomic analyses of the HPG axis-related tissues reveals potential candidate genes and regulatory pathways associated with egg production in ducks. BMC genomics.2022,23(1), 281.
- Hornsby, P. J; Crivello, J. F. The role of lipid peroxidation and biological antioxidants in the function of the adrenal cortex. part 1: a background review.Mol Cell Endocrinol.1983,30(1), 1-20.
- Laloraya, M; Pradeep, K. G; Laloraya, M. M. Changes in the levels of superoxide anion radical and superoxide dismutase during the estrous cycle of Rattus norvegicus and induction of superoxide dismutase in rat ovary by lutropin. Biochem Biophys Res Commun.1988,157(1), 146–153.
- Tsai-Turton, M; Luderer, U. Opposing effects of glutathione depletion and follicle-stimulating hormone on reactive oxygen species and apoptosis in cultured preovulatory rat follicles. Endocrinology.2006, 147(3), 1224–1236.
- Tsai-Turton, M; Nakamura, B. N; Luderer, U. Induction of apoptosis by 9,10-dimethyl-1,2-benzanthracene in cultured preovulatory rat follicles is preceded by a rise in reactive oxygen species and is prevented by glutathione. Biol Reprod.2007,77(3), 442–451.
- Lim, J; Luderer, U. Glutathione deficiency sensitizes cultured embryonic mouse ovaries to benzo[a]pyrene-induced germ cell apoptosis. Toxicol Appl Pharmacol.2018, 352, 38–45.
- Marei, W. F. A; De Bie, J; Mohey-Elsaeed, O; Wydooghe, E; Bols, P. E. J; Leroy, J. L. M. R.Alpha-linolenic acid protects the developmental capacity of bovine cumulus-oocyte complexes matured under lipotoxic conditions in vitro. Biol Reprod.2017,96(6), 1181–1196.
- Broughton, K.S; Bayes, J; Culver, B. High α-linolenic acid and fish oil ingestion promotes ovulation to the same extent in rats. Nutr Res. 2010,30(10):731-738.
- Hordern, J; Henderson, J.F. Comparison of purine and pyrimidine metabolism in G1 and S phases of HeLa and Chinese hamster ovary cells. Can J Biochem. 1982,60(4):422-433.
Figure 1.
Follicular histological differences between large white follicles (LWFs) and small yellow follicles (SYFs). Histological characteristics of LWF (A) and SYF (B) samples. (C) Thickness of the granulosa cell (GC) layer. (D) The area of a single GC. H&E staining at 200×. The red rectangles indicate the GC layer; scale bar = 50 μm. One asterisk (*) indicates P < 0.05.
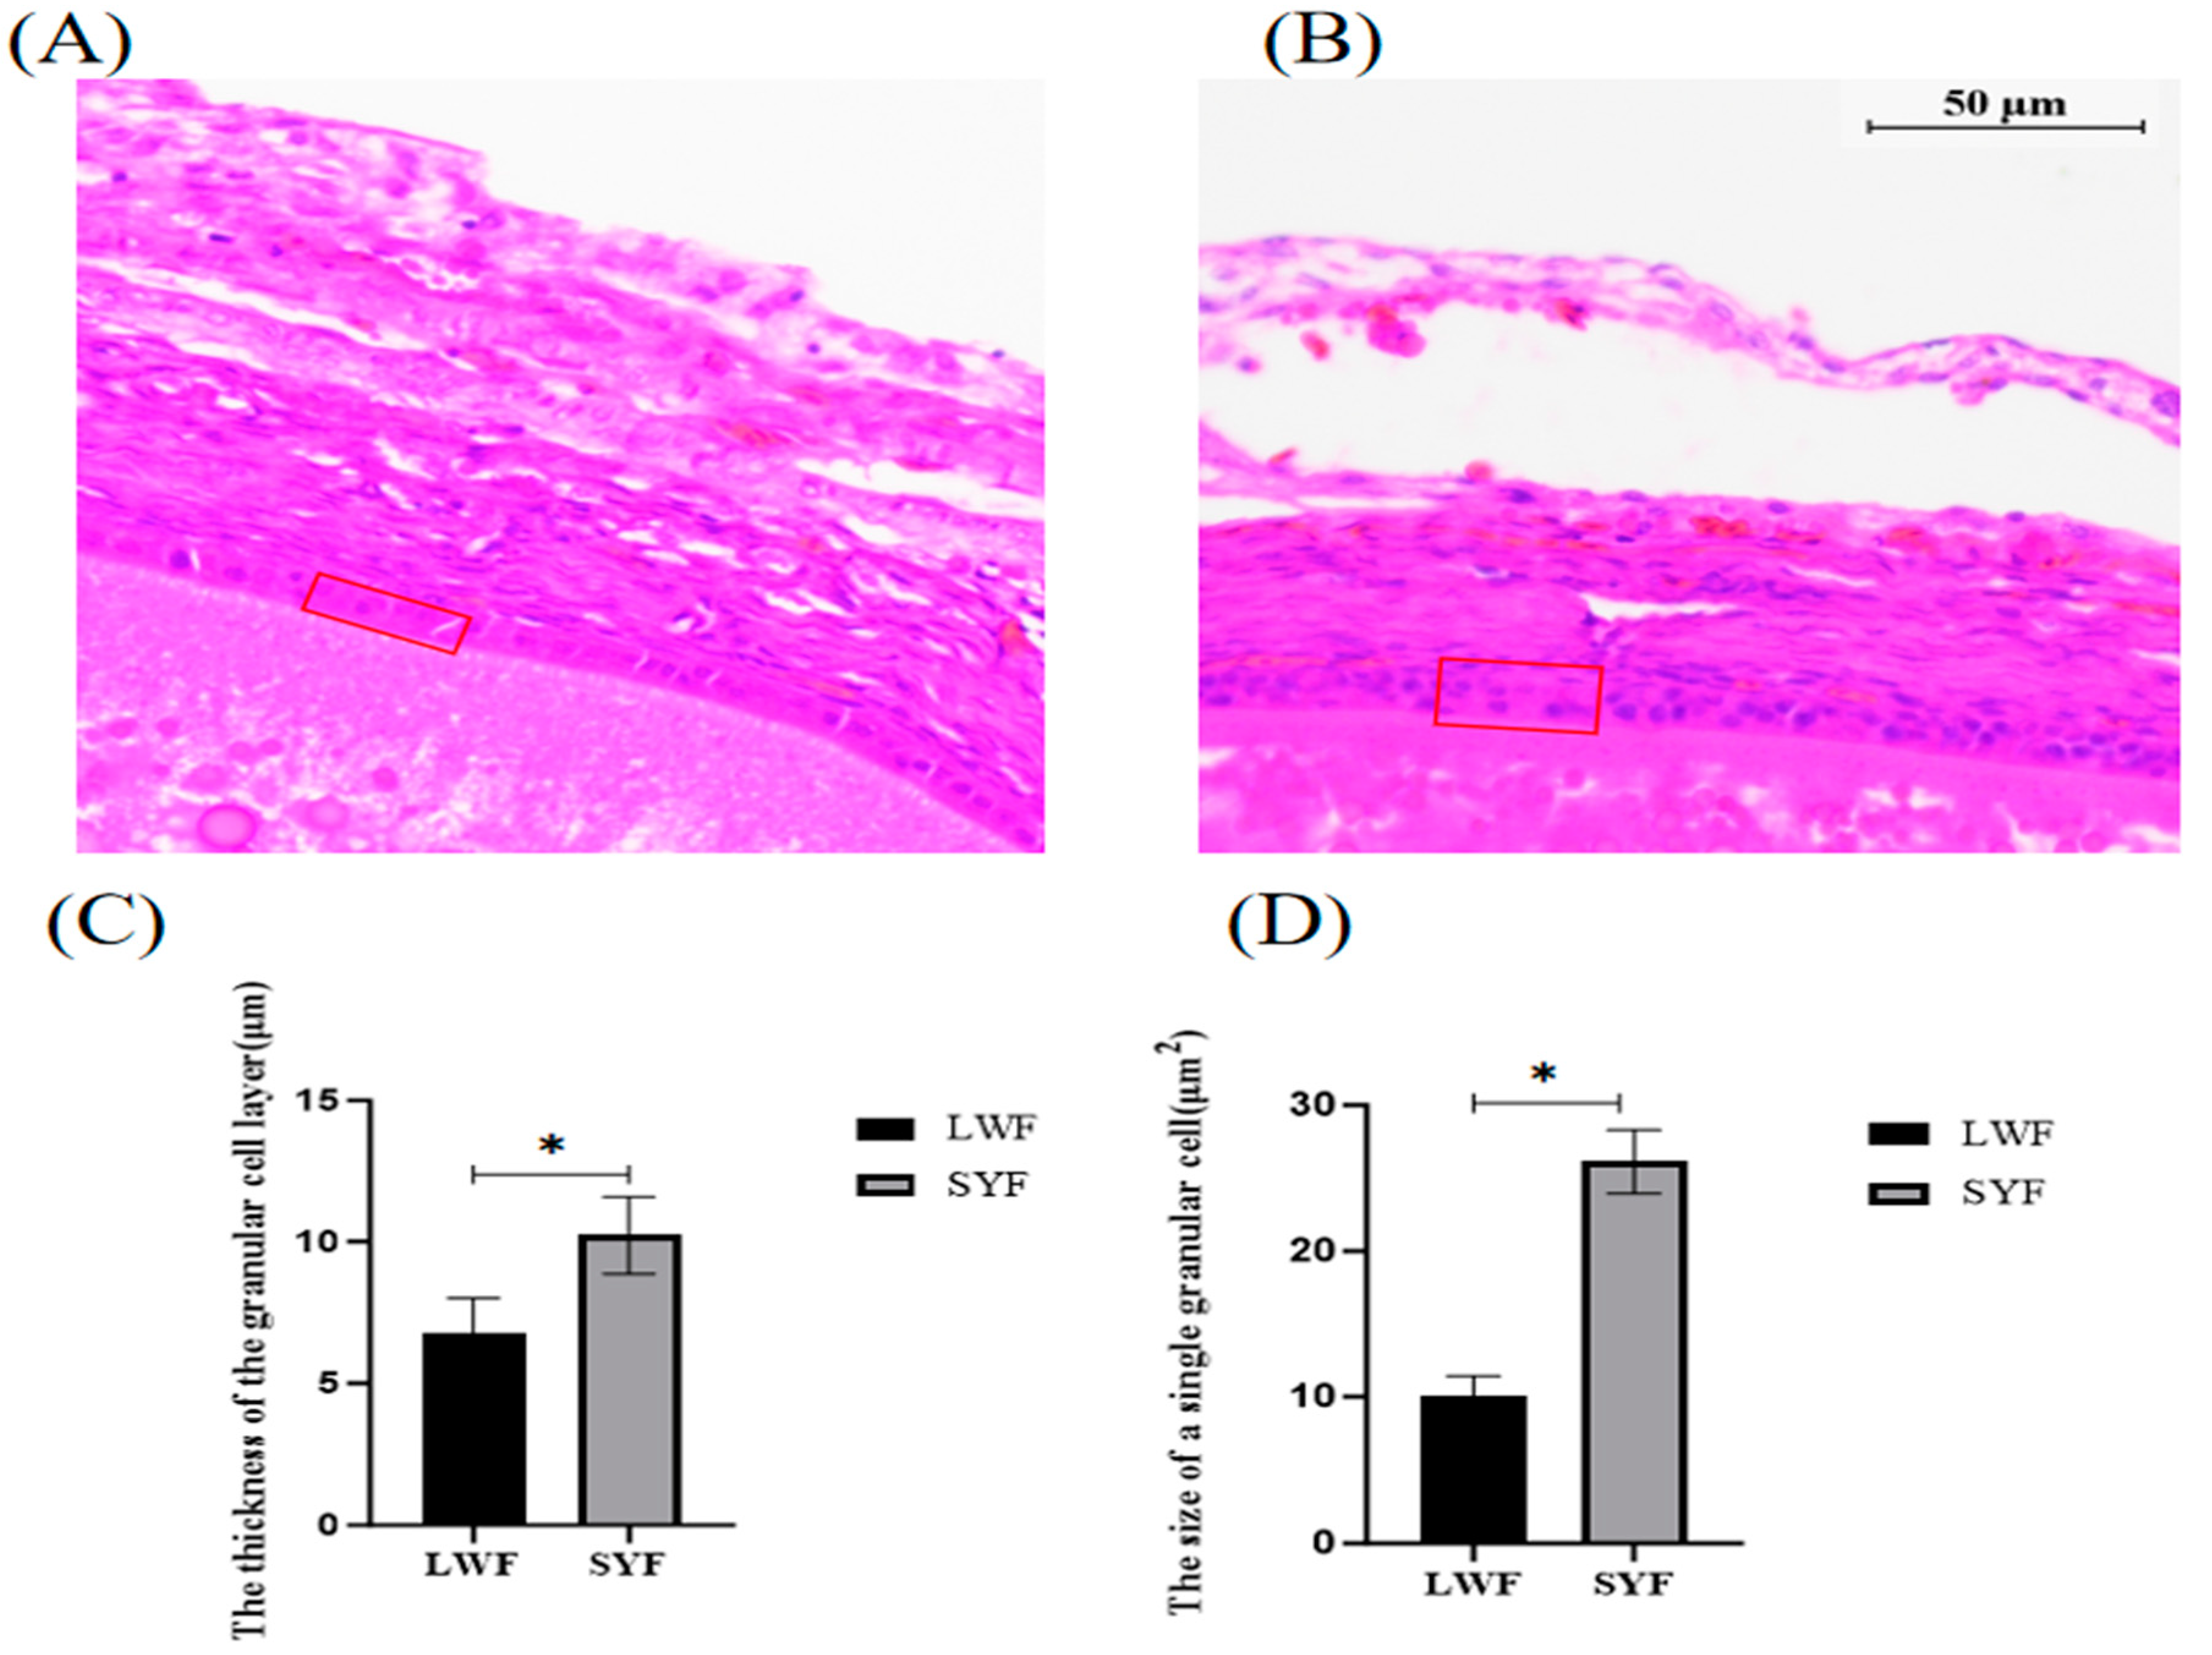
Figure 2.
Transcriptome analysis of SYF vs. LWF. (A) DEGs in SYF and LWF are shown. (B) Hierarchical cluster analysis of DEGs. Red indicates upregulation, and green indicates downregulation. (C) KEGG analysis of the DEGs in SYF and LWF. (D) Validation of DEGs via RT-qPCR in SYF and LWF. Y represents the SYF, and W represents the LWF.
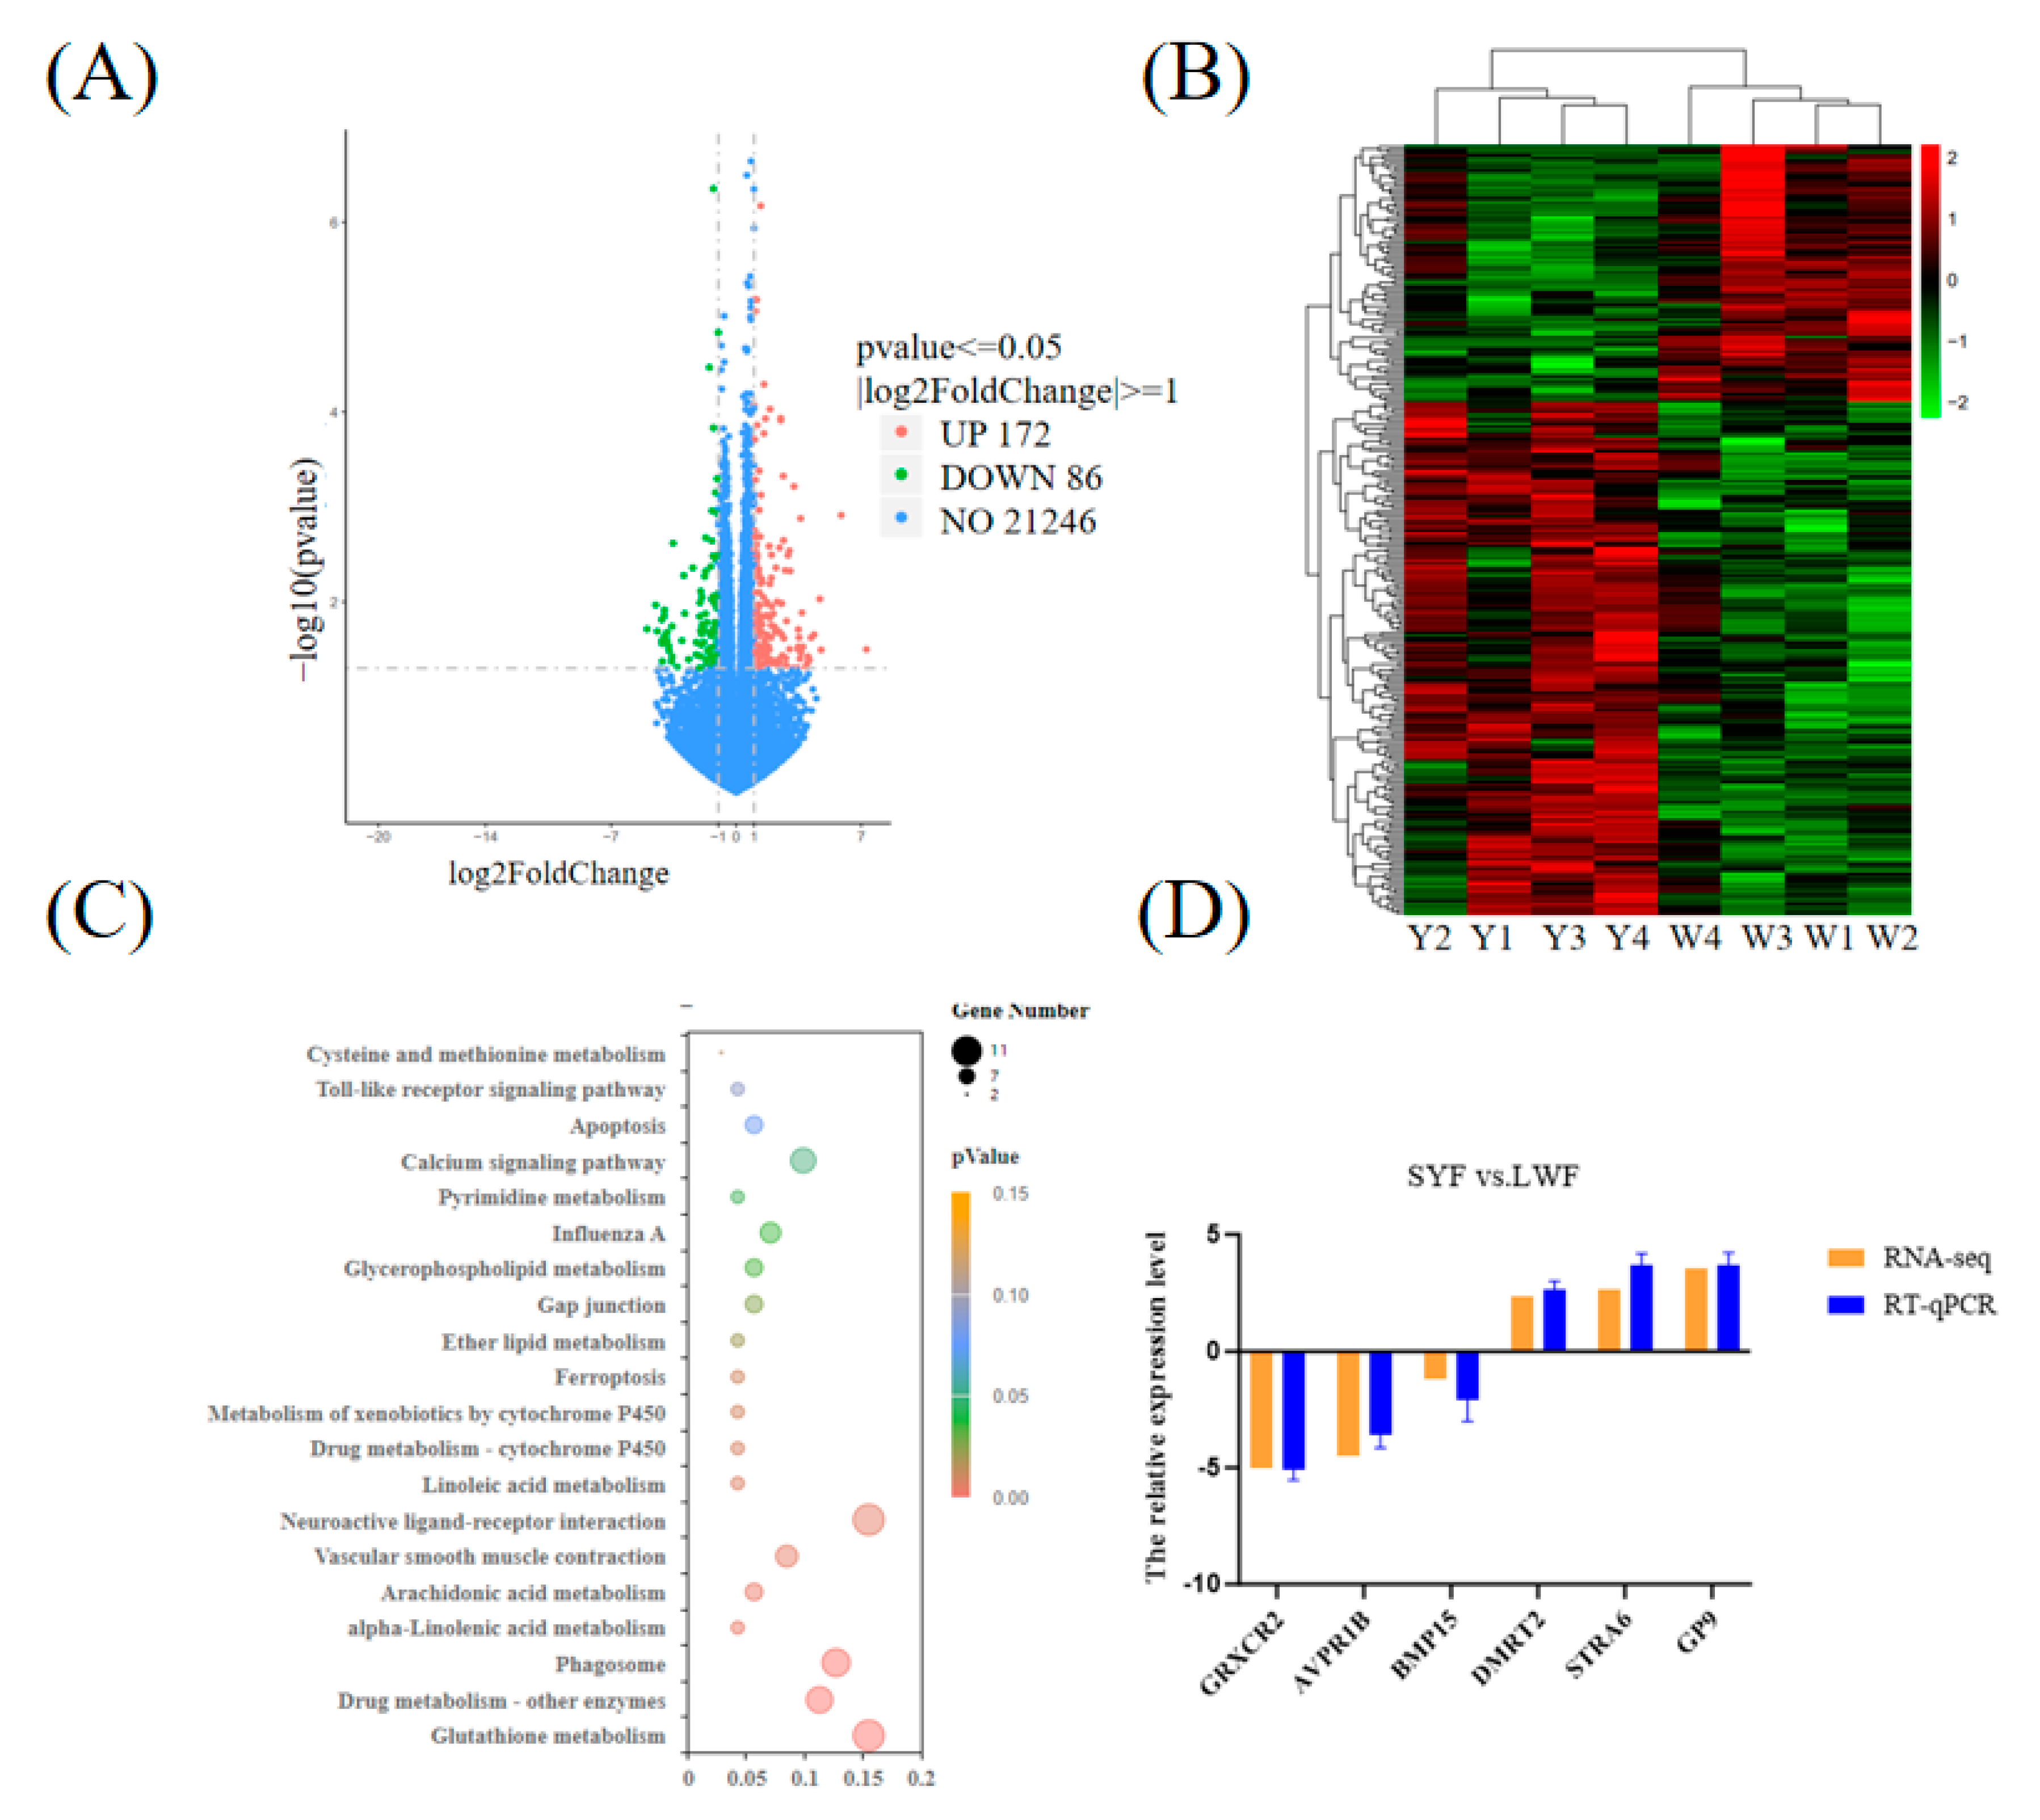
Figure 3.
Metabolome quality control analysis in SYF and LWF. (A and D) PCA for the negative and positive models. (B and E) OPLS-DA for the negative and positive models. (C and F) Permutation test of OPLS-DA for the negative and positive models.
Figure 3.
Metabolome quality control analysis in SYF and LWF. (A and D) PCA for the negative and positive models. (B and E) OPLS-DA for the negative and positive models. (C and F) Permutation test of OPLS-DA for the negative and positive models.
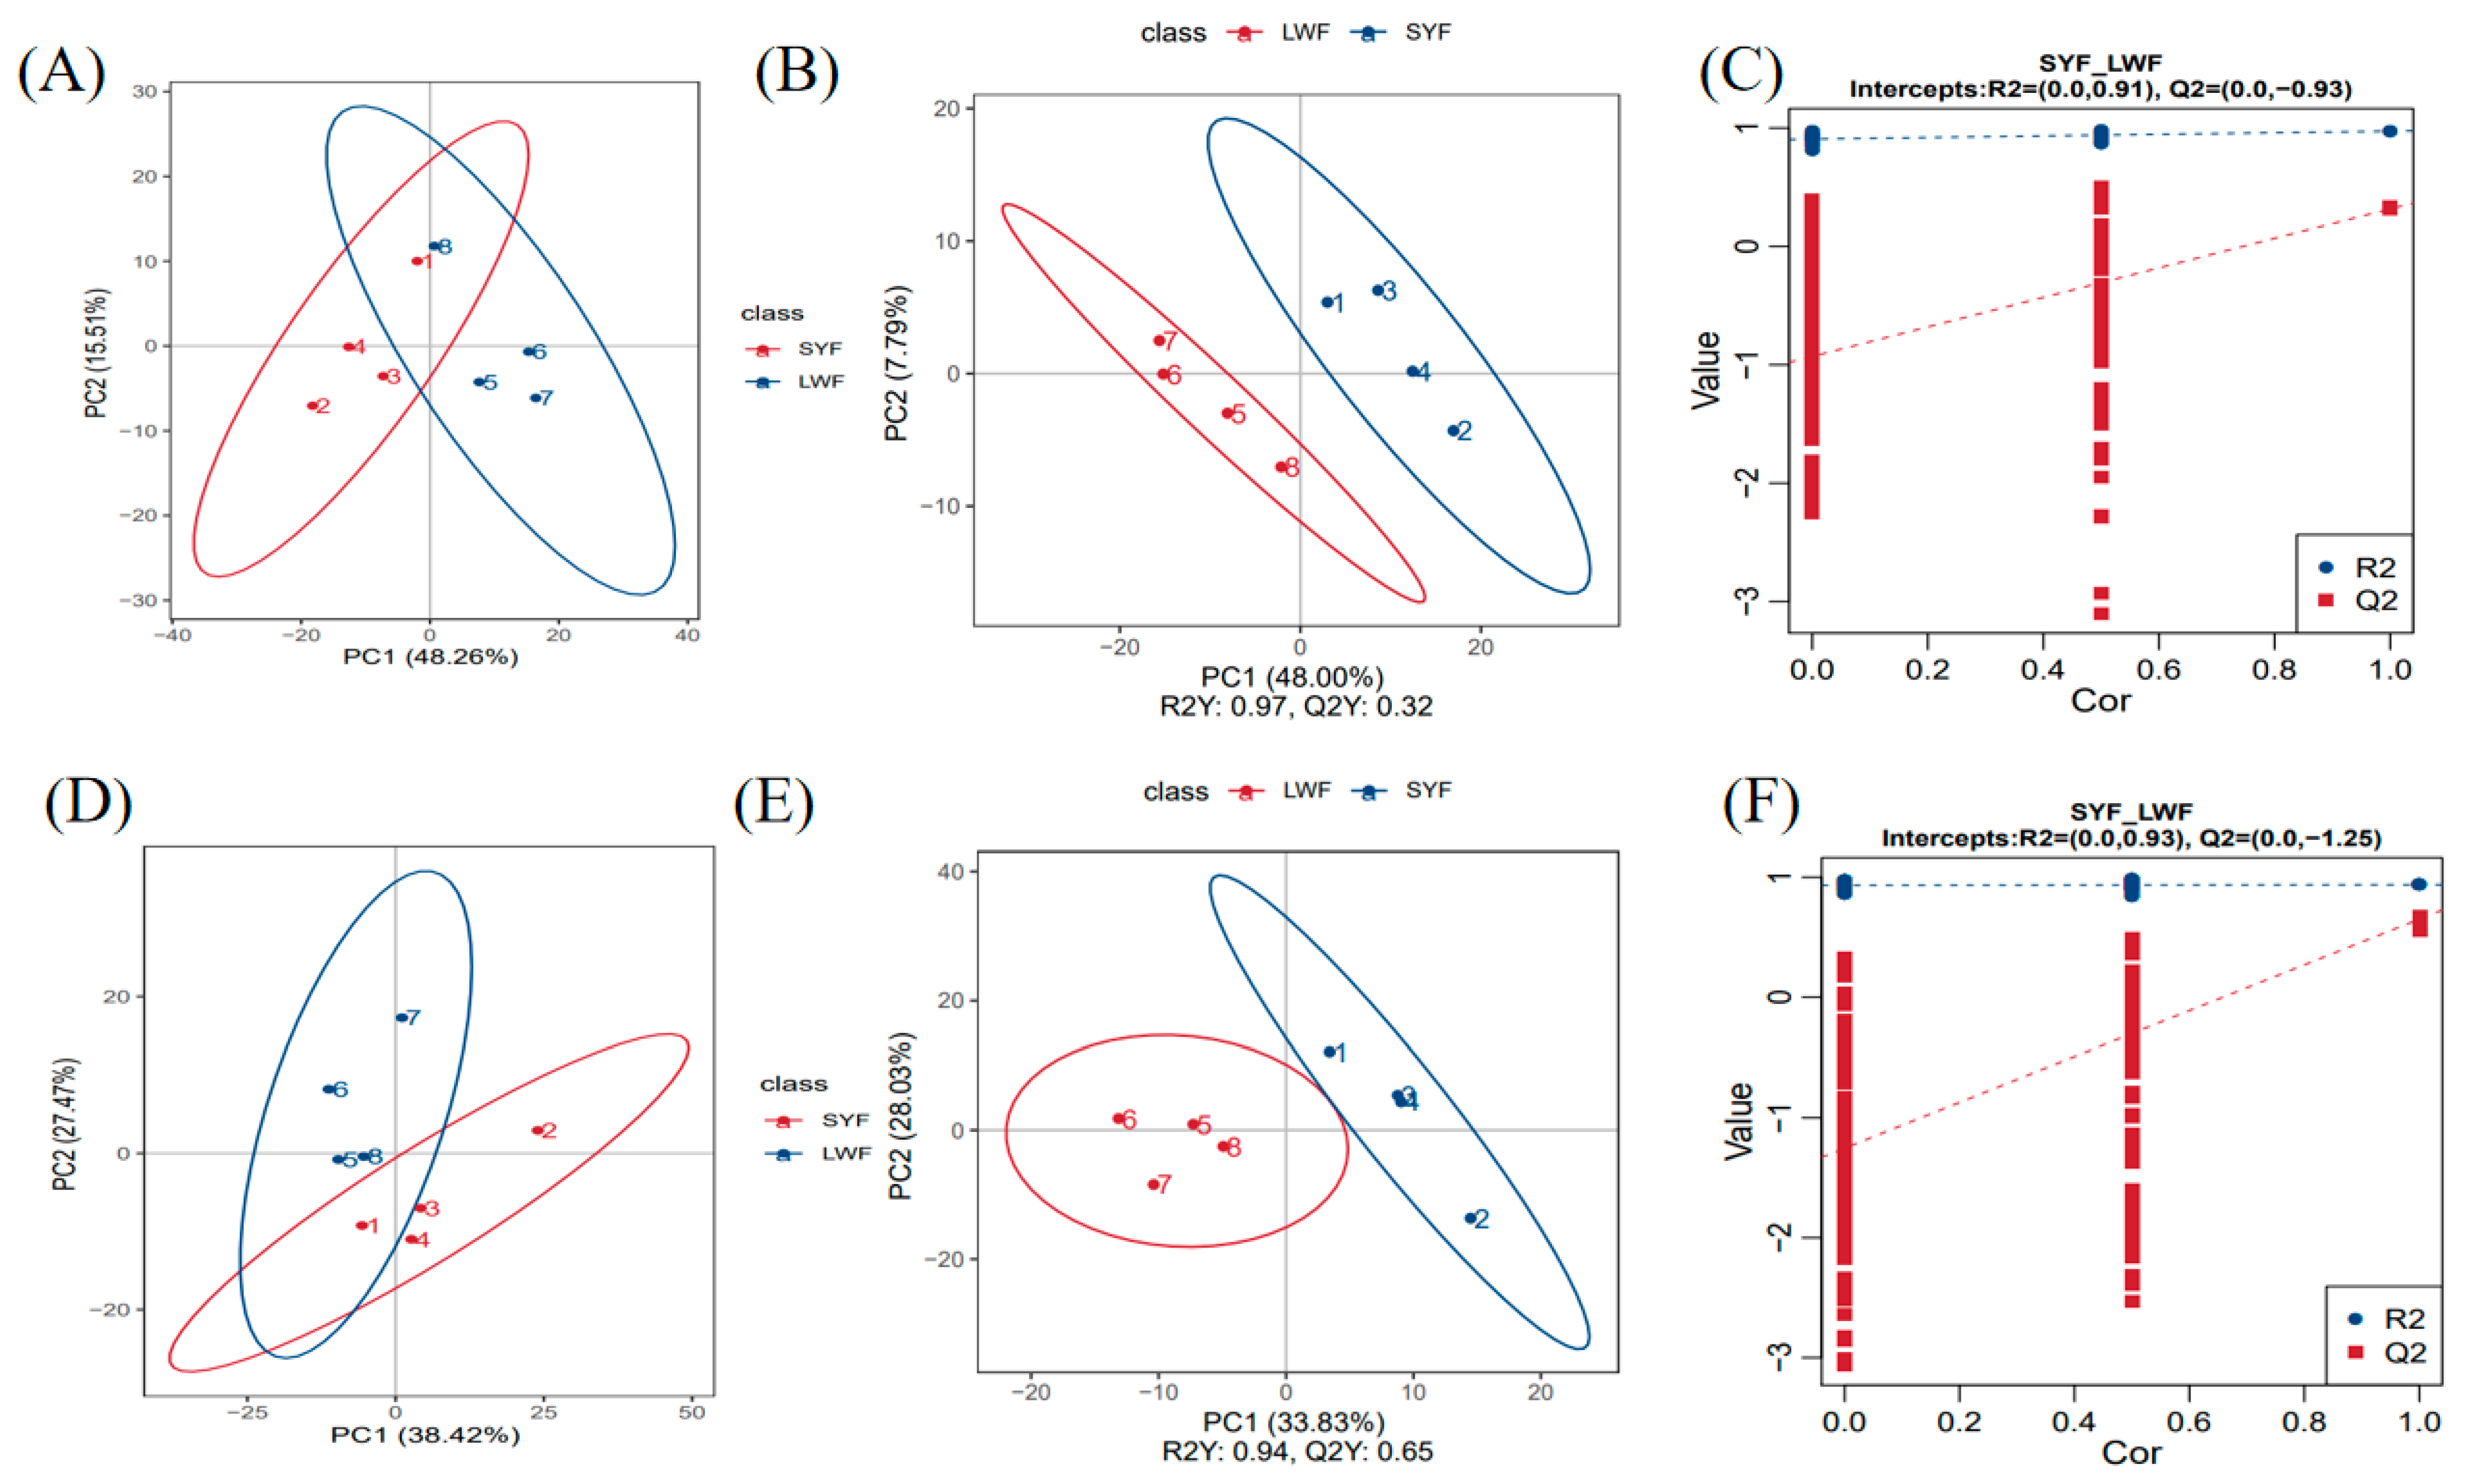
Figure 4.
Metabolomic analysis of SYF vs. LWF. The DMs are shown in the negative (A) and positive (D) models. Hierarchical cluster analysis of DMs in the negative (B) and positive (E) models. Red indicates upregulation, and blue indicates downregulation. KEGG analysis of DMs in the negative (C) and positive (F) models. Y represents the SYF, and W represents the LWF.
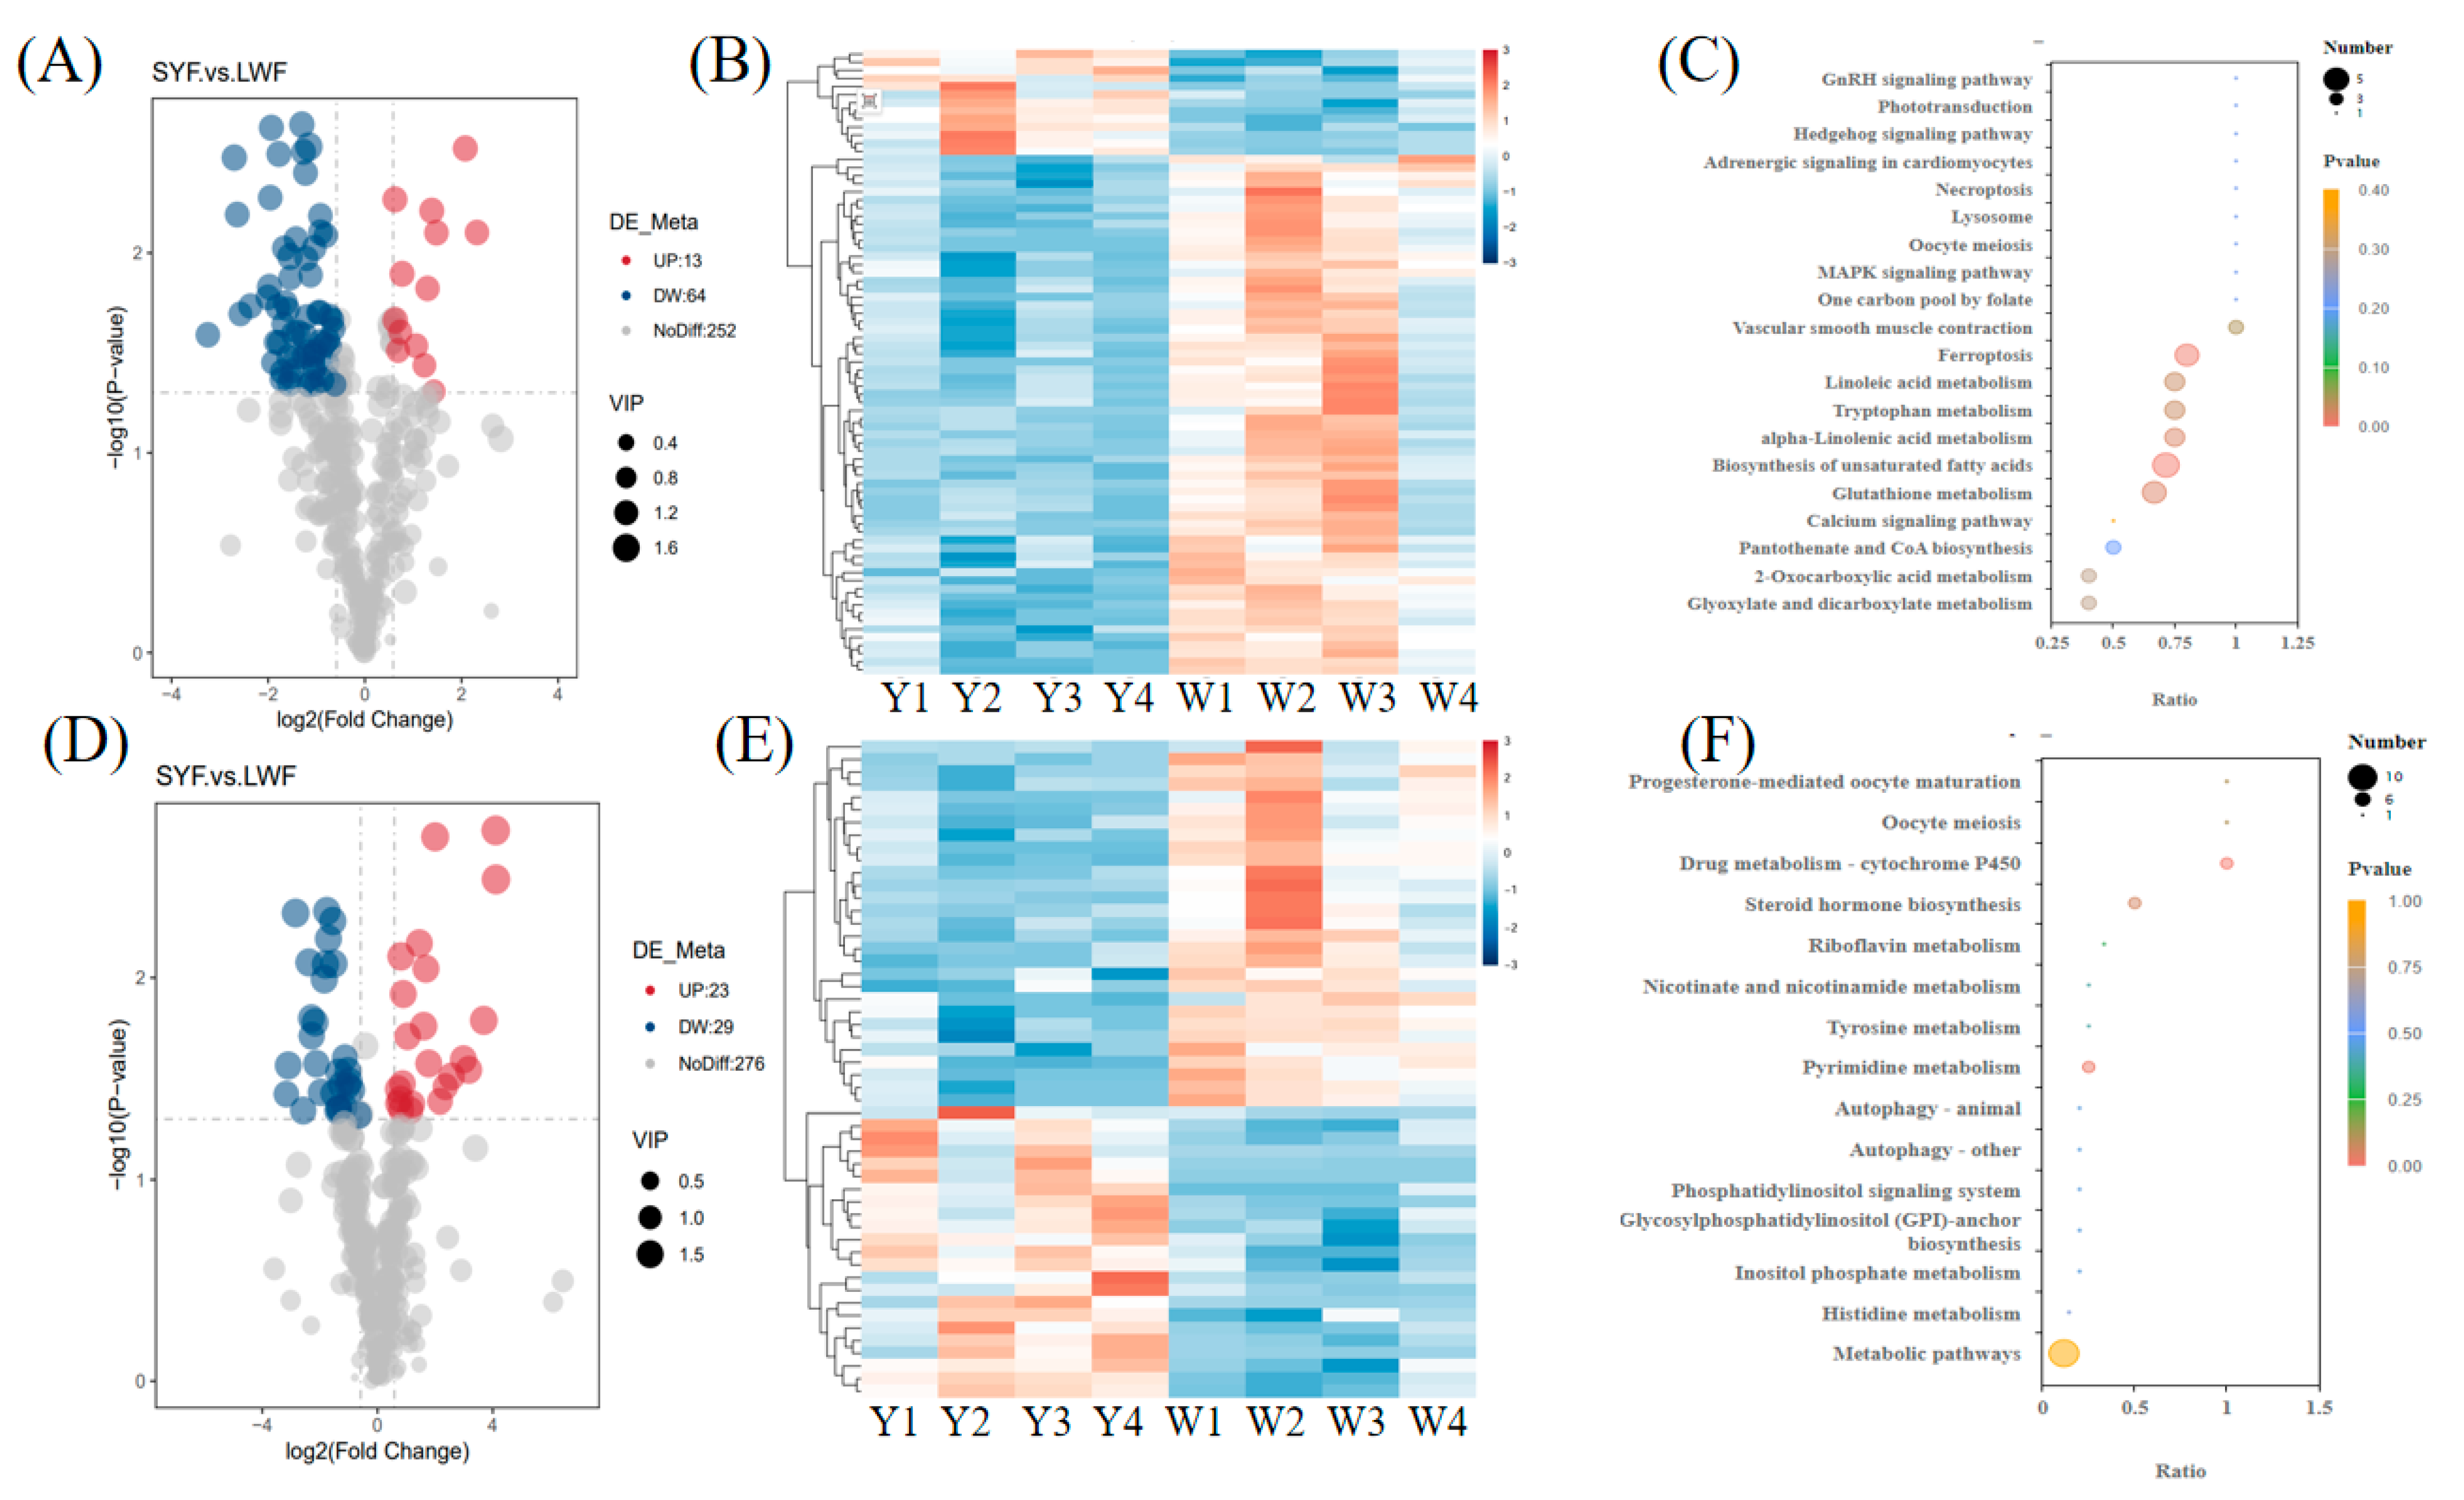
Figure 5.
Conjoint analysis of metabolomic and transcriptomic data. (A) Venn diagram of KEGG pathways shared between the transcriptome and metabolome. (B) Shared pathway analysis of the transcriptomics and metabolomics data. (C) Correlation heat map of the metabolomic and transcriptomic data for the integrated pathway. (D) Correlation network of DEGs and DMs for the shared pathway. One asterisk (*) indicates P < 0.05, and two asterisks (**) indicate P < 0.01.
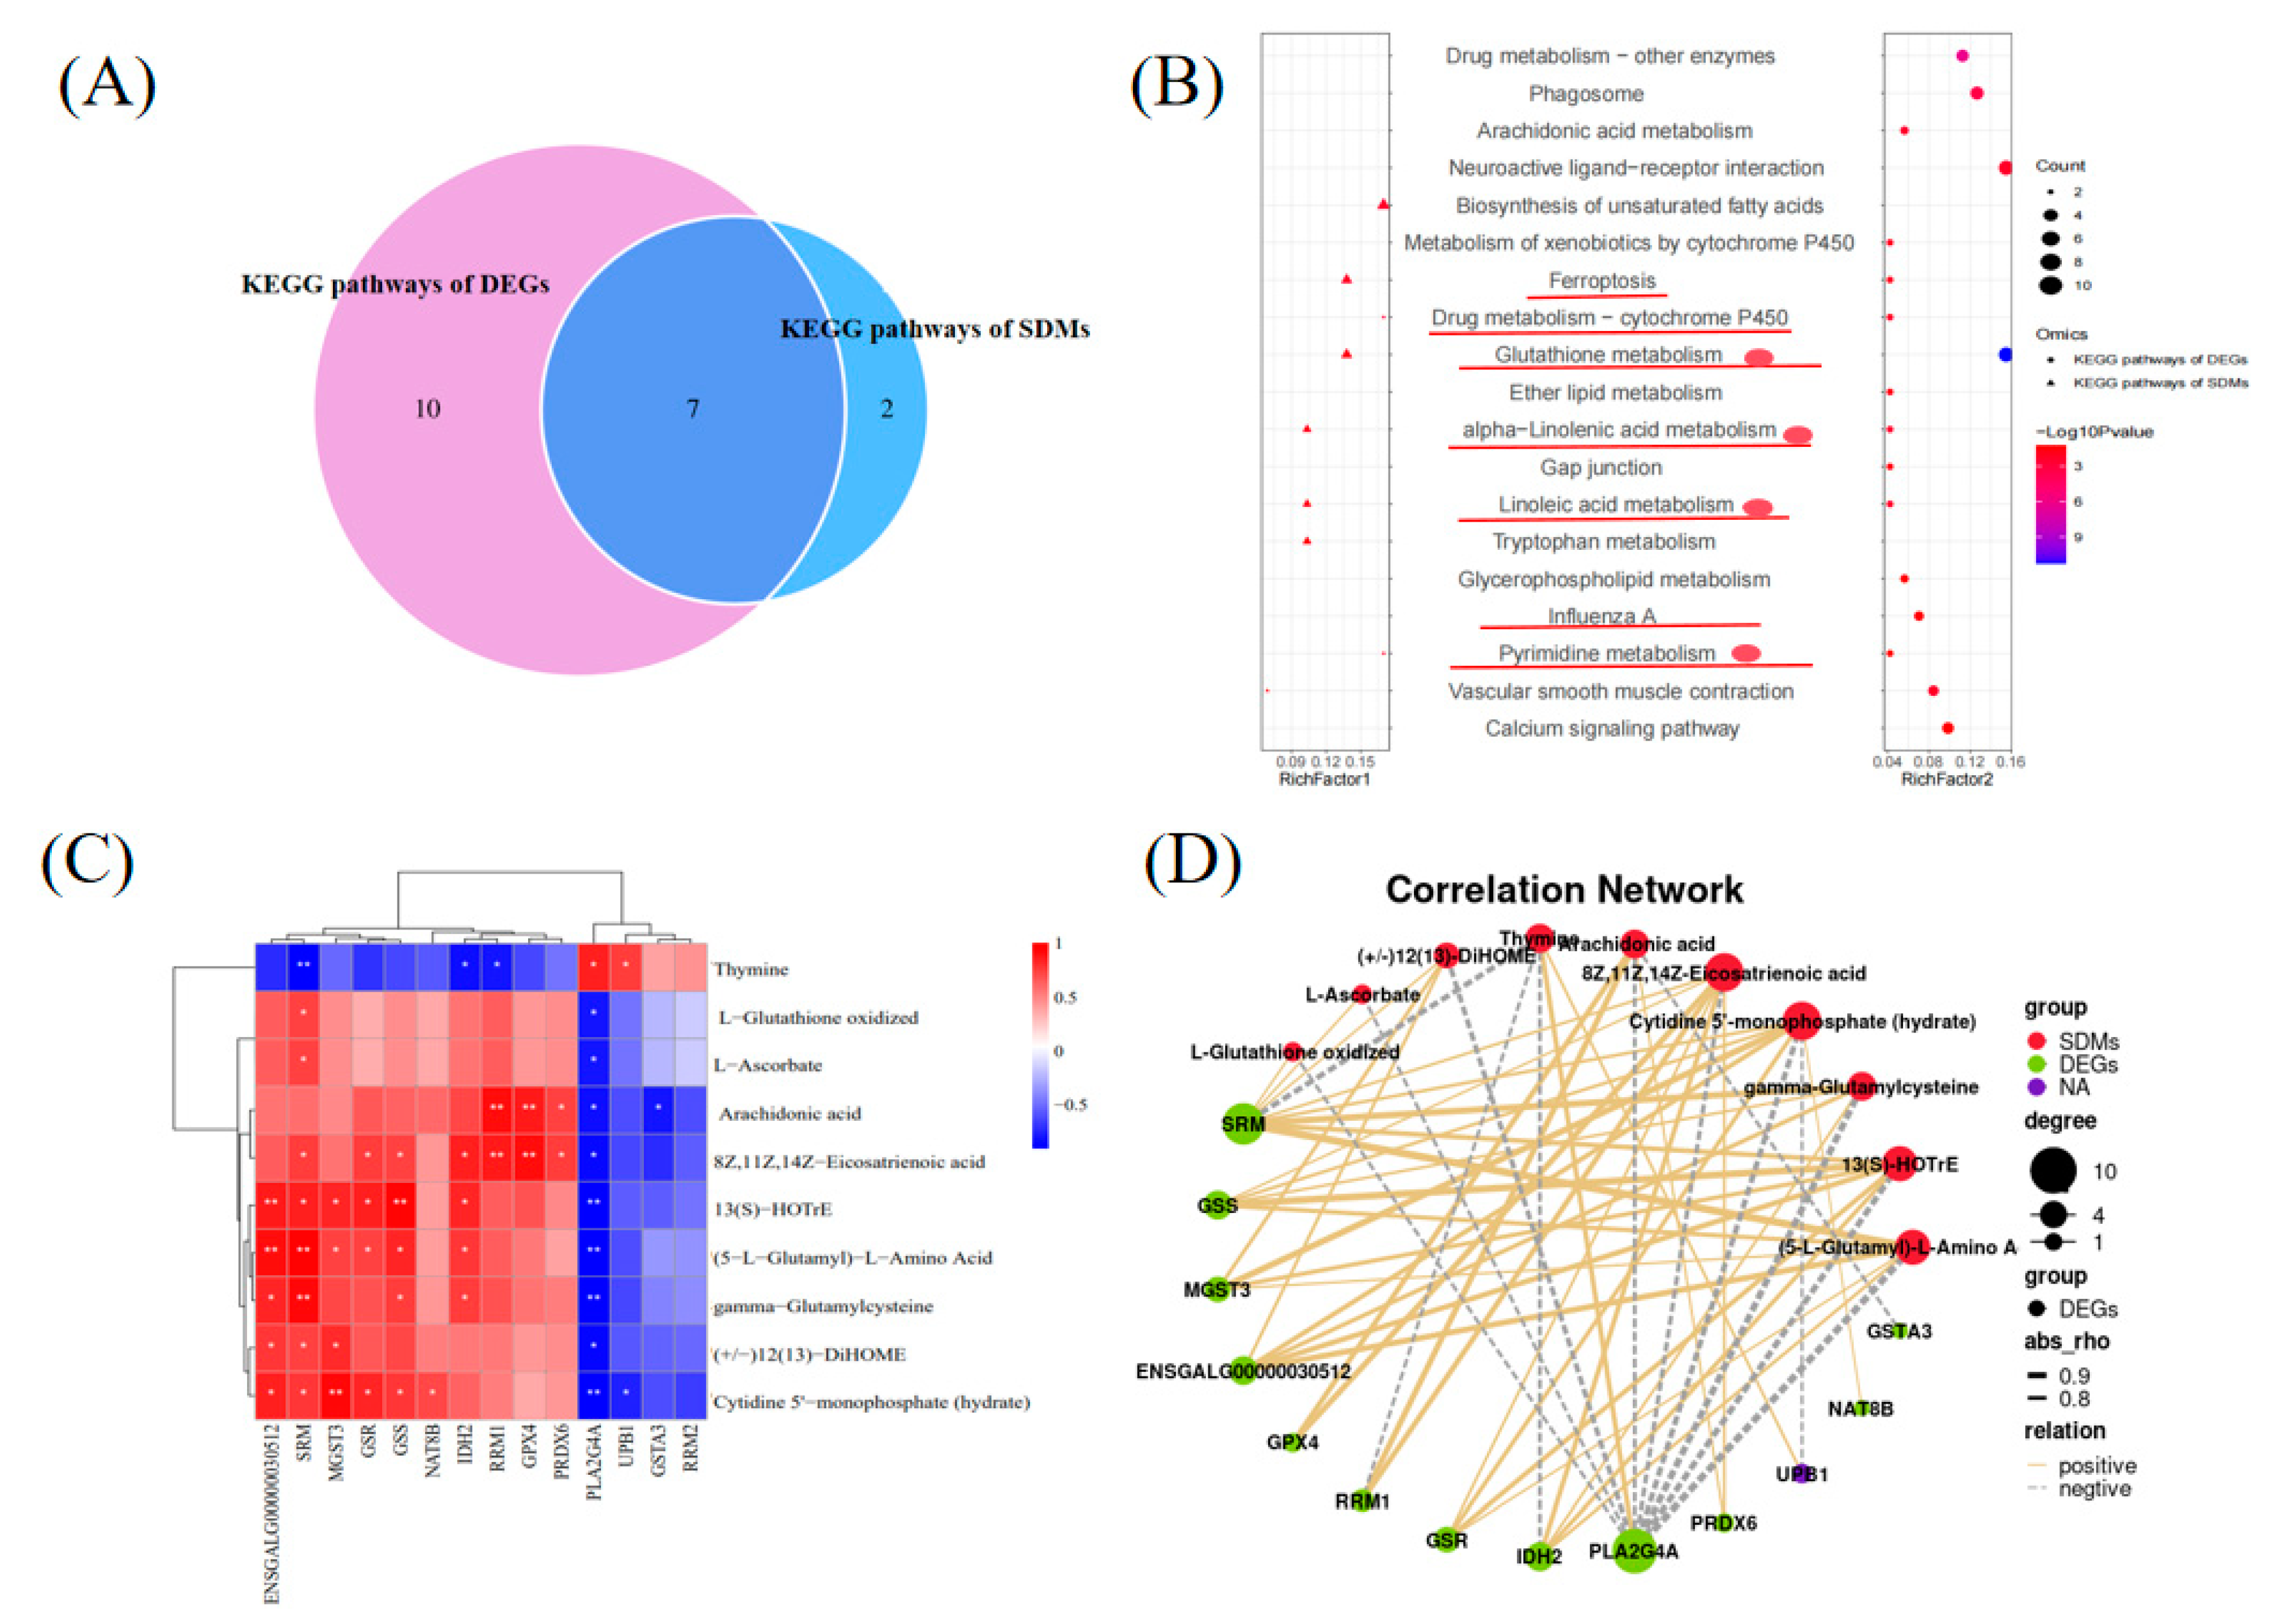
Figure 6.
Analysis of the glutathione metabolism pathway in SYF vs. LWF.
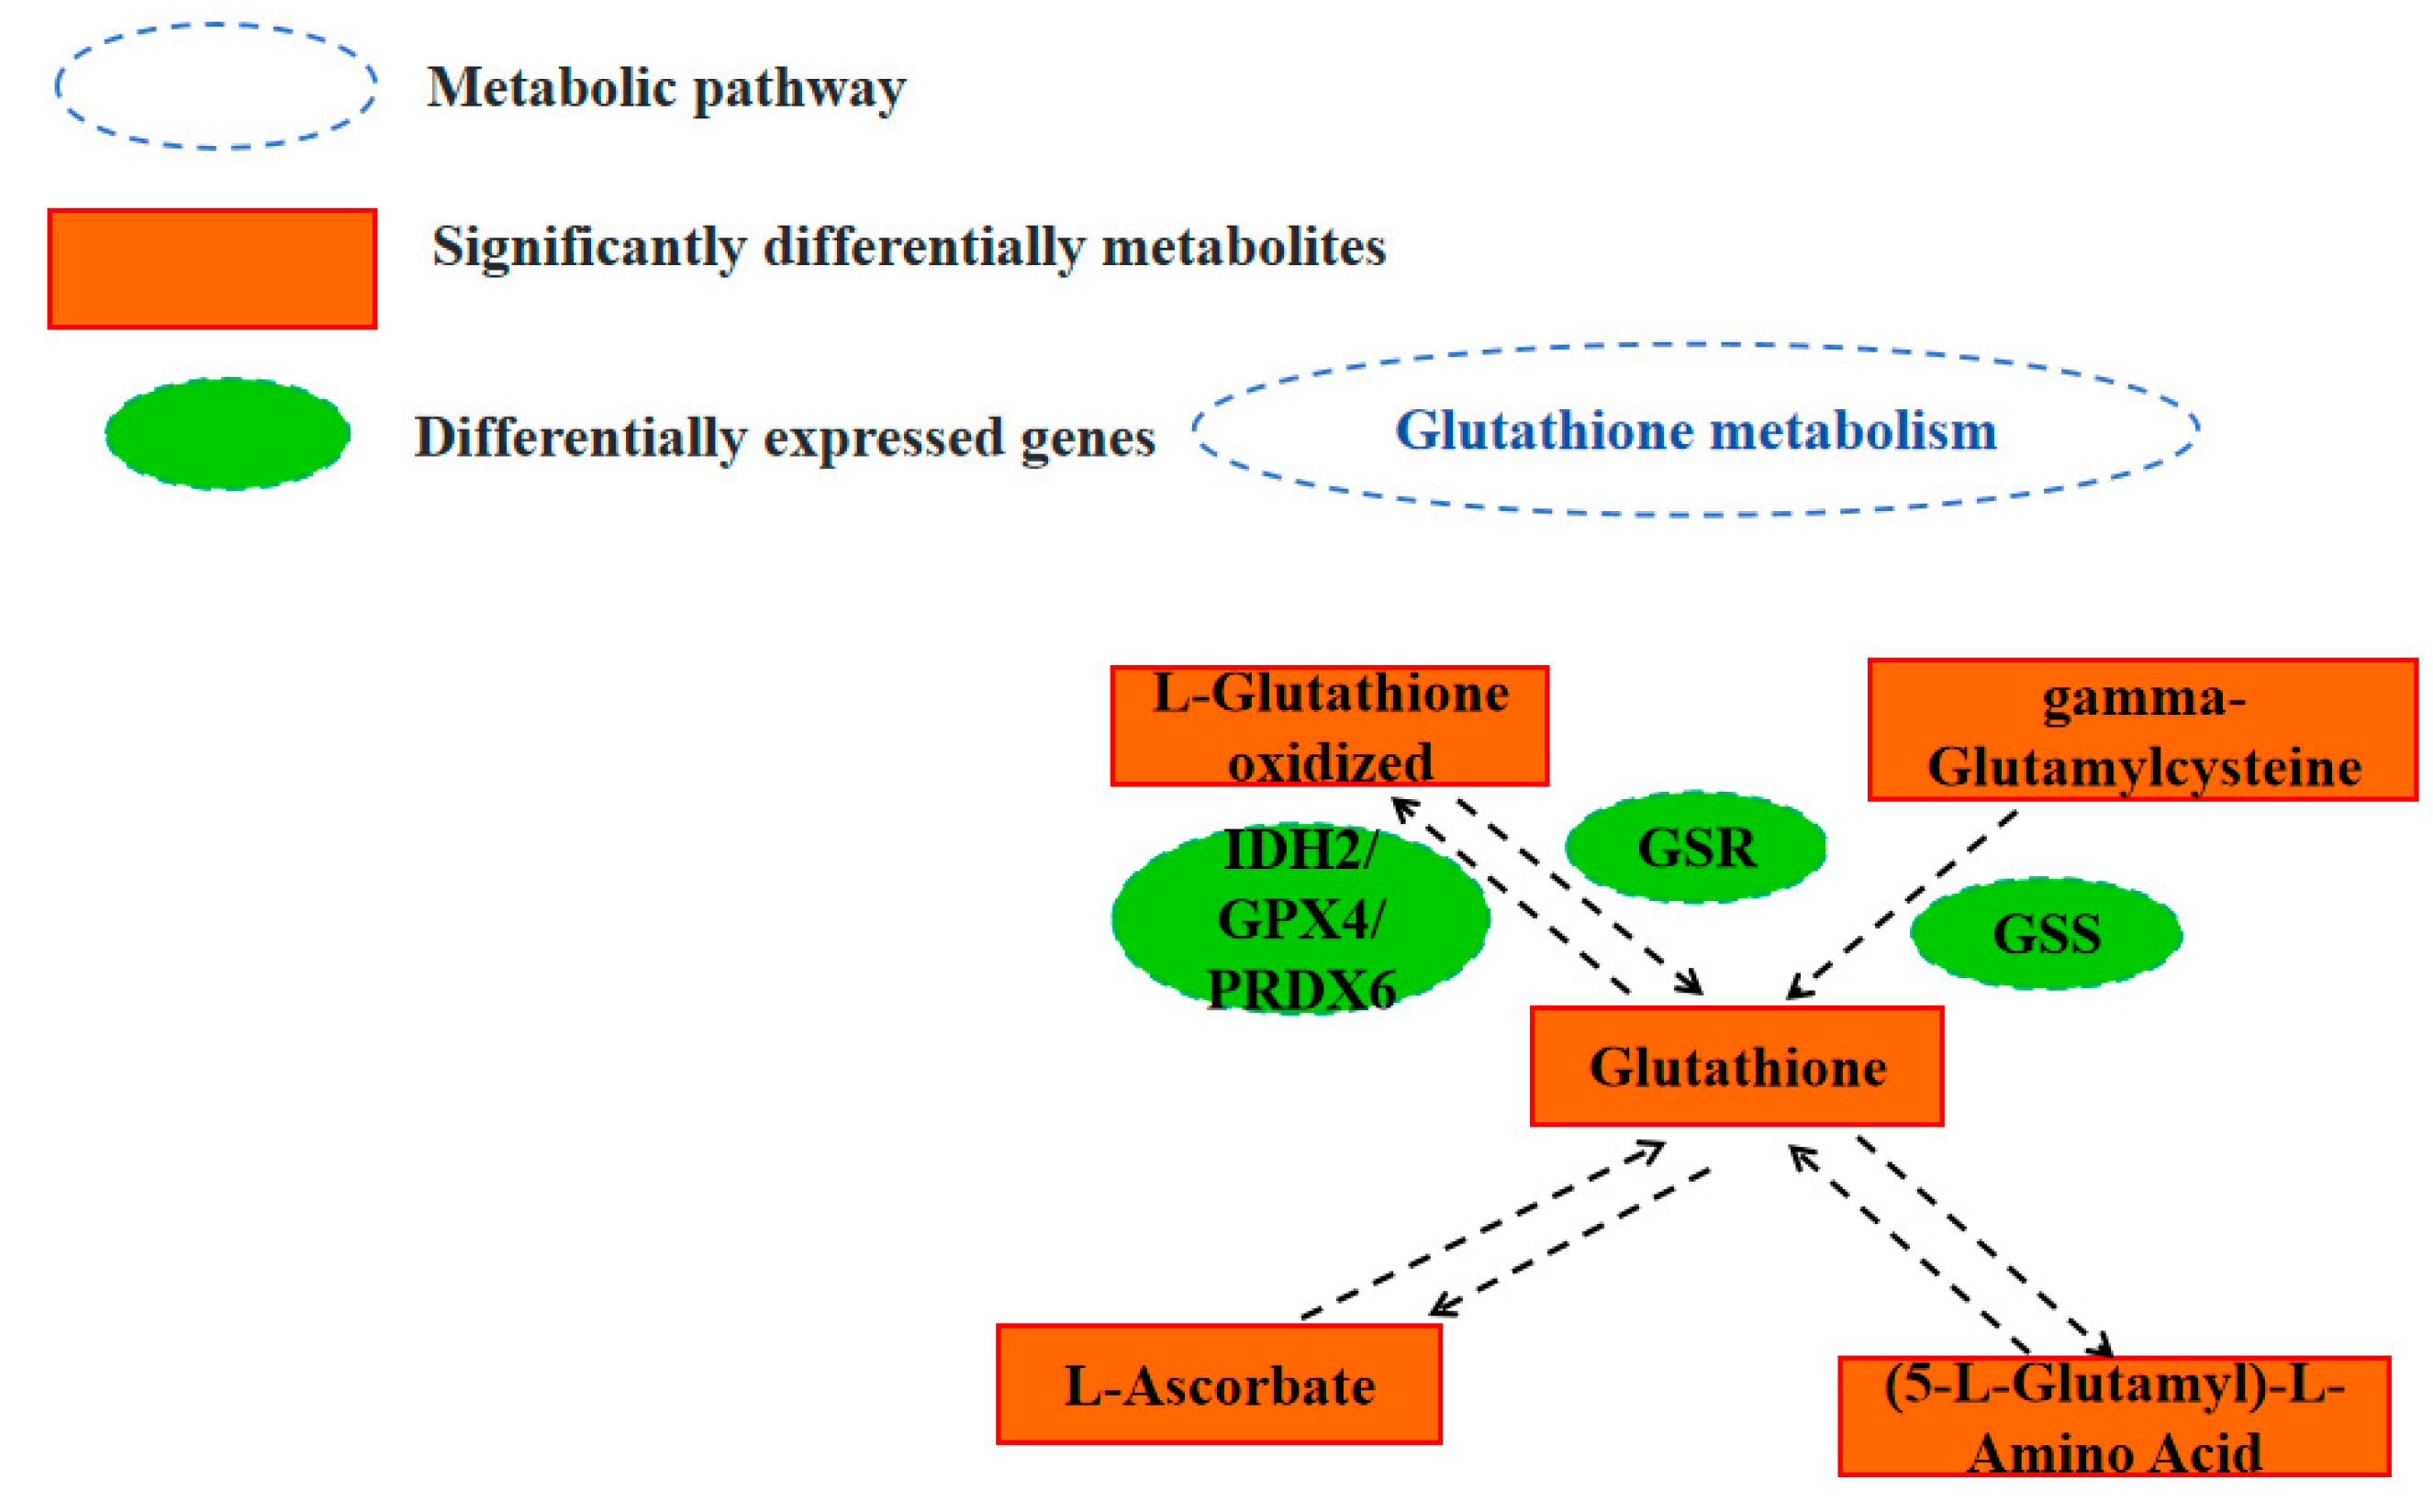

Table 1.
RNA-sequencing reads and the mapping rate.
| Sample | Raw Data | Clean Data | Q20% | Q30% | GC% | Total_map (%) | ||
| Reads | Base (G) | Reads | Base (G) | |||||
| SYF 1 | 47,622,830 | 7.14 G | 46,967,682 | 7.05 G | 97.88 | 94.17 | 49.4 | 41,684,424 (88.75%) |
| SYF 2 | 47,146,628 | 7.07 G | 46,589,606 | 6.99 G | 97.93 | 94.2 | 48.35 | 41,113,933 (88.25%) |
| SYF 3 | 47,446,224 | 7.12 G | 46,985,756 | 7.05 G | 97.94 | 94.17 | 47.21 | 41,887,553 (89.15%) |
| SYF 4 | 48,006,310 | 7.2 G | 47,432,074 | 7.11 G | 98.03 | 94.49 | 49.32 | 42,688,934 (90.0%) |
| LWF1 | 47,178,292 | 7.08G | 46,654,706 | 7.0 G | 97.95 | 94.26 | 48.29 | 42,233,384 (90.52%) |
| LWF2 | 49,372,418 | 7.41G | 48,738,738 | 7.31 G | 97.9 | 94.2 | 50.23 | 43,987,272 (90.25%) |
| LWF3 | 48,580,864 | 7.29 G | 47,975,658 | 7.2 G | 97.86 | 94.1 | 49.53 | 43,168,732 (89.98%) |
| LWF4 | 43,986,970 | 6.6 G | 43,449,124 | 6.52 G | 97.83 | 94.05 | 50.03 | 38,870,397 (89.46%) |
Disclaimer/Publisher’s Note: The statements, opinions and data contained in all publications are solely those of the individual author(s) and contributor(s) and not of MDPI and/or the editor(s). MDPI and/or the editor(s) disclaim responsibility for any injury to people or property resulting from any ideas, methods, instructions or products referred to in the content. |
© 2024 by the authors. Licensee MDPI, Basel, Switzerland. This article is an open access article distributed under the terms and conditions of the Creative Commons Attribution (CC BY) license (http://creativecommons.org/licenses/by/4.0/).
Copyright: This open access article is published under a Creative Commons CC BY 4.0 license, which permit the free download, distribution, and reuse, provided that the author and preprint are cited in any reuse.


