Submitted:
18 February 2025
Posted:
19 February 2025
Read the latest preprint version here
Abstract
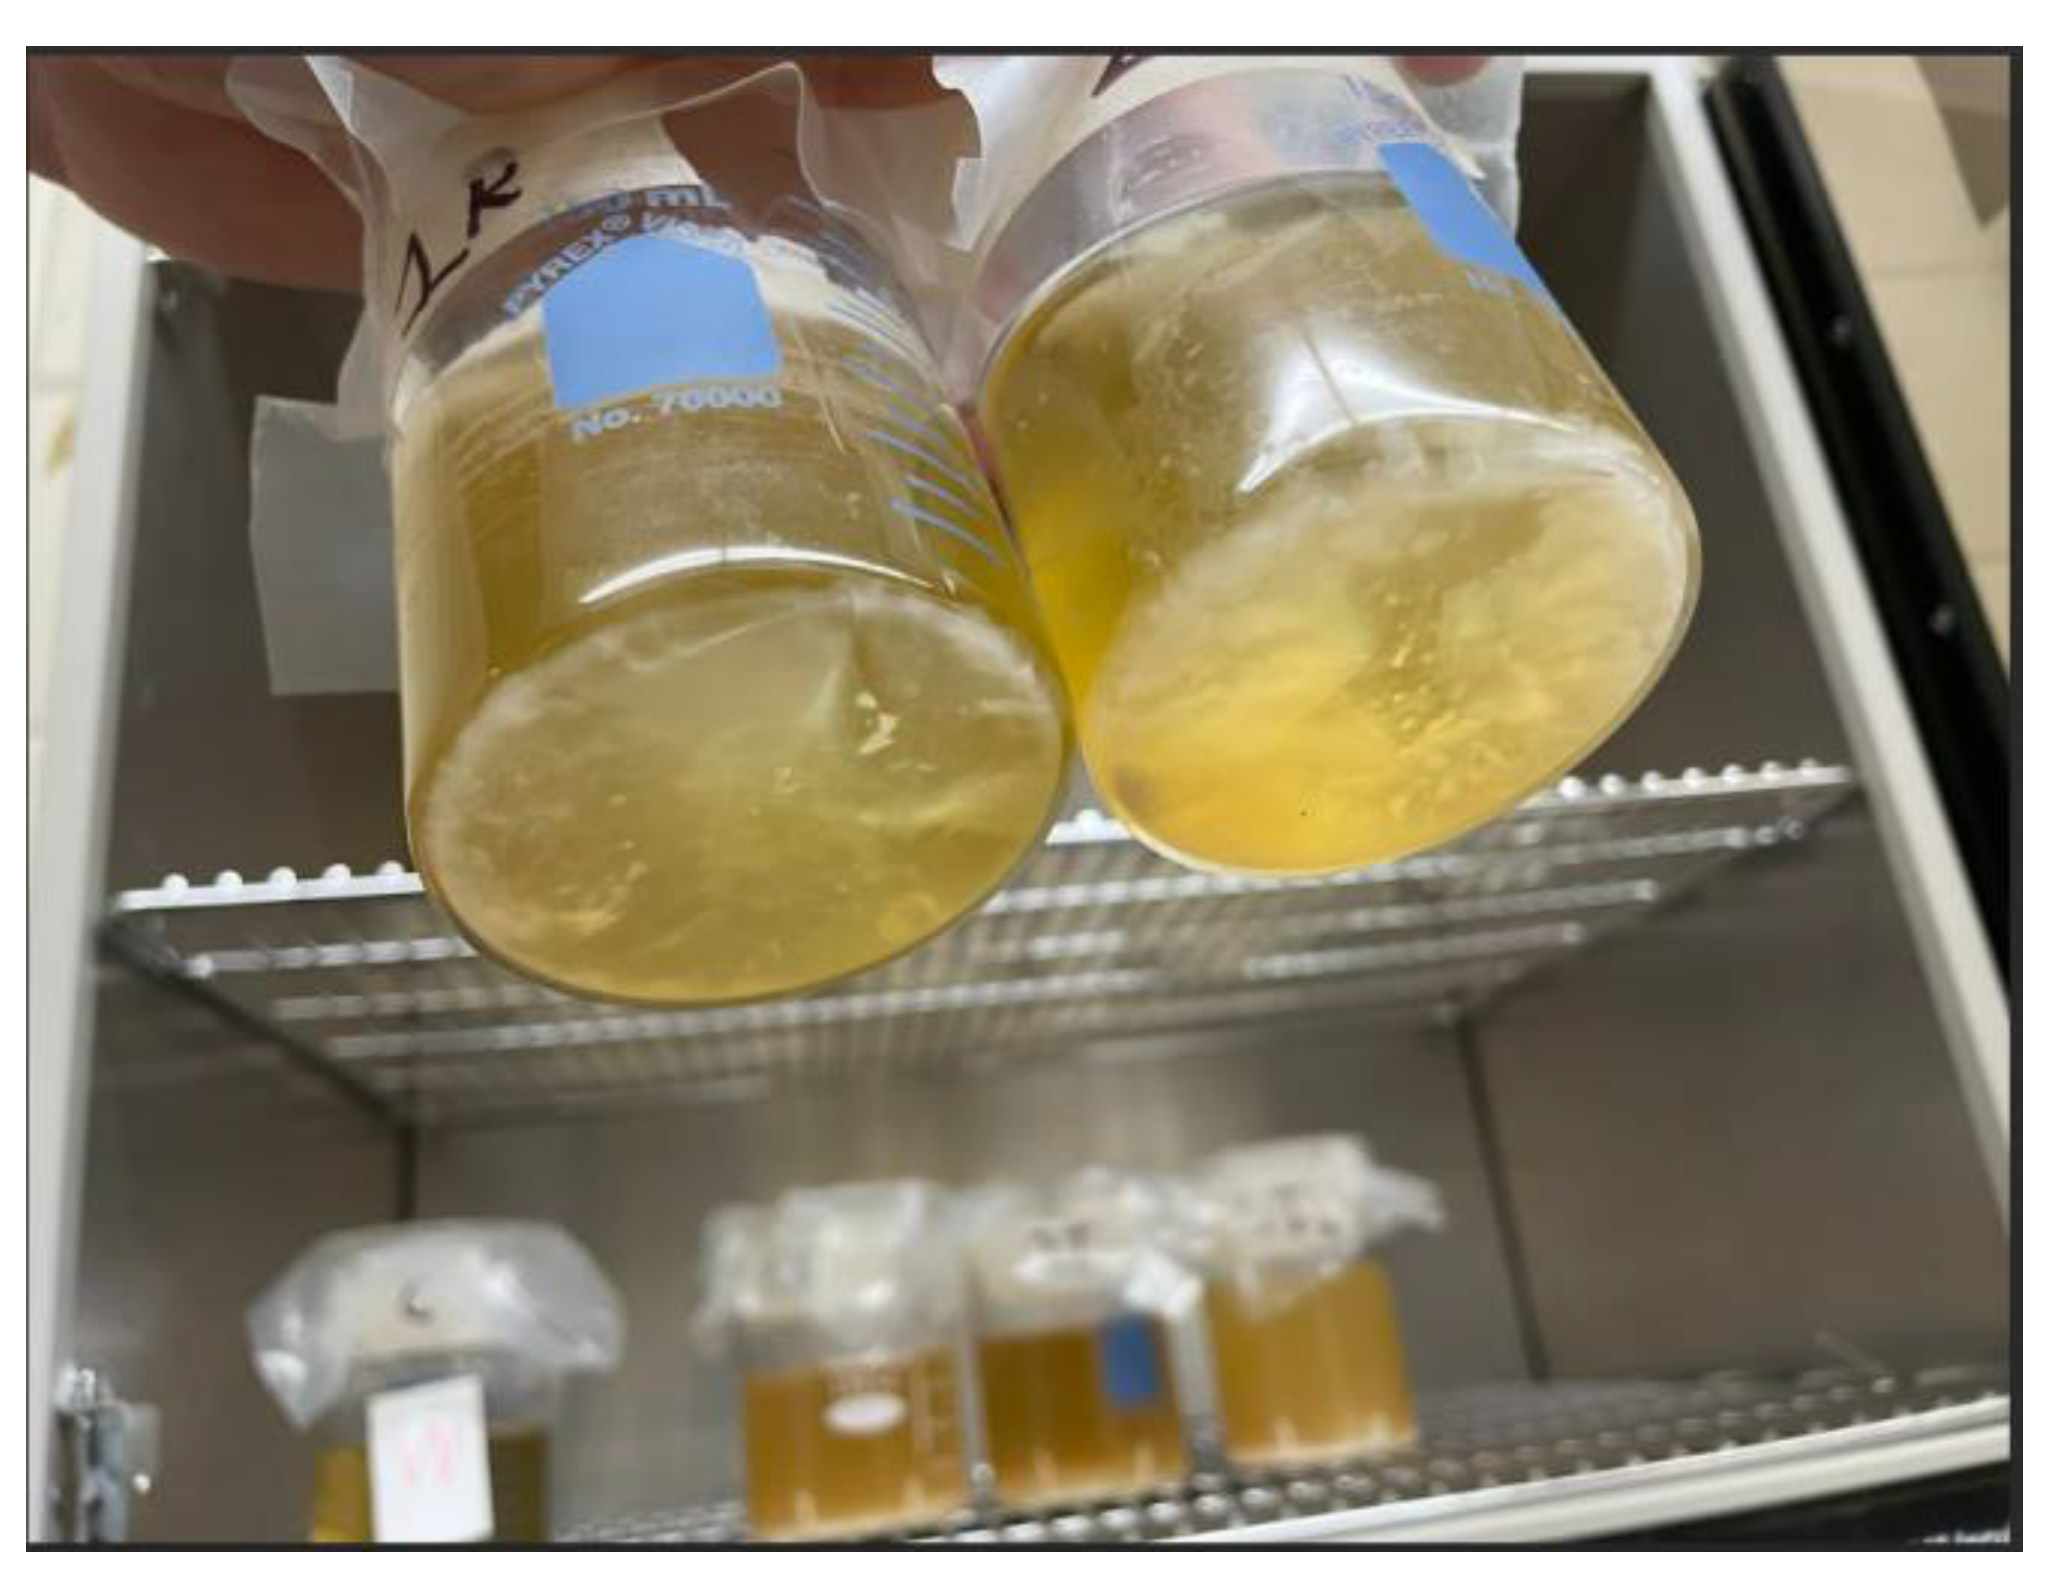
In light of the discovery of the bacteria Ideonella Sakaiensis in 2016, enzyme based recycling has become a very promising field of study. The bacteria was found in the sludge of a Japanese recycling plant and produced the enzyme PET hydrolase. This was one of the first enzymes discovered capable of breaking down type 1 plastic. As time went on, researchers began developing more efficient versions of PET hydrolase. Though it has amazing potential, its ability in a low fidelity setting is still unknown. In our study, we produced a series of low fidelity bioreactors to test the enzyme’s capabilities under stress. For our procedures, we used E. Coli modified with the pET21b(+)-Is-PETase plasmid [3] to produce the enzyme for our study. We conducted our experiment over the course of 4 weeks with 5 unique batch style bioreactors. In our research we were able to determine that E.Coli was able to decrease the weight of 0.6 grams (± 200 milligrams) PET plastic strips by 0.2 milligrams (± 0.1 milligram).
[M1]Refs. Citation are not allowed in abstract, please move them to maintext.
Keywords:
Introduction
METHODS
Materials
| -Incubator | -500mL GL45 bottle | -Deionized water |
| -Microwave | -LB broth Dry Powder | -125ml beakers |
| -Petri dishes | -Sigma Aldrich Ampicillin | -Agar LB Broth |
| -Micropipettes | -Antibacterial soap and wipes | -Inoculating loops |
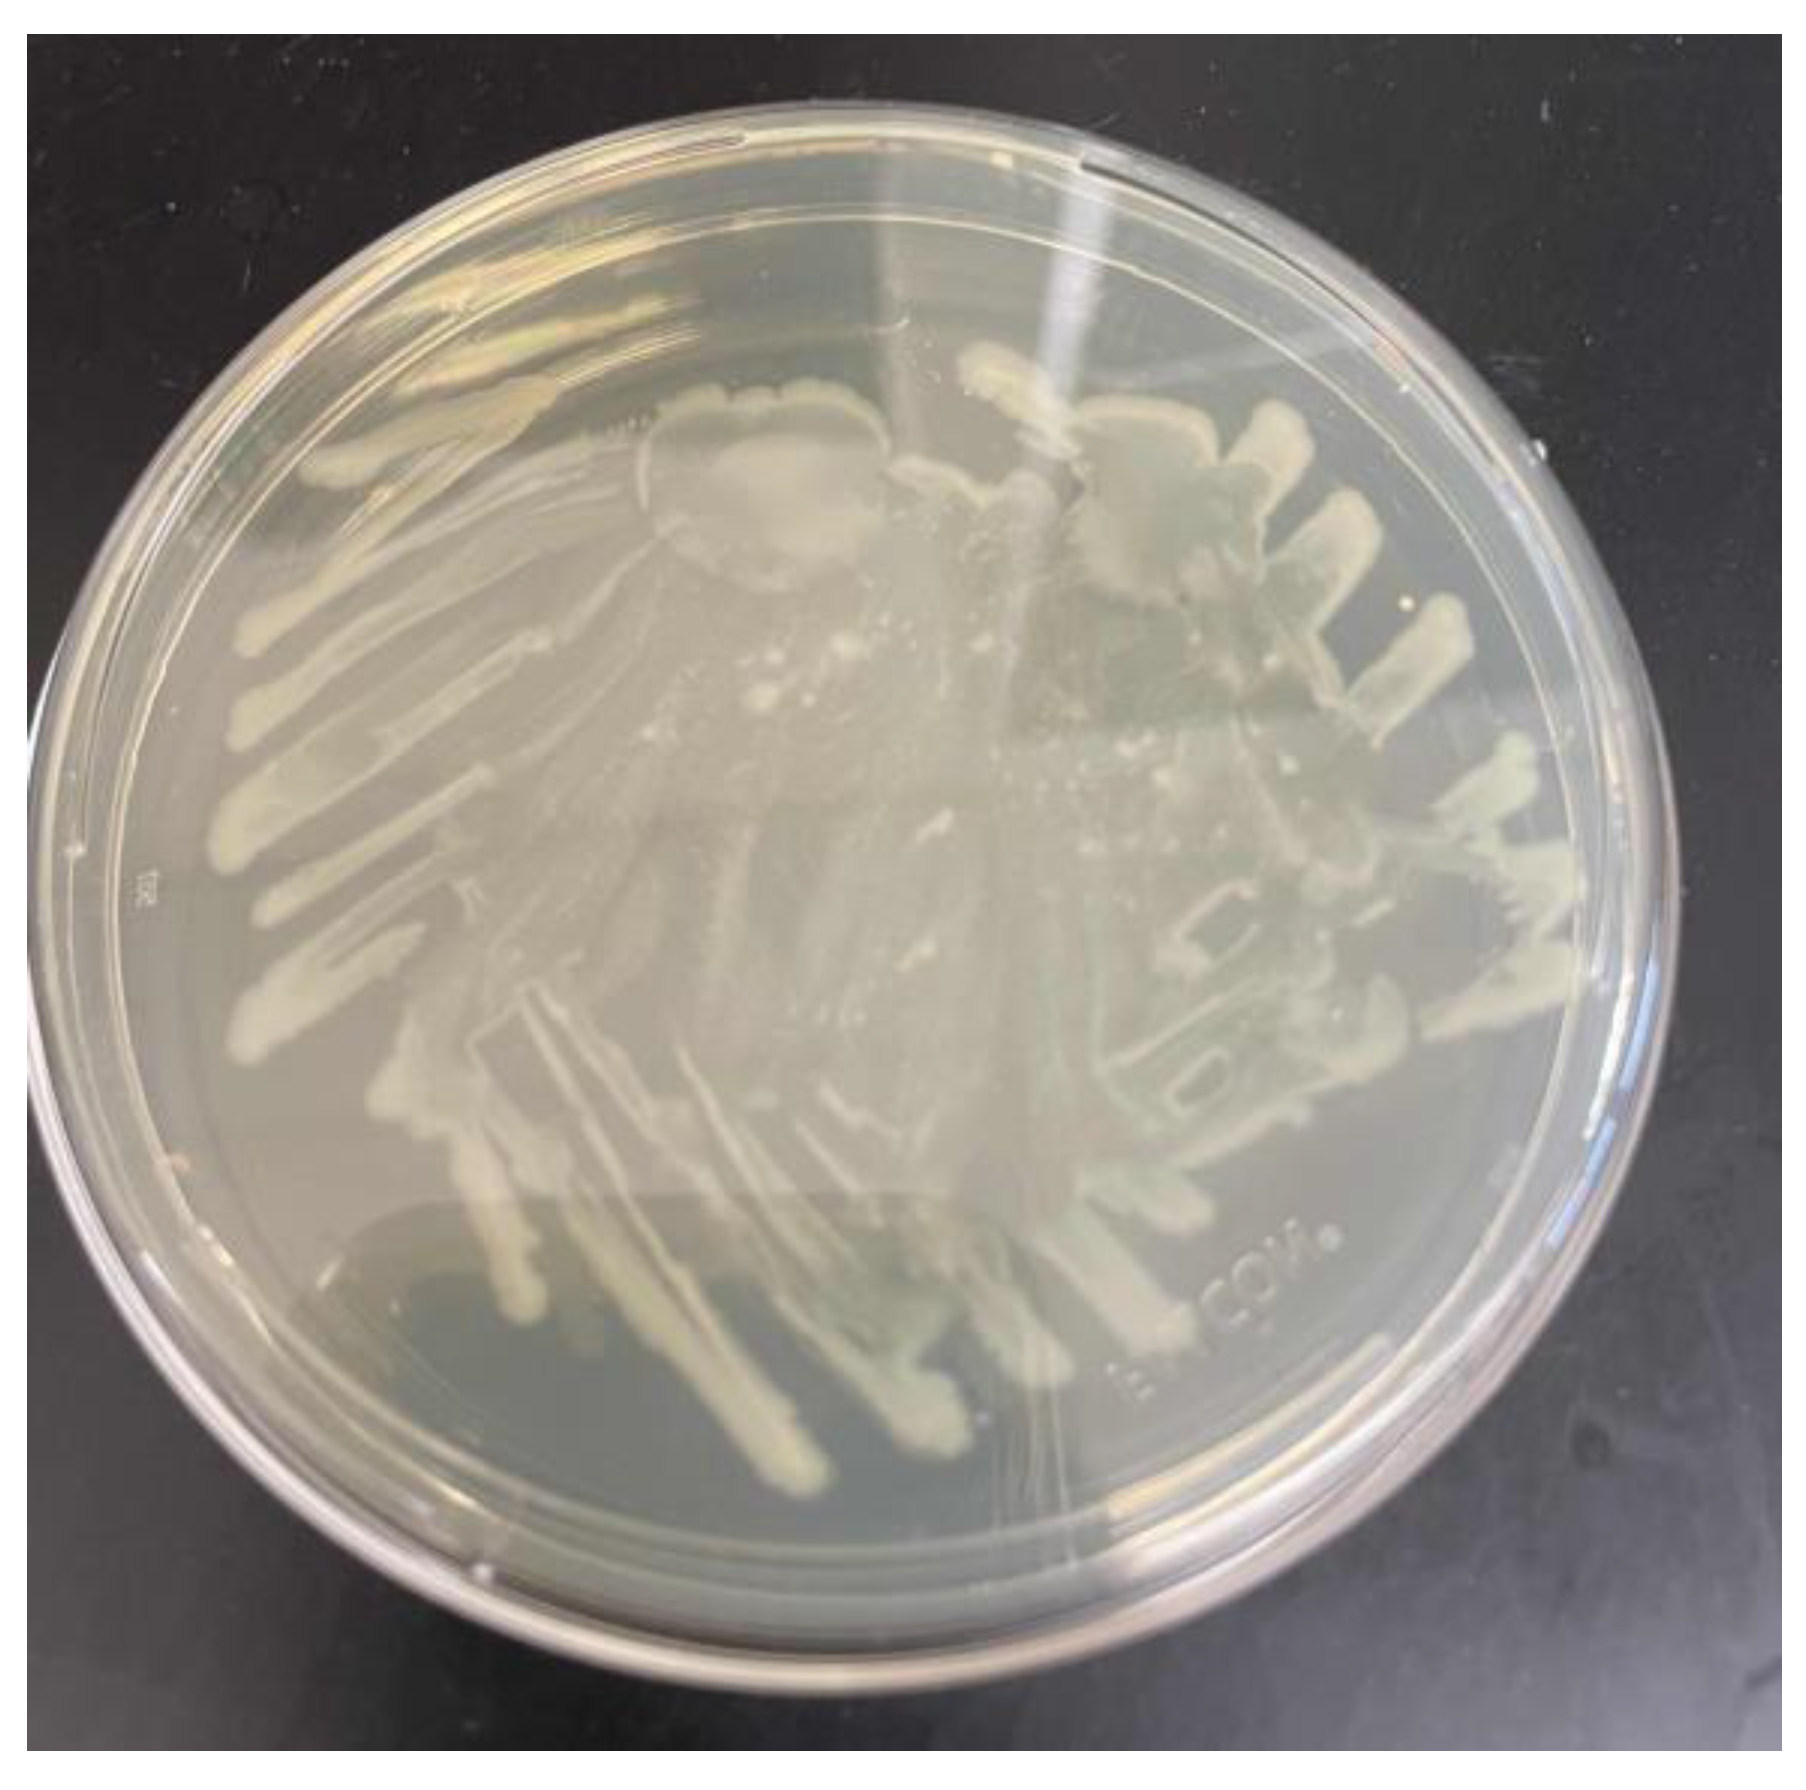
| -500ml beaker | -E. Coli: pET21b(+)-Is-PETase was a gift from Gregg Beckham & Christopher Johnson (Addgene plasmid # 112202 ; http://n2t.net/addgene:112202 ; RRID:Addgene_112202) | Mettler Scale |
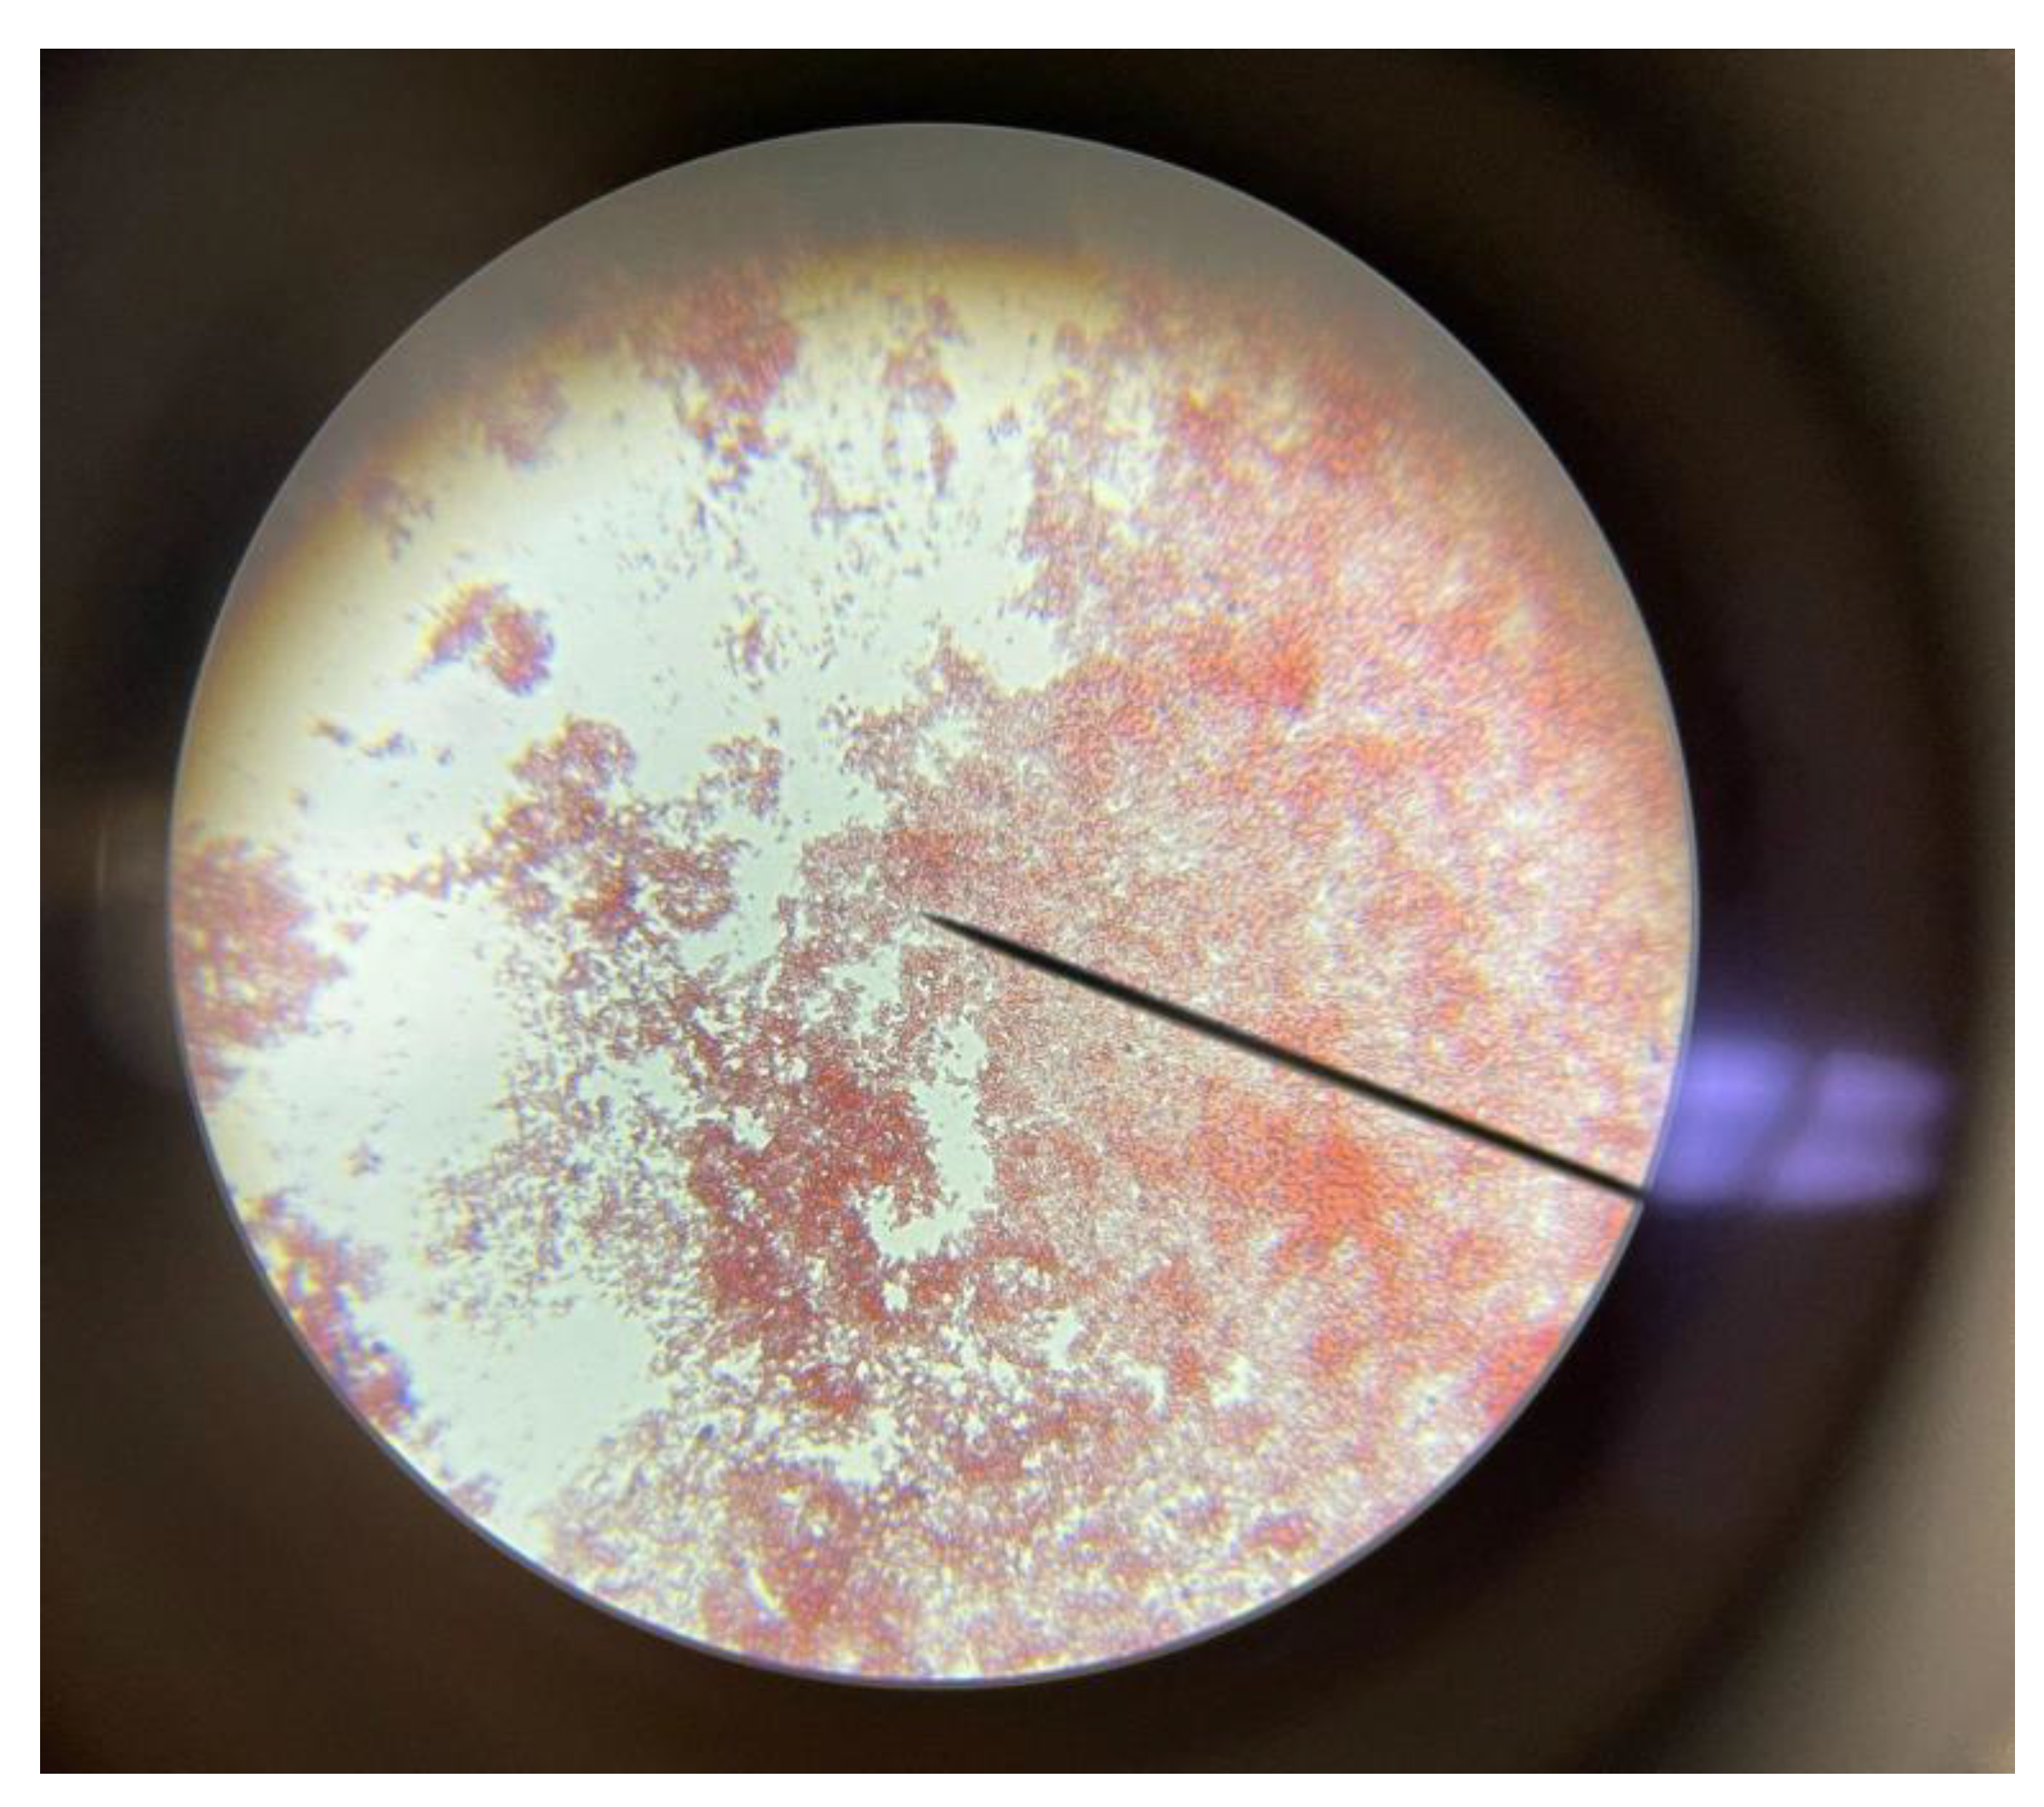
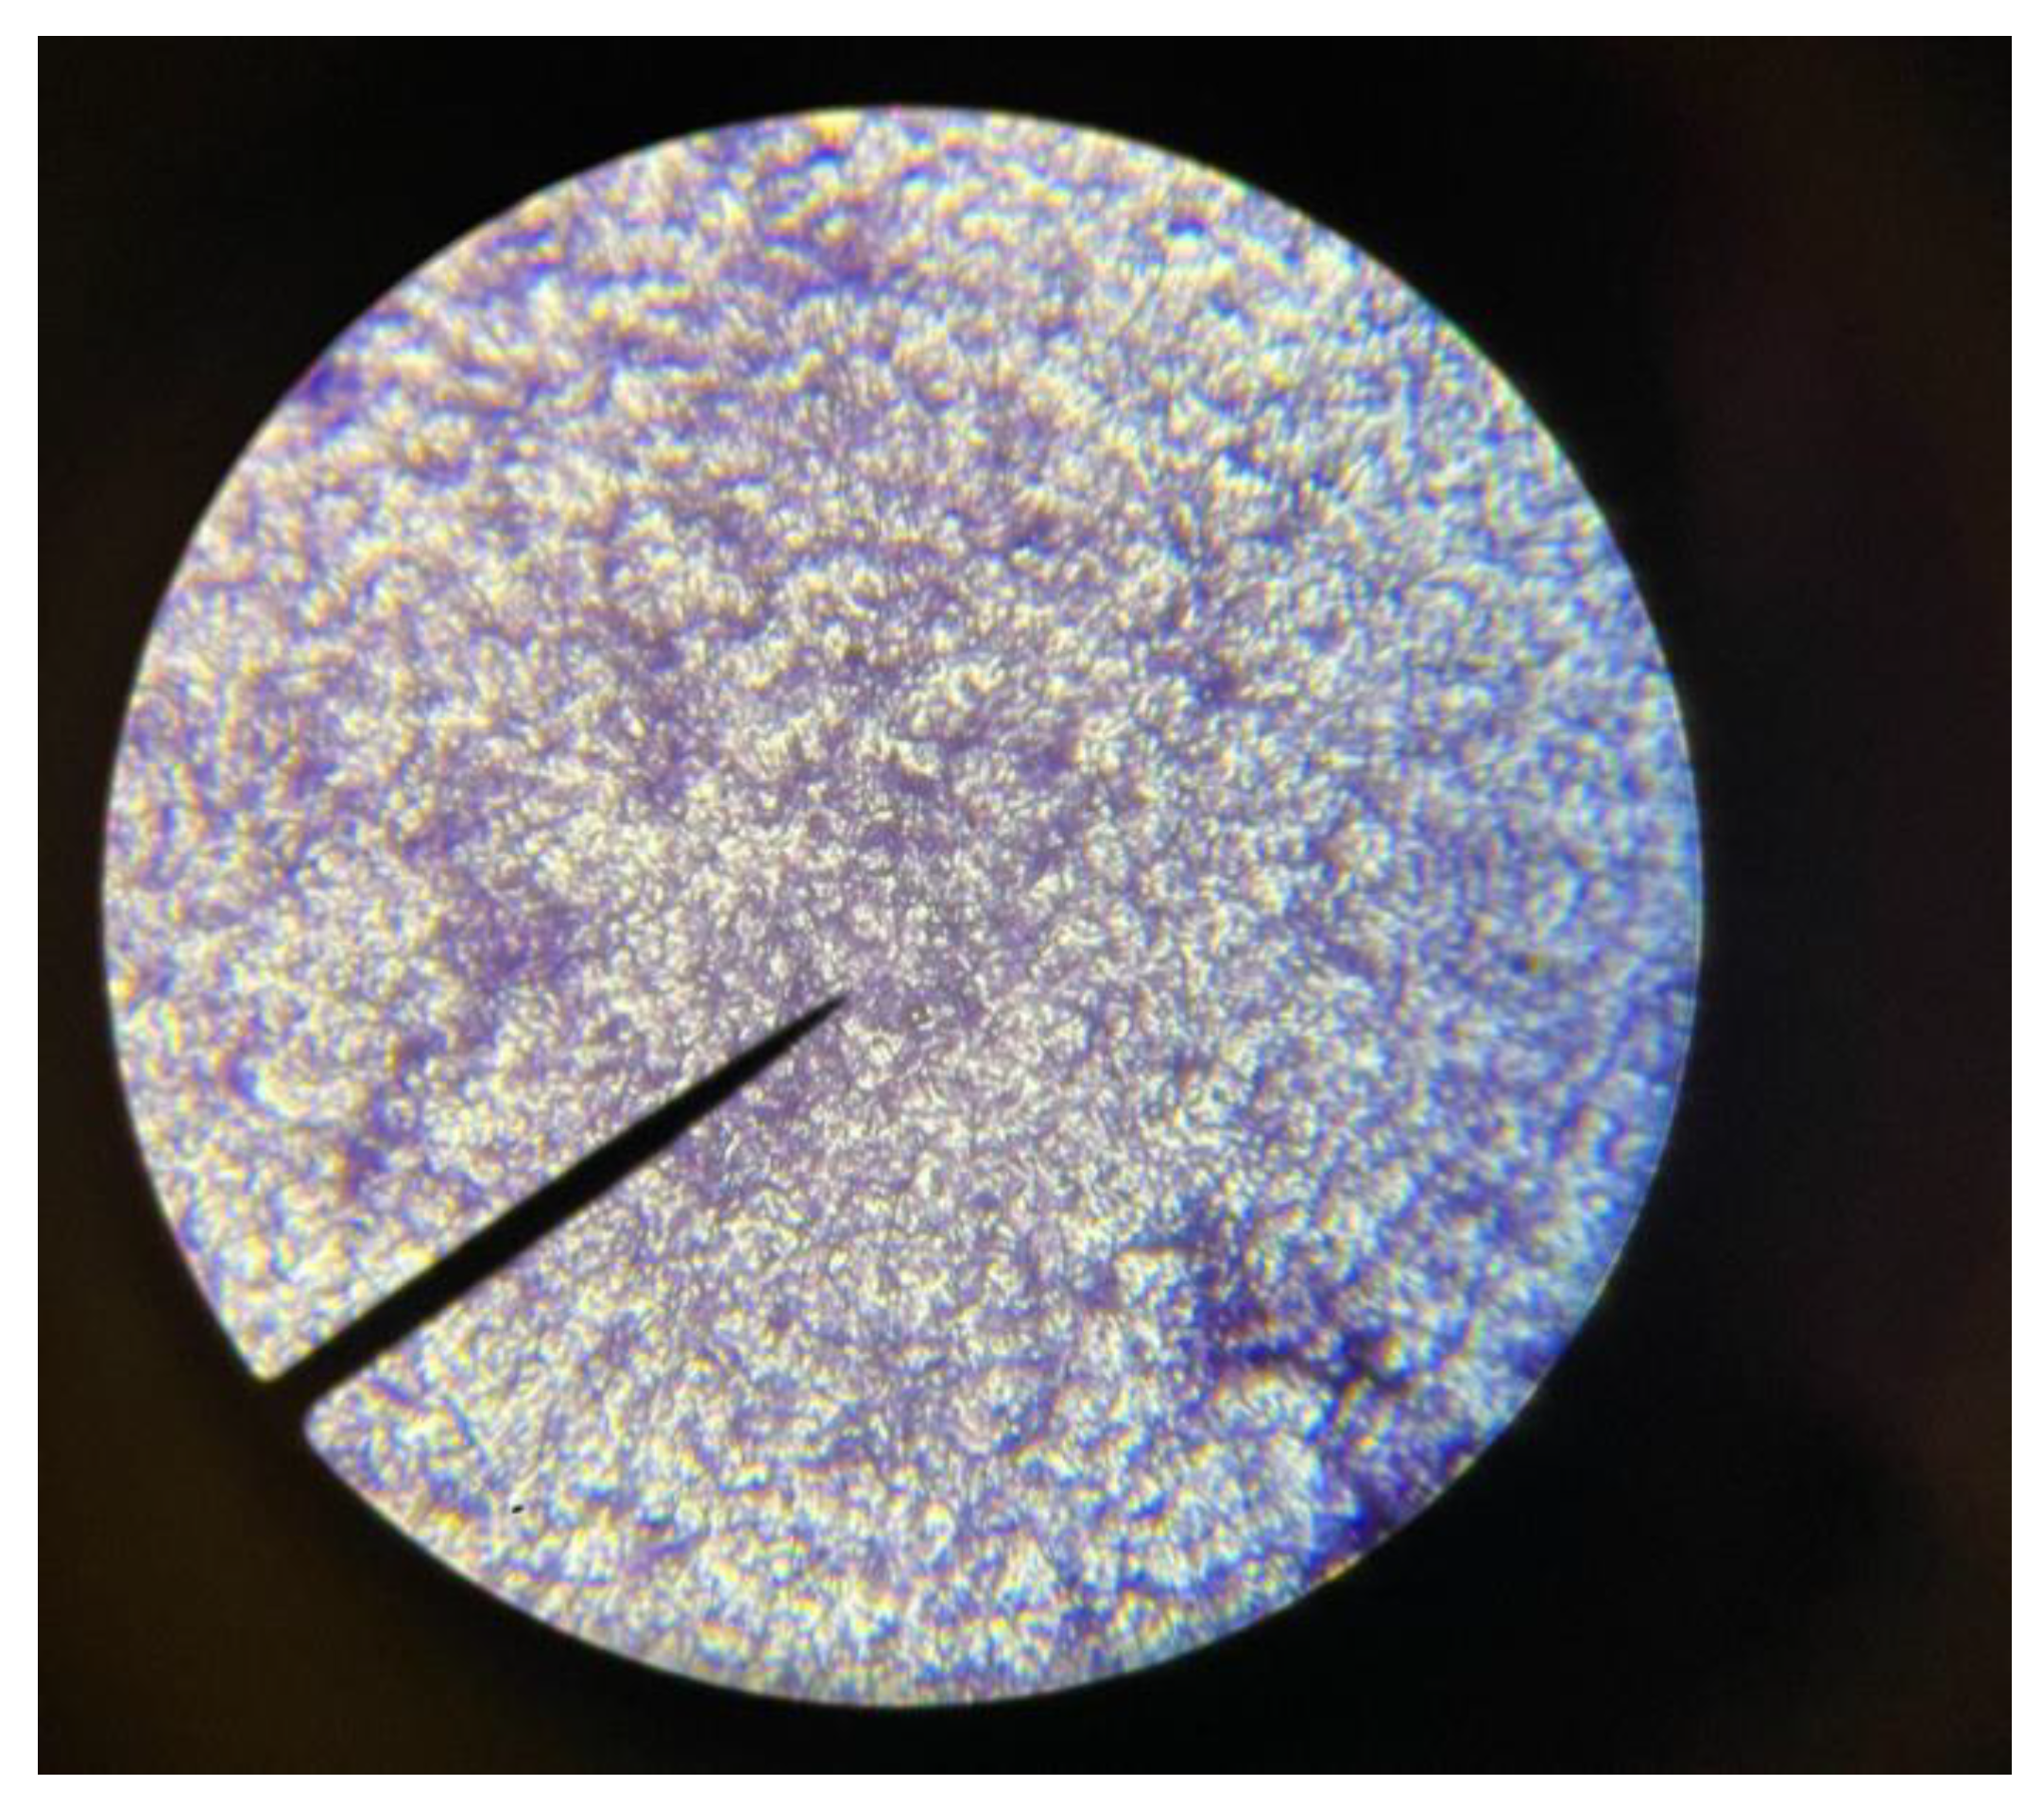
| -Parafilm | Microscope |
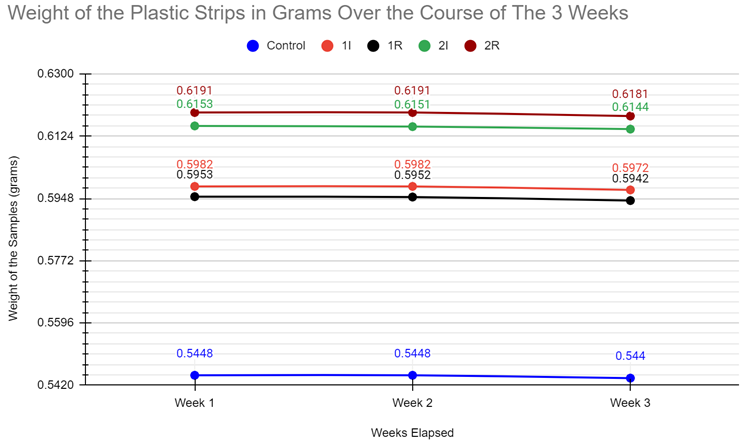
| Control Sample | 1I Sample | 1R Sample | 2I Sample | 2R Sample | |
| Week 1 Sample Weight (grams) | 0.5448 g | 0.598 g | 0.5953 g | 0.6153 g | 0.6191 g |
| Week 2 Sample Weight (grams) |
0.5448 g | 0.5982 g | 0.5952 g | 0.6151 g | 0.6191 g |
| Week 3 Sample Weight (grams) |
0.544 g | 0.5972 g | 0.5942 g | 0.6144 g | 0.6181 g |
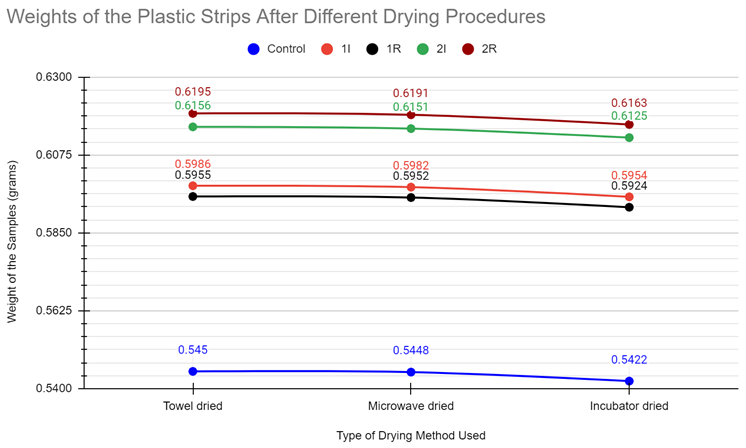
| Control Sample | 1I Sample | 1R Sample | 2I Sample | 2R Sample | |
| Towel Drying Method Sample Weight (grams) | 0.545 g | 0.5986 g | 0.5955 g | 0.6156 g | 0.6195 g |
| Microwave Drying Method Sample Weight (grams) | 0.5448 g | 0.5982 g | 0.5952 g | 0.6151 g | 0.6191 g |
| Incubator Drying Method Sample Weight (grams) | 0.5422 g | 0.5954 g | 0.5924 g | 0.6125 g | 0.6163 g |
Results
Discussion
Acknowledgements
References
- Shosuke Yoshida et al. ,A bacterium that degrades and assimilates poly(ethylene terephthalate).Science351,1196-1199(2016). [CrossRef]
- Lu, H., Diaz, D.J., Czarnecki, N.J. et al. Machine learning-aided engineering of hydrolases for PET depolymerization. Nature 604, 662–667 (2022). [CrossRef]
- Characterization and engineering of a plastic-degrading aromatic polyesterase. Austin HP, Allen MD, Donohoe BS, Rorrer NA, Kearns FL, Silveira RL, Pollard BC, Dominick G, Duman R, El Omari K, Mykhaylyk V, Wagner A, Michener WE, Amore A, Skaf MS, Crowley MF, Thorne AW, Johnson CW, Woodcock HL, McGeehan JE, Beckham GT. Proc Natl Acad Sci U S A. 2018 May 8;115(19):E4350-E4357. Epub 2018 Apr 17. 10.1073/pnas.1718804115 PubMed 29666242. [CrossRef]
- Ali Chamas, Hyunjin Moon, Jiajia Zheng, Yang Qiu, Tarnuma Tabassum, Jun Hee Jang, Mahdi Abu-Omar, Susannah L. Scott, and Sangwon Suh ACS Sustainable Chemistry & Engineering 2020 8 (9), 3494-3511. [CrossRef]
- Benyathiar P, Kumar P, Carpenter G, Brace J, Mishra DK. Polyethylene Terephthalate (PET) Bottle-to-Bottle Recycling for the Beverage Industry: A Review. Polymers (Basel). 2022 Jun 11;14(12):2366. [CrossRef] [PubMed]
Disclaimer/Publisher’s Note: The statements, opinions and data contained in all publications are solely those of the individual author(s) and contributor(s) and not of MDPI and/or the editor(s). MDPI and/or the editor(s) disclaim responsibility for any injury to people or property resulting from any ideas, methods, instructions or products referred to in the content. |
© 2025 by the authors. Licensee MDPI, Basel, Switzerland. This article is an open access article distributed under the terms and conditions of the Creative Commons Attribution (CC BY) license (http://creativecommons.org/licenses/by/4.0/).


