
Submitted:
17 February 2025
Posted:
18 February 2025
You are already at the latest version
Abstract
We describe a novel technique to analyze the extracellular vesicle (EV)-derived microRNA (miRNA) crosstalk between equine chondrocytes and synoviocytes. Donor cells (chondrocytes, n=8; synoviocytes, n=9) were labelled with 5-ethynyl uridine (5-EU); EVs were isolated from culture media and incubated with recipient cells (chondrocytes [n=5] were incubated with synoviocyte-derived EVs, and synoviocytes [n=4] were incubated with chondrocyte-derived EVs). Total RNA was extracted from recipient cells; the 5-EU labelled RNA was recovered and sequenced. Differential expression analysis, pathway analysis, and miRNA target prediction were performed. Overall, 198 and 213 miRNAs were identified in recipient synoviocytes and chondrocytes, respectively. The top five most abundant miRNAs were similar for synoviocytes and chondrocytes (ecamiR-21, eca-miR-221, ecamiR-222, eca-miR-100, eca-miR-26a), and appeared to be linked to joint homeostasis. There were nine differentially expressed (p<0.05) miRNAs (ecamiR-27b, ecamiR-23b, eca-miR-31, ecamiR191a, eca-miR-199a-5p, eca-miR-143, eca-miR-21, eca-miR-181a and eca-miR-181b) between chondrocytes and synoviocytes, which appeared to be linked to migration of cells, apoptosis, cell viability of connective tissue cell, and inflammation. In conclusion, the reported technique was effective in recovering and characterizing the EV-derived miRNA crosstalk between equine chondrocytes and synoviocytes and allowed the identification of EV-communicated miRNA patterns potentially related to cell viability, inflammation, and joint homeostasis.
Keywords:
5-ethynyl uridine
; equine
; extracellular vesicle
; microRNA
; osteoarthritis
; small RNA sequencing
; synovial fluid
1. Introduction
Synovial joints are functional organs constituted by multiple specialized tissues, including cartilage and synovium. Articular cartilage is an avascular tissue constituted by a single cell, the chondrocyte, which is embedded in an extracellular matrix (ECM) of its own production [1]. Due to the avascular nature of cartilage, chondrocytes rely on synovial fluid (SF) for functioning and survival [1]. SF is produced by the synovium and acts as a transport medium for nutrients and for numerous regulatory components [2]. The synovium is a vascularized tissue mainly comprised of two types of synoviocytes: type A synoviocytes, which are macrophagic cells that possess phagocytic and antigen-presenting capabilities; and type B synoviocytes, which are fibroblast-like cells involved in the production of specialized SF constituents, such as hyaluronan and lubricin, and are the predominant cell type of the synovial intima [3,4]. Communication between chondrocytes and synoviocytes is a dynamic process, and understanding the intricate signaling networks between these two cell types is crucial in the study of joint health and disease. For example, inflammatory cytokine production can be detected in normal synovial tissue because synoviocytes are involved in immunological regulation [5]. However, a marked increase in inflammatory responses can contribute to ECM breakdown and chondrocyte injury, leading to cartilage degradation [6], which highlights the complexity of cellular communication pathways.
The role of extracellular vesicles (EVs) in intercellular communication has gathered significant attention from researchers in recent years [7]. EVs are lipid bound vesicles secreted by cells into the extracellular space that serve as vehicles for communication [7]. They are released by nearly every cell type and contain lipids, proteins, and genetic material, including a large variety of coding and non-coding types of RNA [8]. The molecular content of EVs can vary greatly from the contents of the respective parental cell, with some studies suggesting that the RNA cargo of EVs skews toward shorter RNA species [8,9]. EV cargo can be specific per vesicle and per cell type and is influenced by the physiological or pathological state of the donor cell [8,9]. For instance, EVs from interleukin-1 beta (IL-1β) stimulated synovial fibroblasts induced significantly more proteoglycan release from cartilage explants when compared with EVs from non-stimulated synovial fibroblasts [10].
There is a growing interest in the role of EV-mediated communication in osteoarthritis (OA) [11]. EVs play important roles in OA progression by aggravating joint inflammation through macrophage activation in SF [12], affecting chondrocyte catabolism and promoting cartilage destruction [13,14], and by regulating subchondral bone remodeling [15]. Therefore, investigating the content of EVs generated by different joint tissues will allow for a better understanding of OA pathogenesis, as well as the discovery of biomarkers for early diagnosis or disease staging [11].
The aim of this study was to develop a novel RNA tracking technique to explore the EV-derived microRNA (miRNA) crosstalk between chondrocytes and synoviocytes and investigate its functional relevance in joint homeostasis. For this, we labelled newly synthesized RNA in EV-donor cells using 5-ethynyl uridine (5-EU), isolated the EVs and transferred them to EV-recipient cells. Following incorporation by the EV recipient cells, the labelled RNA was recovered, sequenced and analyzed. The reported technique was effective in recovering and characterizing the EV-derived miRNA. Pathway analysis demonstrated that the most abundant miRNAs appeared to be related to joint homeostasis, while differentially expressed miRNAs appeared to be related to cell viability and inflammation. These data highlight the importance of the EV RNA cargo as a mediator of joint homeostasis and disease.
2. Results
2.1. Demographics of EV-donor and EV-recipient cells
EV-donor chondrocytes were collected from metacarpophalangeal (MCP) joints of eight horses with a mean (standard deviation [SD]) age of 6.1 (2.6) years, and a mean (SD) joint macroscopic score [12] of 0.8 (0.7). EV-donor synoviocytes were collected from nine horses with a mean (SD) age of 5.8 (2.3) years, and a mean (SD) joint macroscopic score of 1.6 (1.0). Age and joint macroscopic score were similar between EV-donor chondrocytes and synoviocytes (p = 0.899 and p = 0.092, respectively; Table 1). EV-donor control cells were collected from four additional horses, and the corresponding demographics can be found in Supplementary Materials (Table S1).
EV-recipient chondrocytes were collected from MCP joints of five horses with a mean (SD) age of 6.2 (4.4) years and a mean (SD) joint macroscopic score of 2.2 (1.3). EV-recipient synoviocytes were collected from four horses with a mean (SD) age of 5.5 (2.1) years and mean (SD) joint macroscopic score of 2.0 (0.8). Age and joint macroscopic score were similar between EV-recipient chondrocytes and synoviocytes (p = 0.810 and p = 0.635, respectively; Table 1). EV-recipient control cells were collected from two additional horses, and the corresponding demographics are in the Supplementary Materials (Table S1).
2.2. EV concentration and size
A total of 13 sets of 20 ml of cell culture media were collected from EV-donor chondrocytes, with a mean (SD) EV concentration of 1.7 × 10⁹ (1.0 × 10⁹) particles/ml and a vesicle average size (SD) of 186.3 (92.8) nm. Additionally, 14 sets of 20 ml of cell culture media were collected from EV-donor synoviocytes, with a mean (SD) EV concentration of 8.2 × 10⁸ (9.6 × 10⁸) particles/ml and a vesicle average size (SD) of 190.6 (71.7) nm. There were no significant differences in concentration or size between chondrocyte and synoviocyte-derived EVs (p = 0.115 and p = 0.815, respectively; Table 2).
EVs were pooled together according to EV-donor cell type and equally distributed among EV-recipient cells, so that chondrocytes were incubated with synoviocyte-derived EVs and synoviocytes were incubated with chondrocyte-derived EVs. Overall, EV recipient chondrocytes were incubated with approximately 4.60 × 10¹⁰ synoviocyte-derived EVs (3.04 × 10⁹ synoviocyte EVs/ml media) and EV-recipient synoviocytes were incubated with approximately 1.1 × 10¹¹ chondrocyte-derived EVs (7.33 × 10⁹ chondrocyte EVs/ml media).
2.3. 5-EU RNA capture from recipient cells
After incubating the recipient cells with EVs for 24 h, total RNA was extracted, and the 5-EU labelled RNA was recaptured and quantified. The mean (SD) concentration of 5-EU labelled RNA recovered from EV-recipient chondrocytes was significantly lower than of the EV-recipient synoviocytes (43.1 [5.6] ng/μl vs 62.8 [14.1] ng/μl, respectively; p = 0.016; Table 3). The EV-recipient control samples presented a numerically lower mean RNA concentration when compared with the experimental samples (Table 3); no statistical analyses were performed due to the sample size of the control groups.
2.4. Sequencing results
2.4.1. Data overview
The 5-EU labelled RNA recovered from EV-recipient chondrocytes and synoviocytes was sequenced and analyzed. The total number of reads was similar between EV-recipient chondrocytes and synoviocytes, (5.0 million reads/sample vs 4.5 million reads/samples, respectively; p = 0.905). This was similar to the EV-recipient synoviocyte control sample, with 4.6 million reads. Due to economic constraints, it was not possible to sequence the EV-recipient chondrocyte control sample.
Several types of RNA molecules were identified (Figure 1), including miRNA, transfer RNA, ribosomal RNA, long non-coding RNA, messenger RNA (mRNA), small nuclear RNA, small nucleolar RNA, yRNA and small cytoplasmatic RNA. The relative abundance of miRNAs varied between 0.10–9.62% in EV-recipient chondrocytes and 0.44–7.40% in EV-recipient synoviocytes and had a value of 0.44% in the EV-recipient synoviocyte control. Most samples presented a combined percentage of unclassified and unmapped genomic RNA of over 50% (Figure 1).
2.4.2. EV-transferred miRNAs
A total of 239 miRNAs were identified, of which 213 were present in EV-recipient chondrocytes (RNA originated from EV-donor synoviocytes) and 198 in EV-recipient synoviocytes (RNA originated from EV-donor chondrocytes). Briefly, 43 miRNAs were unique to EV-recipient chondrocytes, 26 miRNAs were unique to EV-recipient synoviocytes, and 170 miRNAs were common to both cell types. Mean (minimum, maximum) absolute miRNA read counts in EV-recipient chondrocytes and synoviocytes were 172 (5–437 ) thousand reads/sample and 167 (17–431) thousand reads/sample, respectively. The top five most abundant miRNAs were the same for both EV-recipient chondrocytes and synoviocytes; these were eca-miR-21, eca-miR-221, eca-miR-222, eca-miR-100 and eca-miR-26a.
2.4.2.1 Predicted mRNA targets of unique miRNAs
Ingenuity Pathway Analysis (IPA) software (Qiagen, Manchester, UK) was used for target prediction. Using the list of miRNAs that were uniquely identified in EV-recipient chondrocytes (RNA originated from EV-donor synoviocytes), IPA revealed 36 experimentally observed targets for eight miRNAs (Table S2; Figure S1;). The top three diseases and functions associated with the predicted interaction network were ‘migration of tumor cells’ (p = 4.36 × 10⁻³⁴; 36/44 molecules involved), ‘proliferation of connective tissue cells’ (p = 8.94 × 10⁻³¹; 28/44 molecules involved), and ‘invasion of tumor cell lines’ (p = 2.29 ×10⁻³⁰; 33/44 molecules). For miRNAs that were unique to EV-recipient synoviocytes (RNA originated from EV-donor chondrocytes), target prediction revealed nine experimentally observed targets for three miRNAs (Table S5; Figure S5). The top three diseases and functions associated with the predicted interaction network were ‘endometriosis’ (p = 2.91 × 10⁻¹⁴; 9/12 molecules involved), ‘benign pelvic disease’ (p = 3.52 × 10⁻¹³; 10/12 molecules involved), and ‘pulmonary fibrosis or aplastic anemia’ (p = 2.77 × 10⁻¹¹; 8/12 molecules involved).
2.4.2.2. Unsupervised analysis
A heatmap and principal component analysis (PCA) plots were built using reads per million (RPM) normalized and scaled miRNA reads. There was a clear distinction between the miRNA expression of EV-recipient chondrocytes and synoviocytes, which was evident in both the heatmap and the PCA plots (Figure 2).
2.4.2.3. Differentially expression analysis
miRNAs were filtered to remove low abundant molecules, as later detailed in the methods. In total, 49 miRNAs were analyzed and nine were found to be significantly differentially expressed between EV-recipient chondrocytes and synoviocytes (p<0.05, Table 4). Of these, four were also differentially expressed at a false discovery rate (FDR) adjusted p<0.05.
2.4.2.4. Target prediction and pathway analysis of differentially expressed miRNAs
Target prediction revealed 23 experimentally observed targets for seven out of the nine differentially expressed miRNAs (Table S4). IPA ‘Core Analysis’ of the combined list (interactome) of differentially expressed miRNAs and miRNA targets revealed that the two top canonical pathways associated to these molecules were ‘role of osteoblasts in rheumatoid arthritis signaling pathway’ (p = 2.30 × 10⁻¹⁰; overlap 3.5% [8/228]) and ‘osteoarthritis pathway’ (p = 2.64 × 10⁻¹⁰; overlap 3.4% [8/232]; Figure S3). When analyzing diseases and functions related to these molecules, 26 were related to organismal injury and abnormalities and 23 were related to inflammatory disease (Figure S3). Pathway analysis also revealed significant links to migration of cells (p = 3.53 × 10⁻¹⁹), angiogenesis (p = 7.79 × 10⁻¹⁷), apoptosis (p = 1.11 × 10⁻¹⁴), cell viability of connective tissue cells (p = 1.28 × 10⁻¹⁵), inflammation of joint (p = 3.92 × 10⁻¹³) and rheumatoid arthritis (p = 9.27 × 10⁻¹²), among others (Figure 3).
3. Discussion
In this study, we reported a novel method of tracking EV-contained miRNA cargo between joint cells in vitro, specifically the crosstalk between equine chondrocytes and synoviocytes. Using a 5-EU labelling and affinity recovery technique, we tracked the EV-led delivery of miRNAs from chondrocytes to synoviocytes and vice versa. Subsequent small RNA sequencing analyses revealed that the most abundant miRNA molecules recovered from EV-recipient cells may play important roles in joint homeostasis, and that the content of EVs produced by chondrocytes differs from that of synoviocytes.
Click chemistry has been widely used as a fast and highly selective method of molecular labelling that allows for the formation of covalent links between unnatural chemical groups or amino acids to any protein sites of interest [17]. A previous study investigating the communication of prostate cancer cells and osteoblasts via EV RNA reported the use of a 5-EU based click chemistry technique to track the transference of miRNAs from donor to recipient cells [18]. The present study used a similar technique, which comprised four main steps: firstly, EV-donor cells were incubated with 5-EU, a non-toxic, alkyne-modified analogue of uridine that is naturally incorporated into newly synthesized RNA; this step enabled the incorporation of the 5-EU label in newly formed RNA in EVs. Secondly, EVs were isolated from donor cells and incubated with recipient cells, allowing for the transference of the 5-EU labelled RNA within the EVs. Thirdly, total RNA was isolated from the recipient cells and the 5-EU labelled RNA was biotinylated; during this process, the alkyne modified uridine of the 5-EU label was combined with an azide modified biotin through a copper catalyzed click-reaction creating a biotin-based handle. Lastly, the total RNA was mixed with streptavidin magnetic beads, and the 5-EU labelled RNA was captured by the beads through the previously created biotin-based handle [19]. RNA concentrations from experimental samples were compared with unlabeled controls to confirm the success of the 5-EU labelled RNA transfer; however, owing to constraints in acquiring fresh equine tissues and technical difficulties in culturing primary cells, sample sizes were relatively small. Mean RNA concentration of EV-recipient chondrocytes was numerically lower than that of the corresponding controls (43.1 ng/μl [n=5] vs 0.9 ng/μl [n=1], respectively). Similarly, mean RNA concentration of EV-recipient synoviocytes was numerically lower than that of the corresponding controls (62.8 ng/μl [n=4] vs 1.8 ng/μl [n=1], respectively). While statistical analyses between experimental and control groups were not possible due to the small sample size of the control groups, there was a clear difference between the mean values, and therefore the technique was deemed successful. This was further supported by the unsupervised analysis of miRNA sequencing data, which showed a clear distinction between the EV-recipient synoviocyte group and the EV-recipient control synoviocyte sample.
In this study, we quantified EVs using nanoparticle tracking analysis and distributed them evenly across recipient cells, ensuring that flasks of recipient cells were incubated with equal volumes of EV-containing media. This resulted in EV-recipient chondrocytes being incubated with approximately 3.04 × 10⁹ synoviocyte EVs/ml media and EV-recipient synoviocytes being incubated with 7.33 × 10⁹ chondrocyte EVs/ml media. Previous studies have shown that incorporation of EV cargo may depend on the type of recipient cells [20], and it is still unclear what the ratio of EV/target cell should be to mimic physiological conditions [21]. In some of these studies, the amount of EVs used was calculated based on their protein content and reported as the EV protein (μg) to the number of recipient cells ratio (e.g. 0.5–50 μg /1 × 104 cells) [20]. In our study, EVs were not fully characterized, and we had no information regarding protein concentration, the presence of protein markers or morphological evaluation. For this reason, we were only able to analyze data regarding vesicle number and size. Whilst EV-led RNA transfer was successful in our study, future studies on chondrocyte and synoviocyte crosstalk could benefit from optimizing the EV input into recipient cells. Additionally, as EV cargo transfer does not necessarily equate to functionality because contents may be degraded via lysosomes [22], functional testing would confirm the active incorporation of transferred molecules into the recipient cells.
Chondrocytes have prolonged metabolic rates, which are partially explained by the lack of vascularization in cartilage and consequent deficient access to nutrients and oxygen [23,24]. There is a known relationship between capillarity and metabolic requirements of a tissue [25]. With the synovium being highly vascularized [4], it can be assumed that the metabolic activity of synoviocytes is higher than that of chondrocytes. We hypothesized this could have an impact on the number of EVs isolated from both cell types, as well as the volume of their cargo. We found that that the number and size of EVs produced by chondrocytes was similar to those produced by synoviocytes. The concentration of 5-EU labelled RNA recovered from recipient synoviocytes (corresponding to RNA derived from chondrocyte EVs; mean [SD] 62.8 [14.1] ng/μl) was significantly higher than that recovered from chondrocytes (corresponding to RNA derived from synoviocyte EVs; mean [SD] 43.1 [5.6] ng/μl; p = 0.016). This indicated that, on average, there was a higher concentration of labelled RNA transferred from chondrocyte-derived EVs to synoviocytes compared with the amount transferred from synoviocyte-derived EVs to chondrocytes. However, we detected a higher number of miRNAs in synoviocyte-derived EVs compared with chondrocyte-derived EVs, as well as a higher number of miRNAs uniquely identified in synoviocyte-derived samples compared with chondrocyte-derived samples. These findings suggest that a difference in metabolic rate alone might not be a determining factor for the volume and type of EV-led communication between chondrocytes and synoviocytes. Of note, the cell type, cell density, growth medium and EU concentration might influence the label uptake [19] and future studies may benefit from optimizing assay conditions.
Using small RNA sequencing, we found a wide variety of small RNA molecules in chondrocyte and synoviocyte-derived EVs, which is in accordance with previous studies [26,27]. Of note, most samples in this study presented a combined percentage of unclassified and unmapped genomic of over 50%. ‘Unclassified genomic’ indicates reads that were mapped against the genome but were not found in any of the RNA specific databases, while ‘unmapped’ are reads that could not be found in the given reference genome. Even with improvements in computational assembly techniques that have contributed to the refinement of the reference genome for the domestic horse [28], annotation of the equine genome still falls short of the level observed in the human genome, and it is reasonable to expect a higher percentage of unmapped reads. Additionally, the samples used in this study had low RNA content and relatively low complexity. Considering that a low amount of starting material can lead to increased technical noise [29], this might have led to an increased presence of unclassified reads in our sequencing data.
The five most abundant miRNAs were the same for chondrocyte and synoviocyte-derived EVs and included eca-miR-21, eca-miR-221, eca-miR-222, eca-miR-100 and eca-miR-26a. Previous studies have demonstrated that miR-21, miR-221 and miR-222 are mechanically regulated miRNAs that affect joint homeostasis by regulating load-induced cartilage behavior in healthy and diseased joints [30]. A study investigating the mechano-regulation of miRNAs in bovine articular cartilage reported a significant increase in the expression levels of miR-21, miR-221 and miR-222 in ex vivo cartilage explants that were subjected to increasing load magnitude, as well as in in vivo cartilage exposed to abnormal loading [30]. Similarly, a miRNA microarray analysis of bovine articular cartilage found miR-221 and miR-222 to be upregulated in the anterior weight-bearing articular area of femoral cartilage compared with the posterior non-weight bearing area in healthy juvenile animals [31]. Additionally, EV-mediated transfer of miR-221-3p between chondrocytes and osteoblasts was shown to have a mechanosensitive function inside cartilage in physiological conditions in an in vitro mice model [32]. It was theorized that, when affected by mechanical loading, chondrocytes secrete EVs that contain miR-221-3p which can be taken up via the microchannel network of the subchondral bone and inhibit osteoblastic function [32]. Studies investigating the expression and function of miRNAs in OA reported that miR-222 was downregulated in OA chondrocytes [33], and that downregulation of miR-221-3p contributed to cartilage degradation in IL-1β treated chondrocytes [34], further confirming the regulatory functions of these miRNAs in joints. Together with these findings, our results suggest that EV-led distribution of eca-miR-21, eca-miR-221 and eca-miR-222 may play an important role in maintaining homeostasis in healthy equine joints by conferring the necessary mechanisms for appropriate biomechanical responses to joint loading. Our results also suggest that both chondrocytes and synoviocytes contribute to the regulation of these mechanisms. Notably, miR-21 has been identified in SF EVs in a post-traumatic equine model of OA and was upregulated in OA SF at 10 days post-induction compared with baseline [35].
A study investigating the role of infrapatellar fat pad mesenchymal stem cells derived exosomes in OA found that miR-100-5p-abundant exosomes protected articular cartilage and ameliorated gait abnormalities [36]. Additionally, overexpression of miR-26a by intraarticular injection significantly attenuated OA progression in mice [37]. In our study, miR-100 and miR-26a were highly abundant in chondrocyte and synoviocyte-derived EVs, suggesting that EV led communication of miR-100 and miR-26a may be implicated in chondroprotective functions in healthy equine joints.
Despite some commonalities, unsupervised analysis of miRNA sequencing data showed a clear separation between chondrocytes and synoviocyte-derived EV content, demonstrating that these samples can be differentiated based on miRNA expression profiles. We found 43 miRNAs that were specific to synoviocyte-derived EVs. Using a miRNA target prediction software, we found 36 experimentally observed targets which were significantly linked to proliferation of connective tissues as well as development of vasculature and angiogenesis. Angiogenesis is a fundamental process for growth and for tissue repair after injury [38]. This dynamic process is finely tuned by the interplay of proangiogenic and antiangiogenic factors, and a disruption of such mechanisms can lead to pathological neovascularization of tissues [39]. While the synovium is highly vascular, vascular proliferation is not a feature of the normal joint and is generally associated with inflammation [38]. In fact, angiogenesis and inflammation are closely integrated processes that contribute to the development of OA [39]. Therefore, regulation of angiogenesis helps maintain appropriate tissue structure and function [38]. Transfer of EVs containing miRNAs that target proteins involved in angiogenesis could help regulate angiogenic processes, allowing the joint to respond to microtrauma while preventing OA development or other joint alterations. In our study, we found that EVs derived from synoviocytes had an increased expression of miRNAs that regulate angiogenesis and other proliferative processes when compared with EVs derived from chondrocytes. Because chondrocytes can induce vascular invasion of the subchondral bone through the production of angiogenic factors such as vascular endothelial growth factor (VEGF)[40], we hypothesize that EV-led communication of these specific miRNAs from synoviocytes to chondrocytes is an important mechanism for regulating angiogenic homeostasis in the joint. Interestingly, the sources of angiogenic signals to the subchondral bone are not yet understood [41] and it is plausible that synoviocyte-derived EVs may participate in this process.
We also found 26 miRNAs that were specific to chondrocyte-derived EVs. Using IPA, we found nine experimentally observed targets including insulin receptor substrate 1 (IRS1), vascular cell adhesion molecule 1 (VCAM1), and VEGFA. Analysis of the top 10 predicted functions and diseases associated with the target mRNAs revealed processes somewhat irrelevant to joint homeostasis, such as endometriosis and benign pelvic disease. This was probably due to the small list of miRNAs used as input, as well as the stringent filters applied. Still, all experimentally observed targets had been previously shown to influence joint homeostasis to some degree. For example, IRS1 is important for bone turnover [42], while VCAM is important in leukocyte trafficking in the synovium [43]. VEGFA is a chondrocyte survival factor during development, and it is crucial for bone formation and skeletal growth in early postnatal life [44]. Additionally, VEGFA is increased in OA joints and synovial levels of this molecule significantly correlate with clinical manifestations, functional impact and radiological changes of knee OA [45]. These examples support the hypothesis that the differentially expressed miRNAs found in this study are involved in processes of joint homeostasis and/or disease.
4. Materials and Methods
All materials and reagents used in this experiment were from ThermoFisher Scientific, Paisley, UK, unless otherwise specified. An overview of the experimental protocol is shown in Figure 4.
4.1. Tissue collection
Equine distal limbs were obtained from the abattoir as a by-product of the agricultural industry. The Animal (Scientific procedures) Act 1986, Schedule 2, does not define collection from these sources as scientific procedures and ethical approval was therefore not required. The MCP joints were aseptically dissected, photographed and scored by three independent researchers using the Osteoarthritis Research Society International equine macroscopic grading system [12]. The final joint macroscopic score was an average of the scores obtained by the three researchers. Horses were selected for inclusion based on a joint macroscopic score <3 and age <15 years old.
4.2. Isolation of primary chondrocytes and synoviocytes
Equine chondrocytes and synoviocytes were isolated as previously described [46,47]. Briefly, the MCP joints were aseptically dissected, and multiple pieces of cartilage (from the metacarpus, proximal phalanx, and sesamoids) and synovium were collected. Tissues were transferred to a class II laminar flow hood, cut into 1–3 mm pieces and digested overnight using a collagenase type II solution (Worthington Biochemicals, New Jersey, USA). Once strained and washed, cells were cultured in monolayer at a density of 20,000 cells/cm2 with complete media (Dulbecco's Modified Eagle Medium [DMEM] supplemented with 10% fetal bovine serum [FBS], 1% Penicillin-Streptomycin [Pen/Strep] and 0.2% Amphotericin B), and incubated at 37°C. Chondrocytes were incubated in hypoxic conditions (5% O2 and 5% CO2) and synoviocytes were incubated in normoxic conditions (25% O2 and 5% CO2). Complete media changes were carried out every two days until cells reached 80% confluence. Cells were stored in liquid nitrogen until further use.
4.3. EV-donor cell set up and RNA labelling
EV-donor cells were thawed, cultured in T175 flasks with complete media at a density of 20,000 cells/cm2 and used at passage 1 (P1). Complete media changes were performed every two days until cells reached 50–60% confluency. The flasks were then washed thrice with sterile phosphate buffered saline (PBS) and incubated with 20 ml of EV media (phenol-red free DMEM supplemented with 1% Pen/Strep, 0.2% Amphotericin B and 1% L-Glutamate), with the addition of 5-EU at 1 μl/ml. Four controls (chondrocyte, n=2; synoviocyte, n=2) were cultured in parallel in EV media with no added label. Cells were incubated for 48 h, after which the cell culture media was collected from each flask and stored in the fridge until further processing. The 5-EU treatment was repeated, and a second batch of media was collected after 48 h.
4.4. EV isolation and characterization
Culture media batches were pre-processed using sequential centrifugation (300 g for 10 min, 2000 g for 10 min, and 10,000 g for 30 min). The resulting supernatant was concentrated down to approximately 400 μl using a 20 ml Vivaspin column (Sartorius, Göttingen, Germany). Samples were transferred to a class II laminar flow hood, and EVs were isolated through size exclusion chromatography using an IZON qEV concentration kit with qEV single columns (IZON, Lyon, France). Firstly, the qEV single columns were flushed with filtered sterile PBS. Then, 150 μl of sample were added to the column, followed by 1 ml of filtered PBS. The first five 200 μl fractions that flowed through the column were discarded, and an additional 1 ml of filtered PBS was added. The following five 200 μl fractions (containing EVs) were collected.
For size analysis and quantitation, 100 μl were aliquoted from each EV sample and subsequently diluted 1:10 in filtered PBS. Diluted samples were characterized using the NanoSight NS300 (Malvern Panalytical, Great Malvern, UK), which was run at 25 °C, with the camera level, slider shutter, and slider gain set at 10, 696, and 73, respectively. Three 60-second-long videos were recorded for each sample, and the results were averaged. For image analysis, the detection threshold was set at 5. Data analysis was performed using NTA 3.4 software (Malvern Panalytical, Malvern, United Kingdom).
4.5. EV-recipient cell set up and EV incubation
EV-recipient cells were thawed, cultured in T75 flasks with complete media at a density of 20,000 cells/cm2 and used at P2. Complete media changes were performed every two days until cells reached 40–50% confluency. Once confluent, the flasks were washed thrice with sterile PBS. Chondrocyte-derived EVs were pooled together and distributed among the EV recipient synoviocyte flasks in equal volumes. Similarly, synoviocyte derived EVs were pooled together and evenly split among EV-recipient chondrocyte flasks. Finally, control recipient chondrocytes (n=1) were incubated with EVs derived from control donor synoviocytes, and control recipient synoviocytes (n=1) were incubated with EVs from control donor chondrocytes. All cells were incubated with EVs for 24 h. After this period, cells were trypsinized and kept in TRIzol until further processing.
4.6. RNA extraction
Total RNA was extracted from EV-recipient cells using the miRNeasy® Serum/Plasma Advanced kit (Qiagen, Manchester, UK) following the manufacturer’s protocol, with the recommended adaptations according to an input volume of 500 μl. RNA was eluted in 18 μl of RNAse-free water.
4.7. Biotinylation of RNA and RNA capture
5-EU labelled RNA was recovered from total RNA samples using the Click-iT® Nascent RNA Capture Kit, following the manufacturer’s protocol with small adjustments. Briefly, a mastermix containing Click-iT® reaction buffers, copper sulphate (component D) and biotin azide (component C) was incubated with total RNA to form a click reaction. To precipitate the RNA, a solution containing ultrapure glycogen, ammonium acetate and chilled absolute ethanol was added to the click reaction. The samples were incubated at -80 °C overnight and centrifuged at 13,000 g for 20 min at 4°C. After discarding the supernatant, 75% ethanol was added to the RNA pellet, and the samples centrifuged again at 13,000 g for 5 min. The ethanol was removed and the pellets allowed to air dry.
The pellet was resuspended in 20 μl of Ultra-Pure™ DNase/RNase-free distilled water and incubated with the kit’s RNA binding reaction mix at 69 °C for 5 min. 25 μl of Dynabeads® MyOne™ Streptavidin T1 were added to the RNA solution and incubated for an additional 30 min at room temperature. Finally, the beads were immobilized using a magnetic stand and washed multiple times with the kit’s reaction buffers. The beads were resuspended in 25 μl of Reaction Wash Buffer 2. 1 μl of the resuspended bead solution was used for RNA quantification using the NanoDrop 8000.
To precipitate the RNA from the beads, the samples were resuspended in 10 mM tris-hydrochloride and incubated at 70 °C for 5 min. The beads were separated from the solution using a magnetic rack. The precipitation step described above was repeated. The dry pellet was resuspended in 35 μl of RNAse-free distilled water.
4.8. Small RNA sequencing
In brief, 8.5 μL of RNA were used as an input for small RNA sequencing library preparation. 1 μL of miND® spike-in standards (TAmiRNA GmbH, Vienna, Austria) were added to each sample prior to small RNA library preparation using the RealSeq Biofluids library preparation kit (RealSeq Biosciences, California, USA). Adapter-ligated libraries were amplified with 25–28 PCR cycles using barcoded Illumina reverse primers in combination with the Illumina forward primer (Illumina, California, USA). Library quality control was performed using DNA1000 Chip (Agilent, California, USA). An equimolar pool consisting of all sequencing libraries was prepared and sequenced on an Illumina Novaseq (Illumina, California, USA) with 100 bp single end reads.
4.9. Data analysis
Horses’ demographics, EV characteristics and RNA concentration were analyzed descriptively and compared between groups (chondrocytes vs synoviocytes). Data were tested for normality of distribution and statistical tests were selected for the specific data types, as appropriate; all tests were performed using GraphPad Prism version 8.0 for Windows, with significance set at a p value of 0.05.
4.9.1. Small RNA sequencing analysis
Data were processed using the miND pipeline and adapted to equine samples [48,49]. Briefly, overall quality of the next-generation sequencing data was evaluated automatically and manually with fastQC v0.11.9 [50] and multiQC v1.10 [51]. Reads from all quality samples were adapter-trimmed and quality-filtered using cutadapt v3.3 [52] and filtered for a minimum length of 17 nucleotides. Mapping steps were performed with Bowtie v1.3.0 [53] and miRDeep2 v2.0.1.2 [54]. Reads were mapped against the genomic reference EquCab.3.0 provided by Ensembl [55] allowing for two mismatches and subsequently against miRBase v22.1 [56], then filtered for miRNAs of eca only, allowing for one mismatch. For a general RNA composition overview, non-miRNA mapped reads were mapped against RNAcentral [57] and then assigned to various RNA species of interest. Statistical analysis of pre-processed sequencing data was undertaken with R v4.0 and the packages pheatmap v1.0.12, pcaMethods v1.82 and genefilter v1.72, to generate heatmaps. Differential expression analysis with edgeR v3.32 [58] used the quasi-likelihood negative binomial generalized log-linear model functions provided by the package. The independent filtering method of DESeq2 [59] was adapted for use with edgeR to remove low abundant miRNAs (defined as RPM values that are lower than 10 divided by the smallest library size in at least half the number of samples of the smaller group) and thus optimize FDR correction.
4.9.2. Target prediction and pathway analysis
Prediction of functional targets for the groups of uniquely expressed miRNAs and for differentially expressed (p<0.05) miRNAs between EV-recipient cell types (chondrocytes vs synoviocytes) were carried out using IPA (Qiagen, Manchester, UK). For this, equine miRNAs were matched to their human equivalents, and the corresponding miRbase IDs were input into IPA as identifiers. Data were analyzed using the ‘Target Prediction’ function and results were filtered for experimentally observed targets in cartilage, chondrocytes and osteoblasts. These interactions were displayed as networks using the Path Designer tool. Additionally, the tool ‘Grow - Diseases & Functions’ was used to assess the top 10 predicted diseases and functions associated with each of the predicted networks.
For the differential expression analysis, the list of predicted mRNA targets was combined with the primary list of differentially expressed miRNAs along with their expression values (log fold change) and significance levels, and input back into IPA. Data were analyzed using the ‘Core Analysis’ function, which calculates the p value of overlap between the molecules in the dataset with the disease and functions contained in the Ingenuity Knowledge Base using a right-tailed Fisher’s exact test. Results were filtered for experimentally observed associations only and used to algorithmically generate a network of canonical pathways, biological functions, diseases and network-eligible molecules based on their connectivity.
5. Conclusions
Understanding the intricate crosstalk between chondrocytes and synoviocytes is crucial to better comprehend the mechanisms underlying joint health and disease. In this proof-of-concept study, we reported a novel method of tracking EV-contained miRNA cargo between joint cells, specifically the crosstalk between equine chondrocytes and synoviocytes. Through a sequencing analysis of the EV content, we found a list of highly abundant miRNAs in EVs which were common for chondrocytes and synoviocytes and appeared to be related to joint homeostasis. We also found nine differentially expressed miRNAs that appear to be related to cell viability and inflammation. These data provide a better understanding of the EV-led intercellular communication between chondrocytes and synoviocytes and highlight the importance of the EV-RNA cargo as a mediator of joint homeostasis and disease.
Supplementary Materials
The following supporting information can be downloaded at the website of this paper posted on Preprints.org, Table S1: Demographics for control donor and recipient cells, stratified by cell type; Table S2. Top 10 diseases and functions associated with the predicted interaction network of uniquely expressed 5-EU labelled miRNAs from synoviocyte-derived EVs and their experimentally observed targets. Table S3. Top 10 diseases and functions associated with the predicted interaction network of uniquely expressed 5-EU labelled miRNAs from chondrocyte-derived EVs and their experimentally observed targets. Table S4. Experimentally observed targets for the differentially expressed miRNAs between EV recipient chondrocytes (RNA from EV-donor synoviocytes) and EV-recipient synoviocytes (RNA from EV-donor chondrocytes), filtered for cartilage, chondrocytes and osteoblasts. Figure S1. Interaction network of 5-EU labelled miRNAs uniquely identified in EV-recipient chondrocytes (RNA from EV-donor synoviocytes) and their experimentally observed targets in chondrocytes, osteoblasts and cartilage tissue. Figure S2. Interaction network of 5-EU labelled miRNAs uniquely identified in EV-recipient synoviocytes (RNA from EV-donor chondrocyte) and their experimentally observed targets in chondrocytes, osteoblasts and cartilage tissue. Figure S3. Summary of IPA Core Analysis performed on differentially expressed miRNAs between chondrocytes and synoviocytes and filtered for experimentally observed relationships.
Author Contributions
Conceptualization, C.C., J.A., V.J., P.C. and M.P.; methodology, C.C., J.A., E.C., M.H., V.J., M.P.; formal analysis, C.C. and M.H. All authors were involved in the writing, reviewing and editing, and agreed to the published version of the manuscript.
Funding
This research was funded by The Horse Trust, grant number G5018. This work was supported by the Medical Research Council (MRC) and Versus Arthritis as part of the Medical Research Council Versus Arthritis Centre for Integrated Research into Musculoskeletal Ageing (CIMA) [MR/P020941/1]. The MRC Versus Arthritis Centre for Integrated Research into Musculoskeletal Ageing is a collaboration between the Universities of Liverpool, Sheffield and Newcastle. Mandy Peffers was funded by a Wellcome Trust Clinical Intermediate Fellowship 107471/Z/15/Z.
Institutional Review Board Statement
Ethical review and approval were waived for this study due to samples being obtained as a by-product of the agricultural industry - the Animal (Scientific procedures) Act 1986, Schedule 2, does not define collection from these sources as scientific procedures and ethical approval was therefore not required.
Data Availability Statement
Data has been submitted to NCBI GEO (Accession will be given on acceptance of publication.)
Acknowledgments
The authors would like to thank the staff at the abattoir, for assistance in sample collection and processing.
Conflicts of Interest
Matthias Hackl is an employee of TAmiRNA, GmBH. The remaining authors declare no conflicts of interest. The funders had no role in the design of the study; in the collection, analyses, or interpretation of data; in the writing of the manuscript; or in the decision to publish the results.
Abbreviations
The following abbreviations are used in this manuscript:
| 5-EU | 5-ethynyl uridine |
| BCL2 | B-cell lymphoma 2 apoptosis regulator |
| CASR | Calcium sensing receptor |
| CI | Confidence interval |
| CXCL12 | C-X-C motif chemokine ligand 12 |
| DMEM | Dulbecco's Modified Eagle Medium |
| ECM | Extracellular matrix |
| EV | Extracellular vesicle |
| FASN | Fatty acid synthase |
| FBS | Fetal bovine serum |
| FDR | False discover rate |
| GRIA2 | Glutamate ionotropic receptor AMPA type subunit 2 |
| HES1 | Hes family bHLH transcription factor 1 |
| IGF1 | Insulin-like growth factor 1 |
| IGFBP5 | Insulin like growth factor binding protein 5 |
| IL | Interleukin |
| IL6R | Interleukin 6 receptor |
| IPA | Ingenuity Pathway Analysis |
| IRS1 | Insulin receptor substrate 1 |
| lncRNA | Long non-coding RNA |
| logFC | Log fold change |
| Max | Maximum |
| MCP | Metacarpophalangeal |
| Min | Minimum |
| MMP | Matrix metalloproteinase |
| miRNA | MicroRNA |
| mRNA | Messenger RNA |
| NOTCH | Notch receptor |
| OA | Osteoarthritis |
| P | Passage |
| PBS | Phosphate buffered saline |
| PCA | Principal Component Analysis |
| Pen/Strep | Penicillin-Streptomycin |
| piRNA | Piwi interfering RNA |
| PPARG | Peroxisome proliferator activated receptor gamma |
| QC | Quality control |
| RECK | Reversion-inducing cysteine-rich protein with Kazal motifs |
| RPM | Reads per million |
| rRNA | Ribosomal RNA |
| RXRA | Retinoid X receptor alpha |
| SEC | Size exclusion chromatography |
| scRNA | Small conditional RNA |
| SIRT1 | Sirtuin 1 |
| SMAD4 | Mothers against decapentaplegic homolog 4 |
| snRNA | Small nuclear RNA |
| snoRNA | Small nucleolar RNA |
| SF | Synovial fluid |
| SD | Standard deviation |
| THRB | Thyroid hormone receptor beta |
| TNF | Tumor necrosis factor. |
| tRNA | Transfer RNA |
| VCAM | Vascular cell adhesion molecule 1 |
| VEGF | Vascular endothelial growth factor |
References
- Fox, A.J.S.; Bedi, A.; Rodeo, S.A. The Basic Science of Articular Cartilage: Structure, Composition, and Function. Sports Health 2009, 1, 461–468, . [CrossRef]
- Tarafder, S.; Lee, C.H. Chapter 14 - Synovial Joint: In Situ Regeneration of Osteochondral and Fibrocartilaginous Tissues by Homing of Endogenous Cells. In In Situ Tissue Regeneration: Host Cell Recruitment and Biomaterial Design. Lee, S.J.; Yoo, J.J.; Atala, A. Elsevier, 2016; pp. 253–273, . [CrossRef]
- Iwanaga, T.; Shikichi, M.; Kitamura, H.; Yanase, H.; Nozawa-Inoue, K. Morphology and Functional Roles of Synoviocytes in the Joint. Arch Histol Cytol 2000, 63, 17–31, . [CrossRef]
- Veale, D.J.; Firestein, G.S. Synovium. In Kelley and Firestein’s Textbook of Rheumatology, 10th ed. Firestein, G.S.; Budd, R.C.; Gabriel, S.E.; McInnes, I.B.; O’Dell, J.R. Elsevier, 2017; Volume 1-2: pp. 20–33, . [CrossRef]
- Smith, M. D. The Normal Synovium. Open Rheumatol J 2011, 5, 100–106, . [CrossRef]
- Sellam, J.; Berenbaum, F. The Role of Synovitis in Pathophysiology and Clinical Symptoms of Osteoarthritis. Nat Rev Rheumatol 2010, 6, 625–635, . [CrossRef]
- Abels, E.R.; Breakefield, X.O. Introduction to Extracellular Vesicles: Biogenesis, RNA Cargo Selection, Content, Release, and Uptake. Cell Mol Neurobiol 2016, 36, 301–312, . [CrossRef]
- O’Grady, T.; Njock, M-S.; Lion, M.; Bruyr, J.; Mariavelle, E.; Galvan, B.; Boeckx, A.; Struman, I.; Dequiedt, F. Sorting and Packaging of RNA into Extracellular Vesicles Shape Intracellular Transcript Levels. BMC Biol 2022, 20, 72, . [CrossRef]
- Valadi, H.; Ekström, K.; Bossios, A.; Sjöstrand, M.; Lee, J.J.; Lötvall, J.O. Exosome-Mediated Transfer of MRNAs and MicroRNAs Is a Novel Mechanism of Genetic Exchange Between Cells. Nat Cell Biol 2007, 9, 654–659, . [CrossRef]
- Kato, T.; Miyaki, S.; Ishitobi, H.; Nakamura, Y.; Nakasa, T.; Lotz, M.K.; Ochi, M. Exosomes from IL-1β Stimulated Synovial Fibroblasts Induce Osteoarthritic Changes in Articular Chondrocytes. Arthritis Res Ther 2014, 16, r163, . [CrossRef]
- Liu, Z.; Zhuang, Y.; Fang, L.; Yuan, C.; Wang, X.; Lin, K. Breakthrough of Extracellular Vesicles in Pathogenesis, Diagnosis and Treatment of Osteoarthritis. Bioact Mater 2022, 22, 423–452, . [CrossRef]
- Peng, S.; Yan, Y.; Li, R.; Dai, H.; Xu, J. Extracellular Vesicles from M1-Polarized Macrophages Promote Inflammation in the Temporomandibular Joint via MiR-1246 Activation of the Wnt/β-Catenin Pathway. Ann N Y Acad Sci 2021, 1503, 48–59, . [CrossRef]
- Guo, Z.; Wang, H.; Zhao, F.; Liu, M.; Wang, F.; Kang, M.; He, W.; Lv, Z. Exosomal Circ-BRWD1 Contributes to Osteoarthritis Development through the Modulation of MiR-1277/TRAF6 Axis. Arthritis Res Ther 2021, 23,159, . [CrossRef]
- Wu, X.; Crawford, R.; Xiao, Y.; Mao, X.; Prasadam, I.. Osteoarthritic Subchondral Bone Release Exosomes That Promote Cartilage Degeneration. Cells, 2021, 10, 251, . [CrossRef]
- Li, D.; Liu, J.; Guo, B.; Liang, C.; Dang, L.; Lu, C.; He, X.; Cheung, H.Y-S.; Xu, L.; Lu, C.; et al. Osteoclast-Derived Exosomal MiR-214-3p Inhibits Osteoblastic Bone Formation. Nat Comms, 2016, 7, 10872, . [CrossRef]
- McIlwraith, C.W.; Frisbie, D.D.; Kawcak, C.E.; Fuller, C.J.; Hurtig, M.; Cruz, A. The OARSI Histopathology Initiative - Recommendations for Histological Assessments of Osteoarthritis in the Horse. Osteoarthritis Cartilage 2010, 18, S93–S105, . [CrossRef]
- Hu, C.; Wang, J. Chapter Five - Method for Enzyme Design with Genetically Encoded Unnatural Amino Acids. In Methods Enzymol. Pecoraro, V.L. Elsevier, 2016; Volume580, p.p. 109–133, . [CrossRef]
- Probert, C.; Dottorini, T.; Speakman, A.; Hunt, S.; Nafee, T.; Fazeli, A.; Wood, S.; Brown, J.E.; James, V. Communication of Prostate Cancer Cells with Bone Cells via Extracellular Vesicle RNA; a Potential Mechanism of Metastasis. Oncogene 2018, 38, 1751–1763, . [CrossRef]
- ThermoFisher Scientific.Click-IT® Nascent RNA Capture Kit Product Information, 2013 Available online: https://assets.thermofisher.com/TFS-Assets/LSG/manuals/mp10365.pdf (accessed on 15 February 2025).
- Yáñez-Mó, M.; Siljander, P.R.-M.; Andreu, Z.; Zavec, A.B.; Borràs, F.E.; Buzas, E.I.; Buzas, K.; Casal, E.; Cappello, F.; Carvalho, J.; et al. Biological Properties of Extracellular Vesicles and Their Physiological Functions. J Extracell Vesicles 2015, 4, 27066, . [CrossRef]
- Tabak, S.; Schreiber-Avissar, S.; Beit-Yannai, E. Extracellular Vesicles Have Variable Dose-Dependent Effects on Cultured Draining Cells in the Eye. J Cell Mol Med 2018, 22, 1992–2000, . [CrossRef]
- O’Brien, K.; Ughetto, S.; Mahjoum, S.; Nair, A. V.; Breakefield, X.O. Uptake, Functionality, and Re-Release of Extracellular Vesicle-Encapsulated Cargo. Cell Rep 2022, 39, 110651, . [CrossRef]
- Goldring, M.B.; Culley, K.L.; Wondimu, E.; Otero, M. Chapter 3 - Cartilage and Chondrocytes. In Kelley and Firestein’s Textbook of Rheumatology, 10th ed. Firestein, G.S.; Budd, R.C.; Gabriel, S.E.; McInnes, I.B.; O’Dell, J.R. Elsevier, 2017; Volume 1: pp. 34–59.e3, . [CrossRef]
- Wu, X.; Fan, X.; Crawford, R.; Xiao, Y.; Prasadam, I. The Metabolic Landscape in Osteoarthritis. Aging Dis 2022, 13, 1166–1182, . [CrossRef]
- Adair, T.H.; Gay, W.J.; Montani, J.P. Growth Regulation of the Vascular System: Evidence for a Metabolic Hypothesis. Am J Physiol 1990, 259, R393–404, . [CrossRef]
- Colombo, M.; Raposo, G.; Théry, C. Biogenesis, Secretion, and Intercellular Interactions of Exosomes and Other Extracellular Vesicles. Annu Rev Cell Dev Biol 2014, 30, 255–289, . [CrossRef]
- O’Brien, K.; Breyne, K.; Ughetto, S.; Laurent, L.C.; Breakefield, X.O. RNA Delivery by Extracellular Vesicles in Mammalian Cells and Its Applications. Nat Rev Mol Cell Biol 2020, 21, 585–606, . [CrossRef]
- Kalbfleisch, T.S.; Rice, E.S.; DePriest, M.S.; Walenz, B.P.; Hestand, M.S.; Vermeesch, J.R.; O′Connell, B.L.; Fiddes, I.T.; Vershinina, A.O.; Saremi, N.F.; et al. Improved Reference Genome for the Domestic Horse Increases Assembly Contiguity and Composition. Comm Biol 2018, 1, 197, . [CrossRef]
- Brennecke, P.; Anders, S.; Kim, J.K.; Kołodziejczyk, A.A.; Zhang, X.; Proserpio, V.; Baying, B.; Benes, V.; Teichmann, S.A.; Marioni, J.C.; et al. Accounting for Technical Noise in Single-Cell RNA-Seq Experiments. Nat Methods 2013, 10, 1093–1095, . [CrossRef]
- Stadnik, P.S.; Gilbert, S.J.; Tarn, J.; Charlton, S.; Skelton, A.J.; Barter, M.J.; Duance, V.C.; Young, D.A.; Blain, E.J. Regulation of MicroRNA-221, -222, -21 and -27 in Articular Cartilage Subjected to Abnormal Compressive Forces. J Physiol 2021, 599, 143–155, . [CrossRef]
- Dunn, W.; DuRaine, G.; Reddi, A.H. Profiling MicroRNA Expression in Bovine Articular Cartilage and Implications for Mechano transduction. Arthritis Rheum 2009, 60, 2333–2339, . [CrossRef]
- Shang, X.; Böker, K.O.; Taheri, S.; Lehmann, W.; Schilling, A.F. Extracellular Vesicles Allow Epigenetic Mechanotransduction between Chondrocytes and Osteoblasts. Int J Mol Sci 2021, 22, 13282, . [CrossRef]
- Song, J.; Jin, E.H.; Kim, D.; Kim, K.Y.; Chun, C.H.; Jin, E.J. MicroRNA-222 Regulates MMP-13 via Targeting HDAC-4 during Osteoarthritis Pathogenesis. BBA Clin 2015, 3, 79–89, . [CrossRef]
- Zheng, X.; Zhao, F-C.; Pang, Y.; Li, D-Y.; Yao, S-C.; Sun, S-S.; Guo, K-J. Downregulation of MiR-221-3p Contributes to IL-1β-Induced Cartilage Degradation by Directly Targeting the SDF1/CXCR4 Signaling Pathway. J Mol Med (Berl) 2017, 95, 615–627, . [CrossRef]
- Anderson, J.R.; Jacobsen, S.; Walters, M.; Bundgaard, L.; Diendorfer, A.; Hackl, M.; Clarke, E.J.; James, V.; Peffers, M.J. Small Non-Coding RNA Landscape of Extracellular Vesicles from a Post-Traumatic Model of Equine Osteoarthritis. Front Vet Sci 2022, 9, 901269, . [CrossRef]
- Wu, J.; Kuang, L.; Chen, C.; Yang, J.; Zeng, W-N.; Li, T.; Chen, H.; Huang, S.; Fu, Z.; Li, J.; et al. MiR-100-5p-Abundant Exosomes Derived from Infrapatellar Fat Pad MSCs Protect Articular Cartilage and Ameliorate Gait Abnormalities via Inhibition of MTOR in Osteoarthritis. Biomaterials 2019, 206, 87–100, . [CrossRef]
- Hu, J.; Wang, Z.; Pan, Y.; Ma, J.; Miao, X.; Qi, X.; Zhou, H.; Jia, L. MiR-26a and MiR-26b Mediate Osteoarthritis Progression by Targeting FUT4 via NF-ΚB Signaling Pathway. Int J Biochem Cell Biol 2018, 94, 79–88, . [CrossRef]
- Walsh, D.A.; Pearson, C.I. Angiogenesis in Pathogenesis of Inflammatory Joint and Lung Diseases. Arthritis Res 2001, 3, 147–153, . [CrossRef]
- Mapp, P.I.; Walsh, D.A. Mechanisms and Targets of Angiogenesis and Nerve Growth in Osteoarthritis. Nat Rev Rheumatol2012, 8, 390–398, . [CrossRef]
- Hashimoto, S.; Creighton-Achermann, L.; Takahashi, K.; Amiel, D.; Coutts, R.D.; Lotz, M. Development and Regulation of Osteophyte Formation during Experimental Osteoarthritis. Osteoarthritis Cartilage 2002, 10, 180–187, . [CrossRef]
- Bonnet, C.S.; Walsh, D.A. Osteoarthritis, Angiogenesis and Inflammation. Rheumatology (Oxford) 2005, 44, 7–16, . [CrossRef]
- Ogata, N.; Chikazu, D.; Kubota, N.; Terauchi, Y.; Tobe, K.; Azuma, Y.; Ohta, T.; Kadowaki, T.; Nakamura, K.; Kawaguchi, H. Insulin Receptor Substrate-1 in Osteoblast Is Indispensable for Maintaining Bone Turnover. J Clin Invest 2000, 105, 935–943, . [CrossRef]
- Carter, R.A.; Campbell, I.K.; O’Donnell, K.L.; Wicks, I.P. Vascular Cell Adhesion Molecule-1 (VCAM-1) Blockade in Collagen-Induced Arthritis Reduces Joint Involvement and Alters B Cell Trafficking. Clin Exp Immunol 2002, 128, 44–51, . [CrossRef]
- Nagao, M.; Hamilton, J.L.; Kc, R.; Berendsen, A.D.; Duan, X.; Cheong, C.W.; Li, X.; Im, H.J.; Olsen, B.R. Vascular Endothelial Growth Factor in Cartilage Development and Osteoarthritis. Sci Rep2017, 7, 13027, . [CrossRef]
- Gaballah, A.; Hussein, N.A.; Risk, M.; Elsawy, N.; Elabasiry, S. Correlation between Synovial Vascular Endothelial Growth Factor, Clinical, Functional and Radiological Manifestations in Knee Osteoarthritis. Egypt Rheumatol 2016, 38, 29–34, . [CrossRef]
- Peffers, M.J.; Milner, P.I.; Tew, S.R.; Clegg, P.D. Regulation of SOX9 in Normal and Osteoarthritic Equine Articular Chondrocytes by Hyperosmotic Loading. Osteoarthritis Cartilage 2010, 18, 1502–1508, . [CrossRef]
- Morgan, R.E.; Clegg, P.D.; Hunt, J.A.; Innes, J.F.; Tew, S.R. Interaction with Macrophages Attenuates Equine Fibroblast-like Synoviocyte ADAMTS5 (Aggrecanase-2) Gene Expression Following Inflammatory Stimulation. J Orthop Res 2018, 36, 2178–2185, . [CrossRef]
- Diendorfer, A.; Khamina, K.; Pultar, M.; Hackl, M. MiND (MiRNA NGS Discovery Pipeline): A Small RNA-Seq Analysis Pipeline and Report Generator for MicroRNA Biomarker Discovery Studies. F1000Research 2022, 11, 233, . [CrossRef]
- Khamina, K.; Diendorfer, A.B.; Skalicky, S.; Weigl, M.; Pultar, M.; Krammer, T.L.; Fournier, C.A.; Schofield, A.L.; Otto, C.; Smith, A.T.; et al. A MicroRNA Next-Generation-Sequencing Discovery Assay (MiND) for Genome-Scale Analysis and Absolute Quantitation of Circulating MicroRNA Biomarkers. Int J Mol Sci 2022, 23, 1226, . [CrossRef]
- Andrews, S. FastQC: A Quality Control Tool for High Throughput Sequence. Available online: https://www.bioinformatics.babraham.ac.uk/projects/fastqc/ (accessed on 26 January 2025).
- Ewels, P.; Magnusson, M.; Lundin, S.; Käller, M. MultiQC: Summarize Analysis Results for Multiple Tools and Samples in a Single Report. Bioinformatics 2016, 32, 3047–3048, . [CrossRef]
- Martin, M. Cutadapt Removes Adapter Sequences from High-Throughput Sequencing Reads. EMBnet J 2011, 17, 10–12, . [CrossRef]
- Langmead, B.; Trapnell, C.; Pop, M.; Salzberg, S.L. Ultrafast and Memory-Efficient Alignment of Short DNA Sequences to the Human Genome. Genome Biol 2009, 10, R25, . [CrossRef]
- Friedländer, M.R.; MacKowiak, S.D.; Li, N.; Chen, W.; Rajewsky, N. MiRDeep2 Accurately Identifies Known and Hundreds of Novel MicroRNA Genes in Seven Animal Clades. Nucleic Acids Res 2012, 40, 37–52, . [CrossRef]
- Zerbino, D.R.; Achuthan, P.; Akanni, W.; Amode, M.R.; Barrell, D.; Bhai, J.; Billis, K.; Cummins, C.; Gall, A.; Girón, C.G.; et al. Ensembl 2018. Nucleic Acids Res 2018, 46, D754–D761, . [CrossRef]
- Griffiths-Jones, S. The MicroRNA Registry. Nucleic Acids Res 2004, 32, D109–D111, . [CrossRef]
- The RNAcentral Consortium. RNAcentral: A Hub of Information for Non-Coding RNA Sequences. Nucleic Acids Res 2019, 47, D221–D229, . [CrossRef]
- Robinson, M.D.; McCarthy, D.J.; Smyth, G.K. EdgeR: A Bioconductor Package for Differential Expression Analysis of Digital Gene Expression Data. Bioinformatics 2010, 26, 139–140, . [CrossRef]
- Love, M.I.; Huber, W.; Anders, S. Moderated Estimation of Fold Change and Dispersion for RNA-Seq Data with DESeq2. Genome Biol 2014, 15, 550, . [CrossRef]
Figure 1.
Absolute read composition of all samples, stratified by RNA type. Different colors represent different RNA types, as indicated in the figure label. Labels with lower opacity correspond to RNA types that were not identified in this dataset (piRNA). The bars represent the different samples, with sample ID and group indicated below each bar. ‘Chond’ refers to 5-EU labelled RNA isolated from EV-recipient chondrocytes. ‘Syn’ refers to 5-EU labelled RNA isolated from EV-recipient synoviocytes. lncRNA, long non-coding RNA; miRNA, microRNA; mRNA, messenger RNA; piRNA, piwi interfering RNA; QC, quality control; rRNA, ribosomal RNA; scRNA, small conditional RNA; snRNA, small nuclear RNA; snoRNA, small nucleolar RNA; tRNA, transfer RNA.
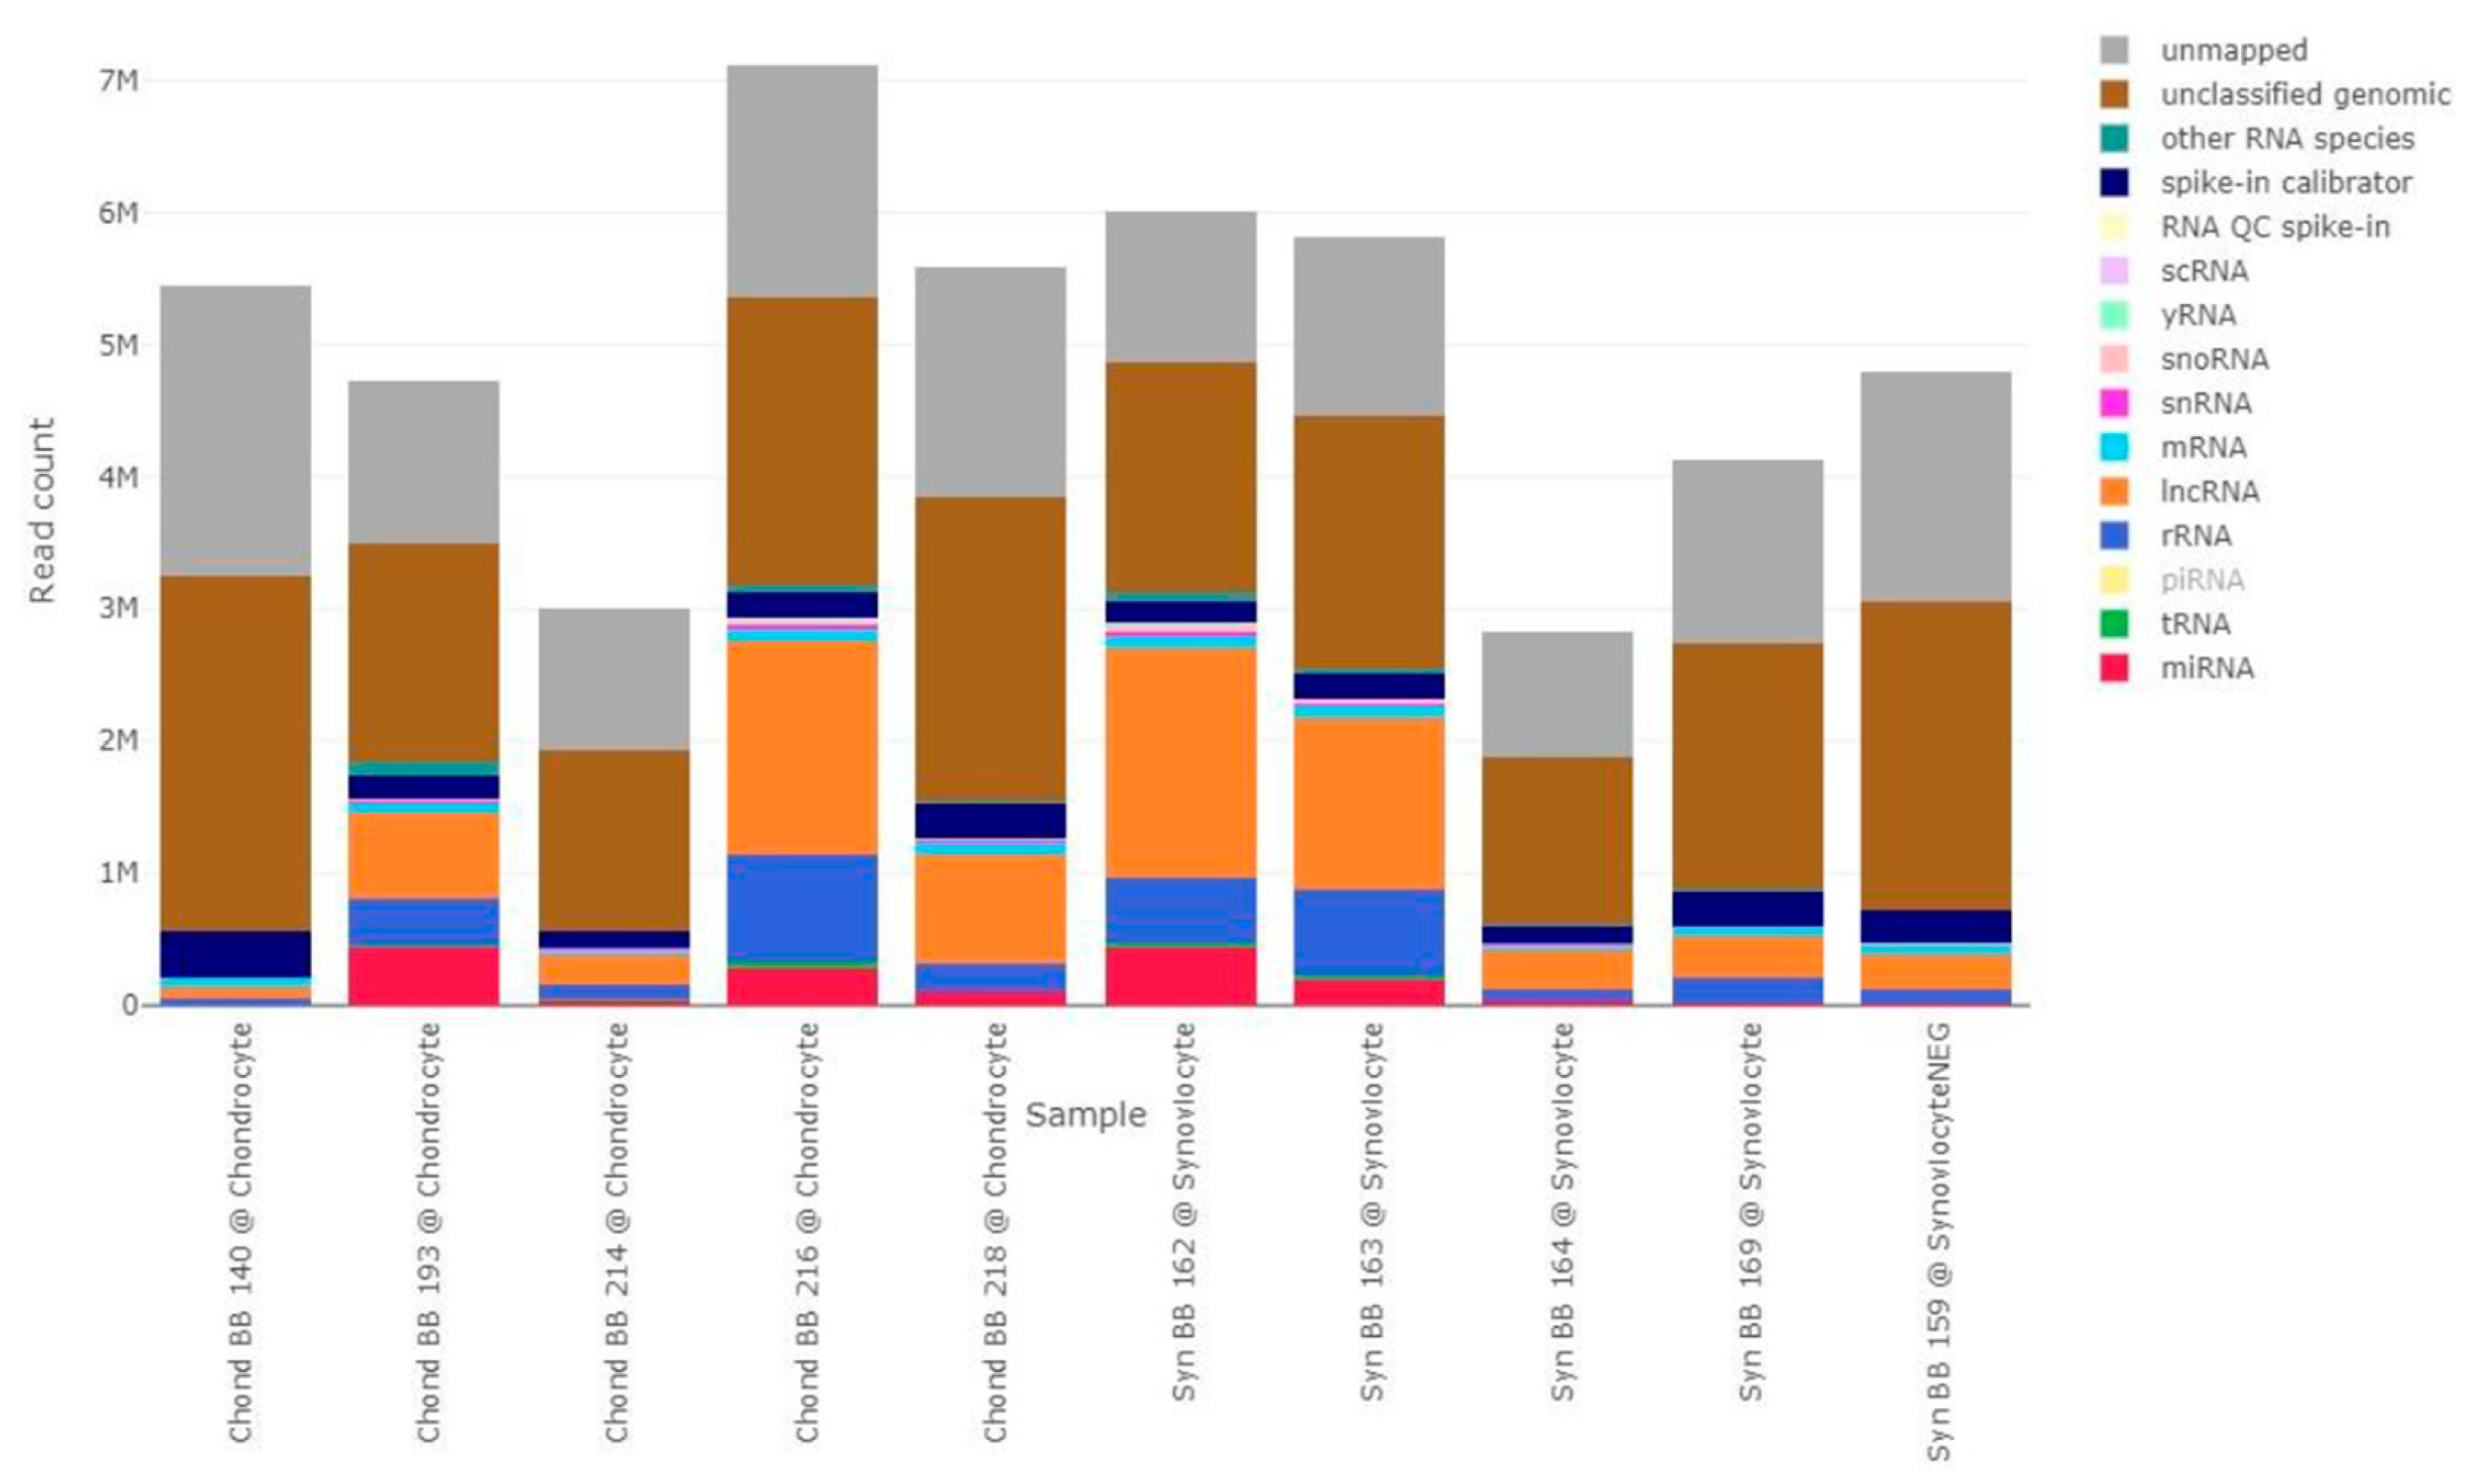
Figure 2.
(A) Heatmap and (B) PCA plot of normalized and scaled miRNA reads. Scaling of data for the heatmap was undertaken using the unit variance method for visualization in heatmaps and filtered to show a minimum of 5 RPM in at least 50% of samples. Each column represents a sample, each row represents a miRNA, and the color intensity of each cell corresponds to the miRNA expression in a given sample. For the PCA plot, reads were normalized as RPM and scaled using unit variance and principal components were calculated using singular value decomposition with imputation. Colors represent the different sample types, as shown in the figure label. ‘Synoviocyte’ refers to labelled RNA isolated from EV-recipient synoviocytes. ‘Chondrocyte’ refers to labelled RNA isolated from EV-recipient chondrocytes. ‘SynoviocyteNEG’ and ‘Synoviocyte CONTROL’ refer to the EV-recipient control synoviocyte sample. PCA, principal component analysis; RPM, reads per million.
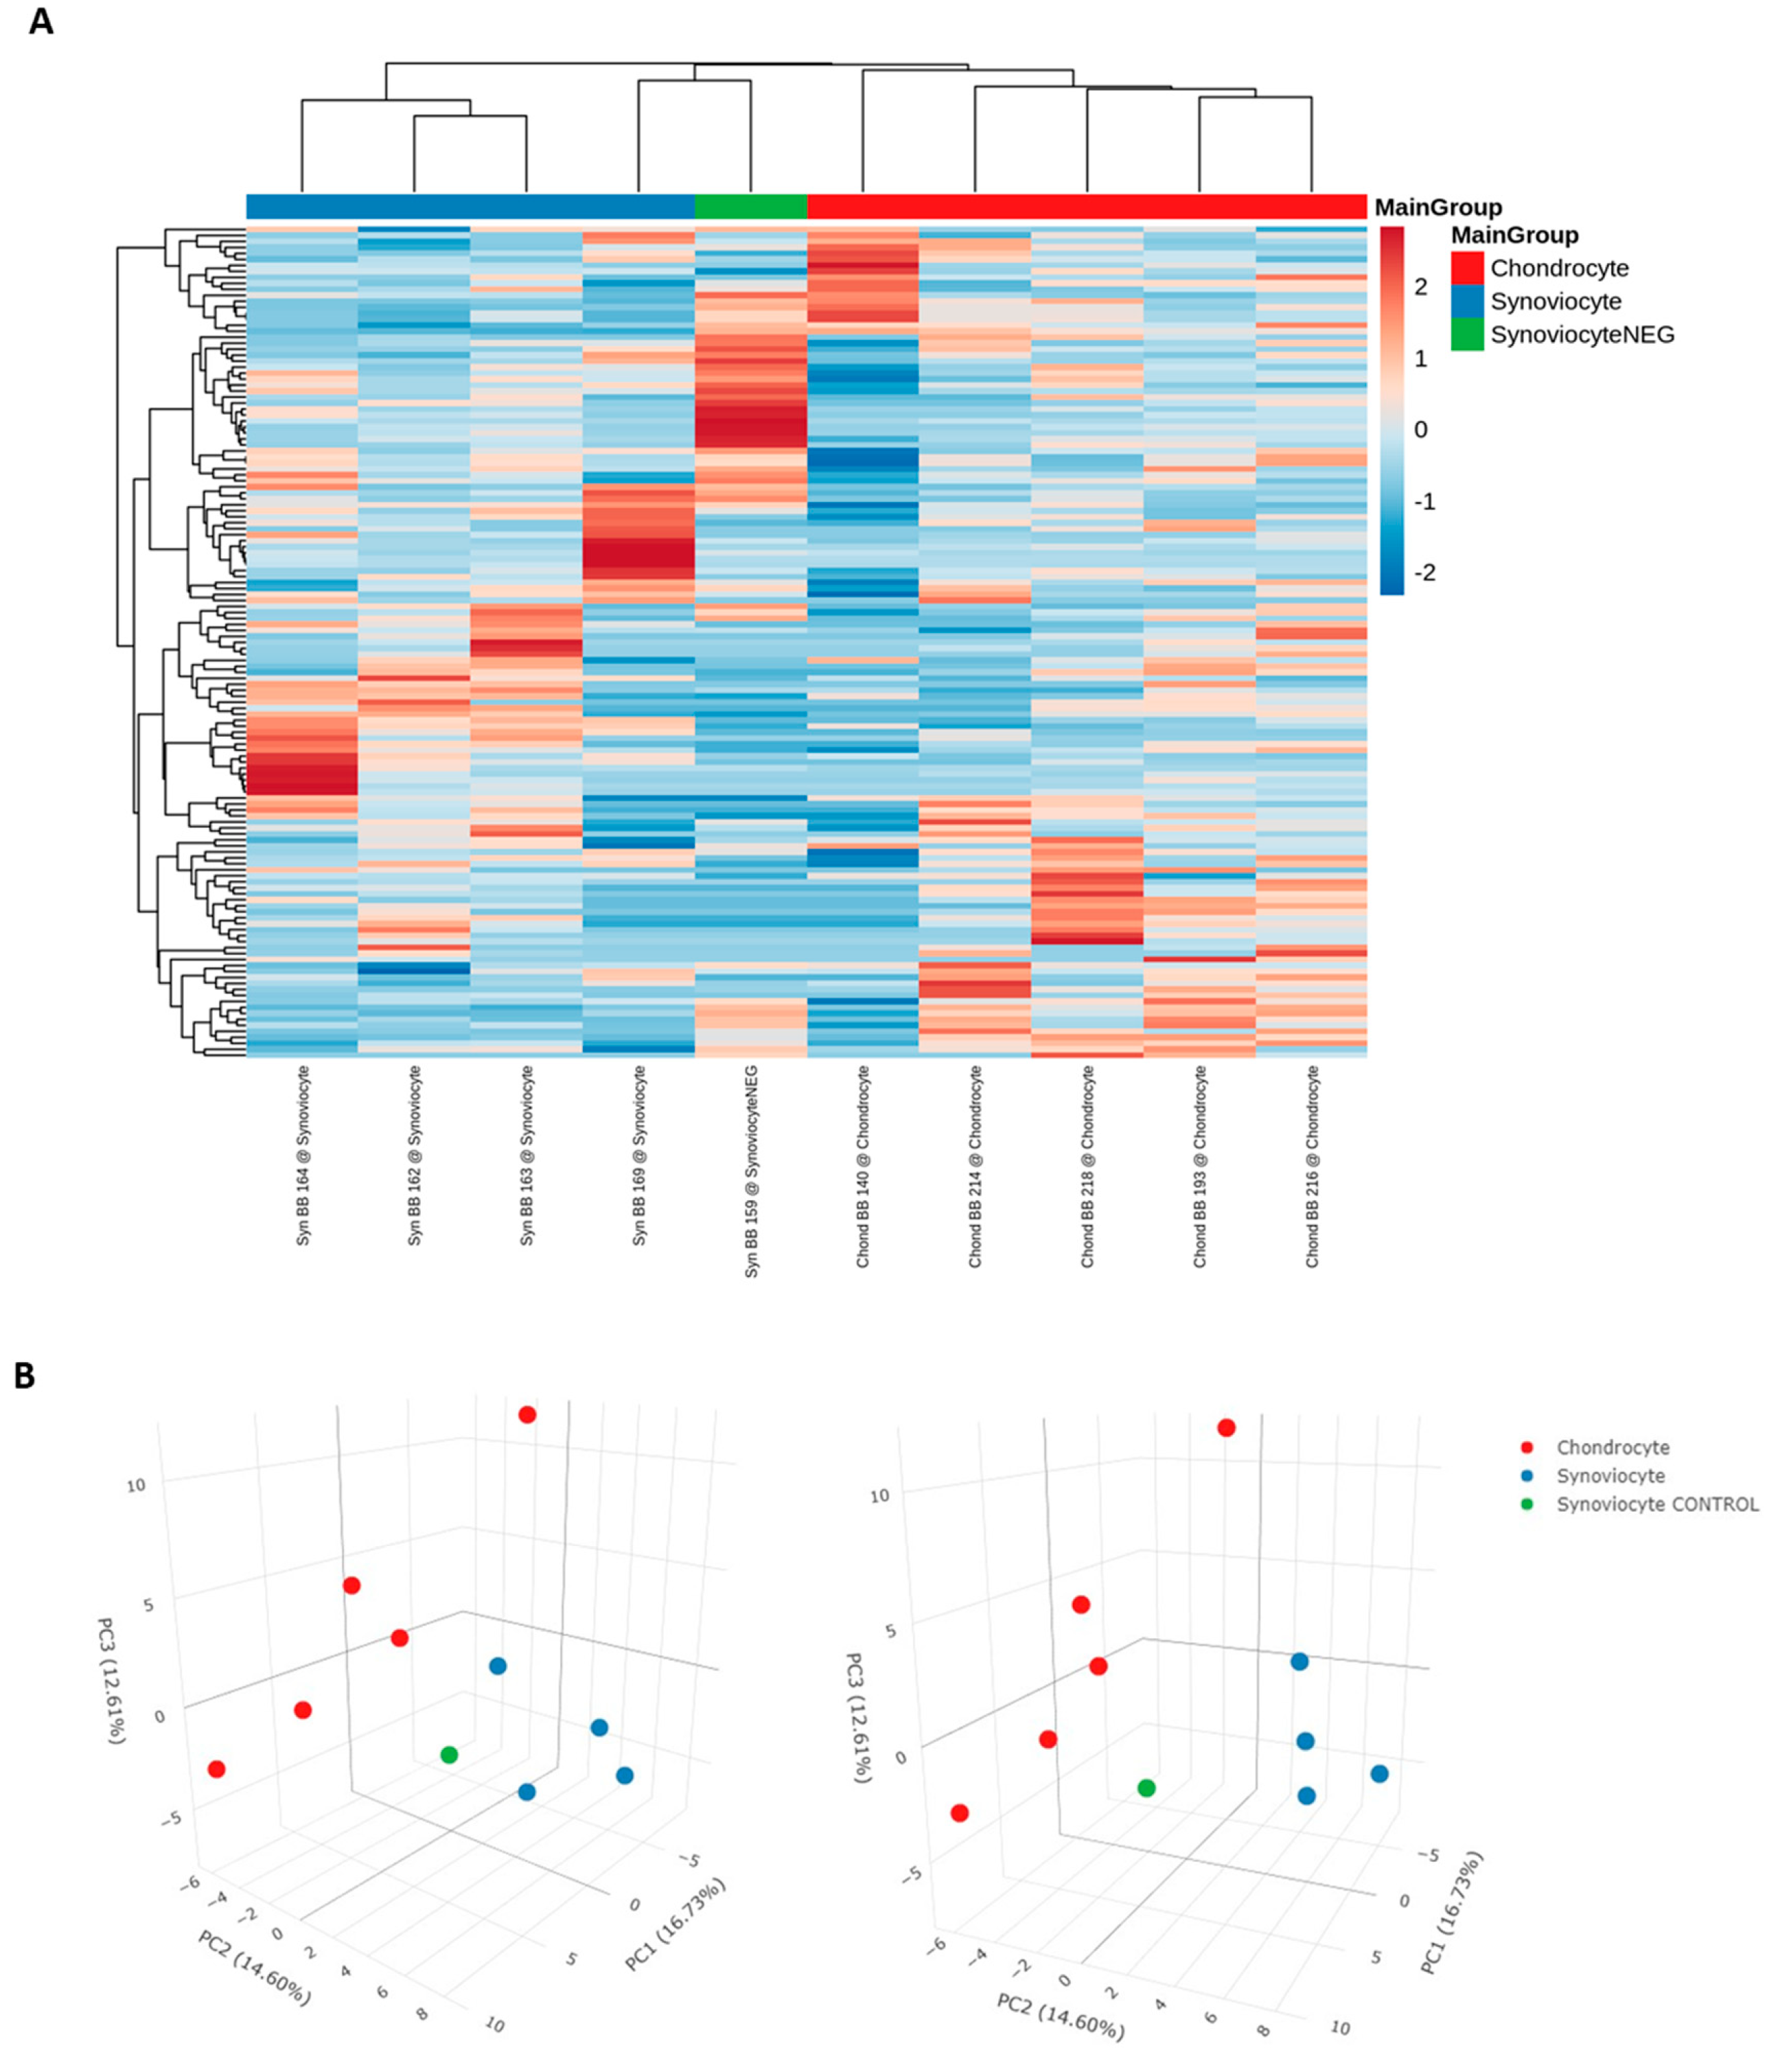
Figure 3.
Interaction network of miRNA targets, diseases and functions predicted to be associated to the differentially expressed miRNAs between EV-recipient chondrocytes and synoviocytes. miRNAs are represented in gray, experimentally predicted targets are represented in white and predicted cellular functions and diseases are represented in different colors. Solid arrows represent direct relationships, and dashed arrows represent predicted diseases and functions associated with the different molecules. BCL2, B-cell lymphoma 2 apoptosis regulator; CASR, calcium sensing receptor; CXCL12, C-X-C motif chemokine ligand 12; FASN, fatty acid synthase; GRIA2, glutamate ionotropic receptor AMPA type subunit 2; HES1, hes family bHLH transcription factor 1; IGF1, insulin-like growth factor 1; IGFBP5, insulin like growth factor binding protein 5; IL6R, interleukin 6 receptor; MMP, matrix metalloproteinase;NOTCH, Notch receptor; PPARG, peroxisome proliferator activated receptor gamma; RECK, Reversion-inducing cysteine-rich protein with Kazal motifs; RXRA, retinoid X receptor alpha; SIRT1, sirtuin 1; SMAD4, mothers against decapentaplegic homolog 4; THRB, thyroid hormone receptor beta; TNF, tumor necrosis factor.
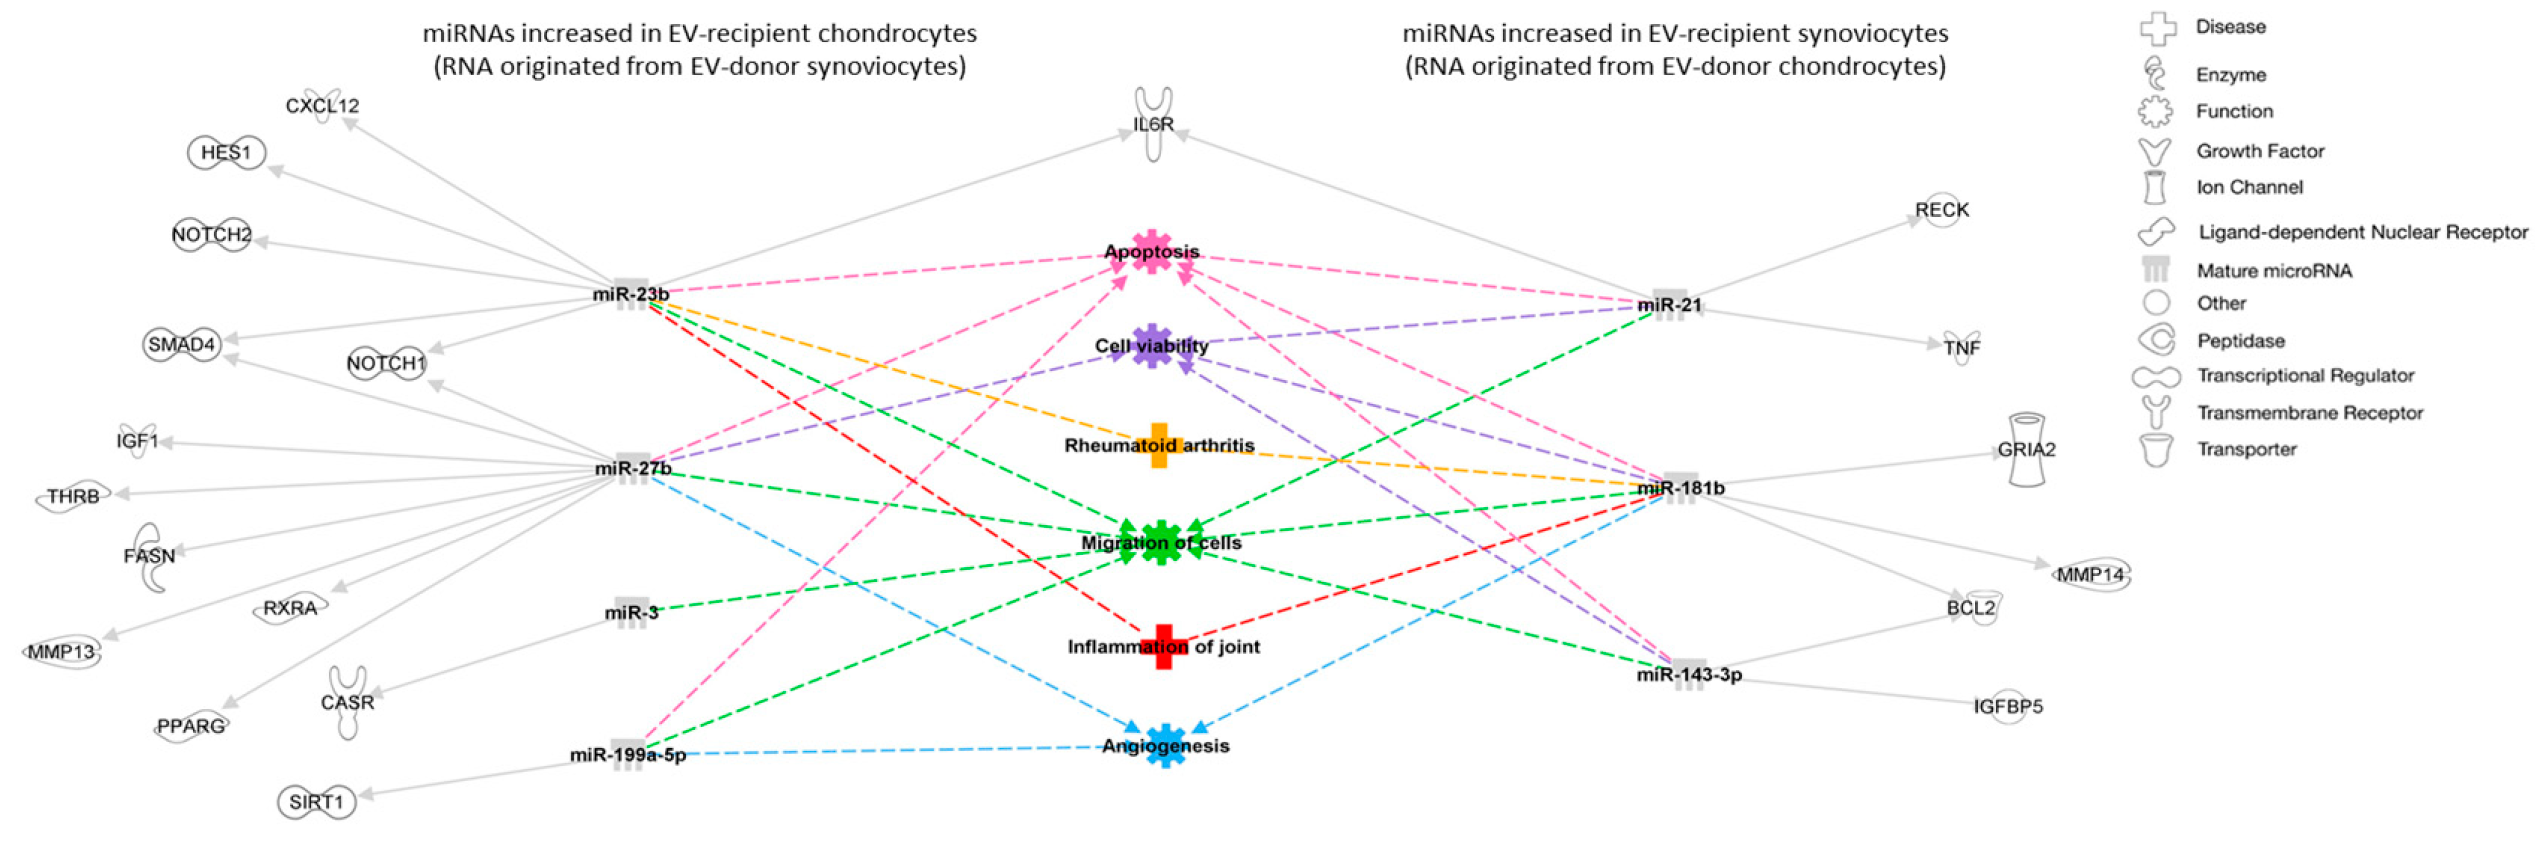
Figure 4.
Overview of the experimental protocol. Figure created with BioRender.com. SEC, size exclusion chromatography.
Figure 4.
Overview of the experimental protocol. Figure created with BioRender.com. SEC, size exclusion chromatography.
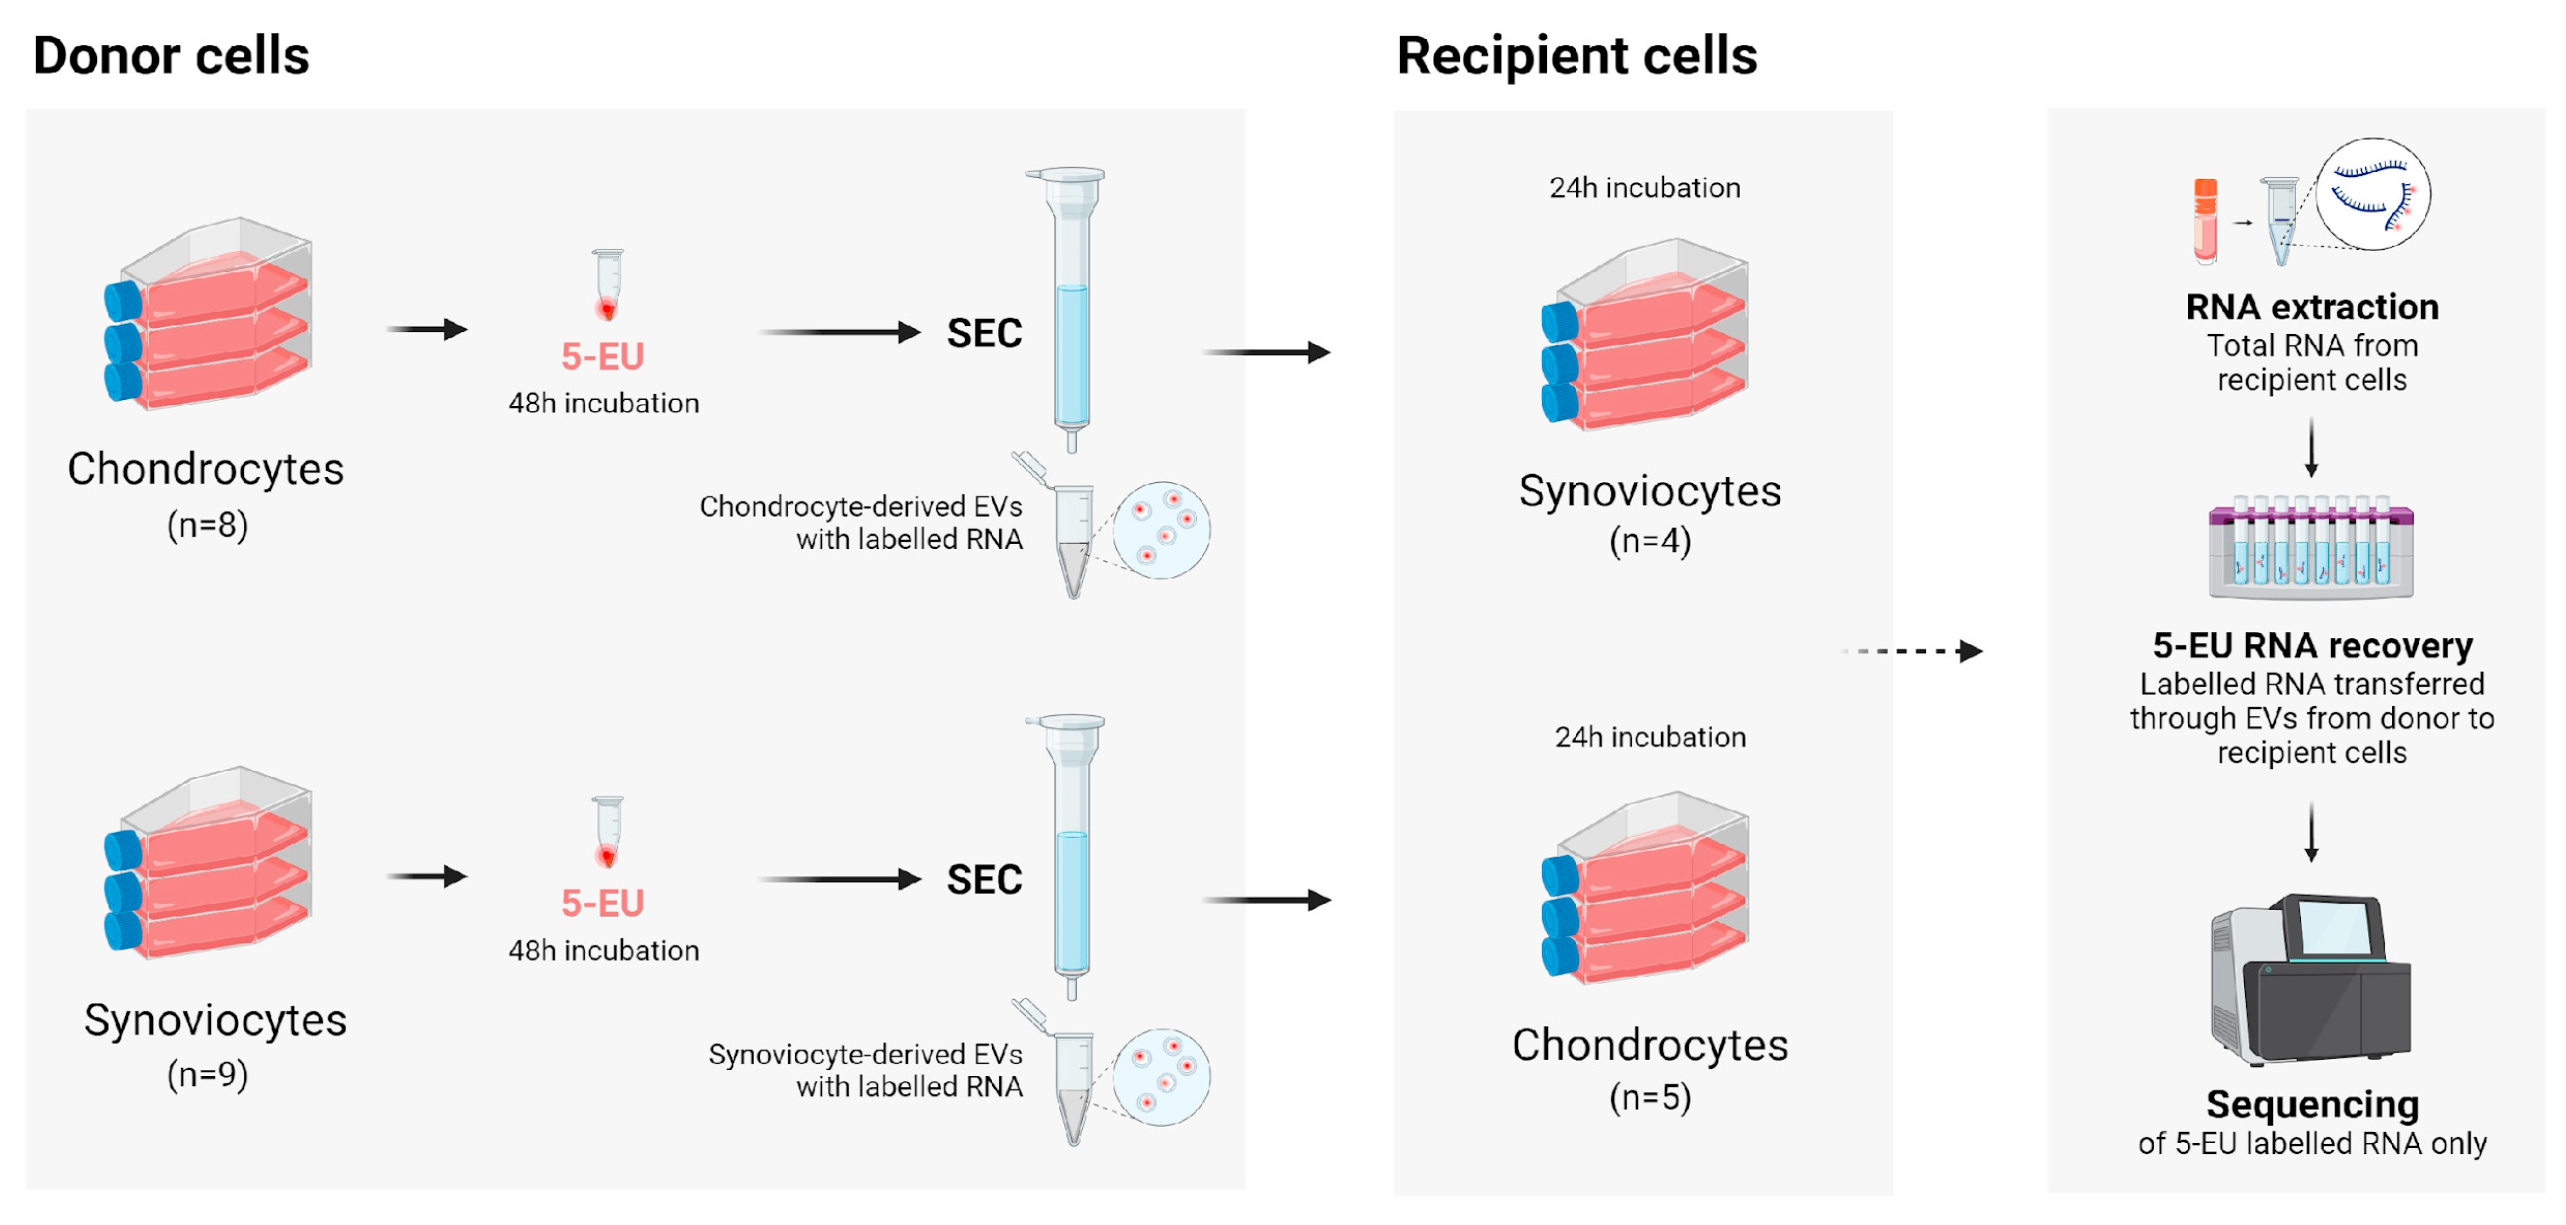

Table 1.
Demographics of EV-donor and recipient cells, stratified by cell type.
| Characteristics | EV-donor cells | EV-recipient cells | ||
|
Chondrocytes (N=8) |
Synoviocytes (N=9) |
Chondrocytes (N=5) |
Synoviocytes (N=4) |
|
| Age,years | ||||
| Mean (SD) | 6.1 (2.6) | 5.8 (2.3) | 6.2 (4.4) | 5.5 (2.1) |
| 95% CI | 4.0–8.3 | 4.0–7.5 | 0.7–11.7 | 2.2–8.8 |
| Min; Max | 3; 10 | 3; 10 | 3; 14 | 3; 8 |
| p value | 0.8991 | 0.8101 | ||
| Sex, n (%) | ||||
| Female | 3 (60.0)2 | 5 (62.5)3 | 0 (0.0)4 | 3 (75.0) |
| Male | 2 (40.0)2 | 3 (37.5)3 | 1 (100.0)4 | 1 (25.0) |
| p value | 0.9285 | – | ||
| Joint macroscopic score (0–9)6, n (%) | ||||
| Scores | ||||
| 0 | 3 (37.5) | 2 (22.2) | 1 (20.0) | 0 (0.0) |
| 1 | 4 (50.0) | 1 (11.1) | 0 (0.0) | 1 (25.0) |
| 2 | 1 (12.5) | 5 (55.6) | 1 (20.0) | 2 (50.0) |
| 3 | 0 (0.0) | 1 (11.1) | 3 (60.0) | 1 (25.0) |
| ≥4 | 0 (0.0) | 0 (0.0) | 0 (0.0) | 0 (0.0) |
| Mean (SD) | 0.8 (0.7) | 1.6 (1.0) | 2.2 (1.3) | 2.0 (0.8) |
| 95% CI | 0.2–1.3 | 0.8–2.3 | 0.6–3.8 | 0.7–3.3 |
| Min; Max | 0; 2 | 0; 3 | 0; 3 | 1; 3 |
| p value | 0.0927 | 0.6351 | ||
1 Calculated using a Mann-Whitney U test. 2 N1=5. 3 N1=8. 4 N1=1. 5 Calculated using a Chi-squared test. 6 Average of the scores obtained by three independent researchers using the Osteoarthritis Research Society International scoring system [16]. 7 Calculated using an unpaired t test. CI, confidence interval; Max, maximum; Min, minimum; n, number of horses included in a given category; N, number of horses included in the analysis set; N1, number of horses with available information in a given category; SD, standard deviation.
Table 2.
Size analysis and quantitation of EVs, stratified by EV-donor cell type.
| EV characteristics |
Chondrocytes (N=8) |
Synoviocytes (N=9) |
| EV concentration, particles/ml | ||
| Mean (SD) | 1.7 × 10⁹ (1.0 × 10⁹) | 8.2 × 10⁸ (9.6 × 10⁸) |
| 95% CI | 8.5 × 10⁸–1.5 × 10⁹ | 5.3 × 10⁸ –1.1 × 10⁹ |
| Min; Max | 7.7 × 10⁷; 3.0 × 10⁹ | 7.9 × 10⁷; 2.6 × 10⁹ |
| p value | 0.1151 | |
| EV size, nm | ||
| Mean (SD) | 186.3 (92.8) | 190.6 (71.7) |
| 95% CI | 157.2–215.4 | 168.9–212.3 |
| Min; Max | 133.0; 274.8 | 136.3; 292.5 |
| p value | 0.8151 | |
1 Calculated using an unpaired t test.
Table 3.
Quantitation of 5-EU labelled RNA recaptured from experimental and control samples, stratified by EV-recipient cell type.
Table 3.
Quantitation of 5-EU labelled RNA recaptured from experimental and control samples, stratified by EV-recipient cell type.
| 5-EU labelled RNA | Experimental samples | Control samples | ||
|
EV-recipient chondrocytes (N=5) |
EV-recipient synoviocytes (N=4) |
EV-recipient chondrocytes (N=1) |
EV-recipient synoviocytes (N=1) |
|
| RNA concentration, ng/ul | ||||
| Mean (SD) | 43.1 (5.6) | 62.8 (14.1) | 0.9 (0.0) | 1.8 (0.0) |
| 95% CI | 36.2–50.0 | 40.5–85.2 | – | – |
| Min; Max | 33.6; 48.4 | 54.9; 83.9 | – | – |
| p value | 0.0161 | – | ||
1 Calculated using a Mann-Whitney U test. 5-EU,5 5-ethynyl uridine.
Table 4.
Differentially expressed miRNAs between EV-recipient chondrocytes and synoviocytes.
| miRNA | logFC | p value | FDR | Significance |
| eca-miR-27b | -2.6 | <0.001 | <0.001 | Increased in EV-recipient chondrocytes (RNA originated from EV-donor synoviocytes) |
| eca-miR-23b | -1.7 | 0.002 | 0.033 | Increased in EV-recipient chondrocytes (RNA originated from EV-donor synoviocytes) |
| eca-miR-143 | 2.6 | 0.002 | 0.033 | Increased in EV-recipient synoviocytes RNA originated from EV-donor chondrocytes) |
| eca-miR-31 | -4.9 | 0.003 | 0.033 | Increased in EV-recipient chondrocytes (RNA originated from EV-donor synoviocytes) |
| eca-miR-21 | 0.8 | 0.013 | 0.110 | Increased in EV-recipient synoviocytes (RNA originated from EV-donor chondrocytes) |
| eca-miR-181a | 2.2 | 0.015 | 0.110 | Increased in EV-recipient synoviocytes (RNA originated from EV-donor chondrocytes) |
| eca-miR-191a | -0.6 | 0.016 | 0.110 | Increased in EV-recipient chondrocytes (RNA originated from EV-donor synoviocytes) |
| eca-miR-181b | 1.8 | 0.018 | 0.110 | Increased in EV-recipient synoviocyte (RNA originated from EV-donor chondrocytes) |
| eca-miR-199a-5p | -0.6 | 0.027 | 0.145 | Increased in EV-recipient chondrocytes (RNA originated from EV-donor synoviocytes) |
FDR, false discovery rate; logFC, log fold change.
Disclaimer/Publisher’s Note: The statements, opinions and data contained in all publications are solely those of the individual author(s) and contributor(s) and not of MDPI and/or the editor(s). MDPI and/or the editor(s) disclaim responsibility for any injury to people or property resulting from any ideas, methods, instructions or products referred to in the content. |
© 2025 by the authors. Licensee MDPI, Basel, Switzerland. This article is an open access article distributed under the terms and conditions of the Creative Commons Attribution (CC BY) license (http://creativecommons.org/licenses/by/4.0/).
Copyright: This open access article is published under a Creative Commons CC BY 4.0 license, which permit the free download, distribution, and reuse, provided that the author and preprint are cited in any reuse.


