
Submitted:
24 March 2025
Posted:
25 March 2025
You are already at the latest version
Abstract
Synovial inflammation is recognised as a pathological driver of osteoarthritis (OA), a degenerative joint disease involving cartilage degradation and joint pain. Since extracellular vesicles (EVs) have emerged as key mediators of cellular cross-talk, this study characterised synovial fluid EVs (SFEVs) in OA patients with varying disease severity, and determined their functional effects on OA articular chondrocytes. Synovial fluid and articular cartilage were collected from patients undergoing knee surgery. SFEVs were isolated via ultracentrifugation and characterised by nanoparticle tracking analysis, ExoView and Luminex analysis of protein cargo. Patients were stratified into mild/moderate and severe OA groups based on Oxford Knee Score and EQ5D. Chondrocytes were treated with SFEVs, and transcriptomic and secretome responses were analysed using RNA sequencing, Luminex, and ELISA. SFEVs from severe OA patients were more abundant, smaller and exhibited increased tetraspanin expression. Synovial fluid and SFEVs induced distinct transcriptomic changes in chondrocytes. SFEVs from severe OA patients promoted a pro-inflammatory and catabolic chondrocyte phenotype, with upregulation of CRTAC1, COL6A3, TNC, and CXCL5, and greater secretion of IL-6, MMP1, MMP3 and MMP13, and pro-nociceptive mediators (NGF and Substance P). These findings suggest that SFEVs may contribute to OA progression by exacerbating cartilage damage and promoting pain sensitisation.
Keywords:
osteoarthritis
; extracellular vesicles
; synovial fluid
; articular chondrocytes
; synovitis
1. Introduction
Osteoarthritis (OA) is a degenerative joint disorder and a leading cause of disability world-wide [1], which poses a growing health burden due to aging populations and rising obesity rates [2]. Unfortunately, current treatment options are inadequate with no approved disease-modifying pharmacological drugs, and generic analgesics that exhibit limited efficacy and significant adverse side effects when taken chronically. Improved understanding of the molecular and cellular mechanisms that mediate OA is therefore a necessity so that more efficacious and targeted interventions can be developed to improve patients’ quality of life.
In attempting to develop new therapeutics it is now recognised that OA is a complex heterogeneous condition involving multiple tissues of the joint, including articular cartilage degradation, remodelling of the subchondral bone, and synovial inflammation [3,4]. Emerging perspectives suggest that this heterogeneity is underpinned by distinct molecular endotypes [5,6], including “low repair”, “bone-cartilage”, “metabolic” and “inflammatory” sub-types. Amongst these, the inflammatory sub-type, which is characterised by significant synovial fluid inflammation, is of particular interest due to the potential for synovial inflammation to exacerbate cartilage degeneration and to promote joint pain via the sensitisation of peripheral nociceptors [7]. Therefore, better understanding of the cross-cellular molecular signalling pathways that mediate and propagate the effects of synovial inflammation within the joint may provide the rationale for the development of novel targeted anti-inflammatory drugs in specific OA populations exhibiting an inflammatory endotype.
To this end, extracellular vesicles (EVs), which are small, lipid membrane-bound particles released by nearly all cell types into the extracellular environment, have emerged as novel candidate mediators of cellular cross-talk in OA. Classified by their size, EVs include exosomes, microvesicles, and apoptotic bodies, and are capable of transporting bioactive molecules including proteins, lipids, and nucleic acids to recipient cells, influencing various biological processes [8]. In the context of OA, EVs have been implicated in disease pathogenesis, mediating cartilage degradation, inflammation and nociception [9,10,11,12].
Asghar et al. (2024) [13] demonstrated that synovial fibroblast EVs contain distinct miRNA profiles, which contribute to chondrocyte damage. Furthermore, Cao et al. (2024) [10] revealed that EVs from the infrapatellar fat pad in OA patients impair cartilage metabolism and induce senescence. Distler et al. (2005) [14] showed that EVs contain OA-relevant proteases, including matrixmetalloproteases (MMPs) that promote cartilage degradation, and pro-inflammatory cytokines including IL-1β, and TNFα, which induce cartilage degeneration and are associated with peripheral pain sensitisation.
However, despite these insights the characterisation of EVs that are present in OA synovial fluid and their role in mediating OA joint pathology remains poorly understood. This study had two main objectives. First, to comprehensively characterise synovial fluid extracellular vesicles (SFEVs) from patients with knee OA across different severity levels. Second, to investigate the functional effects of SFEVs derived from patients with severe or mild/moderate OA on the phenotype of articular chondrocytes, aiming to uncover novel mechanisms of SFEV-mediated communication within the OA joint.
2. Materials and Methods
2.1. Patient Recruitment and Sample Collection
Articular cartilage and synovial joint fluid were collected from OA patients undergoing joint surgery (NRES 17/SS/0456) at the Royal Orthopaedic Hospital, Birmingham (United Kingdom) and Russell’s Hall Hospital, Dudley (United Kingdom). Patients completed Oxford Knee Score (OKS), a visual analogue scale (VAS) of pain severity and EQ5D questionnaires to capture OA joint severity and quality of life.
2.2. Isolation and Culture of Primary Human OA Chondrocytes
Fresh cartilage was dissected into 1-3mm3 pieces, and digested using 2mg/ml collagenase (Merck, C9891) in DMEM (Merck, D6429) for 5-15 hours at 37˚C. Digested cartilage was filtered through a 70µm cell strainer, the resultant filtrate centrifuged at 400 g for 5 min, and then resuspended and cultured in chondrocyte growth media (DMEM, 10% FCS, 1% NEAA, 2 mM L-glutamine (ThermoFisher Scientific, Gloucester, UK, 25030024), 1% penicillin and streptomycin (100 U/mL penicillin and 100µg/mL streptomycin) (Merck, P4333), 2.5ug/ml amphotericin B (Merck, A2942)). Growth media was replaced every 3–4 days and cells were passaged upon reaching 70% confluency.
2.3. Synovial Fluid EV Isolation and Characterisation
Synovial fluid was mixed with 1mg/ml hyaluronidase (Merck, H3506) in PBS at 1:11, vortexed gently for 3 min and incubated at 37˚C for 30 min. The hyaluronidase treated synovial fluid was then centrifuged at 10,000 g for 10 min, and the supernatant ultracentrifuged at 100,000 g for 16 h to pellet EVs [15], which were resuspended in PBS.
EVs from synovial fluid (n = 13 patients) were analysed by Nanoparticle Tracking Analysis using the NSPro (Malvern Panalytical, Malvern, United Kingdom) to determine size and concentration. Samples were diluted PBS (Merck, D8537). Optimal dilutions were determined via NanoSight NS Xplorer software utilising the software’s automated detection threshold and focus. Five videos capturing 400 tracks were taken of each sample at 25˚C with a syringe pump speed of 3μl/min.
EVs were further characterised using the ExoView R100 reader (Unchained Labs, Malvern, United Kingdom) to analyse size, concentration, and CD9, CD63 and CD81 tetraspanin markers using the Leprechaun Exosome Human Plasma Kits (251-1045, Unchained Labs, Malvern, United Kingdom), as previously described [16]. Chips were imaged using the ExoView R100 reader using ExoViewer 3.14 software and analysed using ExoView Analyser 3.0. Fluorescence gating was based on mouse IgG capture control and sizing thresholds were set from a diameter of 50 to 200 nm.
2.4. RNA Isolation and Bulk RNA Sequencing
Total RNA was extracted using a RNeasy Mini kit according to manufacturer’s instructions (Qiagen). RNA quantity and purity was determined by Nanodrop One (ThermoFisher); all isolated RNA samples had A260/A280 ratios of 1.8-2.0. Library preparation and RNA-sequencing were performed by Beijing Genomics Institute (Hong Kong) using the DNBSEQ platform. Reads were mapped to the hg38 reference human genome using Bowtie. Differentially expressed genes (DEGs) were identified through DESEQ analysis and results analysed further by Ingenuity Pathway Analysis (IPA).
2.5. Luminex and ELISA
The concentrations of MMP1, MMP3, MMP13, BDNF, IL-6 and NGF proteins in conditioned media, synovial fluid or SFEV lysates were quantified using a customised Luminex assay (Bio-Techne, United States), whilst TIMP3 and ICAM1 were quantified by ELISA (TIMP3: A717-96, antibodies.com; ICAM1: A1716-96, antibodies.com). Prior to protein quantification, hyaluronidase-treated synovial fluid samples and isolated SFEVs were lysed with 0.5% TritonX, and diluted 1:2 with dilution buffer.
2.6. Statistical Analysis
Statistical analysis was performed using GraphPad Prism v10, with p-values of <0.05 considered to be statistically significant, and FDR <0.05 considered significant when analysing RNA sequencing data. Where appropriate, linear regressions were performed to test associations between variables. Two-way ANOVA was performed on ExoView data with Bonferroni post-hoc tests to determine statistical significance between severe OA and mild/moderate OA tetraspanin expression. One-way ANOVA with Tukey’s multiple comparison post-hoc tests were performed on RNA sequencing count data and Luminex/ELISA data.
3. Results
3.1. Patient Characteristics
Patients were stratified into two groups based on the Oxford Knee Score (OKS) and EQ5D questionnaire results (Figure 1A): Group 1 (severe OA), included n = 14 patients with low OKS (≤21) and high EQ5D (≥9), indicative of greater functional impairment and worse quality of life. Group 2 (mild/moderate OA), included n = 17 patients with high OKS (≥22) and low EQ5D scores (≤8). Patients who did not fit into these defined groups were excluded from the analysis. An inverse relationship between OKS and EQ5D was observed (p < 0.0001, r² = 0.3287), supporting the distinction between these two groups based on OA severity (Figure 1A).
3.2. Characterization of Synovial Fluid Extracellular Vesicles
Patient characteristics of samples used for NTA and Exoview characterisation are summarised in Table 1. EVs were isolated by ultracentrifugation from the synovial fluid of n = 13 patients with mild/moderate OA and characterised by NTA (Figure 1B). NTA confirmed the successful isolation of SFEVs, with concentrations between 2.6x10¹⁰ to 1.7x10¹¹ particles/ml, a mean size of 172 nm and a mean D50 of 136 nm (Figure 1C). Notably, NTA revealed distinct differences in the gross characteristics of SFEVs between severe and mild/moderate OA groups. A significant negative correlation was observed between EQ5D score and SFEV concentration (p = 0.0067, r² = 0.5025, Figure 1D), indicating that lower quality of life was associated with higher SFEV concentrations. Conversely, a positive correlation was found between EQ5D score and SFEV size (p = 0.0137, r² = 0.4383, Figure 1E) suggesting that patients with better quality of life tended to have larger SFEVs. No significant correlations were detected between OKS scores or VAS scores and the SFEV parameters (Figure 1D and Figure 2E). Next, we used ExoView to characterise the surface expression of a panel of tetraspanin markers (n = 11) (Figure 1B). ExoView analysis of CD9, CD63 and CD81 tetraspanins revealed a significant effect of OA severity on the number of particles positively staining for tetraspanin expression, with elevated tetraspanin expression in SFEVs from the severe OA group (Figure 1F,G , 2-way ANOVA p<0.01), compared to EVs from the mild/moderate OA patient group.
3.3. Synovial Fluid and Synovial Fluid EVs Induce Distinct Transcriptomic Profiles in Human Articular Chondrocytes
To determine the functional effect of SFEVs, articular chondrocytes were cultured in the presence of either SFEVs (5x10⁹), or synovial fluid (4-8μl/ml culture media) containing the equivalent amount of EVs from patients with mild/moderate OA or patients with severe OA, or left untreated for a period of 24h, before being subjected to bulk RNA sequencing analysis (Figure 2A).
RNA sequencing analysis revealed that both synovial fluid and SFEVs profoundly affected the transcriptome of human OA articular chondrocytes but induced distinct profiles (Figure 2B–E; Supplementary Tables 1 and 2). Comparing synovial fluid-treated and untreated chondrocytes, differential expression analysis identified 708 differentially expressed genes (DEGs) of log2FC>0.58, of which 376 were upregulated and 332 were downregulated (FDR <0.05). The majority (91.6%) of these DEGs were protein-coding genes, with long non-coding RNAs representing 7.5%, and the remaining ~1% of genes representing microRNA, pseudogenes and snoRNAs (Figure 2F). The DEGs included genes that regulate remodelling of cartilage extracellular matrix (ECM), e.g., MMP13 (FC = +2.8), MMP1 (FC = -2.5), MMP3 (FC = -2.6), ADAMTS1 (FC = -1.7), Collagen Triple Helix Repeat Containing 1 (CTHRC1; FC = +2.6), Periostin (POSTN; FC = +1.8), Tissue Inhibitor of Metalloproteinases 3 (TIMP3; FC = -1.7) and Tissue Factor Pathway Inhibitor 2 (TFPI2; FC = -3.0), and genes that mediate inflammation, including IL-1 receptor antagonist (ILRN; FC = -9.6), TAC1 (Substance P; FC = -5.4) and CXCL8 (FC = 6.1) (Figure 2C,E).
Comparing SFEV-treated and untreated chondrocytes, differential expression analysis identified 328 DEGs with log2FC>0.58 (FDR<0.05), of which 121 were upregulated and 207 were downregulated. The majority (95.4%) of these DEGs were protein-coding genes, with the remaining 4.6% of DEGs representing long non-coding RNAs (Figure 2F). Amongst the differentially expressed genes were several known mediators of cartilage matrix remodelling and inflammatory responses including the upregulation of ANGPTL7 (FC = +3.0), CTRHC1 (FC = + 1.7), CXCL6 (FC = +3.9), CXCL1 (FC = +1.6), CXCL3 (FC = + 1.5), MMP7 (FC = +2.6), DUSP4 (FC = +2.5), ITGA5 (FC = +2.0) and OMD (osteomodulin; FC = +2.7), and downregulation of HAS3 (Hyaluronan Synthase 3; FC = -2.9), ADAMTS12 (FC = -1.5), ADAMTS14 (FC = -2.1), FGF9 (FC = -2.4), which regulates chondrogenesis, and HS3ST1 (FC = -2.7), a glycosaminoglycan which modulates matrix integrity (Figure 2E). Furthermore, several neuronal signalling mediators were differentially dysregulated, including SEMA3A (Semaphorin A, FC = -1.7), PTGS2 (FC = -1.8) and NGF (FC = -1.5). Of note, comparing the DEGs in synovial fluid-treated chondrocytes and SFEV-treated chondrocytes, 48 upregulated DEGs and 59 downregulated DEGs were common to both (Figure 2E).
Next, we used Ingenuity Pathways Analysis (IPA) to understand the effects of both synovial fluid and SFEVs on chondrocyte cellular function. Firstly, to identify candidate upstream regulators (USRs) of the DEGs, we performed an upstream regulator analysis of the DEGs from synovial fluid-treated chondrocytes. In total, we identified >290 USRs that were predicted to be either activated (z-score≥2) or inhibited (z-score≤-2) with significance of p<0.01 (Figure 2G; Supplementary Table 3). Focussing on the most significant USRs, these could be classified into those that regulating (i) Immune and inflammatory responses (e.g., TNFA), (ii) Cartilage and ECM remodelling (e.g., HOXA5), or (iii) Neuronal signalling and cellular communication (e.g., NTRK1). Notably, the majority of pro-inflammatory USRs, including TNFA, IL-1A, IL-1B as well as multiple components of NFκB were predicted to be inhibited, whilst the majority of anti-inflammatory USRs, including IL-10 and corticosterone, were predicted to be activated (Figure 2G,H). Aligned to these USRs, pathway analysis identified significant dysregulation in canonical signalling pathways related to immune and inflammatory responses (e.g., “IL-10 signalling” and “Granulocyte adhesion and diapedesis”), cartilage and ECM remodelling (e.g., “collagen degradation” and “Inhibition of MMPs”), and Neuronal signalling and cellular communication (e.g., Axonal guidance signalling). (Figure 2I; Supplementary Table 4).
Upstream regulator analysis of the DEGs from SVEV-treated chondrocytes identified only 18 USRs with z-scores ≥2 or ≤-2, of significance p<0.01, which could also be classified into those regulating (i) Immune and inflammatory responses (ii) Cartilage and ECM remodelling or (iii) Neuronal signalling and cellular communication (Figure 2J; Supplementary Table 5). However, in comparison to the USRs of synovial fluid-treated chondrocytes, SFEV USRs of SFEV-treated chondrocytes indicated a greater balance between pro-inflammatory/pro-catabolic mediators and anti-inflammatory/pro-anabolic mediators. For example, the predicted activation of pro-inflammatory IL-6 (Figure 2K), and activation of the pro-catabolic mediators OSCAR (osteoclast-associated receptor) and RARA (retinoic acid receptor alpha), alongside the predicted activation of the anti-inflammatory NR3C1 and the pro-anabolic Collagen Type II (complex). Pathway analysis of the DEGs from SFEV-treatment of chondrocytes identified significant dysregulation in pathways, which were similarly related to (i) Immune and inflammatory responses (e.g., “IL-17 signalling” and “Eicosanoid signalling”), (ii) Cartilage and ECM remodelling (e.g., “Chondroitin sulphate biosynthesis” and “Glycosaminoglycan metabolism”), and (iii) Neuronal signalling and cellular communication (e.g., “Axonal guidance signalling” and “Synaptogenesis signalling pathway”) (Figure 2L; Supplementary Table 6).
3.4. Synovial Fluid EVs from Severe OA Patients Elicit Differential Catabolic and Inflammatory Transcriptomic Responses in Human Articular Chondrocytes
Next, we examined whether SFEVs derived from severe OA patients induced distinct transcriptomic changes in chondrocytes compared to SFEVs from patients with mild/moderate OA (Figure 3A,B; Supplementary Tables 7 and 8). Treatment with SFEVs from mild/moderate OA resulted in 273 DEGs (Log2FC>0.58; FDR<0.05), of which 172 were downregulated and 101 were upregulated relative to untreated chondrocytes. In contrast, treatment with SFEVs from severe OA patients yielded 297 DEGs, comprising 189 downregulated and 108 upregulated genes (Figure 3C). Among these, 202 DEGs were common to both treatment conditions, of which 128 were downregulated and 74 were upregulated. As expected, these common genes included many of the genes previously identified as differentially expressed upon SFEV treatment of chondrocytes e.g., the upregulation of OMD, ANGPTL7, CTHRC1, CXCL1, CXCL3, DUSP4 and ITGA5, and the downregulation of HAS3, ADAMTS12, ADAMTS14, FGF9, HS3ST1, SEMA3A NGF, and PTGS2.
With our defined cutoffs (Log2FC>0.58, FDR<0.05) a total of 71 DEGs (26%) were specific to treatment using SFEVs from mild/moderate OA, while 104 DEGs (35%) were specific to treatment with SFEVs from severe OA (Figure 3C). Focusing on the 104 genes (70 downregulated, 34 upregulated) that were preferentially dysregulated by severe OA SFEVs, several were key regulators of cartilage and ECM remodelling, including CRTAC1 (Cartilage Acidic Protein 1, FC = +1.7), RUNX2 (FC= +1.7), COL6A3 (FC = +1.5), TNC (Tenascin-C, FC = +1.6), a matricellular protein increased in cartilage injury and in OA, SOX9 (FC = -1.5), GDF5 (FC = -1.5), and MATN2 (Matrilin2, FC = -1.5). In addition, genes specifically altered by severe SFEVs also included several central regulators of immune and inflammatory responses e.g., CXCL5 (FC = +1.6), NFKBIZ (FC = +1.7), and the neuronal, signalling inflammatory mediators NRG1 (Neuregulin 1, FC = -1.5), CHN1 (Chimerin 1, FC = +1.6) and SYT7 (Synaptotagmin 7, FC = -1.6) (Figure 3D).
Assigning the DEGs to canonical signalling pathways identified multiple significant dysregulated pathways with both mild/moderate SFEVs and severe SFEV treatments, which regulate (i) Immune and Inflammatory responses, (ii) Cartilage and ECM remodelling, and (iii) Neuronal signalling and cellular communication (Figure 3E; Supplementary Tables 9 and 10). Notably, chondrocytes treated with SFEVs from severe OA displayed more significant dysregulation, with greater numbers of DEGs aligned to pathways and lower LogP values. For example, the pro-inflammatory pathways “Eicosanoid signalling” “Agranulocyte adhesion and diapedesis” and “Osteoarthritis pathway”, and in neuroinflammatory pathways “neuroinflammation signalling pathway”, “RAR activation” and “DHA signalling” (Figure 3E).
In line with the canonical pathway analysis, performing upstream regulator analysis revealed distinct differences in the predicted activation status of USRs of the mild/moderate OA SFEV-induced DEGs and the severe OA SFEV-induced DEGs. The predicted USRs and their assigned activation status of the mild/moderate OA SFEVs were strongly anti-inflammatory, with inhibition of the pro-inflammatory cytokines IL-2 and IL-13, and activation of NR3C1 and corticosterone (Figure 3F; Supplementary Table 11). In contrast, the predicted USRs and their activation status of the severe SFEVs was more strongly pro-inflammatory and pro-catabolic, with activation of IL-6, OSCAR and Col Type II (complex) (Figure 3G; Supplementary Table 12).
3.5. Synovial Fluid EVs from Severe OA Patients Induce the Differential Release of Catabolic and Inflammatory Mediators in Human Articular Chondrocytes
Having observed that SFEVs elicited differential effects on the chondrocyte transcriptome relating to pathways that mediate inflammation and cartilage catabolism, we next examined if these effects extended to the protein release of known catabolic and inflammatory mediators. To this end, we used Luminex and ELISA assays to profile the protein secretion of a panel of mediators (including MMPs, pro-inflammatory cytokines and neurotrophins) in cells exposed to either SFEVs from severe OA or from mild/moderate OA, compared to untreated chondrocytes (Figure 4A).
Analysis of protein release of matrix metalloproteases (MMPs) revealed that chondrocytes treated with SFEVs from severe OA patients exhibited a significant increase in the secretion of MMP3 (p < 0.001), whereas no such increase was observed in cells treated with SFEVs from mild/moderate OA. Both SFEVs from severe and mild/moderate OA induced a significant increase in MMP13 secretion; however, SFEVs from severe OA induced a significantly greater effect (p < 0.05) compared to those from mild/moderate OA. Finally, compared to untreated cells, neither SFEVs from mild/moderate OA or severe OA induced any significant change in the secretion of MMP1, albeit levels of MMP1 were significantly greater (p < 0.05) in chondrocytes subjected to severe SFEVs compared to mild/moderate SFEVs (Figure 4B). Furthermore, although not reaching statistical significance, the secretion of the endogenous inhibitor of MMPs, TIMP3, was on average reduced in chondrocytes exposed to SFEVs, particularly those isolated from the synovial fluid of patients with severe OA.
Investigation of the secretion of pro-inflammatory mediators revealed significantly increased secretion of the pro-angiogenic ICAM1 (p<0.001) in chondrocytes exposed to SFEVs from severe OA, but no effect of SFEVs from mild/moderate OA, compared to untreated control. Secretion of IL-6 was significantly increased in chondrocytes treated with ether mild/moderate SFEVs (p < 0.001), and further significantly increased (p < 0001) in cells exposed to severe SFEVs (Figure 4B).
Finally, we observed a significant increase in the release of neuronal signalling mediators from chondrocytes subjected to SFEVs. Firstly, secretion of TAC1 (substance P), was markedly increased ~18-fold in chondrocytes treated with SFEVs from mild/moderate OA (p<0.05). Of note, we observed a comparable (~18-fold) increase in TAC1 in cells exposed to severe OS SFEVs, compared untreated control, although this did not reach significance. Secondly, NGF secretion was increased in cells treated with SFEVs severe OA, but not from mild/moderate OA patients, compared to untreated control cells (Figure 4B).
Retrospective analysis of the RNAseq data of these specific mediators revealed mRNA expression data that was broadly in agreement with protein secretion levels observed for MMP1, MMP3, MMP13, TIMP3 and ICAM1. However, there was no change in IL-6 or TAC1 transcript levels in chondrocytes subjected to SFEVs, and a reduction in NGF mRNA in chondrocytes treated with SFEVs from either mild/moderate or severe OA (Figure 4C), suggesting that SFEVs mediate these particular pro-inflammatory neuronal mediators post-transcriptionally.
Finally, we utilised a customised Luminex panel to assess whether specific protein cargo within SFEVs (MMP1, MMP3, MMP13, NGF, BDNF, IL-6, and IL-1β) could be detected following Triton X-100 lysis of the ultracentrifuged EV pellets, and determined the relationship between analyte concentration/EV particle and patient-reported outcome measures (VAS, EQ5D, and OKS). Importantly, all targeted analytes were detectable within the SFEV lysates (Figure 4D), although absolute concentrations detected were between 4-fold to 35-fold lower than that found in the synovial fluids (Supplementary Figure 1). Of note, MMP3 was only qualitatively detected, as its concentration exceeded the upper limit of the standard curve. This finding suggests that SFEVs transport key pro-catabolic and neuro-inflammatory factors within the OA synovial joint. Among the detected analytes, NGF and MMP1 were the most highly enriched in SFEVs compared to equivalent synovial fluid concentration, suggesting these proteins may be preferentially packaged into SFEVs (Supplementary Figure 1). Moreover, we observed a significant positive correlation between SFEV NGF concentration/EV particles and VAS pain severity scores (p < 0.05, Figure 4E), suggesting a potential mechanistic link between SFEVs and patient-reported pain perception in OA.
4. Discussion
This study provides evidence for a functional relationship between the characteristics of synovial fluid EVs (SFEVs), chondrocyte phenotype and OA severity. For the first time, we demonstrate that size, concentration and tetraspanin marker expression of SFEVs is related to OA severity. Furthermore, we demonstrate that SFEVs from severe OA patients drive a distinct catabolic inflammatory articular chondrocyte phenotype.
Synovial inflammation in OA is considered a driver of both cartilage degeneration and pain sensitisation. Therefore, our finding that SFEVs can promote the expression and release not only of cartilage catabolic mediators including CRTAC1, TNC, COL6A3, MMP3 and MMP13 but also pro-inflammatory mediators such as TAC1 (Substance P), CXCL5 and IL-6 in articular chondrocytes suggests that SFEVs may contribute to both cartilage degeneration and pain sensitisation in the joint. Notably, the induction of many of these pro-catabolic and pro-inflammatory effects was significantly greater in chondrocytes subjected to SFEVs from more severe OA, compared to SFEVs from mild/moderate OA, aligning with the previous study by Zhang et al. (2023) [17], who reported that EVs in severe OA contain pro-inflammatory cytokines that exacerbate joint damage. Furthermore, potentially compounding the pro-catabolic effect of SFEV-induced MMPs on cartilage, we also found that SFEVs reduced the expression of the tissue inhibitor of MMPs, TIMP3. Reduced TIMP3 expression may lead to unchecked MMP activity, tipping the balance towards cartilage matrix degradation.
In addition to the induction of these well-established pro-inflammatory catabolic mediators, pathway analysis of the RNA sequencing transcriptomic data revealed that SFEVs modulated a number of canonical inflammatory signalling pathways that regulate immune and inflammatory responses, cartilage and ECM remodelling and neuronal signalling. For example, chondrocytes subjected to SFEVs exhibited increased expression of DUSP4, which is a known regulator of MAPK inflammatory signalling in chondrocytes [18], and ITGA5, a receptor for fibronectin, supporting the potential for SFEVs to shape the inflammatory joint microenvironment. Recently, ITGA5+ synovial fibroblasts were shown to exacerbate inflammatory joint pathology in a collagen-induced arthritis model [19].
We also found that SFEVs mediated transcriptional changes in several genes that mediate vascular biology. Importantly, angiogenesis is a hallmark of OA progression, driven by chronic inflammation and oxidative stress [20,21]. Unlike healthy cartilage, which is avascular, OA cartilage undergoes aberrant neovascularization [20], a process facilitated by the induction of pro-angiogenic factors such as VEGF [22,23] and ICAM1, which is induced in chondrocytes by IL-1β and found in areas of damaged cartilage [24]. The presence of new vasculature is thought to exacerbate inflammation and pain by supplying nutrients and inflammatory mediators to the joint. Here, we observed no change in expression of VEGF with SFEVs from either mild/moderate OA or severe OA. However, SFEVs from severe OA patients induced increased expression of ANGPTL7, SOD2 and increased expression and secretion of ICAM1 in articular chondrocytes. ANGPTL7, a member of the angiopoietin-like family, promotes angiogenesis. Previously, it was reported that the expression of ANGPTL7 in the joint is induced by mechanical stimuli, whilst functionally its over-expression promotes chondrocytes proliferation and calcification [25]. SOD2 is an antioxidant enzyme that regulates reactive oxygen species (ROS) production [26], which is a known to promote angiogenic and inflammatory signalling [27,28]. Interestingly, ablation of SOD2 in models of mechanical joint loading promoted cartilage degeneration, and its expression, similarly to other superoxide dismutases (e.g., SOD1 and SOD3) is downregulated in human OA cartilage [29,30] and decreased during disease progression in a spontaneous OA animal model [29]. Notably, previous studies have reported that EVs can transport pro-angiogenic factors [31], supporting the potential role of SFEV in actively contributing to neovascularization in, and our findings here would support that concept.
Increasing evidence suggests that peripheral pain sensitisation in OA is associated with synovitis [7,32,33] and, in part mediated by the interactions between chondrocytes, immune cells and synovial fibroblasts within the synovial tissue [7], leading to the production of cytokines and growth factors that are capable of sensitising nociceptors directly or activating neuronal signalling pathways [34,35,36].
Notably, we found that the secretion of NGF protein was significantly increased in chondrocytes stimulated with SFEVs from patients with severe OA. Furthermore, TAC1 (Substance P) secretion was increased approximately 18-fold in chondrocytes exposed to SFEVs from either mild/moderate or severe OA. NGF is a well-established mediator of OA pain, which via binding to TrkA, sensitizes peripheral nociceptors, promotes sprouting, and drives chronic pain states within the joint [37]. Indeed, NGF inhibition has been shown to significantly reduce pain in OA models and in clinical trials [38,39]. Similarly, Substance P, a neuropeptide encoded by TAC1, plays a pivotal role in neurogenic inflammation and pain signalling by activating neurokinin-1 (NK1) receptors on sensory afferent neurons [40]. It has been detected at elevated levels in OA synovial fluid [41], NK1-receptor antagonists have shown analgesic efficacy in rodent models of arthritis [42], and TAC1 SNPs are associated with symptomatic knee OA pain [43]. Thus, together, these findings suggest that SFEVs within the OA joint may contribute to the establishment and amplification of pain signalling networks in cartilage through the induction of NGF and Substance P.
Collectively, SFEVs from severe OA patients elicited more pronounced effects on chondrocytes than SFEVs from patients with mild/moderate OA. Indeed, upstream regulator analysis revealed a striking divergence in the predicted upstream mediators of SFEV action depending on OA severity. The chondrocyte transcriptome induced by SFEVs from mild/moderate OA patients was associated with the upstream activation of corticosterone, a potent anti-inflammatory mediator, suggesting that in less severe disease, SFEVs may help maintain a homeostatic balance, supporting both anabolic and anti-inflammatory responses in chondrocytes. This contrasts with SFEVs from severe OA patients, where IL-6, a well-known pro-inflammatory cytokine, emerged as a key activated upstream regulator of the chondrocyte transcriptome, aligning with the broader pro-inflammatory and catabolic gene and protein expression profiles we observed.
Together, these data suggest that in healthy or mildly affected joints, SFEVs might play a regulatory role, modulating chondrocyte responses in a way that resembles the homeostatic functions of healthy synovial fluid. However, as OA progresses to a severe stage, this balance appears to be shifted towards promoting inflammation and matrix degradation, potentially exacerbating cartilage degeneration and pain. However, it should be noted that these effects were markedly different to the effect of synovial fluid on chondrocytes. Suggesting therefore that although SFEVs likely contribute to driving inflammation and cartilage degeneration, additional non-EV encapsulated synovial fluid factors have a predominant effect on chondrocytes. To this end, it would have been invaluable to include an EV-depleted synovial fluid control to account for the effects of other components in the fluid. However, at present, no reliable methods exist for efficient EV depletion from synovial fluid.
Further supporting the role of SFEVs as active mediators of OA pathology, targeted protein analysis revealed that key catabolic (MMP1, MMP3, MMP13) and neurotrophic (NGF, BDNF) factors were detectable within SFEV lysates following detergent lysis. Notably, NGF and MMP1 were significantly enriched in SFEVs compared to whole synovial fluid, suggesting that these factors may be selectively packaged into EVs rather than freely circulating in the synovial fluid joint environment. This targeted enrichment highlights a potential role for SFEVs in the direct delivery of pro-catabolic and neuro-inflammatory signals to chondrocytes and other joint-resident cells, which may help explain their strong functional effects. Moreover, the observed positive correlation between SFEV NGF concentration and patient-reported pain severity (VAS scores) provides further evidence that SFEVs may contribute to peripheral pain sensitisation in OA. Given that NGF plays a key role in OA pain via sensitization of nociceptive neurons, these findings raise the intriguing possibility that SFEVs serve as vehicles for nociceptive signalling, actively influencing pain perception in severe OA.
Several limitations should be considered in this study. First, the isolation method used for EVs from synovial fluid was ultracentrifugation, which, although widely used, may not be ideal as it can co-precipitate other molecules, such as lipids. This is a common issue with many EV isolation techniques, and while it could affect the purity of the EV fraction, ultracentrifugation remains one of the most effective methods currently available. Another limitation is that our study did not fully profile EV cargo such as RNAs or protein, since the volume of synovial fluid limited this possibility. Previous studies have reported that EVs from both the infrapatellar fat pad [11] and synovial fluid [17] in OA patients, particularly those with advanced disease, contain a higher concentration of pro-inflammatory cargo. Therefore, such analyses, together with EV surface marker expression, could lead to the identification of candidate signatures as biomarkers of OA severity or help to stratify OA patient molecular endotype, as well as provide more mechanistic understanding of the EV mediated functional effects on articular chondrocytes reported here. Finally, the relatively small sample size in this study, a consequence of using human samples, is an inherent limitation. Future studies with larger sample sizes would be beneficial to confirm and extend these findings.
5. Conclusions
In summary, SFEVs, particularly those from patients with severe OA, drive a pro-inflammatory and pro-catabolic phenotype in OA articular chondrocytes. These findings provide further evidence for the role of synovial inflammation in exacerbating cartilage degeneration and for the rationale of therapeutically targeting SFEVs to disrupt the intracellular inflammatory and degenerative signalling cascades within the OA joint.
Supplementary Materials
The following supporting information can be downloaded at the website of this paper posted on Preprints.org, Figure S1: Scatter plots showing protein concentrations of MMP1, MMP13, BDNF, NGF, IL-6 and IL-1β analytes in synovial fluid and SFEVs; Table S1: Differential expression analysis of RNA sequencing data for all gene transcripts from synovial fluid-treated vs untreated chondrocytes; Table S2: Differential expression analysis of RNA sequencing data for all gene transcripts from SFEV-treated vs untreated chondrocytes; Table S3. Upstream regulator analysis using IPA of DEGs from synovial fluid treated chondrocytes vs untreated; Table S4: Canonical signalling pathway analysis using IPA of DEGs from synovial fluid-treated chondrocytes vs untreated; Table S5: Upstream regulator analysis using IPA of DEGs from SFEV treated chondrocytes vs untreated; Table S6: Canonical signalling pathway analysis using IPA of DEGs from SFEV treated chondrocytes vs untreated; Table S7: Differential gene expression analysis of RNA sequencing data for all gene transcripts for mild/moderate OA SFEV-treated chondrocytes vs untreated; Table S8. Differential gene expression analysis of RNA sequencing data for all gene transcripts for severe OA SFEV-treated chondrocytes vs untreated; Table S9. Canonical signalling pathway analysis using IPA of DEGs from mild/moderate OA SFEV-treated chondrocytes vs untreated; Table S10: Canonical signalling pathway analysis using IPA of DEGs from severe OA SFEV-treated chondrocytes vs untreated; Table S11: Upstream regulator analysis using IPA of DEGs from mild/moderate OA SFEV-treated chondrocytes vs untreated; Table S12: Upstream regulator analysis using IPA of DEGs from severe OA SFEV-treated chondrocytes vs untreated.
Author Contributions
Conceptualization, C.D., E.T.D, S.W.J; methodology, C.D, J.P.; formal analysis, C.D., J.P. S.W.J.; investigation, C.D., J.P; resources, E.T.D.; data curation, C.D., J.P., S.W.J.; writing—original draft preparation, C.D.; writing—review and editing, S.W.J.; supervision, S.W.J.; funding acquisition, S.W.J. All authors have read and agreed to the published version of the manuscript.
Funding
This research was funded by the Medical Research Council, grant number MR/W026961/1 and carried out at the National Institute for Health and Care Research (NIHR) Birmingham Biomedical Research Centre (BRC).
Institutional Review Board Statement
The study was conducted in accordance with the Declaration of Helsinki, and approved by UK National Research Ethics Committee (NRES 17/SS/0456).
Informed Consent Statement
Informed consent was obtained from all subjects involved in the study.
Data Availability Statement
Data is contained within the article or supplementary material.
Acknowledgments
We gratefully acknowledge all the patients who agreed to take part in this study and the research nurses who helped co-ordinate this study at the Royal Orthopaedic Hospital.
Conflicts of Interest
The authors declare no conflicts of interest. The funders had no role in the design of the study; in the collection, analyses, or interpretation of data; in the writing of the manuscript; or in the decision to publish the results.
Abbreviations
The following abbreviations are used in this manuscript:
| MDPI | Multidisciplinary Digital Publishing Institute |
| EVs | Extracellular Vesicles |
| SFEVs | Synovial Fluid Extracellular Vesicles |
| OKS | Oxford Knee Score |
| VAS | Visual Analogue Scale |
| EQ5D | EuroQol 5-Dimensions (quality of life questionnaire) |
| NTA | Nanoparticle Tracking Analysis |
| DEGs | Differentially Expressed Genes |
| RNA-seq | RNA sequencing |
| IPA | Ingenuity Pathway Analysis |
| ECM | Extracellular Matrix |
| MMP | Matrix Metalloproteinase |
| FCS | Fetal Calf Serum |
| NEAA | Non-Essential Amino Acids |
| DMEM | Dulbecco’s Modified Eagle Medium |
| PBS | Phosphate-Buffered Saline |
| ELISA | Enzyme-Linked Immunosorbent Assay |
| FC | Fold Change |
| Log2FC | Log2 Fold Change |
| FDR | False Discovery Rate |
| PCA | Principal Component Analysis |
| USRs | Upstream Regulators |
| IQR | Interquartile Range |
| BMI | Body Mass Index |
| hg38 | Human Genome Reference Build 38 |
| DNBSEQ | DNA Nanoball Sequencing Platform |
| DESEQ | Differential gene expression analysis tool |
References
- Cross, M.; Smith, E.; Hoy, D.; Nolte, S.; Ackerman, I.; Fransen, M.; Bridgett, L.; Williams, S.; Guillemin, F.; Hill, C. L.; Laslett, L. L.; Jones, G.; Cicuttini, F.; Osborne, R.; Vos, T.; Buchbinder, R.; Woolf, A.; March, L. The global burden of hip and knee osteoarthritis: estimates from the global burden of disease 2010 study. Ann Rheum Dis 2014, 73, 1323–1330. [Google Scholar] [CrossRef] [PubMed]
- Hawker, G. A.; King, L. K. The Burden of Osteoarthritis in Older Adults. Clin Geriatr Med 2022, 38, 181–192. [Google Scholar] [CrossRef] [PubMed]
- Coaccioli, S.; Sarzi-Puttini, P.; Zis, P.; Rinonapoli, G.; Varrassi, G. Osteoarthritis: New Insight on Its Pathophysiology. J Clin Med 2022, 11. [Google Scholar]
- Tonge, D. P.; Pearson, M. J.; Jones, S. W. The hallmarks of osteoarthritis and the potential to develop personalised disease-modifying pharmacological therapeutics. Osteoarthritis Cartilage 2014, 22, 609–621. [Google Scholar]
- Mobasheri, A.; Loeser, R. Clinical phenotypes, molecular endotypes and theratypes in OA therapeutic development. Nat Rev Rheumatol 2024, 20, 525–526. [Google Scholar]
- Angelini, F.; Widera, P.; Mobasheri, A.; Blair, J.; Struglics, A.; Uebelhoer, M.; Henrotin, Y.; Marijnissen, A. C.; Kloppenburg, M.; Blanco, F. J.; Haugen, I. K.; Berenbaum, F.; Ladel, C.; Larkin, J.; Bay-Jensen, A. C.; Bacardit, J. Osteoarthritis endotype discovery via clustering of biochemical marker data. Ann Rheum Dis 2022, 81, 666–675. [Google Scholar]
- Nanus, D. E.; Badoume, A.; Wijesinghe, S. N.; Halsey, A. M.; Hurley, P.; Ahmed, Z.; Botchu, R.; Davis, E. T.; Lindsay, M. A.; Jones, S. W. Synovial tissue from sites of joint pain in knee osteoarthritis patients exhibits a differential phenotype with distinct fibroblast subsets. EBioMedicine 2021, 72, 103618. [Google Scholar]
- Welsh, J. A.; Goberdhan, D. C. I.; O'Driscoll, L.; Buzas, E. I.; Blenkiron, C.; Bussolati, B.; Cai, H.; Di Vizio, D.; Driedonks, T. A. P.; Erdbrugger, U.; Falcon-Perez, J. M.; Fu, Q. L.; Hill, A. F.; Lenassi, M.; Lim, S. K.; Mahoney, M. G.; Mohanty, S.; Moller, A.; Nieuwland, R.; Ochiya, T.; Sahoo, S.; Torrecilhas, A. C.; Zheng, L.; Zijlstra, A.; Abuelreich, S.; Bagabas, R.; Bergese, P.; Bridges, E. M.; Brucale, M.; Burger, D.; Carney, R. P.; Cocucci, E.; Crescitelli, R.; Hanser, E.; Harris, A. L.; Haughey, N. J.; Hendrix, A.; Ivanov, A. R.; Jovanovic-Talisman, T.; Kruh-Garcia, N. A.; Ku'ulei-Lyn Faustino, V.; Kyburz, D.; Lasser, C.; Lennon, K. M.; Lotvall, J.; Maddox, A. L.; Martens-Uzunova, E. S.; Mizenko, R. R.; Newman, L. A.; Ridolfi, A.; Rohde, E.; Rojalin, T.; Rowland, A.; Saftics, A.; Sandau, U. S.; Saugstad, J. A.; Shekari, F.; Swift, S.; Ter-Ovanesyan, D.; Tosar, J. P.; Useckaite, Z.; Valle, F.; Varga, Z.; van der Pol, E.; van Herwijnen, M. J. C.; Wauben, M. H. M.; Wehman, A. M.; Williams, S.; Zendrini, A.; Zimmerman, A. J.; Consortium, M.; Thery, C.; Witwer, K. W. Minimal information for studies of extracellular vesicles (MISEV2023): From basic to advanced approaches. J Extracell Vesicles 2024, 13, e12404. [Google Scholar]
- Zeng, G.; Deng, G.; Xiao, S.; Li, F. Fibroblast-like Synoviocytes-derived Exosomal PCGEM1 Accelerates IL-1beta-induced Apoptosis and Cartilage Matrix Degradation by miR-142-5p/RUNX2 in Chondrocytes. Immunol Invest 2022, 51, 1284–1301. [Google Scholar]
- Cao, Y.; Ruan, J.; Kang, J.; Nie, X.; Lan, W.; Ruan, G.; Li, J.; Zhu, Z.; Han, W.; Tang, S.; Ding, C. Extracellular Vesicles in Infrapatellar Fat Pad from Osteoarthritis Patients Impair Cartilage Metabolism and Induce Senescence. Adv Sci (Weinh) 2024, 11, e2303614. [Google Scholar]
- Gao, K.; Zhu, W.; Li, H.; Ma, D.; Liu, W.; Yu, W.; Wang, L.; Cao, Y.; Jiang, Y. Association between cytokines and exosomes in synovial fluid of individuals with knee osteoarthritis. Mod Rheumatol 2020, 30, 758–764. [Google Scholar] [PubMed]
- Bakinowska, E.; Kielbowski, K.; Pawlik, A. The Role of Extracellular Vesicles in the Pathogenesis and Treatment of Rheumatoid Arthritis and Osteoarthritis. Cells 2023, 12. [Google Scholar] [CrossRef]
- Asghar, S.; Litherland, G. J.; Cole, J. J.; McInnes, I. B.; Meek, R. M. D.; Lockhart, J. C.; Goodyear, C. S.; Crilly, A. Small extracellular vesicles derived from synovial fibroblasts contain distinct miRNA profiles and contribute to chondrocyte damage in osteoarthritis. Arthritis Res Ther 2024, 26, 167. [Google Scholar] [PubMed]
- Distler, J. H.; Jungel, A.; Huber, L. C.; Seemayer, C. A.; Reich, C. F., 3rd; Gay, R. E.; Michel, B. A.; Fontana, A.; Gay, S.; Pisetsky, D. S.; Distler, O. The induction of matrix metalloproteinase and cytokine expression in synovial fibroblasts stimulated with immune cell microparticles. Proc Natl Acad Sci U S A 2005, 102, 2892–2897. [Google Scholar] [PubMed]
- Boere, J.; van de Lest, C. H.; Libregts, S. F.; Arkesteijn, G. J.; Geerts, W. J.; Nolte-'t Hoen, E. N.; Malda, J.; van Weeren, P. R.; Wauben, M. H. Synovial fluid pretreatment with hyaluronidase facilitates isolation of CD44+ extracellular vesicles. J Extracell Vesicles 2016, 5, 31751. [Google Scholar]
- Price, J. M. J.; Hisada, Y.; Hazeldine, J.; Bae-Jump, V.; Luther, T.; Mackman, N.; Harrison, P. Detection of tissue factor-positive extracellular vesicles using the ExoView R100 system. Res Pract Thromb Haemost 2023, 7, 100177. [Google Scholar]
- Zhang, X.; Ma, S.; Naz, S. I.; Jain, V.; Soderblom, E. J.; Aliferis, C.; Kraus, V. B. Comprehensive characterization of pathogenic synovial fluid extracellular vesicles from knee osteoarthritis. Clin Immunol 2023, 257, 109812. [Google Scholar] [PubMed]
- Li, Z.; Chen, B. DUSP4 alleviates LPS-induced chondrocyte injury in knee osteoarthritis via the MAPK signaling pathway. Exp Ther Med 2021, 22, 1401. [Google Scholar]
- Zheng, L.; Gu, M.; Li, X.; Hu, X.; Chen, C.; Kang, Y.; Pan, B.; Chen, W.; Xian, G.; Wu, X.; Li, C.; Wang, C.; Li, Z.; Guan, M.; Zhou, G.; Mobasheri, A.; Song, W.; Peng, S.; Sheng, P.; Zhang, Z. ITGA5(+) synovial fibroblasts orchestrate proinflammatory niche formation by remodelling the local immune microenvironment in rheumatoid arthritis. Ann Rheum Dis 2024. [Google Scholar]
- Ashraf, S.; Walsh, D. A. Angiogenesis in osteoarthritis. Curr Opin Rheumatol 2008, 20, 573–580. [Google Scholar]
- Walsh, D. A.; McWilliams, D. F.; Turley, M. J.; Dixon, M. R.; Franses, R. E.; Mapp, P. I.; Wilson, D. Angiogenesis and nerve growth factor at the osteochondral junction in rheumatoid arthritis and osteoarthritis. Rheumatology (Oxford) 2010, 49, 1852–1861. [Google Scholar] [PubMed]
- Murata, M.; Yudoh, K.; Masuko, K. The potential role of vascular endothelial growth factor (VEGF) in cartilage: how the angiogenic factor could be involved in the pathogenesis of osteoarthritis? Osteoarthritis Cartilage 2008, 16, 279–286. [Google Scholar] [PubMed]
- Hamilton, J. L.; Nagao, M.; Levine, B. R.; Chen, D.; Olsen, B. R.; Im, H. J. Targeting VEGF and Its Receptors for the Treatment of Osteoarthritis and Associated Pain. J Bone Miner Res 2016, 31, 911–924. [Google Scholar]
- Bujia, J.; Behrends, U.; Rotter, N.; Pitzke, P.; Wilmes, E.; Hammer, C. Expression of ICAM-1 on intact cartilage and isolated chondrocytes. In Vitro Cell Dev Biol Anim 1996, 32, 116–122. [Google Scholar]
- Ootake, T.; Ishii, T.; Sueishi, K.; Watanabe, A.; Ishizuka, Y.; Amano, K.; Nagao, M.; Nishimura, K.; Nishii, Y. Effects of mechanical stress and deficiency of dihydrotestosterone or 17beta-estradiol on Temporomandibular Joint Osteoarthritis in mice. Osteoarthritis Cartilage 2021, 29, 1575–1589. [Google Scholar]
- Wang, Y.; Branicky, R.; Noe, A.; Hekimi, S. Superoxide dismutases: Dual roles in controlling ROS damage and regulating ROS signaling. J Cell Biol 2018, 217, 1915–1928. [Google Scholar] [PubMed]
- Kim, Y. W.; Byzova, T. V. Oxidative stress in angiogenesis and vascular disease. Blood 2014, 123, 625–631. [Google Scholar] [PubMed]
- Kim, Y. W.; West, X. Z.; Byzova, T. V. Inflammation and oxidative stress in angiogenesis and vascular disease. J Mol Med (Berl) 2013, 91, 323–328. [Google Scholar]
- Scott, J. L.; Gabrielides, C.; Davidson, R. K.; Swingler, T. E.; Clark, I. M.; Wallis, G. A.; Boot-Handford, R. P.; Kirkwood, T. B.; Taylor, R. W.; Young, D. A. Superoxide dismutase downregulation in osteoarthritis progression and end-stage disease. Ann Rheum Dis 2010, 69, 1502–1510. [Google Scholar]
- Ruiz-Romero, C.; Calamia, V.; Mateos, J.; Carreira, V.; Martinez-Gomariz, M.; Fernandez, M.; Blanco, F. J. Mitochondrial dysregulation of osteoarthritic human articular chondrocytes analyzed by proteomics: a decrease in mitochondrial superoxide dismutase points to a redox imbalance. Mol Cell Proteomics 2009, 8, 172–189. [Google Scholar]
- Buzas, E. I.; Gyorgy, B.; Nagy, G.; Falus, A.; Gay, S. Emerging role of extracellular vesicles in inflammatory diseases. Nat Rev Rheumatol 2014, 10, 356–364. [Google Scholar]
- Baker, K.; Grainger, A.; Niu, J.; Clancy, M.; Guermazi, A.; Crema, M.; Hughes, L.; Buckwalter, J.; Wooley, A.; Nevitt, M.; Felson, D. T. Relation of synovitis to knee pain using contrast-enhanced MRIs. Ann Rheum Dis 2010, 69, 1779–1783. [Google Scholar] [CrossRef] [PubMed]
- de Lange-Brokaar, B. J.; Ioan-Facsinay, A.; Yusuf, E.; Visser, A. W.; Kroon, H. M.; van Osch, G. J.; Zuurmond, A. M.; Stojanovic-Susulic, V.; Bloem, J. L.; Nelissen, R. G.; Huizinga, T. W.; Kloppenburg, M. Association of pain in knee osteoarthritis with distinct patterns of synovitis. Arthritis Rheumatol 2015, 67, 733–740. [Google Scholar] [CrossRef] [PubMed]
- Wijesinghe, S. N.; Ditchfield, C.; Flynn, S.; Agrawal, J.; Davis, E. T.; Dajas-Bailador, F.; Chapman, V.; Jones, S. W. Immunomodulation and fibroblast dynamics driving nociceptive joint pain within inflammatory synovium: Unravelling mechanisms for therapeutic advancements in osteoarthritis. Osteoarthritis Cartilage 2024, 32, 1358–1370. [Google Scholar] [CrossRef] [PubMed]
- Orita, S.; Koshi, T.; Mitsuka, T.; Miyagi, M.; Inoue, G.; Arai, G.; Ishikawa, T.; Hanaoka, E.; Yamashita, K.; Yamashita, M.; Eguchi, Y.; Toyone, T.; Takahashi, K.; Ohtori, S. Associations between proinflammatory cytokines in the synovial fluid and radiographic grading and pain-related scores in 47 consecutive patients with osteoarthritis of the knee. BMC Musculoskelet Disord 2011, 12, 144. [Google Scholar] [CrossRef]
- Junger, H.; Sorkin, L. S. Nociceptive and inflammatory effects of subcutaneous TNFalpha. Pain 2000, 85, 145–151. [Google Scholar] [CrossRef] [PubMed]
- Shang, X.; Wang, Z.; Tao, H. Mechanism and therapeutic effectiveness of nerve growth factor in osteoarthritis pain. Ther Clin Risk Manag 2017, 13, 951–956. [Google Scholar] [CrossRef]
- Schmelz, M.; Mantyh, P.; Malfait, A. M.; Farrar, J.; Yaksh, T.; Tive, L.; Viktrup, L. Nerve growth factor antibody for the treatment of osteoarthritis pain and chronic low-back pain: mechanism of action in the context of efficacy and safety. Pain 2019, 160, 2210–2220. [Google Scholar] [CrossRef]
- Gao, Y.; Hu, Z.; Huang, Y.; Liu, W.; Ren, C. Efficacy and Safety of Anti-Nerve Growth Factor Antibody Therapy for Hip and Knee Osteoarthritis: A Meta-analysis. Orthop J Sports Med 2022, 10, 23259671221088590. [Google Scholar] [CrossRef] [PubMed]
- Mashaghi, A.; Marmalidou, A.; Tehrani, M.; Grace, P. M.; Pothoulakis, C.; Dana, R. Neuropeptide substance P and the immune response. Cell Mol Life Sci 2016, 73, 4249–4264. [Google Scholar] [CrossRef]
- Menkes, C. J.; Renoux, M.; Laoussadi, S.; Mauborgne, A.; Bruxelle, J.; Cesselin, F. Substance P levels in the synovium and synovial fluid from patients with rheumatoid arthritis and osteoarthritis. J Rheumatol 1993, 20, 714–717. [Google Scholar] [PubMed]
- Ko, K. R.; Lee, H.; Han, S. H.; Ahn, W.; Kim, D. K.; Kim, I. S.; Jung, B. S.; Lee, S. Substance P, A Promising Therapeutic Target in Musculoskeletal Disorders. Int J Mol Sci 2022, 23. [Google Scholar]
- Warner, S. C.; Walsh, D. A.; Laslett, L. L.; Maciewicz, R. A.; Soni, A.; Hart, D. J.; Zhang, W.; Muir, K. R.; Dennison, E. M.; Leaverton, P.; Rampersaud, E.; Cooper, C.; Spector, T. D.; Cicuttini, F. M.; Arden, N. K.; Jones, G.; Doherty, M.; Valdes, A. M. Pain in knee osteoarthritis is associated with variation in the neurokinin 1/substance P receptor (TACR1) gene. Eur J Pain 2017, 21, 1277–1284. [Google Scholar] [PubMed]
Figure 1.
(A) Stratification of patients into “mild/moderate OA” and “severe OA” groups based on linear regression analysis between EQ5D and Oxford Knee Score (OKS) (p < 0.0001, r² = 0.3287). (B) Schematic of the experimental workflow. Synovial fluid was collected from patients with severe OA or mild/moderate OA, and extracellular vesicles (EVs) were isolated by ultracentrifugation. EVs were characterised using Nanoparticle Tracking Analysis (NTA) and ExoView. (C) Histogram showing size distribution of synovial fluid extracellular vesicles (SFEVs) isolated by centrifugation, as measured by NTA (n = 13). (D) Linear regression analysis of EV concentration (particles/ml) measured by NTA with EQ5D, OKS and VAS patient-reported scores (n=13 patients). (E) Linear regression of SFEV mean particle size measured by NTA with EQ5D, OKS and VAS scores (n=13 patients). (F) Representative ExoView image of SFEVs. Tetraspanin markers are CD9 (blue), CD63 (red), and CD81 (green). (G) Two-way ANOVA analysis of tetraspanin expression (CD9, CD63, CD81) on SFEVs from severe OA and mild/moderate OA patients, as measured by ExoView (p = 0.004, n=13).

Figure 2.
(A) Schematic of the experimental workflow. Cartilage from OA patients was collagenase digested. Isolated primary chondrocytes were cultured for 24h in the presence of either synovial fluid (SF) or isolated SFEVs (n=6) from the same patients, or left untreated. Total RNA was extracted and subjected to bulk RNA sequencing. (B) Principal Component Analysis (PCA) plot demonstrating distinct clustering of samples following RNA sequencing. (C) Volcano plots highlighting DEGs (FDR < 0.05, FC > 1.5) in SF-treated vs. untreated and SFEV-treated vs. untreated chondrocytes. (D) Heatmap displaying the differential chondrocyte n between SF-treated and SFEV-treated and untreated chondrocytes. (E) Venn diagrams illustrating the common and unique upregulated and downregulated DEGs of SF-treated and SFEV-treated chondrocytes compared to untreated. (F) Percentage distribution of the different gene elements of DEGs identified in SF-treated and SFEV-treated chondrocytes. (G) Z-scores of identified upstream regulators of the transcriptome induced by SF-treated chondrocytes, as identified by IPA. Positive z-scores ≥2 (red bars) represent “activated regulators, negative z-scores ≤-2 (blue bars) represent “inhibited regulators. (H) Molecular network map of the activated upstream regulator corticosterone with connections to DEGs in SF-treated chondrocytes. (I) Top significantly dysregulated canonical signalling pathways in SF-treated chondrocytes as identified by IPA, showing LogP significance and number of DEGs (n) in the dataset aligned to each pathway. (J) Z-scores of identified upstream regulators of the transcriptome induced by SFEV-treated chondrocytes, as identified by IPA. Positive z-scores ≥2 (red bars) represent “activated regulators, negative z-scores ≤-2 (blue bars) represent “inhibited regulators. (K) Molecular network map of the activated upstream regulator IL6 with connections to DEGs in SFEV-treated chondrocytes. (L) Top significantly dysregulated canonical signalling pathways in SFEV-treated chondrocytes as identified by IPA, showing LogP significance and number of DEGs.
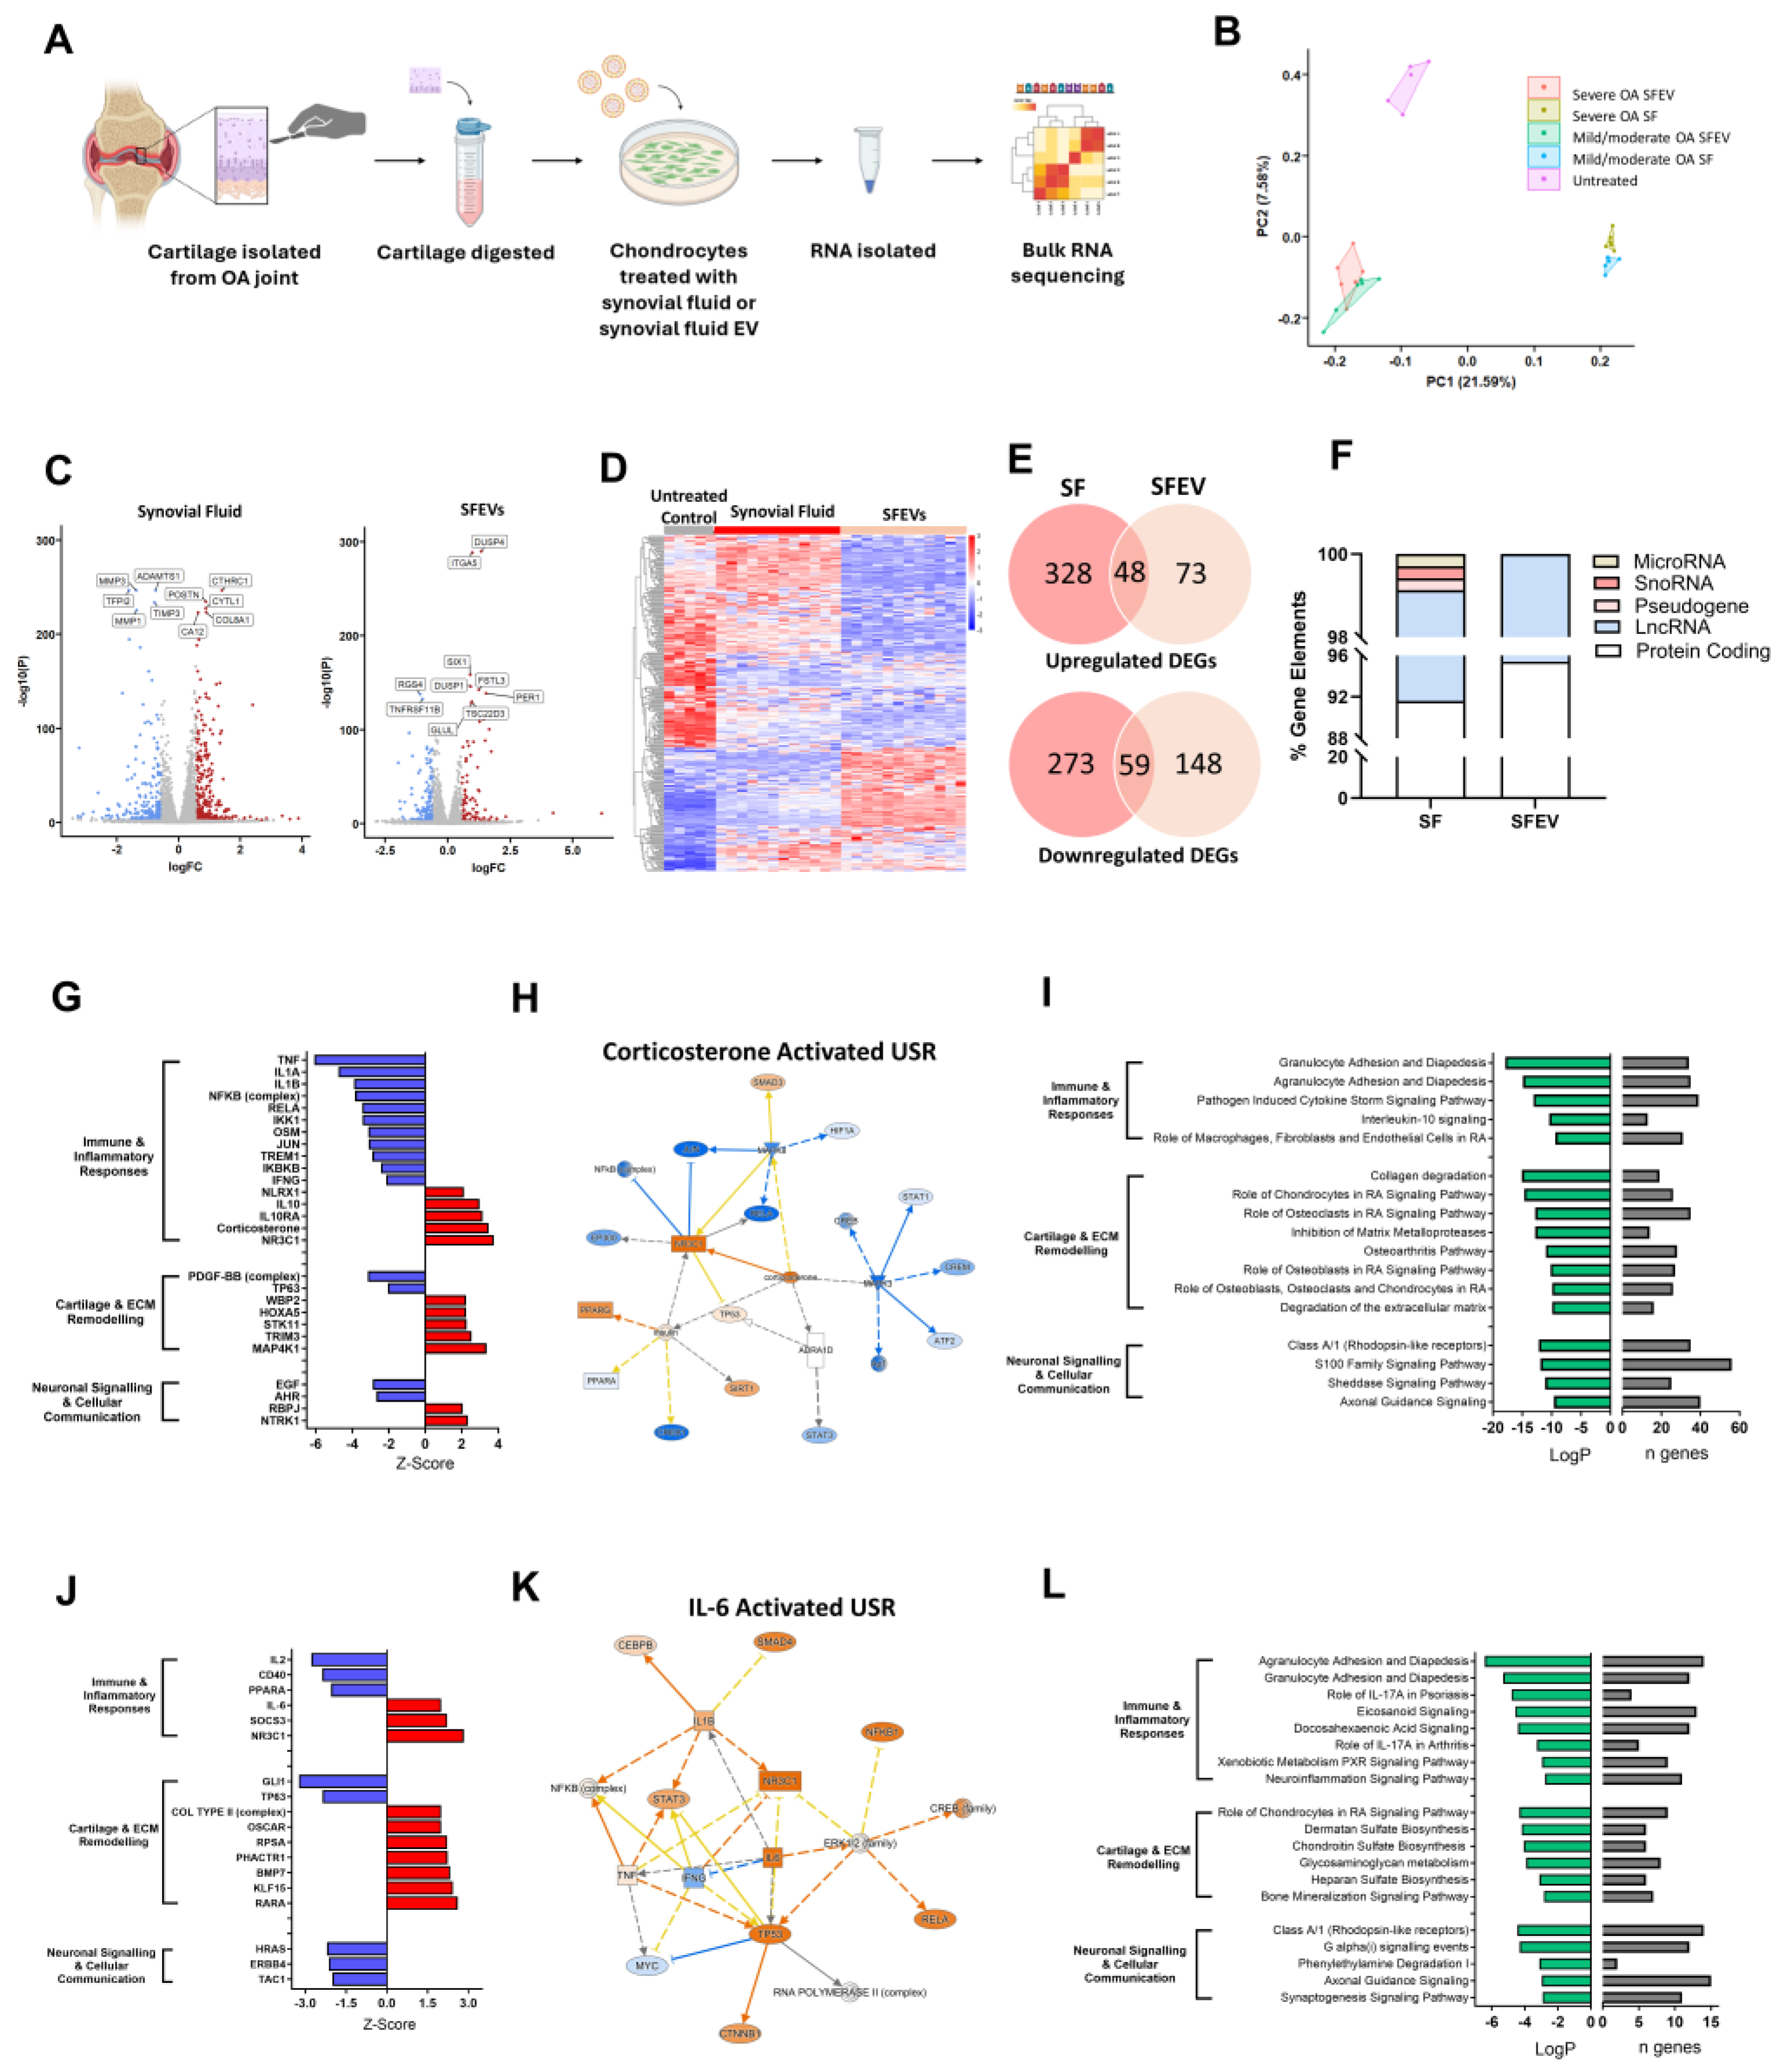
Figure 3.
(A) Volcano plots highlighting DEGs (FDR < 0.05, FC > 1.5) in chondrocytes treated with mild/moderate SFEV vs. untreated and severe SFEV vs. untreated. (B) Heatmap displaying differential transcriptome of untreated, mild/moderate SFEV-treated, and severe SFEV-treated chondrocytes. (C) Venn diagrams illustrating the common and unique upregulated and downregulated DEGs genes of mild/moderate SFEV-treated and severe SFEV-treated chondrocytes. (D) Normalised counts from bulk RNA sequencing for CRTAC1, COL6A3, TNC, CXCL5, NFKBIZ, and SYT7. Data points represent individual sample values for untreated (n=5), mild/moderate SFEV-treated (n=6), and severe SFEV-treated (n=6) conditions, with bar showing mean value. Statistical analysis was performed using 1-way ANOVA with Tukey multiple comparisons post-hoc tests applied (*p < 0.05, **p < 0.01, ***p < 0.001, ****p <0.0001). (E) Bubble plot of canonical signalling pathway enrichment for the DEGs from mild/moderate SFEV-treated (blue bubbles) and severe SFEV-treated (red bubbles) chondrocytes, with -LogP significance represented on the x-axis and bubble size reflecting the number of DEGs aligned to each pathway. (F) Z-scores of identified upstream regulators of the transcriptome induced by mild/moderate SFEV-treated chondrocytes, as identified by IPA. Positive z-scores ≥2 (red bars) represent “activated regulators, negative z-scores ≤-2 (blue bars) represent “inhibited regulators. Molecular network map shows the activated upstream regulator corticosterone with connections to DEGs in mild/moderate SFEV-treated chondrocytes. (G) Z-scores of identified upstream regulators of the transcriptome induced by severe SFEV-treated chondrocytes, as identified by IPA. Positive z-scores ≥2 (red bars) represent “activated regulators, negative z-scores ≤-2 (blue bars) represent “inhibited regulators. Molecular network map shows the activated upstream regulator IL-6 with connections to DEGs in severe SFEV-treated chondrocytes.
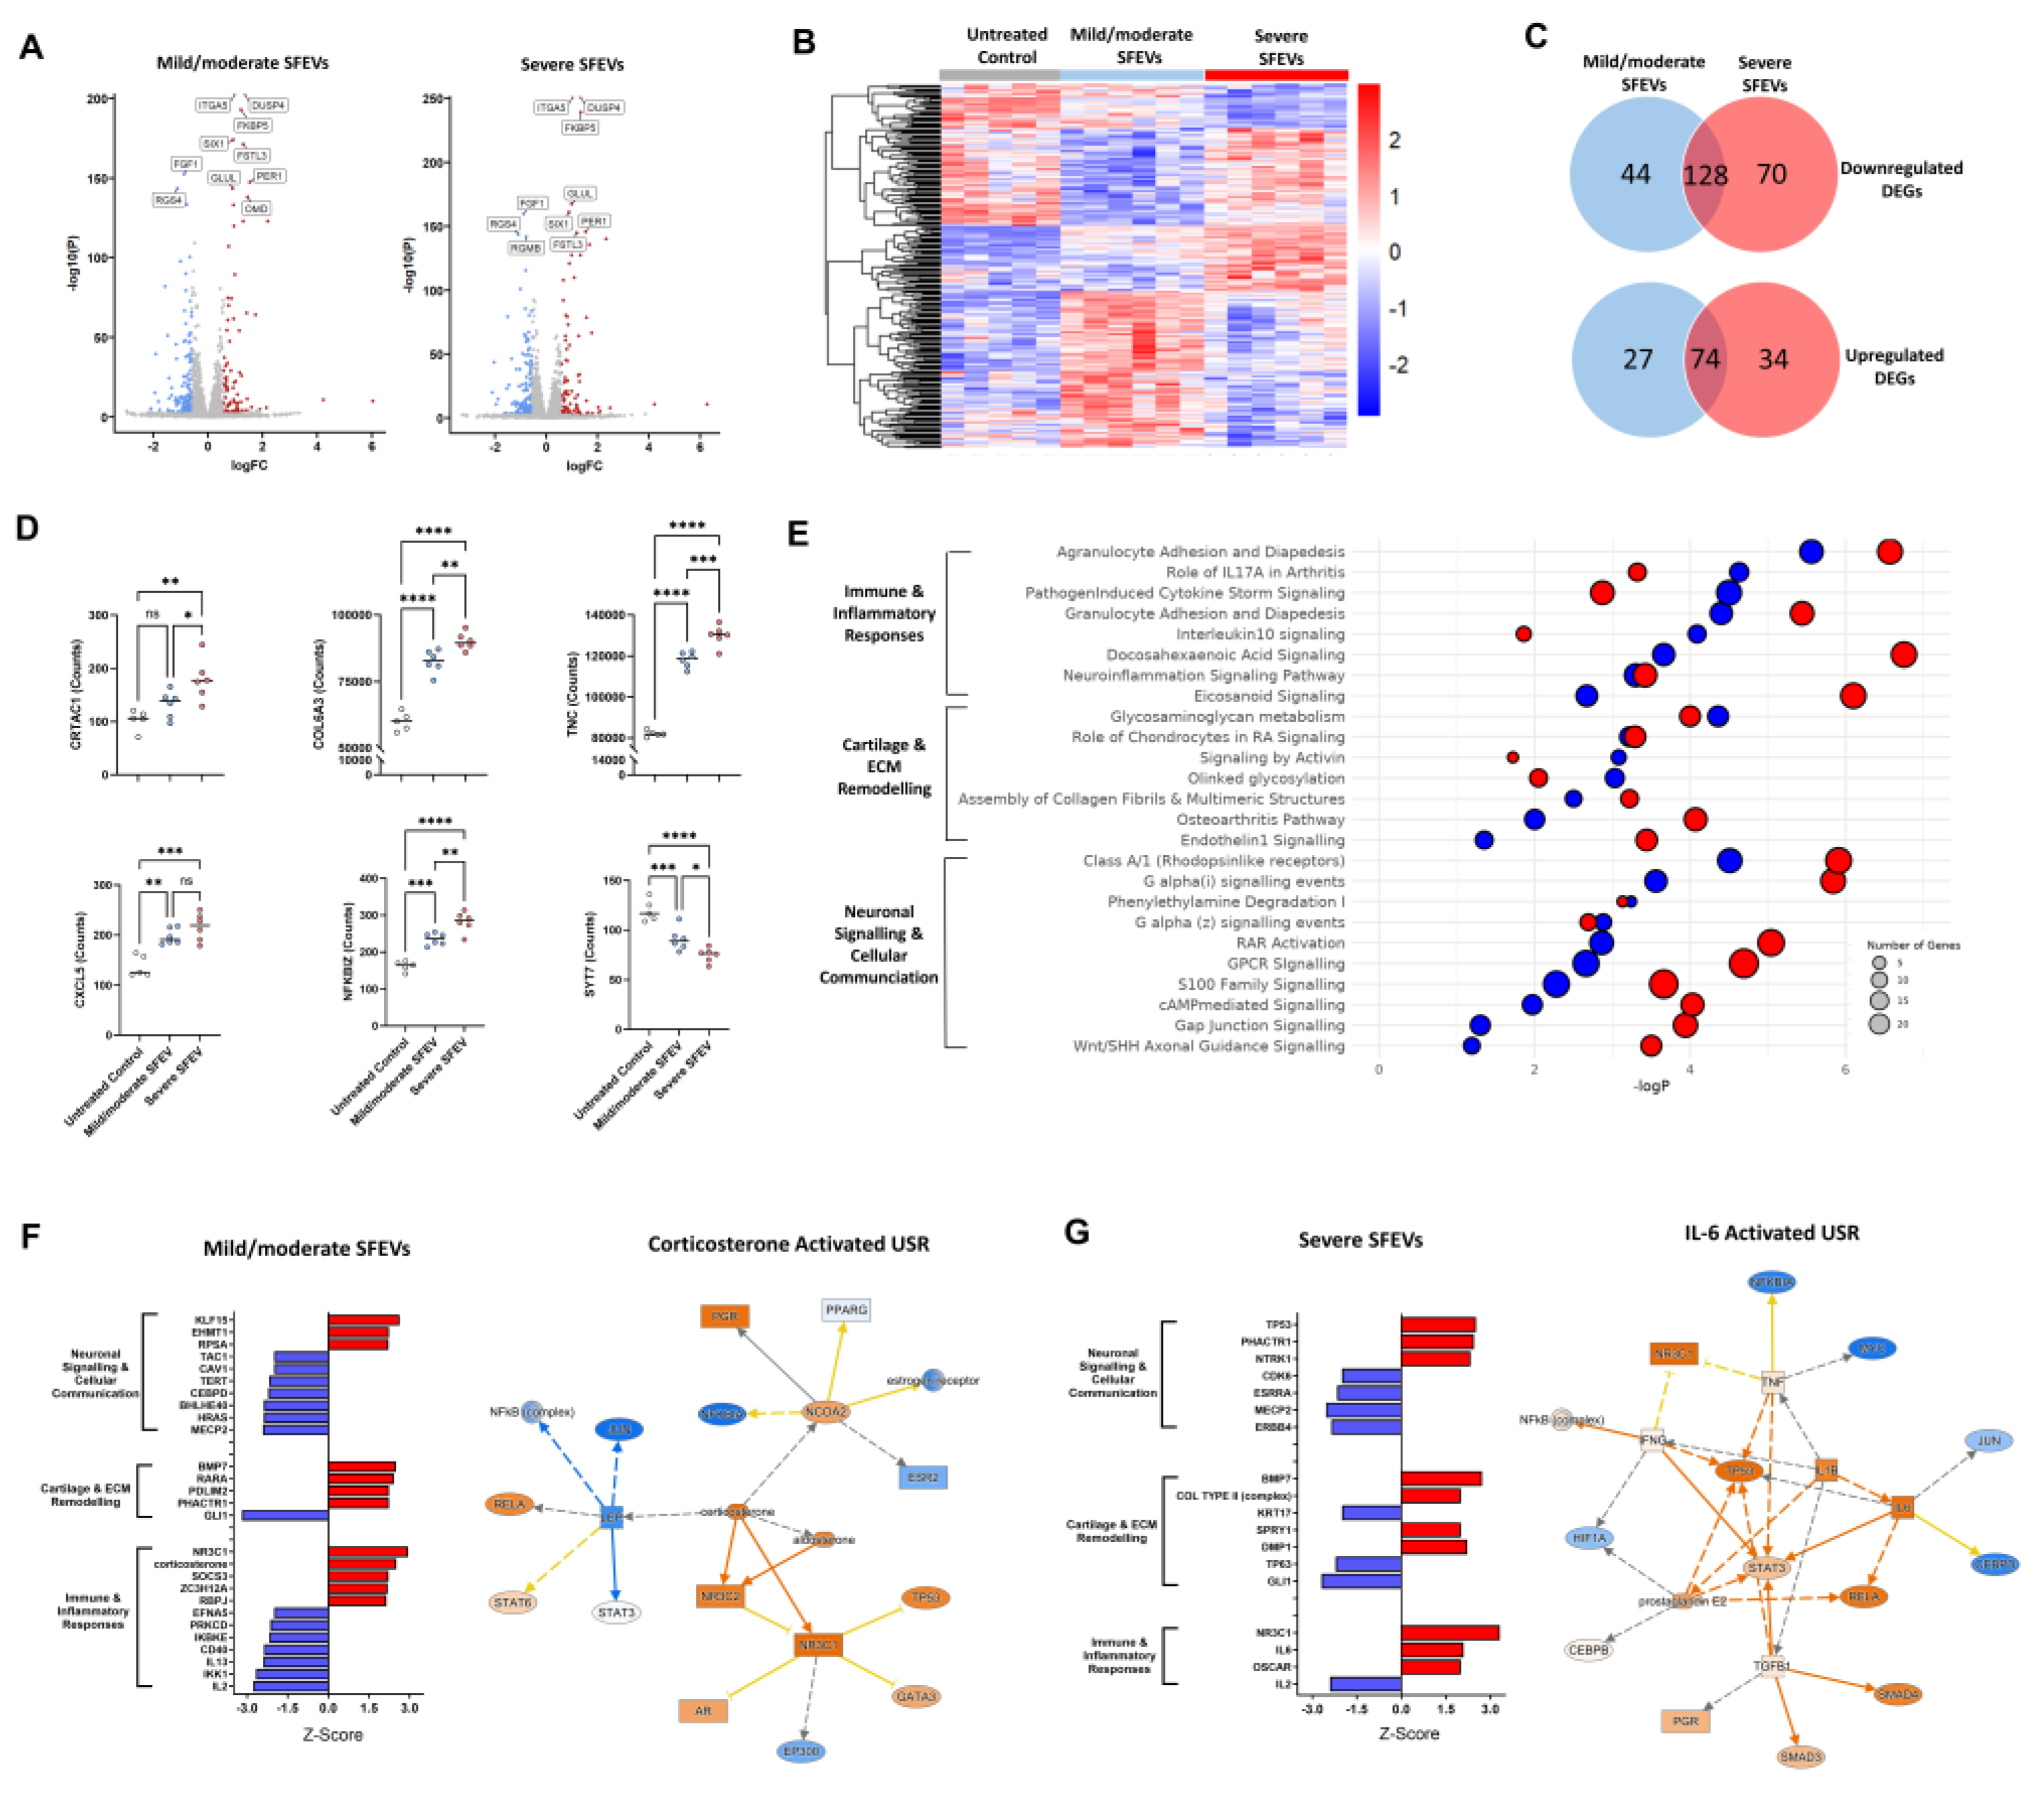
Figure 4.
(A) Schematic of the experimental workflow. Primary human OA chondrocytes, isolated by collagenase digestion of articular cartilage were cultured for 24h with SFEVs from either mild/moderate or severe OA patients, or left untreated. Conditioned media was collected, and protein analyte concentrations quantified using Luminex (MMP1, MMP3, MMP13, IL-6, and NGF) or ELISA (TAC1, TIMP3, and ICAM1). Synovial fluid and SFEVs were lysed with Triton-X and protein analytes were quantified using a customised Luminex (MMP1, MMP3, MMP13, BDNF, NGF, IL-6 and IL-1β). (B) Box and whisker plots showing protein concentrations (pg/ml) of MMP3, MMP13, TIMP3, and MMP1 (cartilage and ECM remodelling response genes), ICAM1 and IL-6 (immune and inflammatory response genes), and TAC1 and NGF (neuronal signalling and cellular communication genes) in untreated (n = 5), mild/moderate SFEV-treated (n = 6), and severe SFEV-treated (n = 6) chondrocytes, as measured by Luminex and ELISA. Boxes represents the interquartile range (IQR; 25th to 75th percentiles), with the line indicating mean and whiskers representing minimum to maximum values. (C) Normalised counts from bulk RNA sequencing for MMP1, MMP3, MMP13, TIMP3, ICAM1, IL6, TAC1, and NGF in untreated (n = 5), mild/moderate SFEV-treated (n = 6), and severe SFEV-treated (n = 6) chondrocytes. Statistical analysis was performed using 1-way ANOVA with Tukey post-hoc multiple comparison tests applied as appropriate. Significance levels: *p < 0.05, **p < 0.01, ***p < 0.001, ****p < 0.0001. (D) Scatter plots of the protein concentration (pg/ml) of the analytes BDNF, IL-6, NGF, IL1β, MMP1 and MMP13 in SFEV lysates. The concentration of the analyte MMP3 is not shown as its concentration exceeded the upper limit of the standard curve. (E) Linear regression analysis of SFEV NGF protein concentration with VAS, EQ5D and OKS patient-reported scores (n = 13 patients). NGF protein was quantified by ELISA of SFEVs lysed with 0.5% Triton-X. Data points represent individual sample values, and bars show the mean.
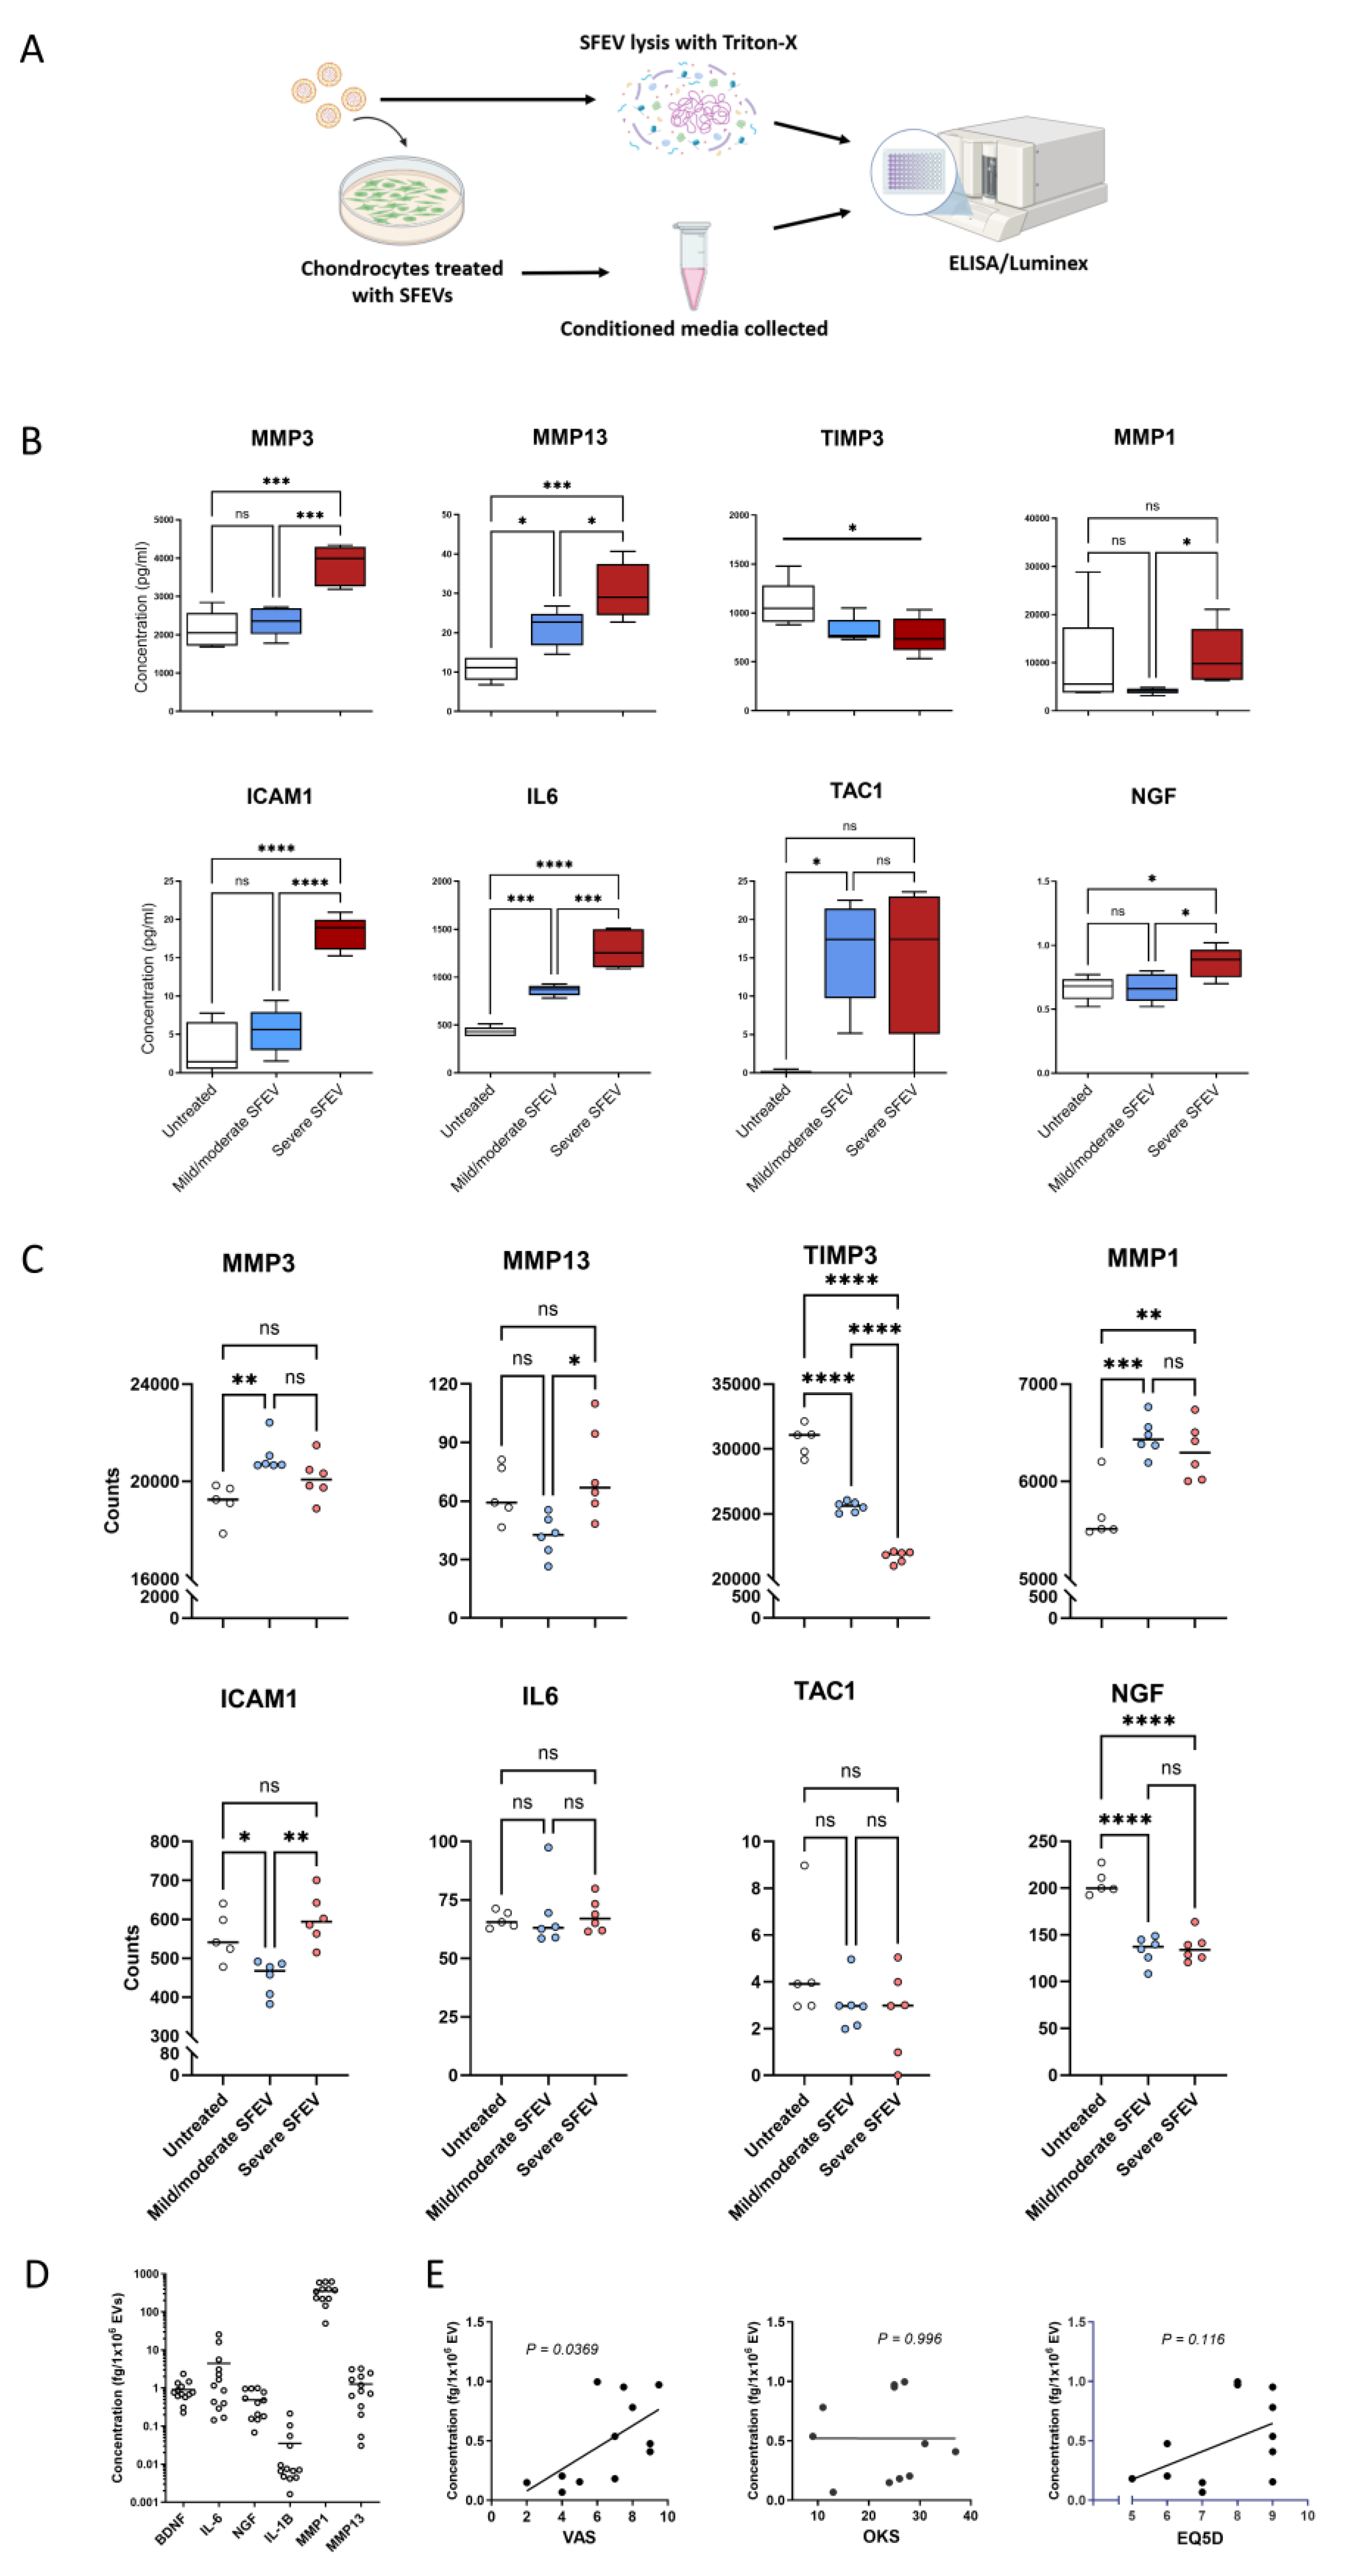

Table 1.
Characteristics of OA patient cohort for SFEV analyses.
| Mild/moderate OA | Severe OA | p value | |
|---|---|---|---|
| n = 7 | n = 4 | ||
| OKS1 | 26.8 ± 3.3 | 15.25 ± 3.38 | *p = 0.0443 |
| EQ5D(sum) 2 | 7.6 ± 0.48 | 8.750 ± 0.63 | p = 0.1722 |
| VAS3 | 6.6 ± 0.93 | 5.667 ± 1.86 | p = 0.6106 |
| Age | 64.0 ± 6 | 57.5 ± 6 | p = 0.5037 |
| Sex (male: female) | 5: 2 | 1: 3 | |
| BMI4 | 32.2 ± 2.3 | 35.2 ± 2.5 | p = 0.4217 |
1 OKS – Oxford Knee Score. 2EQ5Dsum = Summation of scores across all 5 dimensions -mobility, self-care, usual activities, pain/discomfort and anxiety/depression. 3VAS = Visual analogue Scale of pain severity. 4BMI = Body Mass Index, weight (kg)/height (m)2.
Disclaimer/Publisher’s Note: The statements, opinions and data contained in all publications are solely those of the individual author(s) and contributor(s) and not of MDPI and/or the editor(s). MDPI and/or the editor(s) disclaim responsibility for any injury to people or property resulting from any ideas, methods, instructions or products referred to in the content. |
© 2025 by the authors. Licensee MDPI, Basel, Switzerland. This article is an open access article distributed under the terms and conditions of the Creative Commons Attribution (CC BY) license (http://creativecommons.org/licenses/by/4.0/).
Copyright: This open access article is published under a Creative Commons CC BY 4.0 license, which permit the free download, distribution, and reuse, provided that the author and preprint are cited in any reuse.


