Submitted:
31 July 2025
Posted:
31 July 2025
You are already at the latest version
Abstract
Osteoarthritis (OA) represents the most prevalent form of joint disease, leading to considerable pain and functional disability. While surgical interventions and pain relief modalities are available, there is an urgent necessity for effective therapeutic strategies to restore the damage. Our research investigates CK2.1, an innovative peptide that has exhibited significant promise in stimulating chondrogenesis, specifically within articular chondrocytes, for the treatment of OA. In our study, we employed micromass cultures derived from chondrocytes of human OA patients to evaluate the effectiveness of CK2.1. We demonstrated that CK2.1 significantly enhanced proteoglycan synthesis in chondrocytes isolated from OA patients. This observation highlights CK2.1’s targeted action and potential as a novel therapeutic strategy for treating osteoarthritis.
Keywords:
osteoarthritis
; BMP pathway
; peptide drug
; chondrogenesis
; hypertrophy
; musculoskeletal diseases
1. Introduction
Osteoarthritis[1](OA), also known as ‘wear and tear’ arthritis, is the most common joint disease [2,3]. It is more prevalent in individuals involved in manual labor, and women are at a higher risk[3]. In older women, the lowering of estrogen during menopause increases the risk[4,5]. The disease mainly affects weight-bearing joints, leading to immobility as it progresses. OA is a painful condition due to joint swelling and structural damage. As the aging population increases, the incidence rate of OA is expected to rise worldwide over the next few decades. [6]. The management of OA comes with a significant cost. Current treatment options include joint replacement and the use of non-steroidal anti-inflammatory drugs (NSAIDs) to alleviate pain[7,8]. Repairing structural damage using hyaluronan is also under investigation[9]. However, neither of these options provides permanent relief or a complete reversal of symptoms[10,11].
Understanding how different demographics are affected by OA further substantiates the need for better treatment options. In individuals aged 60 and above, the likelihood of developing osteoarthritis (OA) is a significant 50%. Shockingly, one in five men and one in three women above 60 are affected by this condition. Worldwide, an estimated 240 million cases of symptomatic OA exist[12]. Countries with lifestyle factors leading to obesity and lack of movement face a higher probability of OA diagnosis[13,14]. Individuals engaged in manual labor jobs are disproportionately affected after retirement [15]. Smoking and chronic inflammation can also accelerate the progression of the disease[12]. The impact of OA on quality of life is profound, reducing productive years and increasing the likelihood of developing other chronic conditions[14]. OA patients are at elevated risk of developing Type 2 diabetes, obesity, and depression due to their limited ability to engage in regular daily activities [3,16]. Paradoxically, many patients are demotivated to seek timely medical attention and care due to their advanced age and economic status. These challenges highlight the urgent need for a cost-effective and easily accessible treatment for OA that can effectively reverse symptoms, allowing patients to reduce doctor visits and avoid suffering from co-existing illnesses[17]. Treatment that successfully reverses the symptoms of OA requires an understanding of the complexity of OA pathogenesis[18].
Several factors contribute to the progression of osteoarthritis (OA), rather than a single cause[19]. OA progression involves an increase in inflammatory cytokines, such as IL-1β (interleukin-1 beta), TNF-α (tumor necrosis factor alpha), and IL-6 (interleukin 6), in the synovial fluid, damage to the articular cartilage, and abnormalities in the remodeling of the subchondral bone[20,21,22] [20,23,24]. Alterations in the complex molecular architecture of the extracellular matrix of articular cartilage (cECM) play a crucial role in OA progression [17]. These alterations are attributed to the enhanced secretion of proteolytic enzymes such as Matrix metalloproteinases-13 (MMP-13) [25] and a decreased rate of cECM replacement by articular cartilage chondrocytes (ACCs) [7,8].
The ACCs are categorized into three types based on their metabolic activity and localization within articular cartilage. The superficial zone of cartilage contains the early chondrocytes. These ACCs are essential for cartilage development; however, they do not exhibit a high rate of protein synthesis during adulthood[26]. These cells secrete lubricin (encoded by PRG4), which is essential for maintaining the friction-free surface of hyaline cartilage[27]. The middle zone of cartilage contains active chondrocytes. These ACCs are active in synthesizing collagens of the cartilage extracellular matrix (cECM), such as collagen type II and IX[28]. The ACCs in adults secrete the cartilage extracellular matrix[29]. They are responsive to mechanical tissue loading and actively repair cartilage lesions in healthy individuals[30]. The deep cartilage zone, also called the hypertrophic zone, contains hypertrophic chondrocytes. These ACCs are in the terminal stage of differentiation, and they secrete bone extracellular matrix markers such as collagen type X[31]. Stimulation of ACCs to increase the secretion of cECM components is an effective strategy for treating OA[32]. Growth factors and hormones such as Insulin-like Growth Factor-I (IGF-I)[33], Transforming Growth Factor-β (TGF-β), Fibroblast Growth Factor 18 (FGF18) [34]and Bone Morphogenetic Proteins (BMPs) are essential to the secretion of articular cartilage[33,35,36,37].
Bone Morphogenetic Protein-2 (BMP-2) is an essential growth factor for chondrocyte maturation[38]. It is a member of the transforming growth factor beta (TGFβ) superfamily[39]. BMP-2 induces BMP signaling through BMP Receptor Type 1A (BMPRIa)[40]. The deletion of BMPRIa causes defective joints in adult mice[41,42]. BMP-2 binds BMPRIa receptor or BMPRIa-BMPR2 pre-formed complexes [43]. Phosphorylation of the BMPRIa receptor by BMPR2 activates the BMP signaling[44]. This interaction also releases pleiotropic Protein Kinase CK2 (CK2) [45]. CK2 is bound to BMPRIa when the receptor is inactive. The intracellular domain of BMPRIa has three possible CK2 binding and phosphorylation sites (SLKD, SLYD, or SYED)[46]. The release of CK2 initiates the subsequent phosphorylation of downstream signaling, which can cause the differentiation of MSCs into adipocytes, osteoblasts, and chondrocytes[45,47](Figure 1).
BMP2 can induce chondrogenesis [48]. However, restricting the cell's fate towards chondrogenic lineage and avoiding endochondral ossification or adipogenesis by selective activation of BMP signaling is incredibly challenging[45]. BMP-2 also drives endochondral ossification and ectopic bone formation when injected into articular cartilage. Hence, the FDA has not approved it for the treatment of OA[49].
Our lab developed BMPRIa-CK2 interfering peptide CK2.1. This peptide drives stem cell differentiation toward the chondrogenic lineage without the BMP-2 ligand[50]. This peptide contains one of the three CK2 phosphorylation sites on BMPRIa, as identified by SYED. It has the Antennapedia Homeodomain (AntpHD) sequence for cellular uptake at the N terminus[50]. Flanking the CK2 phosphorylation motif is a BMPRIa homologous sequence, facilitating effective binding with CK2. The peptide-induced chondrogenesis in vitro in mouse MSC line C3H10T1/2 and in vivo in the Destabilized Medial Meniscus (DMM) mouse model[51]. CK2.1 increased proteoglycan synthesis and elevated levels of collagen type II without causing chondrocyte hypertrophy, a frequent occurrence with BMP2-induced signaling [52,53]. However, its efficacy in treating OA has not been explored.
In the present study, we investigated the ability of CK2.1 to induce proteoglycan synthesis in ACCs isolated from patients diagnosed with OA who have undergone total hip replacement surgery. Patients undergo surgery at the advanced stage of OA and when non-surgical interventions have been ineffective[54].
We isolated and cultured ACCs from human donors (Figure 2). The articular cartilage was isolated using a scalpel technique to minimize cell death and impairments to matrix degradation capacity[55]. We treated the cultured cells with CK2.1 in vitro and measured the synthesis of proteoglycans. Alcian blue staining is a histological technique widely used to determine proteoglycan content[56]. We used this staining technique to semi-quantify the amount of proteoglycan synthesis.
While CK2.1 effectively induces chondrogenic differentiation of murine mesenchymal stem cells and restores articular cartilage in vivo, its utility as an OA therapeutic is not established [57]. The present study demonstrates that the peptide CK2.1 can induce proteoglycan synthesis in ACCs isolated from patients diagnosed with OA. We also determined the optimal concentration of CK2.1 to induce maximum proteoglycan synthesis. The mechanism of increasing proteo-glycan synthesis was not based on increasing cellular proliferation. Additionally, comparison group chondrocytes are not responsive to CK2.1. In summary, we show that CK2.1 is a potential therapeutic for the treatment of OA. It is capable of selectively activating proteoglycan synthesis in OA.
2. Materials and Methods
2.1. Primary Chondrocyte Isolation
Femoral heads were obtained from patients diagnosed with osteoarthritis and who had undergone total hip replacement surgery. All donors were females between the ages of 50 and 90. The samples were otherwise de-identified concerning medical history and detailed disease diagnosis. Classification of samples OA or comparison group (section 2.2) was performed by medical professionals at ChristianaCare Hospitals in Wilmington, DE, and Newark, DE. Samples were kept on ice during transportation to the laboratory. The cartilage chips were isolated from the femoral heads using the scalpel technique. Cartilage chips were removed from random sampling sites on the femoral head surface. The cartilage chips were extracted through the thickness of the articular cartilage to expose the subchondral bone. The cartilage chips were incubated in a 50 mL conical vial with 5 mL collagenase type II (0.5% w/v) dissolved in Dulbecco’s Modified Eagle Medium (DMEM). After incubation at 37°C and 5% CO2, the undigested chunks of cartilage chips were filtered out using a 70 μm cell filter.
2.2. Comparison Group Chondrocytes
This study used Chondrocytes isolated from the hip joints of Osteoporosis and fracture patients as a comparison group. All donors were females between the ages of 50 to 90. This was due to the unavailability of hip joints from healthy donors. The patients had undergone hip replacement surgery due to a fracture. The methodology for isolating and culturing the comparison group chondrocytes was identical to that used for the chondrocytes obtained from patients diagnosed with OA, as were the procedures for CK2.1 stimulation and Alcian blue staining.
2.3. Cell Density Measurement
Filtered collagenase II-DMEM solution was centrifuged for 15 minutes at 37°C and 1,500 rpm to obtain a cell pellet. Cells were resuspended in 1 mL of DMEM. The cell density of chondrocytes obtained after digestion with collagenase type II was determined using a hemocytometer. For cell density measurement, 10 μL of the suspension was pipetted into the hemocytometer. Cells were counted using a microscope in the improved Neubauer chamber. Cells in the five squares (0.1 cm x 0.1 cm) were counted and averaged. Based on the number of cells in 0.1µL of volume (volume of 0.1 cm x 0.1 cm square of the chamber), we determined the cell density (cells/mL) of the cell suspension.
2.4. Micromass Culture
Cells were concentrated to obtain 107 cells in 10 μL of DMEM. A volume of 10 μL was placed into the center of the well in a 24-well plate. The cells were incubated at 37°C and 5% CO2 for two hours to adhere to the surface of the well plate. Later, 1 mL of fresh DMEM media supplemented with 10% FBS (DMEM complete media) was added to each well.
2.5. CK2.1 Peptide Treatment
Micromasses were incubated at 37°C and 5% CO2 for two to three days for cellular attachment. CK2.1 peptide (Genscript, Piscataway) was dissolved in DMEM complete media to obtain concentrations of 50nM, 100nM, 250nM, 500nM, and 1,000nM. In the unstimulated control, DMEM complete media was added to the wells. Micromasses were treated with CK2.1 peptide for seven days. Media containing peptides was changed every two to three days.
2.6. Alcian Blue Staining
Post-peptide treatment micromasses were washed with 500μL phosphate buffer saline (PBS). Micromasses were fixed with 500μL formalin PCP (pH 7.4) for 30 min. Then, they were treated with glacial acetic acid for 30 min. Micromasses were stained using Alcian Blue dye (pH 2.5) for 24 hours. Afterward, micro masses were washed with glacial acetic acid for 24 hours. Finally, plates were dried at room temperature for 48 hours.
2.7. Image Acquisition and Analysis
Images were acquired using a Zeiss light microscope fitted with an AmScope MD series camera. Three images of each well, totaling twelve per CK2.1 concentration, were captured. Images were processed using Fiji/ImageJ, an open-source image processing software. The Alcian blue staining intensity was recorded for five different sections of each image. Background intensity corrections were applied using a stained well without micromasses.
2.8. Statistical Analysis
The average intensity values per concentration were obtained and normalized for each sample across concentrations. The data for the three OA replicates were combined, and similarly, the data for the three comparison group replicates were combined. The normality of the data distribution was assessed using the Shapiro-Wilk test, as the Sample size was less than 50. The Alcian blue intensity values for OA chondrocytes and the comparison group were normally distributed. The standard error of the mean was calculated. ANOVA and Tukey-Kramer tests were conducted to measure statistical significance.
3. Results
3.1. Optimal Conditions for Articular Chondrocyte Isolation
To identify optimal conditions for isolating articular chondrocytes, we compared the number of chondrocytes obtained with collagenase type II digestion at different intervals. We also analyzed the effects of repeated digestion and cell harvesting on the total number of cells obtained. We obtained femoral heads from the hip joint of patients diagnosed with OA who had undergone total hip replacement surgery. The femoral head samples were divided into three groups, each consisting of three replicates (n=3).
In the first group (Group 1), we harvested the chondrocytes thrice (first at 24 hours of collagenase type II digestion, then at 48 and 72 hours). In the second group (Group 2), we harvested chondrocytes twice (at 48 and 72 hours). In the third group (Group 3), we harvested chondrocytes only once (72 hours). We harvested ACCs by collecting the collagenase type II and DMEM solution in which cartilage chips were placed (section 2.1). For repeated digestion and harvesting in Group 1 and Group 2, we put the cartilage chips in fresh collagenase type II-DMEM solution after harvesting. We normalized the average number of cells within each group based on the highest cell counts obtained and calculated the standard error of the mean.
The samples digested for 48 hours and harvested only once contained higher numbers of cells than those digested for 24 and 72 hours. Repeated isolations of the same samples resulted in significantly diminished cell counts (Figure 3). We used the 48 hours of collagenase type II digestion for the following experiments and harvested cells only once.
3.2. Baseline Proteoglycan Synthesis Is Reduced in OA Chondrocytes
Proteoglycan (PG) depletion is one of the significant tissue-level changes in OA [58]. We determined the difference in baseline PG secretion in chondrocytes obtained from three patients diagnosed with OA (OA chondrocytes) and three comparison group chondrocytes (Materials and methods, 2.7). To determine the differences, we compared the intensity of Alcian blue staining on the untreated micromasses of OA and comparison group chondrocytes. The Alcian blue staining of micromasses helps determine the level of chondrogenesis reflected as total proteoglycan synthesis[57,59].
The chondrocytes were harvested and cultured into micromass (section 2.1). After seven days of culture, we stained micromasses with Alcian blue. We analyzed three microscopic images of OA chondrocytes and comparison group micromasses using ImageJ to obtain the intensity of Alcian blue staining.
OA chondrocytes had roughly 75% of the Alcian blue staining compared to the comparison group. This demonstrated lower levels of proteoglycan synthesis among OA chondrocytes (Figure 4).
3.3. Optimal Concentration of CK2.1 in Inducing Proteoglycan Synthesis
We determined the optimal concentration of CK2.1 required to induce proteoglycan synthesis in OA chondrocytes. In the mouse mesenchymal stem cell line, C3H10T1/2, the 100nM CK2.1 results in the highest level of proteoglycan synthesis [57]. Thus, we hypothesized that the same concentration would cause the highest level of proteoglycan synthesis in OA chondrocytes.
We treated the OA chondrocyte micromasses and the comparison group with CK2.1 concentrations of 50nM, 100nM, 250nM, 500nM, and 1000nM. The samples consisted of OA chondrocytes from three donors and a comparison group from three donors.
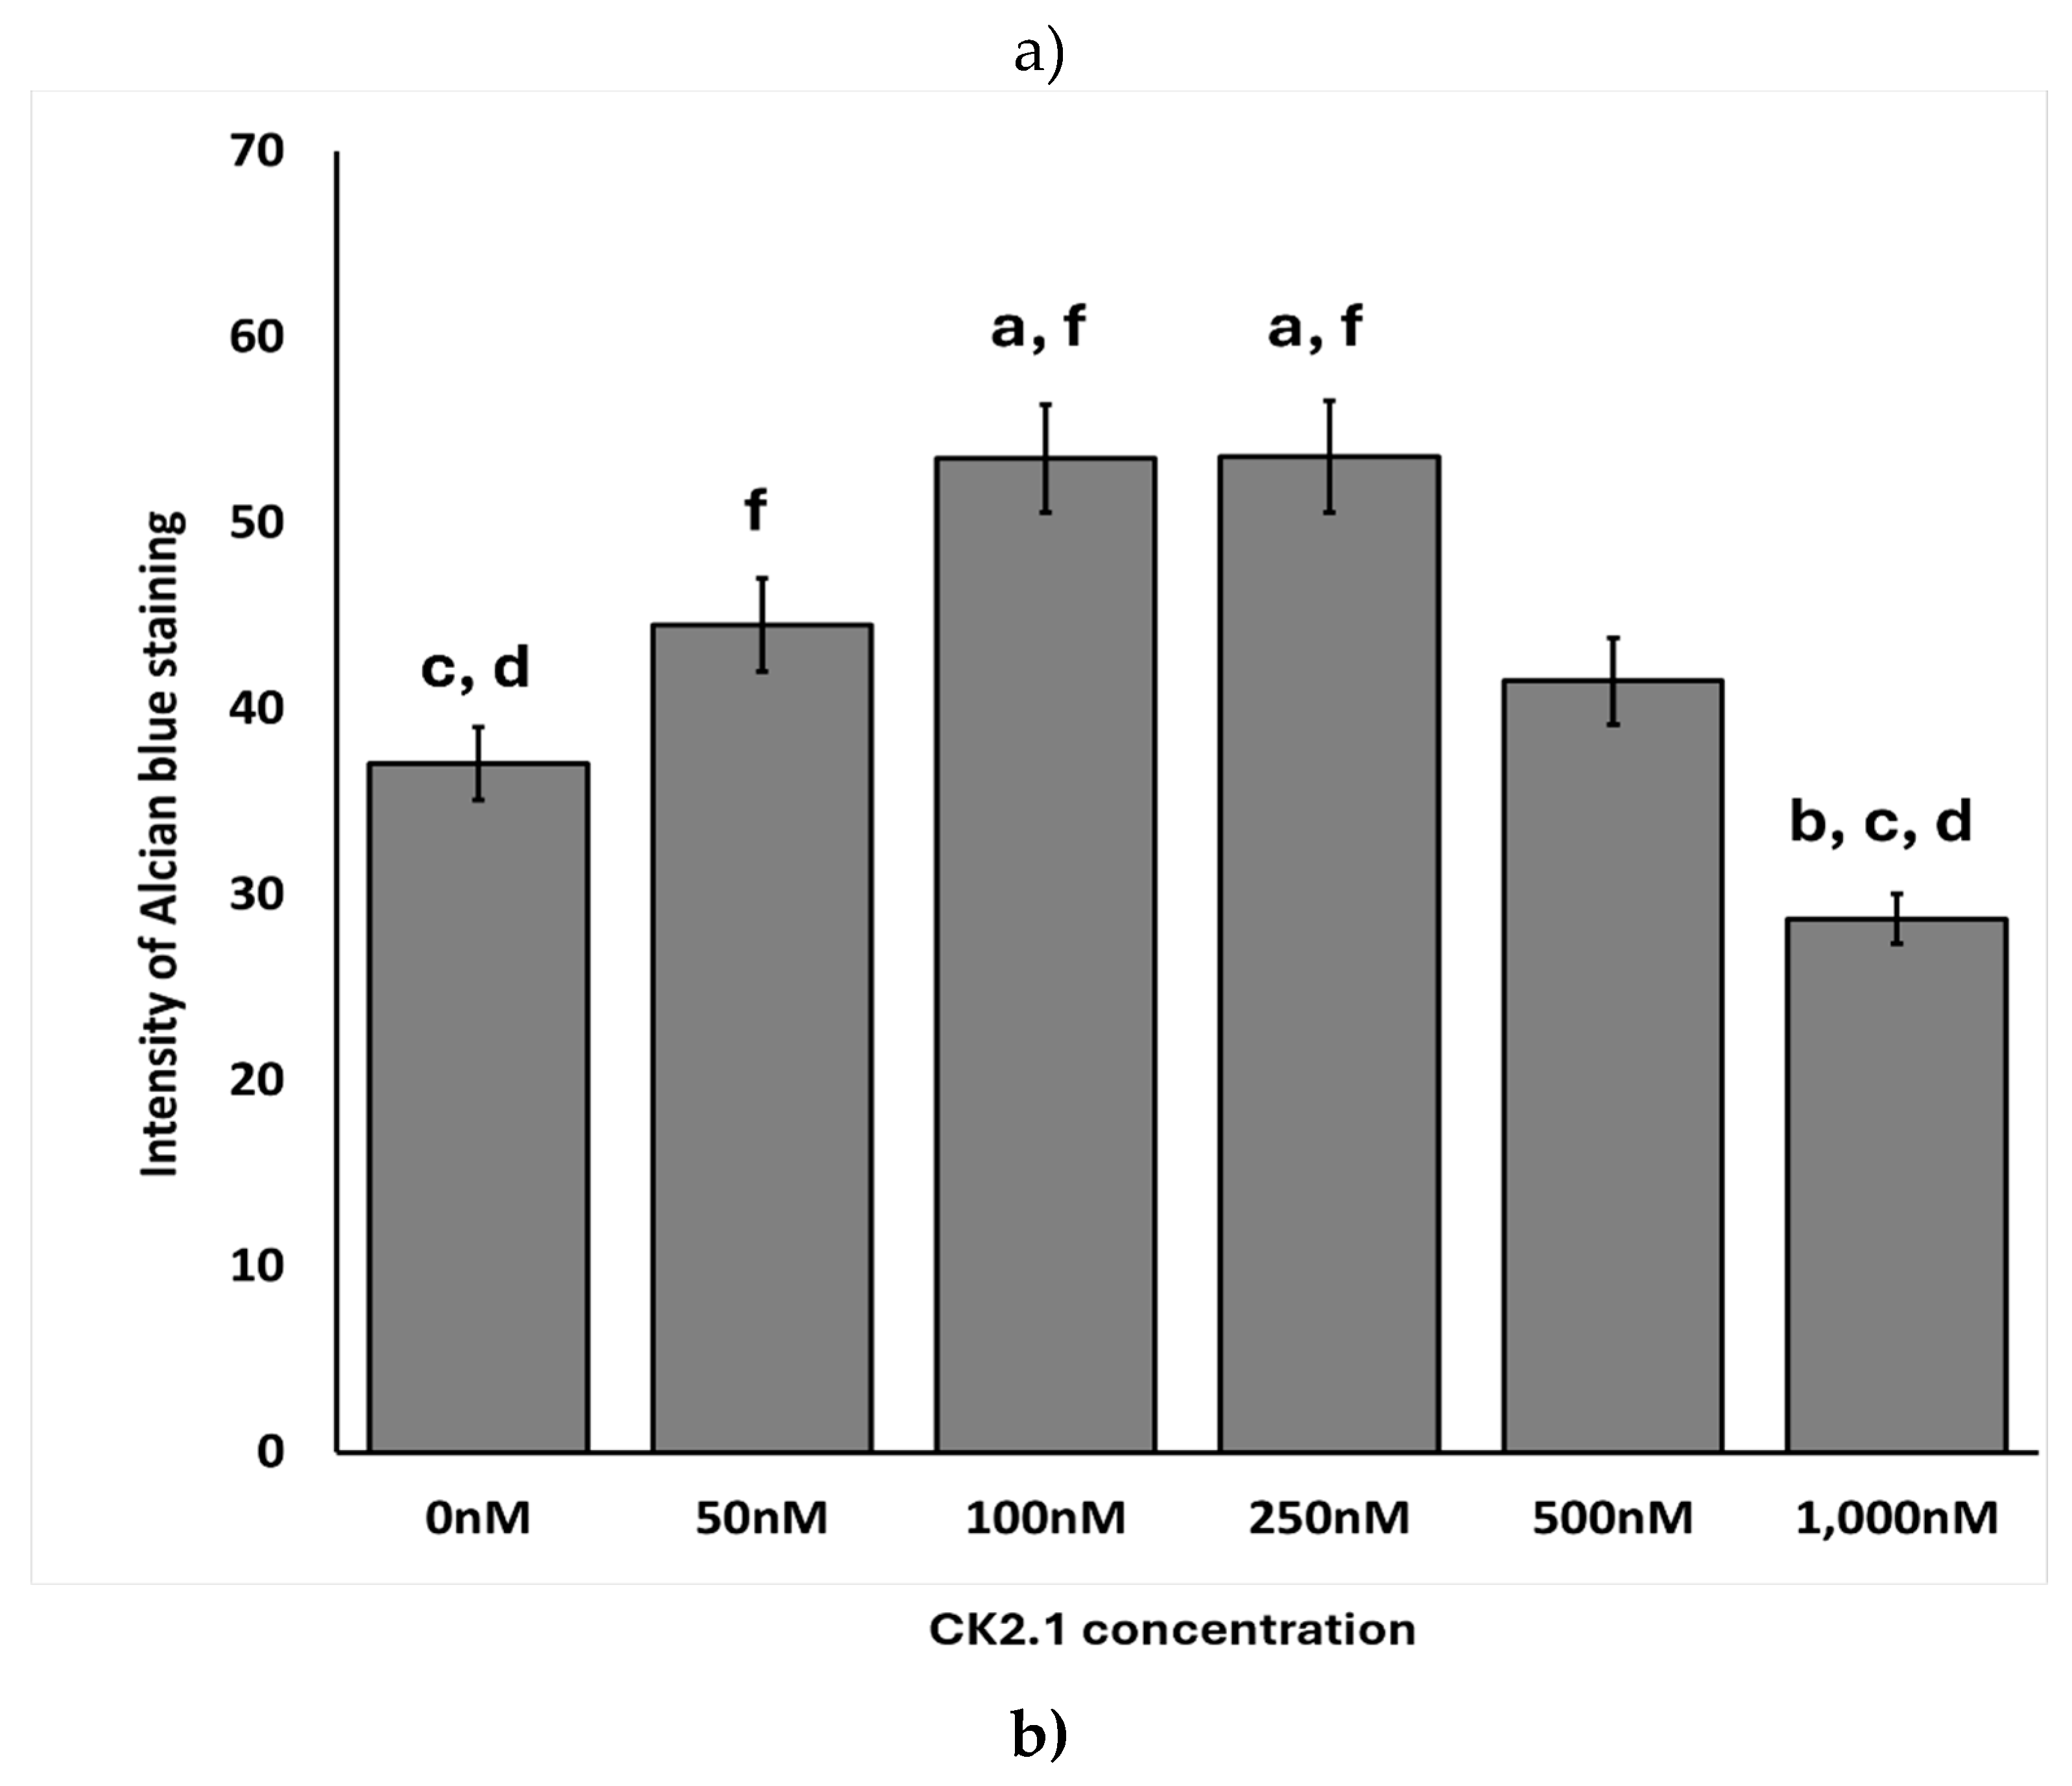
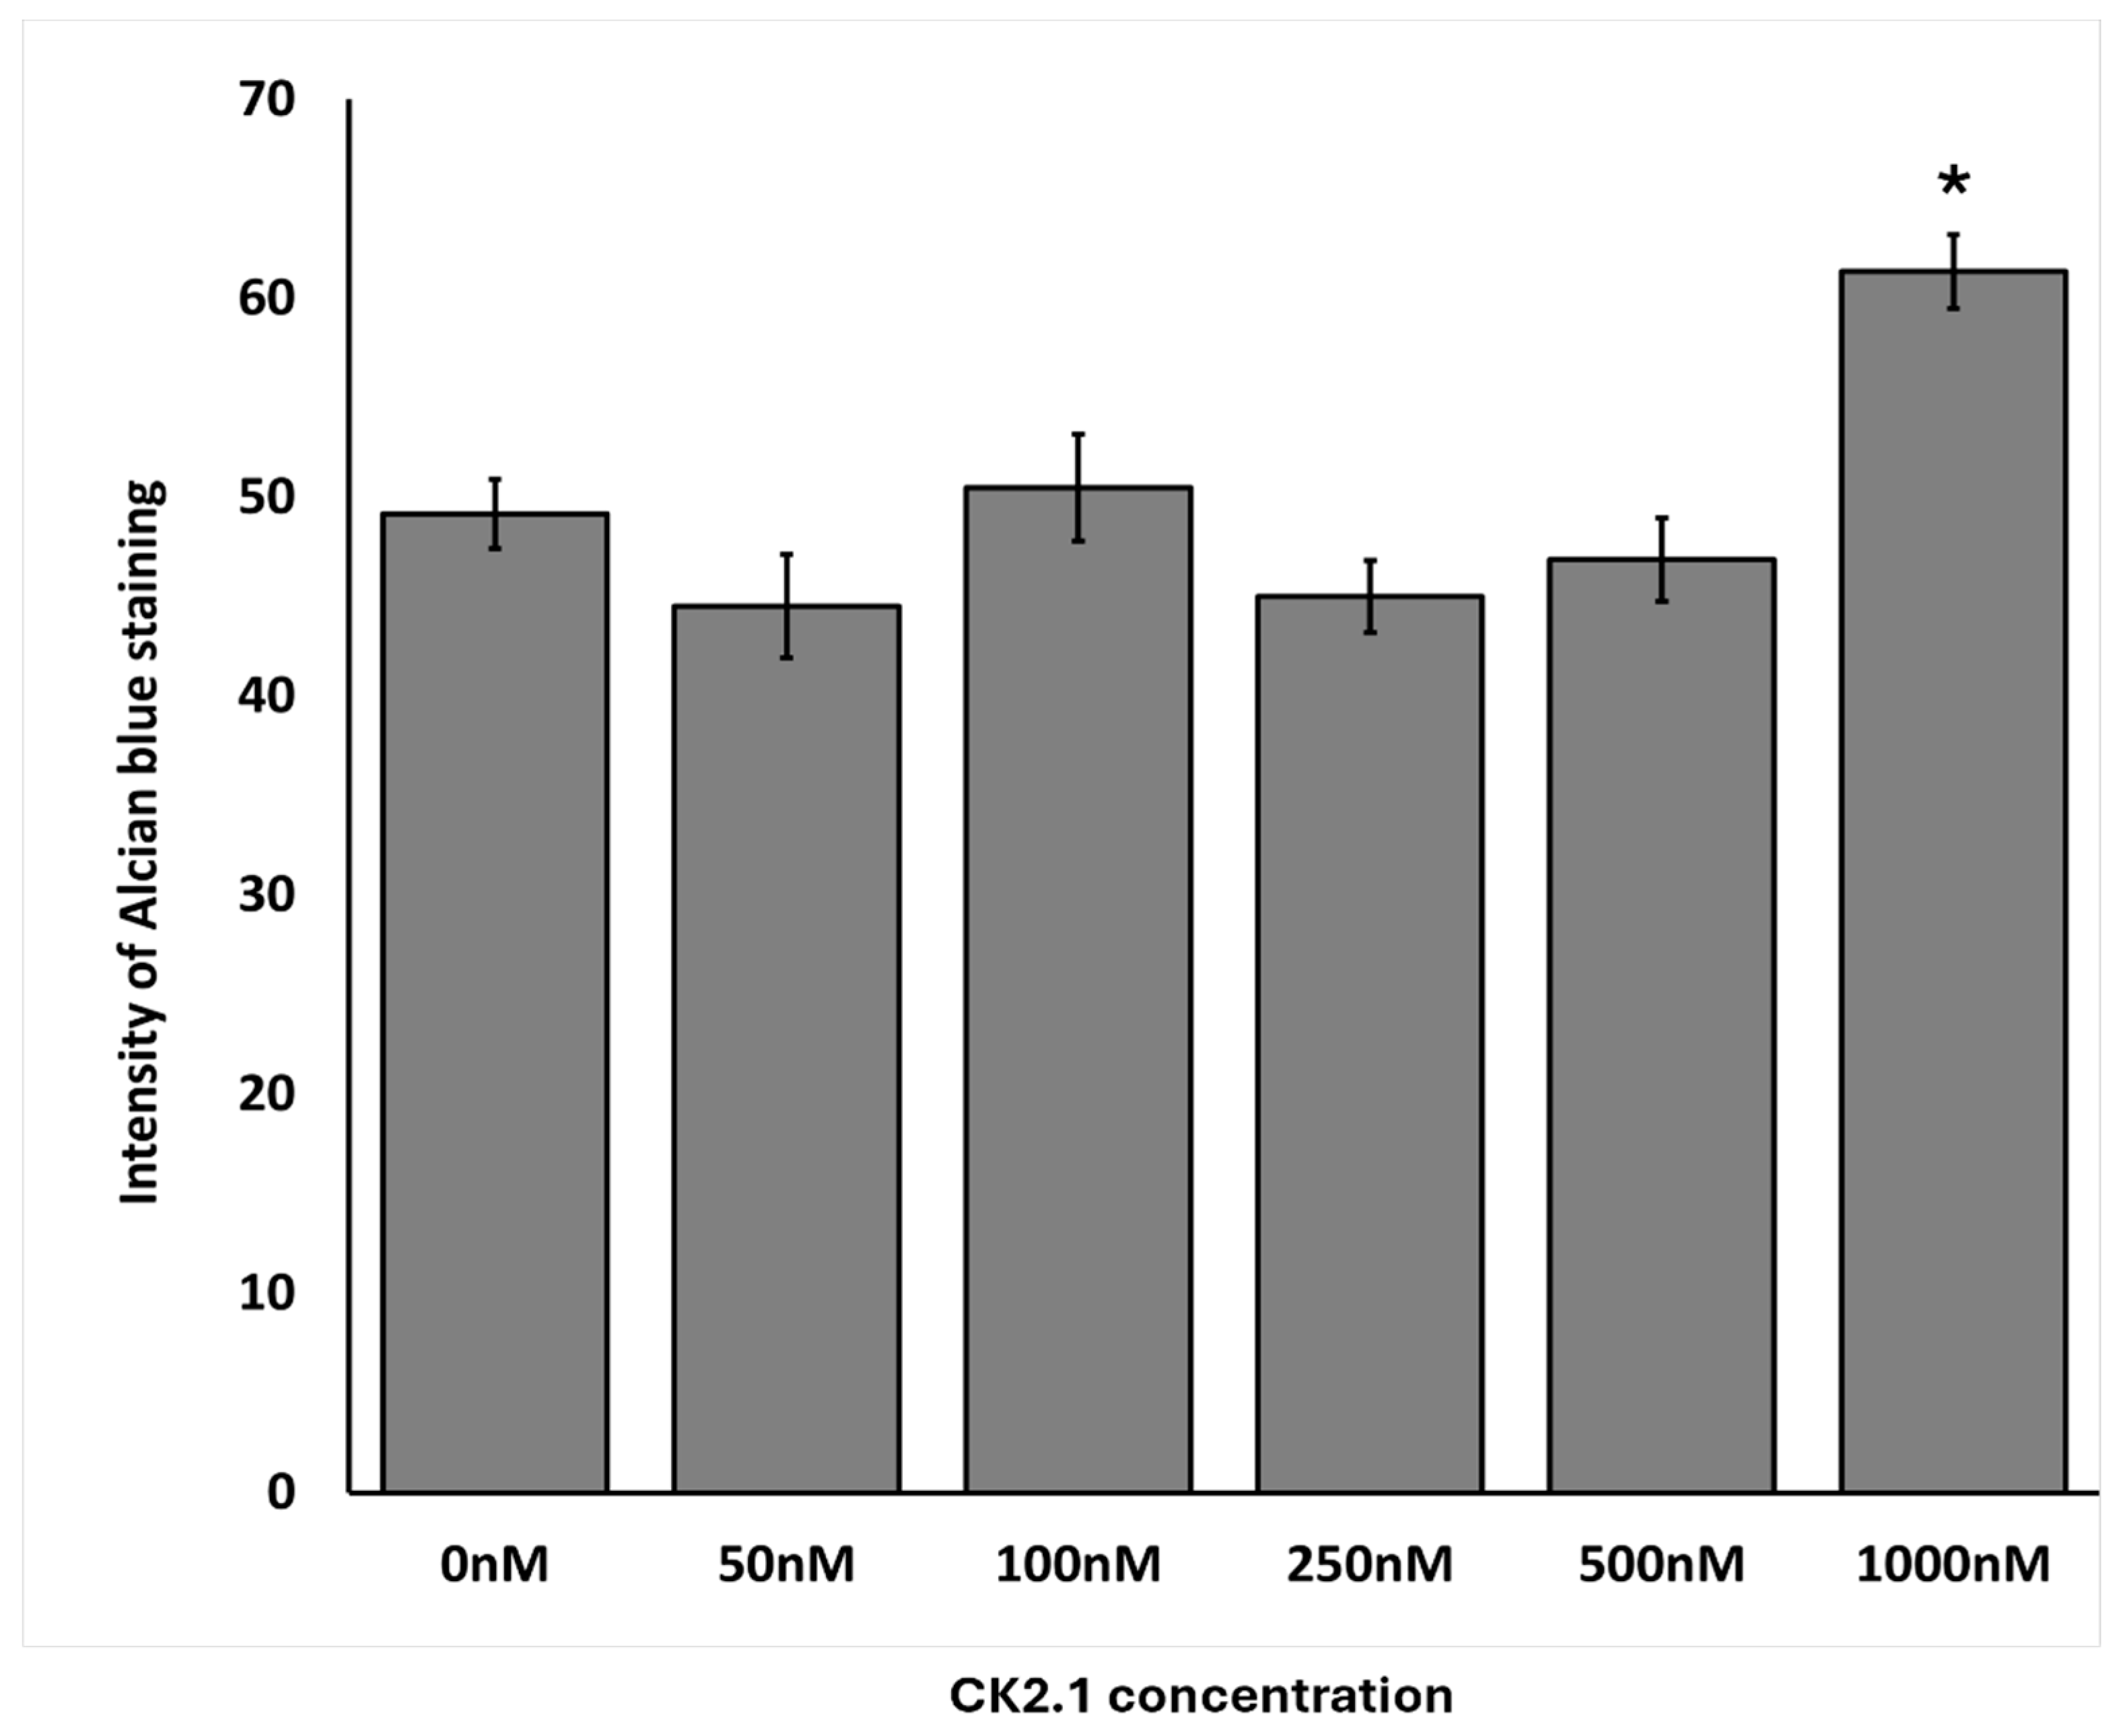
100nM and 250nM CK2.1 were the most effective concentrations of CK2.1 to induce proteoglycan synthesis in OA chondrocyte micromasses. At 1000nM, there was a significant drop in proteoglycan synthesis. In the comparison group, 1000nM CK2.1 increased proteoglycan synthesis significantly. At other concentrations, there was no statistically significant difference in proteoglycan synthesis compared to untreated micromasses.
Figure 5.
Effect of CK2.1 treatment on Alcian blue intensity at different concentrations on chondrocyte micromasses. a) Comparison of Alcian blue intensity of OA chondrocyte micromasses treated with a range of concentrations of CK2.1 (0nM, 50nM, 100nM, 250nM, 500nM, 1000nM). b) Comparison of Alcian blue intensity of comparison group micromasses treated with a range of concentrations of CK2.1. In the bar graphs in the figures, the letters denote group labels for comparing different concentrations of CK2.1 ranging from 0 nM to 1000 nM, designated a through f, respectively. The letters above each bar indicate statistically significant differences between the average intensity value of the concentration and those of the corresponding letter. For instance, for OA Alcian blue intensity, the 0 nM (“a”) concentration shows statistically significant differences from the 100 nM (“c”) and 250 nM (“d”) concentrations, while the 50 nM (“b”) concentration is statistically significantly different from the 1000 nM (“f”) concentration. An asterisk (*) indicates that the intensity value for the concentration is statistically significantly different from all other concentrations. Error bars represent the standard error of the mean. .
3.4. Proteoglycan Synthesis Was Independent of the Total Number of Cells Isolated
The mechanism by which CK2.1 increased proteoglycan synthesis on OA chondrocyte micromasses remains unknown. We determined whether proteoglycan synthesis was dependent on the total number of chondrocytes treated with CK2.1.
We analyzed the number of cells stained in the images. First, we counted the number of cells in each image. We then determined the average number of cells within the group of images for the same concentration of CK2.1. We calculated the standard error of the mean. We normalized the Alcian blue intensity to the value for untreated micromasses for OA chondrocytes and comparison group chondrocytes.
The intensity of Alcian blue did not correlate with the average number of cells in each treatment group in OA chondrocytes or the comparison group (Figure 6).
3.5. CK2.1 Induced Chondrogenesis in OA Chondrocytes but Not in Comparison Group Chondrocytes
Human ACCs express BMPRIa receptors [58]. The CK2.1 peptide disrupts the interaction between the intracellular domain of BMPRIa and CK2[52]. Thus, we hypothesized that the comparison group would respond similarly to OA chondrocytes.
Stimulation with 100nM and 250nM of CK2.1 resulted in the highest intensity of Alcian blue staining values for the OA samples. At the same time, stimulation with 1,000nM CK2.1 resulted in the lowest average intensity value, less than that of the unstimulated cells. This suggests that the efficacy of CK2.1 declines substantially at concentrations greater than 250nM, and higher concentrations. Proteoglycan synthesis at concentrations of 100nM and 250nM was significantly different from the unstimulated and 1,000nM concentrations. For the comparison group, the intensity of Alcian blue peaks at 1,000nM, the only concentration at which there is a significant increase. The highly variable levels of CK2.1 at other concentrations for the comparison group suggest that the effects of CK2.1 on chondrocytes from non-OA patients are limited and less consistent than the impact of the peptide in OA chondrocytes.
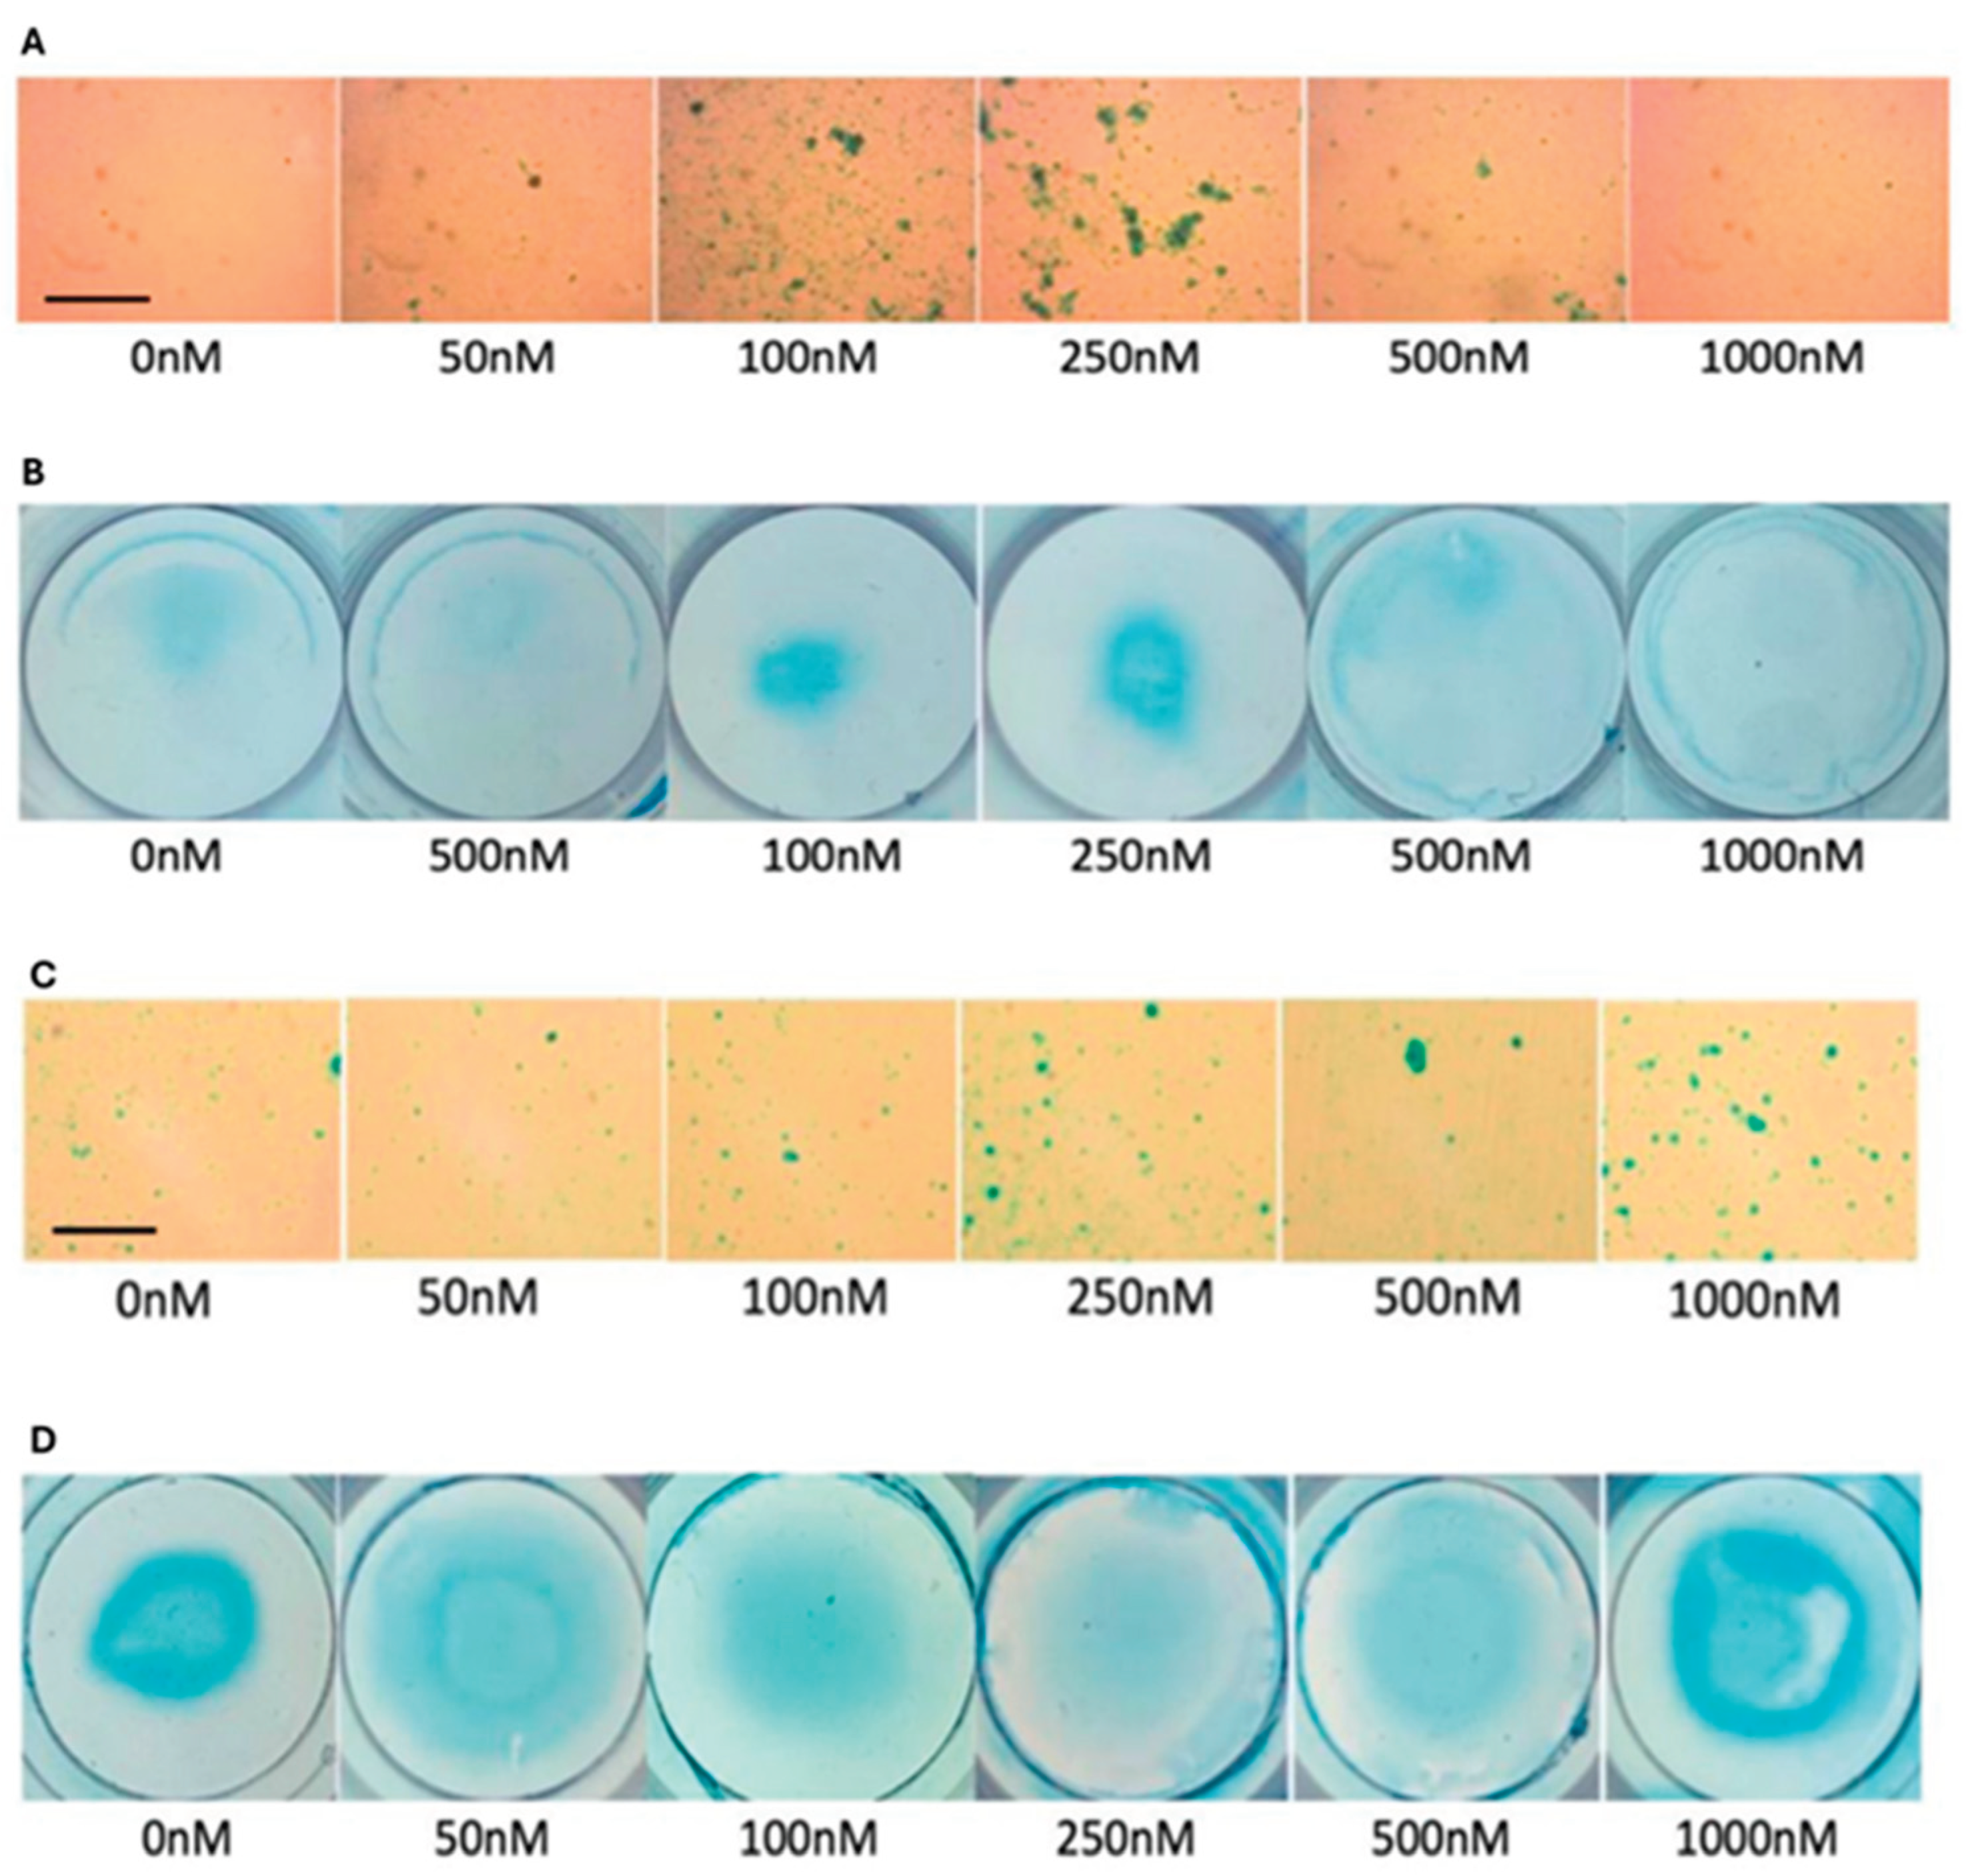
Representative images of micromasses of OA chondrocytes and comparison group demonstrate the differences in the effects of CK2.1 on OA chondrocytes (Figure 7, panels A and B) and comparison group (Figure 7, panels C and D). Additionally, we expected the intensity of Alcian blue to be uniform across the area of micromass. However, the staining pattern was ring-like. The periphery of the micro mass was stained more intensely (Figure 7, arrow) than the central region. This was consistent with OA chondrocyte micromasses and the comparison group.
4. Discussion
In our study, we evaluated the efficacy of CK2.1 to enhance proteoglycan synthesis in chondrocytes isolated from OA patients. CK2.1 induces the synthesis of proteoglycans in C3H10T1/2 cloned mouse cells[52]. There is an increase in proteoglycan levels and expression of markers of chondrogenesis, collagen type II and IX, in C3H10T1/2 treated with CK2.1[60,61]. The 100nM concentration of CK2.1 results in the maximum level of proteoglycan synthesis in these cells. Interestingly, CK2.1 treatment of C3H10T1/2 cells does not induce the expression of chondrocyte hypertrophy markers, such as collagen type X and MMP-13 [62]. CK2.1 is effective in restoring articular cartilage in vivo. The in vivo studies of CK2.1 utilized systemic and intra-articular injections in a destabilized medial meniscus (DMM) mouse model. Compared to mice injected with BMP-2, the CK2.1-injected mice exhibit upregulation of markers of healthy cartilage, such as cartilage types II and IX [52]. Notably, in the CK2.1-injected mice, collagen type X and MMP-13 downregulation are observed. These markers are indicators of chondrocyte hypertrophy and are well-documented in BMP-2 injections in articular cartilage [63,64,65].
In the present study, we conclude that the human OA chondrocytes are responsive to CK2.1. The optimal concentration of CK2.1 was determined to be 100nM or 200nM. The decline in proteoglycan synthesis at high concentrations should be analyzed further. The mechanism of increasing proteoglycan synthesis is not dependent on the number of chondrocytes. Further mechanistic studies are required to understand the molecular mechanism of the induction of proteoglycan synthesis. Comparison group chondrocytes are not responsive to lower concentrations of CK2.1. The selectivity of CK2.1 should be analyzed further. This may aid in the development of highly selective OA therapeutics. The micro-masses stained with Alcian blue show a ring-like pattern rather than uniform staining. The periphery of micromasses is stained more intensely. A more in-depth analysis of the staining pattern will help determine the optimal cell density for increasing proteoglycan synthesis in chondrocytes.
The small sample size and de-identification of patient data limit our current study. Patient pre-existing conditions and information on other treatments the patients have undergone were inaccessible. The histological scoring of the patient samples was not available; therefore, we did not include the stage of OA in our analysis. Another limitation of this study is that it necessitated the use of data obtained from osteoporosis patients as the comparison group. Samples from healthy individuals are rarely obtained from hip replacement surgery unless it is for a fracture.
Future studies are required to establish the utility of CK2.1 as an OA therapeutic. The molecular mechanism of CK2.1-mediated activation of chondrogenesis should be studied. The expression of chondrocyte hypertrophy markers in human OA chondrocytes should be analyzed. The proliferation of OA chondrocytes with CK2.1 treatment should be examined in greater detail. Finally, the differences in BMP pathway activation in OA chondrocytes and the comparison group should be established to understand the specificity of the drug.
Our findings establish that the human OA chondrocytes are specifically responsive to CK2.1. Suggested future directions will more comprehensively analyze the activation mechanism of chondrogenesis in OA chondrocytes. These studies will be fundamental to the development of targeted treatment of OA. Therapies designed based on these studies will help circumvent issues with the current state of OA management in affected individuals.
5. Conclusions
In our study, we tested the efficacy of CK2.1 as an OA therapeutic. We also identified optimal conditions for isolating human articular chondrocytes using collagenase type II digestion. The isolation of human articular chondrocytes by collagenase type II digestion was optimal at 48 hours, and single harvesting of chondrocytes was most effective. The average baseline proteoglycan levels in human OA chondrocytes were approximately 75% of those in the comparison group. The concentrations of 100nM and 250nM were the most effective concentrations of CK2.1 in increasing proteoglycan synthesis in OA chondrocytes. At a concentration of 1000 nM, there was a decline in proteoglycan synthesis compared to untreated micromasses. The mechanism of activation of proteoglycan synthesis was not dependent on the number of chondrocytes. In the comparison group, CK2.1 did not alter proteoglycan synthesis at lower concentrations. A significant increase in proteoglycan synthesis was only at a very high concentration of 1000nM. Thus, CK2.1 selectively affected OA chondrocytes by increasing proteoglycan synthesis.
Supplementary Materials
The following supporting information can be downloaded at the website of this paper posted on Preprints.org.
Author Contributions
Conceptualization, A.N., K.D.,D.H. and V.P.; methodology, A.N.; software, V.P. and K.D.; validation, A.N., V.P. and K.D.; formal analysis, K.D.; investigation, K.D,D.H.; re-sources, A.N.; data curation, V.P, K.D,D.H..; writing—original draft preparation, V.P; writ-ing—review and editing, A.N. V.P.; visualization, V.P.; supervision, A.N.; project administration, A.N.; funding acquisition, A.N. All authors have read and agreed to the published version of the manuscript.
Funding
This study was supported by the National Institute of Health Grant Program (R21AR076689) and the UD Summer Scholars program.
Institutional Review Board Statement
Not applicable
Data Availability Statement
The corresponding author can make any data or material supporting this study's findings available upon request.
Acknowledgments
The authors want to acknowledge our collaborators at ChristianaCare in Newark, DE, USA, and Wilmington, DE, USA. We thank Delaware Biotechnology Institute and the University of Delaware Department of Biological Sciences for equipment usage and resources during this study. Kelechi Chukwoucha and Tanim, Md Tamzid Hossain, for extensive manuscript review.
Conflicts of Interest
The authors declare no conflicts of interest
References
- Management of Osteoarthritis of the Knee (Non-Arthroplasty). 2022.
- Allen, K.D.; Thoma, L.M.; Golightly, Y.M. Epidemiology of osteoarthritis. Osteoarthritis Cartilage 2022, 30, 184–195. [Google Scholar] [CrossRef]
- Hawker, G.A. Osteoarthritis is a serious disease. Clin Exp Rheumatol 2019, 37 Suppl 120, 3–6. [Google Scholar]
- Hame, S.L.; Alexander, R.A. Knee osteoarthritis in women. Curr Rev Musculoskelet Med 2013, 6, 182–187. [Google Scholar] [CrossRef]
- Tschon, M.; Contartese, D.; Pagani, S.; Borsari, V.; Fini, M. Gender and Sex Are Key Determinants in Osteoarthritis Not Only Confounding Variables. A Systematic Review of Clinical Data. J Clin Med 2021, 10. [Google Scholar] [CrossRef] [PubMed]
- Abramoff, B.; Caldera, F.E. Osteoarthritis: Pathology, Diagnosis, and Treatment Options. Med Clin North Am 2020, 104, 293–311. [Google Scholar] [CrossRef]
- Zhang, W.; Moskowitz, R.W.; Nuki, G.; Abramson, S.; Altman, R.D.; Arden, N.; Bierma-Zeinstra, S.; Brandt, K.D.; Croft, P.; Doherty, M.; et al. OARSI recommendations for the management of hip and knee osteoarthritis, Part II: OARSI evidence-based, expert consensus guidelines. Osteoarthritis Cartilage 2008, 16, 137–162. [Google Scholar] [CrossRef]
- Hussain, S.M.; Neilly, D.W.; Baliga, S.; Patil, S.; Meek, R. Knee osteoarthritis: a review of management options. Scott Med J 2016, 61, 7–16. [Google Scholar] [CrossRef] [PubMed]
- Concoff, A.; Sancheti, P.; Niazi, F.; Shaw, P.; Rosen, J. The efficacy of multiple versus single hyaluronic acid injections: a systematic review and meta-analysis. BMC Musculoskelet Disord 2017, 18, 542. [Google Scholar] [CrossRef] [PubMed]
- Charlier, E.; Deroyer, C.; Ciregia, F.; Malaise, O.; Neuville, S.; Plener, Z.; Malaise, M.; de Seny, D. Chondrocyte dedifferentiation and osteoarthritis (OA). Biochem Pharmacol 2019, 165, 49–65. [Google Scholar] [CrossRef]
- Akkiraju, H.; Nohe, A. Role of Chondrocytes in Cartilage Formation, Progression of Osteoarthritis and Cartilage Regeneration. J Dev Biol 2015, 3, 177–192. [Google Scholar] [CrossRef]
- Carballo, C.B.; Nakagawa, Y.; Sekiya, I.; Rodeo, S.A. Basic Science of Articular Cartilage. Clin Sports Med 2017, 36, 413–425. [Google Scholar] [CrossRef]
- Weaver, C.M.; Gordon, C.M.; Janz, K.F.; Kalkwarf, H.J.; Lappe, J.M.; Lewis, R.; O'Karma, M.; Wallace, T.C.; Zemel, B.S. The National Osteoporosis Foundation's position statement on peak bone mass development and lifestyle factors: a systematic review and implementation recommendations. Osteoporos Int 2016, 27, 1281–1386. [Google Scholar] [CrossRef]
- Palazzo, C.; Nguyen, C.; Lefevre-Colau, M.M.; Rannou, F.; Poiraudeau, S. Risk factors and burden of osteoarthritis. Ann Phys Rehabil Med 2016, 59, 134–138. [Google Scholar] [CrossRef]
- Baker, N.A.; Barbour, K.E.; Helmick, C.G.; Zack, M.M.; Al Snih, S. Associations Between Arthritis and Change in Physical Function in U.S. Retirees. J Gerontol A Biol Sci Med Sci 2017, 72, 127–133. [Google Scholar] [CrossRef] [PubMed]
- Veronese, N.; Cooper, C.; Reginster, J.Y.; Hochberg, M.; Branco, J.; Bruyère, O.; Chapurlat, R.; Al-Daghri, N.; Dennison, E.; Herrero-Beaumont, G.; et al. Type 2 diabetes mellitus and osteoarthritis. Semin Arthritis Rheum 2019, 49, 9–19. [Google Scholar] [CrossRef]
- Kotlarz, H.; Gunnarsson, C.L.; Fang, H.; Rizzo, J.A. Insurer and out-of-pocket costs of osteoarthritis in the US: evidence from national survey data. Arthritis Rheum 2009, 60, 3546–3553. [Google Scholar] [CrossRef] [PubMed]
- Rodriguez-Merchan, E.C. The Current Role of Disease-modifying Osteoarthritis Drugs. Arch Bone Jt Surg 2023, 11, 11–22. [Google Scholar] [CrossRef] [PubMed]
- Zhai, G. Clinical relevance of biochemical and metabolic changes in osteoarthritis. Adv Clin Chem 2021, 101, 95–120. [Google Scholar] [CrossRef]
- Wojdasiewicz, P.; Poniatowski Ł, A.; Szukiewicz, D. The role of inflammatory and anti-inflammatory cytokines in the pathogenesis of osteoarthritis. Mediators Inflamm 2014, 2014, 561459. [Google Scholar] [CrossRef]
- Horváth, E.; Sólyom, Á.; Székely, J.; Nagy, E.E.; Popoviciu, H. Inflammatory and Metabolic Signaling Interfaces of the Hypertrophic and Senescent Chondrocyte Phenotypes Associated with Osteoarthritis. Int J Mol Sci 2023, 24. [Google Scholar] [CrossRef]
- Bharadwaj, U.; Kasembeli, M.M.; Robinson, P.; Tweardy, D.J. Targeting Janus Kinases and Signal Transducer and Activator of Transcription 3 to Treat Inflammation, Fibrosis, and Cancer: Rationale, Progress, and Caution. Pharmacol Rev 2020, 72, 486–526. [Google Scholar] [CrossRef] [PubMed]
- Ding, L.; Hong, X.; Sun, B.; Huang, Q.; Wang, X.; Liu, X.; Li, L.; Huang, Z.; Liu, D. IL-37 is associated with osteoarthritis disease activity and suppresses proinflammatory cytokines production in synovial cells. Scientific Reports 2017, 7, 11601. [Google Scholar] [CrossRef]
- Bouhaddou, M.; Memon, D.; Meyer, B.; White, K.M.; Rezelj, V.V.; Correa Marrero, M.; Polacco, B.J.; Melnyk, J.E.; Ulferts, S.; Kaake, R.M.; et al. The Global Phosphorylation Landscape of SARS-CoV-2 Infection. Cell 2020, 182, 685–712.e619. [Google Scholar] [CrossRef]
- Ji, B.; Ma, Y.; Wang, H.; Fang, X.; Shi, P. Activation of the P38/CREB/MMP13 axis is associated with osteoarthritis. Drug Des Devel Ther 2019, 13, 2195–2204. [Google Scholar] [CrossRef]
- Youn, I.; Choi, J.B.; Cao, L.; Setton, L.A.; Guilak, F. Zonal variations in the three-dimensional morphology of the chondron measured in situ using confocal microscopy. Osteoarthritis Cartilage 2006, 14, 889–897. [Google Scholar] [CrossRef] [PubMed]
- Jay, G.D.; Waller, K.A. The biology of lubricin: near frictionless joint motion. Matrix Biol 2014, 39, 17–24. [Google Scholar] [CrossRef] [PubMed]
- Komori, T. Molecular Processes in Chondrocyte Biology. Int J Mol Sci 2020, 21. [Google Scholar] [CrossRef]
- Zhu, M.; Zhong, W.; Cao, W.; Zhang, Q.; Wu, G. Chondroinductive/chondroconductive peptides and their-functionalized biomaterials for cartilage tissue engineering. Bioact Mater 2022, 9, 221–238. [Google Scholar] [CrossRef]
- Nazempour, A.; Van Wie, B.J. Chondrocytes, Mesenchymal Stem Cells, and Their Combination in Articular Cartilage Regenerative Medicine. Ann Biomed Eng 2016, 44, 1325–1354. [Google Scholar] [CrossRef]
- Yang, Y. Skeletal morphogenesis during embryonic development. Crit Rev Eukaryot Gene Expr 2009, 19, 197–218. [Google Scholar] [CrossRef]
- Occhetta, P.; Pigeot, S.; Rasponi, M.; Dasen, B.; Mehrkens, A.; Ullrich, T.; Kramer, I.; Guth-Gundel, S.; Barbero, A.; Martin, I. Developmentally inspired programming of adult human mesenchymal stromal cells toward stable chondrogenesis. Proc Natl Acad Sci U S A 2018, 115, 4625–4630. [Google Scholar] [CrossRef]
- Fortier, L.A.; Barker, J.U.; Strauss, E.J.; McCarrel, T.M.; Cole, B.J. The role of growth factors in cartilage repair. Clin Orthop Relat Res 2011, 469, 2706–2715. [Google Scholar] [CrossRef]
- Chen, G.; Deng, C.; Li, Y.P. TGF-β and BMP signaling in osteoblast differentiation and bone formation. Int J Biol Sci 2012, 8, 272–288. [Google Scholar] [CrossRef]
- Chen, H.; Tan, X.N.; Hu, S.; Liu, R.Q.; Peng, L.H.; Li, Y.M.; Wu, P. Molecular Mechanisms of Chondrocyte Proliferation and Differentiation. Front Cell Dev Biol 2021, 9, 664168. [Google Scholar] [CrossRef]
- Hogan, B.L. Bone morphogenetic proteins in development. Curr Opin Genet Dev 1996, 6, 432–438. [Google Scholar] [CrossRef] [PubMed]
- Chen, M.; Jiang, Z.; Zou, X.; You, X.; Cai, Z.; Huang, J. Advancements in tissue engineering for articular cartilage regeneration. Heliyon 2024, 10, e25400. [Google Scholar] [CrossRef] [PubMed]
- Gamer, L.W.; Pregizer, S.; Gamer, J.; Feigenson, M.; Ionescu, A.; Li, Q.; Han, L.; Rosen, V. The Role of Bmp2 in the Maturation and Maintenance of the Murine Knee Joint. J Bone Miner Res 2018, 33, 1708–1717. [Google Scholar] [CrossRef]
- Rosen, V. BMP2 signaling in bone development and repair. Cytokine Growth Factor Rev 2009, 20, 475–480. [Google Scholar] [CrossRef] [PubMed]
- Bonor, J.; Adams, E.L.; Bragdon, B.; Moseychuk, O.; Czymmek, K.J.; Nohe, A. Initiation of BMP2 signaling in domains on the plasma membrane. J Cell Physiol 2012, 227, 2880–2888. [Google Scholar] [CrossRef]
- Rountree, R.B.; Schoor, M.; Chen, H.; Marks, M.E.; Harley, V.; Mishina, Y.; Kingsley, D.M. BMP receptor signaling is required for postnatal maintenance of articular cartilage. PLoS Biol 2004, 2, e355. [Google Scholar] [CrossRef]
- Jing, J.; Ren, Y.; Zong, Z.; Liu, C.; Kamiya, N.; Mishina, Y.; Liu, Y.; Zhou, X.; Feng, J.Q. BMP receptor 1A determines the cell fate of the postnatal growth plate. Int J Biol Sci 2013, 9, 895–906. [Google Scholar] [CrossRef] [PubMed]
- Nohe, A.; Hassel, S.; Ehrlich, M.; Neubauer, F.; Sebald, W.; Henis, Y.I.; Knaus, P. The mode of bone morphogenetic protein (BMP) receptor oligomerization determines different BMP-2 signaling pathways. J Biol Chem 2002, 277, 5330–5338. [Google Scholar] [CrossRef]
- Nohe, A.; Keating, E.; Underhill, T.M.; Knaus, P.; Petersen, N.O. Effect of the distribution and clustering of the type I A BMP receptor (ALK3) with the type II BMP receptor on the activation of signalling pathways. J Cell Sci 2003, 116, 3277–3284. [Google Scholar] [CrossRef]
- Moseychuk, O.; Akkiraju, H.; Dutta, J.; D'Angelo, A.; Bragdon, B.; Duncan, R.L.; Nohe, A. Inhibition of CK2 binding to BMPRIa induces C2C12 differentiation into osteoblasts and adipocytes. 2013, 7, 265–278. [CrossRef]
- Bragdon, B.; Thinakaran, S.; Moseychuk, O.; Gurski, L.; Bonor, J.; Price, C.; Wang, L.; Beamer, W.G.; Nohe, A. Casein kinase 2 regulates in vivo bone formation through its interaction with bone morphogenetic protein receptor type Ia. Bone 49, 944-954, doi:S8756-3282(11)01078-7. [CrossRef]
- Bragdon, B.; Thinakaran, S.; Moseychuk, O.; King, D.; Young, K.; Litchfield, D.W.; Petersen, N.O.; Nohe, A. Casein kinase 2 beta-subunit is a regulator of bone morphogenetic protein 2 signaling. Biophys J 99, 897-904.
- Kovermann, N.J.; Basoli, V.; Della Bella, E.; Alini, M.; Lischer, C.; Schmal, H.; Kubosch, E.J.; Stoddart, M.J. BMP2 and TGF-β Cooperate Differently during Synovial-Derived Stem-Cell Chondrogenesis in a Dexamethasone-Dependent Manner. Cells 2019, 8. [Google Scholar] [CrossRef]
- Carragee, E.J.; Hurwitz, E.L.; Weiner, B.K. A critical review of recombinant human bone morphogenetic protein-2 trials in spinal surgery: emerging safety concerns and lessons learned. Spine J 2011, 11, 471–491. [Google Scholar] [CrossRef]
- Bragdon, B.; Thinakaran, S.; Moseychuk, O.; King, D.; Young, K.; Litchfield, W., David; Petersen, N.O.; Nohe, A. Casein Kinase 2 β-Subunit Is a Regulator of Bone Morphogenetic Protein 2 Signaling. Biophysical Journal 2010, 99, 897–904. [Google Scholar] [CrossRef]
- Akkiraju, H.; Srinivasan, P.P.; Xu, X.; Jia, X.; Safran, C.B.K.; Nohe, A. CK2.1, a bone morphogenetic protein receptor type Ia mimetic peptide, repairs cartilage in mice with destabilized medial meniscus. Stem cell research & therapy 2017, 8, 82–82. [Google Scholar] [CrossRef]
- Akkiraju, H.; Bonor, J.; Nohe, A. CK2.1, a novel peptide, induces articular cartilage formation in vivo. J Orthop Res 2016. [Google Scholar] [CrossRef]
- Kugimiya, F.; Kawaguchi, H.; Kamekura, S.; Chikuda, H.; Ohba, S.; Yano, F.; Ogata, N.; Katagiri, T.; Harada, Y.; Azuma, Y.; et al. Involvement of endogenous bone morphogenetic protein (BMP) 2 and BMP6 in bone formation. J Biol Chem 2005, 280, 35704–35712. [Google Scholar] [CrossRef] [PubMed]
- Kumar, P.; Sen, R.K.; Aggarwal, S.; Jindal, K. Common hip conditions requiring primary total hip arthroplasty and comparison of their post-operative functional outcomes. J Clin Orthop Trauma 2020, 11, S192–s195. [Google Scholar] [CrossRef]
- Redman, S.N.; Dowthwaite, G.P.; Thomson, B.M.; Archer, C.W. The cellular responses of articular cartilage to sharp and blunt trauma. Osteoarthritis Cartilage 2004, 12, 106–116. [Google Scholar] [CrossRef]
- Takács, R.; Juhász, T.; Katona, É.; Somogyi, C.; Vágó, J.; Hajdú, T.; Barna, K.B.; Nagy, P.; Zákány, R.; Matta, C. Isolation and Micromass Culturing of Primary Chicken Chondroprogenitor Cells for Cartilage Regeneration. Curr Protoc 2023, 3, e835. [Google Scholar] [CrossRef]
- Akkiraju, H.; Bonor, J.; Nohe, A. CK2.1, a novel peptide, induces articular cartilage formation in vivo. J Orthop Res 2017, 35, 876–885. [Google Scholar] [CrossRef]
- Chen, A.L.; Fang, C.; Liu, C.; Leslie, M.P.; Chang, E.; Di Cesare, P.E. Expression of bone morphogenetic proteins, receptors, and tissue inhibitors in human fetal, adult, and osteoarthritic articular cartilage. J Orthop Res 2004, 22, 1188–1192. [Google Scholar] [CrossRef] [PubMed]
- Elahi, S.A.; Castro-Viñuelas, R.; Tanska, P.; Korhonen, R.K.; Lories, R.; Famaey, N.; Jonkers, I. Contribution of collagen degradation and proteoglycan depletion to cartilage degeneration in primary and secondary osteoarthritis: an <em>in silico</em> study. Osteoarthritis and Cartilage 2023, 31, 741–752. [Google Scholar] [CrossRef] [PubMed]
- Yao, Q.; Wu, X.; Tao, C.; Gong, W.; Chen, M.; Qu, M.; Zhong, Y.; He, T.; Chen, S.; Xiao, G. Osteoarthritis: pathogenic signaling pathways and therapeutic targets. Signal Transduct Target Ther 2023, 8, 56. [Google Scholar] [CrossRef] [PubMed]
- Yoshioka, N.K.; Young, G.M.; Khajuria, D.K.; Karuppagounder, V.; Pinamont, W.J.; Fanburg-Smith, J.C.; Abraham, T.; Elbarbary, R.A.; Kamal, F. Structural changes in the collagen network of joint tissues in late stages of murine OA. Sci Rep 2022, 12, 9159. [Google Scholar] [CrossRef]
- Dreier, R. Hypertrophic differentiation of chondrocytes in osteoarthritis: the developmental aspect of degenerative joint disorders. Arthritis Res Ther 2010, 12, 216. [Google Scholar] [CrossRef] [PubMed]
- Zhou, N.; Li, Q.; Lin, X.; Hu, N.; Liao, J.Y.; Lin, L.B.; Zhao, C.; Hu, Z.M.; Liang, X.; Xu, W.; et al. BMP2 induces chondrogenic differentiation, osteogenic differentiation and endochondral ossification in stem cells. Cell Tissue Res 2016, 366, 101–111. [Google Scholar] [CrossRef]
- Mang, T.; Kleinschmidt-Doerr, K.; Ploeger, F.; Schoenemann, A.; Lindemann, S.; Gigout, A. BMPR1A is necessary for chondrogenesis and osteogenesis, whereas BMPR1B prevents hypertrophic differentiation. Journal of Cell Science 2020, 133, jcs246934. [Google Scholar] [CrossRef]
- Singh, P.; Marcu, K.B.; Goldring, M.B.; Otero, M. Phenotypic instability of chondrocytes in osteoarthritis: on a path to hypertrophy. Ann N Y Acad Sci 2019, 1442, 17–34. [Google Scholar] [CrossRef] [PubMed]
Figure 1.
Activation of BMP signaling by BMP2 ligand. When not activated by the BMP2 ligand, the cytoplasmic domain of the BMPRIa receptor is associated with a pleiotropic kinase CK2. Upon binding with the BMP2 ligand, the BMPRIa receptor undergoes heterodimerization with BMPRII. The BMPRII receptor is a constitutively active kinase that phosphorylates BMPRIa. This interaction of the BMP2 ligand with the BMPRIa-BMPRII complex leads to the release of CK2 and activation of the BMP pathway. (Created with Biorender.com).
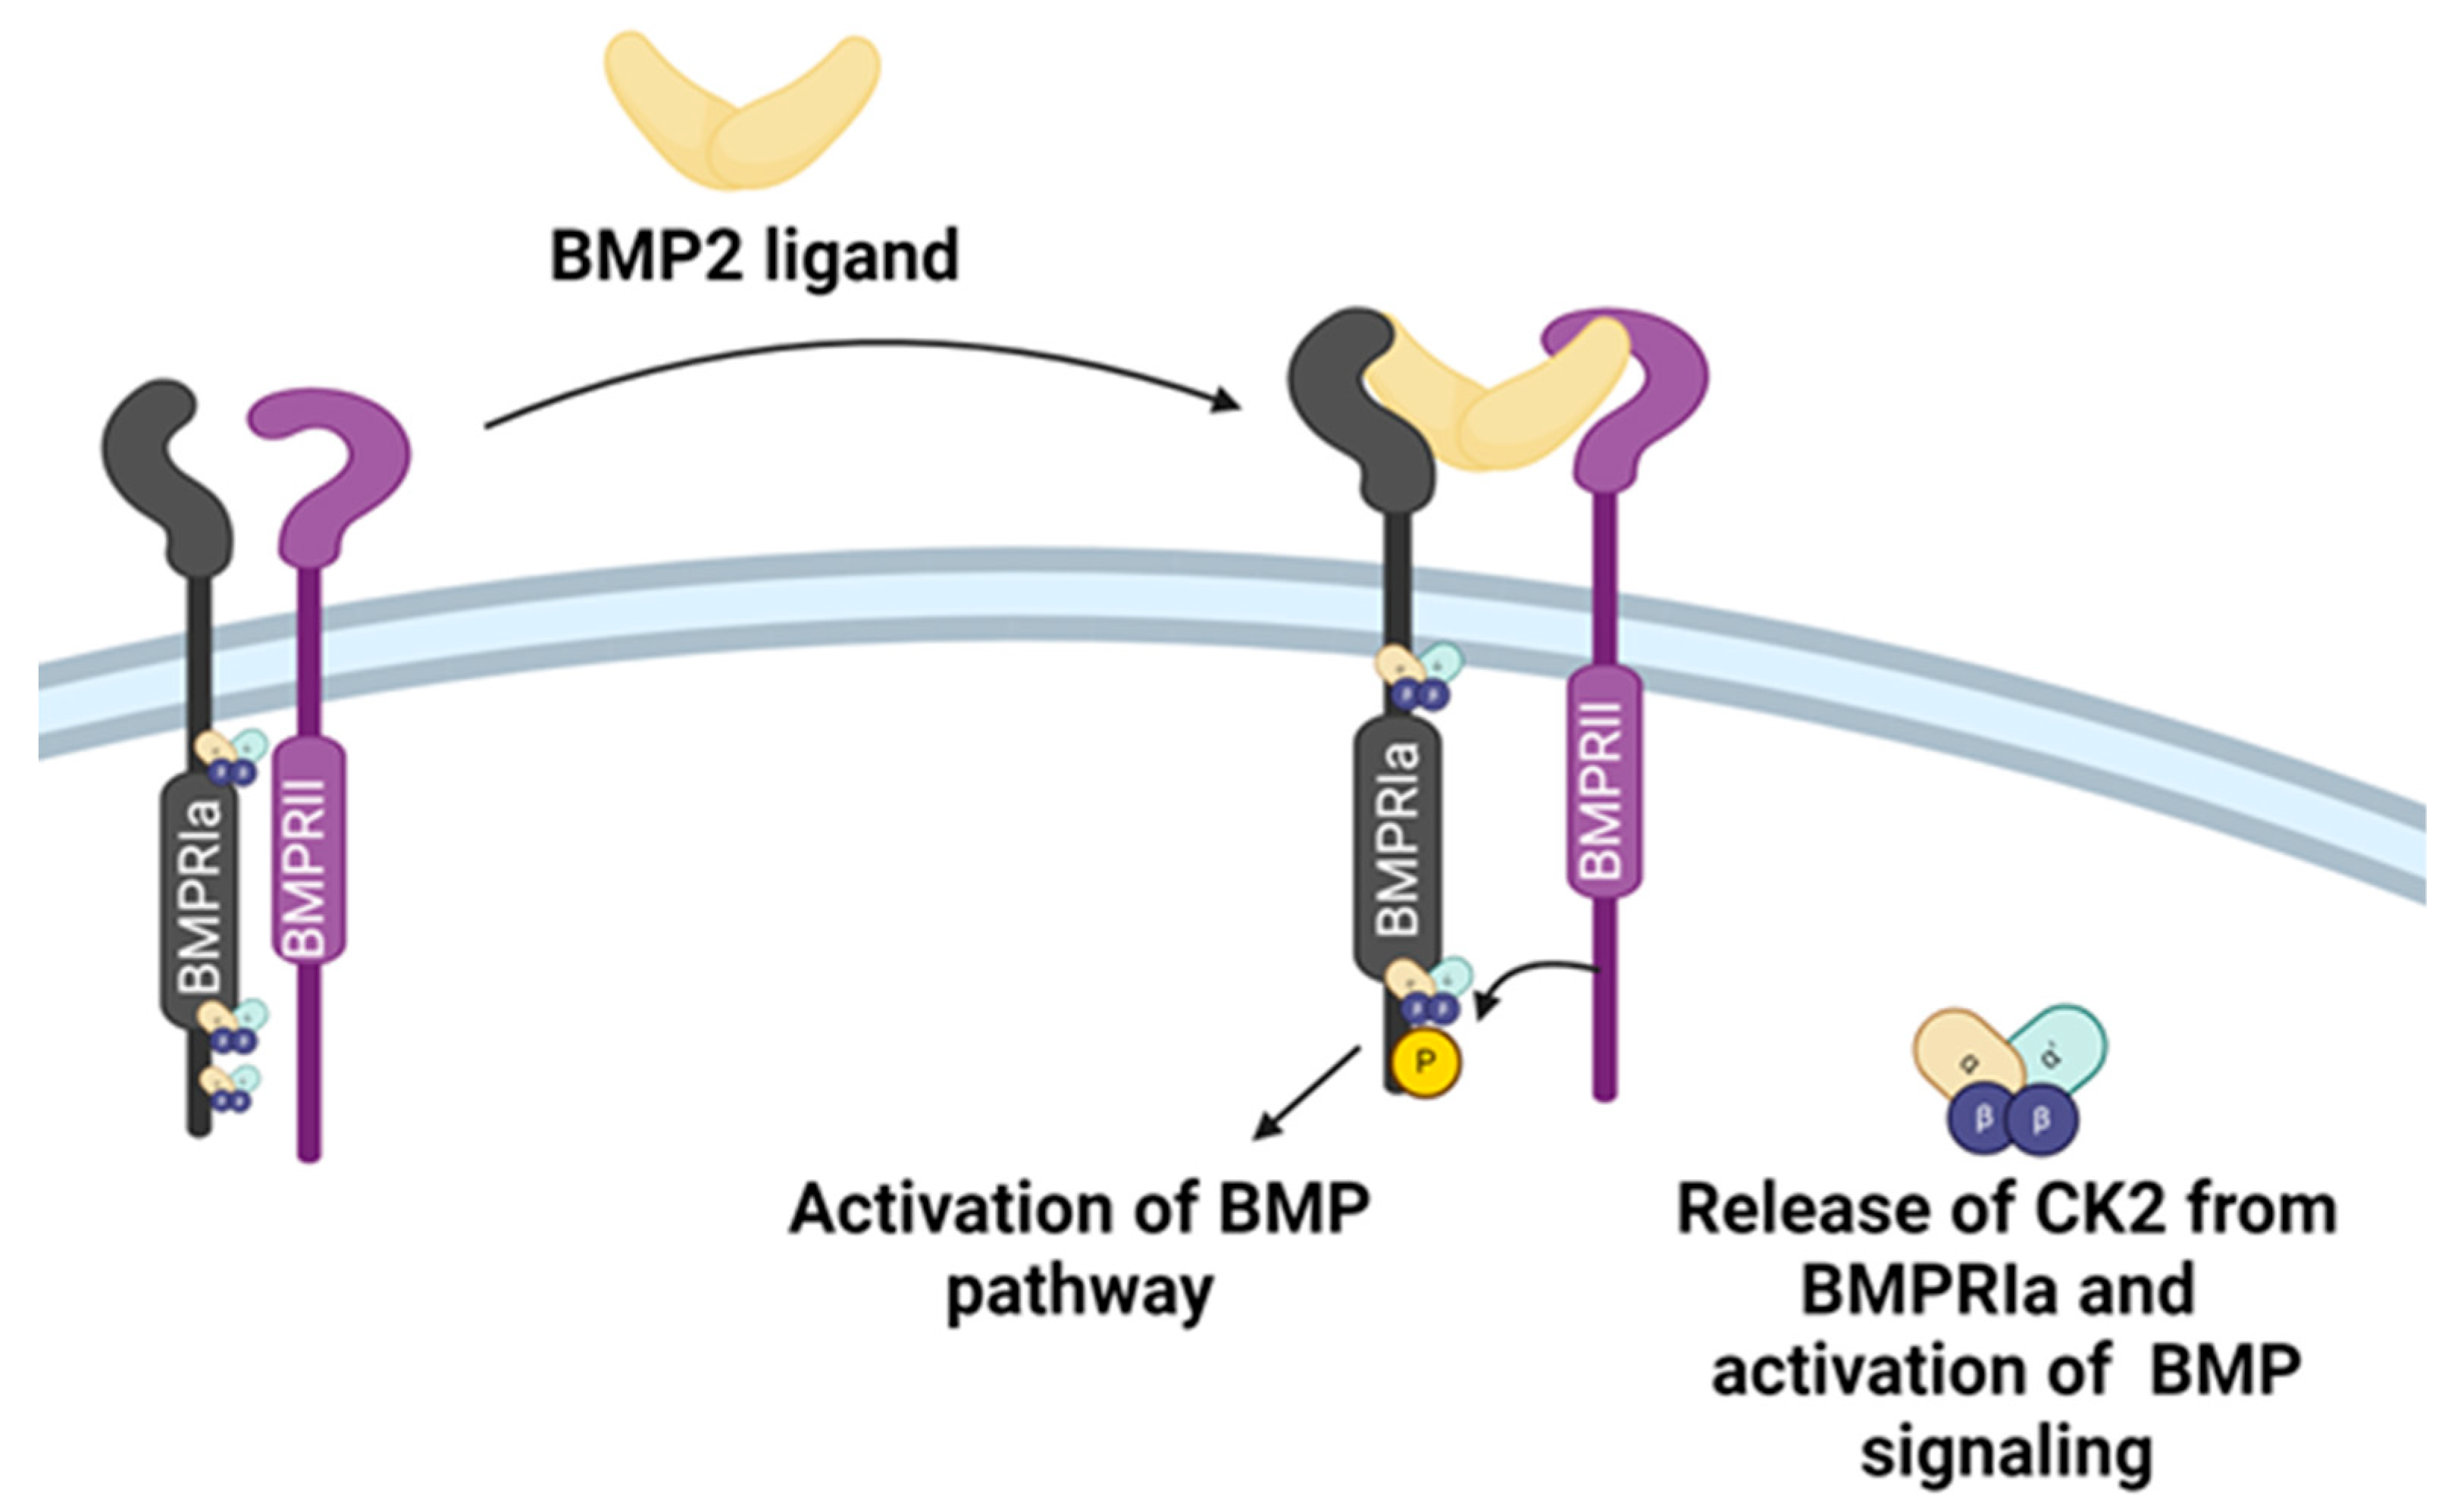
Figure 2.
Isolation and culture of human articular chondrocytes 11) Femoral head was obtained from the hip joint of patients (n=3, females) who had under-gone total hip replacement surgery for Osteoarthritis and Osteoporosis (designated as the comparison group), 2) Articular cartilage tissue chips were obtained, 3) The cartilage extra-cellular matrix from the articular cartilage tissue chips were digested in Collagenase type II dissolved in DMEM media at 370C, 3) Chondrocytes suspended in the Collagenase type II-DMEM solution were separated by centrifugation, 4) Chondrocytes were cultured in high cell density micromasses cultures, 5) Micromasses were treated with varying concentrations of the CK2.1 peptide. Scale bar - 10μm (Created with Biorender.com).
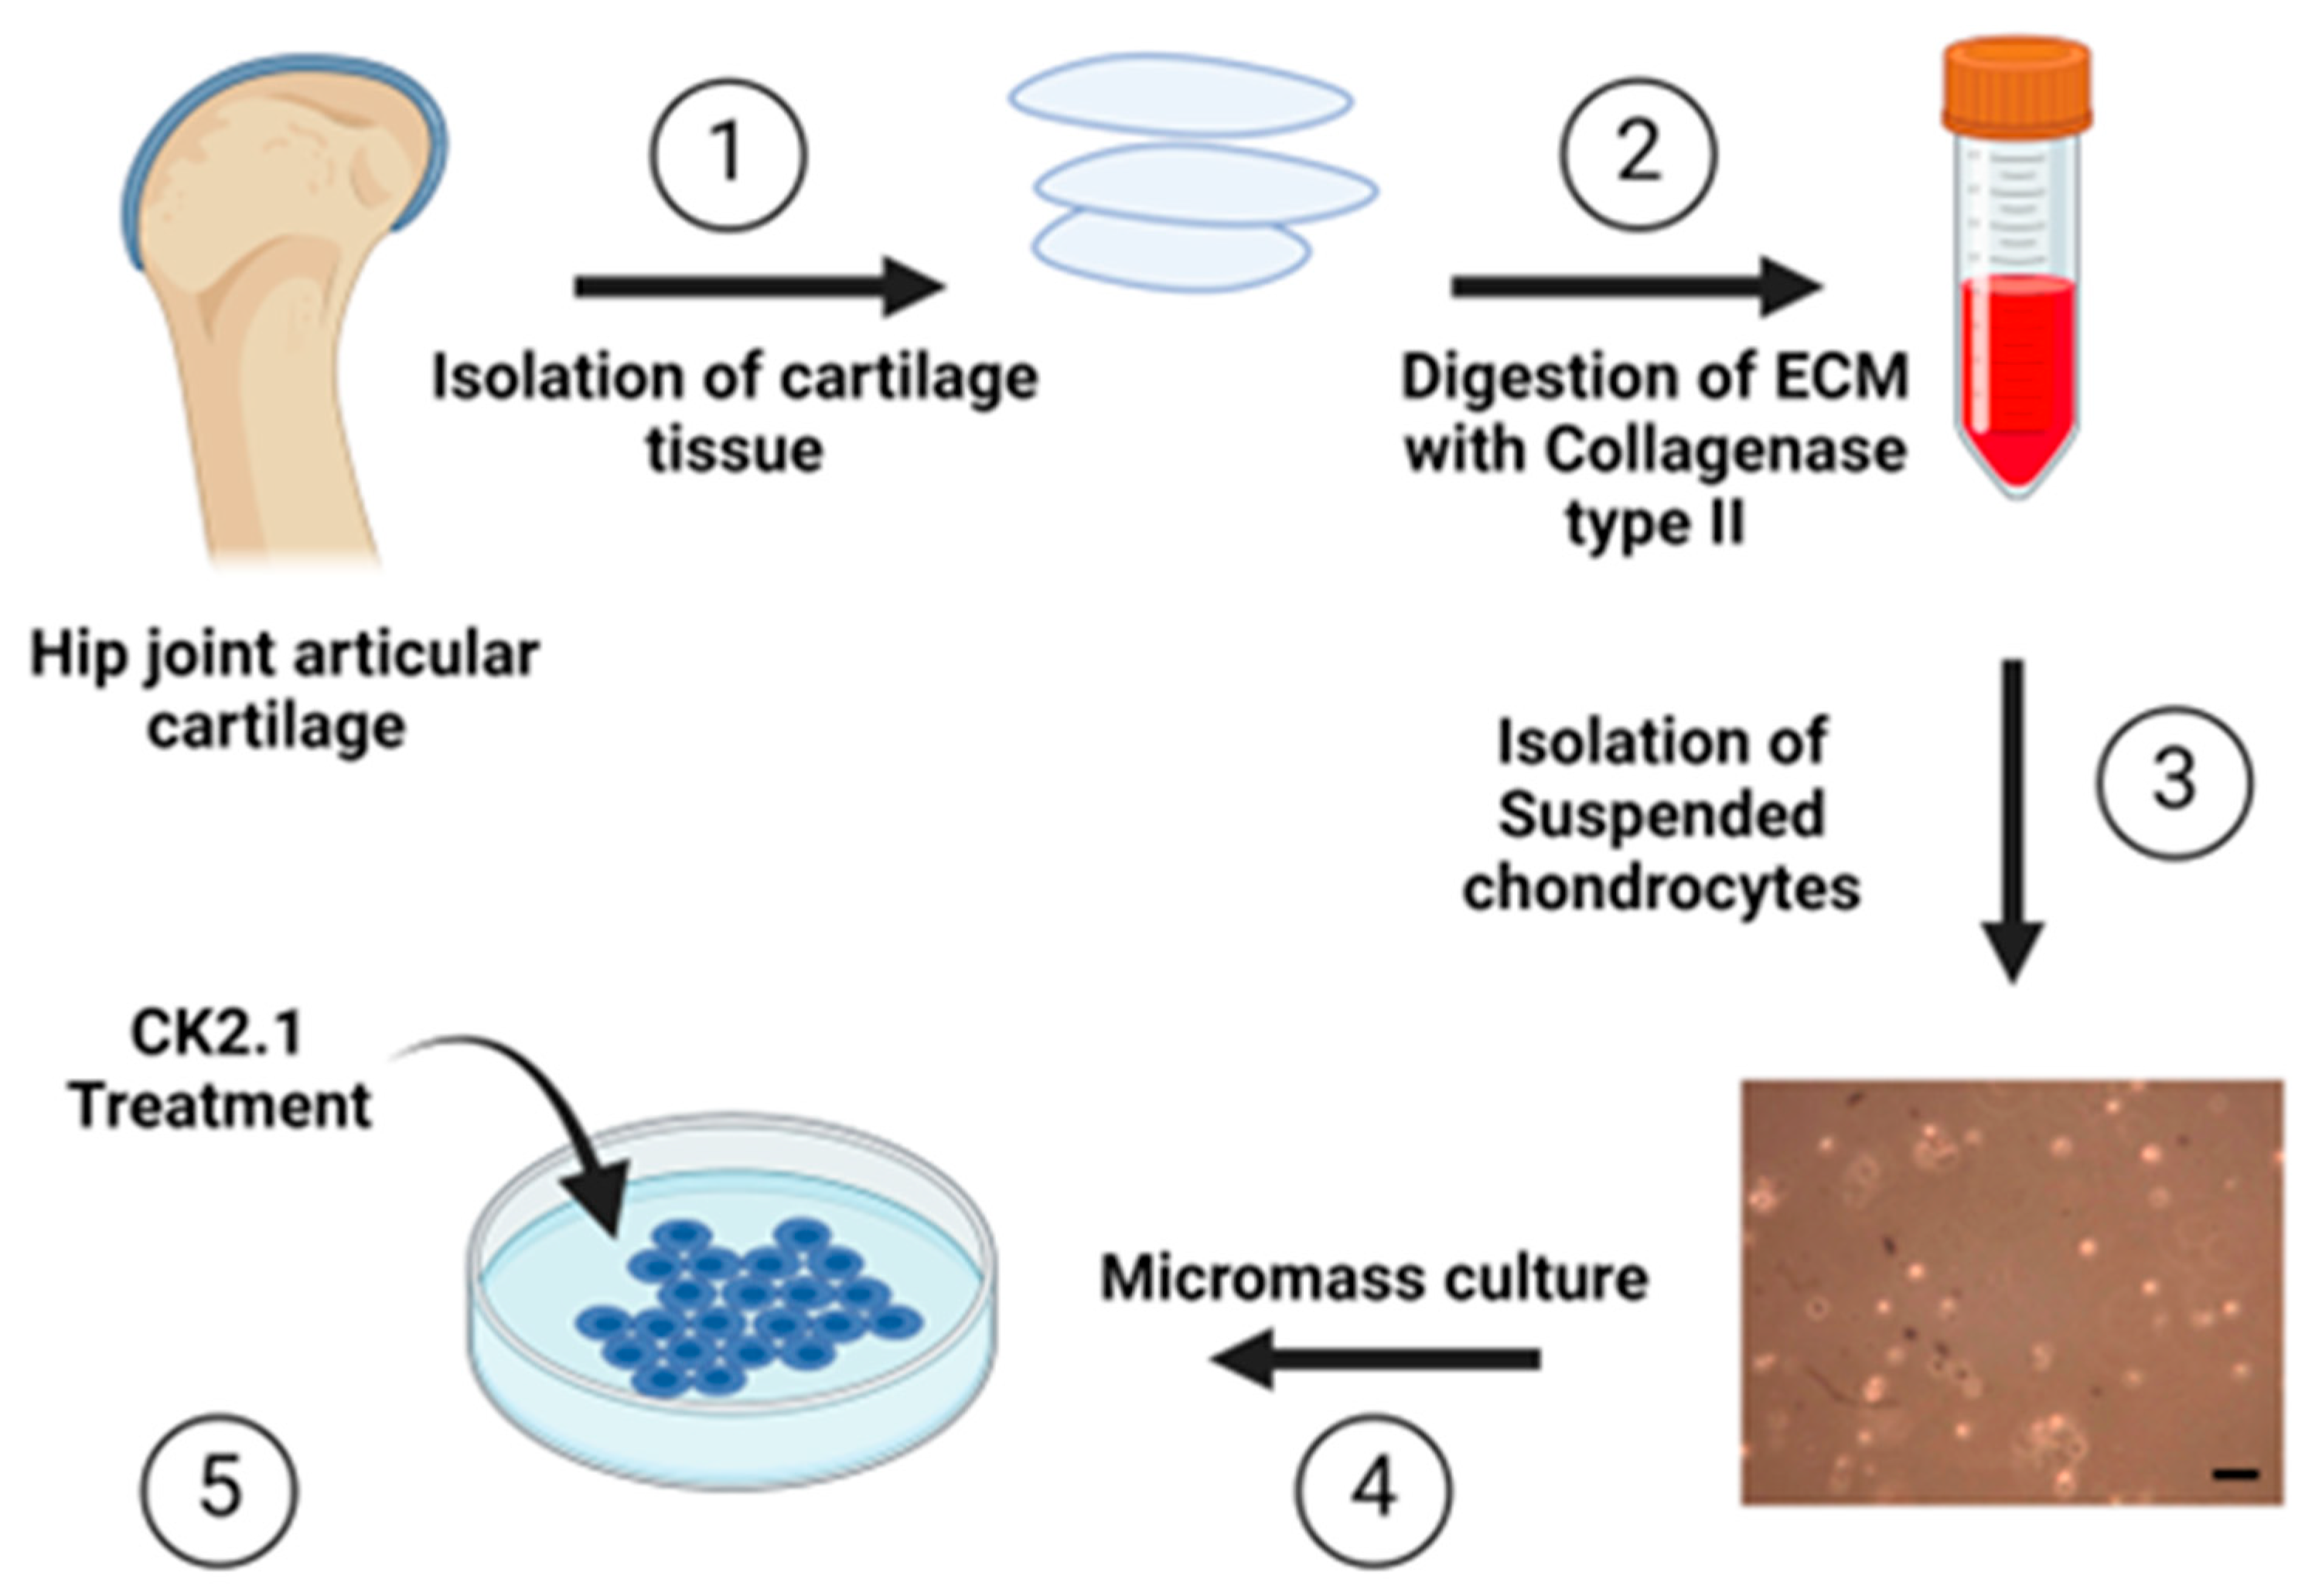
Figure 3.
Comparison of the normalized value of cell counts obtained after digestion of articular cartilage with Collagenase type II under different conditions a) Representative images of primary chondrocytes on Day 0 and Day 3. b) Hip joint articular cartilage obtained from three patients diagnosed with OA was digested with Collagenase type II 24 hours, 48 hours, and 72 hours. Chondrocytes were harvested three times for samples in Group 1, twice in Group 2, and once in Group 3. The number of chondrocytes obtained after digestion was counted using a hemocytometer. Significant differences within the treatment groups (based on the digestion/incubation time and the number of times cells were harvested) were determined using Tukey’s test. Letters a through g denote group labels within respective treatment groups. Groups sharing letters indicate that the groups are not statistically significantly different. Scale bar - 10µm. Error bars represent the standard error of the mean. .
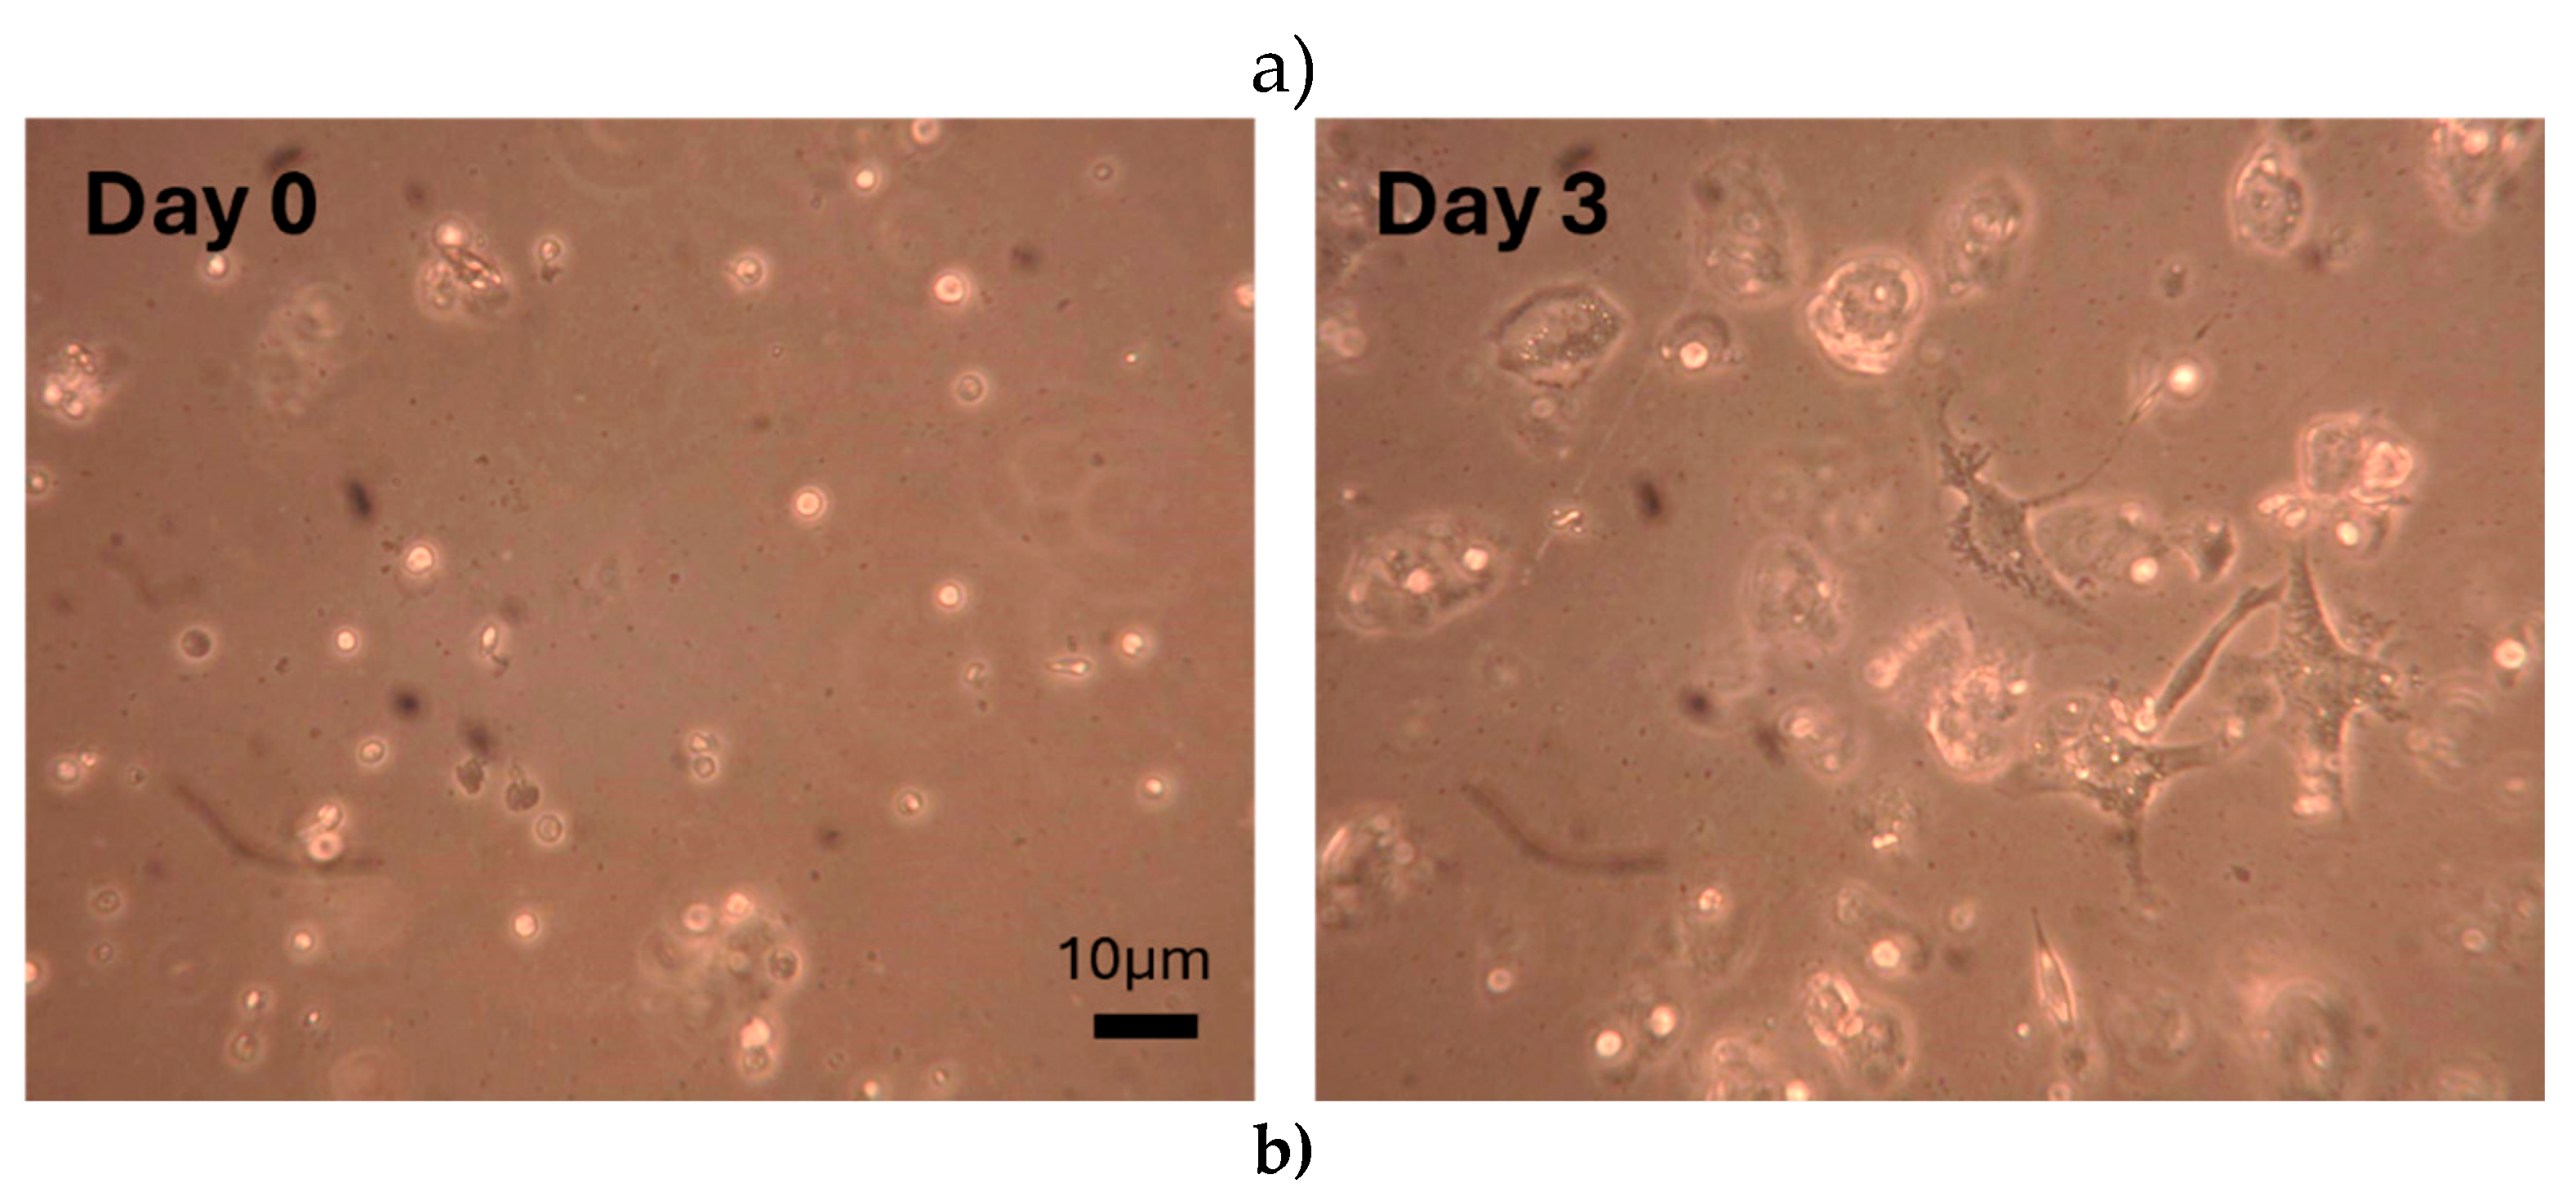
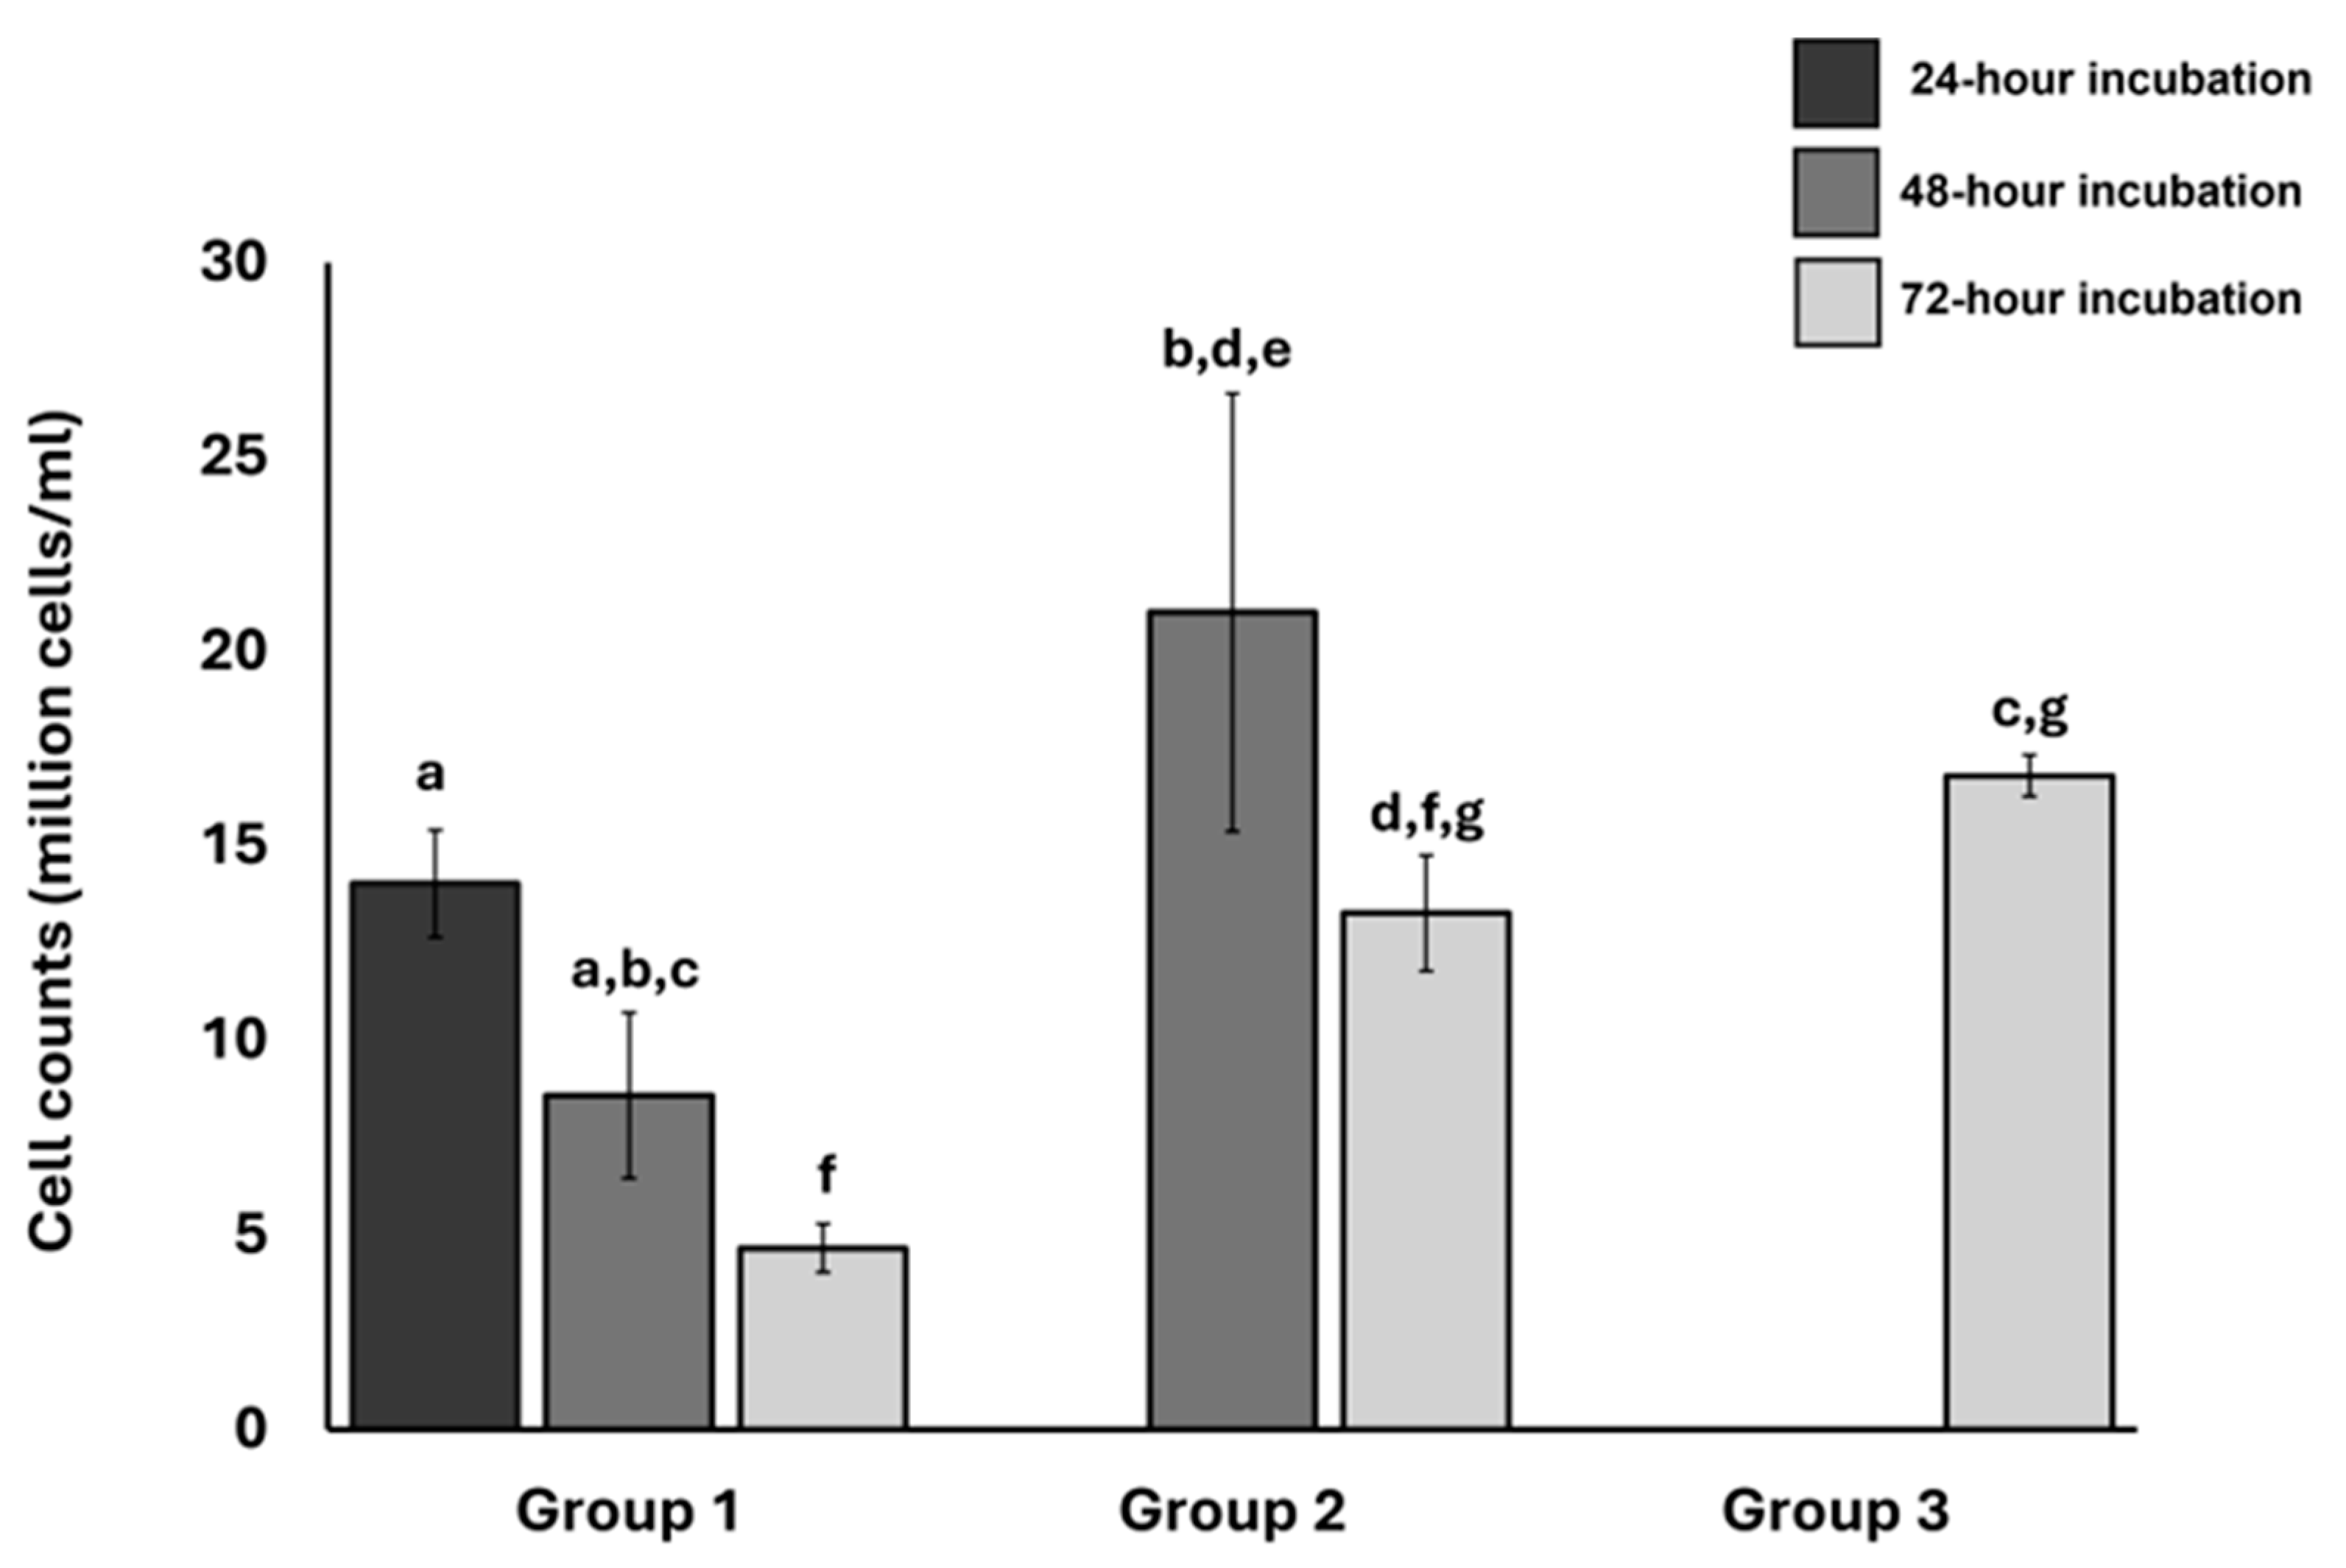
Figure 4.
Comparison of baseline proteoglycan synthesis between OA chondrocytes and comparison group a) Representative microscopic image of alcian blue staining in untreated micromass of OA chondrocytes and comparison group, b) Alcian blue staining intensity of OA chondrocyte micro mass. Values were normalized to the highest intensity values. OA chondrocytes have approximately 75% of the Alcian blue staining intensity compared to the comparison group. The data was analyzed using three images for each group of micromasses. Error bars represent the standard error of the mean.
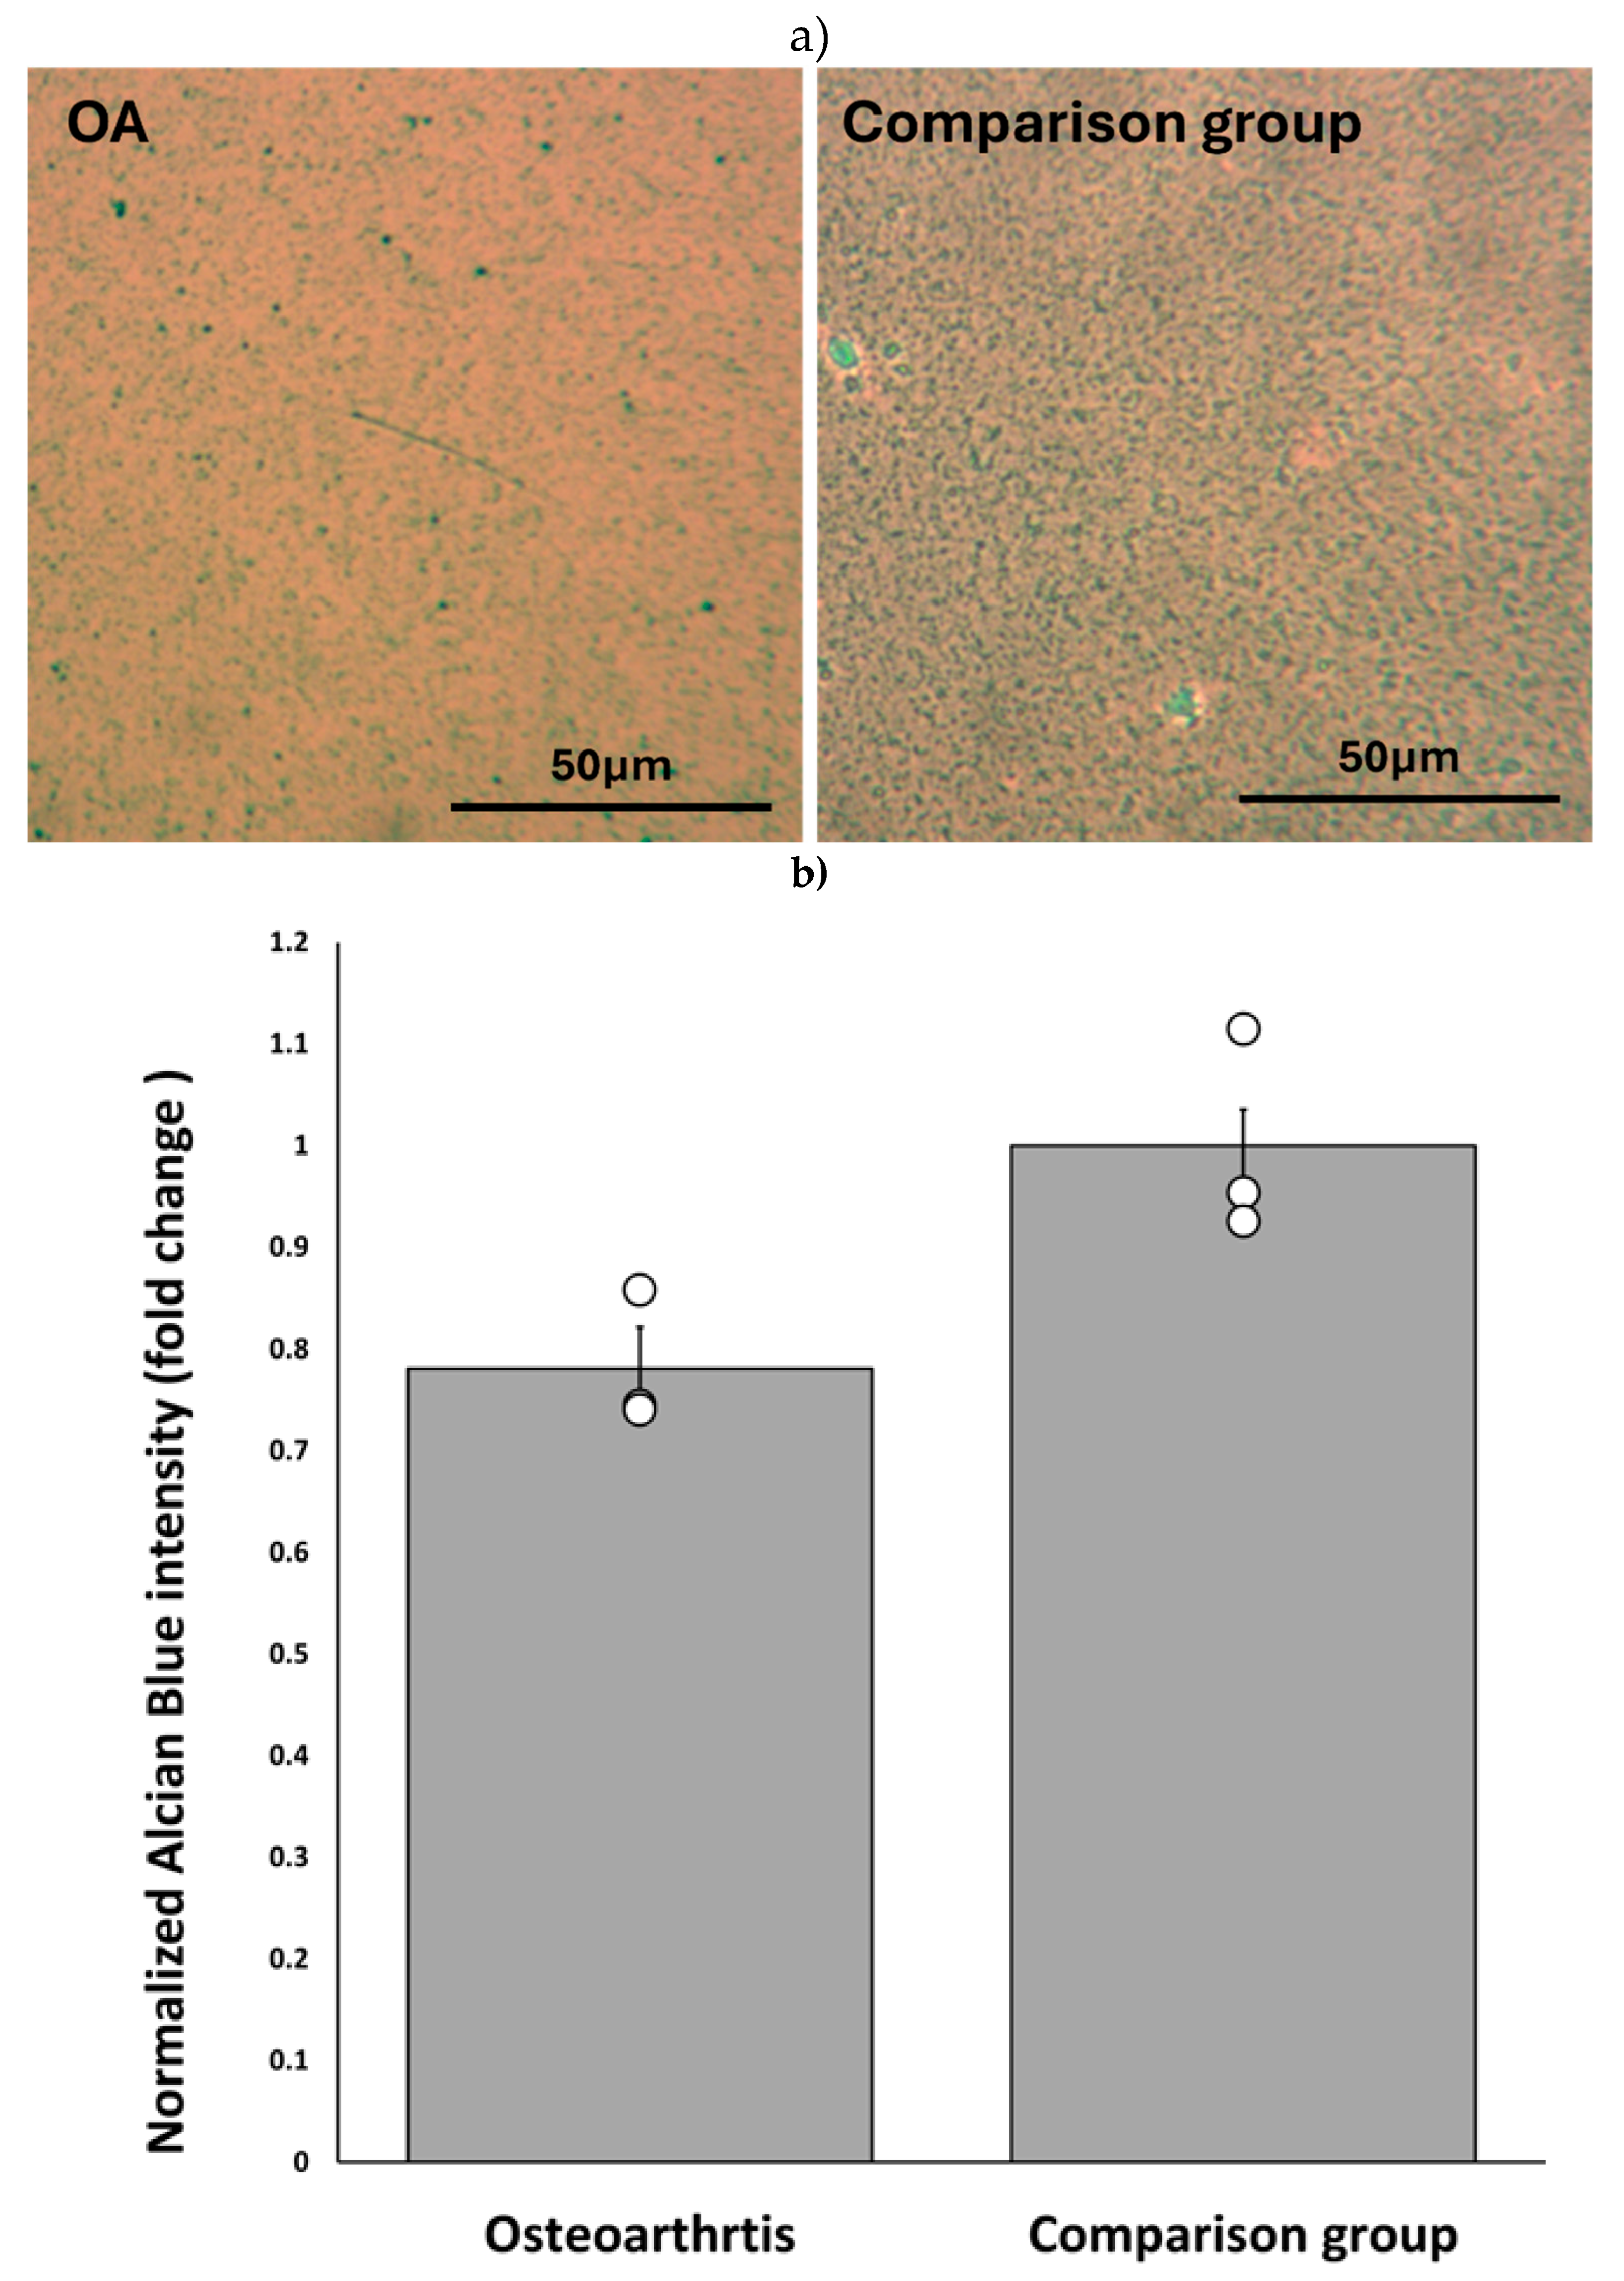
Figure 6.
Relation between Alcian blue intensity and total number of cells stained in micro-masses. a) OA chondrocyte micromasses, b) comparison group. Error bars represent the standard error of the mean. In the bar graphs in the figures, the letters denote statistical significance among the different concentrations ranging from 0 nM to 1000 nM, designated A through F, respectively. The letters above each bar indicate group labels while comparing the average Alcian blue stain intensity for the CK2.1 concentration. For instance, for OA Alcian blue intensity, the 0 nM (“a”) concentration shows statistically significant differences from the 100 nM (“c”) and 250 nM (“d”) concentrations, while the 50 nM (“b”) concentration is statistically significantly different from the 1000 nM (“f”) concentration. An asterisk (*) indicates that the intensity value for the concentration is statistically significantly different from all other concentrations; c) Linear regression analysis between average cell count and Alcian blue intensity for OA chondrocytes. There is a weak correlation between cell count and Alcian blue intensity (R2 = 0.647), d) Linear regression analysis between average cell count and Alcian blue intensity for comparison group. There is a weak correlation between cell count and Alcian blue intensity (R2 = -0.71).
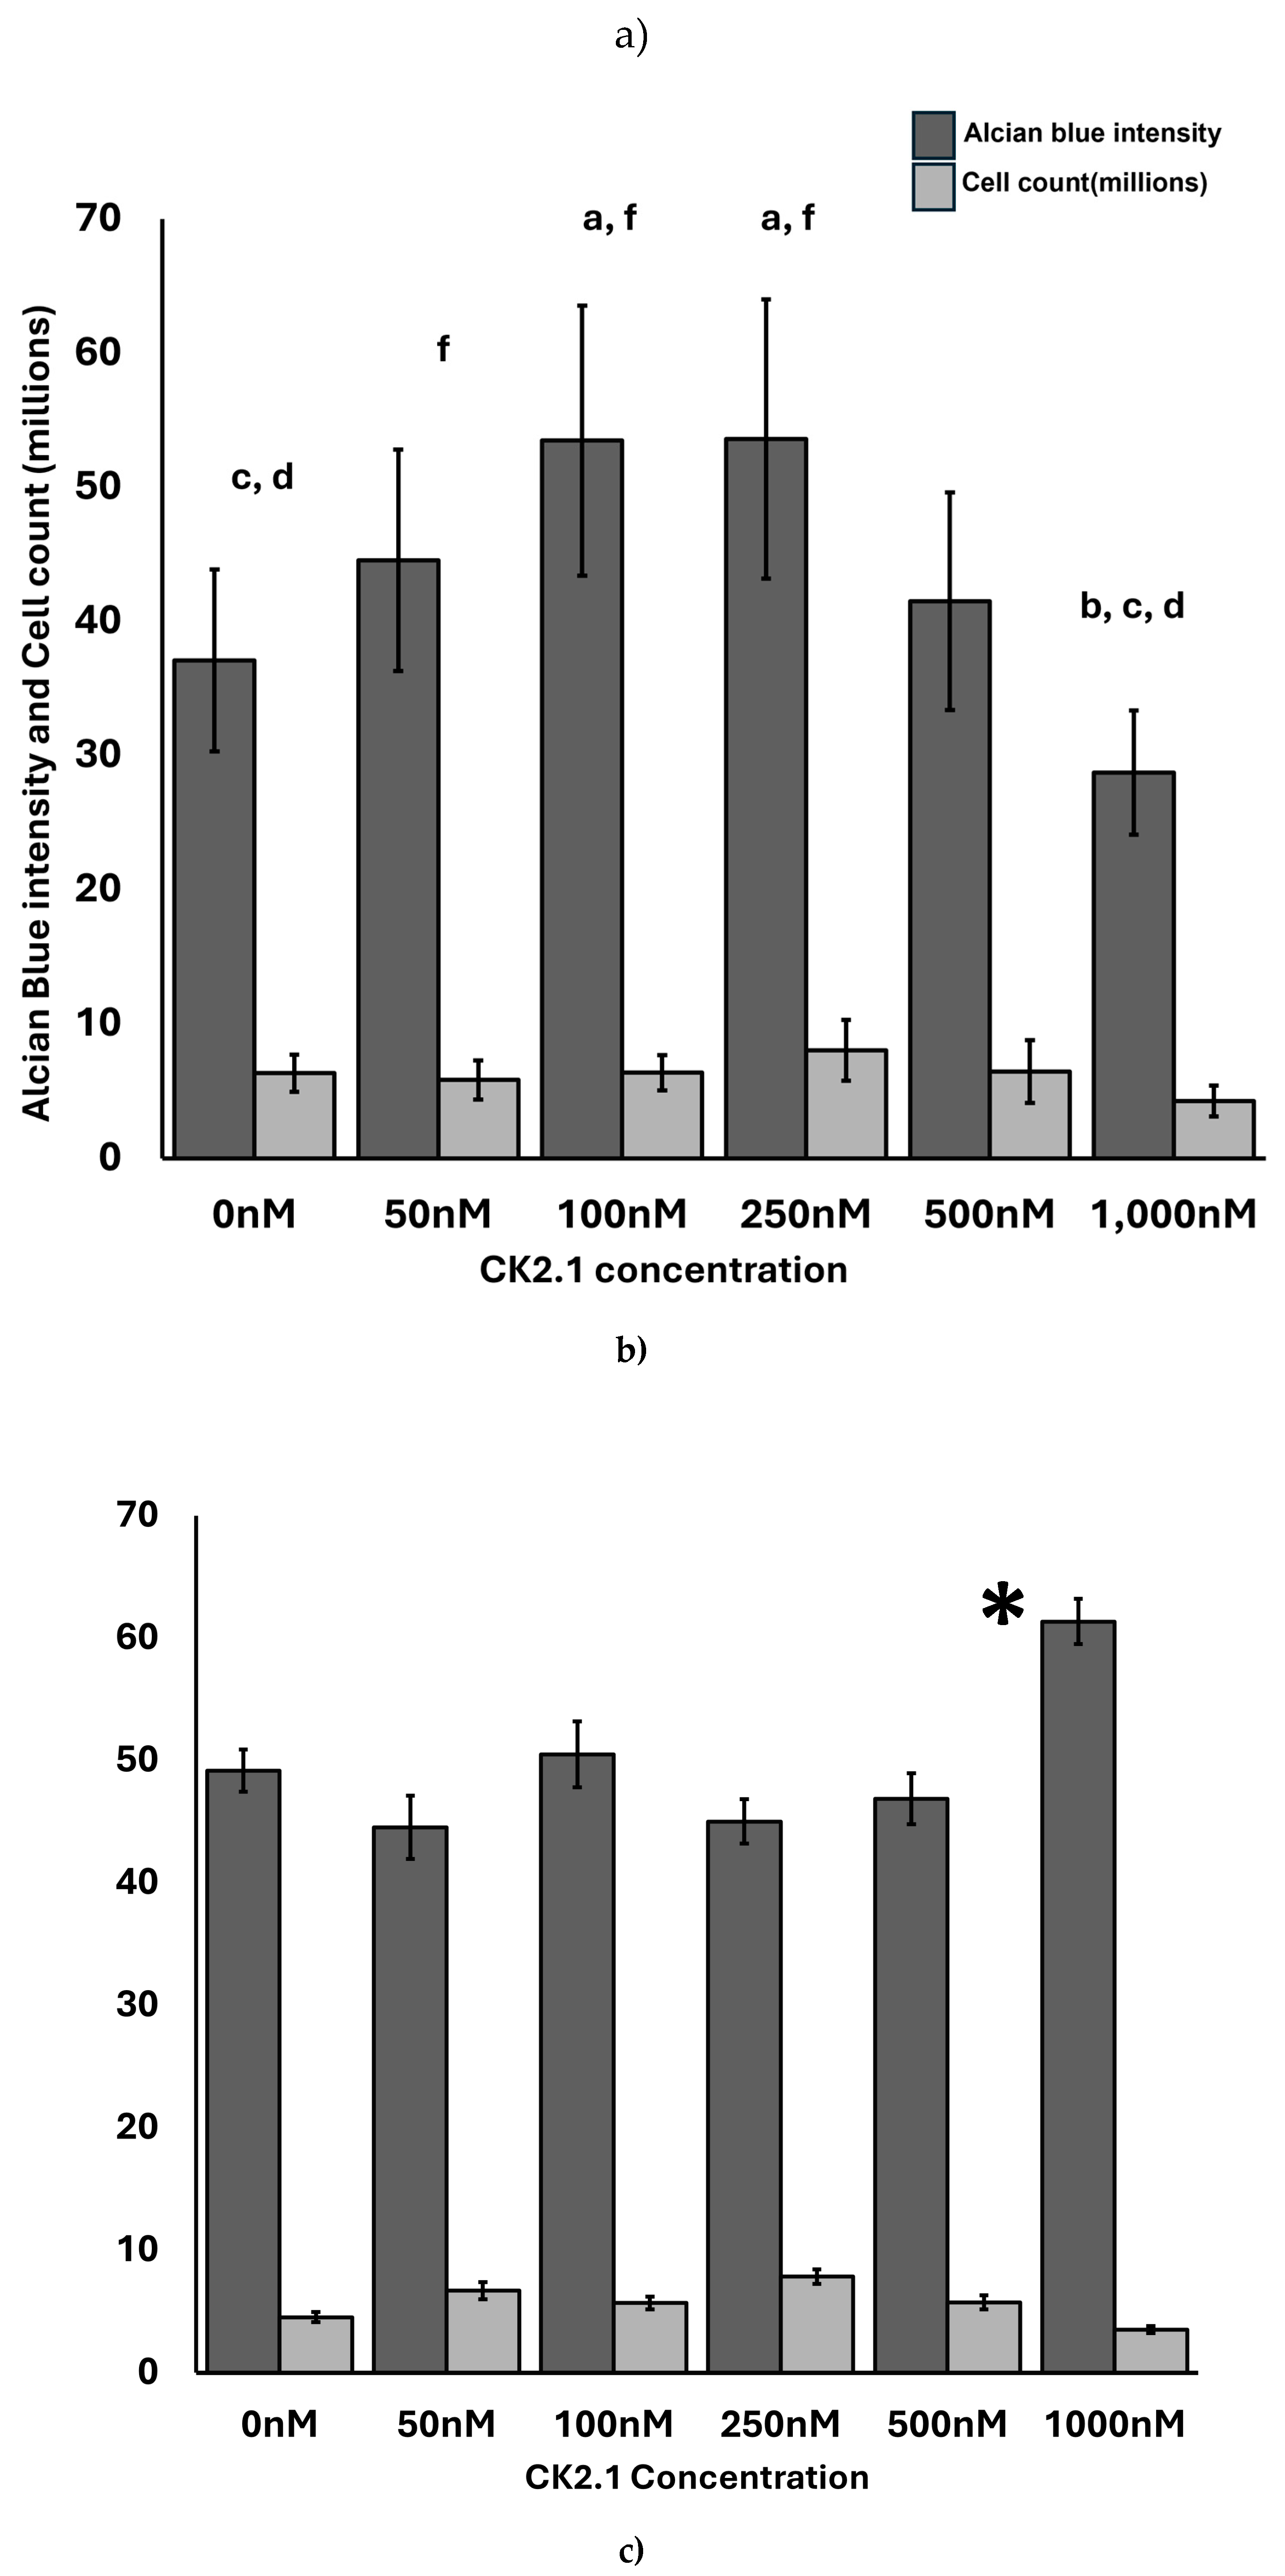
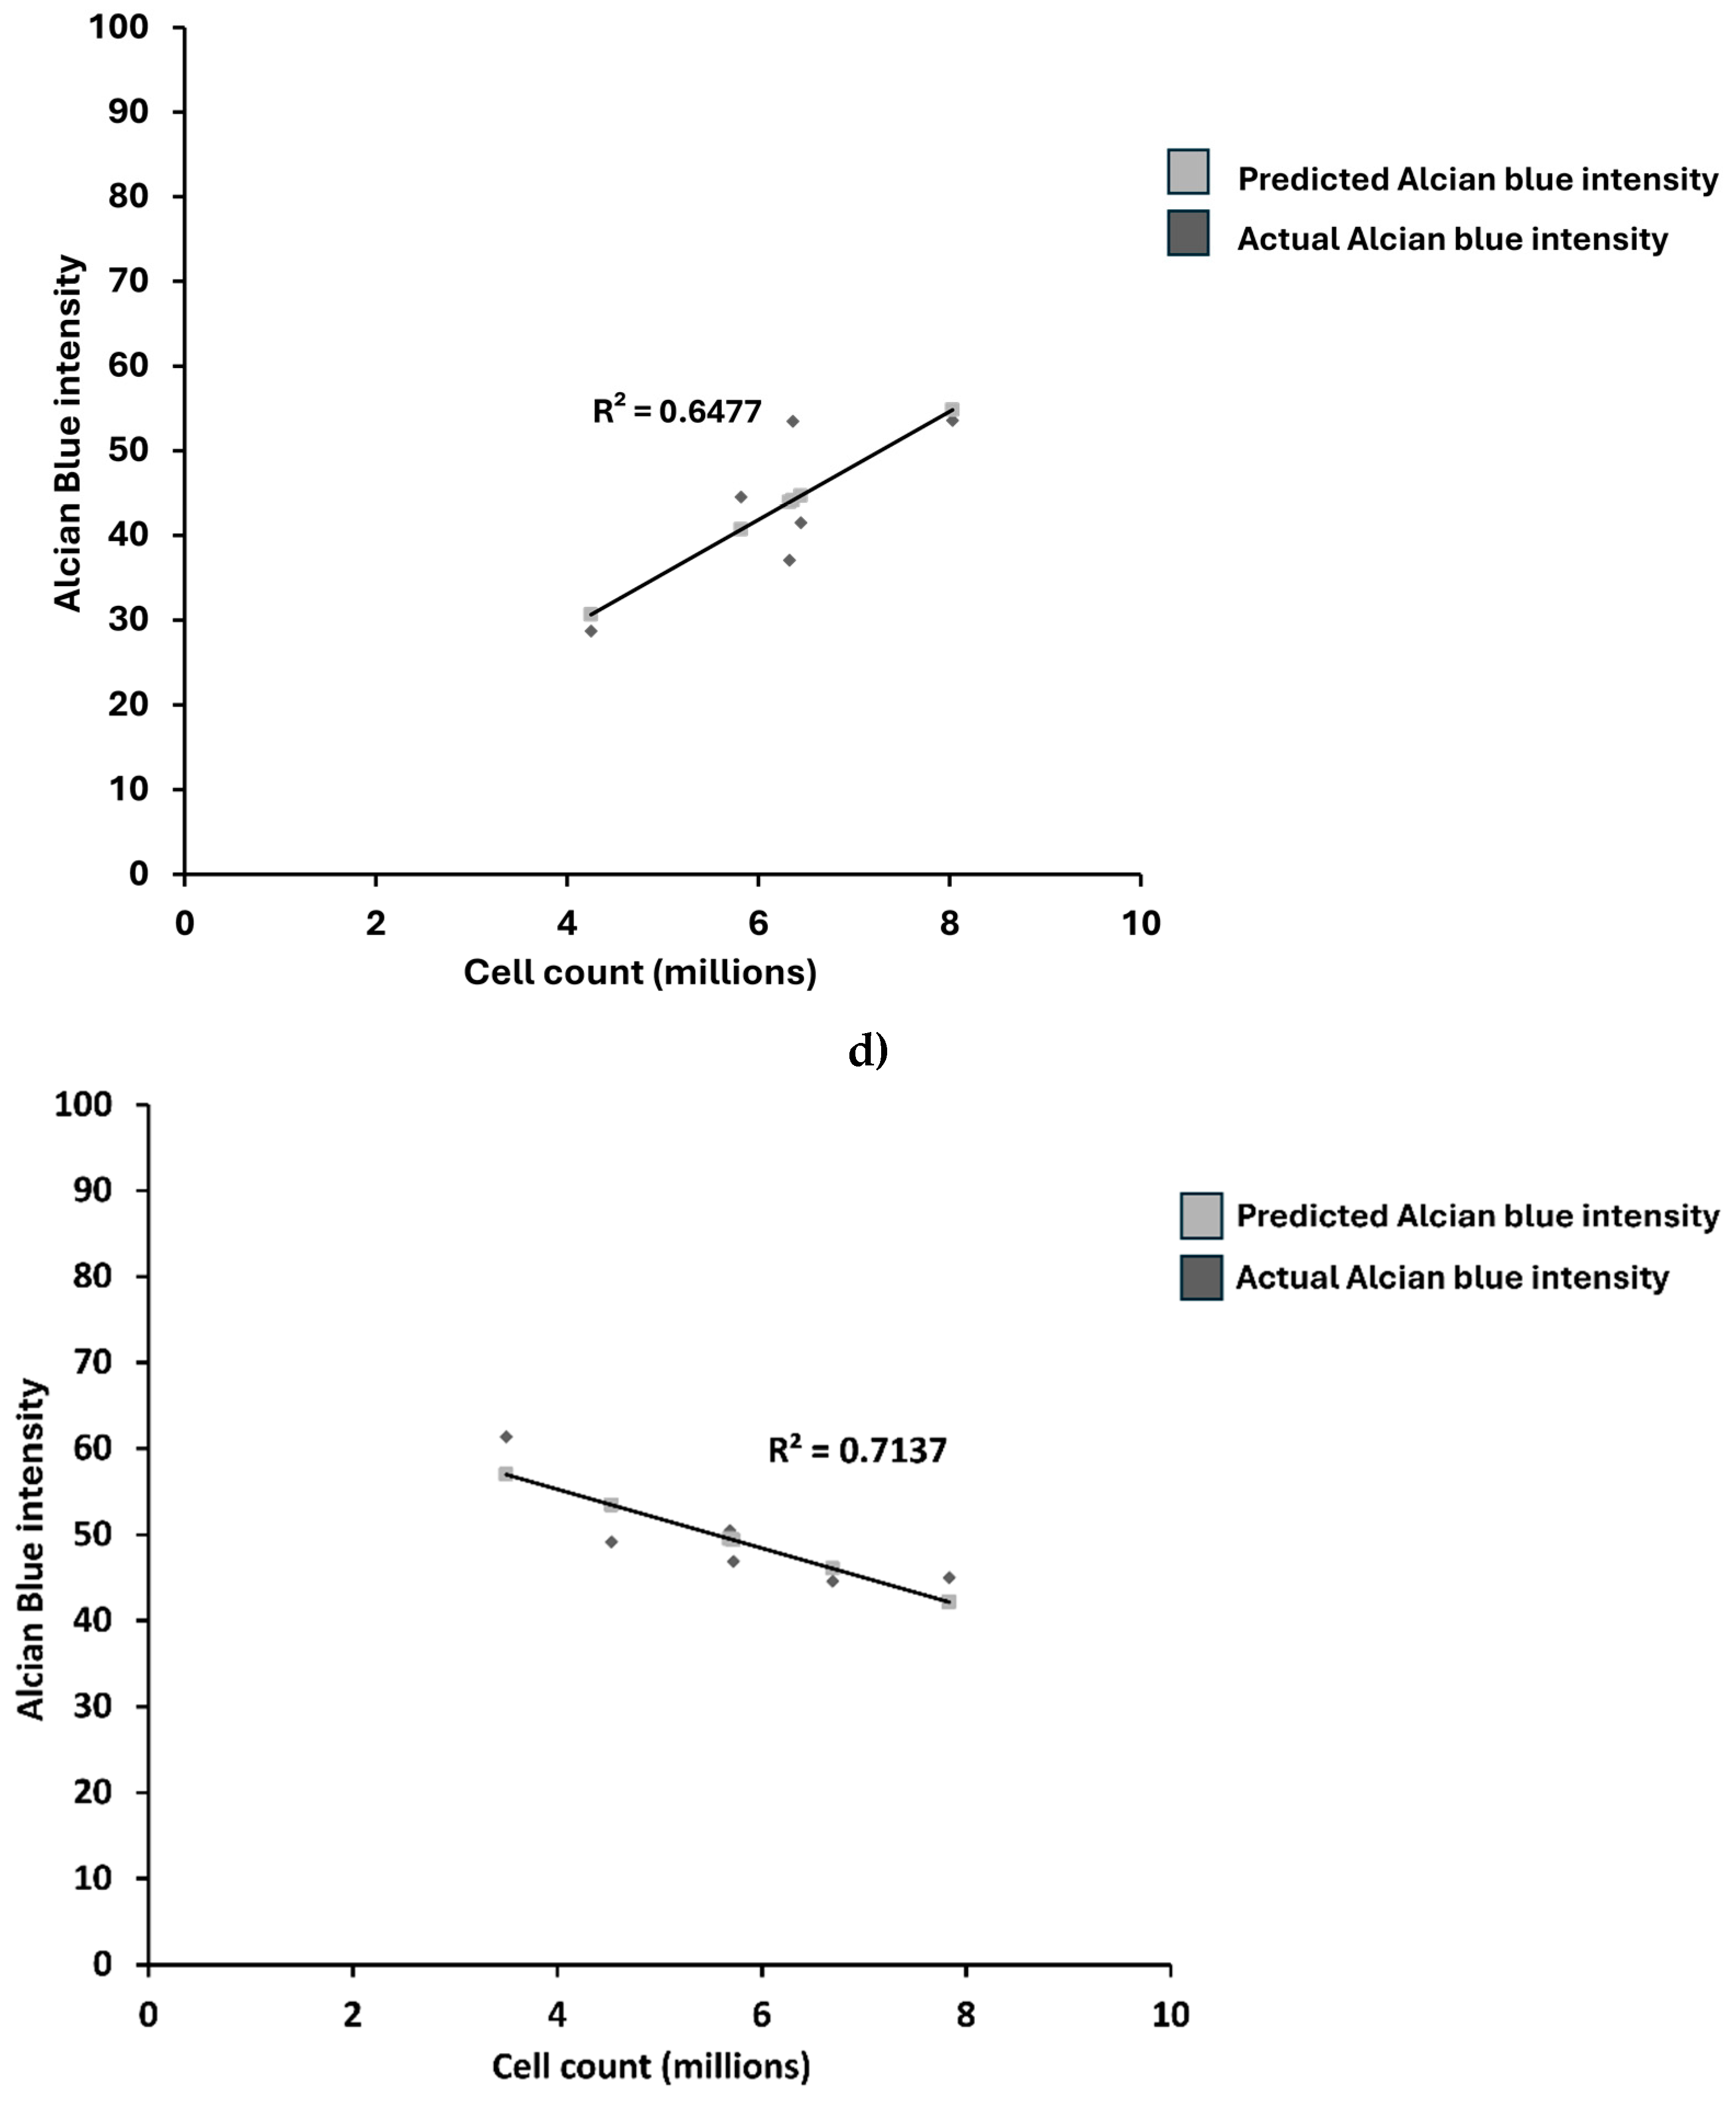
Figure 7.
Representative images of Alcian blue staining of micromasses. a) Microscopic images of Alcian blue staining of OA chondrocytes, b) Image of OA chondrocyte micromasses stained with Alcian blue. c) Microscopic images of Alcian blue staining of comparison group, d) Image of comparison group micromasses stained with Alcian blue. The staining of micromasses showed a ring-like pattern with a higher intensity of Alcian blue near the periphery of the micromasses (denoted by arrow). The scale bar represents 50μm.
Disclaimer/Publisher’s Note: The statements, opinions and data contained in all publications are solely those of the individual author(s) and contributor(s) and not of MDPI and/or the editor(s). MDPI and/or the editor(s) disclaim responsibility for any injury to people or property resulting from any ideas, methods, instructions or products referred to in the content. |
© 2025 by the authors. Licensee MDPI, Basel, Switzerland. This article is an open access article distributed under the terms and conditions of the Creative Commons Attribution (CC BY) license (http://creativecommons.org/licenses/by/4.0/).
Copyright: This open access article is published under a Creative Commons CC BY 4.0 license, which permit the free download, distribution, and reuse, provided that the author and preprint are cited in any reuse.


