Preprint
Article

This version is not peer-reviewed.

Association of Nutritional Status and Cognitive Development in Preschoolers: A Public Health and Educational Cross-Sectional Study

A peer-reviewed article of this preprint also exists.

Submitted:

16 February 2025

Posted:

17 February 2025

You are already at the latest version

Abstract

Nutritional deficiencies negatively impact cognitive development in preschoolers, affecting brain growth and causing behavioral and educational consequences. This study evaluates the relationship between nutritional status and cognitive development, highlighting the public health and educational implications of cognitive developmental delays and the increasing malnutrition among children. This study aimed to explore the factors influencing cognitive development in preschoolers (ages 3-5) in Rupandehi District, Nepal. A cross-sectional survey design was employed, using multi-stage random sampling with data collected from 379 children. Information on the children’s socio-economic and demographic status, as well as their stage of cognitive development, was gathered through scheduled interviews and direct observation. Nutritional status was assessed using anthropometric measurements, specifically Height-for-Age (HAZ) and Weight-for-Age (WAZ), which emerged as significant predictors of cognitive development. Better nutritional status was strongly correlated with higher cognitive development scores. Family structure also played a critical role, with children from joint families exhibiting lower cognitive development scores. Age was a marginally significant factor, indicating a slight decline in cognitive development as children grew older. The findings emphasize the need for interventions targeting improved child nutrition and addressing family dynamics alongside policies that promote equitable educational opportunities. These results provide valuable insights into how nutrition, family structure, and age influence early childhood cognitive development, informing strategies for effective interventions and policy recommendations. Public health authorities should focus on enhancing the educational and nutritional status of preschoolers, as preschool significantly impacts their cognitive and productive development.

Keywords: 
;  ;  ;  ;  ;  

1. Introduction

Optimal nutrition during early childhood is critical for cognitive development, forming the foundation for future learning, behavior, and health outcomes. Nutritional status during early life has a significant impact on cognitive and behavioral development and serves as an indication of these qualities. The first years of life lay the framework for an individual's future cognitive development (Zavitsanou & Drigas, 2021). Cognitive development encompasses the acquisition of skills such as language, memory, attention, and problem-solving, which are profoundly influenced by nutrition during the first few years of life (Sharma, 2022; Sharma & Budhathoki, 2023). Evidence shows deficiencies in iron and iodine during pregnancy can lead to brain dysfunction. A study examining the relationship between nutritional status and intelligence in adolescents found that nutritional elements account for a significant proportion of variation in IQ scores, suggesting the need for similar research across different age groups (Cortés-Albornoz et al., 2021). The frequency of malnutrition in children under five has increased over the last seven years, with alarming rates of stunting, anemia, and acne, emphasizing the importance of addressing these concerns (Cohen et al., 2021).
Araújo et al. (2021) investigated the link between nutritional status and cognitive development in Salvadorian preschoolers despite limited evidence.
The findings of this study are expected to have consequences for public health practices and nutritional education programs in communities confronting such issues (Howlett et al., 2022). Cognitive skills play a crucial role in cognitive development and developmental outcomes; early development, such as counting, reading (Roberts et al., 2022), and understanding, significantly impact an individual's educational accomplishments (Cohen et al., 2021). Cognitive development and academic achievement at primary school and later ages can be influenced by the performance of cognitive skills, such as mathematical or literary proficiency(Gallegos et al., 2021). Studies have found a link between dietary intake and various cognitive and developmental outcomes, suggesting that early care and stimulation can significantly impact cognitive skills and educational success (Tsan et al., 2021; Gutierrez et al., 2021). Emerging evidence suggests that inadequate nutrition, including deficiencies in essential macronutrients and micronutrients, can impair brain structure and function, hindering cognitive potential. These effects are particularly significant in low- and middle-income countries (LMICs), where malnutrition remains a pervasive issue. Nepal, an LMIC with high rates of childhood stunting, wasting, and micronutrient deficiencies, faces substantial challenges in addressing child malnutrition. According to the Nepal Demographic and Health Survey (NDHS) 2022, approximately 25% of Nepali children under five years are stunted, and 10% are wasted (MoHP, 2022). These statistics underscore the need to understand how malnutrition impacts children's cognitive development in specific regional and sociocultural contexts. Despite national efforts to improve maternal and child nutrition, gaps persist in comprehending how regional disparities in food security, socio-economic status, and health practices influence developmental outcomes. An examination of the population verified similar findings, demonstrating that starvation, stunting, anemia, and cognitive impairments are widespread difficulties (Santander et al.2021). Another study revealed that malnutrition negatively impacts educational achievements and future educational prospects (Cui et al., 2021).
Furthermore, a study conducted within the same country indicated that nutritional factors during the lactation period are vital for a child's cognitive development (Soliman et al.2021). Building on previous research, including our earlier study exploring broader environmental and psychosocial determinants of cognitive development in preschool children, this study narrows its focus to the specific impact of nutritional status (Sharma et al., 2024). Unlike the prior study, which utilized a comprehensive dataset and holistic analytical approach, the current analysis refines the sample. It employs a novel methodological framework to yield deeper insights into the nutritional dimensions of cognitive development (Sharma et al., 2023) (Sharma, 2023). Therefore, this study aims to fill critical gaps in the literature by examining the role of nutrition—measured through anthropometric indicators such as stunting, wasting, underweight, and obesity on cognitive outcomes among preschool children in the Rupandehi District, Nepal. It seeks to inform evidence-based interventions tailored to the region's unique socio-cultural and economic landscape, ultimately contributing to national efforts to improve child nutrition and development outcomes. Public health faces significant challenges in addressing obesity and undernutrition among preschoolers, with disparities in childhood undernutrition varying among impoverished areas (Kwansa et al., 2022). Causes can include frequent infections, diets, and imbalanced energy/nutrient intake, the prevention of obesity, infirmary to playgroup interventions should focus on growth-specific preliminary workings related to BMI at a given phase of growth (Fouad et al.2023). The primary objective and scope of this study are to investigate the relationship between nutritional status and cognitive development within a cross-sectional design. It strives to address the gap between standardized nutritional status and cognitive development. Early detection is critical for improving cognitive development, as preschool is the ideal stage for learning. Early childhood cognitive development has a significant impact on later learning processes. The research aims to provide valuable insights into the relationship between nutritional status and cognitive development.

2. Methodology and Materials

2.1. Methods and Procedures

This study focuses on the nutritional status and cognitive development of preschoolers, using sociodemographic characteristics and parental education level as independent variables. Cognitive development is the dependent variable, and nutritional status is the level of analysis. The cross-sectional design of the study allows for quick data collection to identify differences in structure or behavior within a given group. The dependent variable is the combination of other categories of analysis of the dependent variable. This cross-sectional study contributes to public health and educational research.

2.2. Study Design and Setting

The study utilized a cross-sectional descriptive survey design, targeting primary caregivers of preschool-aged children as participants. Data collection was conducted between February 4th and April 12th, 2021, across Rupandehi District, Nepal from 14,358 children in government-operated Early Childhood Development (ECD) centers reflecting a rich tapestry of ethnic, cultural, and socio-economic diversity (Sharma et al, 2024) (Sharma et al., 2022). The Rupandehi District, situated in the southern plains of Nepal, provides a unique setting to explore these dynamics. It represents a microcosm of the national demographic, with diverse ethnic, cultural, and socio-economic backgrounds.
The sample size was calculated using Yamane's formula (Yamane, 2009),
n= N/ [1+N (e2)]
where ‘n’ represented the sample population, N= total population, and ‘e’ = 5% allowable error. This calculation yielded a sample of 389 children. The sampling process followed a multi-stage approach to ensure representativeness and rigor. Initially, three local administrative units were randomly selected from distinct strata, encompassing a sub-metropolitan city, a municipality, and a rural municipality to capture diverse geographic and socio-economic contexts. In the subsequent phase, comprehensive records of schools and Early Childhood Development (ECD) centers were obtained from the selected local units. Following this, a simple random sampling method (lottery technique) was applied to draw five ECD centers from each local unit. In the final stage, the population proportionate sampling (PPS) technique was utilized to allocate participants, culminating in a sample of 389 primary caregivers of preschool-aged children. If a primary caregiver was unavailable or unable to provide necessary information, a close family member was consulted as an alternative respondent. The study exclusively included caregivers who accompanied their preschool children to the respective ECD centers or schools during the data collection period. Participants unwilling to respond or provide data were excluded, along with ECD centers and schools that participated in pre-testing the research instruments to minimize bias in the final analysis (Sharma, 2023).

2.3. Data Collection Tools

Data collection was conducted using a self-administered questionnaire, adopted tools, and direct observation and measurement of children. The nutritional status of preschool children was assessed using anthropometric measurement tools for age, height, and weight. The age of each child was recorded in both months and years, with data obtained from school records and verified through interviews with the primary caregivers (Sharma et al., 2023). Height and weight measurements were conducted at the children’s respective Early Development Centers (EDCs). A portable wooden child height board with a measurement range of 0–120 cm was employed. The device featured a large foot and headpiece, along with adjustable feet to provide stability on uneven surfaces, ensuring a stable vertical setup. The board was equipped with a smoothly gliding measuring slide or wedge that could be locked or adjusted to prevent parallax errors, thereby guaranteeing precise readings. The measuring slide had a maximum wobble of 0.2 cm across its full range, enabling accurate and consistent measurements. For weight measurement, A SAMSO-branded LCD digital weighing scale (dimensions: L=31 cm, W=29.4 cm, H=2.65 cm) with a maximum capacity of 150 kg and a precision of 100 g was used to measure body weight. This device had a minimum weighing capacity of 0.82 kg, ensuring accurate measurements for all children. To meet the study's objectives, children’s nutritional status data, including height, weight, and age, were entered into a Microsoft Excel sheet, converted into a "New Text Document" (Notepad), and uploaded to WHO Anthro and AnthroPlus software to calculate z-scores. Continuous data were imported into SPSS and categorized into four sub-variables (Normal, Moderate, Severe, and Obese) as required for the analysis (Sharma, 2023). The socio-economic variables such as the child's gender and age, family structure, parental education level, and family wealth status recognize these factors as potential determinants of a child's cognitive development. Economic status was measured using a tool from the 2016 Nepal Demographic and Health Survey (NDHS), which evaluated household assets and living conditions (Ministry of Health, 2017). Wealth scores were then classified into poorest, poor, middle, rich, and richest based on specific score ranges (Sharma, 2023). Similarly, the cognitive development of preschool children (ages 3–5) was assessed using Dr. Hema Pandey’s Cognitive Development Test (Pandey, 1991). The tool was contextualized for the Nepali context by replacing some culturally irrelevant items, such as “What is Dosai made of?” with “What is rice pudding made of?” (Sharma, 2023). A pilot test with 10% of the sample ensured the tool's clarity, relevance, and cultural suitability, leading to minor revisions for contextual accuracy, and its reliability was confirmed with a Cronbach’s alpha of 0.90 (Sharma, 2023). This tool, copyrighted in 2005 by the National Psychological Corporation of India, evaluates six dimensions: conceptual skill, information, comprehension, memory, visual perception, and object vocabulary, using 20 items with a total score of 65. Conceptual skill measures aspects like shape, color, and classification, reflecting memory and reasoning abilities, while information assesses general knowledge and associative thinking. Comprehension evaluates recall, association, and reasoning through oral instructions, while visual perception determines qualitative associations between objects, requiring attention and comprehension. Memory assesses auditory recall and mental alertness, and object vocabulary evaluates language richness and abstract thinking (Pandey, 1991). Two experts with bachelor’s degrees and eight years of experience in anthropometric measurement conducted the assessments for preschool children. Enumerators responsible for testing cognitive development were M.Ed. students with a strong understanding of child psychology. The primary investigator supervised and accompanied the team throughout the process (Sharma, 2023).

2.4. Data Analysis

The data were entered into IBM SPSS software version 25.0 for statistical analysis. The data were coded and categorized based on the study's objectives and the nature of the variables. Categorical variables were presented as frequencies (n) and percentages (%), while continuous variables were expressed as means and standard deviations (SD). Statistical tests, including the independent samples t-test and one-way ANOVA, were performed. A p-value of less than 0.05 was considered statistically significant.
The Shapiro-Wilk test was used to assess the data's normality. The unstandardized and standardized residuals showed a significance level of 0.133.
Ten outliers from the dependent variable were removed to achieve normality, resulting in a refined dataset of 379 valid cases.
The Ordinary Least Squares (OLS) regression assumptions considered in the analysis were: (1) normality of residuals, verified through the Histogram and P-P plot; (2) homogeneity of variance; and (3) absence of multicollinearity.
Cognitive development was analyzed as the dependent variable, with predictors: HAZ, WAZ, wealth status, family type, paternal education, number of children in the family, gender of children, and the age of the children.
A multiple linear regression analysis was conducted to identify the key factors influencing cognitive development.
This analysis controlled for potential confounding variables to isolate significant predictors, providing a more accurate understanding of the relationships between variables and ensuring the reliability and validity of the results. Belongs, we show the results of the study, specifically Figure 1. which shows the histogram of the frequency and regression standardized residual of the cognitive development, and Figure 2. which shows the scatter plot of the predicted value and regression standardized residual of the cognitive development. Also, Figure 2 shows Figure 3. show the Normal P-P Plot of the predicted value and regression standardized residual of the cognitive development correlated with observed cum prob.

2.5. Ethical Considerations

Ethical approval for the study was secured from the Board of Ethical Review at the Nepal Health Research Council (NHRC: No. 2078- 56/2021), following prior authorization from the Office of the Dean, Faculty of Education, Tribhuvan University. Additionally, all previous research and scholarly contributions relevant to the study were appropriately acknowledged, and their works were thoroughly cited throughout the research.

3. Results

3.1. Demographic Characteristics

The study initially sampled 389 preschool children, but 10 outliers were removed during the residual analysis, leaving 379 children for the final analysis. Among these, 50.7% were male, and 49.3% were female. Most of the children were either four years old (45.1%) or five years old (46.2%), with only 8.7% being three years old. The majority of families had two or fewer children (71.5%), and 52.5% of the children lived in joint family structures. In terms of parental education, nearly half of the mothers (46.2%) and fathers (49.6%) had completed basic-level education, while 23.7% of mothers and 14.3% of fathers were illiterate. Wealth distribution showed that children were spread across quintiles, with 19.3% in the poorest category and 21.4% in the richest category. Nutritional status assessments revealed that 15.0% of children were severely stunted and 4.0% obese based on height-for-age (HAZ) scores, while 15.3% were severely wasted and 2.9% obese according to weight-for-age (WAZ) scores (Table 1).

3.2. Determinants Factors of Cognitive Development

Table 1 presents the analysis of cognitive development scores across various independent and demographic variables.
The findings highlight significant associations between cognitive development and specific factors, including the age of children (p=0.011), type of family (p=0.024), mothers' education level (p=0.002), fathers' education level (p=0.019), and height-for-age (HAZ) categories (p=0.0001). Children aged three years had the highest mean cognitive development score (M=109.57, SD=21.61).
Similarly, children from nuclear families showed significantly higher mean scores (M=103.83, SD=14.23). Children whose mothers had secondary or higher education achieved the highest scores (M=106.12, SD=15.17).
Fathers’ education followed a similar trend, with children of fathers with secondary or higher education achieving the highest scores (M=104.96, SD=15.96).
Children with normal HAZ scores recorded the highest cognitive development scores (M=105.38, SD=15.43), while those with severe stunting had the lowest scores (M=96.08, SD=11.88).
Figure 4. Histogram of Cognitive Development Scores, showing the frequency distribution of cognitive development levels among preschoolers.
Preprints 149568 g004
Figure 5. Box Plot of Cognitive Development Scores by Family Structure, indicating differences in mean and distribution across nuclear and joint family types.
Preprints 149568 g005

3.3. Analysis of WAZ and HAZ Scores with Demographic Variables

Table 2 illustrates the analysis of Weight-for-Age (WAZ) and Height-for-Age (HAZ) z-scores across various demographic variables. Significant differences were observed in WAZ and HAZ based on the number of children in the family (p=0.000) and wealth status (p=0.0001). Children from families with two or fewer children demonstrated better nutritional outcomes, with a mean WAZ of -0.85 (SD=1.06) compared to -1.31 (SD=1.12) for children from larger families. Similarly, children from wealthier households had more favorable WAZ scores, with the richest quintile showing the lowest mean z-score of -1.54 (SD=1.22) compared to -0.80 (SD=1.05) in the poorest households.
Figure 6. Distribution of Cognitive Development Scores by Nutritional Status (HAZ), illustrating how cognitive scores vary across different height-for-age categories.
Preprints 149568 g006

3.4. Regression Analysis of HAZ and WAZ with Demographic Variables

Table 3 presents the results of multiple regression analyses examining the relationship between nutritional status (HAZ and WAZ) and demographic variables. In Model I (HAZ score), economic status is a significant predictor (β = 0.258, p = 0.0001), suggesting that higher economic status is linked to better height-for-age outcomes. Other factors like child age, joint family structure, and parental illiteracy were not significant predictors. The model explains 6.4% of the variance in HAZ. In Model II (WAZ score), economic status remains a significant predictor (β = 0.318, p = 0.0001), and child age becomes a significant negative predictor (β = -0.105, p = 0.034). Other variables, including family structure and parental illiteracy, were not significant. This model explains 12.4% of the variance in WAZ.

3.5. Multiple Regression Analysis: Predictors of Cognitive Development

Table 4 presents the results of multiple regression models that examine the relationship between various predictors and cognitive development. The analysis is split into two models: Model I assesses the impact of socioeconomic factors on cognitive development, while Model II incorporates both nutrition status (HAZ, WAZ) and socioeconomic factors. In Model I, the age of the child and family structure (joint family) were significant predictors of cognitive development. The age of the child exhibited a significant negative relationship (β = -0.131, p = 0.011), indicating that older children had lower cognitive development scores. Similarly, children from joint families had significantly lower cognitive development scores (β = -0.131, p = 0.011). Economic status, mother's illiteracy, and father's illiteracy were not significant predictors (p > 0.05). The model explains 4.3% of the variance in cognitive development (R² = 4.3%) with an F-statistic of 3.358 (p = 0.006). In Model II, when nutrition status (HAZ and WAZ) was added as predictors, height-for-age (HAZ) emerged as a highly significant predictor of cognitive development (β = 0.38, p = 0.0001). This suggests that children with higher HAZ scores had significantly better cognitive development scores. Additionally, weight-for-age (WAZ) also had a significant effect, with lower WAZ scores being associated with lower cognitive development (β = -0.171, p = 0.018). The model explains 12.2% of the variance in cognitive development (R² = 12.2%) with an F-statistic of 77.376 (p = 0.0001).
Figure 7. Correlation Matrix of Cognitive Development and Socioeconomic Factors, highlighting relationships between nutritional status, parental education, family wealth, and cognitive scores.
Preprints 149568 g007
Figure 7. Scatter Plot of Cognitive Development Scores vs. Residuals, validating the regression model by assessing predicted cognitive scores against residuals.
Preprints 149568 g008

4. The Summary of the Study's Findings

4.1. Demographic Characteristics

·
The final sample comprised 379 preschool children, with a nearly equal distribution of males (50.7%) and females (49.3%).
·
The majority of children were aged four (45.1%) or five (46.2%) years, and most families had two or fewer children (71.5%).
·
A significant portion of children (52.5%) lived in joint family structures.
·
Parental education levels were relatively low, with about 46.2% of mothers and 49.6% of fathers completing basic education. Illiteracy was more common among mothers (23.7%) than fathers (14.3%).
·
Regarding wealth, children were evenly distributed across wealth backgrounds, with 19.3% in the poorest and 21.4% in the richest category.
·
Nutritional status assessments showed that 15.0% of children were severely stunted, 4.0% were obese based on height-for-age (HAZ), 15.3% were severely wasted, and 2.9% were obese based on weight-for-age (WAZ).

4.2. Determinants of Cognitive Development:

·
Age: Three-year-old children had the highest mean cognitive development score (M=109.57, SD=21.61).
·
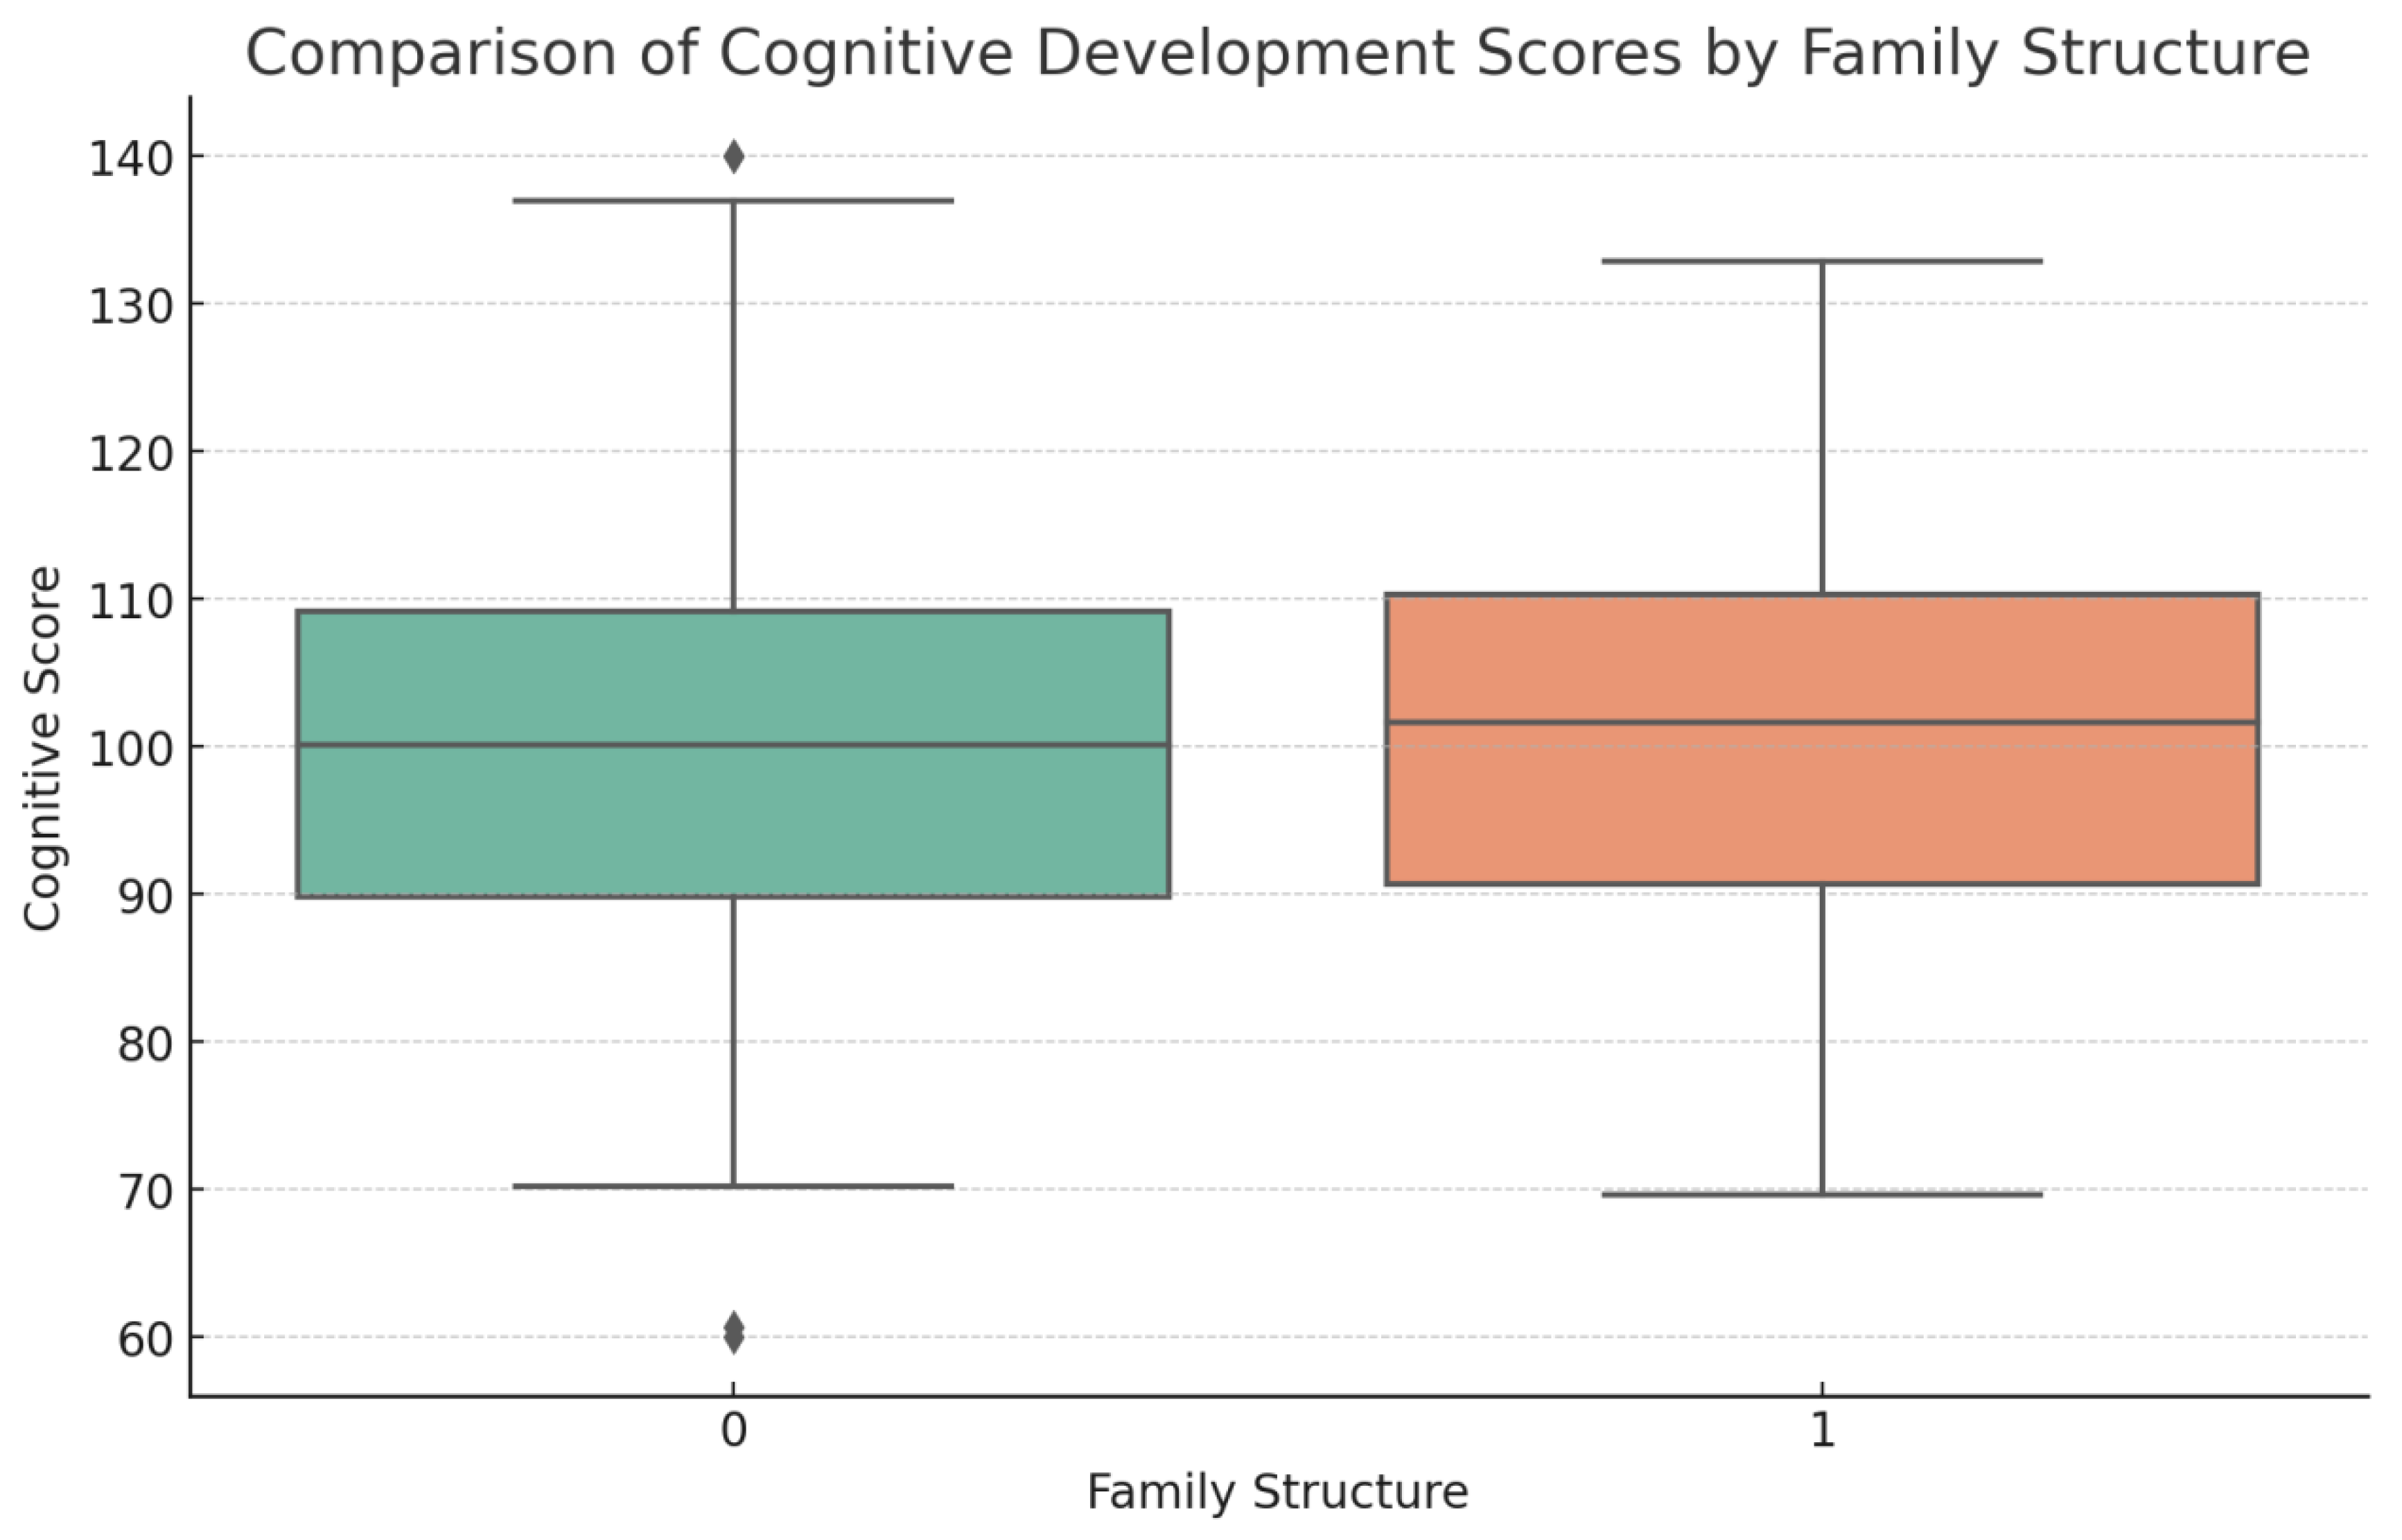
Family Structure: Children from nuclear families had significantly higher mean cognitive development scores (M=103.83, SD=14.23) compared to those from joint families (M=100.28, SD=16.12).
·
Parental Education: Children whose mothers (M=106.12, SD=15.17) and fathers (M=104.96, SD=15.96) had secondary or higher education had the highest cognitive development scores.
·
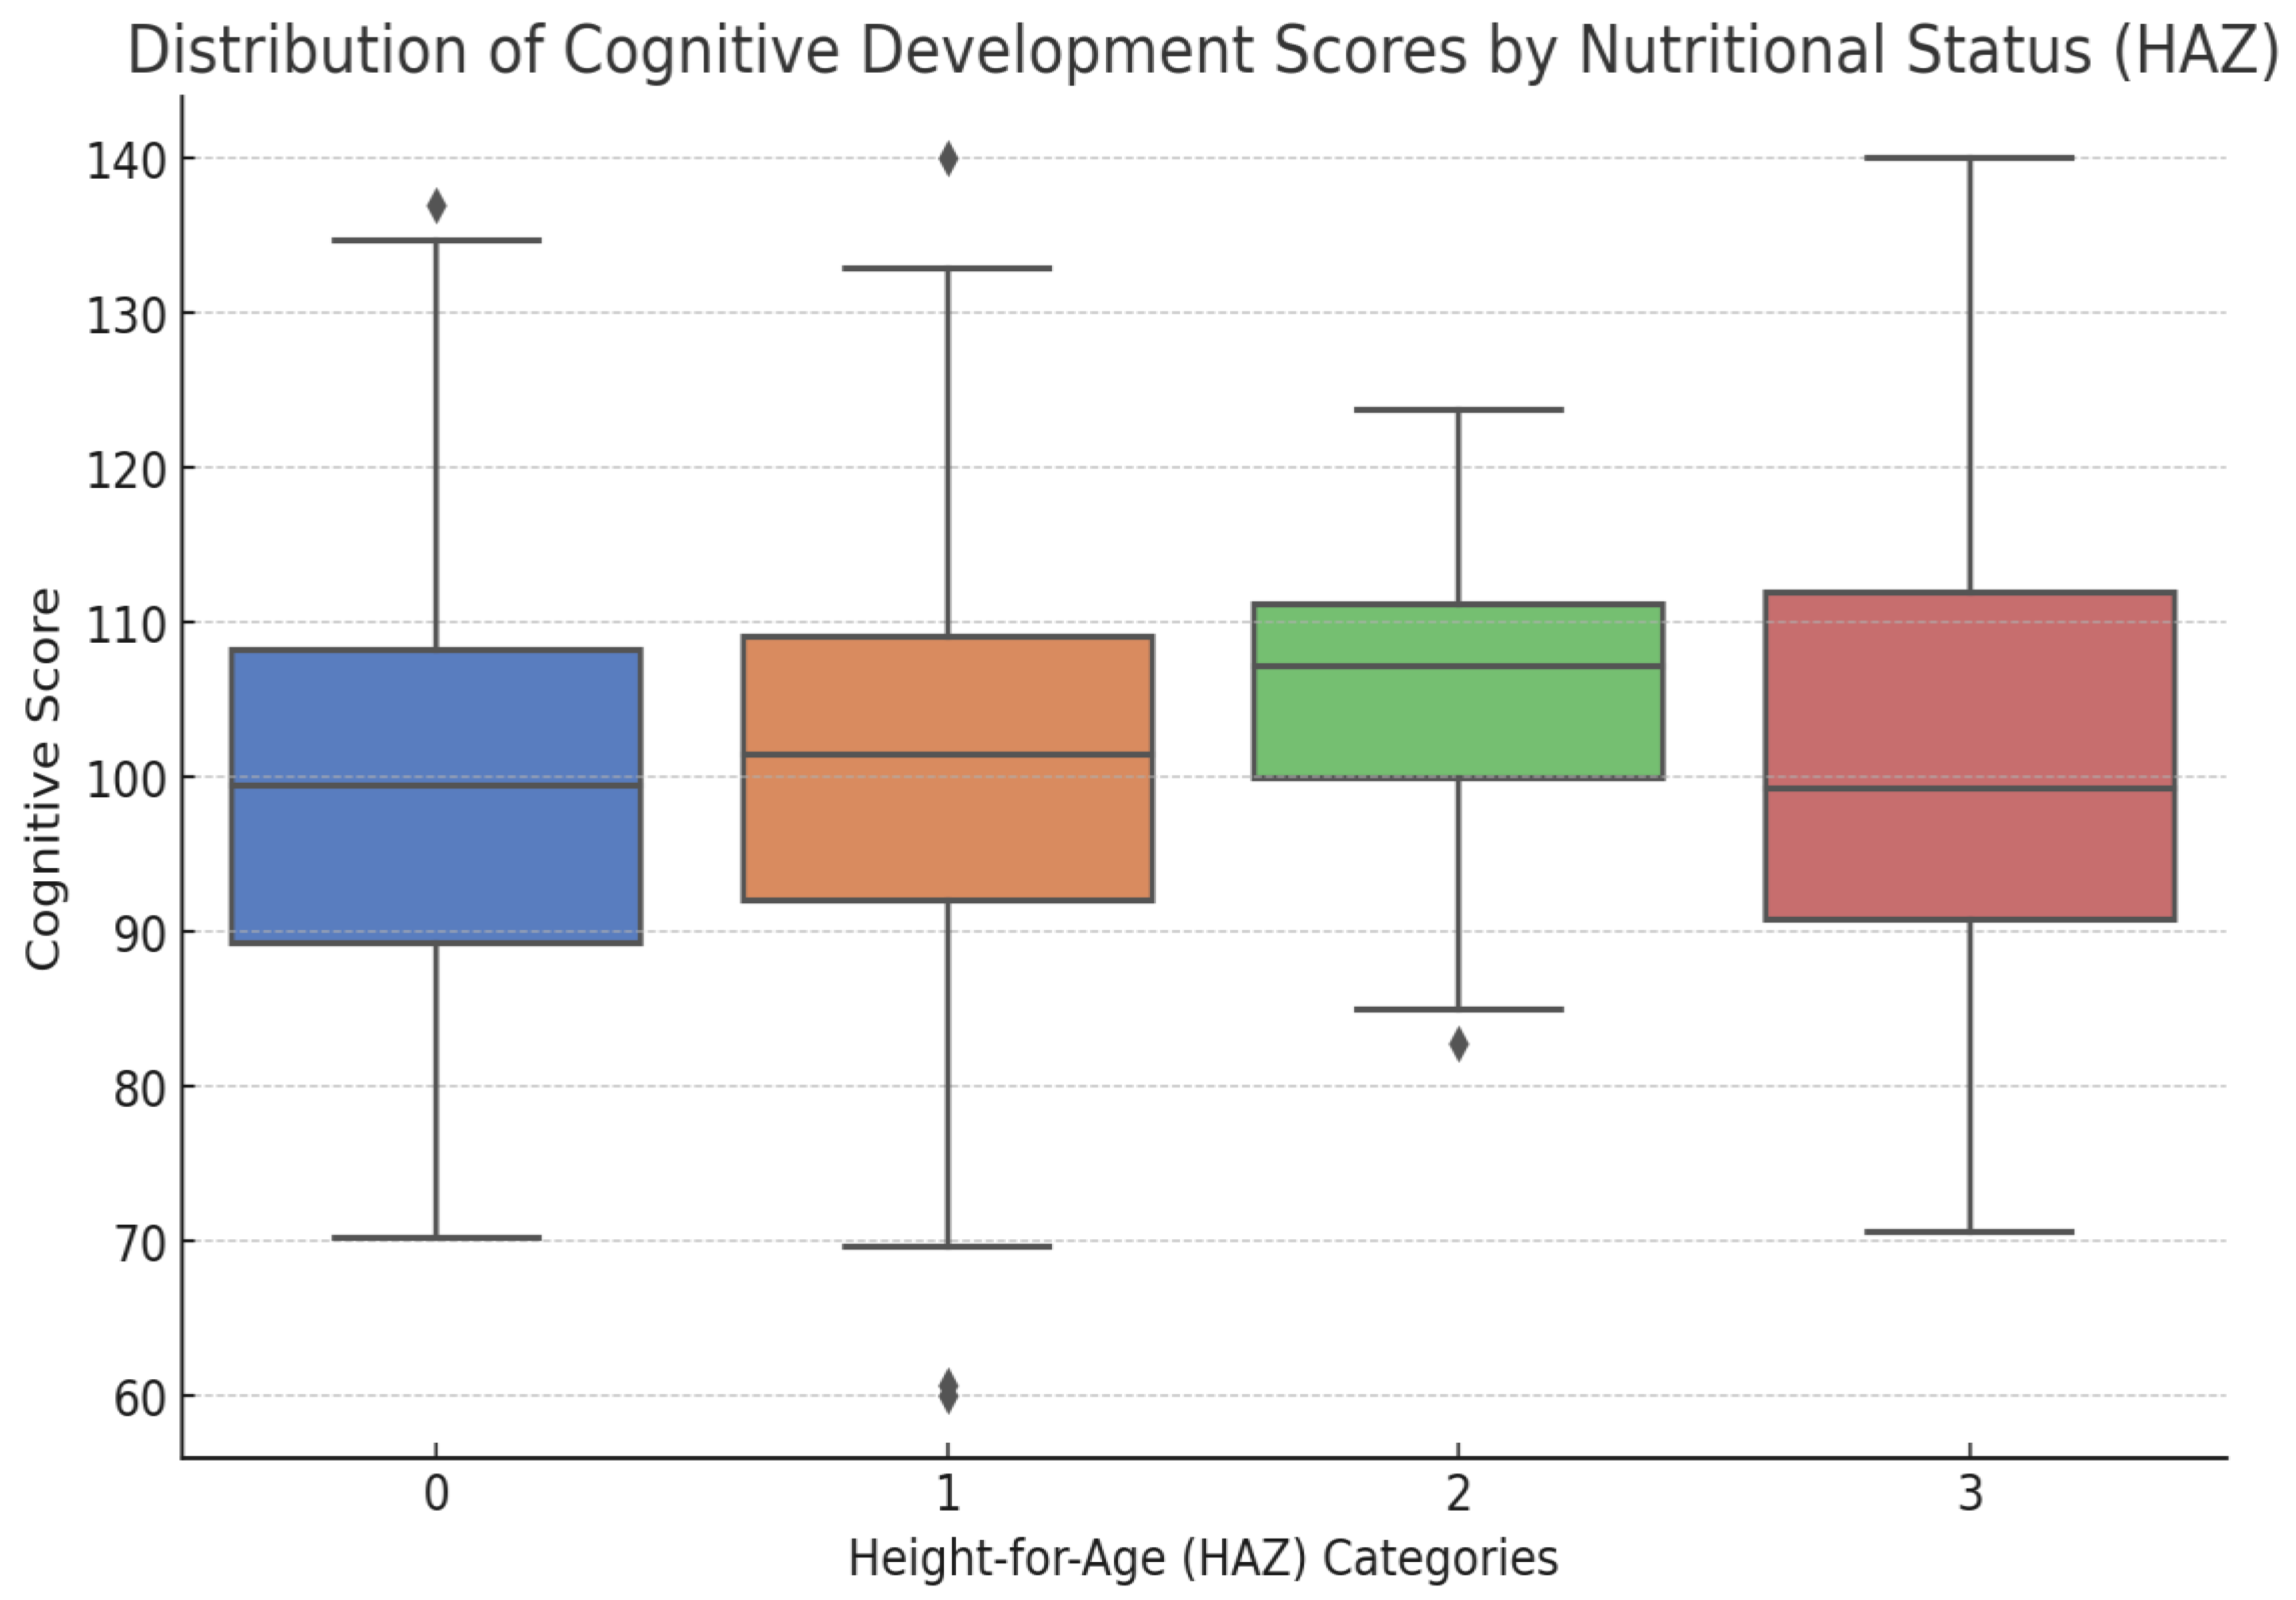
Nutritional Status: Children with normal HAZ scores had the highest cognitive development scores (M=105.38, SD=15.43), while severely stunted children had the lowest scores (M=96.08, SD=11.88).

4.3. Determinants of Nutritional Status (WAZ and HAZ):

·
Family Size: Children from families with two or fewer children had better nutritional outcomes, with lower WAZ z-scores (-0.85) compared to those from larger families (-1.31).
·
Wealth Status: Wealthier households had better nutritional outcomes, with children from the richest family background showing the lowest mean WAZ z-score (-1.54) and the poorest background showing the highest mean WAZ z-score (-0.80).

4.4. Regression Analysis with Independent Variables

·
HAZ Score: Wealth status was a significant predictor of HAZ (β = 0.258, p = 0.0001), explaining 6.4% of the variance. Other factors, such as child age, joint family structure, and parental illiteracy, were not significant.
·
WAZ Score: Wealth status (β = 0.318, p = 0.0001) and child age (β = -0.105, p = 0.034) were significant predictors of WAZ, with age negatively influencing nutritional outcomes. This model explained 12.4% of the variance in WAZ.

5. Discussion

The association between preschool cognitive development outcomes and BMI is not yet established, prompting the need to explore the connection between children's nutritional status and cognitive growth (Vassilakou, 2021; (Zemene et al., 2023). A study examines the correlation between children's nutritional status and cognitive growth, focusing on preschool toddlers, as this phenomenon is not widely studied (Pomati et al.2021). findings could be useful for designing and implementing targeted intervention schemes in the educational environment for preschool children (Łuszczki et al., 2023). Cognitive development, a complex set of mental functions, is crucial for health and well-being. The brain, which includes attention, memory, thinking, learning, and perception, plays a significant role in cognitive development (Hutagalung et al.2022). Education, which builds human capital, is linked to better jobs, income, socio-economic status, health care access, lifestyle, nutrition, and physical activity (Sharma et al.2024). Improved nutrition plays a crucial role in cell proliferation, DNA synthesis, neurotransmitter and hormone metabolism, and enzyme systems in the brain (Green et al., 2021). Early brain development may make it more vulnerable to dietary deficiencies (Costa et al., 2021). Undernutrition, particularly stunting and micronutrient deficiency, significantly impacts children's cognitive performance (Beckmann et al.2021). Underweight children have a higher risk of repetition and lower scores on cognitive tasks (Gerber et al.2, 021). Stunting is independently associated with cognitive processing speed, with children underweight and stunted performing the lowest on cognitive tasks (Strauß et al., 2023).Nutritional status is crucial for a population's health and welfare, as it directly impacts cognitive performance and the cognitive area (Muscaritoli, 2021). Optimal nutrition, characterized by a broad spectrum of macro and micronutrients, can lead to enhanced cognitive performance (Kuzik et al., 2022). The development of the neurological structure responsible for cognitive functions occurs mainly during the first 1,000 days of life, and inadequate nutrition can cause irreversible damage to the brain (Haan et al., 2021). Children from impoverished populations are more likely to suffer from diseases and have lower intellectual coefficients (Chen et al., 2021; Motokawa et al.2, 021). Overweight and obesity, associated with inadequate eating habits, are public health problems, particularly in young preschoolers (Fauziah et al., .2022). However, associations between overweight or obesity and cognitive abilities are often based on chance rather than true associations (Abreha & Zereyesus, 2021). Factors related to socioeconomic and cultural levels may also influence cognitive development (Govender et al., 2021). The objective of the present discussion was to explore the relationship between nutritional status and cognitive development in preschoolers around the world. Poor nutritional status and unfavorable environmental factors dramatically impair cognitive development, resulting in lower academic achievement and future chances (N Santos et al., 2008; Mathiarasan and Hüls2021). The goal was to identify preschoolers with low cognitive development, prevent probable learning problems (Deoni et al.2021; De et al.2021), and plan interventions to improve cognitive growth (Gallegos et al.2021; Cohen et al.2021). The studies postulated that nutritional status, MDI scores, and HOME scores are all significantly related, directly correlate with MDI scores, and have both direct and indirect effects on MDI scores (Roberts et al.2, 022; Richardson & Lovegrove, 2021; Sameroff & Seifer, 2021). Consider the modern technologies and risk factors associated with job stress and job satisfaction at the workplace and the effects of the climate crisis at home, also correlated with the COVID-19 pandemic (Adamopoulos, 2022; Adamopoulos and Syrou, 2022; Adamopoulos et al., 2022; Adamopoulos et al., 2023). In educational institutions, healthcare workers also see the effects on public health and adverse stress on employees and students in educational institutions of quality indoor air, and atmospher polutans risk factors as African dust efect popoulation public health, (Adamopoulos et al., 2025; Khan et al., 2024; Adamopoulos & Syrou, 2024). The findings explore the relationship between nutritional status and cognitive development in preschool childhood (Bassuoni et al.2021), considering factors such as sex, hyperactivity, school remoteness, delayed age entrance (Mantey et al., 2021), schooling quarter, and mental health perception (Bustami et al., 2021). The findings suggest that nutritional status can vary over time, impacting cognitive skills (Corona et al.2, 022). To design effective educational strategies, teachers should be aware of these variables and implement pacing strategies that align with students' abilities (Tandoh et al.2021). It's crucial to consider the constantly changing nutritional status of the population and conduct new anthropometric and nutrition probes (Lapidot et al.2, 023; Cardino et al., 2023). Cognitive development is crucial during the preschool period in Indonesia, but child health and education are lacking. A 2016 study found a 14.51% delayed cognitive development prevalence, with underweight, stunting, and wasting among pre-schoolers. Adequate nutrition is needed to support cognitive development, including protein, fat, Vitamin B1, Vitamin A, Vitamin C, iron, and zinc (Sharma et al., 2024). The government must prioritize the nutritional needs of preschool children to maximize their cognitive development potential; the National School Feeding Program should be established to ensure daily nutritional fulfillment(Said et al., 2023), considering social welfare levels (Amandus et al., 2024). Emphasizing food diversity and nutrient content is crucial for programs aiming to improve cognitive ability (Irfani & O'Boyle). Further research on nutrition and cognitive development is needed to appreciate intervention potential fully (Padhi et al.2024). Planners should consider the multi-faceted role of nutritional factors and ensure good synergies between them (Dey et al., 2024). Nutrition plays a significant role in chronic diseases, which are linked to cognitive ability, and should be considered in specialists' interventions (Dominic et al.2, 024; Siagian, 2023).
The important findings correlate with the literature review and case reports on this field improve significant results:
1. Nutrition status emerged as a highly significant predictor, with better nutrition status (indicated by higher HAZ scores) strongly associated with higher cognitive development scores.
2. Family structure remained a significant predictor, with children from joint families showing significantly lower cognitive development scores. This suggests that family dynamics, such as joint family arrangements, may affect a child's developmental trajectory.
3. The child's age continued to show a marginally significant negative effect, indicating that older children may experience a slight decline in cognitive development. This could be attributed to caregivers' tendency to provide less nurturing as children grow older, often redirecting attention and resources toward younger siblings. Additionally, older children may assume more caregiving responsibilities for younger family members, which could reduce the time and energy available for their cognitive development (Pandey, 1991).

6. Conclusion

The findings of this study emphasize the critical role of nutritional status and family structure in shaping cognitive development. Nutritional indicators such as HAZ and WAZ were found to be significant predictors, with better nutritional status strongly correlating with higher cognitive development scores. Family structure also emerged as a significant factor, with children from joint families exhibiting lower cognitive development scores, suggesting that family dynamics may influence developmental outcomes. Age was identified as a marginally significant predictor, highlighting that older children may experience slight declines in cognitive development.
These results underscore the importance of addressing both nutritional and familial factors to support cognitive development. The study calls for interventions that focus on improving children's nutritional status and considering family structures in educational programs. Policies aimed at enhancing child nutrition, supporting family dynamics, and promoting age-appropriate developmental activities can significantly contribute to better cognitive outcomes for children. This cross-sectional study found that preschoolers who are stunted and obese are more likely to have a low cognitive development score. Therefore, nutritional and educational interventional programs targeting such preschoolers are highly recommended. Public health authorities also need to start working on the educational and nutritional status of preschoolers. Preschool plays a significant role in the cognitive and productive development of preschool children. This study confirmed the previously established relationships between socio-economic factors, including children's and families' socio-demographic status, and the cognitive development score of Nepalese preschool children. Research has shown that low ideas children or children from poor families are more likely to have poor cognitive development. This might be due to the fact that children from poor or low-wealth families are less likely to develop preschool learning abilities.

Funding

The author did not receive any financial support for this study.

CRediT authorship contribution statement

P. Sharma: Writing – original draft, Visualization, Methodology, Formal analysis, Data curation, Conceptualization. C. B. Budhathoki: Writing – original draft, Visualization, Validation, Methodology, Conceptualization. B. Devkota: Writing – review & editing, Validation, Conceptualization. N. Syrou: Writing – review & editing, Validation, Conceptualization. A. Valamontes: Writing – review & editing, Validation, Supervision, Conceptualization. I. Adamopoulos: Writing – original draft, Writing – review & editing, Validation, Supervision, Data curation, Methodology, Resources, Conceptualization, Project Administration.

Declaration of competing interest

The authors declare that they have no known competing financial interests or personal relationships that could have appeared to influence the work reported in this paper.

Acknowledgments

We would like to extend our heartfelt gratitude to all the individuals who actively participated in this study. Additionally, we would like to express our appreciation to the anonymous reviewers for their valuable feedback and insightful suggestions on improving this article.

Conflict of interest

None declared

References

  1. Abreha, S. K., & Zereyesus, Y. A. (2021). Women's empowerment and infant and child health status in sub-Saharan Africa: A systematic review. Maternal and Child Health Journal. [CrossRef]
  2. Adamopoulos, I. P. (2022). Job Satisfaction in Public Health Care Sector, Measures Scales and Theoretical Background. European Journal of Environment and Public Health, 6(2), em0116. [CrossRef]
  3. Adamopoulos, I. P., & Syrou, N. F. (2022). Associations and Correlations of Job Stress, Job Satisfaction and Burn out in Public Health Sector. European Journal of Environment and Public Health, 6(2), em0113. [CrossRef]
  4. Adamopoulos, I., Lamnisos, D., Syrou, N., & Boustras, G. (2022). Public health and work safety pilot study: Inspection of job risks, burnout syndrome, and job satisfaction of public health inspectors in Greece. Safety Science.
  5. Adamopoulos, I., Syrou, N., Lamnisos, D., & Boustras, G. (2023). Cross-sectional nationwide study in occupational safety and health: Inspection of job risks, burnout syndrome, and job satisfaction of public health inspectors during the COVID-19 pandemic in Greece. Safety Science, 158, 105960.
  6. Adamopoulos, I., Frantzana, A., & Syrou, N. (2024). Climate Crises Associated with Epidemiological, Environmental, and Ecosystem Effects of a Storm: Flooding, Landslides, and Damage to Urban and Rural Areas (Extreme Weather Events of Storm Daniel in Thessaly, Greece). Medical Sciences Forum, 25(1), 7. [CrossRef]
  7. Adamopoulos, I., Syrou, N. Climate Change, Air Pollution, African Dust Impacts on Public Health and Sustainability in Europe, European Journal of Public Health, Volume 34, Issue Supplement_3, November 2024, ckae144.1374, . [CrossRef]
  8. Adamopoulos, I. P., Syrou, N. F., Mijwil, M., Thapa, P., Ali, G., & Dávid, L. D. (2025). Quality of indoor air in educational institutions and adverse public health in Europe: A scoping review. Electronic Journal of General Medicine, 22(2), em632. [CrossRef]
  9. Amandus, H., Baedlawi, A., Handayani, V. W., Linda, E., Alina, T., & Maria, S. (2024). Determinants of maternal health-seeking behavior for stunted children in Indonesian community health centers: A cross-sectional study. Population Medicine, 6(October), 1-7. [CrossRef]
  10. Araújo, L. A. D., Veloso, C. F., Souza, M. D. C., Azevedo, J. M. C. D., & Tarro, G. (2021). The potential impact of the COVID-19 pandemic on child growth and development: A systematic review. Jornal de Pediatria, 97, 369-377. [CrossRef]
  11. Bassuoni, R. A., Mohamed, M. S., Monir, Z. M., & AbdEl-Megeid, A. A. (2021). Relationship between nutritional status and cognitive performance among primary school students. Egyptian Journal of Nutrition, 36(2), 49-87.
  12. Beckmann, J., Lang, C., du Randt, R., Gresse, A., Long, K. Z., Ludyga, S., ... & Gerber, M. (2021). Prevalence of stunting and relationship between stunting and associated risk factors with academic achievement and cognitive function: A cross-sectional study with South African primary school children. International Journal of Environmental Research and Public Health, 18(8), 4218. [CrossRef]
  13. Bustami, B., Suryana, S., Junita, D., Kushargina, R., & Eka, A. (n.d.). The influence of adequate levels of zinc-iron and hemoglobin levels on linear growth and cognitive development in toddlers: A cross-sectional study in Aceh. i-Scientific.org.
  14. Cardino, V. N., Goeden, T., Yakah, W., Ezeamama, A. E., & Fenton, J. I. (2023). New perspectives on the associations between blood fatty acids, growth parameters, and cognitive development in global child populations. Nutrients, 15(8), 1933. [CrossRef]
  15. Chen, K., Liu, C., Liu, X., Wang, Z., Luo, R., Li, S., Yu, Y., & Alderman, H. (2021). Nutrition, cognition, and social emotion among preschoolers in poor, rural areas of South Central China: Status and correlates.
  16. Chen, S., Luo, S., & Yan, C. (2021). Gut microbiota implications for health and welfare in farm animals: A review. Animals, 11(2), 459. [CrossRef]
  17. Cohen Kadosh, K., Muhardi, L., Parikh, P., Basso, M., Jan Mohamed, H. J., Prawitasari, T., ... & Geurts, J. M. (2021). Nutritional support of neurodevelopment and cognitive function in infants and young children—An update and novel insights. Nutrients, 13(1), 199. [CrossRef]
  18. Corona, L. P., Andrade, F. C. D., da Silva Alexandre, T., de Brito, T. R. P., Nunes, D. P., & de Oliveira Duarte, Y. A. (2022). Higher hemoglobin levels are associated with better physical performance among older adults without anemia: A longitudinal analysis. BMC Geriatrics, 22(1), 233. [CrossRef]
  19. Cortés-Albornoz, M. C., García-Guáqueta, D. P., Velez-van-Meerbeke, A., & Talero-Gutiérrez, C. (2021). Maternal nutrition and neurodevelopment: A scoping review. Nutrients, 13(10), 3530. [CrossRef]
  20. Costa, H. M., Partanen, P., & Van Herwegen, J. (2021). The role of working memory, processing speed, and approximate number system abilities in low maths achievement among preschoolers.
  21. Cui, X., McGrath, J. J., Burne, T. H. J., & Eyles, D. W. (2021). Vitamin D and schizophrenia: 20 years on. Molecular Psychiatry. [CrossRef]
  22. De Figueiredo, C. S., Sandre, P. C., Portugal, L. C. L., Mázala-de-Oliveira, T., da Silva Chagas, L., Raony, Í., ... & Bomfim, P. O. S. (2021). COVID-19 pandemic impact on children and adolescents' mental health: Biological, environmental, and social factors. Progress in Neuro-Psychopharmacology and Biological Psychiatry, 106. [CrossRef]
  23. Deoni, S. C., Beauchemin, J., Volpe, A., D’Sa, V., & Resonance Consortium. (2021). Impact of the COVID-19 pandemic on early child cognitive development: Initial findings in a longitudinal observational study of child health. MedRxiv.
  24. Dey, S., Zahangir, M. S., Faruk, M. O., Hossain, S., & Hossain, M. R. (2024). Prevalence and determinants of malnutrition among women of reproductive age in Bangladesh. Journal of Medicine, Surgery, and Public Health, 2, 100096.
  25. Dominic, N., Bhatia, V., Dabadghao, P., & Ansari, M. S. (2024). Long-term outcomes in patients with differences in sex development in Lucknow, India. Clinical Endocrinology.
  26. Fauziah, N., Aviani, J. K., Agrianfanny, Y. N., & Fatimah, S. N. (2022). Intestinal parasitic infection and nutritional status in children under five years old: A systematic review. Tropical Medicine and Infectious Disease, 7(11), 371.
  27. Fouad, H. M., Yousef, A., Afifi, A., Ghandour, A. A., Elshahawy, A., Elkhawass, A., ... & Shalaby, S. (2023). Prevalence of malnutrition & anemia in preschool children: A single-center study. Italian Journal of Pediatrics, 49(1), 75.
  28. Gallegos, D., Eivers, A., Sondergeld, P., & Pattinson, C. (2021). Food insecurity and child development: a state-of-the-art review. International Journal of Environmental Research and Public Health, 18(17), 8990. [CrossRef]
  29. Gerber, M., Lang, C., Beckmann, J., du Randt, R., Gall, S., Seelig, H., ... & Walter, C. (2021). How are academic achievement and inhibitory control associated with physical fitness, soil-transmitted helminth infections, food insecurity and stunting among South African primary schoolchildren? BMC Public Health, 21, 1-15. [CrossRef]
  30. Govender, I., Rangiah, S., Kaswa, R., & Nzaumvila, D. (2021). Malnutrition in children under the age of 5 years in a primary health care setting. South African Family Practice, 63(1). [CrossRef]
  31. Granziera, F., Guzzardi, M. A., & Iozzo, P. (2021). Associations between the Mediterranean diet pattern and weight status and cognitive development in preschool children. Nutrients. [CrossRef]
  32. Green, C. C., Smith, J., Bent, C. A., Chetcuti, L., Sulek, R., Uljarević, M., & Hudry, K. (2021). Differential predictors of well-being versus mental health among parents of pre-schoolers with autism. Autism, 25(4), 1125-1136. [CrossRef]
  33. Gutierrez, L., Folch, A., Rojas, M., Cantero, J. L., Atienza, M., Folch, J., ... & Bullo, M. (2021). Effects of nutrition on cognitive function in adults with or without cognitive impairment: a systematic review of randomized controlled clinical trials. Nutrients, 13(11), 3728. [CrossRef]
  34. Haan, R., Ali Alblooshi, M. E., Syed, D. H., Dougman, K. K., Al Tunaiji, H., Campos, L. A., & Baltatu, O. C. (2021). Health and well-being of athletes during the coronavirus pandemic: a scoping review. Frontiers in Public Health, 9, 641392. [CrossRef]
  35. Howlett, J. R., Nelson, L. D., & Stein, M. B. (2022). Mental health consequences of traumatic brain injury. Biological Psychiatry. [CrossRef]
  36. Hutagalung, F. D., Peng, C. F., Adams, D., & Fitriana, N. (2022). A comparative study of children's cognitive ability in Malaysian public and private pre-schools. Journal of Nusantara Studies (JONUS), 7(2), 377-398. [CrossRef]
  37. Irfani, B., & O'Boyle, A. (). Teacher practices and student preferences of oral corrective feedback in Indonesian EFL classrooms: A Vygotskian perspective. Training.
  38. Khan, A. J. J., Yar, S., Fayyaz, S., Adamopoulos, I., Syrou, N., & Jahangir, A. (2024). From Pressure to Performance, and Health Risks Control: Occupational Stress Management and Employee Engagement in Higher Education. Preprints. [CrossRef]
  39. Kuzik, N., da Costa, B. G., Hwang, Y., Verswijveren, S. J., Rollo, S., Tremblay, M. S., ... & Saunders, T. J. (2022). School-related sedentary behaviours and indicators of health and well-being among children and youth: a systematic review. International Journal of Behavioral Nutrition and Physical Activity, 19(1), 40. [CrossRef]
  40. Kwansa, A. L., Akparibo, R., Cecil, J. E., Infield Solar, G., & Caton, S. J. (2022). Risk factors for overweight and obesity within the home environment of preschool children in Sub-Saharan Africa: A systematic review. Nutrients, 14(9), 1706. [CrossRef]
  41. Lapidot, Y., Maya, M., Reshef, L., Cohen, D., Ornoy, A., Gophna, U., & Muhsen, K. (2023). Relationships of the gut microbiome with cognitive development among healthy school-age children. Frontiers in Pediatrics, 11, 1198792. [CrossRef]
  42. Łuszczki, E., Jagielski, P., & Martínez-Rodríguez, A. (2023). Metabolic pathways and consequences of malnutrition in children and adolescents. Frontiers in Nutrition. [CrossRef]
  43. Lynn Terista, S. (2000). Nutrition and student achievement in kindergarten students: an experimental study.
  44. Mannan Liza, M., Roy, S., Azmain Iktidar, M., Chowdhury, S., & Bin Sharif, A. (2024). Nutritional status, dietary habits, and their relation to cognitive functions: A cross-sectional study among the school-aged (8–14 years) children of Bangladesh.
  45. Mantey, A. A., Annan, R. A., Lutterodt, H. E., & Twumasi, P. (2021). Iron status predicts cognitive test performance of primary school children from Kumasi, Ghana. PLOS ONE. [CrossRef]
  46. Mathiarasan, S., & Hüls, A. (2021). Impact of environmental injustice on children’s health—interaction between air pollution and socioeconomic status. International Journal of Environmental Research and Public Health, 18(2), 795. [CrossRef]
  47. Ministry of Health, N. E. and I. (2017). Nepal Demographic and Health Survey 2016. In MoHN & New ERA. [Accessed 12-01-2025] at, https://dhsprogram.com/pubs/pdf/FR336/FR336.pdf.
  48. MoHP. (2022). Nepal Demographic and Health Survey 2022 Key Indicators Report. Ministry of Health and Population, Kathmandu.[Accessed 12-01-2025]at, https://mohp.gov.np/uploads/Resources/Nepal%20Demographic%20and%20Health%20Survey%202022%20Key%20Indicators%20Report.pdf.
  49. Motokawa, K., Mikami, Y., Shirobe, M., Edahiro, A., Ohara, Y., Iwasaki, M., ... & Hirano, H. (2021). Relationship between chewing ability and nutritional status in Japanese older adults: a cross-sectional study. International Journal of Environmental Research and Public Health, 18(3), 1216. [CrossRef]
  50. Muscaritoli, M. (2021). The impact of nutrients on mental health and well-being: insights from the literature. Frontiers in Nutrition. [CrossRef]
  51. Mwadiwa, R. J., Kearney, J. E., & Napier, C. (2016). Determining nutritional status and food intake patterns of preschool children in Empangeni, South Africa.
  52. N Santos, D., Marlúcia O Assis, A., Cecília S Bastos, A., M Santos, L., Antonio ST Santos, C., Strina, A., S Prado, M., M Almeida-Filho, N., C Rodrigues, L., & L Barreto, M. (2008). Determinants of cognitive function in childhood: A cohort study in a middle-income context.
  53. Nyaradi, A., Li, J., Hickling, S., Foster, J., & Oddy, W. (2013). The role of nutrition in children’s neurocognitive development, from pregnancy through childhood. [CrossRef]
  54. Padhi, B. K., Gaidhane, A. M., Satapathy, P., Bushi, G., Ballal, S., Bansal, P., ... & Shabil, M. (2024). Assessing the impact of ecological, climatic, and socioeconomic factors on age-specific malaria incidence in India: a mixed-model approach using the Global Burden of Disease Study (2010–2019). Malaria Journal, 23(1), 332. [CrossRef]
  55. Pandey, H. (1991). Impact of preschool education component in integrated child development services programme on the cognitive development of children. Journal of Tropical Pediatrics, 37(5), 235–239. [CrossRef]
  56. Pomati, M., Mendoza-Quispe, D., Anza-Ramirez, C., Hernández-Vásquez, A., Carrillo Larco, R. M., Fernandez, G., ... & Bernabé-Ortiz, A. (2021). Trends and patterns of the double burden of malnutrition (DBM) in Peru: A pooled analysis of 129,159 mother-child dyads. International Journal of Obesity, 45(3), 609-618. [CrossRef]
  57. Richardson, D. P. & Lovegrove, J. A. (2021). Nutritional status of micronutrients as a possible and modifiable risk factor for COVID-19: A UK perspective. British Journal of Nutrition. [CrossRef]
  58. Roberts, M., Tolar-Peterson, T., Reynolds, A., Wall, C., Reeder, N., & Rico Mendez, G. (2022). The effects of nutritional interventions on the cognitive development of preschool-age children: A systematic review. Nutrients, 14(3), 532. [CrossRef]
  59. Said, W. P., Arto, K. S., Pratita, W., & Sufitni, S. (2023). Intelligence quotient (IQ) outcome in children with early-treated congenital hypothyroidism: a systematic review and meta-analysis. Paediatrica Indonesiana, 63(4), 290-7. [CrossRef]
  60. Sameroff, A. J. & Seifer, R. (2021). Accumulation of environmental risk and child mental health. Children of Poverty.
  61. Santander Ballestín, S., Giménez Campos, M. I., Ballestin Ballestin, J., & Luesma Bartolomé, M. J. (2021). Is supplementation with micronutrients still necessary during pregnancy? A review. Nutrients, 13(9), 3134. [CrossRef]
  62. Sharma, P. (2022). Nutritional practices of the preschool-aged children and associated factors: A cross-sectional study in Rupandehi district of Nepal. Journal of Health Promotion, 10(1), 59–72. [CrossRef]
  63. Sharma, P. (2023). Effect of Nutrition and Psychosocial Stimulation on Cognitive Development of Preschool Children in Nepal. Unpublished PhD thesis, Faculty of Education, Tribhuvan University, Kathmandu, Nepal.
  64. Sharma, P., & Budhathoki, C. B. (2023). Effects of Primary Caregivers’ Feeding Habits on the Nutrition Status of Pre-schoolers in Rupandehi District of Nepal. Journal of Health Promotion, 11(1), 86–103. [CrossRef]
  65. Sharma, P., Bahadur Budhathoki, C., Devkota, B., & Kumar Singh, J. (2024). Healthy eating encouragement and socio-demographic factors associated with cognitive development among pre-schoolers: a cross-sectional evaluation in Nepal.
  66. Sharma, P., Budhathoki, C. B., Devkota, B., & Singh, J. K. (2024). Healthy eating encouragement and socio-demographic factors associated with cognitive development among pre-schoolers: A cross-sectional evaluation in Nepal. European Journal of Public Health, 34(2), 230-236. [CrossRef]
  67. Sharma, P., Budhathoki, C. B., Maharjan, R. K., & Singh, J. K. (2023). Nutritional status and psychosocial stimulation associated with cognitive development in preschool children: A cross-sectional study at Western Terai, Nepal. PLOS ONE, 18(3), e0280032. [CrossRef]
  68. Sharma, P., Budhathoki, C. B., Maharjan, R. K., Devkota, B., Upreti, Y. R., Bhandari, T. R., & Tulsi, R. B. (2022). Nutrition status and associated factors among preschool children: A cross-sectional study in Nepal. International Journal of Elementary Education, 11(3), 76–83.
  69. Sharma, P., Budhathoki, C.B. & Thapa, P. (2024). Factors associated with psychosocial stimulation development of preschool children in Rupandehi District of Nepal. KMC Journal, 6(1), 241–259.
  70. Siagian, F. E. (2023). Role of intestinal parasitic infection in stunting. South Asian Journal of Research in Microbiology.
  71. Soliman, A., De Sanctis, V., Alaaraj, N., Ahmed, S., Alyafei, F., Hamed, N., & Soliman, N. (2021). Early and long-term consequences of nutritional stunting: From childhood to adulthood. Acta Bio Medica: Atenei Parmensis, 92(1).
  72. Strauß, H., Venables, P., & Zentner, M. (2023). Associations between early childhood poverty and cognitive functioning throughout childhood and adolescence: A 14-year prospective longitudinal analysis of the …. PLOS ONE.
  73. Tandoh, M. A., Appiah, A. O., & Edusei, A. K. (2021). Prevalence of anemia and undernutrition of adolescent females in selected schools in Ghana. Journal of Nutrition and Metabolism, 2021(1), 6684839.
  74. Tsan, L., Décarie-Spain, L., Noble, E. E., & Kanoski, S. E. (2021). Western diet consumption during development: Setting the stage for neurocognitive dysfunction. Frontiers in Neuroscience, 15, 632312. [CrossRef]
  75. Vassilakou, T. (2021). Childhood malnutrition: Time for action. Children, 8(10), 849. [CrossRef]
  76. Yamane, T. (2009). An Introductory Analysis. In HARPER & ROW, NEW YORK, EVANSTON & LONDON AND JOHN WEATHERHILL, INC., TOKYO. [CrossRef]
  77. Zavitsanou, A., & Drigas, A. (2021). Nutrition in mental and physical health. Technium Social Sciences Journal, 19, 226-239.
  78. Zemene, M. A., Anley, D. T., Gebeyehu, N. A., Adella, G. A., Kassie, G. A., Mengstie, M. A., ... & Dessie, A. M. (2023). Concurrent stunting and overweight or obesity among under-five children in sub-Saharan Africa: A multilevel analysis. Archives of Public Health, 81(1), 119. [CrossRef]
Figure 1. The histogram of the frequency and regression standardized residual of the cognitive development.
Preprints 149568 g001
Figure 2. The scatter plot of the predicted value and regression standardized residual of the cognitive development.
Preprints 149568 g002
Figure 3. The Normal P-P Plot of the predicted value, and regression standardized residual of the cognitive development correlated with observed cum prob.
Preprints 149568 g003
Table 1. Analysis of Cognitive Development across Independent and Demographic Variables.
Variables Category N (%) Mean (SD) 95% CI P-value
Gender of children Male
Female
192 (50.7)
187 (49.3)
101.65 (15.14)
102.29 (15.56)
-3.73/2.46
-3.74/2.46
.686
Age of children Three years
Four years
Five years
33 (8.7)
171 (45.1)
175 (46.2)
109.57 (21.61)
101.56 (12.73)
100.93 (15.95)
101.91/117.24
99.64/103.48
98.55/103.31
.011*
Number of children Two or less
More than two
271(71.5)
108 (28.5)
102.63 (15.27)
100.34 (15.43)
-1.15/5.70
-1.17/5.73
.192
Types of family Nuclear
Joint
180 (47.5)
199 (52.5)
103.83 (14.23)
100.28 (16.12)
0.47/6.64
0.49/6.62
.024*
Mothers’ education Illiterate
Basic level
Secondary and above
90 (23.7)
175 (46.2)
114 (30.1)
99.64 (13.69)
100.46 (15.78)
106.12 (15.17)
96.77/102.51
98.10/102.81
103.30/108.93
.002**
Fathers’ education Illiterate
Basic level
Secondary and above
58 (14.3)
188 (49.6)
133 (35.1)
100.13 (13.46)
100.41(15.18)
104.96 (15.96)
96.59/103.67
98.22/102.59
102.23/107.70
.019*
Wealth status Poorest
Poor
Middle
Rich
Richest
73 (19.3)
72 (19.0)
79 (20.8)
74 (19.5)
81(21.4)
102.69 (17.95)
105.06 (15.50)
102.49 (14.16)
99.62 (14.98)
100.19 (13.77)
98.51/106.88
101.42/108.71
99.32/105.66
96.14/103.09
97.15/103.24
.198
HAZ Normal
Moderate
Severe (Stunted)
Obese
169 (44.6)
138 (36.4)
57 (15.0)
15 (4.0)
105.38 (15.43)
101.68 (15.34)
96.08 (11.88)
88.46 (12.05)
103.04/107.72
99.10/104.27
92.93/99.24
81.78/95.14
.0001***
WAZ Normal
Moderate
Severe (Wasted)
Obese
175 (46.2)
135 (35.6)
58 (15.3)
11 (2.9)
102.70 (15.23)
103.11(15.96)
97.84 (14.79)
98.09 (7.13)
100.42/104.97
100.39/105.82
93.95/101.73
93.29/102.88
.109
Total 379 (100)
Note: Significant at *p<0.05, **p<0.01, ***p<0.0001, # p-value calculated for T-test and ONE WAY ANOVA.
Table 2. Analysis of Weight for Age (WAZ) and Height for Age (HAZ) across Demographic Variables.
Variables Category WAZ HAZ
Mean (SD) 95% CI P-value Mean (SD) 95% CI P-value
Gender of children Male
Female
-0.98 (1.06)
-0.99 (1.14)
-0.21/0.23
-0.21/0.23
.916 -0.97 (1.11)
-1.06 (1.18)
-0.14/0.31
-0.14/0.31
.476
Age of children Three years
Four years
Five years
-0.92 (1.15)
-1.02 (1.16)
-1.03 (1.13)
-1.32/-0.51
-1.20/-0.85
-1.20/-0.86
.870 -0.92 (1.15)
-1.02 (1.16)
-1.03 (1.13)
-1.32/-0.51
-1.20/-0.85
-1.20/-0.86
.870
Number of children Two or less
More than two
-0.85 (1.06)
-1.31(1.12)
0.21/0.69
0.20/0.70
.000
***
-0.95 (1.09)
-1.18 (1.26)
-0.02/0.49
-0.04/0.50
.073
Types of family Nuclear
Joint
-0.89 (1.07)
-1.06 (1.12)
-0.05/0.39
-0.05/0.39
.134 -0.92 (1.08)
-1.11(1.20)
-0.04/0.42
-0.04/0.41
.111
Mothers’ education Illiterate
Basic level
Secondary+
-1.12 (1.26)
-1.00 (1.08)
-0.95 (1.15)
-1.39/-0.86
-1.17/-0.84
-1.17/-0.74
.574 -1.12 (1.26)
-1.00 (1.08)
-0.95 (1.15)
-1.39/-0.86
-1.17/-0.84
-1.17/-0.74
.574
Fathers’ education Illiterate
Basic level
Secondary +
-0.86 (1.13)
-1.04 (1.14)
-1.06 (1.17)
-1.16/-0.56
-1.20/-0.87
-1.26/-0.85
.517 -0.86 (1.13)
-1.04 (1.14)
-1.06 (1.17)
-1.16/-0.56
-1.20/-0.87
-1.26/-0.85
.517
Wealth status Poorest
Poor
Middle
Rich
Richest
-0.80 (1.05)
-0.84 (1.03)
-0.93 (1.16)
-0.91(1.10)
-1.54 (1.22)
-1.04/-0.55
-1.09/-0.60
-1.19/-0.67
-1.17/-0.66
-1.81/-1.27
.0001
***
-0.80 (1.05)
-0.84 (1.03)
-0.93 (1.16)
-0.91(1.10)
-1.54 (1.22)
-1.04/-0.55
-1.09/-0.60
-1.19/-0.67
-1.17/-0.66
-1.81/-1.27
.0001
***
Table 3. Multiple Regressions Between HAZ and WAZ With Demographic Variables.
Predictors Standardized
Coefficients β
(95 % CI)
Model I
p-value Standardize
Coefficients β
(95 % CI)
Model II
p-value
Age of child -0.021 (-0.218/ 0.141) 0.675 -0.105 (-0.348/ -0.014) 0.034
Joint family -0.09 (-0.437/ 0.023) 0.078 -0.089 (-0.409/0.018) 0.073
Mother's illiteracy -0.069 (-0.482/0.11) 0.217 0.007 (-0.255/0.294) 0.891
Father’s Illiteracy -0.011 (-0.265/ 0.213) 0.831 0.006 (-0.207/0.236) 0.896
Wealth status 0.258 (0.205/0.505) 0.0001*** 0.318 (0.28/0.559) 0.0001
***
R Square 6.4% 12.4%
Std. Error 1.12 1.03
F (P-value) 5.067 0.0001
***
10.547 0.0001
***
Model-I: HAZ score adjusted with socio-economic factors; Model-II: WAZ score adjusted with socio-economic factors.
Table 4. Multiple Regressions Model among Independent and Demographic Variables Predicting Cognitive Development.
Predictors Standardized
Coefficients β (95 % CI)
Model I
p-value Standardize
Coefficients β (95 % CI)
Model II
p-value
Age of child -0.131(-5.576/-0.726) 0.011* -0.141(-5.736/-1.036) 0.005**
Joint family -0.131 (-7.121/-0.914) 0.011* -0.112 (-6.431/-0.440) 0.025*
Mother's illiteracy 0.028 (-2.997/4.990) 0.624 0.055 (-1.867/5.839) 0.311
Father’s Illiteracy 0.031(-2.221/4.223) 0.542 0.036 (-1.928/4.263) 0.459
Wealth status 0.087 (-0.434/3.620) 0.123 0.043 (-1.247/2.828) 0.446
HAZ 0.38 (3.235/6.896) 0.0001***
WAZ -0.171(-4.348/-0.401) 0.018*
R Square 4.3% 12.2%
Std. Error 15.10 14.50
F (P-value) 3.358 0.006** 77.376 0.0001***
Model-I: Cognitive development score with socio-economic factors; Model-II: Cognitive development score adjusted with HAZ, WAZ, and socio-economic factors. Note: Significant at *p<0.05, **p<0.01, ***p<0.0001.
Disclaimer/Publisher’s Note: The statements, opinions and data contained in all publications are solely those of the individual author(s) and contributor(s) and not of MDPI and/or the editor(s). MDPI and/or the editor(s) disclaim responsibility for any injury to people or property resulting from any ideas, methods, instructions or products referred to in the content.
Copyright: This open access article is published under a Creative Commons CC BY 4.0 license, which permit the free download, distribution, and reuse, provided that the author and preprint are cited in any reuse.
Prerpints.org logo

Preprints.org is a free preprint server supported by MDPI in Basel, Switzerland.

Subscribe

Disclaimer

Terms of Use

Privacy Policy

Privacy Settings

© 2025 MDPI (Basel, Switzerland) unless otherwise stated