
Submitted:
16 August 2025
Posted:
20 August 2025
You are already at the latest version
Abstract
Background/Objectives: Adequate nutrient intake is crucial for cognitive development and academic performance in schoolchildren. This study assessed the association between dietary nutrient intake and cognition and academic performance in school-aged children from Taabo, Côte d’Ivoire. Methods: A total of 251 schoolchildren aged 6-12 years were randomly selected from seven public primary schools. Dietary intake was assessed using repeated 24-hour recalls, cognitive skills with Raven's Progressive Colored Matrices and academic performance using school results in mathematics and literature. Results: More than half of the participants had adequate intakes of vitamin A (55.8%) vitamin B6, (61.0%) vitamin B12 (61.0%) and omega-3 fatty acids (70.1%), while most had inadequate intakes of iron (96.8%), zinc (100%) thiamin (99.2%), riboflavin (99.6%) and folate (96.8%). Thiamin, riboflavin, folate, iron, zinc and a nutrient blend (iron, zinc, thiamin, riboflavin and folate) showed significant associations with cognitive scores (p < 0.05). Additionally, higher intakes of thiamin (AOR = 6.3; 95% CI: 2.5-16.0, p < 0.001) and riboflavin (AOR = 2.2; 95% CI: 1.5-7.8, p = 0.003) were linked to increased odds of better cognitive performance compared to lower intakes. No consistent associations were found with academic performance. Conclusions: Cognition-related micronutrients are largely inadequate among school-aged children involved in this study. While intakes of thiamin, riboflavin, folate, iron, zinc, and nutrient blend were significantly associated with cognition, no associations were found with academic performance. Further studies exploring such links are needed, especially those involving interventions.
Keywords:
micronutrient intake
; dietary intake
; cognition
; academic performance
; school-aged children
; Côte d'Ivoire
1. Introduction
The school age (6-12 years) is the period of life between childhood and adolescence, accompanied by a rapid increase in the rate of cognitive development due to social stimulation, including but not limited to school environment [1]. Cognition is the ability to assimilate and process information received from different sources and convert them into knowledge [2]. Cognitive processes include learning, attention, memory, language, reasoning and decision making. For children, especially of school age, cognition is a building block required to obtain adequate academic performance [3]. Cognitive functions, particularly fluid intelligence, play a crucial role in learning, memory, reasoning, problem solving and adapting to new situations, which are essential for overcoming challenges in the school setting [4]. Cognition is linked to brain structural development [5] and brain structural development can be influenced by nutrition, therefore cognitive functions can indirectly be influenced by nutrition [6]. Brain development undergoes a complex early life development that is modulated by genetics as well as the environment; for the latter, nutrition is one of the factors significantly contributing to it. Nutrients can influence gene expression by providing molecules essential to fulfil their roles in brain growth and development. Nutrients are also critical for neurogenesis, axon and dendrite extension, synaptogenesis, as well as myelination, all of which are fundamental processes for effective brain connectivity. Nutrients therefore operate at the intersection of biological and environmental determinants and play a central role in shaping brain architecture and function [7]. Thus, the quality and composition of children’s diet can significantly influence how their learning potential can be realized.
Nutrients such as omega-3 fatty acids, iron, zinc iodine, vitamins A, thiamin, riboflavin, folate and vitamins B6 and B12 have been significantly associated with cognitive performance in school-aged children. Omega-3 fatty acids are the most important for brain and cognitive functions. Dietary intake of polyunsaturated fatty acids, especially omega-3 fatty acids, including DHA and eicosapentaenoic acid (EPA), is often inadequate in school-aged children and adolescents and an adequate intake in these fatty acids are critical for cognitive function growth and better academic performance [8]. Richardson et al. [9]have highlighted that omega-3 fatty acids supplementation increased reading abilities and alertness in school-age children. In addition, Lassek & Gaulin [10] have shown that an increase in n-3 fatty acid intake and a decrease in n-6 fatty acids in the diets is positively associated to cognitive performance in school-aged children.
Iron is also key nutrients for cognitive development and its role in brain has been largely studied. Iron is involved in several enzyme systems. It is involved in the cytochrome c oxidase enzyme system for energy production and in tyrosine hydroxylase for the synthesis of dopamine receptors. Delta-9 desaturase is involved in myelination and fatty acid synthesis, and ribonucleotide reductase regulates brain growth. Studies among school-aged children suggest that adequate iron status is beneficial for cognitive and academic performance [11]. A cross-sectional study in 389 school-aged children in Ghana showed that serum iron was correlated with cognitive performance [4]. Iron supplementation was has also been associated with improved cognitive and academic performance in children with anemia [12]. Thus, iron deficiency can affect brain functions and lead to poor academic performance.
Zinc is also vital nutrient for the brain, with important structural and functional roles. Zinc is a cofactor for over 200 enzymes that regulate various metabolic activities in the body, including protein, DNA and RNA synthesis. Zinc also plays a role in neurogenesis, the maturation and migration of neurons and the formation of synapses. Zinc is involved in the modulation of certain neurotransmitters, particularly glutamate and gamma-aminobutyric acid (GABA) receptors [13]. Zinc is essential for neurodevelopment and cognitive function. While zinc deficiency has been shown to negatively affect these processes, zinc supplementation does not consistently produce beneficial effects. A review of randomized studies involving school-aged children found that zinc deficiency may impair motor activity and neuropsychological functions, particularly reasoning, though evidence regarding its impact on general cognitive development remains inconsistent [14]. Moreover, a study in Brazil reported significant improvements in cognitive performance following zinc supplementation in schoolchildren [15], whereas a randomized controlled trial in Canada found no such effect [16].
Iodine is critical nutrient for metal functions which its deficiency is a major public health concerns in developing countries [17]. The relationship between iodine and cognitive development has been investigated in several studies. It is well established that iodine is crucial for thyroid hormones production which are involved many neurological processes. Iodine deficiency is associated with mental retardation, speech and hearing impairment [18]. Thus, an adequate iodine status is essential for optimal cognitive development in children. An iodine supplementation in 310 children aged 10 to 12 in Albania showed a significant improvement in cognitive and motor skills in iodine-deficient children [19].
B vitamins, especially, thiamin (vitamin B1), riboflavin (vitamin B2), folate (vitamin B9), vitamin B6 and vitamin B12, are also known as key nutrients associated with cognitive development. Thiamin acts as a coenzyme in glucose metabolism and neurotransmitter production (e.g., acetylcholine), making it vital for cognitive function, particularly in growing brains [20]. Riboflavin is involved in metabolism of carbohydrates, fats, proteins, energy production and the metabolism of other B vitamins, such as pyridoxine (vitamin B6), folate and niacin (vitamin B3) [21]. Folate is plays a crucial role in neurocognitive development, influencing key processes such as DNA synthesis, gene expression regulation, and neurotransmitter synthesis [22]. Folate, along with choline, acts as a methyl-donor nutrient, affecting brain development through DNA methylation mechanisms [23]. Vitamin B6 plays a critical role in neurotransmitter metabolism by facilitating the conversion of glutamate to γ-aminobutyric acid (GABA) and supporting the synthesis of serotonin and dopamine. Vitamin B6, together with folate and vitamin B12, contributes to the reduction of homocysteine, a neurotoxic amino acid associated with cognitive impairment and neurodegenerative risk [24,25]. Vitamin B12 is an important micronutrient found only in animal foods and is necessary for full brain development and cognition [26]. Research in developing countries has reported high rates of vitamin B12 deficiency in children, largely due to inadequate dietary intake. This deficiency can be associated with impaired cognitive development and stunted growth [27,28].
Vitamin A is also important for regulating neurodevelopmental pathways that can affect cognition [29]. Vitamin A deficiency in children can lead to serious consequences, including vision impairment, anaemia and poor immune system. However, in school-aged children, the evidence on the relationship between vitamin A and cognition is inconsistent across studies. In Ethiopia, vitamin A supplementation was associated with improved cognitive test scores [30], while in Nepal, vitamin A supplementation had no beneficial effect on cognition in school-aged children [31].
In Côte d'Ivoire, separate studies conducted in school-age children reported high prevalence of stunting (5.8-40%), vitamin A deficiency (31%) and iron deficiency (20-39%) [32,33,34]. Other studies have shown a significant influence of malnutrition and socio-demographic status on school performance [35,36], suggesting that the performance of these children could be linked to their dietary intake of the aforementioned nutrients or other not investigated yet. However, little is known especially regarding nutrient intake and cognitive function and academic performance in Ivorian schoolchildren, despite the high prevalence of malnutrition and micronutrient deficiencies reported. Therefore, the current study was conducted to assess the association between dietary nutrient intake and cognition and school performance in school-aged children in the Health and Demographic Surveillance System of Taabo, Côte d'Ivoire.
2. Materials and Methods
2.1. Study Design and Area
This study adopted a cross-sectional observational design. It was conducted between January and May 2023 in a sample of school-aged children aged 6 to12 years from the Health and Demographic Surveillance System (HDSS) of Taabo, Côte d'Ivoire.
The HDSS is located in the south-central region of Côte d'Ivoire approximately 150 km of Abidjan and 60 km of Yamoussoukro, the economic and political capitals of Cote d’Ivoire respectively [37]. The HDSS covers an area of 980 km² between 6°0' and 6°20' north latitude and 4°55' and 5°15' west longitude. The region has a tropical climate characterized by two rainy seasons (March to July and October to November) and two dry seasons (December to February and August to September). However, climate change has increasingly blurred the distinction between these seasons [38]. The average annual rainfall is about 284 mm, while the average temperature ranges between 27.6°C and 28.3°C. Relative humidity varies between 76.6% and 79.6%. The Taabo HDSS is predominantly rural and comprises 13 main villages, over 100 small hamlets and a small town called Taabo-Citée with a population of 7,514. The total population of the HDSS is estimated at 57,189 [39]. Agriculture is the dominant economic activity, with staple crops including yams, bananas, maize and cassava, while cocoa and coffee are the main cash crops. Livestock (cattle, small ruminants, pigs and poultry) and fishing also contribute to the local economy. This study was conducted in in the small urban area of Taabo-cité or Barrage and in six villages which are Tokohiri, Ndenou, Ahouati, Leleblé, Ahouakro, Adikouassikro (Figure 1).
2.2. Sample Size and Sampling Procedure
A total of 252 children aged 6 to12 years were recruited from seven public primary schools (PPS) in the HDSS area. The HDSS is administratively divided into three academic zones: zone A, zone B, and zone C. Seven government-owned schools namely Ahouakro, Tokohiri, N’Denou, Ahouati, Leleble, and Taabo-Barrage PPS were randomly selected within these zones, with proportional consideration given to the number of schools in each zone. In each selected school, 36 children from grades one to six were recruited, with six children per grade. A systematic random sampling method was used to select pupils within each grade using updated school enrolment lists, restricted to children in the required age range, provided by the teachers or headteachers.
2.3. Eligibility Criteria
Children aged 6 to 12 years who attended school in one of the seven selected PPSs within the Taabo HDSS were eligible to participate in the study. Children were excluded if parental or guardian consent was not obtained, if they were outside the age range, had any apparent disease or were enrolled in similar or nutrition intervention studies.
2.4. Sociodemographics and Anthropometrics
The sociodemographic information collected included the age, sex, school grade of the participants. Education level and occupation of parents or guardians were also collected. The age of each child was determined based on their birth date provided in the school records.
For anthropometric data, height and weight of each child were measured according to the World Health Organization recommendations for children and adolescents (WHO 2011). Z-scores for each of the nutritional indicators, including BMI for age, weight for age and height for age, and the prevalence of wasting, stunting and thinness were calculated using the AnthroPlus software available on the WHO website [41]. All children below negative two standard deviations (SD) were considered to be underweight, stunted or wasted. Children between -2SD and +2 SD were considered to have normal status, while those above positive two standard deviations were considered to be overweight, overgrown and obese (Onis et al., 2007).
2.5. Dietary Intake Assessment
Dietary intake data were collected from participants on two non-consecutive weekdays. All foods and beverages consumed at home (including breakfast, lunch, dinner, and snacks) and outside the home were recorded. A pre-tested 24-hour dietary recall questionnaire was used, following the methodology described by Gibson & Ferguson [44] in the WHO Dietary Assessment Manual. According to this method, two non-consecutive 24-hour recalls were obtained from each child, with a minimum of two days between interviews. The first recall was conducted with all participants (n = 252), while 245 participants (97%) completed the second recall. Visual portion estimation tools, such as commonly used household measures and photographic food atlas, were used during data collection to help participants recall portion sizes consumed. Dietary intakes of iron, zinc, iodine, vitamin B6, folate, vitamin B12, vitamin A, eicosapentaenoic acid (EPA) and docosahexaenoic acid (DHA) were estimated for each child using NutriSurvey software (Anderegg, 2008), which had been adapted to include local Ivorian foods. The dietary patterns of the children studied included both animal- and plant-based sources [45]. Therefore, nutrient bioavailability for iron and zinc was assumed to be moderate, in accordance with WHO/FAO guidelines [46]. Nutrient adequacy was assessed using the Recommended Dietary Allowances (RDAs) provided by WHO/FAO in 2004 for micronutrients [46] and by the European Food Safety Authority for omega-3 fatty acids [47]. Due to substantial variability, nutrient intake was categorized into tertiles based on the distribution of each nutrient: lower (≤ 33.3rd percentile), medium (33.4th-66.7th percentile) and higher tertiles (> 66.7th percentile).
2.6. Cognitive Skills Assessment
Cognitive assessment was carried out using the Raven's Coloured Progressive Matrices (RCPM). The RCPM, a widely used test of non-verbal intelligence, was chosen for its cultural fairness and its ability to assess fluid cognitive abilities, which are crucial for academic performance [4]. To ensure that all children understood the tasks, test instructions were first given in French and then translated into the local language. Individual test sessions were conducted without a time limit, following the standard procedure outlined in the test manual [48]. The test consisted of presenting participants with a matrix of symbols and asking them to identify the missing symbol from a set of six options. Each correct answer was worth one point, and the total score was calculated by summing the correct answers, with a maximum possible score of 36 points. As there is no local norm of the RCPM for Ivorian children, cognitive performance was defined as low if less than the 50th percentile, medium if between the 50th and 75th percentiles, and high if equal to or greater than the 75th percentile [49]. The corresponding threshold scores were (low < 14, medium 14-18, high ≥ 18).
2.7. Academic Performance Assessment
Academic performance was assessed based on participants' average scores in mathematics and literature at the end of the 2023-2024 school year. Using a method adapted from Ateillah et al.[50] to fit the local context, three performance levels were defined: low performance for average scores below 5 out of 10, medium performance for scores between 5 and 7 (out of 10), and high performance for scores above 7 out of10. Noteworthy, in Côte d'Ivoire, the minimum required average score for primary school is 5 out of 10.
2.8. Statistical Analysis
Data were analyzed using the Statistical Package for the Social Sciences version 20.0 (SPSS IBM Inc). Categorical variables were summarized using frequencies and percentages, while continuous variables were expressed as means ± standard deviations (SD). Principal component analysis (PCA) was applied to identify nutrients associated with cognitive or school performance. Mean scores in the cognitive test and academic outcomes (mathematics and literature) were compared across sociodemographic, anthropometric and dietary intake groups (lower and higher tertiles) using the Kruskal-Wallis test, with the Mann-Whitney U test used for two-group comparisons. Chi-squared tests (χ²) were conducted to assess associations between categorical variables. Spearman’s rank correlation coefficients were computed to examine the relationships between nutrient intake, cognitive scores and academic performance. Nutrients that showed significant correlations with cognitive test scores or academic performance were combined into a composite variable: “nutrient blend”. A multivariable logistic regression was further conducted to identify factors associated to cognitive and school performance among the study participants. Variables which were significantly (p < 0.05) associated with cognition or school performance in the bivariable analyses were selected for the logistic regression models. All models were adjusted for maternal education level and father’s occupation. No correction for multiple comparisons was applied; instead, unadjusted p-values were considered, with significance set at p < 0.05.
3. Results
3.1. Sociodemographic and Anthropometric Characteristics
As shown in Table 1, 16.7% of school-aged children were enrolled in each school grade. Among the children recruited, 116 (46.2%) were female and 135 (53.8%) were male. The mean age was 9.3 ± 1.9 years (range: 6-12 years). Age distribution was as follows: 35.1% were aged 6-8 years, 30.3% were aged 9-10 years, and 34.7% were aged 11-12 years. The majority of participants (80.5%) came from large households (more than five members), and most (97.2%) lived with their parents. Regarding paternal characteristics, 79.3% of fathers worked in the primary sector (e.g., agriculture), and most had completed only primary education. In contrast, 60.6% of mothers were housewives with no formal education. Approximately 72.5% of the children reported eating lunch at the school cafeteria. Additionally, 90% revised their coursework for 30-60 minutes after school (classified as moderate study duration). More than half of the children (56.7%) had never repeated a school grade.
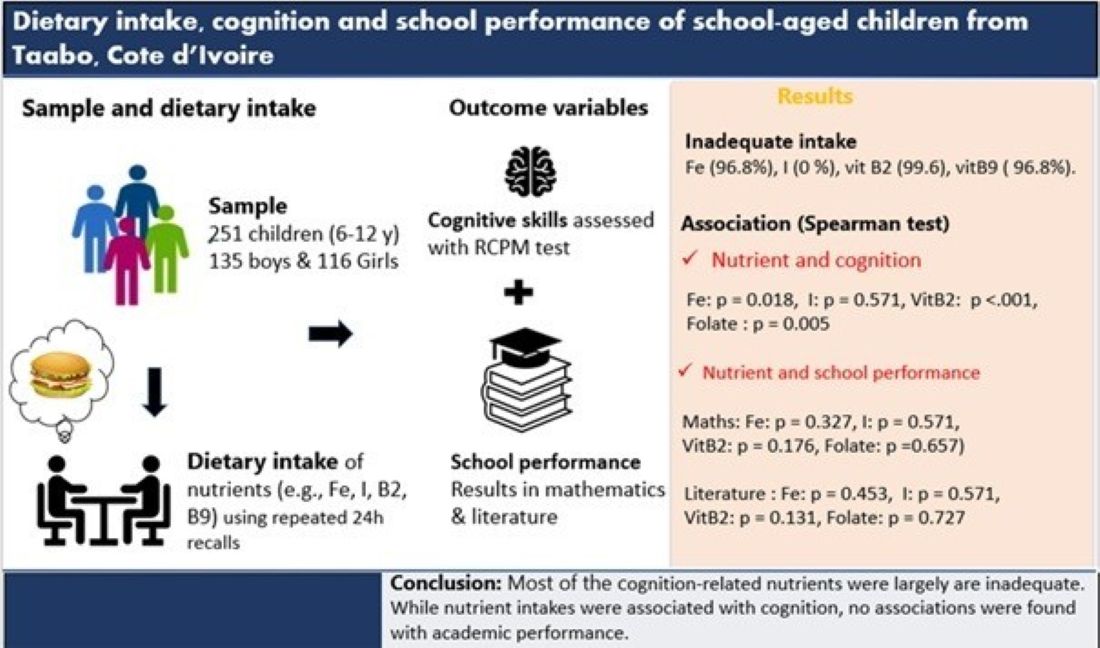
For anthropometrics, the mean z-scores were -0.49 (SD ± 1.15) for BMI-for-age, -0.32 (SD ± 1.19) for weight-for-age and -0.08 (SD ± 1.78) for height-for-age as compared to WHO reference mean (Table A1). The BMI-for age of the children was slightly lower (around 2% deviation) when compared with WHO growth standard whereas the height for age and weight for age was largely lower (more 5 % deviation) compared to WHO growth standard (Figure A1, Figure A2 and Figure A3). The prevalence of stunting, underweight and wasting were 11.6 %, 10. 1 % and 9.2% respectively. The percentage of participants having any kind of under nutrition (stunting, wasting and underweight) was 30.9%.
3.2. Cognitive and School Performance
The average score obtained by the children on the cognitive test was 15.37 ± 4.38 (out of a maximum of 36) with the majority (43.4%) having low performance (score below the 50th percentile). For school performance, the mean scores were 5.96 ± 2.36 for mathematics and 5.43 ± 1.79 for literature (out of a maximum of 10 for both). The majority of the children in mathematics (44.2%) and literature (47.8%) had medium performance (Score between 5 and 7 out of 10). The threshold scores for both mathematics and literature were low < 5, medium 5-7, high > 7 respectively (Table A1).
3.3. Cognitive and Academic Performance by Sociodemographic and Anthropometric Characteristics
Cognition test scores and school performance across the different sociodemographic and anthropometric groups are presented in Table 1. Comparisons of cognitive scores revealed statistically significant differences by sex, age group, and school grade. Using the Mann-Whitney U test, boys and girls differed in their cognition scores (p = 0.046). Kruskal-Wallis tests indicated highly significant differences across age groups (p < 0.001) and school grade levels (p < 0.001). After adjusting for covariate such as maternal education and father’s occupation, girls had significantly lower odds of achieving high cognitive scores compared to boys (AOR = 0.6, 95% CI 0.3-0.9, p = 0.048) indicating that girls were 40% less likely than boys to attain higher cognitive performance. In addition, cognitive performance improved with age. Children aged 11-12 years were more than twice as likely to score above the 50th percentile on the cognitive test compared to those aged 9-10 years, while younger children (6-8 years) were significantly less likely to do so (AOR = 0.4; 95% CI: 0.2-0.8; p = 0.010). School grades were also significantly associated with cognitive performance. Compared to children in grade six, those in lower grades demonstrated reduced odds of cognitive performance. Specifically, children in grades one (AOR = 0.1, 95% CI: 0.05-0.4, p < 0.001), two (AOR = 0.1, 95% CI: 0.0-0.3, p < 0.001), and three (AOR = 0.2, 95% CI: 0.1-0.5, p < 0.001) showed significantly lower adjusted odds.
Regarding academic performance, significant differences in mean scores were observed across age groups, grade levels and schools in mathematics and literature or in both. Children aged 6-8 years recorded significantly higher mean scores in mathematics (p < 0.001) and literature (p = 0.002) compared to their older peers aged 9-10 and 11-12 years. At the school level, children from Ahouati and Adikouassikro primary schools demonstrated the highest performance in literature. For school grade, the logistic regression analysis revealed negative associations for children in grade three (AOR = 0.2; 95% CI: 0.1–0.6; p = 0.004) and grade four (AOR = 0.3; 95% CI: 0.1-0.9; p = 0.029), indicating reduced odds of performing above the 50th percentile in mathematics relative to grade six. In literature performance, children in grade two demonstrated significantly higher odds of achievement compared to those in Grade Six (AOR = 4.1; 95% CI: 1.3-12.7; p = 0.014). No statistically significant differences were observed among the other grades.
Anthropometric characteristics analysis showed a significant difference (p < 0.035) between weight-for-age groups (underweight, normal weight and overweight) in mathematics. However, in the adjusted analysis, no association was observed between weight-for-age status and mathematics either with cognitive score or literature performance among the participants.
3.4. Associations Between Nutrient Intake and Cognitive or Academic Performance
Daily nutrient intakes, the proportion of participants with adequate and inadequate intakes, and the distribution across the lower, medium and higher tertiles are provided in Table 2. The majority of participants had an inadequate intake of most nutrients assessed, with 99.2% for vitamin B1, 99.6% for vitamin B2, 96.8% for folate and 96,8% for iron. While zinc intake was inadequate in all children (100%), iodine intake was adequate in all the participants. Moreover, more than half of the children had adequate intake of vitamin A (55.8%), vitamin B12 (61.0%) and omega-3 fatty acids (70.1%)
The principal component analysis (PCA) showed that all assessed nutrients were found along one component with cognitive test scores, but not along the other component which contained the two outcomes from school performance (Figure A4). Comparison of median cognitive test scores using the Mann-Whitney U test revealed significant differences (p < 0.05) between children in the lowest and highest tertiles for thiamin, riboflavin, folate, iron, zinc and nutrient blend. In addition, significant associations between intake of these micronutrient and cognitive test scores were observed using Chi-square test and Spearman’s rank correlation (rho), as presented in Table 3 and Table A3. Children in the highest tertile of thiamin (χ² = 20.8, p < 0.001), riboflavin (χ² = 12.6, p = 0.002), folate (χ² = 10.4, p = 0.006), iron (χ² = 7.1, p = 0.029), zinc (χ² = 6.8, p = 0.033), and the nutrient blend (χ² = 7.5, p = 0.024) exhibited significantly better cognitive performance, with a higher proportion scoring above the 75th percentile compared to those in the lowest tertile. In the multivariable logistic regression analysis adjusted for maternal education and paternal occupation, children in the highest tertile of thiamin intake (AOR = 6.3; 95% CI: 2.5-16.0; p < 0.001) and riboflavin intake (AOR = 2.2; 95% CI: 1.5-7.8; p = 0.003) had significantly higher odds of achieving better cognitive performance compared to those in the lowest tertile.
Concerning academic performance, thiamin (χ² = 7.9, p = 0.019) and zinc (χ² = 9.7, p = 0.008) intakes were significantly associated with literature performance. Among children in the lowest tertile of thiamin and zinc intake, the majority (52.0 % for thiamin and 60.0% for zinc) scored between 5 and 7 out of 10 (medium performance). Un expectedly, in the adjusted analysis, children with higher intakes of thiamin (AOR = 0.30; 95% CI: 0.10-0.60; p = 0.002) and zinc (AOR = 0.40; 95% CI: 0.20-0.70; p = 0.005) showed decreased odds of better literature performance compared to those in the lowest tertile. No significant associations were observed for vitamin A, riboflavin, folate, iron, iodine, omega-3 fatty acids, or the nutrient blend (Table 4).
4. Discussion
This study reported the association of dietary nutrient intakes with both cognition and school performance in school-aged children from the HDSS of Taboo, Côte d’Ivoire. Almost half (46.2%) the participants were female indicating that the sample of children recruited in the study was balanced in terms of gender. We observed that cognitive performance improved with age and school grade-levels. This may underline a cumulative impact of both developmental maturation and sustained educational exposure. This trend is consistent with findings from a recent study in school-aged children (4- 7years), which show that age-related gains in cognitive control and reasoning abilities emerge progressively throughout childhood, supported by enriched learning environments and structured curricula [51]. For academic performance, the results showed that younger children outperformed older peers in both mathematics and literature, indicating a potential early academic advantage. This observation is consistent with previous findings by Correa-Burrows et al.[52] , who reported higher academic performance among younger age groups. However, when accounting for school grade levels, mathematical performance declined in middle grades (three and four) relative to grade six, suggesting a dip during transitional academic phases, a pattern similarly observed in previous studies among schoolchildren [53,54]. On the other hand, literature performance peaked in grade two, highlighting a potential early literacy development window, which aligns with the findings of Bleiweiss-Sande et al.[55], who observed enhanced language performance in early primary grades. These findings underscore the need to explore age-grade mismatches and possible curriculum or cognitive load challenges in intermediate grades.
Analysis of nutritional indicators showed that participants had lower BMI-for-age (Δ −0.49) and weight-for-age (Δ = -0.32) compared with WHO standards. The overall prevalence of undernutrition was relatively high among the children in this study. Co-occurrence of stunting and underweight was present in 21.7%, contributing to an overall undernutrition prevalence of 30.9%. Similar findings have been reported in previous studies conducted among school-aged children in Côte d’Ivoire [56,57]. Children malnutrition remains a major challenge for many developing countries. According to the WHO report, 22.5% malnourished children live in Sub-Saharan Africa [58]. It is extensively documented that malnutrition can negatively affect cognitive development in school-aged children resulting in poor academic performance. A review conducted by Grantham-McGregor showed that malnourished children exhibit poorer cognitive abilities and academic achievement compared to well-nourished peers [59]. A study involving 436 primary school children from Northern Ethiopia also reported a significant association between undernutrition and lower academic performance [60]. Specific cognitive function have been even demonstrated to be affected by a chronic malnutrition: attention, memory and executive function, which are all crucial for performance in academic setting [61]. In the current study, although obese children had higher performance in mathematics compared to their underweight peers, no consistently significant associations were found between nutritional status and academic performance or cognition in the children studied. Further research is needed to clarify the relationships nutritional status and school performance or cognition in these children as well as the underlying mechanisms.
This study found a high percentage of inadequate intakes of thiamin, riboflavin, folate, and iron, which may suggest a widespread burden of micronutrient inadequacy among the school-aged children studied. Nutrient intakes were principally assessed based on Dietary Reference Intake provided by WHO/FAO [46]. Similar findings have been reported among children aged 7-11 years in Côte d’Ivoire, where the adequate intake of none of the assessed nutrients, including iron and zinc, was met. In that study, zinc intake reached 72% of the Recommended daily intake (RDI), while iron intake covered only 31% to 45.4% [45]. Additional evidence from studies assessing biochemical markers in Ivorian school-aged children has shown high prevalence of anemia (30-50%), iron deficiency (47%) and vitamin A deficiency (17%) [32,33,34]. Such deficiencies are commonly associated with inadequate dietary intake, poor bioavailability from predominantly plant-based diets, and frequent exposure to parasitic infections (e.g., helminths and malaria) [62,63]. Micronutrient deficiencies are recognized contributors to impaired immune function and cognitive development in children. It has been estimated that approximately 200 million school-aged children in low- and middle-income countries failed to reach their full cognitive potential due to inadequate nutrition [64]. The prevalence of inadequate nutrient intake observed among the children involved in this study is worrying, and therefore there is a need for evidence-based nutritional strategies to improve their micronutrient status. In contrast to most other micronutrients, where at least a significant proportion of children were deficient, all children had adequate iodine intake. This finding highlights the effectiveness of iodine fortification strategies, (e.g., iodized salt), in ensuring sufficient dietary iodine intake in Côte d'Ivoire [65].
This study revealed that dietary intakes of thiamin, riboflavin and folate were significantly associated with cognitive performance assessed using the Raven's Coloured Progressive Matrices (RCPM). Children in the highest tertile of thiamin and riboflavin intake were significantly more likely to exhibit better cognitive performance compared to those in the lowest tertile, even after adjusting for potential confounders such as the mother's level of education and the father's occupation. These findings align with those obtained from a prior study involving the same sample of school-aged children, where blood concentration of folate showed a significant correlation ( p = 0.03) with numeracy skills [66]. Other studies in Kenyan and Korean school-aged children found significant associations between thiamin, riboflavin, folate and improved cognitive performance [67,68]. However, this study found no significant association between vitamin B6, vitamin B12 and cognitive scores or school performance. Similar findings emerged from the analysis of biomarker data, where no association was observed between pyridoxal 5′-phosphate (active form of vitamin B6) and cognition (p = 0.46) nor between vitamin B12 levels and cognition (p = 0.10) [66]. These results are also consistent with those reported by Annan et al. (2019), who found no association between the dietary intake of vitamin B6 and vitamin B12 and cognitive performance among Ghanaian school-aged children (9-13 years). In contrast, studies conducted by Gewa et al. and Kim & Kang reported significant positive associations between dietary intakes of vitamin B6 and B12 and cognitive test scores in school-aged populations [67,68]. This divergence highlights the ambiguity surrounding the relationship between vitamins B6 and B12 and cognitive function, which further investigation might help to elucidate. B vitamins are involved in several biological processes. They serve as key coenzymes in the metabolism of carbohydrates, fats and proteins, facilitating energy production crucial for brain function and cognitive development [21], particularly during primary school years. The brain's daily energy consumption is estimated at 20-25% of the total body energy expenditure [70]. B vitamins are also involved in DNA synthesis, gene expression regulation, and neurotransmitter synthesis [22]. Deficiencies in B vitamins can significantly affect cognitive development and school performance.
Significant associations were also observed between iron intake and cognitive test scores. Children in the higher tertile of iron intake showed better cognitive performance, with a higher proportion scoring in the upper percentile (above 50th) of the cognitive performance. This finding aligns with results obtained from iron biomarkers in the same participants, where transferrin (Iron-binding protein considered the primary iron transport protein), showed a strong correlation with cognitive test scores (p = 0.0004) and ferritin (Iron storage protein) demonstrated a similar trend (p = 0.06). This finding is consistent with results from a randomized controlled trial conducted among school-aged children in Kenya (mean age ~7.4 years), in which higher dietary iron intake was significantly associated with improved Raven’s Coloured Progressive Matrices (RCPM) scores, reflecting better problem-solving and abstract reasoning abilities. At the biological level, iron is involved in several essential processes. It serves as a cofactor in numerous enzyme systems critical for energy metabolism and neurological function. Iron also plays a key role in neurotransmitter synthesis and the myelination of nerve fibers, both of which are vital for cognitive development [71]. Iron deficiency can considerably affect health status and cognitive functions.
A significant association was also observed between zinc intake cognitive test scores. Children in the highest tertile of zinc intake demonstrated a higher proportion scoring above the 75th percentile on cognitive assessments compared to those in the lowest tertile. This implies that adequate dietary zinc intake may contribute to enhanced cognitive performance among school-aged children. This result is also consistent with findings from Ghanaian school-aged children (9–13 years), where a weak but statistically significant positive association (p = 0.050) was reported between zinc intake and cognitive test scores [69]. However, an inverse relationship has been observed between zinc intake and school performance. In our previous study [66], no significant association was found between serum zinc and school performance (r = -0.08, p = 0.19). The present findings are consistent with those from a study conducted among Ghanaian school-aged children (6-11 years), where zinc status was negatively correlated with reasoning and problem-solving skills, critical for school performance. These results underscore the ambiguity in the relationship between zinc status and cognitive or academic performance, as reported in previous literature [14]. Further investigation is warranted to clarify this association.
This study found a positive association between the composite blend of micronutrients (vitamin A, thiamin, riboflavin, folate, zinc and iron) and cognitive test performance, suggesting a potential synergistic effect on cognitive development in school-age children. During school-age ages (6-12), executive functions (EF), including working memory, attention control, planning and inhibition, undergo rapid refinement, primarily governed by prefrontal cortex (PFC) maturation. This neurodevelopmental trajectory relies on: Neurotransmitter modulation (e.g., dopamine, acetylcholine), Synaptic pruning and plasticity, Myelination, Neuronal energy metabolism. Each nutrient in the blend contributes to EF development: Vitamin A regulates retinoic acid signaling critical for dopaminergic plasticity and synaptic function [72]. Thiamin facilitates glucose metabolism and supports neurotransmitter synthesis [73]. Riboflavin enhances mitochondrial energy production in high-demand PFC circuits [74]. Folate drives DNA methylation, neurogenesis and monoamine synthesis [75]. Zinc modulates Brain-Derived Neurotrophic Factor (BDNF) expression and synaptic plasticity and iron is essential for dopamine production, myelin formation, and oxygen delivery [76]. Evidence from randomized controlled trials has shown positive effects of these micronutrients on EF in school-aged children. A study in Ethiopian schoolchildren demonstrated that high-dose vitamin A supplementation significantly improved working memory and the combination with iron showed enhanced benefit in vulnerable subgroups [77]. Similarly, Román et al. emphasized the neurocognitive significance of folate, iron, and vitamin A in childhood EF development [78]. Noteworthy, the nutrient included in the blend were selected based on observed significant correlations in the dataset (except for vitamin A) and prior literature linking these nutrients to EF development. Future research should further explore causal mechanisms and validate this combination in controlled intervention settings.
This study found no association between vitamin A, vitamin B6, vitamin B12, iodine or omega-3 fatty acids intakes and cognitive test scores or school performance. Similar results were reported in Ghanaian school-aged children (9-13 years), where vitamin A, vitamin B6, vitamin and vitamin B12 intakes showed no association with cognition [69]. In addition, a study in South African schoolchildren (6-11 years) reported no association between omega-3 fatty acids intake and cognition [79]. In contrast, studies among school-aged children in Korea and Kenya revealed significant correlations between vitamin A, vitamin B6 and vitamin B12 intakes and cognition [67,68]. Other studies have reported significant associations between iodine or omega-3 fatty acids intake and cognition in school-aged children [10,80]. This clearly shows that evidence from studies on the association between these nutrients intake and cognition remains equivocal. The specificity of the population might impact, both in term of genetic background and background insufficiencies (nutritional). A recent review on the importance of lipids for neurodevelopment in low and middle-income countries underlined that the metabolism of fatty acids in humans is affected by gene variants of Fatty Acid Desaturases (FADS), which is responsible for encoding the key enzymes (D5D and D6D) needed for fatty acid synthesis. Noteworthy, conversion of ALA into DHA and EPA and of LA into ARA is done by FADS but with low efficiency. Specifically, only 8%–20% of a dose of ingested ALA is converted into EPA and 0.5%-9% into DHA [81]. Further studies might elucidate the relationship between these nutrients and cognitive functions. Noteworthy, the majority of the nutrients assessed in the present study were not associated with school performance, despite a large body of literature reporting an association between improved cognition and better school performance among sub-Saharan schoolchildren [82,83,84]. This discrepancy could be attributed to the multifactorial nature of academic achievement, which is influenced not only by cognition, but also by environmental factors such as teaching quality or socio-economic background. These factors may explain the variation observed in the academic performance between the schools included in this study.
This study has some limitations. School-aged children were interviewed directly about their dietary intake from the previous day using a 24-hour dietary recall questionnaire. Visual portion estimation tools, such as commonly used household measures and photographic food atlas, were employed during data collection to help participants recall portion sizes and reduce reporting bias. However, the authors recognize that the 24-hour recall method may not be the most reliable for this age group and that overestimation or underestimation of food portions is therefore possible. Additionally, the study did not assess total energy intake or consider the impact of dietary inhibitors, such as phytates, on iron absorption, both of which could have affected the interpretation of micronutrient adequacy. Furthermore, as this was a cross-sectional study, it cannot infer causality.
5. Conclusions
This study found that cognition-related micronutrients, particularly B-vitamins and minerals are largely inadequate among school-aged children in the Taabo HDSS, Côte d’Ivoire, except for vitamin A and iodine, which were assumed adequate in most participants. While intakes of thiamin, riboflavin, folate, iron, zinc and nutrient blend were significantly associated with cognitive test scores, no consistent associations were observed between nutrient intakes and academic performance, in contrast to previous studies. Future studies using controlled trials are needed to evaluate the causal relationship between these nutrients and cognition or school performance in this population.
Author Contributions
Conceptualization, J.H., G.A.K. and CN.; methodology, A.T.; software, E.L.J.C.E.; validation, J.H., G.A.K., C.N. and O.C.; formal analysis, A.T. and E.L.JC.E.; investigation, A.T. and K.N.Y.R.; resources, G.A.K.; data curation, E.L.J.C.E.; writing—original draft preparation, AT.; writing—review and editing, J.H., G.A.K. and O.C.; visualization, A.T.; supervision, J.H., G.A.K., OC and C.N.; project administration, J.H.; funding acquisition, GAK. All authors have read and agreed to the published version of the manuscript.
Funding
This research was funded by by Société des Produits Nestlé SA, Switzerland [Grant Nestlé. Réf : CSRS/Ph D School children performance/2021.]
Institutional Review Board Statement
The study was conducted in accordance with the Declaration of Helsinki. Ethical approval was obtained from the National Committee on Ethics in Life Sciences and Health under the Ministry of Health, Public Hygiene and Universal Health Coverage of Côte d'Ivoire (N/Ref: 118-22/MSHPCMU/CNESVS-kp).
Informed Consent Statement
Informed consent was obtained from all parents or legal guardians of each child involved in the study.
Data Availability Statement
The data presented in this study are available on request from the corresponding author. The datset are not publicly available due to ethical reasons.
Acknowledgments
The authors are grateful to Société des Produits Nestlé SA and the Centre Suisse de Recherches Scientifiques en Côte d'Ivoire (CSRS) for their support in conducting this study. We also thank all the schools, as well as the participants and their parents, for their collaboration.
Conflicts of Interest
The authors declare no conflicts of interest. J.H. and O.C. are employees of Société des Produits Nestlé SA in Switzerland.
Appendix A

Table A1.
Mean and standard deviation of nutritional indicators: weight-for-age z-score, height-for-age z-score, and BMI-for-age z-score.
Table A1.
Mean and standard deviation of nutritional indicators: weight-for-age z-score, height-for-age z-score, and BMI-for-age z-score.
| Variable | Mean | Std. Deviation | 95% CI Mean Upper | 95% CI Mean Lower | Minimum | Maximum |
|---|---|---|---|---|---|---|
| Weight for age | -0.32 | 1.04 | -0.17 | -0.46 | -2.87 | 2.77 |
| Height for age | -0.20 | 1.64 | 0.01 | -0.40 | -13.43 | 5.37 |
| BMI for age | -0.44 | 2.78 | -0.09 | -0.78 | -3.89 | 39.61 |
Figure A1.
Comparison of participants BMI-for-age values with WHO growth standards.
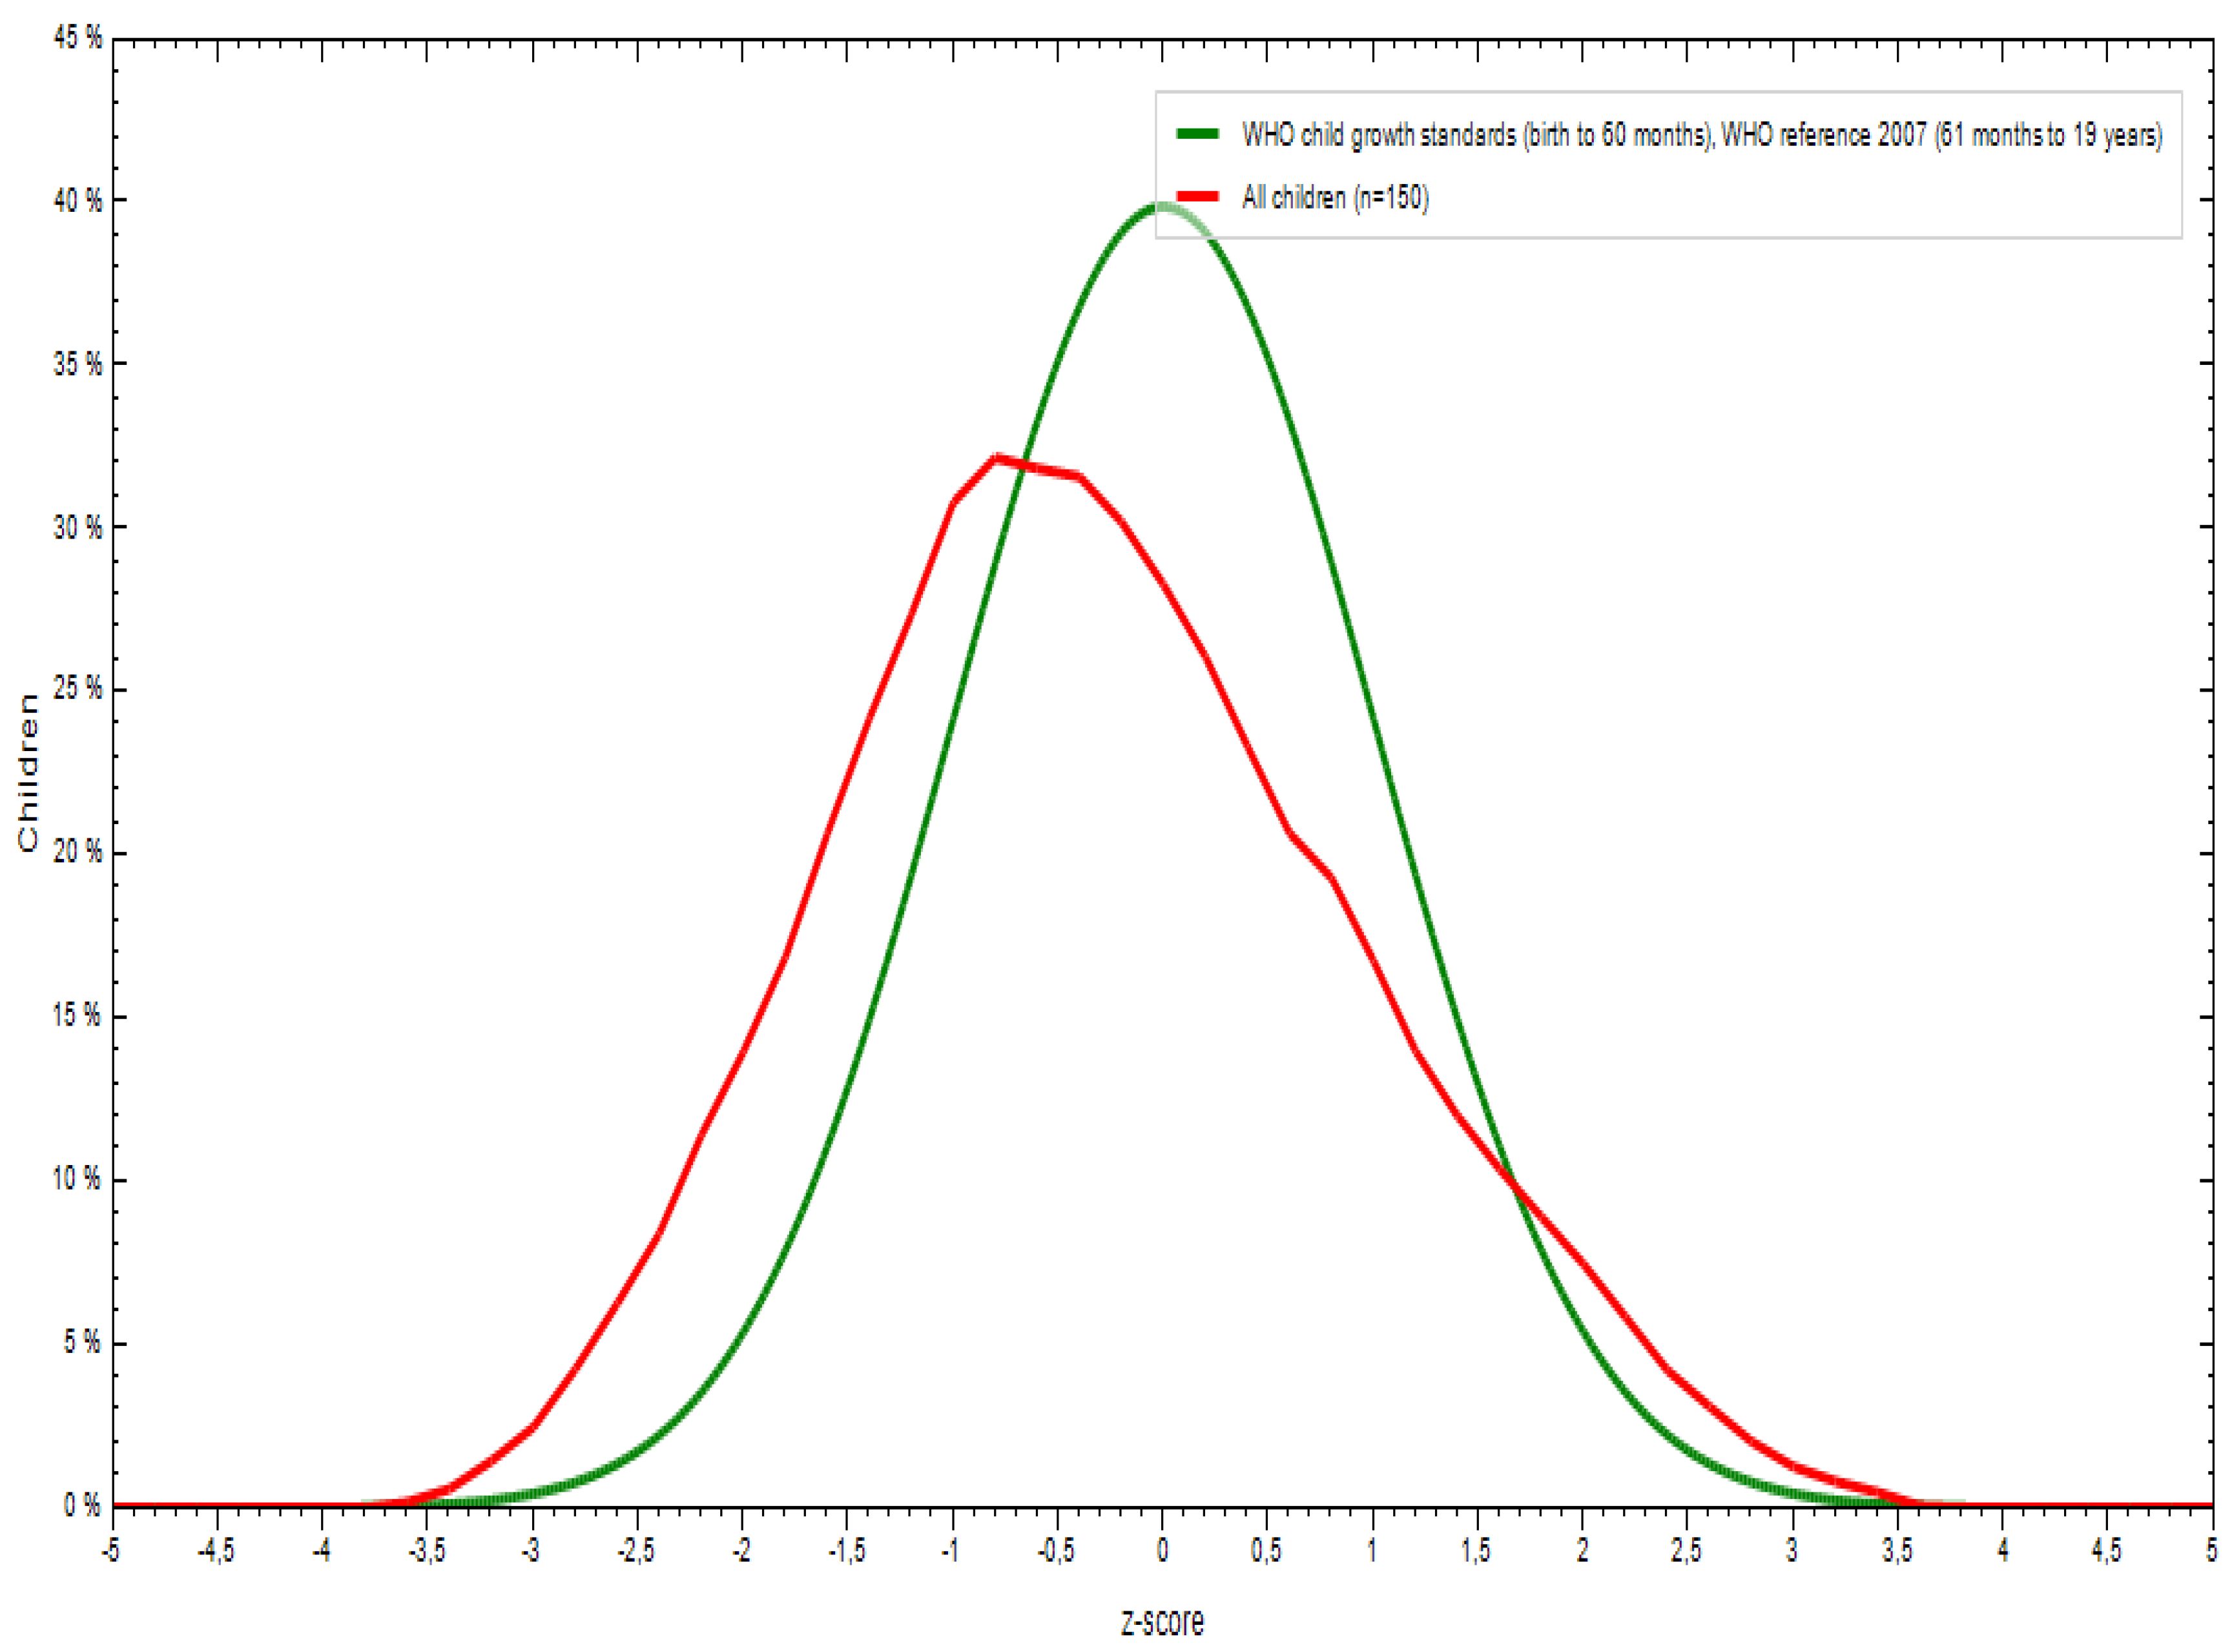
Figure A2.
Comparison of participants height-for-age values with WHO growth standards.
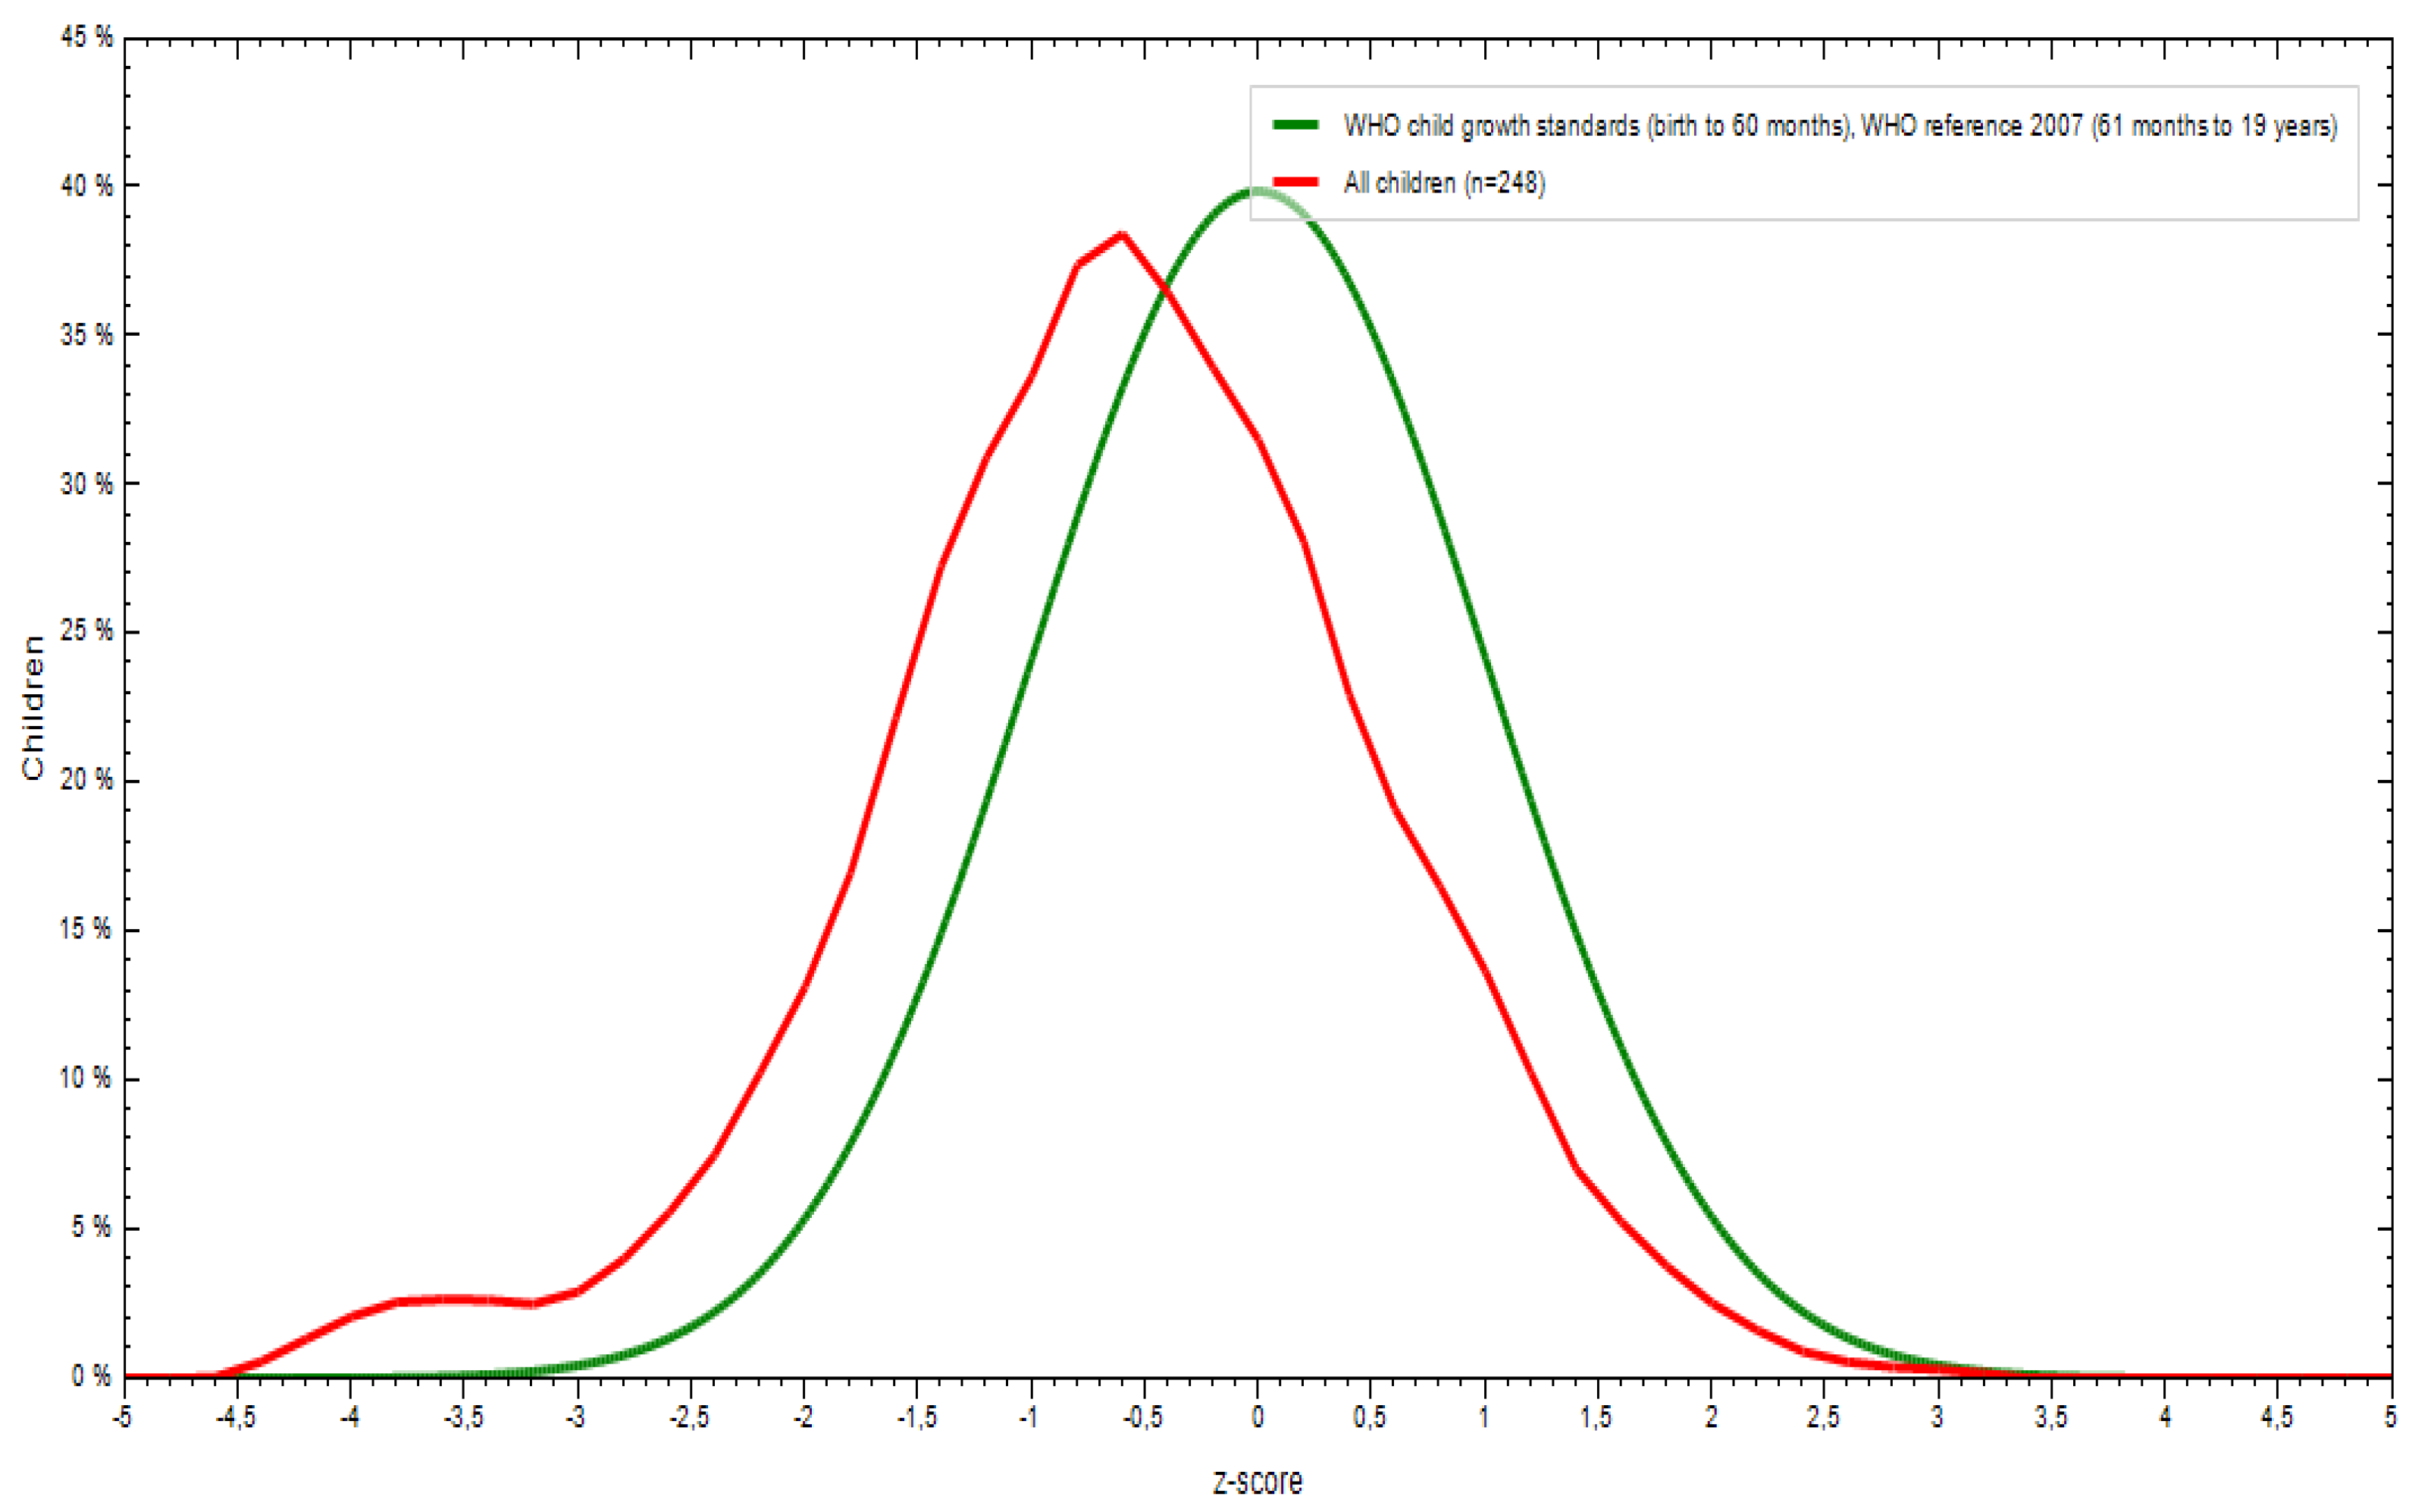
Figure A3.
Comparison of participants’ weight -for-age values with WHO growth standards.
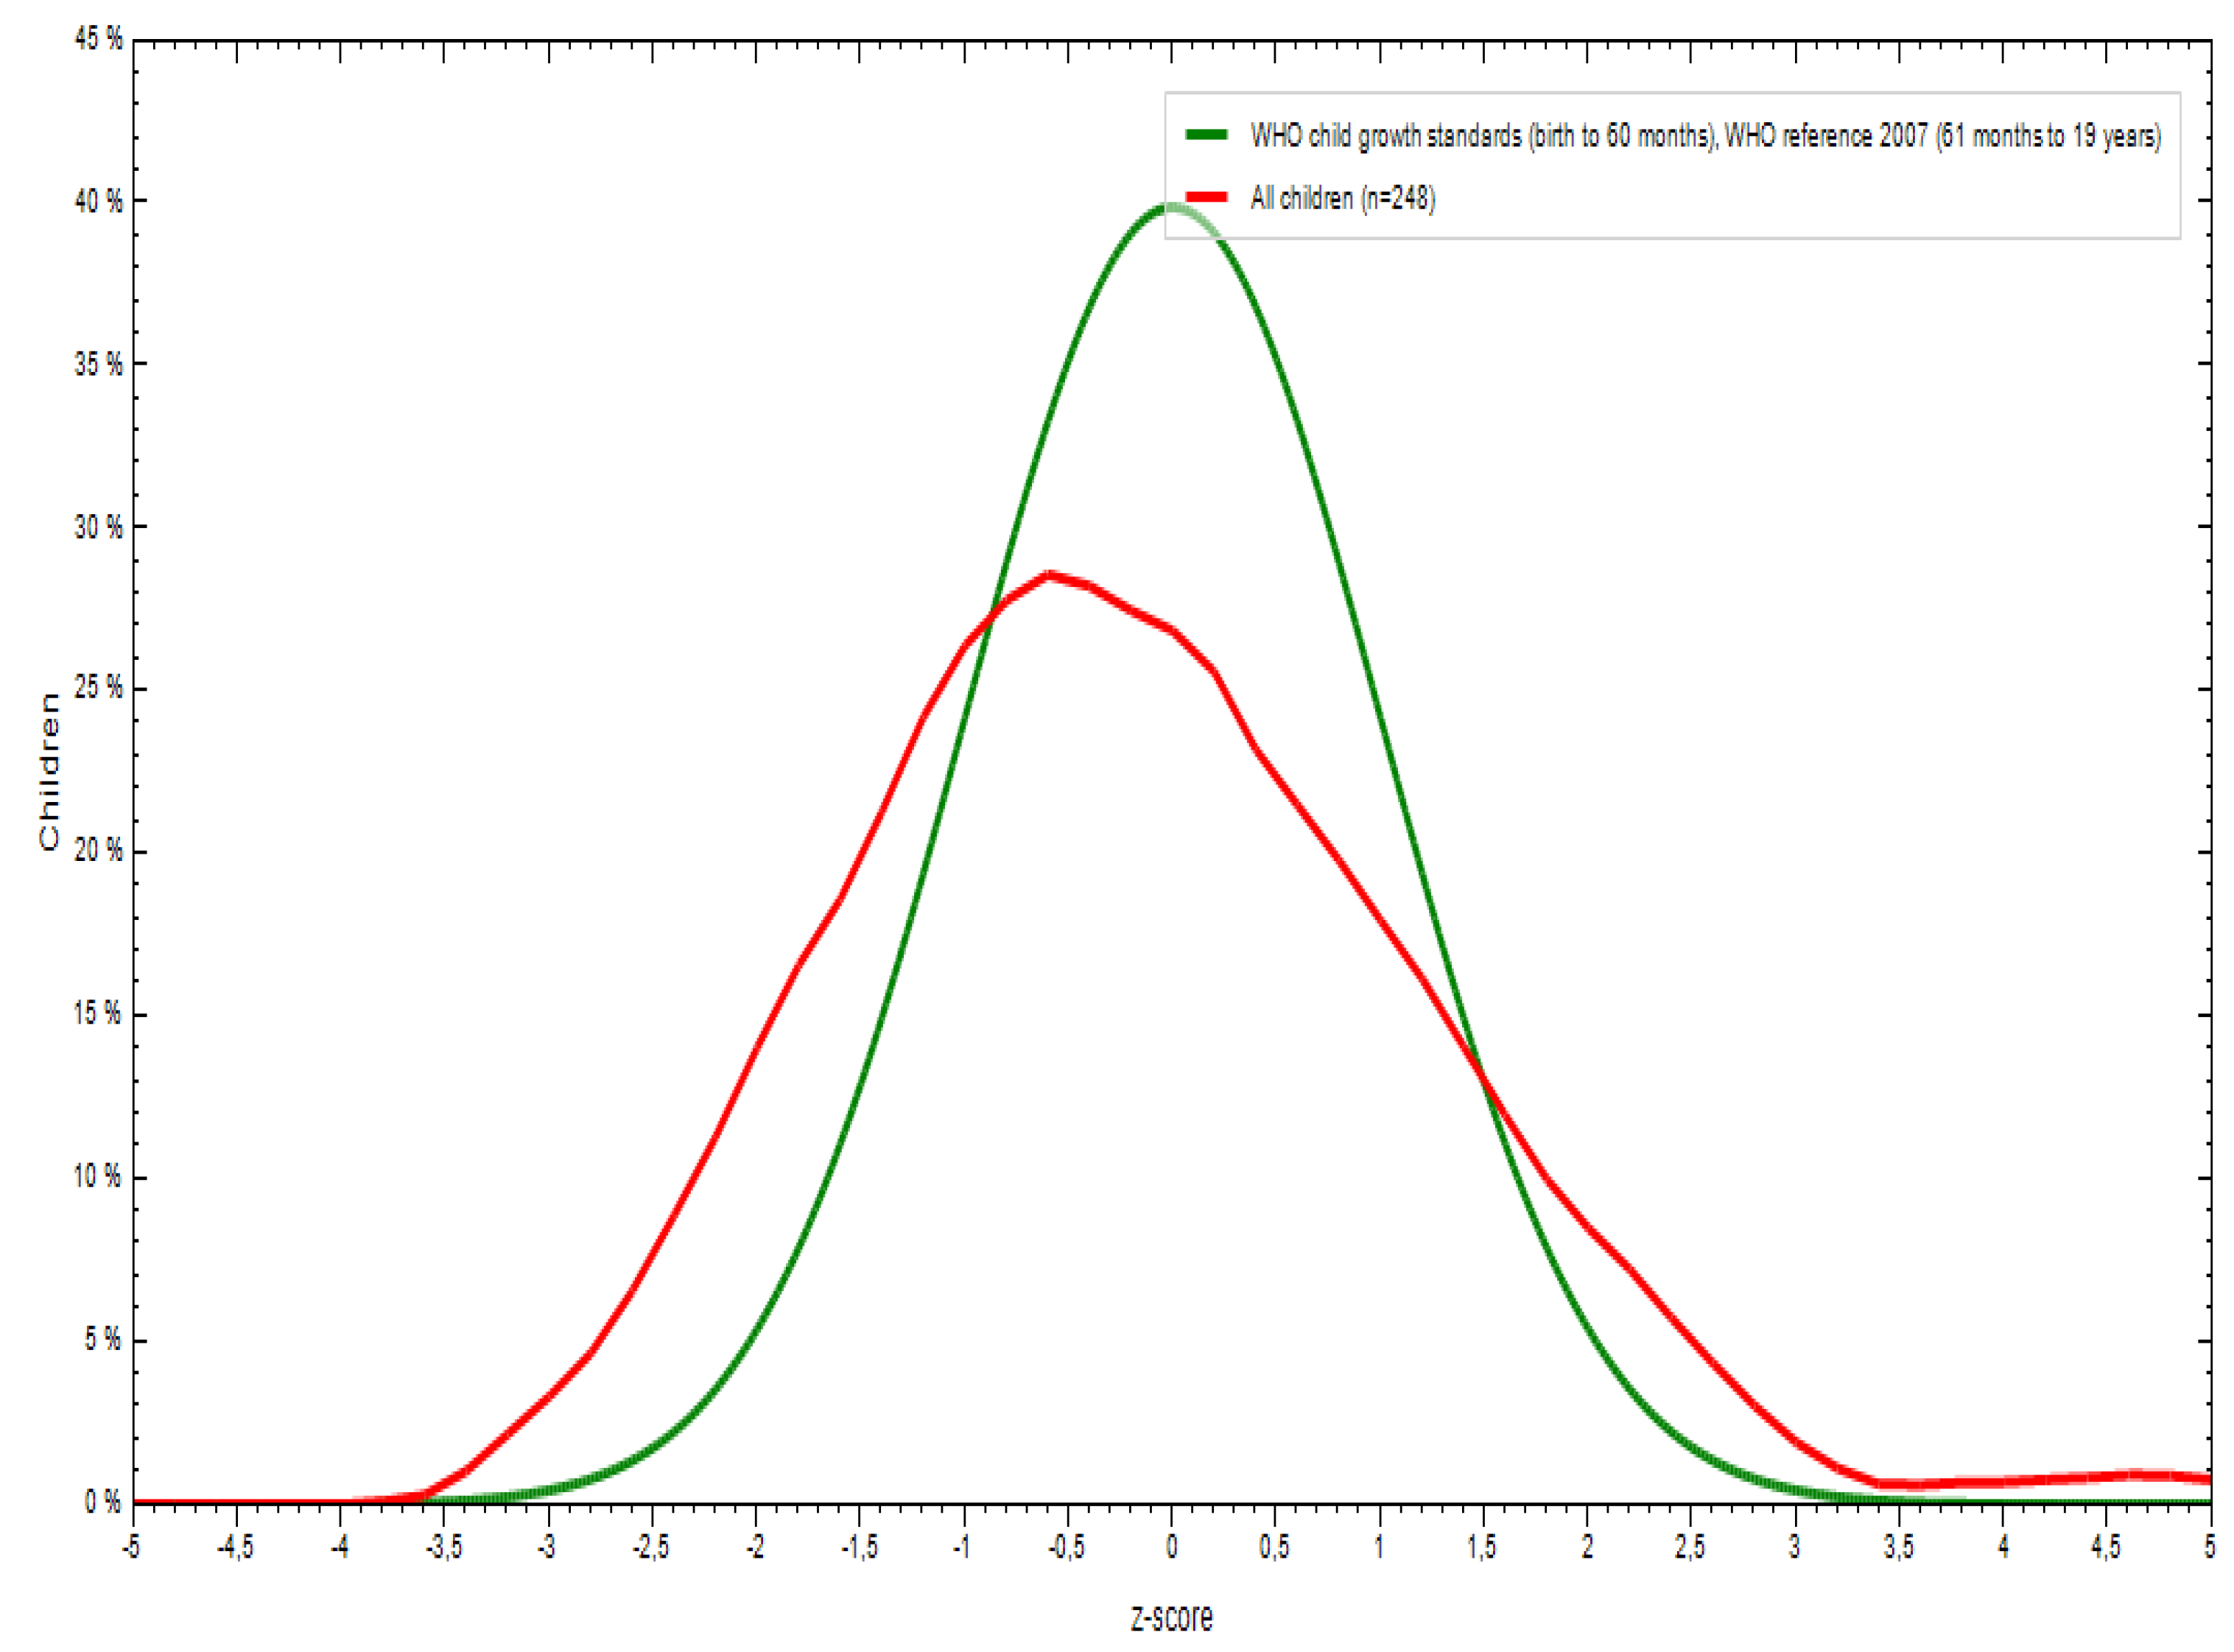
Table A2.
Mean scores and standard deviation (SD) in cognitive tests, mathematics, and literature and distribution of scores across performance categories: low (below the 50th percentile), medium (50th-75th percentile) and high (above the 75th percentile) performance for cognition test and low below 5/10, medium (5/10-7/10), and high (above 7/10) performance for mathematics and literature.
| Variable | Frequency N (%) | |||||
|---|---|---|---|---|---|---|
| Mean | ± | SD | High | Medium | Low | |
| Cognition | 15.4 | ± | 4.4 | 65 (25.9) | 77 (30.7) | 109 (43.4) |
| Mathematics | 6.0 | ± | 2.4 | 67 (26.7) | 111 (44.2) | 73 (29.1) |
| Literature | 5.4 | ± | 1.8 | 39 (15.5) | 120 (47.8) | 92 (36.7) |
Figure A4.
Identification of nutrients associated with cognition and school outcomes using principal component analysis.
Figure A4.
Identification of nutrients associated with cognition and school outcomes using principal component analysis.
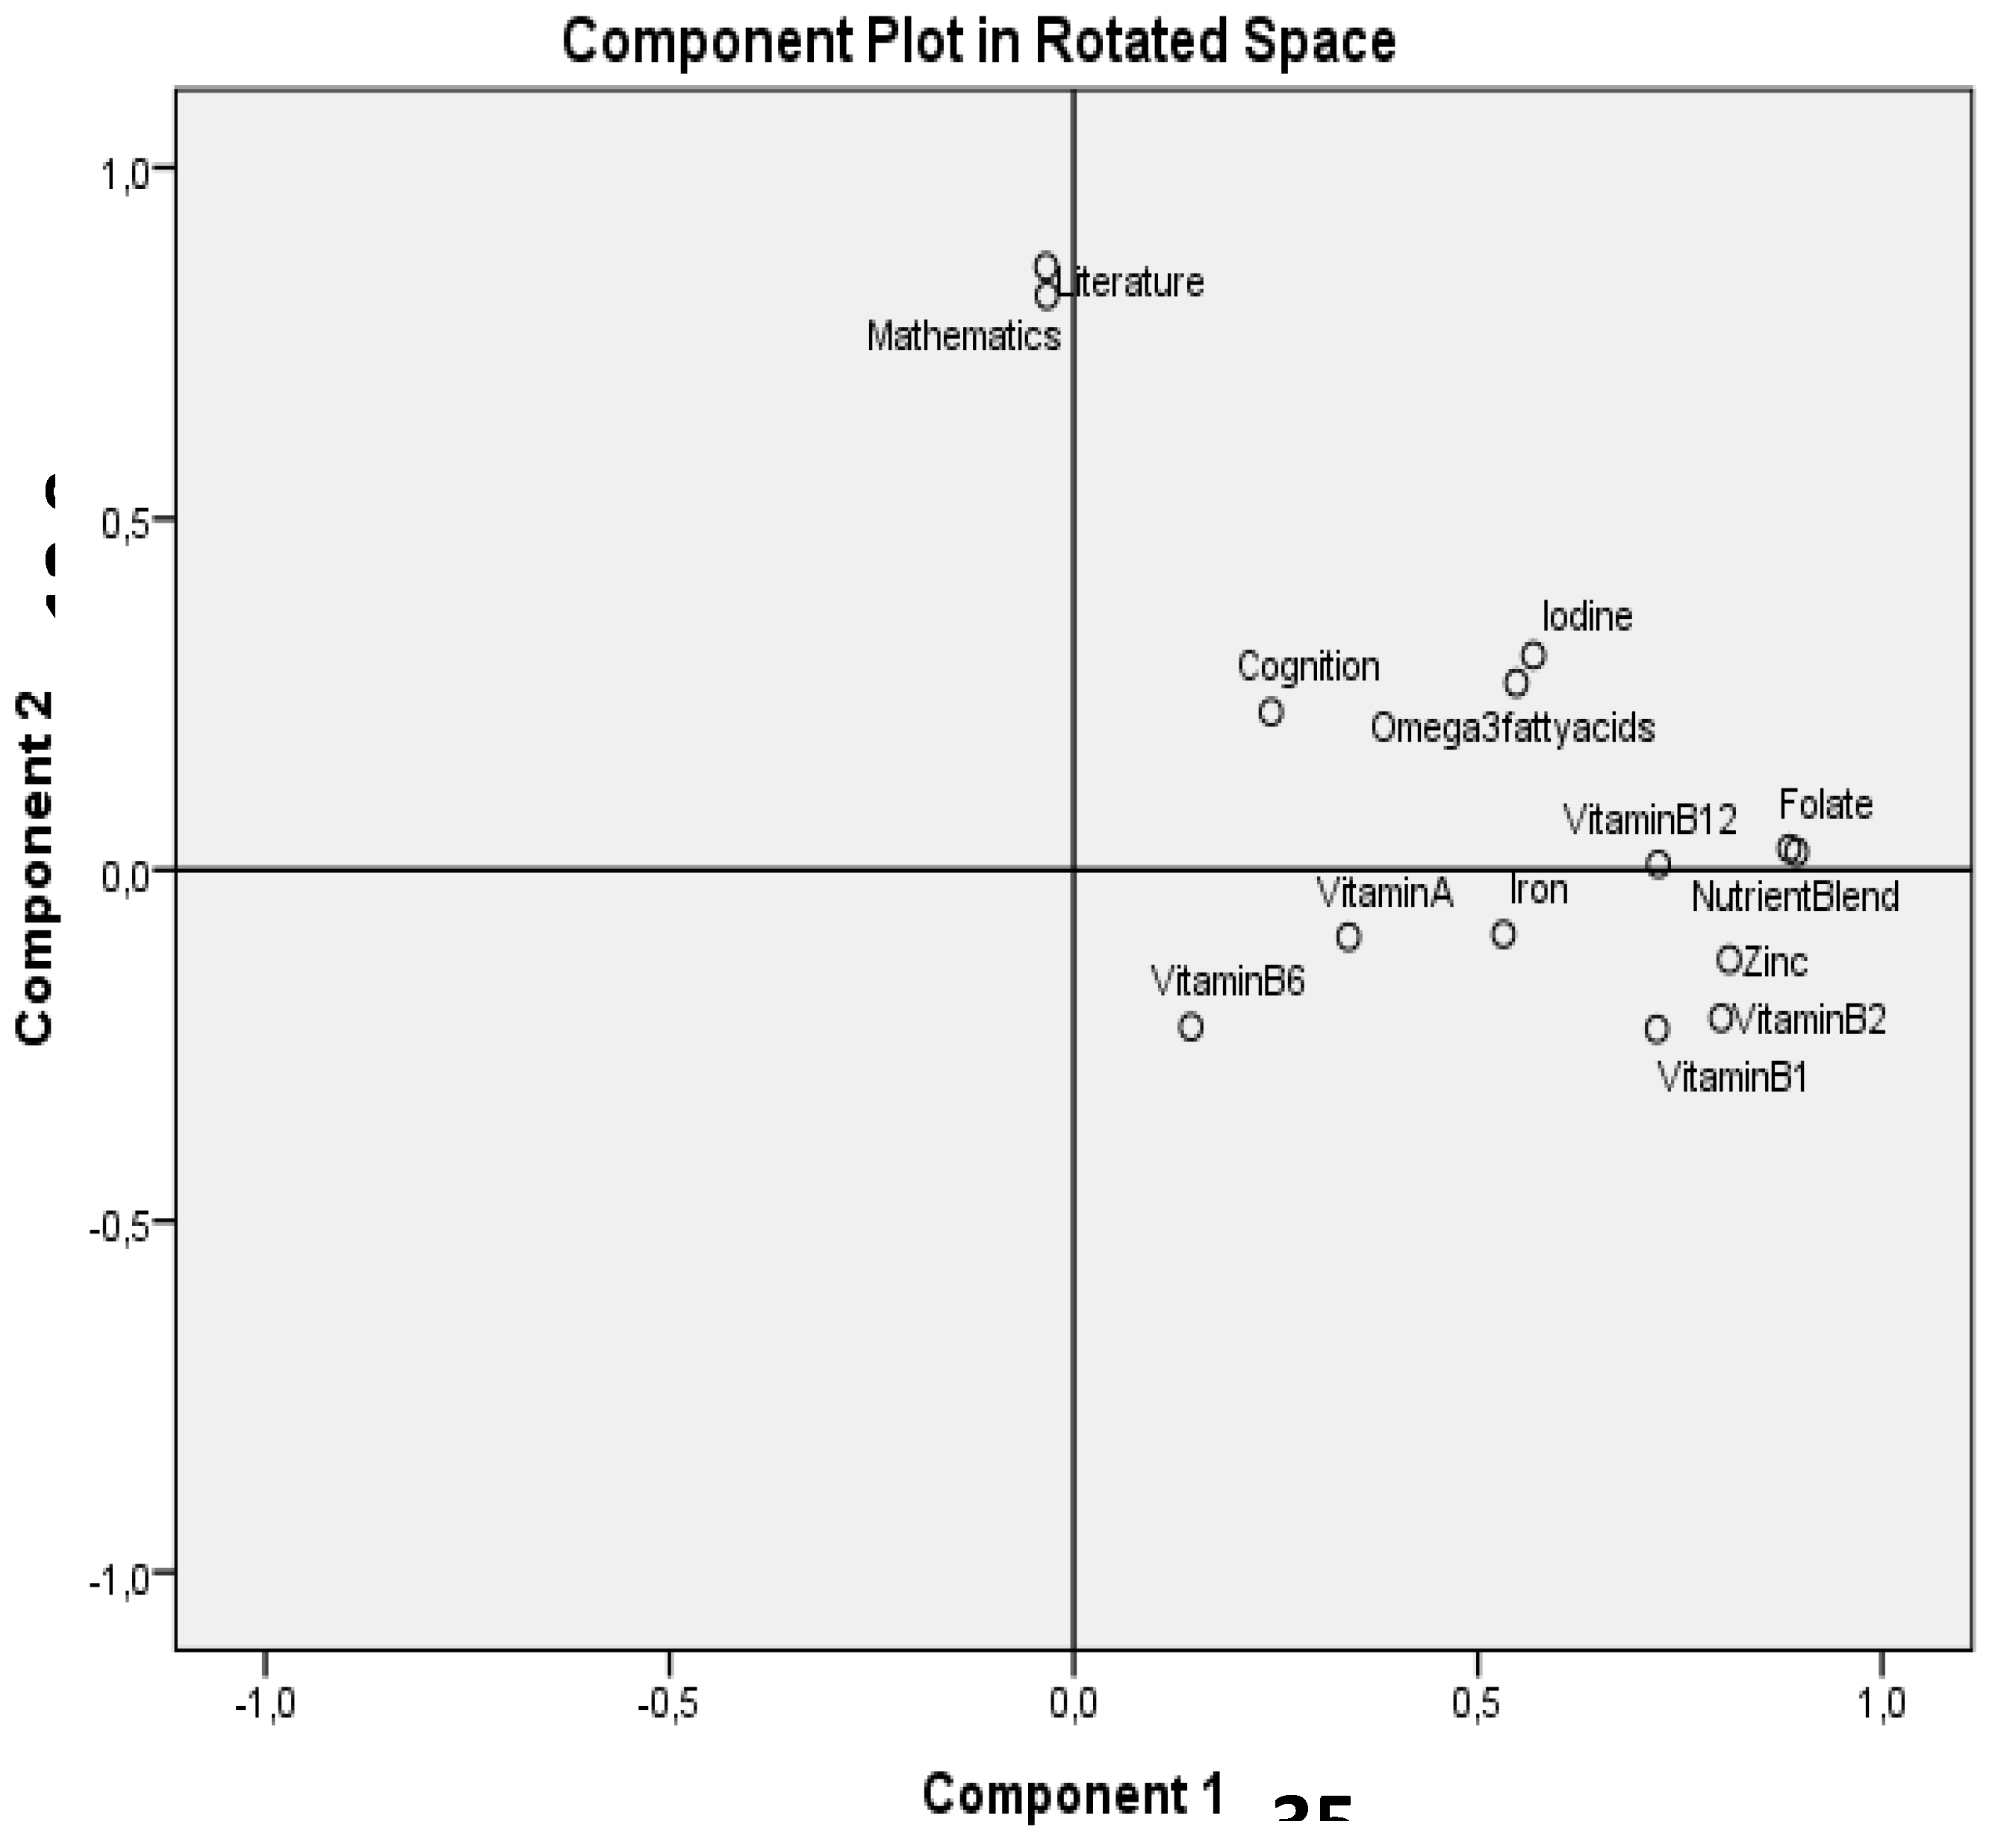
Table A3.
Associations between cognitive scores, academic performance, and nutrient intake using Spearman’s rank correlation (rho).
Table A3.
Associations between cognitive scores, academic performance, and nutrient intake using Spearman’s rank correlation (rho).
| Variable | Cognition test score | Mathematics | Literature | |||
|---|---|---|---|---|---|---|
| rho | p-value | rho | p-value | rho | p-value | |
| Vitamin A (µg) | 0.059 | 0.353 | -0.112 | 0.059 | -0.112 | 0.076 |
| Vitamin B1 (mg) | 0.227** | <.001 | -0.157* | 0.013 | -0.127* | 0.045 |
| Vitamin B2 (mg) | 0.248** | <.001 | -0.086 | 0.176 | -0.096 | 0.131 |
| Folate (µg) | 0.179** | 0.005 | -0.028 | 0.657 | -0.022 | 0.727 |
| Vitamin B12 (µg) | 0.065 | 0.308 | -0.019 | 0.767 | -0.060 | 0.345 |
| Vitamin B6 (mg) | -0.014 | 0.823 | -0.017 | 0.785 | -0.026 | 0.680 |
| Iron (mg) | 0.150* | 0.018 | -0.062 | 0.327 | -0.048 | 0.453 |
| Zinc (mg) | 0.118 | 0.062 | -0.050 | 0.433 | -0.081 | 0.200 |
| Iodine (µg) | 0.036 | 0.571 | -0.044 | 0.492 | 0.031 | 0.620 |
| Omega-3 fatty acids | 0.009 | 0.881 | -0.053 | 0.400 | -0.055 | 0.382 |
| Nutrient blend | 0.181** | 0.004 | -0.029 | 0.653 | -0.025 | 0.695 |
* Correlation is significant at the 0.05 level (2-tailed). ** Correlation is significant at the 0.01 level (2-tailed).
References
- Collins, W.A. School And Children: The Middle Childhood Years. In Development During Middle Childhood: The Years From Six to Twelve; National Academies Press (US), 1984.
- Monti, J.M.; Moulton, C.J.; Cohen, N.J. The Role of Nutrition on Cognition and Brain Health in Ageing: A Targeted Approach. Nutr. Res. Rev. 2015, 28, 167–180. [Google Scholar] [CrossRef]
- Yehuda, S.; Rabinovitz, S.; Mostofsky, D.I. Nutritional Deficiencies in Learning and Cognition. J. Pediatr. Gastroenterol. Nutr. 2006, 43, S22–S25. [Google Scholar] [CrossRef]
- Mantey, A.A.; Annan, R.A.; Lutterodt, H.E.; Twumasi, P. Iron Status Predicts Cognitive Test Performance of Primary School Children from Kumasi, Ghana. PLOS ONE 2021, 16, e0251335. [Google Scholar] [CrossRef]
- Gómez-Pinilla, F. Brain Foods: The Effects of Nutrients on Brain Function. Nat. Rev. Neurosci. 2008, 9, 568–578. [Google Scholar] [CrossRef]
- Lemaire, J.B.; Wallace, J.E.; Dinsmore, K.; Lewin, A.M.; Ghali, W.A.; Roberts, D. Physician Nutrition and Cognition during Work Hours: Effect of a Nutrition Based Intervention. BMC Health Serv. Res. 2010, 10, 241. [Google Scholar] [CrossRef]
- Zeisel, S.H. Importance of Methyl Donors during Reproduction. Am. J. Clin. Nutr. 2009, 89, 673S–677S. [Google Scholar] [CrossRef]
- Schuchardt, J.P.; Schneider, I.; Meyer, H.; Neubronner, J.; von Schacky, C.; Hahn, A. Incorporation of EPA and DHA into Plasma Phospholipids in Response to Different Omega-3 Fatty Acid Formulations - a Comparative Bioavailability Study of Fish Oil vs. Krill Oil. Lipids Health Dis. 2011, 10, 145. [Google Scholar] [CrossRef]
- Richardson, A.J. The Importance of Omega-3 Fatty Acids for Behaviour, Cognition and Mood. Scand. J. Nutr. 2003, 47, 92–98. [Google Scholar] [CrossRef]
- Lassek, W.D.; Gaulin, S.J.C. Sex Differences in the Relationship of Dietary Fatty Acids to Cognitive Measures in American Children. Front. Evol. Neurosci. 2011, 3. [Google Scholar] [CrossRef]
- Larson, L.M.; Phiri, K.S.; Pasricha, S.-R. Iron and Cognitive Development: What Is the Evidence? Ann. Nutr. Metab. 2017, 71, 25–38. [Google Scholar] [CrossRef]
- Falkingham, M.; Abdelhamid, A.; Curtis, P.; Fairweather-Tait, S.; Dye, L.; Hooper, L. The Effects of Oral Iron Supplementation on Cognition in Older Children and Adults: A Systematic Review and Meta-Analysis. Nutr. J. 2010, 9, 4. [Google Scholar] [CrossRef]
- Bhatnagar, S.; Taneja, S. Zinc and Cognitive Development. Br. J. Nutr. 2001, 85, S139–S145. [Google Scholar] [CrossRef]
- Black, M.M. The Evidence Linking Zinc Deficiency with Children’s Cognitive and Motor Functioning. J. Nutr. 2003, 133, 1473S–1476S. [Google Scholar] [CrossRef]
- De Moura, J.E.; De Moura, E.N.O.; Alves, C.X.; De Lima Vale, S.H.; Dantas, M.M.G.; De Araújo Silva, A.; Das Graças Almeida, M.; Leite, L.D.; Brandão-Neto, J. Oral Zinc Supplementation May Improve Cognitive Function in Schoolchildren. Biol. Trace Elem. Res. 2013, 155, 23–28. [Google Scholar] [CrossRef]
- Gibson, R.S.; Vanderkooy, P.D.; MacDonald, A.C.; Goldman, A.; Ryan, Ba.; Berry, M. A Growth-Limiting, Mild Zinc-Deficiency Syndrome in Some Southern Ontario Boys with Low Height Percentiles. Am. J. Clin. Nutr. 1989, 49, 1266–1273. [Google Scholar] [CrossRef]
- OMS WHO Global Database on Iodine Deficiency. WHO Geneva 2004.
- DeLong, G.R.; Stanbury, J.B.; Fierro-Benitez, R. Neurological Signs in Congenital Iodine-Deficiency Disorder (Endemic Cretinism). Dev. Med. Child Neurol. 1985, 27, 317–324. [Google Scholar] [CrossRef]
- Zimmermann, M.B.; Connolly, K.; Bozo, M.; Bridson, J.; Rohner, F.; Grimci, L. Iodine Supplementation Improves Cognition in Iodine-Deficient Schoolchildren in Albania: A Randomized, Controlled, Double-Blind Study. Am. J. Clin. Nutr. 2006, 83, 108–114. [Google Scholar] [CrossRef]
- Szeleszczuk, Ł.; Pisklak, D.M.; Grodner, B. Thiamine and Thiamine Pyrophosphate as Non-Competitive Inhibitors of Acetylcholinesterase—Experimental and Theoretical Investigations. Molecules 2025, 30, 412. [Google Scholar] [CrossRef]
- Aljaadi, A.M.; Devlin, A.M.; Green, T.J. Riboflavin Intake and Status and Relationship to Anemia. Nutr. Rev. 2022, 81, 114–132. [Google Scholar] [CrossRef]
- Naninck, E.F.G.; Stijger, P.C.; Brouwer-Brolsma, E.M. The Importance of Maternal Folate Status for Brain Development and Function of Offspring. Adv. Nutr. 2019, 10, 502–519. [Google Scholar] [CrossRef]
- Irvine, N.; England-Mason, G.; Field, C.J.; Dewey, D.; Aghajafari, F. Prenatal Folate and Choline Levels and Brain and Cognitive Development in Children: A Critical Narrative Review. Nutrients 2022, 14, 364. [Google Scholar] [CrossRef]
- Takle, M.; Sahjwani, D.; Bharucha-Goebel, D.; Rapp, T.; Bouska, C.; Kornbluh, A.; Sen, K. Pyridoxal Phosphate Binding Protein (PLPBP) Deficiency Mimicking Opsoclonus-myoclonus-ataxia Syndrome. Ann. Child Neurol. Soc. 2025, 3, 52–56. [Google Scholar] [CrossRef]
- Zhang, C.; Hu, Y.; Cao, X.; Deng, Y.; Wang, Y.; Wu, X.; Jiang, H. Lower Water-Soluble Vitamins and Higher Homocysteine Levels Contribute to Cognitive Decline in Patients with Neurodegenerative Diseases: A Retrospective Case-Control Study 2024.
- Rathod, R.; Kale, A.; Joshi, S. Novel Insights into the Effect of Vitamin B12 and Omega-3 Fatty Acids on Brain Function. J. Biomed. Sci. 2016, 23, 17. [Google Scholar] [CrossRef]
- Moore, E.; Mander, A.; Ames, D.; Carne, R.; Sanders, K.; Watters, D. Cognitive Impairment and Vitamin B12: A Review. Int. Psychogeriatr. 2012, 24, 541–556. [Google Scholar] [CrossRef]
- Strand, T.A.; Taneja, S.; Ueland, P.M.; Refsum, H.; Bahl, R.; Schneede, J.; Sommerfelt, H.; Bhandari, N. Cobalamin and Folate Status Predicts Mental Development Scores in North Indian Children 12–18 Mo of Age. Am. J. Clin. Nutr. 2013, 97, 310–317. [Google Scholar] [CrossRef]
- Ali, H.; Hamadani, J.; Mehra, S.; Tofail, F.; Hasan, M.I.; Shaikh, S.; Shamim, A.A.; Wu, L.S.; West Jr, K.P.; Christian, P. Effect of Maternal Antenatal and Newborn Supplementation with Vitamin A on Cognitive Development of School-Aged Children in Rural Bangladesh: A Follow-up of a Placebo-Controlled, Randomized Trial. Am. J. Clin. Nutr. 2017, 106, 77–87. [Google Scholar] [CrossRef]
- Gutema, B.T.; Levecke, B.; Sorrie, M.B.; Megersa, N.D.; Zewdie, T.H.; Yesera, G.E.; De Henauw, S.; Abubakar, A.; Abbeddou, S. Effectiveness of Intermittent Iron and High-Dose Vitamin A Supplementation on Cognitive Development of School Children in Southern Ethiopia: A Randomized Placebo-Controlled Trial. Am. J. Clin. Nutr. 2024, 119, 470–484. [Google Scholar] [CrossRef]
- Buckley, G.J.; Murray-Kolb, L.E.; Khatry, S.K.; LeClerq, S.C.; Wu, L.; West, K.P.; Christian, P. Cognitive and Motor Skills in School-Aged Children Following Maternal Vitamin A Supplementation during Pregnancy in Rural Nepal: A Follow-up of a Placebo-Controlled, Randomised Cohort. BMJ Open 2013, 3, e002000. [Google Scholar] [CrossRef]
- Asobayire, F.S.; Adou, P.; Davidsson, L.; Cook, J.D.; Hurrell, R.F. Prevalence of Iron Deficiency with and without Concurrent Anemia in Population Groups with High Prevalences of Malaria and Other Infections: A Study in Cote d’Ivoire. Am. J. Clin. Nutr. 2001, 74, 776–782. [Google Scholar] [CrossRef]
- Righetti, A.A. Aetiology of Anaemia and Public Health Implications in the Taabo Health Demographic Surveillance System, South-Central Côte d’Ivoire. PhD Thesis, University_of_Basel, 2014.
- Yapi, H.F.; Ahiboh, H.; Ago, K.; Aké, M.; Monnet, D. Profil Protéique et Vitamine A Chez l’enfant d’âge Scolaire En Côte d’Ivoire. Ann. Biol. Clin. (Paris) 2005, 63, 291–295. [Google Scholar]
- Fifi, T.M.; Sylvère, Z.K.Y.A.; Fossou, A.F.; Bitty, M.L.A.; Séraphin, K.-C. Assessment of the Nutritional Status of Schoolchildren in the Commune of Abobo. 2023.
- YAPO, P. Nutritional Status, Sociodemographic Status and Academic Performance of Students in Two Selected Secondary Schools in Yopougon, Abidjan (Côte d’Ivoire). Age 2018, 10, 70. [Google Scholar] [CrossRef]
- Koné, S.; Baikoro, N.; N’Guessan, Y.; Jaeger, F.N.; Silué, K.D.; Fürst, T.; Hürlimann, E.; Ouattara, M.; Séka, M.-C.Y.; N’Guessan, N.A.; et al. Health & Demographic Surveillance System Profile: The Taabo Health and Demographic Surveillance System, Côte d’Ivoire. Int. J. Epidemiol. 2015, 44, 87–97. [Google Scholar] [CrossRef]
- Diomande, M.; Dongo, K.; Dje, K.B.; Kouadio, K.K.H.; Kone, D.; Biemi, J.; Bonfoh, B. Vers Un Changement Du Calendrier Cultural Dans l’ecotone Foret-Savane de La Côte D’Ivoire. Agron. Afr. 2013, 25, 133–147. [Google Scholar]
- INS Institut National de la Statistique (INS). (2021). Recensement Général de la Population et de l’Habitat. Accès : Revue Internationale du Chercheur (PDF disponible). Available online: https://www.bing.com/search?q=Institut+National+de+la+Statistique+%28INS%29.+%282021%29Recensement+Général+de+la+Population+et+de+l’Habitat.+Accès+%3A+Revue+Internationale+du+Chercheur+%28PDF+disponible%29&form=ANNH01&refig=a69505812a6744f8a0e2554f682ee367&pc=U531 (accessed on 27 December 2024).
- World Health Organization Waist Circumference and Waist-Hip Ratio : Report of a WHO Expert Consultation, Geneva, 8-11 December 2008. 2011.
- WHO Growth Reference 5-19 Years - Application Tools. Available online: https://www.who.int/tools/growth-reference-data-for-5to19-years/application-tools (accessed on 15 April 2025).
- Mantey, A.A.; Annan, R.A.; Lutterodt, H.E.; Twumasi, P. Iron Status Predicts Cognitive Test Performance of Primary School Children from Kumasi, Ghana. Plos One 2021, 16, e0251335. [Google Scholar] [CrossRef]
- Onis, M. de; Onyango, A.W.; Borghi, E.; Siyam, A.; Nishida, C.; Siekmann, J. Development of a WHO Growth Reference for School-Aged Children and Adolescents. Bull. World Health Organ. 2007, 85, 660–667. [Google Scholar] [CrossRef]
- Gibson, R.S.; Ferguson, E.L. An Interactive 24-Hour Recall for Assessing the Adequacy of Iron and Zinc Intakes in Developing Countries. 2008.
- Anderegg, S.C. Evaluation and Interpretation of a Three-Day Weighed Food Record from South-Central Côte d’Ivoire with a Focus on Iron Intake and Absorption. Thesis, ETH Zurich, 2008.
- WHO/FAO, F.A.O. Vitamin and Mineral Requirements in Human Nutrition. 2004.
- EFSA Scientific Opinion on Dietary Reference Values for Fats, Including Saturated Fatty Acids, Polyunsaturated Fatty Acids, Monounsaturated Fatty Acids, Trans Fatty Acids, and Cholesterol. EFSA J. 2010, 8, 1461. [CrossRef]
- Raven, J.C. Guide to Using the Coloured Progressive Matrices; Guide to using the Coloured Progressive Matrices; H. K. Lewis & Co.: Oxford, England, 1958; p. 40. [Google Scholar]
- Ayalew, M.; Bayray, A.; Bekele, A.; Handebo, S. Nutritional Status and Educational Performance of School-Aged Children in Lalibela Town Primary Schools, Northern Ethiopia. Int. J. Pediatr. 2020, 2020, e5956732. [Google Scholar] [CrossRef]
- Ateillah, K.; Aboussaleh, Y.; Sbaibi, R.; Ahami, A.O.T. Évaluation Anthropométrique et Son Impact Sur La Performance Scolaire Des Lycéens de La Commune Urbaine Kenitra (Nord-Ouest Marocain). Antropo 2018, 39, 71–76. [Google Scholar]
- Toffoli, L.; Stefanelli, G.; Manca, G.; Del Popolo Cristaldi, F.; Duma, G.M.; Guidi, M.; Incagli, F.; Sbernini, L.; Tarantino, V.; Mento, G. Adaptive Cognitive Control in 4 to 7-Year-Old Children and Potential Effects of School-Based Yoga-Mindfulness Interventions: An Exploratory Study in Italy. Front. Psychol. 2025, 16. [Google Scholar] [CrossRef]
- Correa-Burrows, P.; Burrows, R.; Blanco, E.; Reyes, M.; Gahagan, S. Nutritional Quality of Diet and Academic Performance in Chilean Students. Bull. World Health Organ. 2016, 94, 185. [Google Scholar] [CrossRef]
- Haile, D.; Nigatu, D.; Gashaw, K.; Demelash, H. Height for Age z Score and Cognitive Function Are Associated with Academic Performance among School Children Aged 8–11 Years Old. Arch. Public Health 2016, 74, 17. [Google Scholar] [CrossRef]
- Taras, H. Nutrition and Student Performance at School. J. Sch. Health 2005, 75, 199–213. [Google Scholar] [CrossRef]
- Bleiweiss-Sande, R.; Chui, K.; Wright, C.; Amin, S.; Anzman-Frasca, S.; Sacheck, J.M. Associations between Food Group Intake, Cognition, and Academic Achievement in Elementary Schoolchildren. Nutrients 2019, 11, 2722. [Google Scholar] [CrossRef]
- Bleyere, M.N.; Kokore, B.A.; Konan, A.B.; Yapo, P.A. Prevalence of Child Malnutrition through Their Anthropometric Indices in School Canteens of Abidjan (Côte D’ivoire). Pak. J. Nutr. 2013, 12, 60. [Google Scholar] [CrossRef]
- Hürlimann, E.; Yapi, R.B.; Houngbedji, C.A.; Schmidlin, T.; Kouadio, B.A.; Silué, K.D.; Ouattara, M.; N’Goran, E.K.; Utzinger, J.; Raso, G. The Epidemiology of Polyparasitism and Implications for Morbidity in Two Rural Communities of Côte d’Ivoire. Parasit. Vectors 2014, 7, 81. [Google Scholar] [CrossRef]
- Akombi, B.J.; Agho, K.E.; Merom, D.; Renzaho, A.M.; Hall, J.J. Child malnutrition in sub-Saharan Africa: A meta-analysis of demographic and health surveys (2006-2016). PLOS ONE 2017, 12, e0177338. [Google Scholar] [CrossRef]
- Grantham-McGregor, S. A Review of Studies of the Effect of Severe Malnutrition on Mental Development. J. Nutr. 1995, 125, 2233S–2238S. [Google Scholar] [CrossRef]
- Asmare, B.; Taddele, M.; Berihun, S.; Wagnew, F. Nutritional Status and Correlation with Academic Performance among Primary School Children, Northwest Ethiopia. BMC Res. Notes 2018, 11, 805. [Google Scholar] [CrossRef]
- (Khokhlov; Slovenko, Neuropsychological Predictors of Poor School Performance. Available online: https://typeset.io/papers/neuropsychological-predictors-of-poor-school-performance-2i5wq0ac71 (accessed on 11 October 2024).
- Petry, N.; Olofin, I.; Hurrell, R.; Boy, E.; Wirth, J.; Moursi, M.; Donahue Angel, M.; Rohner, F. The Proportion of Anemia Associated with Iron Deficiency in Low, Medium, and High Human Development Index Countries: A Systematic Analysis of National Surveys. Nutrients 2016, 8, 693. [Google Scholar] [CrossRef]
- Wirth, J.; Petry, N.; Tanumihardjo, S.; Rogers, L.; McLean, E.; Greig, A.; Garrett, G.; Klemm, R.; Rohner, F. Vitamin A Supplementation Programs and Country-Level Evidence of Vitamin A Deficiency. Nutrients 2017, 9, 190. [Google Scholar] [CrossRef]
- Grantham-McGregor, S.; Cheung, Y.B.; Cueto, S.; Glewwe, P.; Richter, L.; Strupp, B. Developmental Potential in the First 5 Years for Children in Developing Countries. The Lancet 2007, 369, 60–70. [Google Scholar] [CrossRef]
- GAIN Iodine Deficiency in Côte d’Ivoire: Achievements and Remaining Challenges. Geneva: GAIN 2007.
- Tia, A.; Hauser, J.; Konan, A.G.; Ciclet, O.; Grzywinski, Y.; Mainardi, F.; Visconti, G.; Frézal, A.; Nindjin, C. Unravelling the Relationship between Nutritional Status and Cognitive and School Performance among School-Aged Children in Taabo, Côte d’Ivoire: A School-Based Observational Study. Front Nutr manuscript under revision.
- Gewa, C.A.; Weiss, R.E.; Bwibo, N.O.; Whaley, S.; Sigman, M.; Murphy, S.P.; Harrison, G.; Neumann, C.G. Dietary Micronutrients Are Associated with Higher Cognitive Function Gains among Primary School Children in Rural Kenya. Br. J. Nutr. 2009, 101, 1378–1387. [Google Scholar] [CrossRef]
- Kang, E.Y.; Kim, D.; Kim, H.K.; Kim, T.H.; Kim, W.; Lei, C.; Lee, S.; Gang, G.; Shin, M.; Kim, J.; et al. Modified Korean MIND Diet: A Nutritional Intervention for Improved Cognitive Function in Elderly Women through Mitochondrial Respiration, Inflammation Suppression, and Amino Acid Metabolism Regulation. Mol. Nutr. Food Res. 2023, 67, 2300329. [Google Scholar] [CrossRef]
- Annan, R.A.; Apprey, C.; Asamoah-Boakye, O.; Okonogi, S.; Yamauchi, T.; Sakurai, T. The Relationship between Dietary Micronutrients Intake and Cognition Test Performance among School-Aged Children in Government-Owned Primary Schools in Kumasi Metropolis, Ghana. Food Sci. Nutr. 2019, 7, 3042–3051. [Google Scholar] [CrossRef]
- Chen, Y.; Zhang, J. How Energy Supports Our Brain to Yield Consciousness: Insights From Neuroimaging Based on the Neuroenergetics Hypothesis. Front. Syst. Neurosci. 2021, 15. [Google Scholar] [CrossRef]
- Beard, J.L. Iron Biology in Immune Function, Muscle Metabolism and Neuronal Functioning. J. Nutr. 2001, 131, 568S–580S. [Google Scholar] [CrossRef]
- Corcoran, J.P.T.; Mey, J. Editorial: The Role of Retinoic Acid Signaling in Maintenance and Regeneration of the CNS: From Mechanisms to Therapeutic Targeting. Front. Mol. Neurosci. 2024, 17. [Google Scholar] [CrossRef]
- Butterworth, R.F. Thiamin Deficiency and Brain Disorders. Nutr. Res. Rev. 2003, 16, 277–284. [Google Scholar] [CrossRef]
- Powers, H.J. Riboflavin (Vitamin B-2) and Health12. Am. J. Clin. Nutr. 2003, 77, 1352–1360. [Google Scholar] [CrossRef]
- Crider, K.S.; Yang, T.P.; Berry, R.J.; Bailey, L.B. Folate and DNA Methylation: A Review of Molecular Mechanisms and the Evidence for Folate’s Role. Adv. Nutr. 2012, 3, 21–38. [Google Scholar] [CrossRef]
- Mocchegiani, E.; Romeo, J.; Malavolta, M.; Costarelli, L.; Giacconi, R.; Diaz, L.-E.; Marcos, A. Zinc: Dietary Intake and Impact of Supplementation on Immune Function in Elderly. AGE 2013, 35, 839–860. [Google Scholar] [CrossRef] [PubMed]
- Gutema, B.T.; Levecke, B.; Sorrie, M.B.; Megersa, N.D.; Zewdie, T.H.; Yesera, G.E.; De Henauw, S.; Abubakar, A.; Abbeddou, S. Effectiveness of Intermittent Iron and High-Dose Vitamin A Supplementation on Cognitive Development of School Children in Southern Ethiopia: A Randomized Placebo-Controlled Trial. Am. J. Clin. Nutr. 2024, 119, 470–484. [Google Scholar] [CrossRef] [PubMed]
- Román, C.K.; Cannavale, C.N.; Khan, N.A. Nutrition and Neurodevelopment: From Early Life Through Adolescence. In The Oxford Handbook of Cognitive Enhancement and Brain Plasticity; Oxford University Press, 2025; ISBN 978-0-19-767713-1. [Google Scholar] [CrossRef]
- Baumgartner, J.; Smuts, C.M.; Malan, L.; Kvalsvig, J.; van Stuijvenberg, M.E.; Hurrell, R.F.; Zimmermann, M.B. Effects of Iron and N-3 Fatty Acid Supplementation, Alone and in Combination, on Cognition in School Children: A Randomized, Double-Blind, Placebo-Controlled Intervention in South Africa1234. Am. J. Clin. Nutr. 2012, 96, 1327–1338. [Google Scholar] [CrossRef] [PubMed]
- van den Briel, T.; West, C.E.; Bleichrodt, N.; van de Vijver, F.J.; Ategbo, E.A.; Hautvast, J.G. Improved Iodine Status Is Associated with Improved Mental Performance of Schoolchildren in Benin123. Am. J. Clin. Nutr. 2000, 72, 1179–1185. [Google Scholar] [CrossRef] [PubMed]
- Okai-Mensah, P.; Brkić, D.; Hauser, J. The Importance of Lipids for Neurodevelopment in Low and Middle Income Countries. Front. Nutr. 2025, 12. [Google Scholar] [CrossRef]
- Bangirana, P.; Menk, J.; John, C.C.; Boivin, M.J.; Hodges, J.S. The Association between Cognition and Academic Performance in Ugandan Children Surviving Malaria with Neurological Involvement. PloS One 2013, 8, e55653. [Google Scholar] [CrossRef]
- Haile Height for Age z Score and Cognitive Function Are Associated with Academic Performance among School Children Aged 8–11 Years Old. Arch. Public Health 2016, 74, 17–17. [CrossRef]
- Molteno, G. Intellectual, Cognitive and Academic Outcomes of Very Low Birth Weight Adolescents Living in Disadvantaged Communities. PhD Thesis, Stellenbosch: Stellenbosch University, 2004.
Figure 1.
Map showing the study area located in the south-central region of Côte d’Ivoire.
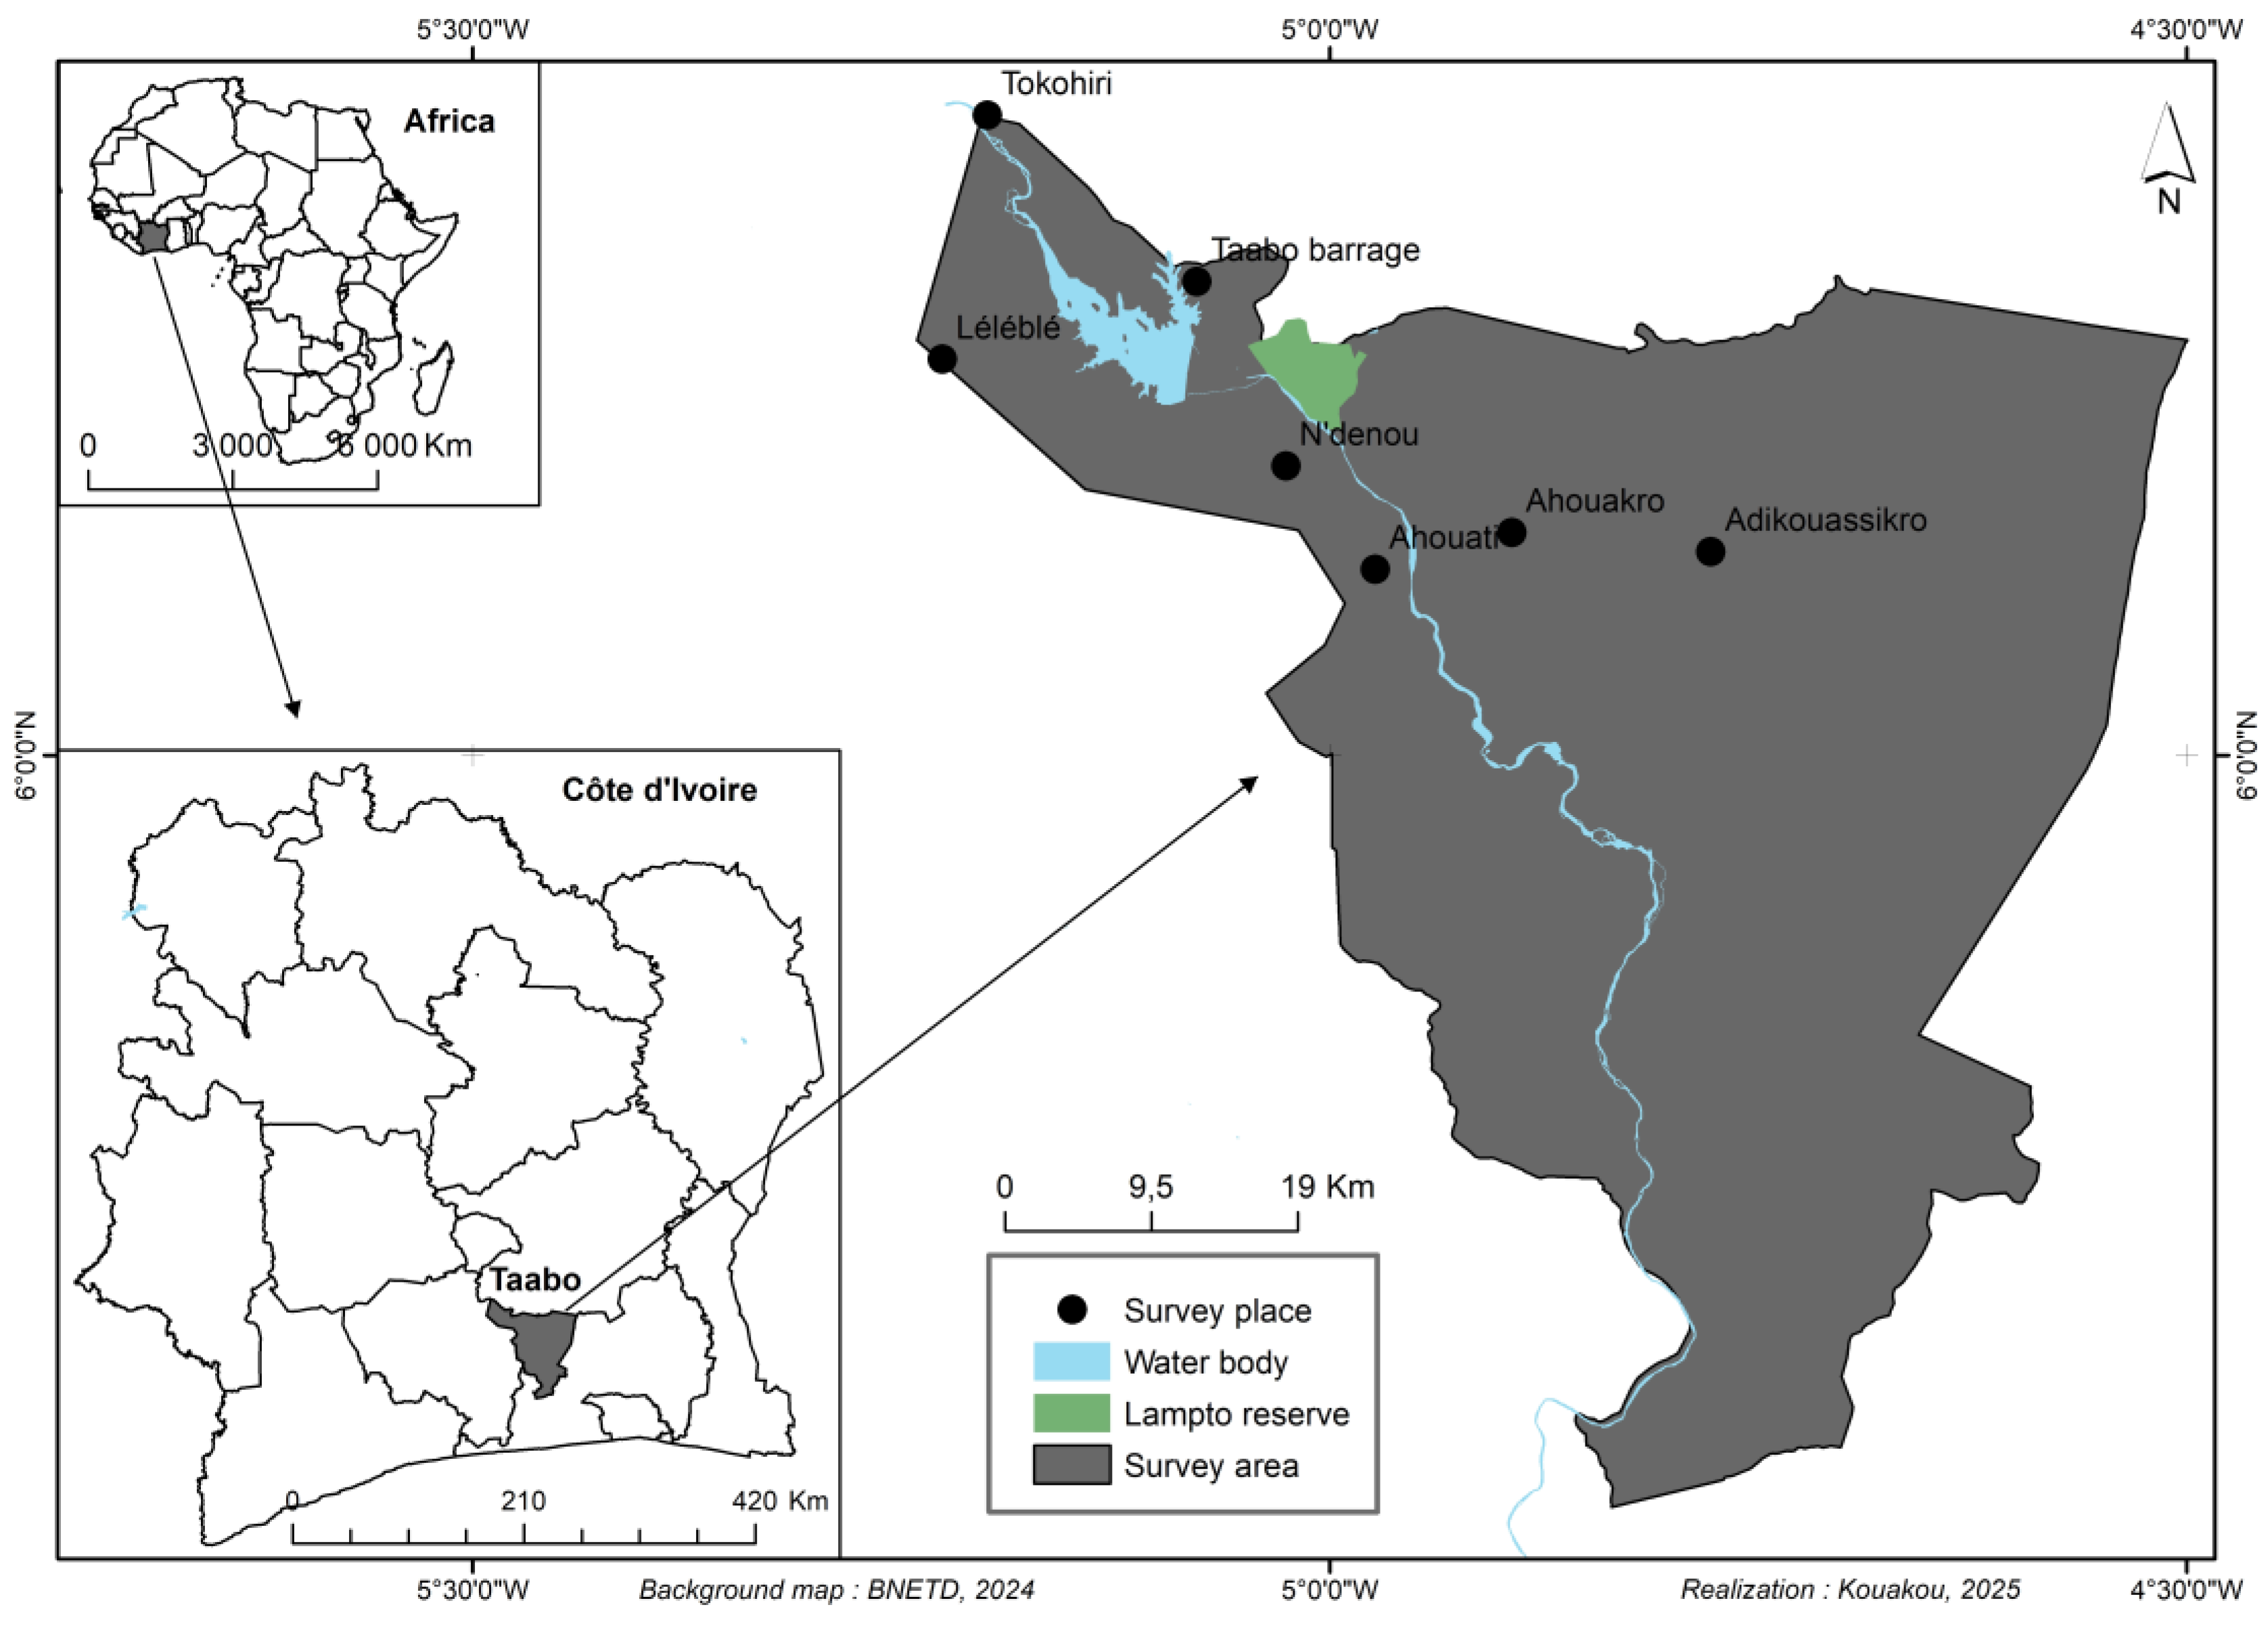
Table 1.
Comparison of mean scores in cognitive and school performance across sociodemographic and anthropometric groups.
Table 1.
Comparison of mean scores in cognitive and school performance across sociodemographic and anthropometric groups.
| Variable | Cognition | Mathematics | Literature | |||||||||||
|---|---|---|---|---|---|---|---|---|---|---|---|---|---|---|
| N | % | Mean | ± | SD | p-value | Mean | ± | SD | p-value | Mean | ± | SD | p-value | |
| Gender | ||||||||||||||
| Female | 116 | 46.2 | 14.9 | ± | 4.5 a | 0.046* | 5.9 | ± | 2.3 | 0.807* | 5.5 | ± | 1.8 | 0.624* |
| Male | 135 | 53.8 | 15.8 | ± | 4.3 b | 6.0 | ± | 2.4 | 5.4 | ± | 1.8 | |||
| Age | ||||||||||||||
| 6-8 years | 88 | 35.1 | 13.1 | ± | 2.7 b | < .001 | 6.8 | ± | 2.8a | < .001 | 5.9 | ± | 1.9a | 0.002 |
| 9-10 years | 76 | 30.3 | 15.9 | ± | 4.9 a | 5.4 | ± | 2.1b | 5.4 | ± | 1.8ab | |||
| 11-12 years | 87 | 34.7 | 17.1 | ± | 4.4 a | 5.6 | ± | 1.9b | 5.0 | ± | 1.6b | |||
| Absence in class | ||||||||||||||
| Never | 70 | 27.9 | 15.5 | ± | 4.9 | 0.807 | 6.0 | ± | 2.6 | 0.516 | 5.5 | ± | 2.0 | 0.874 |
| 1-3 days | 157 | 62.5 | 15.3 | ± | 4.2 | 6.0 | ± | 2.2 | 5.4 | ± | 1.7 | |||
| More than 3 days | 24 | 9.6 | 15.6 | ± | 3.8 | 5.4 | ± | 2.4 | 5.3 | ± | 1.8 | |||
| Grade repetition | ||||||||||||||
| Never | 141 | 56.2 | 15.3 | ± | 4.3 | 0.753 | 6.0 | ± | 2.5 | 0.114 | 5.7 | ± | 1.9a | 0.04 |
| Once | 87 | 34.7 | 15.2 | ± | 3.9 | 6.1 | ± | 2.1 | 5.2 | ± | 1.6a | |||
| More than once | 23 | 9.2 | 16.5 | ± | 6.1 | 5.1 | ± | 2.2 | 4.9 | ± | 1.6a | |||
| Household size | ||||||||||||||
| Small (≤5) | 49 | 19.5 | 15.7 | ± | 5.0 | 0.953* | 6.1 | ± | 2.3 | 0.682* | 5.6 | ± | 1.9 | 0.692* |
| Large (> 5) | 202 | 80. | 15.3 | ± | 4.2 | 5.9 | ± | 2.4 | 5.4 | ± | 1.8 | |||
| Duration (min) | ||||||||||||||
| Short (≤ 30 min) | 7 | 2.8 | 13.9 | ± | 2.3 | 0.284 | 6.6 | ± | 2.9 | 0.720 | 5.0 | ± | 1.6 | 0.284 |
| Medium (30-60 min) | 226 | 90.0 | 15.3 | ± | 4.3 | 5.9 | ± | 2.4 | 5.4 | ± | 1.8 | |||
| Long (≥ 60 min) | 18 | 7.2 | 17.1 | ± | 5.4 | 6.2 | ± | 1.5 | 5.8 | ± | 1.6 | |||
| School canteen | ||||||||||||||
| No | 69 | 27.5 | 14.8 | ± | 4.4 | 0.085* | 5.8 | ± | 2.6 | 0.962 | 5.5 | ± | 2.1 | 0.966 |
| Yes | 182 | 72.5 | 15.6 | ± | 4.4 | 6.0 | ± | 2.3 | 5.4 | ± | 1.7 | |||
| Live with parents | ||||||||||||||
| No | 7 | 2.8 | 15.3 | ± | 4.6 | 0.930* | 4.8 | ± | 1.9 | 0.194* | 4.9 | ± | 1.1 | 0.534* |
| Yes | 244 | 97.2 | 15.4 | ± | 4.4 | 6.0 | ± | 2.4 | 5.4 | ± | 1.8 | |||
| Mother’s occupation | ||||||||||||||
| Tertiary sector | 24 | 9.6 | 15.9 | ± | 4.8 | 0.566* | 6.2 | ± | 2.3 | 0.680* | 5.4 | ± | 1.8 | 0.664* |
| Housewife | 227 | 90.4 | 15.3 | ± | 4.3 | 5.9 | ± | 2.4 | 5.4 | ± | 1.9 | |||
| Mother’s education | ||||||||||||||
| Higher | 5 | 2.0 | 17.8 | ± | 7. 1a | 0.018 | 5.7 | ± | 1.2 | 0.419 | 5.8 | ± | 1.6 | 0.619 |
| Illiterate | 114 | 45.4 | 14.6 | ± | 4.2a | 6.1 | ± | 2.4 | 5.4 | ± | 1.8 | |||
| Primary | 88 | 35.1 | 15.8 | ± | 4.3 a | 5.7 | ± | 2.4 | 5.3 | ± | 1.8 | |||
| Secondary | 44 | 17.5 | 16.3 | ± | 4.3 a | 6.1 | ± | 2.2 | 5.8 | ± | 1.9 | |||
| Father’s occupation | ||||||||||||||
| Primary sector | 200 | 79.7 | 15.2 | ± | 4.5 | 0.272 | 6.0 | ± | 2.4 | 0.322 | 5.4 | ± | 1.8a | 0.023 |
| Secondary sector | 10 | 4.0 | 16.2 | ± | 5.2 | 4.9 | ± | 2.4 | 4.3 | ± | 1.2a | |||
| Tertiary sector | 41 | 16.3 | 15.8 | ± | 3.5 | 6.2 | ± | 2.3 | 5.9 | ± | 1.7b | |||
| Father's education | ||||||||||||||
| Higher | 21 | 8.4 | 16.2 | ± | 4.5 | 0.575 | 6.3 | ± | 2.3 | 0.688 | 5.9 | ± | 1.7 | 0.094 |
| Illiterate | 65 | 25.9 | 15.0 | ± | 4.5 | 6.1 | ± | 2.5 | 5.4 | ± | 1.7 | |||
| Primary | 102 | 40.6 | 15.2 | ± | 4.4 | 5.8 | ± | 2.4 | 5.1 | ± | 1.8 | |||
| Secondary | 63 | 25.1 | 15.8 | ± | 4.3 | 6.0 | ± | 2.3 | 5.8 | ± | 1.8 | |||
| School grade | ||||||||||||||
| Grade 1 | 42 | 16.7 | 13.0 | ± | 2.0 b | < .001 | 6.8 | ± | 3.2a | < .001 | 5.9 | ± | 2.0ab | 0.004 |
| Grade 2 | 42 | 16.7 | 12.6 | ± | 2.4 b | 6.8 | ± | 2.4ab | 5.9 | ± | 1.2a | |||
| Grade 3 | 42 | 16.7 | 14.5 | ± | 3.3 b | 5.0 | ± | 2.1c | 4.9 | ± | 1.9b | |||
| Grade 4 | 41 | 16.3 | 16.1 | ± | 4.2 a | 5.2 | ± | 2.1b | 5.0 | ± | 1.6b | |||
| Grade 5 | 42 | 16.7 | 18.1 | ± | 5.5 a | 5.8 | ± | 1.7ab | 5.3 | ± | 2.0ab | |||
| Grade 6 | 42 | 16.7 | 18.0 | ± | 4.4 a | 6.3 | ± | 1.8ab | 5.5 | ± | 1.7ab | |||
| Weight for age | ||||||||||||||
| Underweight | 11 | 8.8 | 13.1 | ± | 1.7 | 0.226 | 4.7 | ± | 3.0a | 0.035 | 5.3 | ± | 1.8 | 0.562 |
| Normal | 235 | 90.8 | 15.5 | ± | 4.4 | 6.0 | ± | 2.3ab | 5.4 | ± | 1.8 | |||
| Overweight | 5 | 0.4 | 15.7 | ± | 5.0 | 7.8 | ± | 1.4b | 5.8 | ± | 1.7 | |||
| Height for age | ||||||||||||||
| Stunting | 19 | 8.8 | 17.5 | ± | 6.0 | 0.172 | 5.6 | ± | 2.6 | 0.774 | 11.2 | ± | 3.4 | 0.188 |
| Normal | 214 | 84.9 | 15.2 | ± | 4.2 | 6.0 | ± | 2.3 | 5.5 | ± | 1.8 | |||
| Overgrowth | 18 | 0.4 | 15.8 | ± | 4.2 | 5.6 | ± | 2.4 | 4.9 | ± | 1.5 | |||
| BMI for age | ||||||||||||||
| Thinness | 23 | 9.2 | 15.9 | ± | 4.3 | 0.816 | 5.9 | ± | 2.5 | 0.976 | 5.8 | ± | 2.0 | 0.570 |
| Normal | 224 | 90 | 15.3 | ± | 4.4 | 6.0 | ± | 2.3 | 5.4 | ± | 1.7 | |||
| Overweight/Obesity | 2 | 0.8 | 17.5 | ± | 7.8 | 6.3 | ± | 2.4 | 6.4 | ± | 1.9 | |||
Note. Values are presented as frequency (N) and percentage (%) for categorical variables, as unadjusted means ± standard deviation (SD) and standard error (SE) for cognitive scores, and scores in mathematics and literature, stratified by sociodemographic and anthropometric categories. Group differences were assessed using the Kruskal-Wallis test. For comparisons involving two groups, the Mann-Whitney U test was applied. Statistical significance was set at p < 0.05. Values sharing the same letter within a column do not differ significantly based on Dunn’s post hoc test p-values (p < 0.05). *p-value from Mann-Whitney U test.
Table 2.
Mean of daily nutrient intake, percentage of adequate and inadequate intakes and distribution across tertiles.
Table 2.
Mean of daily nutrient intake, percentage of adequate and inadequate intakes and distribution across tertiles.
| Nutrient intake | Mean | ± | SD | Adequate | Inadequate | 1st tertile | 2nd tertile | 3rd tertile | |||||
|---|---|---|---|---|---|---|---|---|---|---|---|---|---|
| N | % | N | % | N | % | N | % | N | % | ||||
| Vitamin A (µg) | 1170.7 | ± | 1278.1 | 140 | 55.8 | 111 | 44.2 | 84 | 33.5 | 84 | 33.5 | 83 | 33.1 |
| Vitamin B1 (mg) | 0.4 | ± | 0.2 | 2 | 0.8 | 249 | 99.2 | 98 | 39.0 | 113 | 45 | 40 | 15. 9 |
| Vitamin B2 (mg) | 0.3 | ± | 0.2 | 1 | 0.4 | 250 | 99.6 | 94 | 37.5 | 112 | 44.6 | 45 | 17. 9 |
| Folic acid (µg) | 116.1 | ± | 67.3 | 1 | 0.4 | 250 | 99.6 | 84 | 33.5 | 85 | 33.9 | 82 | 32.7 |
| Vitamin B12 (µg) | 2.6 | ± | 1.8 | 153 | 61.0 | 98 | 39. 0 | 92 | 36.7 | 77 | 30.7 | 82 | 32.7 |
| Vitamin B6 (mg) | 3.6 | ± | 4.6 | 160 | 63.7 | 91 | 36.3 | 98 | 39.0 | 72 | 28.7 | 81 | 32.3 |
| Iron (mg) | 2.0 | ± | 1.7 | 8 | 3.2 | 242 | 96.8 | 83 | 33.1 | 85 | 33.9 | 83 | 33.1 |
| Zinc (mg) | 2.3 | ± | 1.0 | 0 | 0 | 251 | 100 | 85 | 33.3 | 86 | 34.3 | 80 | 31.9 |
| Iodine (µg) | 691.1 | ± | 416.9 | 251 | 100 | 0 | 0 | 83 | 33.1 | 85 | 33.9 | 83 | 33.1 |
| Omega-3 fatty acids (g) | 0.4 | ± | 0.4 | 176 | 70.1 | 75 | 29.9 | 128 | 51.0 | 61 | 24.3 | 62 | 24.7 |
| Nutrient blend | 123.0 | ± | 69.3 | NA | NA | NA | NA | 84 | 33.5 | 84 | 33.5 | 83 | 33.1 |
Note: Values are presented as mean ± standard deviation for daily nutrient intake, and as frequency (N) and percentage (%) for adequacy and tertile distribution. Nutrient adequacy was determined using WHO/FAO Dietary Reference Intakes (2004), except for iron and omega-3 fatty acids, for which reference values from the Institute of Medicine (IOM, 2005) and the European Food Safety Authority (EFSA, 2010) were used respectively.
Table 3.
Distribution of cognitive and academic performance across among the lower and higher tertiles of nutrient intakes.
Table 3.
Distribution of cognitive and academic performance across among the lower and higher tertiles of nutrient intakes.
| Cognition | Mathematics | Literature | ||||||||||||||||||||
|---|---|---|---|---|---|---|---|---|---|---|---|---|---|---|---|---|---|---|---|---|---|---|
| Nutrient intake tertile | Above75th | 50th75th | Below 50th | ꭓ2 | p | Above 7/10 | 5/10-7/10 | Below 5/10 | ꭓ2 | p | Above 7/10 | 5/10-7/10 | Below 5/10 | ꭓ2 | p | |||||||
| Vitamin A (µg) | ||||||||||||||||||||||
| Higher tertile | 27(32.5) | 30(36.1) | 26(31.3) | 3.4 | 0.181 | 18(21.7) | 40(48.2) | 25(30.1) | 3.6 | 0.166 | 14(16.9) | 33(39.7) | 36(43.4) | 3.0 | 0.228 | |||||||
| Lower tertile | 22(26.2) | 24(28.6) | 38(45.2) | 29(34.5) | 36(42.9) | 19(22.6) | 15(51.7) | 43(56.6) | 26(41.9) | |||||||||||||
| Vitamin B1 (mg) | ||||||||||||||||||||||
| Higher tertile | 20(50.0) | 13(32.5) | 7(17.5) | 20.8 | < .001 | 8(20.0) | 20(50.0) | 12(30.0) | 2.5 | 0.274 | 5(12.5) | 13(32.5) | 22(55.0) | 7.9 | 0.019 | |||||||
| Lower tertile | 18(18.4) | 24(24.5) | 56(57.4) | 33(33.7) | 42(42.9) | 23(23.5) | 18(18.4) | 51(52.0) | 29(29.6) | |||||||||||||
| Vitamin B2 (mg) | ||||||||||||||||||||||
| Higher tertile | 19(42.2) | 13(28.9) | 13(28.9) | 12.6 | 0.002 | 10(22.2) | 23(51.1) | 12(26.7) | 1.3 | 0.522 | 6(13.3) | 18(40.0) | 21(46.7) | 2.9 | 0.238 | |||||||
| Lower tertile | 16(17.0) | 25(26.6) | 53(56.4) | 29(30.9) | 40(42.6) | 25(26.6) | 15(16.0) | 49(52.1) | 31(31.9) | |||||||||||||
| Folate (µg) | ||||||||||||||||||||||
| Higher tertile | 32(39.0) | 21(25.6) | 29(35.4) | 10.4 | 0.006 | 22(26.8) | 36(43.9) | 24(29.3) | 0.4 | 0.833 | 14(17.1) | 34(41.5) | 34(41.5) | 2.1 | 0.350 | |||||||
| Lower tertile | 14(16.7) | 28(33.3) | 42(50.0) | 26(31.0) | 34(40.5) | 24(28.6) | 13(15.5) | 44(52.4) | 27(32.1) | |||||||||||||
| Vitamin B12 (µg) | ||||||||||||||||||||||
| Higher tertile | 23(28.0) | 23(28.0) | 36(43.9) | 0.2 | 0.886 | 22(26.8) | 37(45.1) | 23(28.0) | 0.1 | 0.977 | 13(15.9) | 38(46.3) | 31(37.8) | 0.1 | 0.964 | |||||||
| Lower tertile | 23(25.0) | 41(44.6) | 28(30.4) | 26(28.3) | 41(44.6) | 25(28.3) | 16(17.4) | 42(45.7) | 34(37.0) | |||||||||||||
| Vitamin B6 (mg) | ||||||||||||||||||||||
| Higher tertile | 18(22.2) | 21(25.9) | 42(51.9) | 1.5 | 0.482 | 18(22.2) | 41(50.6) | 22(27.2) | 3.2 | 0.207 | 12(14.8) | 38(46.9) | 31(38.3) | 0.7 | 0.719 | |||||||
| Lower tertile | 25(25.1) | 31(31.6) | 42(42. 9) | 30(30.6) | 37(37.8) | 31 (31.6) | 17(17.4) | 49(50.0) | 32(32.6) | |||||||||||||
| Iron (mg) | ||||||||||||||||||||||
| Higher tertile | 45(30.0) | 49(32.7) | 56(37.3) | 7.1 | 0.029 | 38(25.3) | 66(44.0) | 46(30.7) | 0.3 | 0.856 | 26(17.3) | 67(42.1) | 56(37.3) | 2.2 | 0.337 | |||||||
| Lower tertile | 12(14.5) | 25(30.1) | 46(55.4) | 22(26.5) | 46(47.0) | 22(26.5) | 11(13.3) | 43(51.8) | 29(34.9) | |||||||||||||
| Zinc (mg) | ||||||||||||||||||||||
| Higher tertile | 30(37.5) | 25(31.3) | 25(41.5) | 6.8 | 0.033 | 20(25.0) | 38(47.5) | 22(27.5) | 1.2 | 0.548 | 12(15.0) | 29(36.3) | 39(48.8) | 9.7 | 0.008 | |||||||
| Lower tertile | 17(20.0) | 29(34.1) | 39(45.9) | 27(31.8) | 34(40.0) | 24(28.2) | 10(11.8) | 51(60.0) | 24(28.2) | |||||||||||||
| Iodine (µg) | ||||||||||||||||||||||
| Higher tertile | 26(31.3) | 24(28.9) | 33(39.8) | 1.0 | 0.605 | 20(24.1) | 38(45.8) | 25(30.1) | 2.0 | 0.366 | 10(12.0) | 45(54.2) | 28(33.7) | 2.9 | 0.236 | |||||||
| Lower tertile | 21(25.3) | 29(34.9) | 33(39.8) | 28(33.7) | 35(42.2) | 20(24.1) | 17(20.5) | 36(43.4) | 30(36.1) | |||||||||||||
| Omega-3 fatty acids (g) | ||||||||||||||||||||||
| Higher tertile | 20(32.3) | 13(21.0) | 64(46.8) | 4.0 | 0.133 | 16(25.8) | 26(41.9) | 20(32.3) | 0.4 | 0.816 | 7(11.3) | 31(50.0) | 24(38.7) | 1.1 | 0.567 | |||||||
| Lower tertile | 45(23.8) | 64(33.9) | 80(42.3) | 51(27.0) | 85(44.9) | 53(28.0) | 32(16.9) | 89(47.1) | 68(36.0) | |||||||||||||
| Nutrient Blend | ||||||||||||||||||||||
| Higher tertile | 31(37.3) | 22(26.5) | 30(36.1) | 10.3 | 0.006 | 23(27.7) | 36(43.4) | 24(28.9) | 0.3 | 0.849 | 15(18.1) | 34(41.0) | 34(41.0) | 2.2 | 0.329 | |||||||
| Lower tertile | 13(15.5) | 29(34.5) | 42(50.0) | 26(30.9) | 33(39.3) | 25(29.8) | 13(15.5) | 44(52.4) | 27(32.1) | |||||||||||||
Note. Data are presented as frequency (N) and percentage (%). Associations nutrients intakes with cognition and school performance were assessed using the chi-squared (χ²) test. Statistical significance was defined as p < 0.05. χ² = chi-squared test statistic. p= chi-squared (χ²) test p-value.
Table 4.
Binary logistic regression of sociodemographic and nutritional factors associated with cognitive test scores and school performance above 50th percentile and 5 out 10 respectively.
Table 4.
Binary logistic regression of sociodemographic and nutritional factors associated with cognitive test scores and school performance above 50th percentile and 5 out 10 respectively.
| Variable | Cognition | Mathematics | Literature | ||||||
|---|---|---|---|---|---|---|---|---|---|
| AOR | 95% C. I | p-value | AOR | 95% C. I | p-value | AOR | 95% C. I | p-value | |
| Gender | |||||||||
| Girls | 0.6 | (0.3-0.9) | 0.048 | 1.2 | (0.7-2.1) | 0.584 | 1.2 | (0.7-2.0) | 0.541 |
| Boys | Reference | ||||||||
| Age groups | |||||||||
| 6-8 years | 0.4 | (0.2-08) | 0.010 | 1.9 | (0.9-3.3) | 0.073 | 1.8 | (0.9-3.5) | 0.103 |
| 11-12 years | 2.2 | (1.1-4.2) | 0.024 | 1.1 | (0.6-2.1) | 0.784 | 0.5 | (3.0-1.0) | 0.054 |
| 9-10 years | Reference | ||||||||
| School grade | |||||||||
| Grade one | 0.1 | (0.5-0.4) | <.001 | 0.8 | (0.3-2.2) | 0.59 | 1.2 | (0.7-4.6) | 0.235 |
| Grade two | 0.1 | (0.-0.3) | <.001 | 1.7 | (0.5-5.8) | 0.369 | 4.1 | (1.3-12.7) | 0.014 |
| Grade three | 0.2 | (0.1-0.5) | <.001 | 0.2 | (0.1-0.6) | 0.004 | 0.7 | (0.3-1.6) | 0.375 |
| Grade four | 0.4 | (0.1-1.1) | 0.072 | 0.3 | (0.1-0.9) | 0.029 | 0.4 | (0.2-1.1) | 0.064 |
| Grade five | 0.6 | (0.2-1.6) | 0.291 | 0.6 | (0.2-1.6) | 0.308 | 0.6 | (0.3-1.5) | 0.270 |
| Grade six | Reference | ||||||||
| Weight-for-age | |||||||||
| Under/overweight | Reference | ||||||||
| Normal Vitamin B1 intake |
0.4 | (0.1-1.1) | 0.066 | 1.7 | (0.6-5.0) | 0.342 | 1.7 | (0.6-5.1) | 0.332 |
| Lower | Reference | ||||||||
| Higher | 6.3 | (2.5-16.0) | <.001 | 0.7 | (0.3-1.6) | 0.676 | 0.3 | (0.1-0.6) | 0.02 |
| Vitamin B2 intake | |||||||||
| Lower | Reference | ||||||||
| Higher | 2.2 | (1.5-7.8) | 0.003 | 1.0 | (0.4-2.2) | 0.961 | 0.5 | (0.3-1.1) | 0.099 |
| Folate intake | |||||||||
| Lower | Reference | ||||||||
| Higher | 1.8 | (0.9-3.3) | 0.086 | 1.0 | (0.5-2.0) | 0.935 | 0.7 | (0.3-1.2) | 0.196 |
| Iron intake | |||||||||
| Lower | Reference | ||||||||
| Higher | 1.9 | (1.0-3.6) | 0.056 | 0.9 | (0.4-1.8) | 0.727 | 0.9 | (0.5-1.7) | 0.750 |
| Zinc intake | |||||||||
| Lower | Reference | ||||||||
| Higher | 1.7 | (0.8-3.3) | 0.130 | 1.1 | (0.5-2.2) | 0.820 | 0.4 | (0.2-0.7) | 0.005 |
| Nutrient blend intake | |||||||||
| Lower | Reference | ||||||||
| Higher | 1.7 | (0.9-3.3) | 0.101 | 1.0 | (0.5-2.1) | 0.918 | 0.6 | (0.3-1.2) | 0.136 |
AOR: Adjusted Odds Ratio; CI: Confidence Interval. Micronutrient intake levels were categorized into lower and higher tertiles, with the lower tertile used as reference. All models were adjusted for maternal education level and paternal occupation. Statistical significance was set at p < 0.05.
Disclaimer/Publisher’s Note: The statements, opinions and data contained in all publications are solely those of the individual author(s) and contributor(s) and not of MDPI and/or the editor(s). MDPI and/or the editor(s) disclaim responsibility for any injury to people or property resulting from any ideas, methods, instructions or products referred to in the content. |
© 2025 by the authors. Licensee MDPI, Basel, Switzerland. This article is an open access article distributed under the terms and conditions of the Creative Commons Attribution (CC BY) license (https://creativecommons.org/licenses/by/4.0/).
Copyright: This open access article is published under a Creative Commons CC BY 4.0 license, which permit the free download, distribution, and reuse, provided that the author and preprint are cited in any reuse.


