Submitted:
11 February 2025
Posted:
12 February 2025
You are already at the latest version
Abstract
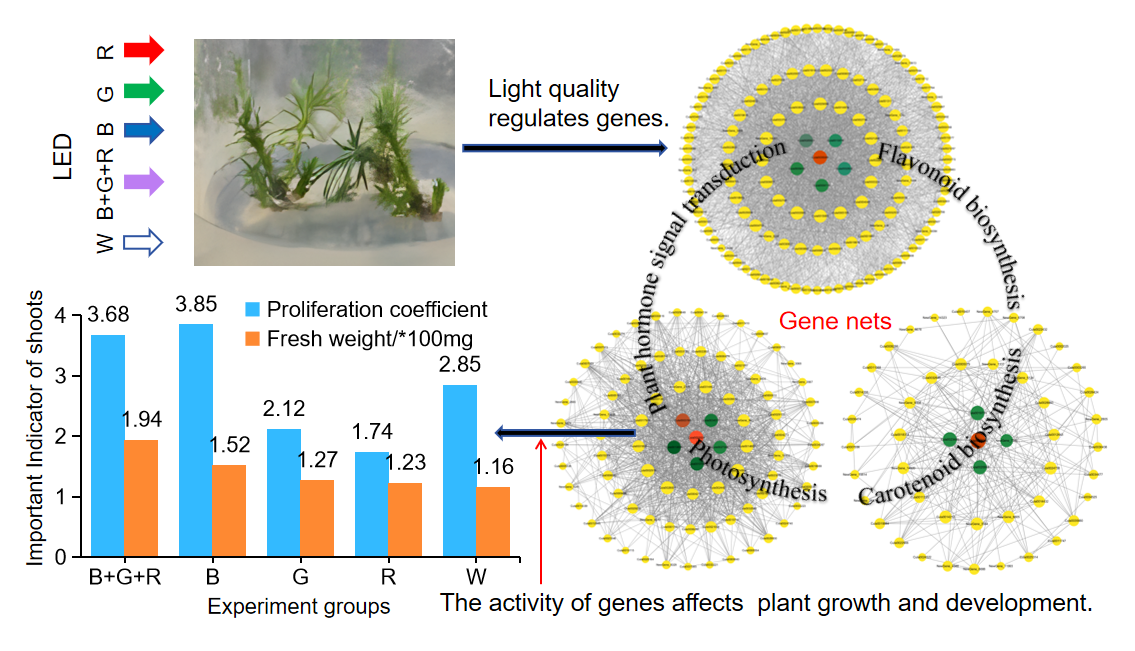
Chinese fir (Cunninghamia lanceolata) is an important fast-growing tree species for timber production and ecological protection in China. Tissue culture is a key method for fast-propagating Chinese fir seedlings, but the technique is hindered by low proliferation rate and poor seedling quality. Light quality plays a crucial role in influencing seedling proliferation and growth, but the underlying regulatory mechanisms remain poorly understood. This study integrated transcriptome and metabolome analyses to investigate how light qualities regulate adventitious shoot proliferation and growth in tissue-cultured Chinese fir seedlings. Seedlings were grown under red, green, blue, and composite light-emitting diode (LED) conditions, with white light serving as the control. The results showed that blue light and blue-dominant composite light significantly enhanced adventitious shoot proliferation by promoting higher levels of auxin (IAA) and cytokinin (CTK), with gibberellin (GA) strongly enhancing the proliferation under blue light. These light conditions also enhanced chlorophyll content and photosynthetic efficiency, thereby promoting biomass accumulation, and highlighting the significant regulatory effects of light quality on growth. In contrast, red light promoted shoot height, leaf area, and carotenoid content, likely due to elevated GA and reduced IAA and CTK levels but inhibited proliferation due to hormonal imbalances. Green light increased abscisic acid (ABA) levels, counteracting the proliferation-promoting effect of zeatin riboside (ZR) and suppressing shoot growth. Transcriptome and metabolome analyses identified key pathways involved in light quality-mediated regulation, including plant hormone signal transduction, photosynthesis, and flavonoid and carotenoid biosynthesis. Weighted gene co-expression network analysis (WGCNA) identified four key genes regulated by light quality that further modulated hormone biosynthesis and signaling transduction. The genes PSBS (encoding photosystem II protein) and FTSH (encoding cell division protease) were crucial for photosynthesis, proliferation, and biomass accumulation. GID1 (encoding gibberellin receptor) was essential for shoot height and leaf area expansion, and GST (encoding glutathione S-transferase) played a key role in carotenoid biosynthesis and stress tolerance of adventitious shoots. Differential expression of GA- and CTK-related genes, such as GID1, DELLA (GA negative regulator), B-ARR and A-ARR (Arabidopsis response regulators), underscored the pivotal role of light quality in regulating hormonal pathways. This research provided valuable insights for optimizing Chinese fir seedling proliferation and growth, and would ultimately contribute to sustainable plantation management.
Keywords:
Chinese fir
; proliferation coefficient
; light quality
; hormone metabolism
; transcriptome
; WGCNA
1. Introduction
Light is a critical environmental factor influencing plant growth and development, particularly during the seedling phase, which exerts a direct influence on survival rates, quality, and, ultimately, productivity [1,2,3]. Light quality, defined by wavelength, plays a key role in regulating seedling growth. Photons of different light qualities possess varying energy levels and generate distinct light signals that activate diverse signal transduction processes, regulating gene expression, protein synthesis, and cellular metabolism [4,5]. These processes, in turn, influence plant photosynthesis, morphogenesis, physiology, and biochemistry [6,7]. The types and quantities of light receptors in plant seedlings are diverse, rendering their responses to light quality intricate, multifarious, and species-specific [8,9]. Therefore, investigating the mechanisms by which light quality regulates plant seedling growth and development remains both challenging and essential.
Chinese fir (Cunninghamia lanceolata) stands as a pivotal fast-growing plantation species in South China. It is extensively utilized in timber production for construction, bridge and shipbuilding industries. Moreover, it assumes a vital role in ecological protection, contributing significantly to soil and water conservation, sand fixation, and acting as windbreaks. Additionally, its roots and bark are utilized in traditional Chinese medicine. In recent years, the planted area and volume of Chinese fir have ranked first among plantation forests in China [10]. The cultivation of high-quality seedlings is of utmost significance for the success of afforestation. These seedlings can rapidly establish themselves within favorable ecological niches and enhance survival rates [11,12]. The propagation of Chinese fir predominantly occurs through seed germination, cuttings, and tissue culture techniques [13]. Among these methods, tissue culture is the most effective for procuring high-quality seedlings. It enables the rapid multiplication of superior clones through in-vitro culture. This not only results in shorter growth cycles and enhanced propagation efficiency but also ensures the preservation of favorable parental characteristics [11,12]. Despite efforts to optimize the proliferation medium for Chinese fir plantlets [14], challenges such as low proliferation coefficients and poor adventitious shoot quality still hinder the widespread application of tissue culture techniques in Chinese fir seedling production.
Light quality plays a critical role in regulating the growth and development of tissue-cultured plant seedlings, particularly in influencing the proliferation of adventitious shoots. Various studies have demonstrated that different light qualities impact key physiological processes such as cell division, shoot differentiation, and root formation across different plant species. For example, red light has been found to maximize the proliferation coefficient in Aquilaria crassna Pierre. plantlets [15], while a red-to-blue light intensity ratio of 3:1 is most beneficial for root formation in tissue-cultured Chinese fir seedlings [11]. Additionally, blue light and a combination of red and blue light have been shown to promote adventitious shoot germination and affect the growth of tissue-cultured Chinese fir seedlings [13,16]. A multi-wavelength light combination, including red, blue, purple, and green, has been found to enhance the overall growth of tissue-cultured Chinese fir seedlings [17]. Furthermore, our previous research about optimization of the light environment for the propagation of tissue-cultured Chinese fir seedlings demonstrated that seedlings exhibited the highest proliferation coefficient and growth under a composite light of 30 μmol m−2 s−1 blue, 2 μmol m−2 s−1 green, and 20 μmol m−2 s−1 red light [18]. Light not only impacts growth directly but also interacts with plant hormones to regulate developmental processes. For example, gibberellin (GA) and auxins (IAA) play a crucial role in adventitious shoot germination, while ethylene acts to inhibit the process [19]. Moreover, light quality affects the synthesis, distribution, and transport of these hormones. Recent studies have shown that red light enhances the polar transport of IAA, while purple light increases IAA and zeatin riboside (ZR) levels, and green and yellow light elevate IAA and gibberellin A3 (GA3) contents while reducing abscisic acid (ABA) content [20]. Despite significant progress, previous studies have focused on the effects of light quality on adventitious shoot proliferation and physiological-biochemical characteristics, while the molecular mechanisms behind the regulation of adventitious shoot proliferation of Chinese fir under different light qualities remain poorly understood. Thus, further research is needed to unravel the precise molecular pathways through which light quality influences the adventitious shoot proliferation, providing insights to improve the propagation of Chinese fir seedlings.
Transcriptomic and metabolomic analyses are powerful tools for investigating gene expression patterns and revealing the molecular mechanisms of plant propagation. Transcriptomics explores gene structures and expression profiles, while metabolomics identifies metabolites and traces metabolic changes during biological processes. Studies have shown that the auxin pathway is critical in the gene co-expression network involved in tea propagation [21]. Similarly, in maize seedlings, blue light significantly alters transcriptional signaling and glutathione metabolism compared to red light [22]. In addition to these studies on light-regulated pathways, research has identified flavonoid and phenylpropanoid biosynthesis as key pathways in Chinese fir seed germination, with genes like FLS and CHI being up-regulated expression [23].
To further investigate the molecular mechanisms underlying light quality regulation in tissue-cultured Chinese fir seedlings, and building on the findings from our previous research [18], we designed an experiment involving four light quality treatments: red, green, and blue monochromatic light, along with the optimal composite light previously identified in our study, all generated using light-emitting diodes (LEDs). White light, also provided by LEDs, served as the control. This study aims to: (1) explore the effects of light quality on adventitious shoot morphology, physiology, and biochemistry; (2) investigate how light quality regulates gene expression and metabolite profiles in adventitious shoots; (3) identify key genes associated with proliferation and growth of adventitious shoots, construct key regulatory networks, and elucidate the mechanisms by which light quality mediates adventitious shoot proliferation and growth in Chinese fir seedlings. Our findings will enhance understanding of the molecular mechanisms through which light quality influences the proliferation of tissue-cultured Chinese fir seedlings, contributing to the development of high-quality artificial breeding techniques.
2. Materials and Methods
2.1. Plant Materials and Treatments
In late March 2023, adventitious shoots of tissue-cultured Chinese fir seedlings (clone ‘Yang 020’, 2~2.5 cm height) were transplanted into bottles with medium (MS + 1.7 mg/L 6-benzylaminopurine (6-BA) + 0.3 mg/L 1-naphthenic acetic acid (NAA) + 0.04 g/L riboflavin + 6.5 g/L agar + 40.0 g/L sucrose, pH 5.8). Three adventitious shoots were placed in each bottle, which were then incubated in a climate-controlled room at 23±2 ºC and 70±5% relative humidity at Fujian Agriculture and Forestry University, Fuzhou, China.
The experiment consisted of four LED light treatments: red, green, blue, and a composite light of 30 μmol m−2 s−1 blue, 2 μmol m−2 s−1 green, and 20 μmol m−2 s−1 red light (as shown in Table 1). The composite light was designed based on our previous research [18], which identified the optimal light intensity combination for adventitious shoot proliferation. In that study, we employed a three-factor, five-level second-order quadratic regression orthogonal rotation experimental design to investigate the relationship between light intensity and proliferation in tissue-cultured Chinese fir seedlings. The optimal light intensity combination for maximizing the proliferation coefficient, determined through the regression model, was applied in the current experiment. White LED light, commonly used in plant growth studies, was used as the control in the following study. Each treatment was replicated three times, with each replicate consisting of 10 bottles. The adventitious shoots were cultured under these light treatments for 12 hours daily with a light intensity of 52 μmol m−2 s−1 based on our previous research. To further investigate the mechanisms underlying light quality regulation in tissue-cultured Chinese fir seedlings, these treatments were selected in subsequent studies to examine the physiological responses and growth characteristics, as well as the transcriptomic and metabolomic profiles of the seedlings.
2.2. Determination of Morphological Indexes
The influence of light quality on the apparent morphology of adventitious shoots is the primary aspect of research on light quality regulation. The morphological indexes of new adventitious shoots grown in the experiment were tested after 35 days of culture under different light qualities. The values of all the indicators studied thereafter were counted from the new effective adventitious shoots, defined as those with a height ≥ 1 cm, based on previous studies that have shown that this threshold correlates with actively proliferating shoots [18]. The proliferation coefficient (C) was calculated using the formula
where N represents the number of new effective adventitious shoots, and 3 is the number of initial adventitious shoots in each bottle. This formula accounts for the expected number of shoots per initial planting unit, but further analysis of shoot quality and health was also conducted to evaluate overall growth success.
C = N/3
The heights of adventitious shoots were measured using a vernier caliper, which was chosen for its accuracy in measuring small dimensions. The leaves from the 2nd and 3rd pairs counted down from the top of each shoot were selected for leaf area measurements. This selection was based on the fact that these leaves are fully developed and represent the typical leaf size for assessing growth. The leaf areas were determined by photographing the needle leaves with a digital single-lens reflex camera, ensuring consistent lighting and camera settings for optimal image quality. Leaf area calculation was performed using IPP 7.0 software (Media Cybernetics Co., USA).
The fresh and dry weights of the shoots were determined using an electronic balance with a precision of 0.001 g. The ratio of dry to fresh weight, known as the dry matter ratio, was used as an indicator of the plant’s water content and overall growth efficiency.
2.3. Determination of Physiological-Biochemical Indices
To deeply understand the regulatory effects of light quality on adventitious shoots, several important physiological and biochemical indices were accurately measured. Firstly, the contents of photosynthetic pigments, including chlorophyll a, chlorophyll b, and carotenoids, were measured and quantified following the method of Chen et al. [24]. Absorbance was determined using an ultraviolet-visible spectrophotometer (UV-2600, Shimadzu Co., Japan) at wavelengths of 663 nm, 645 nm, and 440 nm, which are standard wavelengths for calculating the contents of these photosynthetic pigments in plant tissues.
Secondly, to evaluate the photosystem II efficiency and the photochemical activity of the adventitious shoots under different light conditions, chlorophyll fluorescence parameters Fo (minimum fluorescence), Fm (maximum fluorescence), Fv (variable fluorescence), Fv/Fm (maximum photochemical efficiency of photosystem II), and qP (photochemical quenching) were measured using a PAM 2500 fluorometer (Heinz Walz GmbH Co., Germany) according to the method outlined by Ye et al. [25].
Additionally, the enzyme-linked immunosorbent assay (ELISA) method was used to detect plant endogenous hormone contents of gibberellic acid (GA), abscisic acid (ABA), auxin (IAA), cytokinins (CTK) and trans-Zeatin-riboside (ZR) [26]. ELISA was chosen due to its high specificity and sensitivity, making it suitable for the quantification of small hormone concentrations in the adventitious shoots.
2.4. RNA Extraction, cDNA Library Construction, RNA Sequencing and Data Analysis
To investigate how light quality affects adventitious shoot proliferation at the molecular level, transcriptome sequencing was carried out. Total RNA was extracted from the adventitious shoots using the RNAprep Pure Plant Kit (Tiangen, Beijing, China) according to the manufacturer’s instructions. RNA concentration and purity were assessed using the NanoDrop 2000 (Thermo Fisher Scientific, Wilmington, DE), and RNA integrity was evaluated with the RNA Nano 6000 Assay Kit on the Agilent Bioanalyzer 2100 system (Agilent Technologies, CA, USA). This quality control ensured reliable gene expression data for subsequent analyses.
The cDNA libraries were constructed and sequenced on an Illumina NovaSeq platform, generating 150 bp paired-end reads. A total of 10 libraries were constructed from 15 experimental samples, including 3 biological replicates. The raw FASTQ reads were processed to remove adapters, poly-N sequences, and low-quality reads, ensuring clean data for downstream analyses. Data quality was assessed using Q20, Q30, GC content, and sequence duplication metrics, confirming data integrity.
Gene expression levels were quantified by calculating fragments per kilobase of transcript per million fragments mapped (FPKM) [27]. Differential expression analysis was conducted with the DESeq2 R package [28], and genes with an adjusted p-value p < 0.01 and fold change ≥ 2 were considered differentially expressed genes (DEGs). This stringent threshold helped identify genes most impacted by light quality, providing insights into the molecular mechanisms underlying shoot proliferation.
To further explore the biological relevance of the DEGs, functional annotation was performed using Gene Ontology (http://www.geneontology.org/) and the Kyoto Encyclopedia of Genes and Genomes (KEGG) (http://www.genome.jp/kegg/). This analysis identified key biological processes and pathways involved in light quality regulation.
Gene co-expression networks were constructed using weighted gene co-expression network analysis (WGCNA) in the R package [29]. This method enabled the identification of gene clusters and regulatory interactions critical for understanding light quality-mediated shoot proliferation. The raw RNA-seq data were deposited in the NCBI BioProject database under project number SUB14671786.
2.5. Quantitative Real-Time PCR (qRT–PCR)
To validate the RNA-seq data and assess gene expression patterns associated with light quality-mediated shoot proliferation, nine genes were selected for qRT-PCR analysis. Total RNA was extracted from all samples using a Trizol kit, followed by cDNA synthesis with the TUREscript 1st Strand cDNA Synthesis Kit. Each qRT-PCR assay was performed with three biological and technical replicates. Primers for the selected genes were designed using Beacon Designer 7.9 software [30], as detailed in Table S1. The relative expression levels of the target genes were quantified using the 2− ΔΔCt method [31].
2.6. Untargeted Metabonomic Analysis
To investigate the metabolic profile of adventitious shoot tissues under different light conditions, 50 mg of freeze-dried adventitious shoot powder was accurately weighed and subjected to extraction using methanol: acetonitrile: water solution (2:2:1, v/v/v) containing an internal standard. The extraction process involved vortexing for 30 s, followed by 45 Hz lapping for 10 min, and ultrasonic treatment in an ice-water bath for an additional 10 min to enhance metabolite extraction. After centrifugation at 12,000 rpm and 4 °C for 15 min, the supernatant was collected and mixed with a fresh extraction solution. The final samples were processed to optimize preparation and minimize variability, ensuring consistency and reliability of the metabolic data for subsequent analysis.
Metabolomic analysis was performed using a Waters Acquity I-Class PLUS UHPLC system coupled with a Waters Xevo G2-XS high-resolution tandem mass spectrometer. Chromatographic separation was carried out using a Waters Acquity UPLC HSS T3 column (1.8 μm, 2.1 mm × 100 mm). The mobile phase consisted of 0.1% formic acid in water (A) and 0.1% formic acid in acetonitrile (B), with a flow rate of 400 μL/min and an injection volume of 1 μL. The gradient program was optimized to ensure the effective separation of metabolites.
Raw data were processed with MassLynx V4.2, and peak extraction and alignment were conducted using Progenesis QI software. Metabolite identification was based on the METLIN database and a custom-built Biomark library, with mass deviation set within 100 ppm. Differential metabolites were identified using statistical criteria, including fold change (FC) > 1, p < 0.05, and VIP > 1, ensuring biological relevance and statistical significance.
For statistical analysis, OPLS-DA modeling was performed using R software, followed by 200 permutation tests to assess model stability. KEGG pathway enrichment analysis was conducted via a hypergeometric distribution test to explore the biological pathways associated with the identified metabolites. Data were analyzed using SPSS 22.0, presented as mean ± standard error (S.E.), with statistical significance assessed by ANOVA and post-hoc LSD’s multiple-range test. Normality and homogeneity of variances were verified before conducting ANOVA.
3. Result
3.1. Light Quality Regulation on Morphology, Physiology and Biochemistry
Light quality significantly affected the proliferation coefficient and growth indicators of the adventitious shoots (p < 0.01), but had no significant effect on shoot height (Table 2; Figure 1A). The proliferation coefficient was 81.6%, 117.2%, and 35.1% higher under blue light compared to green light, red light, and the control, respectively (p < 0.01), suggesting that blue light strongly promoted adventitious shoot proliferation. In contrast, the proliferation coefficient was slightly higher under blue light than under composite light, though the difference was not statistically significant.
Shoot height was greater under red light compared to blue light, but no significant differences were observed between the treatments and the control. Leaf area was largest under red light, with a 26.7% increase compared to the control, whereas it was 27.8% smaller under green light than the control. Fresh and dry weights were highest under composite light, with increases of 67.2% and 81.8%, respectively, compared to the control. However, the dry matter ratio was highest under blue light, which was 24.2% higher than the control. These suggested that blue and composite light enhanced biomass accumulation. Additionally, no significant differences were observed between green or red light treatments and the control for fresh and dry weights.
Light quality significantly affected the photosynthetic pigment contents in the adventitious shoots (p < 0.01, Figure 1B). Among the photosynthetic pigments, chlorophyll a, and b contents were highest under blue light, showing increases of 28.8% and 20.1%, respectively, compared to the control. In contrast, chlorophyll contents were significantly lower under green light compared to the control (p < 0.05). The chlorophyll a/b ratio was highest under composite light, with a 19.4% increase relative to the control, while it was lowest under red light, with a 25.1% decrease compared to the control. Carotenoid content was highest under red light, with a 52.7% increase compared to the control, while it was lowest under blue light, showing a 6.7% decrease compared to the control.
In addition to photosynthetic pigment content, light quality significantly influenced the contents of endogenous hormones in new adventitious shoots of tissue-cultured Chinese fir seedlings (p < 0.01, Figure 1C). GA and auxin IAA levels were higher in all light treatments compared to the control group. Specifically, red light treatment exhibited the highest GA content, 44.1% higher than the control, while composite light treatment had the lowest GA content. In contrast, composite light treatment showed the highest IAA content, with a 39.6% increase over the control, while red light treatment had the lowest IAA content.
ABA levels were lower in most treatments compared to the control, except for the green light treatment, which had the highest ABA content—1.42 times greater than that in the composite light treatment. CKT content was highest in composite light, showing a 16.3% increase relative to the control, while CKT levels were lower in the other light treatments compared to the control. ZR content was significantly higher under green light, 7.6% greater than the control, and higher than in other light treatments.
Light quality also significantly influenced chlorophyll fluorescence parameters in the leaves of the adventitious shoots (p < 0.01, Figure 1C). Fm and Fv were 7.4% and 7.3% higher under blue light than the control, respectively. However, fluorescence parameters such as Fm, Fv, Fv/Fm, and qP were lowest under red light, with reductions of 50.3%, 58.2%, 15.9%, and 11.3%, respectively, compared to the control. Fo was lowest under green light, with a 47.9% decrease compared to the control.
3.2. Transcriptome Sequencing Results and Alignment with the Reference Genome
Following transcriptome sequencing, a total of 99.68 Gb of clean data were obtained from 15 samples, with each sample providing approximately 6 Gb. The Q20 and Q30 base percentages exceeded 97% and 92%, respectively, indicating high sequencing quality (Table S2). These quality metrics were considered ideal for transcriptomic studies and were consistent with industry standards for similar species. However, it was important to note that these values might vary depending on the complexity of the genome and the specific objectives of the research.
The sequencing data were aligned to the Chinese fir reference genome, yielding a percentage of mapped reads ranging from 86.52% to 88.39%, with uniquely mapped reads exceeding 83.87%. These mapping rates were deemed satisfactory for this study, providing sufficient efficiency for subsequent analyses. The slight variation in mapping rates could be attributed to differences in sequence complexity or the quality of reference genome annotations.
A total of 37,102 genes were identified and annotated, accounting for 83.3% of the known genes in the Chinese fir reference genome. The identification of these genes confirmed the reliability of the transcriptome dataset for this species and provided a solid foundation for future functional analyses. In addition, 7,311 new genes were discovered, of which 2,844 were functionally annotated. These new genes were not previously annotated in the Chinese fir reference genome, and while they were computationally predicted, their biological significance would require further experimental validation.
3.3. Transcriptome Analysis of Adventitious Shoots Under Different Light Quality
RNA-seq analyses demonstrated that light quality significantly influenced gene expression in adventitious shoots, with distinct effects across treatments. Principal component analysis (PCA) revealed that PC1 and PC2 explained 35.05% and 23.85% of the variance in gene expression, respectively (Figure 2A). These components together accounted for a substantial proportion of the variation, underscoring the critical role of light quality in gene expression regulation. Further analysis was needed to link these components to specific light quality treatments and their biological relevance.
The heatmap of hierarchical clustering, based on the Spearman correlation coefficient (Figure 2B), showed strong coherence among biological replicates (R2> 0.76), confirming the reliability and reproducibility of the data. These findings suggested that the observed gene expression differences were biologically meaningful, rather than arising from technical variability.
Differential expression analysis identified 5,641 differentially expressed genes (DEGs), with 3,107 up-regulated and 2,534 down-regulated genes (Figure 2C). This large number of DEGs reflected the sensitivity of adventitious shoot gene expression to light quality. Notably, red light treatment resulted in the highest number of DEGs (772), while composite light treatment yielded the fewest (320). This suggests that red light had a strong regulatory effect on gene expression, while composite light might exert a more complex or weaker influence.
Red light treatment also led to the highest number of up-regulated genes (503), compared to green light treatment, which had the fewest (139). Conversely, blue light treatment resulted in the greatest number of down-regulated genes (325), whereas composite light treatment had the fewest (159). These findings suggested that different light wavelengths modulated gene expression via distinct mechanisms, likely through their effects on light signaling pathways. Further functional annotation of these DEGs was required to elucidate the molecular mechanisms involved.
The comparison of light quality treatments revealed the largest number of DEGs between blue and red light treatments (1,213 DEGs: 732 up-regulated and 481 down-regulated). This contrast was more pronounced than in other comparisons, indicating that adventitious shoots had a particularly sensitive gene expression response to the interplay between blue and red light. These results had implications for understanding light quality-mediated regulation of shoot proliferation. In contrast, the fewest DEGs were observed between blue and green light treatments, suggesting these wavelengths exerted similar effects on gene expression in adventitious shoots.
Venn diagrams comparing DEGs across treatments (Figure 2D–F) revealed that 30, 8, and 14 shared DEGs were identified when comparing treatments with the control, monochromatic light with composite light, and comparisons among monochromatic light treatments, respectively. While the number of shared DEGs was small, the larger number of unique DEGs suggested that each light treatment induced a distinct gene expression profile. These findings highlighted the complex and specific effects of light quality on gene expression, warranting further investigation to determine the functional roles of these unique DEGs in adventitious shoot development under various light conditions.
3.4. GO and KEGG Enrichment Analyses
A total of 4,463 differentially expressed genes (DEGs) were annotated in the Gene Ontology (GO) database, categorized into three domains: biological process, cellular component, and molecular function. The DEGs were predominantly enriched in biological processes and molecular functions, with a particular focus on cell membrane-related processes. Notably, the term ‘integral component of the membrane’ was significantly enriched in seven of the comparison groups (p < 0.05, Figure 3). This suggested that light quality influenced membrane-associated processes in adventitious shoots, potentially modulating cellular signaling or transport mechanisms that regulated shoot proliferation.
To elucidate the biological pathways involved in adventitious shoot formation under different light quality treatments, we performed KEGG pathway enrichment analysis on the differentially expressed genes (DEGs). A total of 3,964 DEGs were annotated in the KEGG database. Among the top 20 enriched pathways, significant enrichment was observed in four key pathways: plant hormone signal transduction, plant-pathogen interaction, starch and sucrose metabolism, and MAPK signaling. Notably, the red vs. blue light comparison showed a marked presence of DEGs in these pathways, indicating that light quality, particularly red and blue light, affected gene regulation in ways that likely contributed to differences in adventitious shoot proliferation. In contrast, only a small number of DEGs were enriched in the photosynthesis-antenna proteins pathway in the white vs. composite light and composite vs. red light comparisons (p < 0.05, Figure 4).
3.5. Metabolite Analysis of Adventitious Shoots Under Different Light Quality
Untargeted metabolomic profiling identified a total of 4,183 metabolites across all samples, with 1,953 detected in positive ion mode (POS) and 2,230 in negative ion mode (NEG). Principal component analysis (PCA) revealed a clear separation between treatment groups, demonstrating both repeatability within biological replicates and distinct metabolomic differences between light treatments (Figure 5A,B). These results indicated that light quality influenced the metabolomic profiles of adventitious shoots, suggesting the involvement of specific metabolic pathways in regulating shoot proliferation.
Metabolite annotation via HMDB and KEGG databases identified several dominant classes, including prenol lipids, carboxylic acids, fatty acyls, and organooxygen composites (Figure 5C). A clustering heatmap of 1,073 differential metabolites (DMAs) revealed that composite light and control, as well as blue and green light treatments, exhibited similar metabolite profiles (except for sample B-1). In contrast, blue and red light treatments showed more pronounced differences (Figure 5D).
Venn diagrams comparing DMAs between treatments highlighted notable trends. Green light treatment showed the highest number of DMAs (332), while composite light had the fewest (85) compared to the control (Figure 5E,F). When comparing blue and red light treatments, red light treatment had more DMAs (124) than green light (88) (Figure 5G). These findings suggested that light quality influenced distinct metabolic pathways, with unique metabolic profiles under different light conditions.
Further, the Venn diagrams revealed minimal overlap between treatments. Specifically, only 1, 26, and 1 identical DMA were found when comparing treatments vs. control, monochromatic vs. composite light treatments, and monochromatic vs. monochromatic light treatments, respectively (Figure 5E–G). These overlapping DMAs were mainly associated with the biosynthesis of secondary metabolites and flavonoid biosynthesis pathways, indicating their critical role in adventitious shoot proliferation. Among the top 20 KEGG pathways, the biosynthesis of secondary metabolites accumulated the most DMAs (391), with the ABC transporter pathway, involved in transmembrane transport, exhibiting the highest number of DMAs (59) (Figure 5H). This suggested that secondary metabolite biosynthesis and transporter pathways were key regulators of adventitious shoot proliferation under various light conditions.
3.6. Co-Expression Network Analysis of Weighted Genes
To further investigate the molecular mechanisms by which light quality regulated adventitious shoot formation in tissue-cultured Chinese fir seedlings, we performed weighted gene co-expression network analysis (WGCNA) on 2,667 differentially expressed genes (DEGs) retained after filtering out missing data and outliers. Previous analyses indicated significant enrichment of DEGs in plant hormone signal transduction pathways (Figure 4), which are crucial for tissue culture proliferation [6,19,20]. Based on this, we selected eight key plant hormones—N6-(delta 2-isopentenyl)-adenine (iP), gibberellin A1, A3, A4 (GA), zeatin (ZR), dihydrozeatin (DHZ), abscisic acid (ABA), and jasmonic acid (JA), along with a major metabolic product of IAA, 5-Hydroxyindole-3-acetic acid (5-HIAA, the intensity of which serves as an indicator of the metabolic activity of IAA), for further WGCNA.
Pearson correlation analysis between the DEG modules and hormone metabolism revealed nine co-expressed gene modules (Figure 6A; Tables S3 and S4), with the brown, magenta and red modules exhibiting significant correlations with the intensities of specific hormones (Figure 6B). The brown module, positively correlated with 5-HIAA, CTK (iP, ZR and DHZ) and negatively correlated with GA, included key genes involved in cell division and stress responses. The magenta module, comprising 177 DEGs, showed strong positive correlations with the metabolic intensity of GA, whereas the red module, containing 89 DEGs, showed an inverse relationship with ABA metabolism intensity. The expression profiles of eigengenes in these modules varied markedly across different light quality treatments (Figure 6C–E; Tables S5–S7), with up-regulation observed under blue, red, and combined light treatments.
To identify key regulatory genes, we selected the top 150 genes based on high module eigengene-based connectivity (kME) for network analysis (Figure 6F–H). In the brown module, 83 genes, such as FTSH (Cula0033528, encoding cell division protease), SLC15 (Cula0013655, encoding solute carrier family 15), DHDDS (Cula0003166, encoding polyprenyl diphosphate synthase), ANR (Cula0010196, encoding anthocyanidin reductase), and PSBS (Cula0034311, encoding photosystem II protein), were strongly correlated with hormone metabolism and may play pivotal roles in regulating shoot proliferation (Figure 6F; Table S8). Similarly, in the magenta module, 131 genes, such as GST (Cula0035046, encoding glutathione S-transferase), GID1 (Cula0020923, encoding gibberellin receptor), POD (Cula0032932, encoding peroxidase), ABA2 (Cula0009430, encoding xanthoxin dehydrogenase), and SP (Cula0004114, encoding MFS transporter), was implicated in GA regulation (Figure 6G; Table S9). In the red module, 49 genes, such as CASPL (Cula0028594, encoding Casparian strip domain-like protein), CLPB (Cula0023485, encoding Clp protease subunit), CHI (Cula0019739, encoding chitinase), and POD (Cula0020069, encoding peroxidase), were associated with ABA metabolism (Figure 6H; Table S10). Notably, FTSH, GST, and CASPL emerged as central hub genes, linking the greatest number of genes, and are likely to play pivotal roles in the regulation of hormone metabolism.
3.7. Variation of Gene Expression and Metabolite Accumulation in Key Pathways Regulated by Light Quality
To explore the molecular mechanisms by which light quality influences adventitious shoot formation and growth in tissue-cultured Chinese fir seedlings, we examined gene expression variations in pathways related to plant hormone metabolism. Based on the WGCNA results, hub genes such as FTSH, GST, and CASPL were identified as central regulators, as they exhibited strong correlations with plant hormone metabolites within their respective gene modules. These genes were implicated in critical pathways such as plant hormone signal transduction (ko04075), photosynthesis (ko00195), phenylpropanoid biosynthesis (ko00940), flavonoid biosynthesis (ko00941), terpenoid backbone biosynthesis (ko00900), carotenoid biosynthesis (ko00906) and glutathione metabolism (ko00480), all of which play essential roles in cell division, shoot proliferation, and overall plant growth.
The regulation of these pathways in response to different light treatments is summarized in Figure 7. It showed that variation of gene expression of FTSH, SLC15, ANR, DHDDS, PSBS, PSBH, PSBW (encoding photosystem II proteins PsbH and PsbW, respectively), PSBB (encoding photosystem II CP47 chlorophyll a protein) and PSBO (encoding photosystem II 13 kDa protein) was very similar, with consistent up-regulated under blue light and down-regulated under red light, except for PSBW (Figure 7A). Conversely, genes GST, ABA2, POD and HCT (encoding shikimate O-hydroxycinnamoyl transferase) showed up-regulated expression under red light and down-regulated under blue light (except for ABA2). Notably, genes CASPL and CLPB exhibited high expression under composite light and low expression under red light. Additionally, CHS (encoding chalcone synthase) and CCoAOMT (encoding caffeoyl-CoA O-methyltransferase) showed higher expression under green light but lower expression under composite and red light.
In the plant hormone signal transduction pathway (Figure 7B), genes involved in auxin metabolism, such as AUX1 (regulating auxin influx carrier) and SAUR (small auxin up-regulated RNA) significantly up-regulated under blue and composite light (p < 0.05), compared to control and other treatments. Conversely, SAUR expression was down-regulated under red light. For CTK metabolism, genes like A-ARR and B-ARR (Arabidopsis response regulators) exhibited up-regulation under red light and down-regulation under blue light, showing an inverse correlation with the highest CTK metabolic intensity under blue light and the lowest under red light.
Similarly, genes involved in GA metabolism, such as G1D1 (encoding gibberellin receptor), and DELLA (GA negative regulator) were up-regulated under red light, aligning with the highest observed GA metabolism intensity in this treatment. For ABA metabolism, genes PYR/PYL (encoding ABA receptor) and PP2C (encoding protein phosphatase 2C) showed a positive correlation with ABA accumulation in all light treatments. A similar pattern was observed for JA metabolism, with JAZ (encoding jasmonate ZIM domain-containing protein), showing up-regulation under red light and down-regulation under blue light (Figure 7C). In the brassinosteroid (BR) pathway, genes such as BZR1/2 (encoding brassinosteroid resistant 1/2), TCH4 (encoding xyloglucosyl transferase), BAK1 (encoding receptor kinase 1) and BRI1 (encoding brassinosteroid insensitive 1) were down-regulated under blue and green light treatments. Notably, gene PR-1 (encoding pathogenesis-related protein 1) in the salicylic acid (SA) pathway exhibited the highest expression under green light.
To validate the transcriptome data, nine genes were randomly selected from the transcriptome data for qRT-PCR Validation to verify the accuracy of the sequencing results. Each gene showed a distinct response to different light quality treatments (Figure 8). Correlation analysis revealed that the correlation coefficients (R2) between the transcriptome data and qRT-PCR validation for six genes were all above 0.63. This strong correlation demonstrates the accuracy and reliability of the transcriptome data, supporting its use in subsequent experiments.
4. Discussion
Forests play a crucial role in preserving the ecological equilibrium of the planet, and the advancement of plantations represents a pivotal strategy for ensuring the sustainable development of forests. Investigating the molecular mechanisms underlying light quality-mediated regulation of adventitious shoot proliferation in tissue-cultured Chinese fir seedlings holds significant value in enhancing the cultivation of artificial seedlings for plantation purposes.
4.1. Light Quality Regulation on Morphology, Physiology and Biochemistry
The rapid propagation technology of tissue-cultured Chinese fir seedlings is based on the totipotency and regenerative capacity of cells, with seedlings proliferating in vitro via adventitious shoots. Proliferation is the primary characteristic of adventitious shoots under various environmental stimuli, among which light quality is one of the most crucial factors. In our study, the proliferation coefficient, a key parameter reflecting the propagation capacity of adventitious shoots, was significantly higher under blue light and blue-light-dominant composite light compared to other light qualities and the control in the ‘Yang 020’ clone (Table 2). This result aligns with the findings of Zhou [13], which reported a similar trend in the No. 04 clone of Chinese fir. However, previous studies have shown that the proliferation coefficient of Aquilaria crassna Pierre. and Gerbera jamesonii was highest under red light [15,32]. The impact of light quality on proliferation may vary significantly across different species, potentially due to species-specific variations in cellular processes, hormone signaling pathways, and gene regulatory networks that control cell division and growth.
Fresh and dry matter accumulation is fundamental for yield formation. In the current study, the fresh weight under composite light treatments was significantly higher than under other light treatments, which aligns with previous research indicating that composite light generally promotes biomass accumulation more effectively than monochromatic light [24,33,34]. Additionally, the dry weights in composite light and blue light treatments were significantly greater than those in red and green light treatments, as well as the control. Photosynthesis, the physiological process by which plants convert light energy into organic matter, is central to biomass accumulation. The content of photosynthetic pigments and the efficiency of photosynthesis are key factors that determine the plant’s capacity to accumulate biomass [9,24]. Our study showed that chlorophyll a and b contents were higher under blue light compared to composite light and other light qualities, while carotenoid content was greatest under red light. This suggests that while photosynthetic pigment content is an important factor, other mechanisms may influence biomass accumulation. The chlorophyll fluorescence parameter Fv/Fm, which reflects photosynthetic efficiency, was highest under blue and composite light, correlating with higher chlorophyll a content, and suggests that these conditions may enhance photosynthetic efficiency in Chinese fir seedlings. High values of chlorophyll a content, the chlorophyll a/b ratio, and Fv/Fm together contribute to higher biomass accumulation under blue and composite light. However, these results are not entirely consistent with previous studies on Chinese fir seedlings [13,35], strawberry [33], and Phoebe bournei [9], where the effects of light quality on biomass accumulation varied. This indicates that light quality effects on biomass accumulation are species-dependent. The dry matter ratio of Chinese fir seedlings under blue light was higher than under other light qualities, suggesting that blue light may enhance water retention and potentially contribute to drought resistance. However, drought resistance is a complex trait influenced by various factors, including genetic tolerance and environmental conditions, which warrants further research.
Our study also indicated that red light increased shoot height and leaf area, while blue light led to shorter, more robust seedlings. These findings align with existing research [13,24]. However, we observed that carotenoid content was higher under red and green light compared to blue and composite light, which is consistent with a previous study on one-year-old Chinese fir seedlings [35]. This result contrasts with several studies that have reported elevated carotenoid levels under blue light, suggesting a protective role against light-induced damage [13,36]. Therefore, the regulatory mechanisms underlying light quality effects on carotenoid content in Chinese fir seedlings remain unclear and warrant further investigation.
The proliferation of plant tissue-culture seedlings is closely linked to endogenous hormone levels. Gibberellin (GA), auxin (IAA) and cytokinins (CTK) play key roles in promoting cell elongation and division, and GA is known to regulate IAA levels [37]. In the current study, IAA and CTK contents were highest under composite light, indicating that composite light promoted the synthesis of both IAA and CTK. This effect on hormone levels was consistent with the increase in fresh weight, suggesting that IAA and CTK promote biomass synthesis, possibly through their role in promoting cell division. However, while the GA content was higher under blue light, and the IAA and CTK contents were lower under it compared to composite light, the proliferation coefficient under blue light was slightly higher. It indicates that the synergistic effects of IAA, CTK, and GA strongly enhance the proliferation of adventitious shoots under blue light, and GA may plays a more dominant role than IAA and CTK in promoting adventitious shoot proliferation under blue light. This aligns with similar findings of plant endogenous hormones’ complementary effects under red and far-red light [37]. Moreover, red light treatment, which resulted in the highest GA content, was associated with the lowest levels of IAA and CTK, leading to the lowest proliferation coefficient. This highlights that while elevated GA levels can enhance the growth of adventitious shoots, a deficiency in IAA and CTK may prevent their effective proliferation. Thus, the regulation of the proliferation of adventitious shoots requires a balanced presence of these hormones under red light. Further research is needed to elucidate the molecular mechanisms underlying this balance and understand how these hormones interact under different light conditions.
Zeatin riboside (ZR) is known to promote cell division and stimulate shoot proliferation [1], while abscisic acid (ABA) inhibits cell elongation and plant growth [38]. In our study, green light treatment resulted in the highest ZR and ABA contents but showed low proliferation and poor growth. This suggests that elevated ABA levels may counteract the proliferation-promoting effects of ZR, suppressing adventitious shoot proliferation in Chinese fir seedlings under green light. However, the molecular mechanisms underlying this counteraction remain unclear and warrant further investigation.
4.2. Light Quality Regulation on DEGs and DMs
Light quality regulates the proliferation of tissue-cultured plant seedlings by influencing gene expression and metabolite accumulation, thereby affecting their growth and development [6,39]. Our study identified the highest number of DEGs under red light, which contrasts with findings in pak choi [40] and grapes [41], where more DEGs were identified under blue and green light, respectively. This suggests that the response of gene expression to light quality is species-specific, indicating that different plant species may have distinct regulatory mechanisms in light-induced gene expression. In our study, composite light treatment resulted in fewer DEGs and down-regulated genes compared to the control, possibly due to the spectral composition of composite light being more similar to natural light conditions, which might induce less dramatic gene expression changes compared to monochromatic light treatments. DEGs in our study were enriched in key pathways, including plant hormone signal transduction, plant-pathogen interaction, starch and sucrose metabolism, and the MAPK signaling pathway. These findings are consistent with previous research on proliferation in Osmanthus fragrans [42] and seed germination in Chinese fir [43,44], suggesting that these pathways are essential for regulating propagation in plants.
Our study found that composite light treatment resulted in the lowest number of differential metabolites (DMs) compared to monochromatic light treatments (Figure 5E), suggesting that smaller spectral differences lead to more similar metabolite profiles. This is consistent with the finding that composite light treatment led to fewer DEGs, possibly due to the similarity in light spectrum to natural conditions. The highest number of metabolites were enriched in pathways related to the biosynthesis of secondary metabolites, including hormone biosynthesis and flavonoid production. Interestingly, these metabolite pathways were largely aligned with the DEGs enriched in similar pathways, further supporting the link between gene expression and metabolite accumulation under different light treatments.
4.3. Key Genes and Networks for Light Quality Regulating Proliferation of Chinese Fir Seedlings
Metabolism and gene expression are intricately interlinked in organisms, with each influencing the other, particularly in the regulation of endogenous hormones and metabolic products, as observed in our study. In the current study, weighted gene co-expression network analysis (WGCNA) identified three key modules (brown, magenta, and red) that were strongly correlated with the metabolite intensities of eight major endogenous hormones and a main metabolic product of IAA in adventitious shoots of tissue-cultured Chinese fir seedlings. The hub genes FTSH, GST, and CASPL in these modules, along with other strongly correlated genes, were involved in seven important pathways, such as plant hormone signal transduction, photosynthesis, glutathione metabolism, as well as phenylpropanoid, flavonoid, terpenoid backbone, and carotenoid biosynthesis (Figure 7).
PSBS is a regulatory gene for the PSII photoprotective protein, playing a critical role in increasing non-photochemical quenching (NPQ) to optimize light energy utilization and protect against light-induced damage under high light intensity and varying light qualities [45,46,47]. In the current study, PSBS was a strongly correlated gene that connected 56 DEGs in the brown module. It was significantly up-regulated under blue light (p < 0.01), up-regulated under composite light, and down-regulated under green and red light. Its expression was positively correlated with chlorophyll fluorescence parameters, such as Fv/Fm and qP, as well as with proliferation coefficients and metabolite intensities of 5-Hydroxyindole-3-acetic acid (5-HIAA) and N6-(delta 2-isopentenyl)-adenine (CTK) under different light qualities. Additionally, other photosynthesis pathway genes (PSBB, PSBH, PSBO) and auxin signal transduction pathway genes (AUX1 and SAUR) exhibited similar expression patterns to those of PSBS.
However, a notable difference was observed in the cytokinin (CTK) regulators B-ARR and A-ARR. B-ARR functions as a positive regulator in cytokinin signal transduction, while A-ARR exerts a negative regulatory effect [23]. In our study, B-ARR and A-ARR were both significantly down-regulated under blue light and up-regulated under red light, which suggests a potential antagonistic relationship in their regulation of cytokinin signaling. Interestingly, under composite light, B-ARR was slightly up-regulated, and A-ARR was slightly down-regulated, indicating a supportive role in promoting cytokinin signal transduction. This may be one of the reasons why the biomass accumulation of adventitious shoots under compound light was higher than that under blue light. These findings diverge from previous research [23], suggesting that the regulatory effects of B-ARR and A-ARR may vary depending on light quality. The underlying mechanisms behind these differential effects warrant further investigation.
Despite these differences, our results suggest that light quality plays a crucial role in regulating photosynthesis, biomass accumulation, auxin biosynthesis, and CTK biosynthesis. The synergistic regulation of these pathways likely contributes to optimizing plant growth and development under different light qualities. Taken together, these results suggest that PSBS may be a key regulatory gene in photosynthesis. Light quality regulates its expression, as well as the expression of genes such as AUX1, SAUR, PSBB, PSBH, PSBO, B-ARR and A-ARR, which together regulate photosynthesis, IAA, and CTK biosynthesis, ultimately influencing the proliferation and biomass accumulation of tissue-cultured Chinese fir seedlings.
FTSH has been identified as playing a significant role in regulating various biological processes, including cell division, chloroplast development, and photosynthesis [48,49]. Previous studies have shown that the expression of FTSH genes in Arabidopsis thaliana increases significantly under strong light, suggesting that FTSH is involved in photoinhibition protection by acting as a necessary protease [48,50]. In the present study, FTSH was identified as a hub gene within the brown module, which connected 62 DEGs. The expression pattern of FTSH was similar to PSBS, with positive correlations observed between its expression and key parameters such as proliferation coefficients, Fv/Fm, and qP across different light treatments. These results suggest that FTSH may play a key role in the regulation of proliferation and photosynthesis in adventitious shoots. However, the precise molecular mechanisms underlying its function require further investigation to validate its potential as a key regulatory gene in light quality-mediated shoot proliferation.
GID1 acts as a GA receptor, transmitting a signal to DELLA after sensing GA presence. DELLA proteins generally negatively regulate GA signaling by inhibiting the growth-promoting effects of GA [51]. However, GID1 can counteract DELLA’s suppressive effect on plant elongation, thereby promoting the elongation of cotyledons and stems [51,52]. In the present study, GID1 was identified as a hub gene in the magenta module, correlating with the expression of 105 DEGs. Its expression showed a positive correlation with the intensities of GA metabolites, such as gibberellin A1, A3, and A4, suggesting a significant role in GA signal transduction. Interestingly, the metabolite intensity of GA was highest and the GID1 expression was significantly up-regulated under red light, where it suppressed DELLA protein-mediated inhibition of stem and leaf elongation, resulting in the highest shoot height and leaf area. In contrast, the proliferation coefficient remained low under red light. This observation may be due to the concurrent up-regulation of DELLA, which can counteract the proliferative effects of GA by limiting its capacity to stimulate cell division and proliferation. However, under blue light, while the metabolite intensity of GA was increased, the GID1 expression was down-regulated, and the DELLA expression was slightly up-regulated to inhibit the growth-promoting effects of GA. This led to the lowest shoot height and smaller leaf area in blue light treatment, which was consistent with previous studies [52]. These findings suggest that light quality plays a pivotal role in modulating the expression of GID1 and DELLA, thereby influencing GA signaling transduction. However, the opposing effects of these two genes, where GID1 promotes elongation while DELLA inhibits it, highlight the complexity of GA regulation and suggest that the balance between these proteins is critical for optimizing shoot growth and proliferation. Further investigations are necessary to fully elucidate the molecular mechanisms underlying this regulation.
GST proteins have been well-documented for their involvement in biotic and abiotic stress responses, where they promote carotenoid synthesis and scavenge reactive oxygen species (ROS), protecting plants from oxidative damage [53]. In our study, GST expression was significantly up-regulated under red light and down-regulated under blue light, which is consistent with findings in maize seedlings [22]. Additionally, GST expression was positively correlated with carotenoid content, ABA metabolite intensity, and genes associated with oxidative stress and hormone signaling, including POD, ABA2, PYR/PYL, PP2C, JAZ, and MYC2. These findings highlight the potential of GST as a key player in coordinating both oxidative stress responses and hormone signaling pathways. However, the observed differences in gene regulation between species, such as POD and ABA2 in Bletilla striata [54] and Camellia sinensis [55], suggest that light quality effects on gene expression may be species-specific. Despite these variations, our study supports the hypothesis that GST may be a key gene in regulating carotenoid biosynthesis, ABA biosynthesis, ABA and JA signal transduction, and stress tolerance in adventitious shoots of tissue-cultured Chinese fir seedlings. Further studies are needed to confirm these findings and clarify the precise mechanisms involved.
In addition to the genes discussed above, several other genes were identified that could regulate the proliferation, growth, and physiological processes of tissue-cultured Chinese fir seedlings. For example, BAK1, BRI1, and BZR1/2 were up-regulated under red light but down-regulated under other light qualities, potentially promoting brassinosteroids (BR) signaling transduction and enhancing photosynthetic capacity in adventitious shoot leaves, as reported in previous studies [23,56]. Similarly, the expression patterns of ANR (a key gene in anthocyanin biosynthesis) and SLC15 (a gene regulating small molecule and ion movement) were consistent with those of FTSH and PSBS, suggesting they may indirectly regulate shoot proliferation and photosynthesis. Flavonoids are known to influence seed germination by balancing hormones, enhancing antioxidant defense, and participating in signal transduction [44]. The genes HCT, CHS, and CCoAOMT, which are central to flavonoid synthesis, displayed varying expression patterns in our study, reflecting the differential regulation of flavonoid synthesis under different light conditions. The genes CASPL and CLPB were highly expressed under composite light treatment and showed lower expression under monochromatic light treatments. This might be due to composite light promoting tolerance to abiotic stresses, a mechanism that could be attributed to plant adaptation over long periods of growth under natural light. This observation is consistent with previous studies [56,57]. TCH4 genes were down-regulated across all light treatments in our study. This down-regulation may be linked to the broader spectrum of white light, which could increase TCH4 expression and support cell wall homeostasis for plant growth and development, as shown in studies on Dendrobium nobile Lindl [7] and Arabidopsis [58]. Finally, previous studies have shown that salicylic acid accumulation is influenced by light quality, with up-regulation of PR expression enhancing plant resistance to pathogens [59]. Our results align with these findings, as PR-1 expression was up-regulated under green and red light, suggesting that these light qualities may induce a stronger pathogen resistance response compared to blue and composite light conditions. However, further experiments are needed to clarify the specific regulatory effects of light quality on these genes in regulating the proliferation of tissue culture Chinese fir seedlings.
5. Conclusion
Light quality plays a crucial role in regulating the growth and proliferation of Chinese fir tissue-cultured seedlings, potentially through its effects on photosynthesis, hormone balance, gene expression, and metabolic product accumulation. Blue and composite light enhances proliferation by promoting higher IAA and CTK levels and lower GA content, improving photosynthetic efficiency and biomass accumulation. In contrast, red light increases seedling height and leaf area, likely through higher GA and lower IAA and CTK, though the proliferation rate is lower due to hormonal imbalances. Composite light is more effective than monochromatic light in enhancing biomass, supported by higher chlorophyll content. Hormones such as IAA, CTK, and GA significantly influence proliferation under varying light treatments, with blue light fostering the most beneficial hormonal profile. Additionally, WGCNA analysis highlights key genes like PSBS, FTSH, GID1, and GST, which are essential for light-mediated proliferation regulation. Light quality regulated these genes, alongside the modulated hormone biosynthesis and signal transduction, which consequently governed the synthesis of photosynthetic pigments, photosynthetic efficiency, adventitious shoot proliferation, biomass accumulation, shoot height, leaf expansion, and stress tolerance. The differential expression of GA-related genes, GID1 and DELLA, as well as cytokinin-related genes, B-ARR and A-ARR, further underscores light quality’s integral role in the regulation of hormonal pathways. These findings provide profound insights into strategies for optimizing seedling proliferation, and growth and enhancing stress tolerance, contributing to the sustainable management of plantations.
Declaration of competing interest
All the authors declare that they have no known competing financial interests and personal relationships that could have appeared to influence the work reported in the paper.
Supplementary Materials
The following supporting information can be downloaded at the website of this paper posted on Preprints.org.
Author Contributions
All authors designed the experiments. M.X. Chen and W.L. Lan performed the experiments, and M.X. Chen, S.S. Xu and W.L. Lan analyzed the data. M.X. Chen and Y.Q. Ye wrote the paper. Y.Q. Ye, K.M. Lin, and G.Q. Cao read and revised the manuscript, provided helpful discussions, and approved its final version.
Funding
This work was supported by the research project of the National Key Research and Development Program of China (No.2021YFD2201302 and 2016YFD0600300), and the Science and Technology Innovation Special Fund Project of Fujian Agricultural and Forestry University (No.KFB23043A), Fuzhou, China.
Acknowledgments
The authors would like to acknowledge the financial support received from the project via the National Key Research and Development Program of China (No.2021YFD2201302 and 2016YFD0600300). Science and Technology Innovation Special Fund Project of Fujian Agricultural and Forestry University (No.KFB23043A), Fuzhou, China.
References
- Chen, S.Z.; Fan, X.C.; Song, M.F.; Yao, S.T.; Liu, T.; Ding, W.S.; et al. Cryptochrome 1b represses gibberellin signaling to enhance lodging resistance in maize. Plant Physiol. 2024, 194, 902–917. [Google Scholar] [CrossRef]
- Riikonen, J. Applications of different light spectra in growing forest tree seedlings. Forests. 2021, 12, 1194–1194. [Google Scholar] [CrossRef]
- Tang, Z.Q.; Yu, J.H.; Xie, J.M.; Lyu, J.; Feng, Z.; Dawuda, M.M.; et al. Physiological and growth response of pepper (Capsicum annuum L.) seedlings to supplementary red/blue light revealed through transcriptomic analysis. Agronomy 2019, 9, 139–139. [Google Scholar] [CrossRef]
- Shen, Y.; Fan, K.; Wang, Y.; Wang, H.; Ding, S.; Song, D.; et al. Red and blue light affect the formation of adventitious roots of tea cuttings (Camellia sinensis) by regulating hormone synthesis and signal transduction pathways of mature leaves. Front Plant Sci. 2022, 13, 943662. [Google Scholar] [CrossRef]
- Zhang, Y.T.; Jiang, L.Y.; Li, Y.L.; Chen, Q.; Ye, Y.T.; Zhang, Y.; et al. Effect of red and blue light on anthocyanin accumulation and differential gene expression in strawberry (Fragaria × ananassa). Molecules. 2018, 23, 820. [Google Scholar] [CrossRef] [PubMed]
- Wang, Y.T.; Jiang, Z.H.; Li, W.X.; Yang, X.L.; Li, C.M.; Cai, D.X.; et al. Supplementary low far-red light promotes proliferation and photosynthetic capacity of blueberry in vitro plantlets. Int J Mol Sci. 2024, 25, 688–688. [Google Scholar] [CrossRef]
- Li, X.B.; Yang, K.G.; Ma, J.; Wu, S.D.; Xu, E.Y.; Liu, Y.Y.; et al. Transcriptome analysis reveals different red and blue light duration promote growth and main medicinal ingredients of Dendrobium nobile Lindl. Ind Crop Prod. 2023, 204. [Google Scholar] [CrossRef]
- Cai, X.B.; Huq, E. Shining light on plant growth: Recent insights into phytochrome-interacting factors. J Exp Bot. 2024; erae276. [Google Scholar]
- Nie, R.X.; Wei, X.L.; Jin, N.Q.; Su, S.C.; Chen, X.Y. Response of photosynthetic pigments, gas exchange and chlorophyll fluorescence parameters to light quality in Phoebe bournei seedlings. Plant Growth Regul. 2024, 103, 675–687. [Google Scholar] [CrossRef]
- Zhang, J.L. China forest resources report (2014–2018). China Forestry Publishing House. 2019, 10–50. [Google Scholar]
- Tang, Y.; Li, L.Y.; Xu, S.S.; Zhong, M.H.; Zheng, X.Y.; Ye, Y.Q. Effect of different light qualities on rooting of tissue cultured Cunninghamia lanceolata seedlings and its mechanism. Acta Botanica Boreali-Occidentalia Sinica. 2022, 42, 609–618. [Google Scholar]
- Zhou, B.Y.; Sun, L.J.; Wu, P.F.; Li, M.; Ma, X.Q. Research progress in cultivation of large-diameter timber tree of Chinese fir. World For. Res. 2024, 37, 54–58. [Google Scholar]
- Zhou, J.Y. The research of rapid propagation technology based on light emitting diode of the Chinese fir. Master thesis, Fujian Agriculture and Forestry University. 2013.
- Huang, J.; Wu, P.F.; Cheng, H.; Ma, X.Q. Callus subculture and regeneration of Cunninghamia lanceolata. J For Environ. 2018, 38, 20–26. [Google Scholar]
- Li, X.Y.; Zeng, B.S. The proliferative efficiency and the photoprotective response of Aquilaria crassna Pierre. plantlets under different light quality. Mol Plant Breed. 2021, 19, 291–298. [Google Scholar]
- Zhou, J.Y.; Peng, Z.Q.; Xu, S.S.; Ding, G.C.; Lin, S.Z. Effect of light quality on the growth of tissue culture chlorophyll and chlorophyll fluorescence in Cunninghamia lanceolata. Chinese Journal of Tropical Crops. 2016, 37, 1759–1765. [Google Scholar]
- Xu, Y.; Yang, M.; Cheng, F.; Liu, S.; Liang, Y. Effects of LED photoperiods and light qualities on in vitro growth and chlorophyll fluorescence of Cunninghamia lanceolata. BMC Plant Biology. 2020, 20, 269–269. [Google Scholar] [CrossRef] [PubMed]
- Chen, M.X.; Ye, Y.Q.; Xu, S.S.; Lin, K.M. Optimization of the light environment for the propagation of tissue-cultured Cunninghamia lanceolata seedlings. J For Environ. 2023, 43, 380–387. [Google Scholar]
- Ahammed, G.J.; Gantait, S.K.; Mitra, M.; Yang, Y.; Li, X. Role of ethylene crosstalk in seed germination and early seedling development: A review. Plant Physiol Biochem. 2020, 151, 124–131. [Google Scholar] [CrossRef]
- Shen, Y.Z.; Han, X.; Wang, H.; Fan, K.; Wang, Y.; Shen, J.Z.; et al. Full-length transcriptome and metabolism revealed the difference of callus formation of tea cutting under white, red, and blue light. Plant Growth Regul. 2023, 101, 715–726. [Google Scholar] [CrossRef]
- Wang, L.B.; Qian, Y.H.; Wu, L.Y.; Wei, K.; Wang, L.Y. The MADS-box transcription factor CsAGL9 plays essential roles in seed setting in Camellia sinensis. Plant Physiol Biochem. 2024, 207, 108301. [Google Scholar] [CrossRef]
- Liu, T.D.; Zhang, X.W. Comparative transcriptome and metabolome analysis reveal glutathione metabolic network and functional genes underlying blue and red-light mediation in maize seedling leaf. BMC Plant Biol. 2021, 21, 1–14. [Google Scholar] [CrossRef]
- Chen, C.; Chen, H.; Ni, M.; Zhang, Z.H.; Yu, F.Y. Research progress of brassinolide in regulating plant growth and development. Scientia Silvae Sinicae. 2022, 58, 144–155. [Google Scholar]
- Chen, M.X.; Zeng, X.P.; Liu, Y.C.; Zhang, H.; Hu, Q.C. An orthogonal design of light factors to optimize growth, photosynthetic capability and metabolite accumulation of Anoectochilus roxburghii (Wall.) Lindl. Sci Hortic. 2021, 288, 110272. [Google Scholar] [CrossRef]
- Ye, Y.Q.; Luo, H.Y.; Li, M.; Liu, X.X.; Cao, G.Q.; Xu, S.S. Effects of nitrogen forms on lateral roots development and photosynthetic characteristics in leaves of Cunninghamia lanceolata seedlings. Acta Botanica Boreali-Occidentalia Sinica 2018, 38, 2036–2044. [Google Scholar]
- Mao, W.; Bao, C.Y.; Cheng, Q.; Liang, N.; Wang, L.C.; Yang, H.Q. All-year high IAA and ABA contents in rhizome buds may contribute to natural four-season shooting in woody bamboo Cephalostachyum pingbianense. Plants 2024, 13, 410. [Google Scholar] [CrossRef]
- Guo, Y.J.; Su, A.; Tian, H.H.; Zhai, M.X.; Li, W.T.; Tian, Y.D.; et al. Transcriptomic analysis of spleen revealed mechanism of dexamethasone-induced immune suppression in chicks. Genes. 2020, 11, 513. [Google Scholar] [CrossRef]
- Makino, M.; Shimizu, K.; Kadota, K. Enhanced clustering-based differential expression analysis method for RNA-seq data. MethodsX. 2024, 12, 102518. [Google Scholar] [CrossRef]
- Liu, Y. CWGCNA: An R package to perform causal inference from the WGCNA framework. NAR Genom Bioinform. 2024, 6, lqae042. [Google Scholar] [CrossRef]
- Lin, Y.; Jiang, J.X.; Zhang, J.P.; You, W.; Hu, Q.L. Development of a TaqMan real-time PCR for detection of the Mycoplasma mycoides subsp. capri. Small Ruminant Res. 2019, 175, 31–36. [Google Scholar] [CrossRef]
- Xie, L.B.; Song, X.; Lei, L.; Chen, C.; Zhao, H.; Hu, J.Y.; et al. Exploring the potential mechanism of Heng-Gu-Gu-Shang-Yu-He-Ji therapy for osteoporosis based on network pharmacology and transcriptomics. J Ethnopharmacol. 2024, 321, 117480. [Google Scholar] [CrossRef]
- Sun, Y.; Zhang, Y.C.; Yin, L.Q.; Li, Q.Z.; Yang, L.Y.; Li, X. Effects of LED light on proliferation and physiological characteristics of Gerbera jamesonii plantlets. Acta Botanica Boreali-Occidentalia Sinica 2017, 37, 2419–2426. [Google Scholar]
- Liu, Q.; Lian, H.F.; Liu, S.Q.; Sun, Y.L.; Yu, X.H.; Guo, H.P. Effects of different LED light qualities on photosynthetic characteristics, fruit production and quality of strawberry. Chin J Appl Ecol. 2015, 26, 1743–1750. [Google Scholar]
- Hernandez-Adasme, C.; Silva, H.; Escalona, V. In-door germination and seedling growth of green and red lettuce under LED-light spectrum and subsequent effect on baby leaf lettuce. Ital J Agron. 2022, 17. [Google Scholar] [CrossRef]
- Chen, J.C.; Chen, G.; Dai, J.H.; Fan, F.J.; Cao, G.Q.; Cao, S.J. Effects of different light quality ratios on photosynthetic and physiological characteristics of Chinese fir seedlings. J Agric Sci. 2022, 35, 2319–2325. [Google Scholar]
- Seki, S.; Yoshida, K.; Sugisaki, M.; Yamano, N.; Fujii, R. Characterization of the ultraviolet-B absorption band of carotenoids using solvent-dependent shifts in steady-state and transient absorption spectra. J Phys Chem B. 2024, 128, 5623–5629. [Google Scholar] [CrossRef]
- Li, L.; Wonder, J.; Helming, T.; van Asselt, G.; Pantazopoulou, C.; van de Kaa, Y.; et al. Evaluation of the roles of brassinosteroid, gibberellin and auxin for tomato internode elongation in response to low red:far-red light. Physiol Plant. 2024, 176, e14558. [Google Scholar] [CrossRef] [PubMed]
- Kaminska, M.; Kesy, J.; Trejgell, A. Abscisic acid in preservation of Taraxacum pieninicum in the form of synthetic seeds in slow growth conditions. Plant Cell Tissue Organ Cult. 2021; 144, 295–312. [Google Scholar]
- Peng, M.X.; Chen, R.M.; Wei, Q.; Guo, H.R.; Zeng, R.Z.; Xie, L.; et al. Effects of genotype, light, and plant growth regulators on rhizome browning, proliferation, and sprouting in Cymbidium. HortScience. 2023, 58, 671–676. [Google Scholar] [CrossRef]
- Fan, X.X.; Bian, Z.H.; Song, B.; Xu, H. Transcriptome analysis reveals the differential regulatory effects of red and blue light on nitrate metabolism in pakchoi (Brassica campestris L.). J Integr Agric. 2022, 21, 1015–1027. [Google Scholar] [CrossRef]
- Dong, T.Y.; Zhang, P.A.; Hakeem, A.; Liu, Z.J.; Su, L.Y.; Ren, Y.H.; et al. Integrated transcriptome and metabolome analysis reveals the physiological and molecular mechanisms of grape seedlings in response to red, green, blue, and white LED light qualities. Environ Exp Bot. 2023, 213. [Google Scholar] [CrossRef]
- Gu, H.; Ding, W.J.; Shi, T.T.; Ouyang, Q.X.; Yang, X.L.; Yue, Y.Z.; et al. Integrated transcriptome and endogenous hormone analysis provides new insights into callus proliferation in Osmanthus fragrans. Sci Rep. 2022, 12, 1–13. [Google Scholar] [CrossRef]
- Deng, H.Y.; Hu, D.H.; Wei, R.P.; Yan, S.; Wang, R.H.; Zheng, H.Q. Global transcriptome analysis reveals genes associated with seedling advance growth traits in a selfed family of Chinese fir (Cunninghamia lanceolata). Dendrobiology. 2022, 87, 27–46. [Google Scholar] [CrossRef]
- Chen, X.T.; Zhao, G.Y.; Li, Y.L.; Wei, S.M.; Dong, Y.H.; Jiao, R.Z. Integrative analysis of the transcriptome and metabolome reveals the mechanism of Chinese fir seed germination. Forests. 2023, 14, 676. [Google Scholar] [CrossRef]
- Zheng, Z.; Gao, S.; Wang, G. Far red light induces the expression of LHCSR to trigger nonphotochemical quenching in the intertidal green macroalgae Ulva prolifera. Algal Res. -Biomass Biofuels Bioprod. 2019; 40. [Google Scholar]
- Ptushenko, V.V.; Bondarenko, G.N.; Vinogradova, E.N.; Glagoleva, E.S.; Karpova, O.V.; Ptushenko, O.S.; et al. Chilling upregulates expression of the PsbS and LhcSR genes in the chloroplasts of the green microalga Lobosphaera incisa IPPAS C-2047. Biochemistry-Moscow. 2022, 87, 1699–1706. [Google Scholar] [CrossRef]
- Wilson, S.; Kim, E.; Ishii, A.; Ruban, A.V.; Minagawa, J. Overexpression of LHCSR and PsbS enhances light tolerance in Chlamydomonas reinhardtii. J Photochem Photobiol B. 2023, 244, 112718. [Google Scholar] [CrossRef]
- Wang, J.; Liu, L.; Luo, R.; Zhang, Q.; Wang, X.; Lin, F.; Wang, P. Genome-wide analysis of filamentous temperature-sensitive H protease (ftsH) gene family in soybean. BMC Genomics. 2024, 25, 1–13. [Google Scholar] [CrossRef]
- Shan, Q.; Zhou, B.H.; Wang, Y.X.; Hao, F.Y.; Zhu, L.; Liu, Y.H.; et al. Genome-wide identification and comprehensive analysis of the FtsH gene family in Soybean (Glycine max). Int J Mol Sci. 2023, 24. [Google Scholar] [CrossRef] [PubMed]
- Zaltsman, A.; Feder, A.; Adam, Z. Developmental and light effects on the accumulation of FtsH protease in Arabidopsis chloroplasts–implications for thylakoid formation and photosystem II maintenance. Plant J. 2005, 42, 609–617. [Google Scholar] [CrossRef]
- Zhong, M.; Zeng, B.J.; Tang, D.Y.; Yang, J.X.; Qu, L.N.; Yan, J.D.; et al. The blue light receptor CRY1 interacts with GID1 and DELLA proteins to repress GA signaling during photomorphogenesis in Arabidopsis. Mol Plant. 2021, 14, 1328–1342. [Google Scholar] [CrossRef]
- Yan, B.Q.; Yang, Z.J.; He, G.H.; Jing, Y.X.; Dong, H.X.; Ju, L.; Zhang, Y.W.; Zhu, Y.F.; Zhou, Y.; Sun, J.Q. The blue light receptor CRY1 interacts with GID1 and DELLA proteins to repress gibberellin signaling and plant growth. Plant Commun. 2021, 2, 82–95. [Google Scholar] [CrossRef] [PubMed]
- Jiang, H.W.; Liu, M.J.; Chen, I.C.; Huang, C.H.; Chao, L.Y.; Hsieh, H.L. A glutathione S-transferase regulated by light and hormones participates in the modulation of Arabidopsis seedling development. Plant Physiol. 2010, 154, 1646–1658. [Google Scholar] [CrossRef]
- Wang, Z.B.; Yang, W.; Chen, J.; Peng, F.M. Effect of light quality on physiological characteristics and expression of antioxidant enzyme genes in Bletilla striata L. in vitro. J Trop Subtrop Bot. 2016, 24, 665–670. [Google Scholar]
- Tian, Y.Y.; Wang, H.Y.; Zhang, Z.Q.; Zhao, X.X.; Wang, Y.; Zhang, L.X. An RNA-seq analysis reveals differential transcriptional responses to different light qualities in leaf color of Camellia sinensis cv. Huangjinya. J Plant Growth Regul. 2022, 41, 612–627. [Google Scholar] [CrossRef]
- Su, Y.T.; Zeeshan, U.; Haq, M.; Liu, X.F.; Li, Y.; Yu, J.; et al. A genome-wide identification and expression analysis of the Casparian strip membrane domain protein-like gene family in Pogostemon cablin in response to p-HBA-induced continuous cropping obstacles. Plants-, 2023; 12. [Google Scholar]
- Erdayani, E.; Nagarajan, R.; Grant, N.P.; Gill, K.S. Genome-wide analysis of the HSP101/CLPB gene family for heat tolerance in hexaploid wheat. Sci Rep. 2020, 10, 1–17. [Google Scholar] [CrossRef] [PubMed]
- Zhang, C.; He, M.L.; Jiang, Z.X.; Liu, L.; Pu, J.B.; Zhang, W.J.; et al. The xyloglucan endotransglucosylase/hydrolase gene XTH22/TCH4 regulates plant growth by disrupting the cell wall homeostasis in Arabidopsis under boron deficiency. Int J Mol Sci. 2022, 23, 1250. [Google Scholar] [CrossRef] [PubMed]
- Sgamma, T.; Forgione, I.; Luziatelli, F.; Iacona, C.; Mancinelli, R.; Thomas, B.; et al. Monochromic radiations provided by light emitted diode (LED) modulate infection and defense response to fire blight in pear trees. Plants 2021, 10, 1886. [Google Scholar] [CrossRef]
Figure 1.
Physiological and biochemical indices of adventitious shoots under different light qualities. (A) Morphology of new adventitious shoots after 35 d of treatment. (B) Photosynthetic pigment contents in leaves. (C) Endogenous hormone levels in adventitious shoots and (D) Chlorophyll fluorescence parameters in leaves. Different letters indicate significant differences between means at p < 0.05.
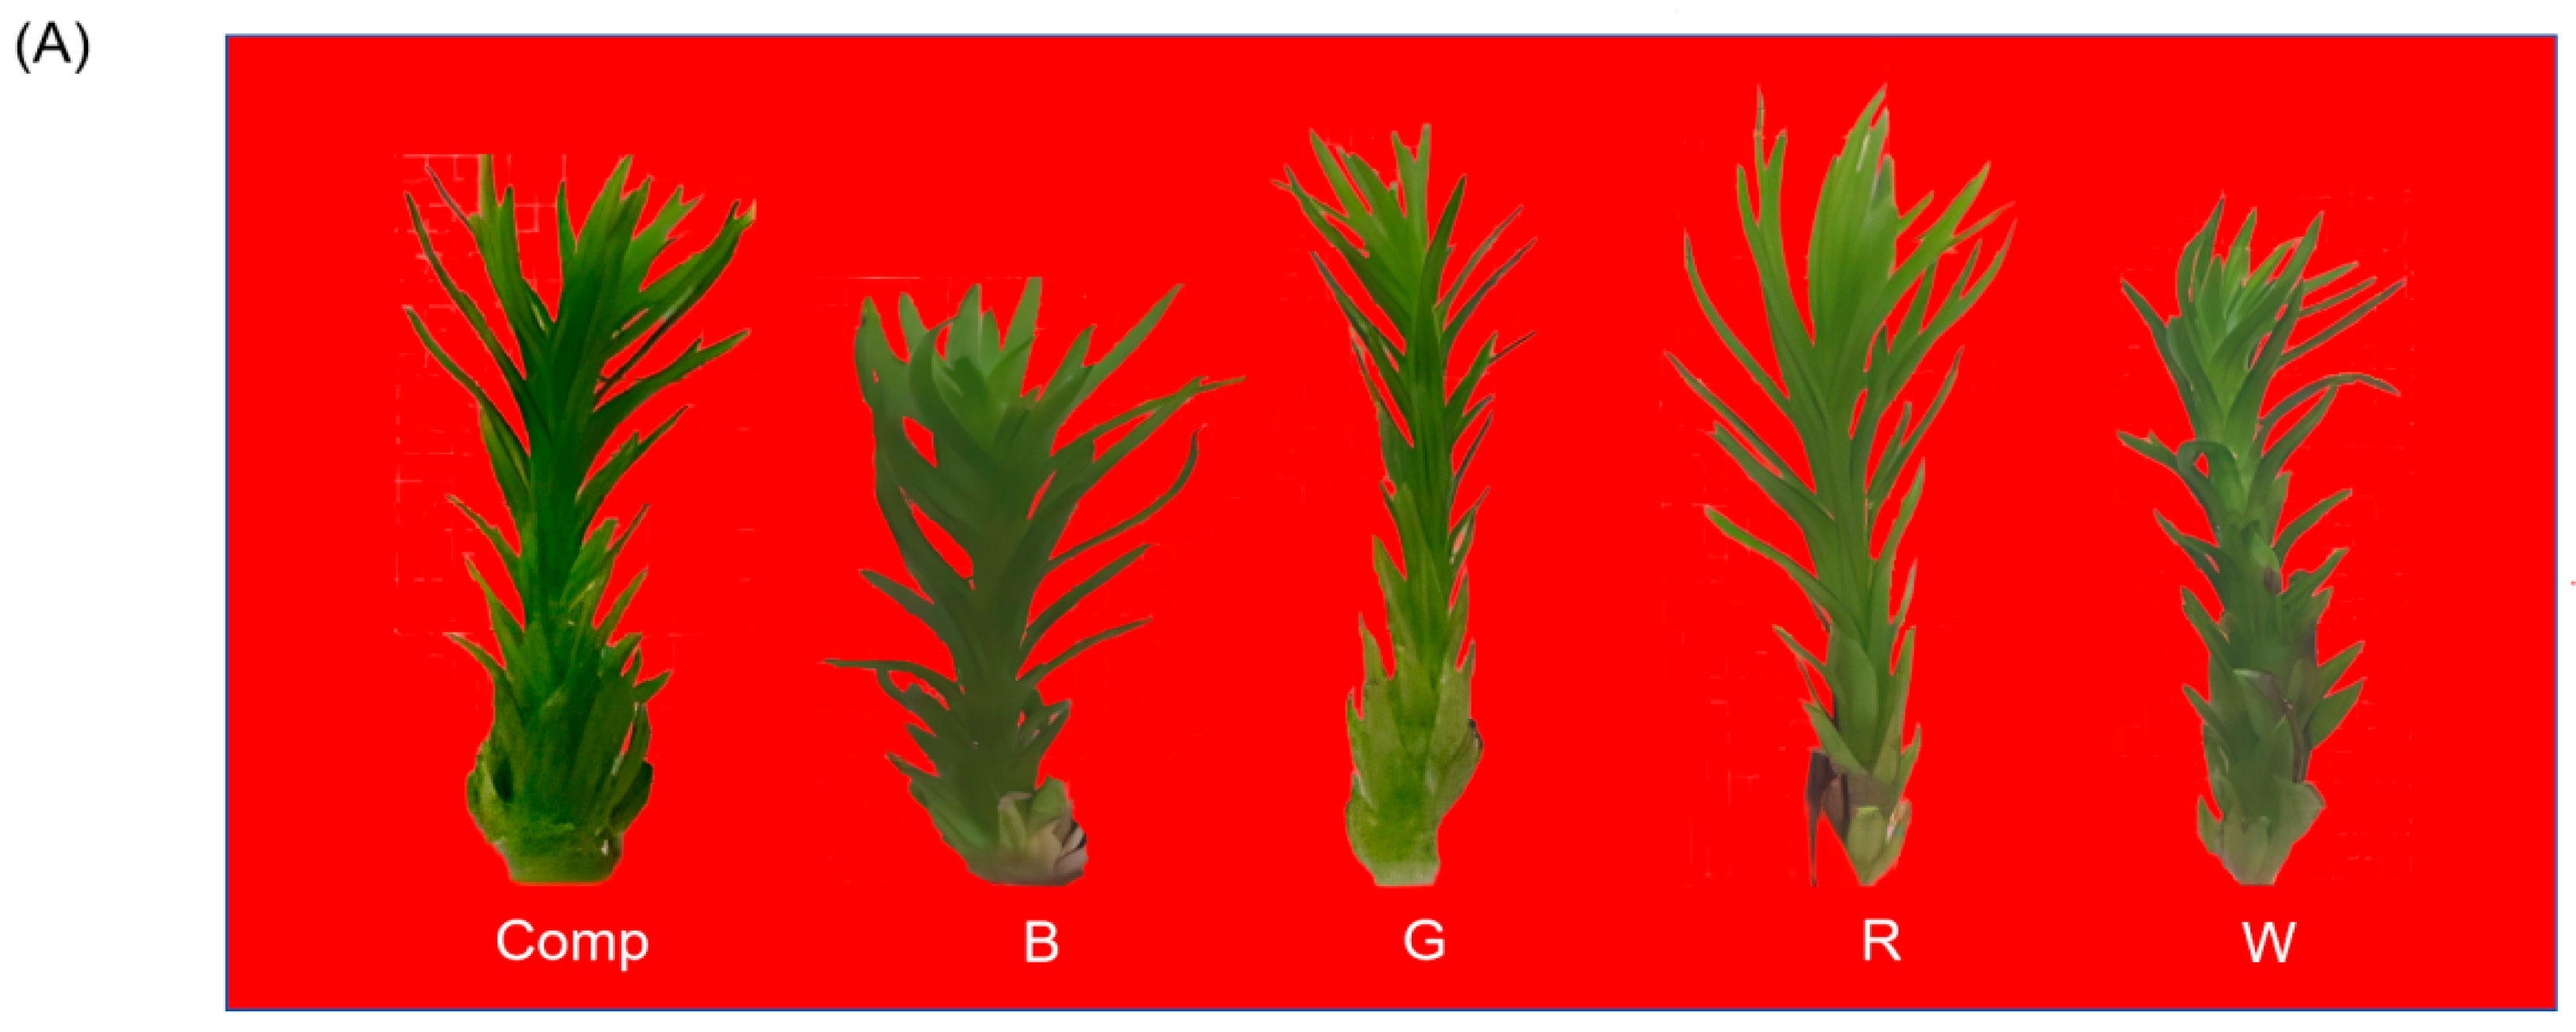
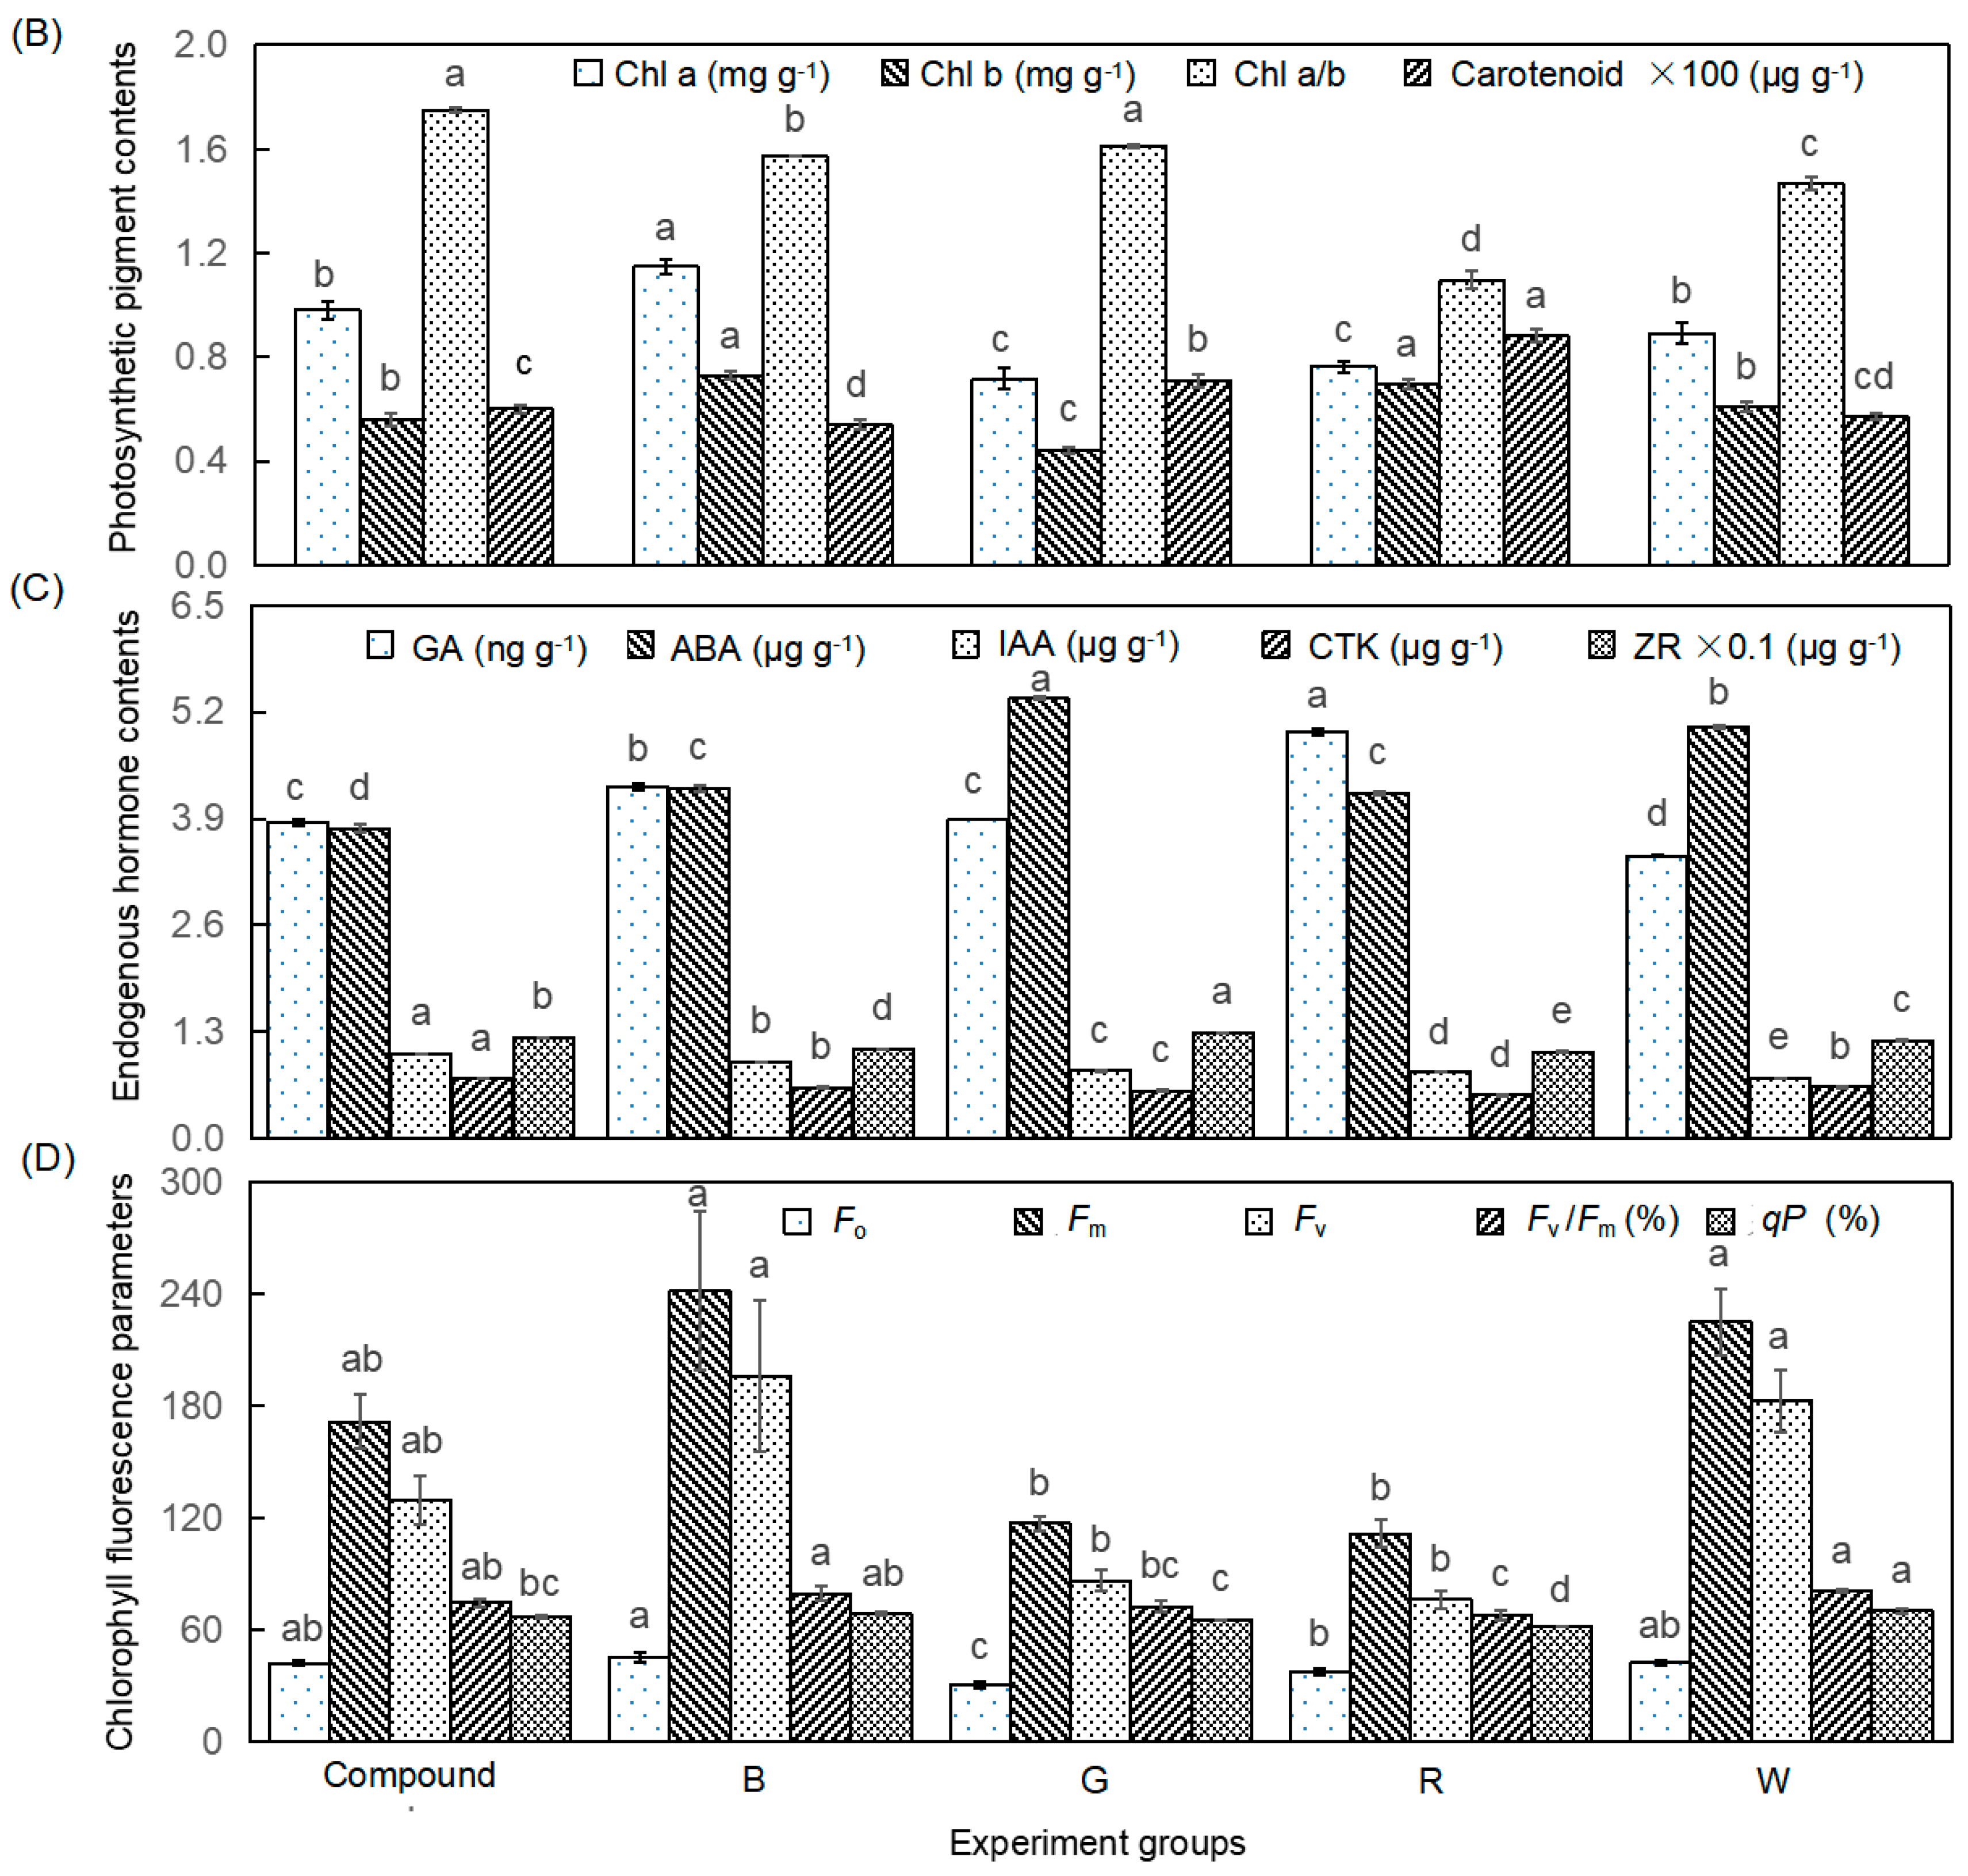
Figure 2.
Principal Component Analysis (PCA), correlation analysis, and differential gene expression (DEG) statistics from RNA-seq of adventitious shoots in tissue-cultured Chinese fir seedlings under different light qualities. (A) PCA plot illustrating the contribution of each principal component to the overall variance, with individual samples represented as points. (B) Heatmap of Spearman’s correlation coefficients, showing the relationships between all samples. (C) Differential gene expression (DEG) statistics across different sample comparison groups. (D)-(F) Venn diagrams highlighting the overlap of DEGs between various comparison groups, with numbers in overlapping areas indicating shared DEGs and those in non-overlapping areas representing unique DEGs.
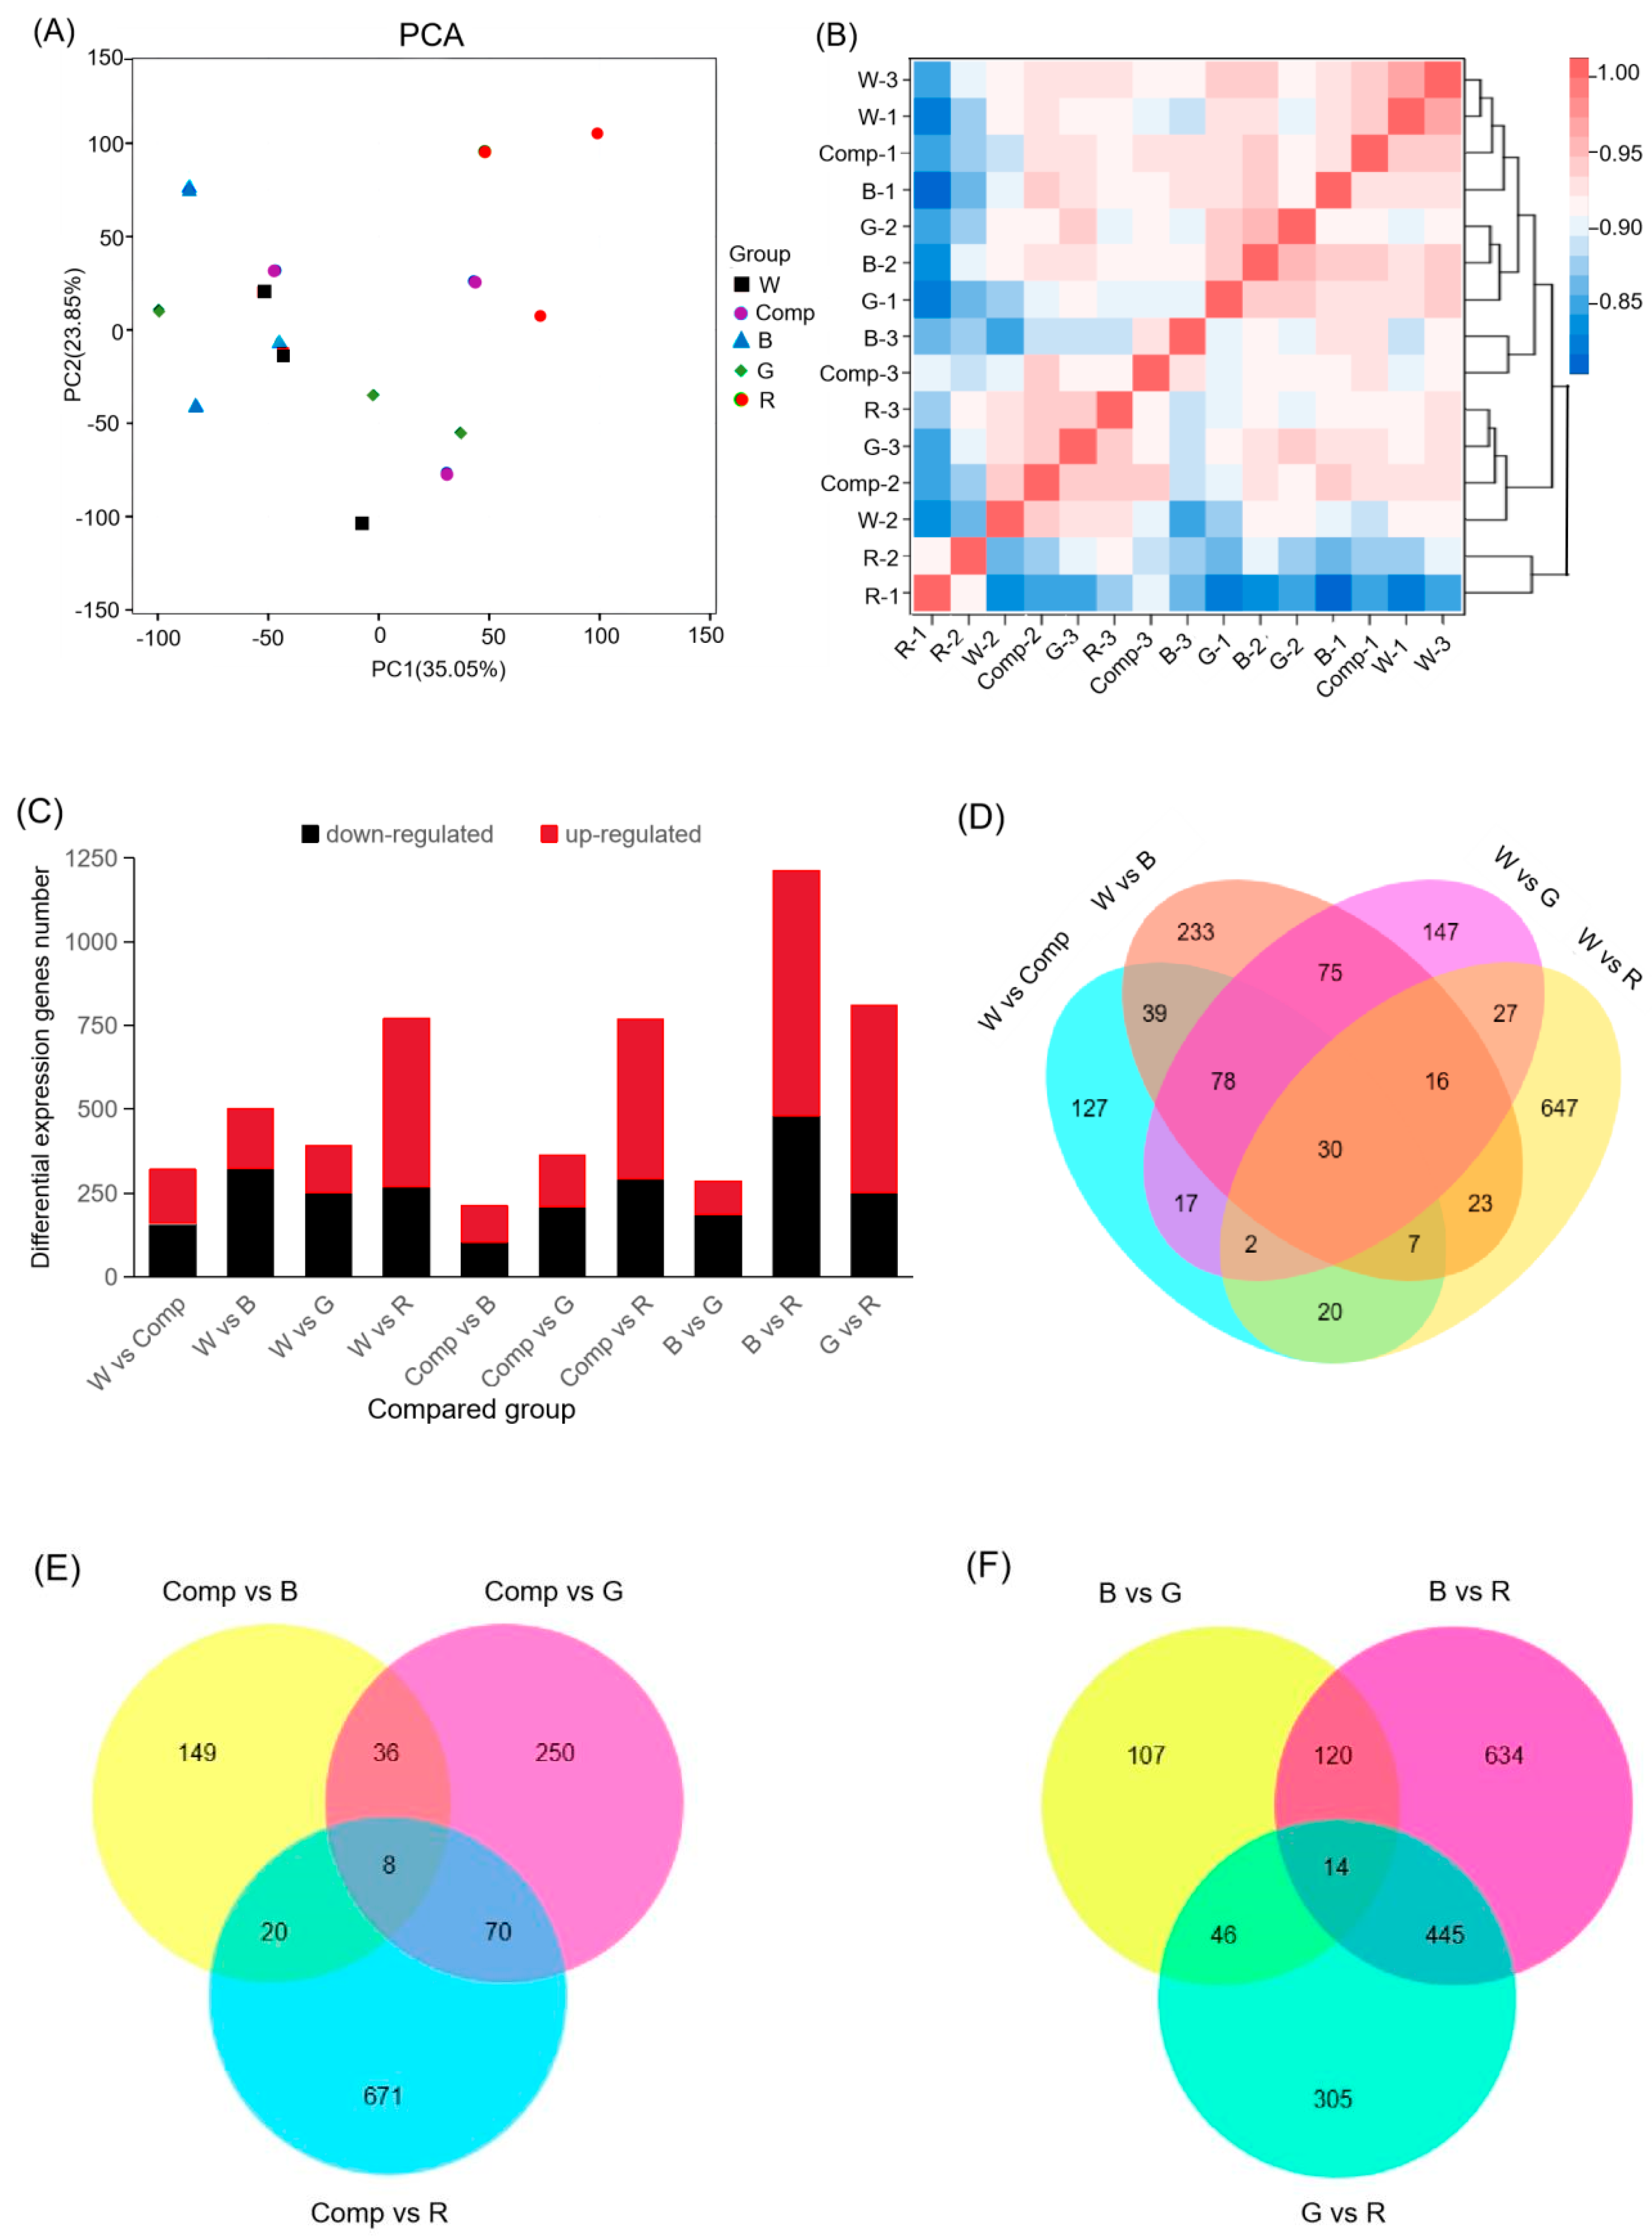
Figure 3.
GO term enrichment analysis of DEGs in adventitious shoots under different light quality treatments in tissue-cultured Chinese fir seedlings. The color of the circles represents the p-value, circle size is proportional to the number of DEGs within each pathway.
Figure 3.
GO term enrichment analysis of DEGs in adventitious shoots under different light quality treatments in tissue-cultured Chinese fir seedlings. The color of the circles represents the p-value, circle size is proportional to the number of DEGs within each pathway.
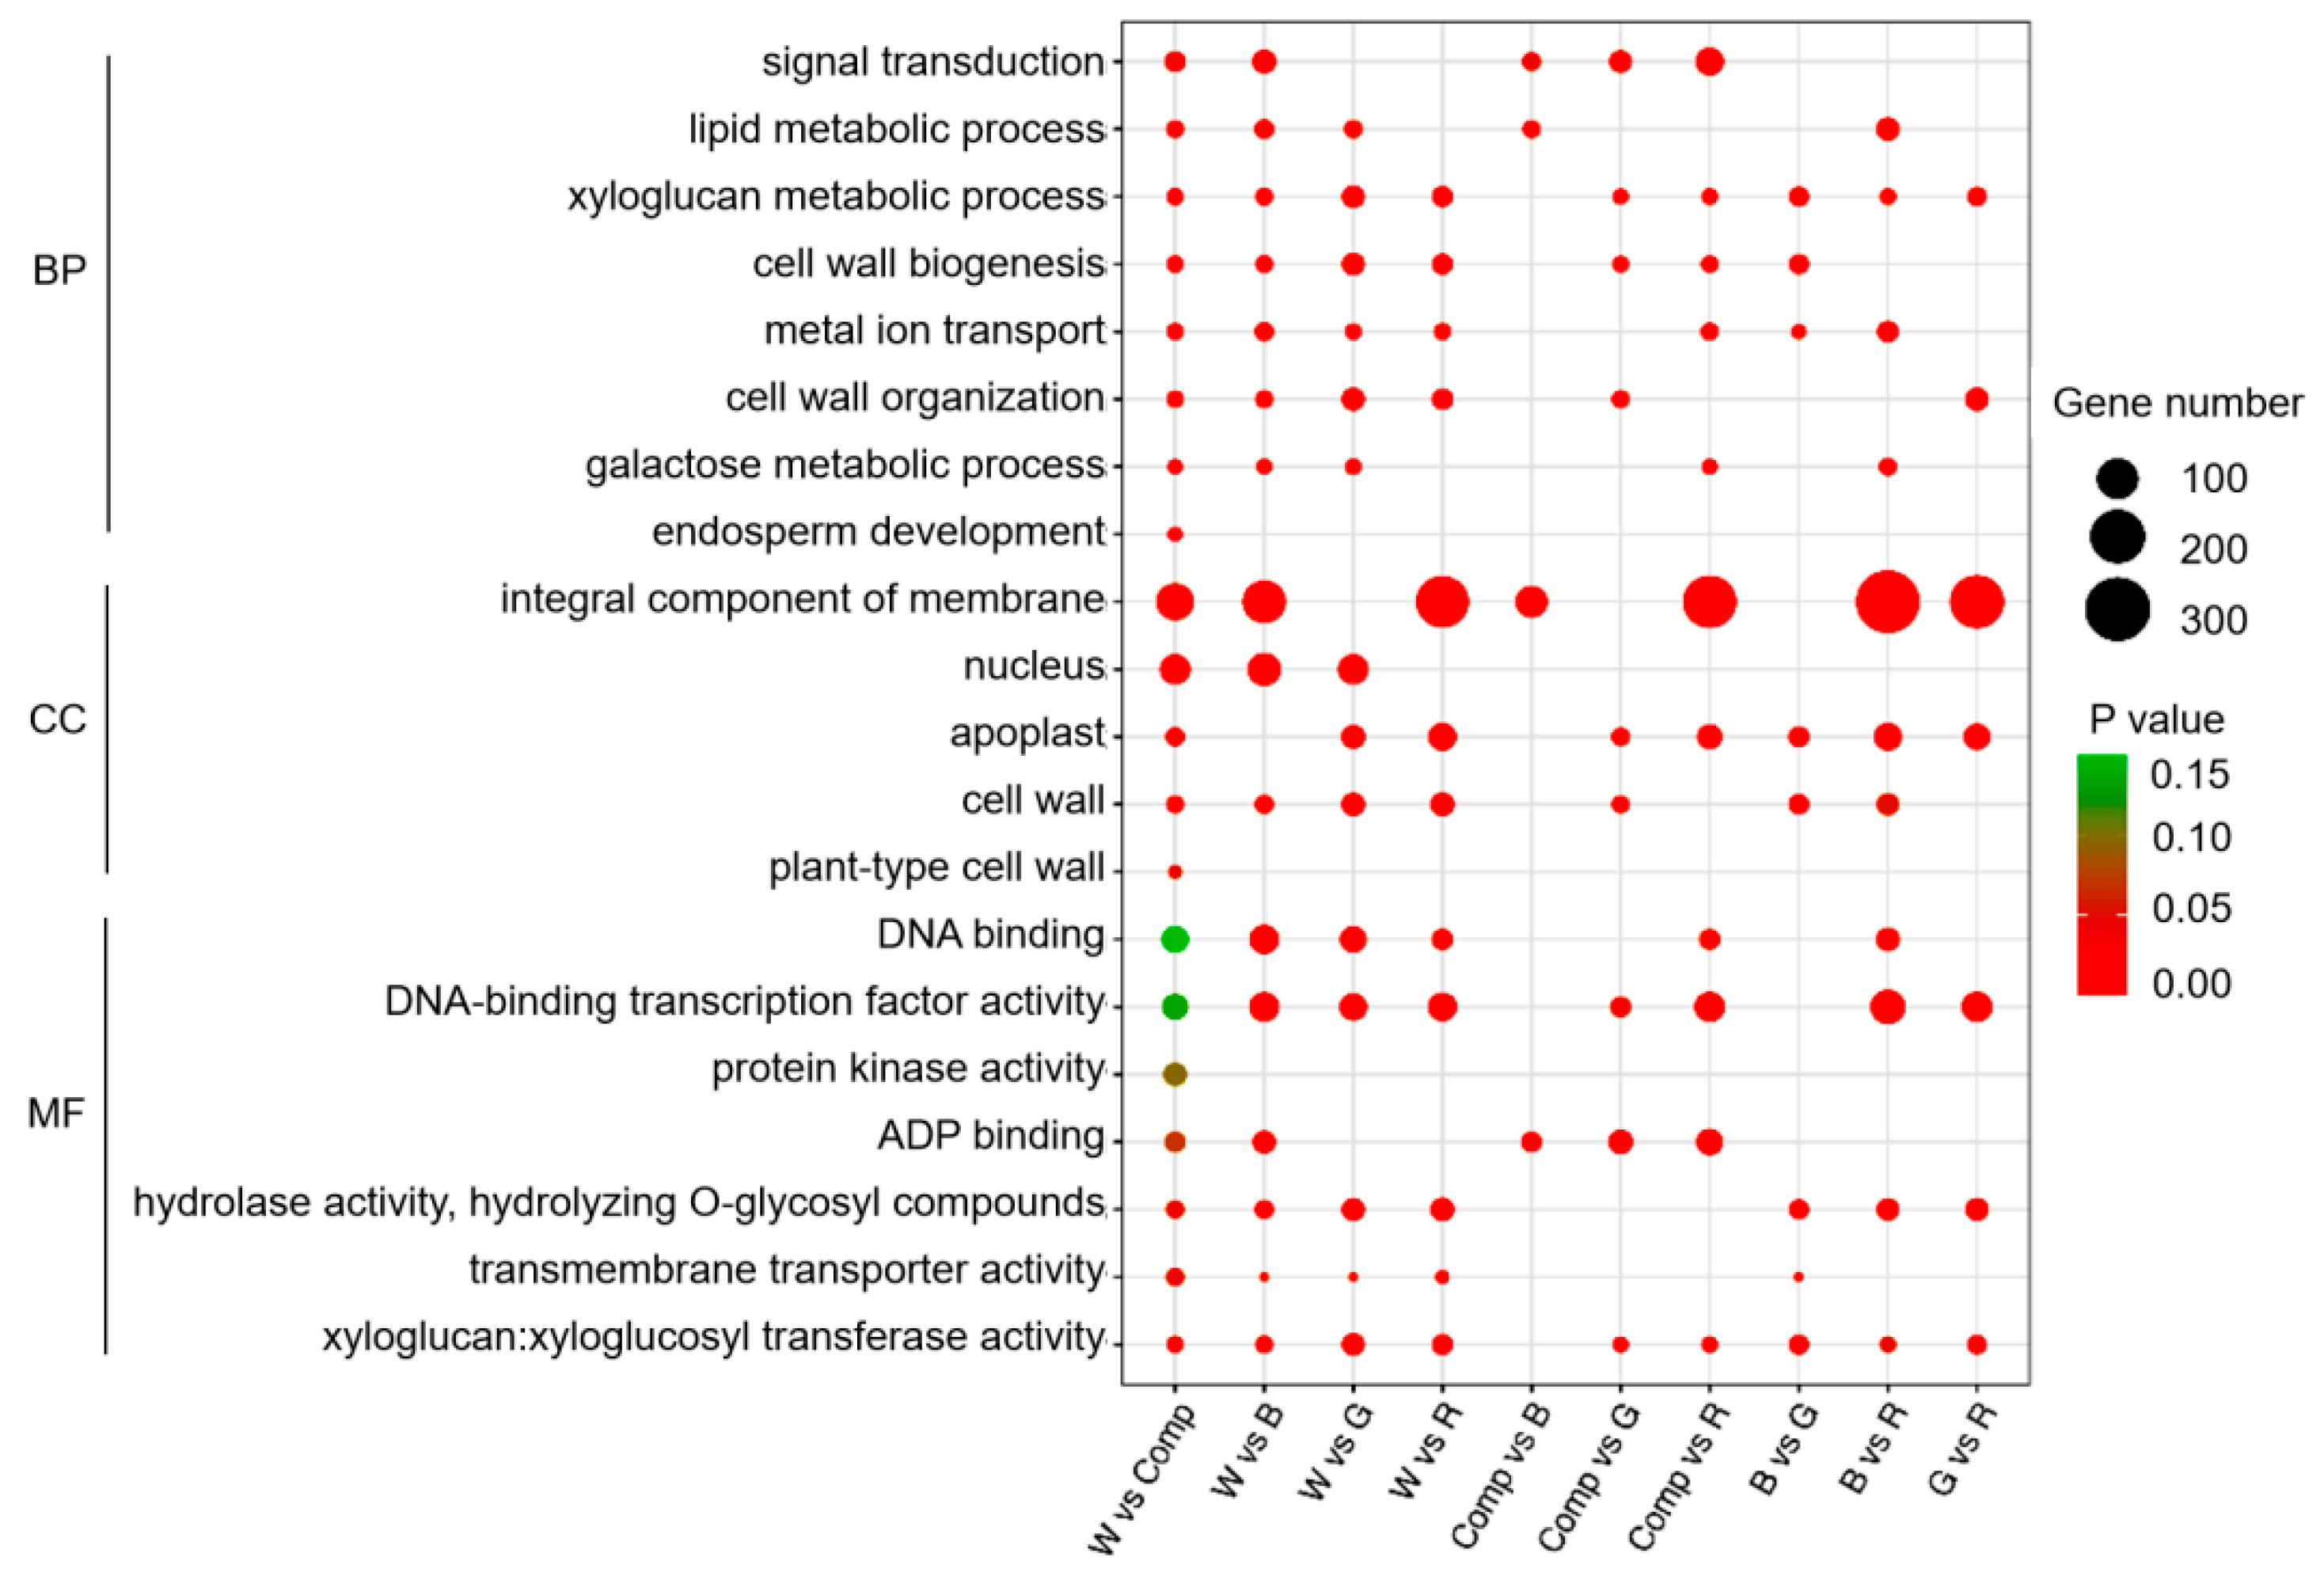
Figure 4.
KEGG pathway enrichment analysis of DEGs in adventitious shoots of tissue-cultured Chinese fir seedlings under different light quality treatments. The circle color represents the p-value, while the circle size corresponds to the number of DEGs in each pathway.
Figure 4.
KEGG pathway enrichment analysis of DEGs in adventitious shoots of tissue-cultured Chinese fir seedlings under different light quality treatments. The circle color represents the p-value, while the circle size corresponds to the number of DEGs in each pathway.
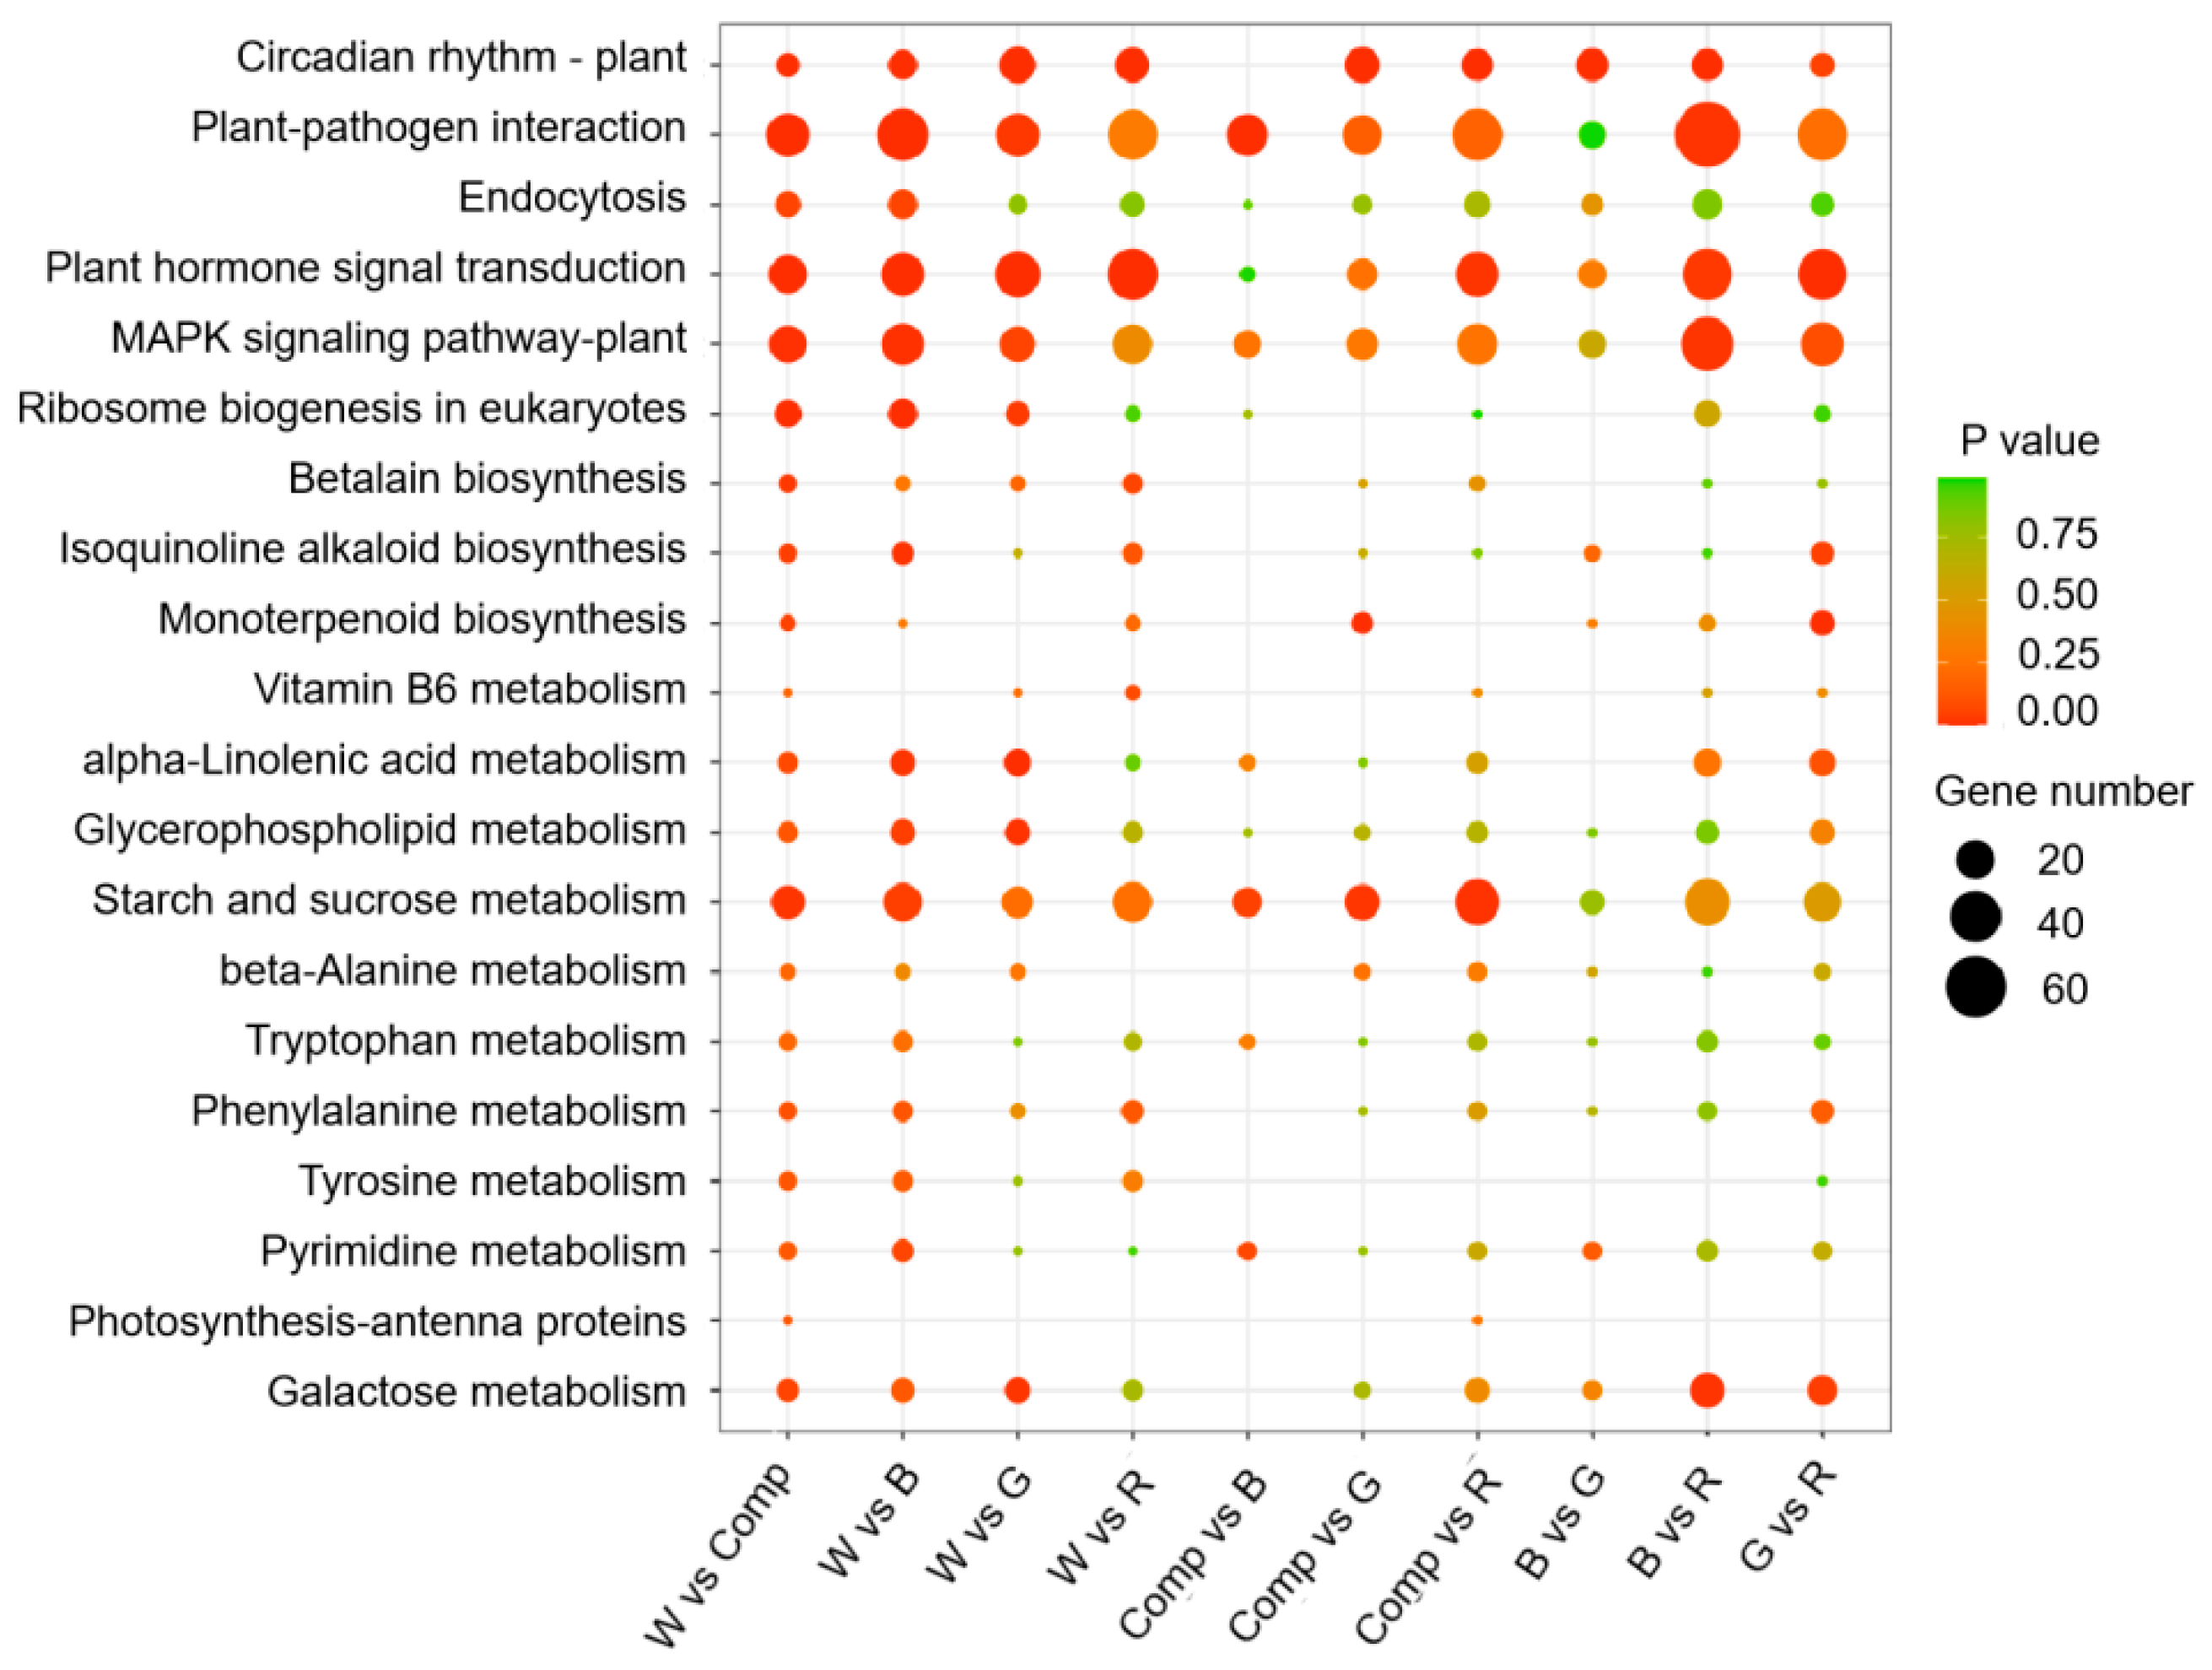
Figure 5.
Analysis of metabolites and their pathways. (A) PCA of metabolites in positive ions mode. (B) PCA of metabolites in negative ions mode. (C) Pie chart depicting the distribution of the top 10 metabolite classes annotated in the Human Metabolome Database (HMDB) across both positive and negative ion modes. (D) Clustering heat map of all differential metabolites (DMAs) for all samples. (E-G) Venn diagrams of DMAs between different comparison groups. (H) Percentages of metabolites classified within the top 20 KEGG metabolic pathways, reflecting the broader metabolic processes involved in shoot proliferation under varying light conditions.
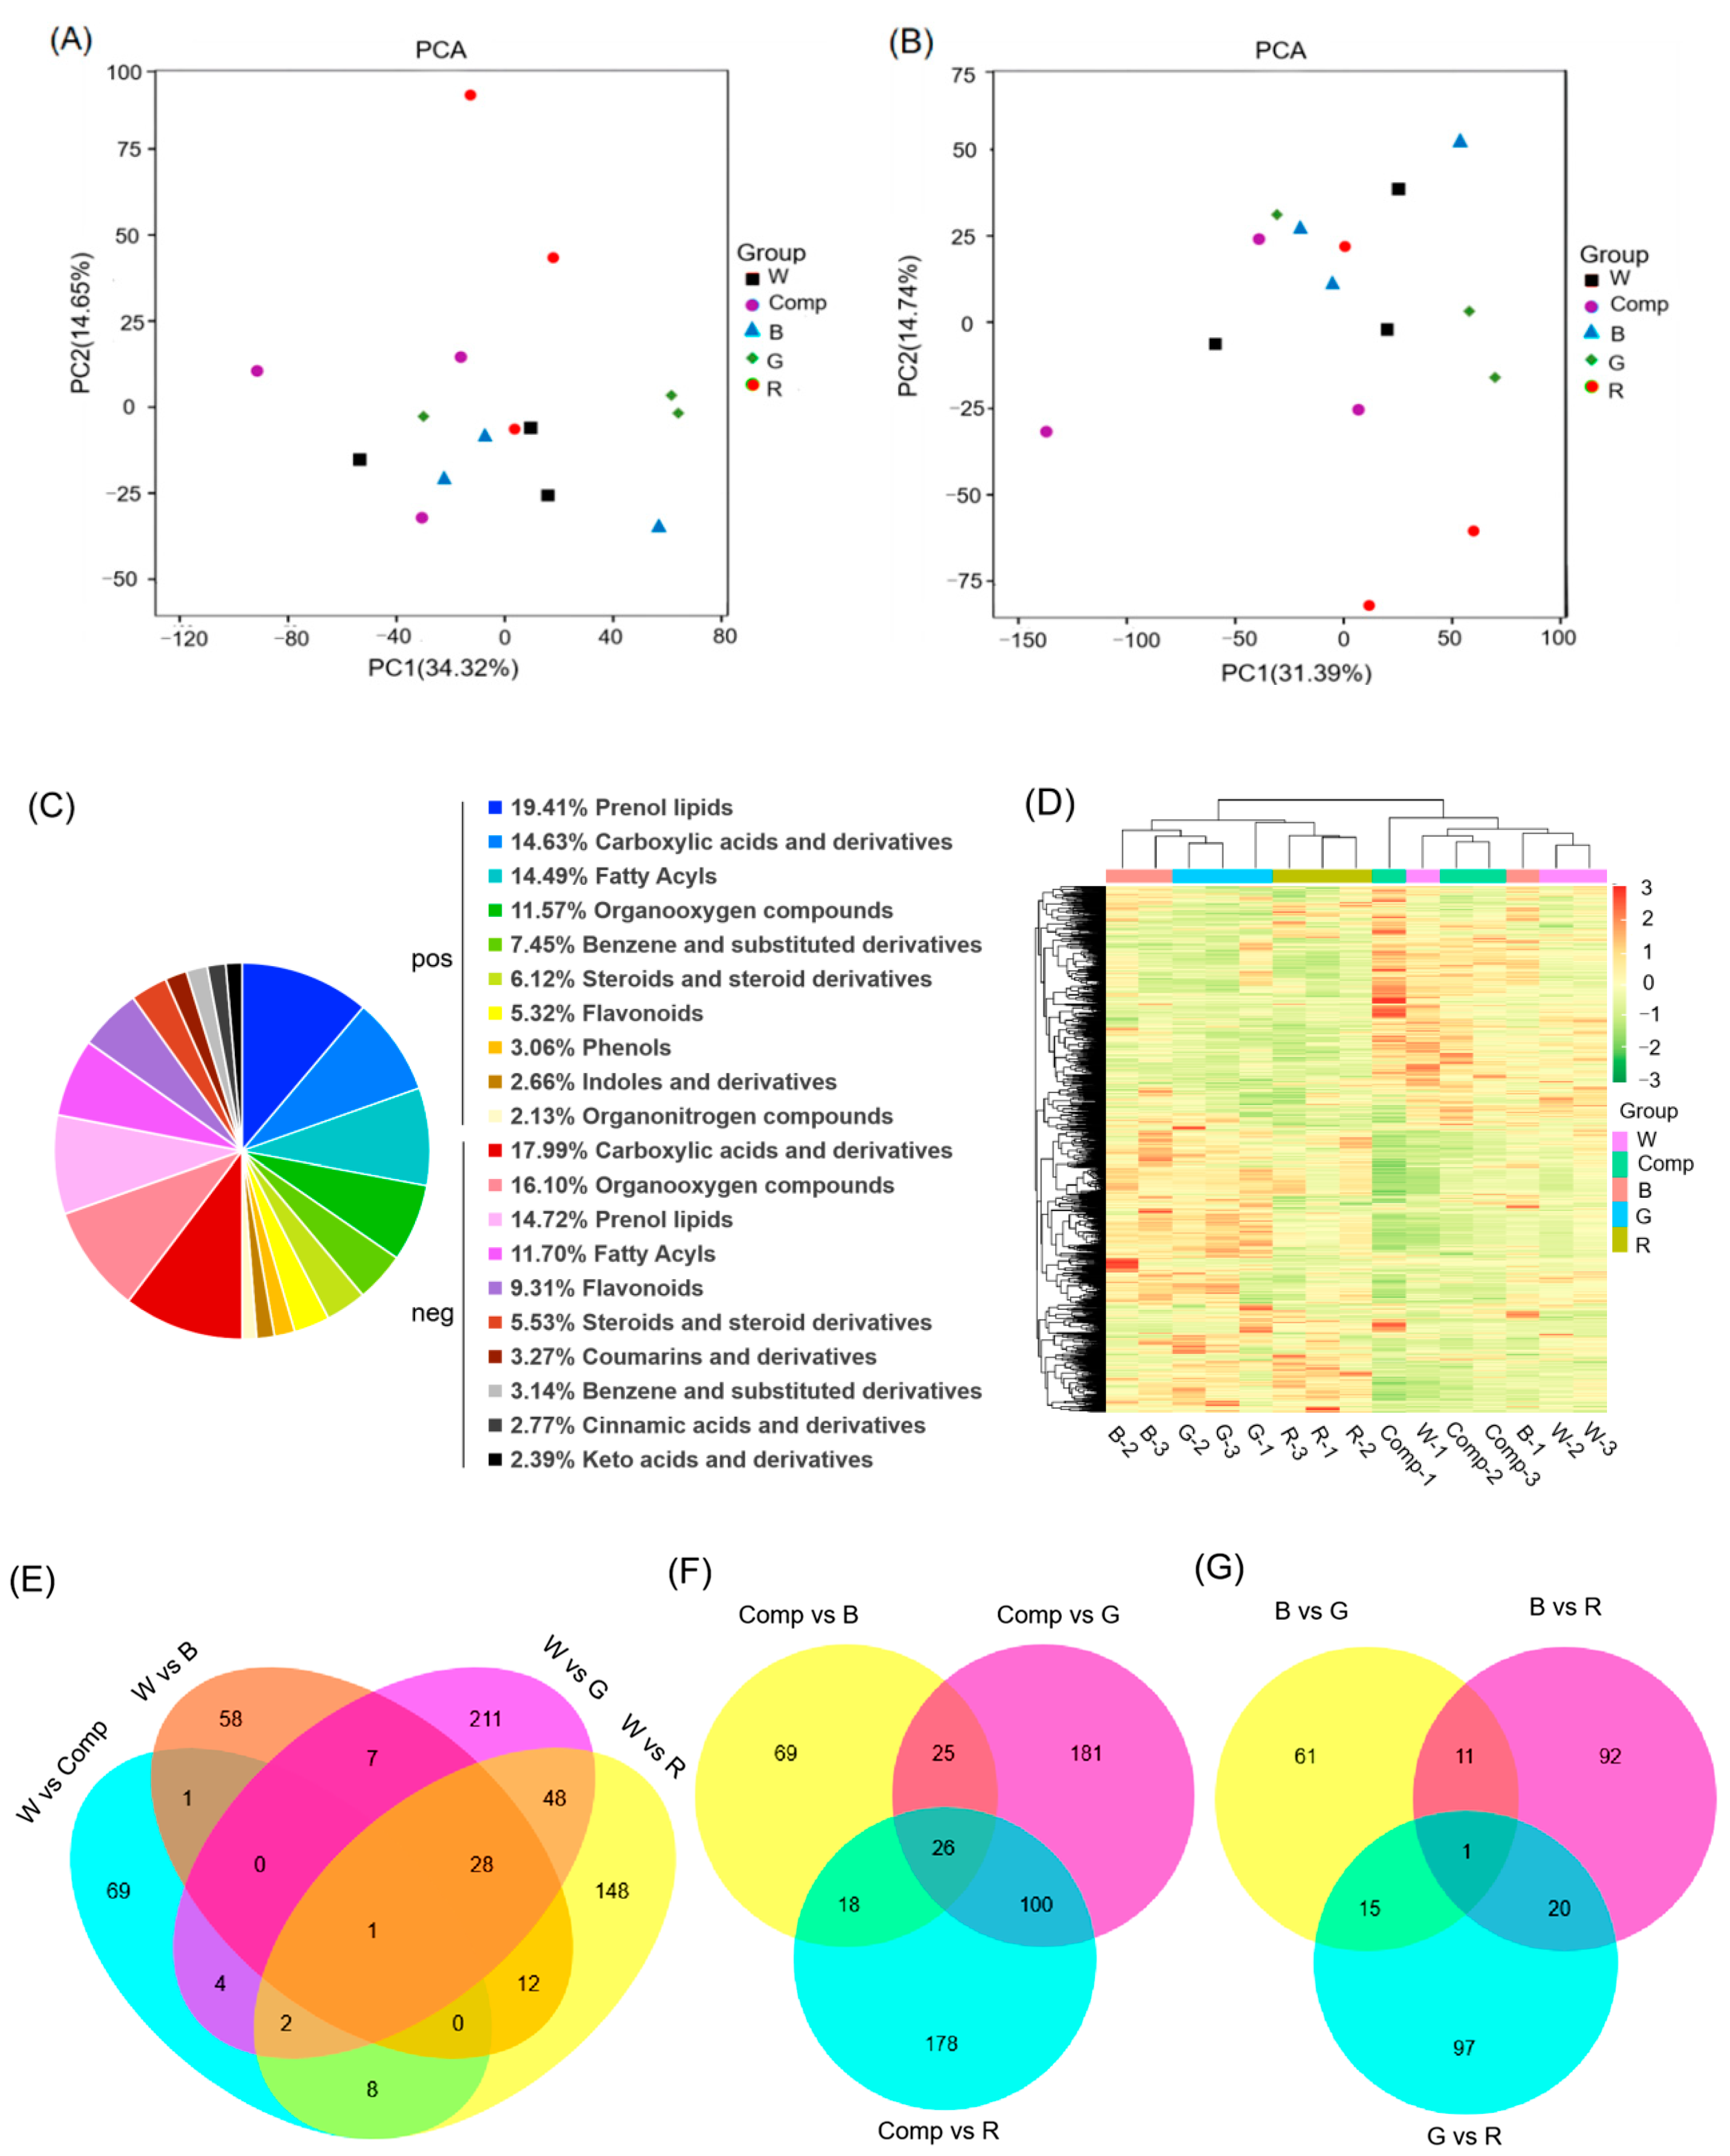
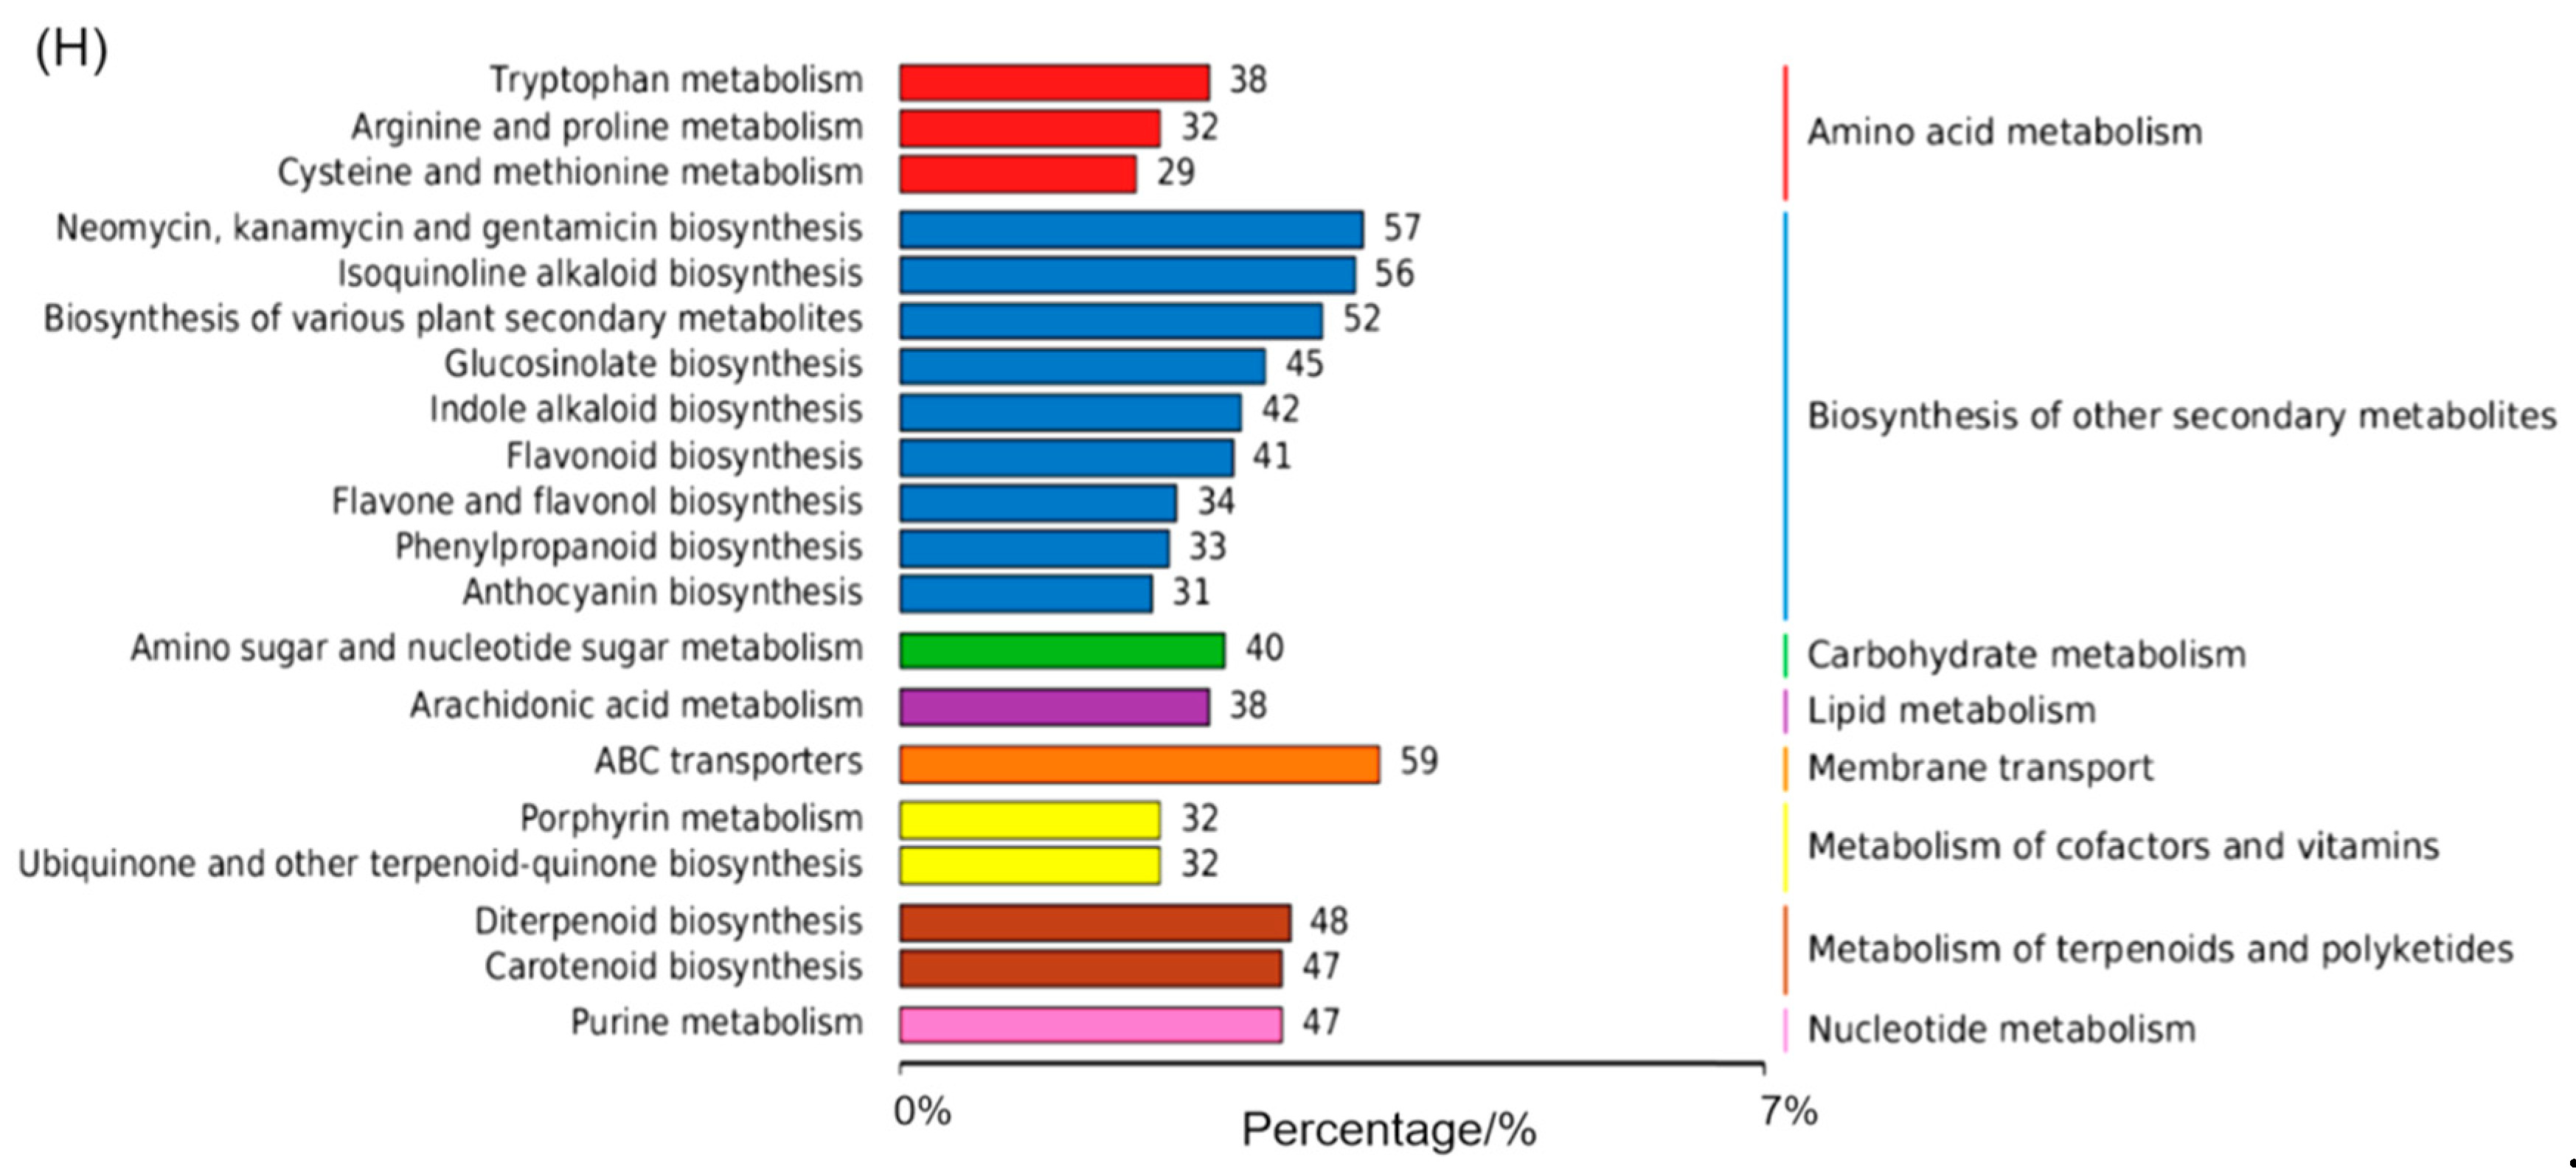
Figure 6.
WGCNA analysis of DEGs. (A) Cluster dendrogram identifying nine co-expressed gene modules, each represented by a distinct color. (B) Correlation of each module with key plant hormone metabolism profiles. Rows represent gene modules, and columns represent hormone profiles, with color intensity reflecting the degree of correlation. (C), (D), and (E) Heatmaps of gene expression within the brown, magenta, and red modules (upper panels) along with eigengene expression values for each sample (lower panels). (F), (G), and (H) Co-expression networks for DEGs in the brown, magenta, and red modules. Hub genes are highlighted in red, while genes strongly correlated with hub gene expression are marked in green.
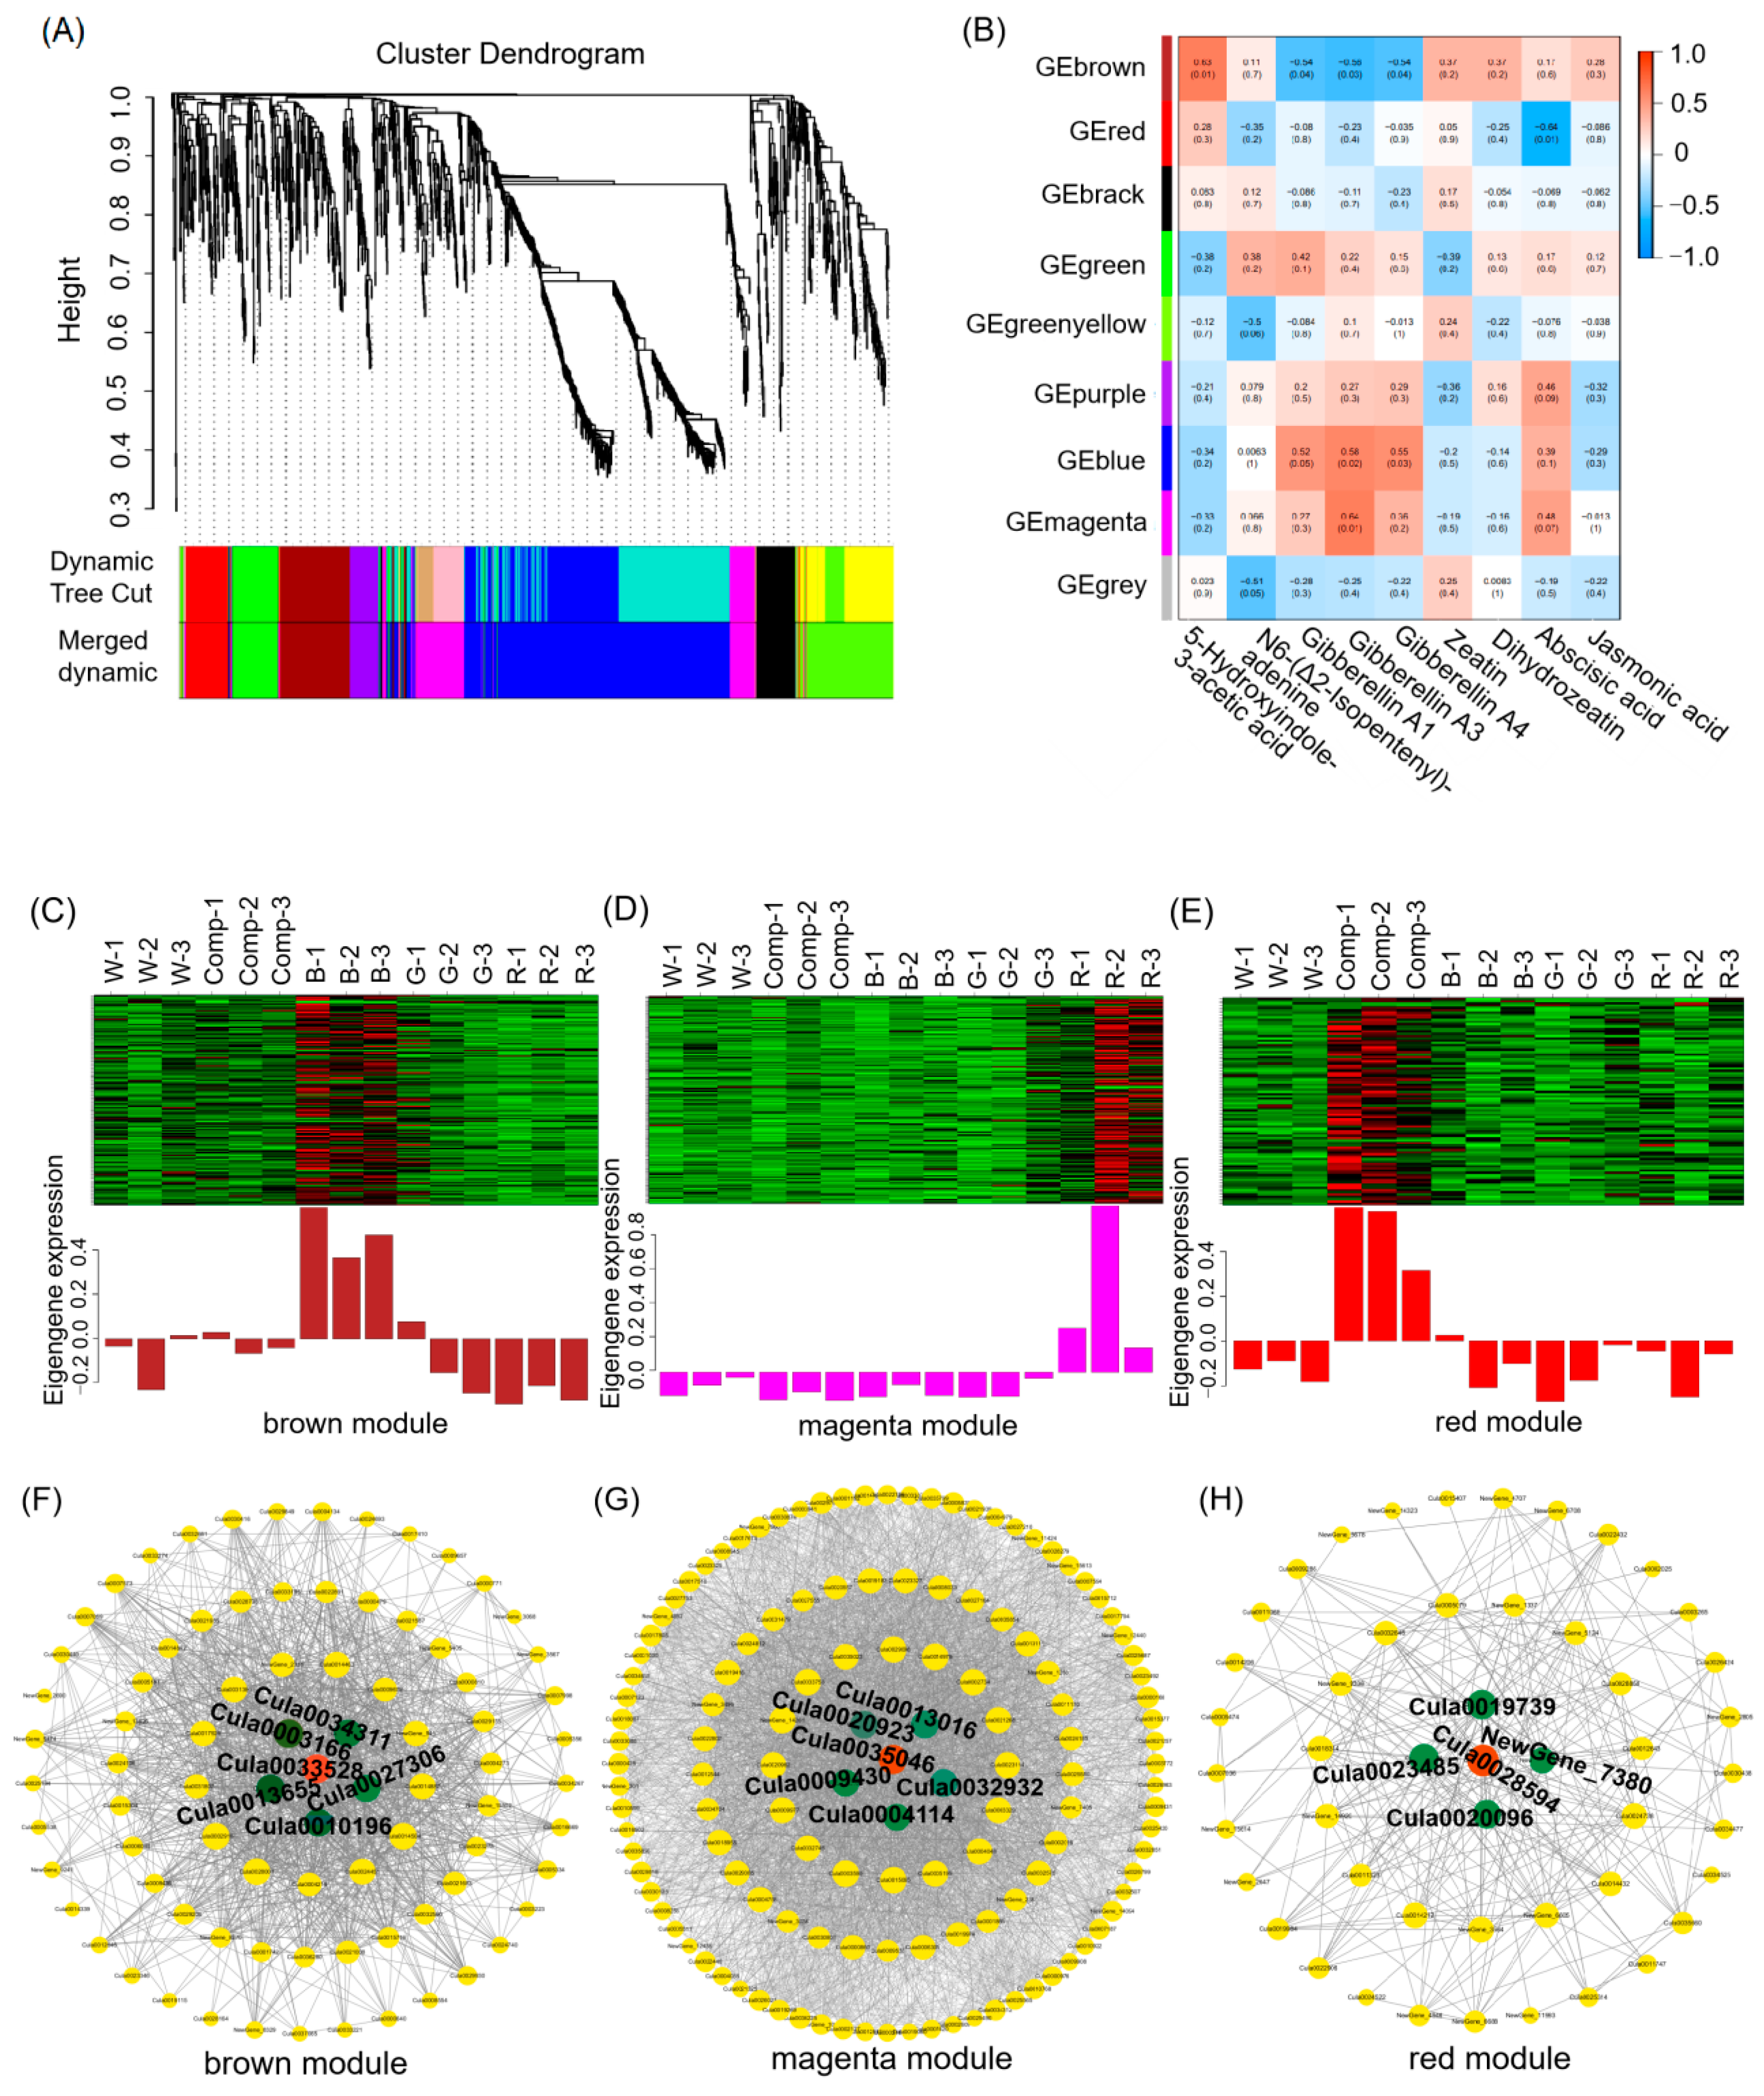
Figure 7.
Co-analysis of gene expression and metabolite accumulation in the important pathways involving the key genes. (A) Location of the key genes and the heat map of gene expression. The names in the boxes mean the pathways. (B) and (C) showed the heat maps of gene expression and metabolite accumulation in the plant hormone signal transduction pathway. Pathways are represented in large boxes, while smaller boxes indicate the individual proteins associated with each pathway. In addition, oval rings identify key metabolites involved in these pathways. PHE: Phenydalarine; CCoA: Cirnamoyl-CoA; CFCoA: Caffeoyi-CoA; FeCoA: Feruloyl-CoA; ERI: Eriodictyol; DHQ: Dihycdroquercetin; QR: Quercetin; EC: Epicatechin; GSH: Glutathione; RSGSH: R-S-Glutathione; LAA: L-Amino acid; FtsH: FtsH hetero-hexameric complex; CASP: Casparian strip membrane domain proteins; ClpB: caseinolytic peptidase B protein; XAT: Xanthoxin; GGPP: Geranylgeranyl pyrophosphate; ABAA: Abscisic aldehyde; ABA: Abscisate; DHDPP: Dehydrp dolchol-PP; pCCoA: p-Counaroy-CoA.
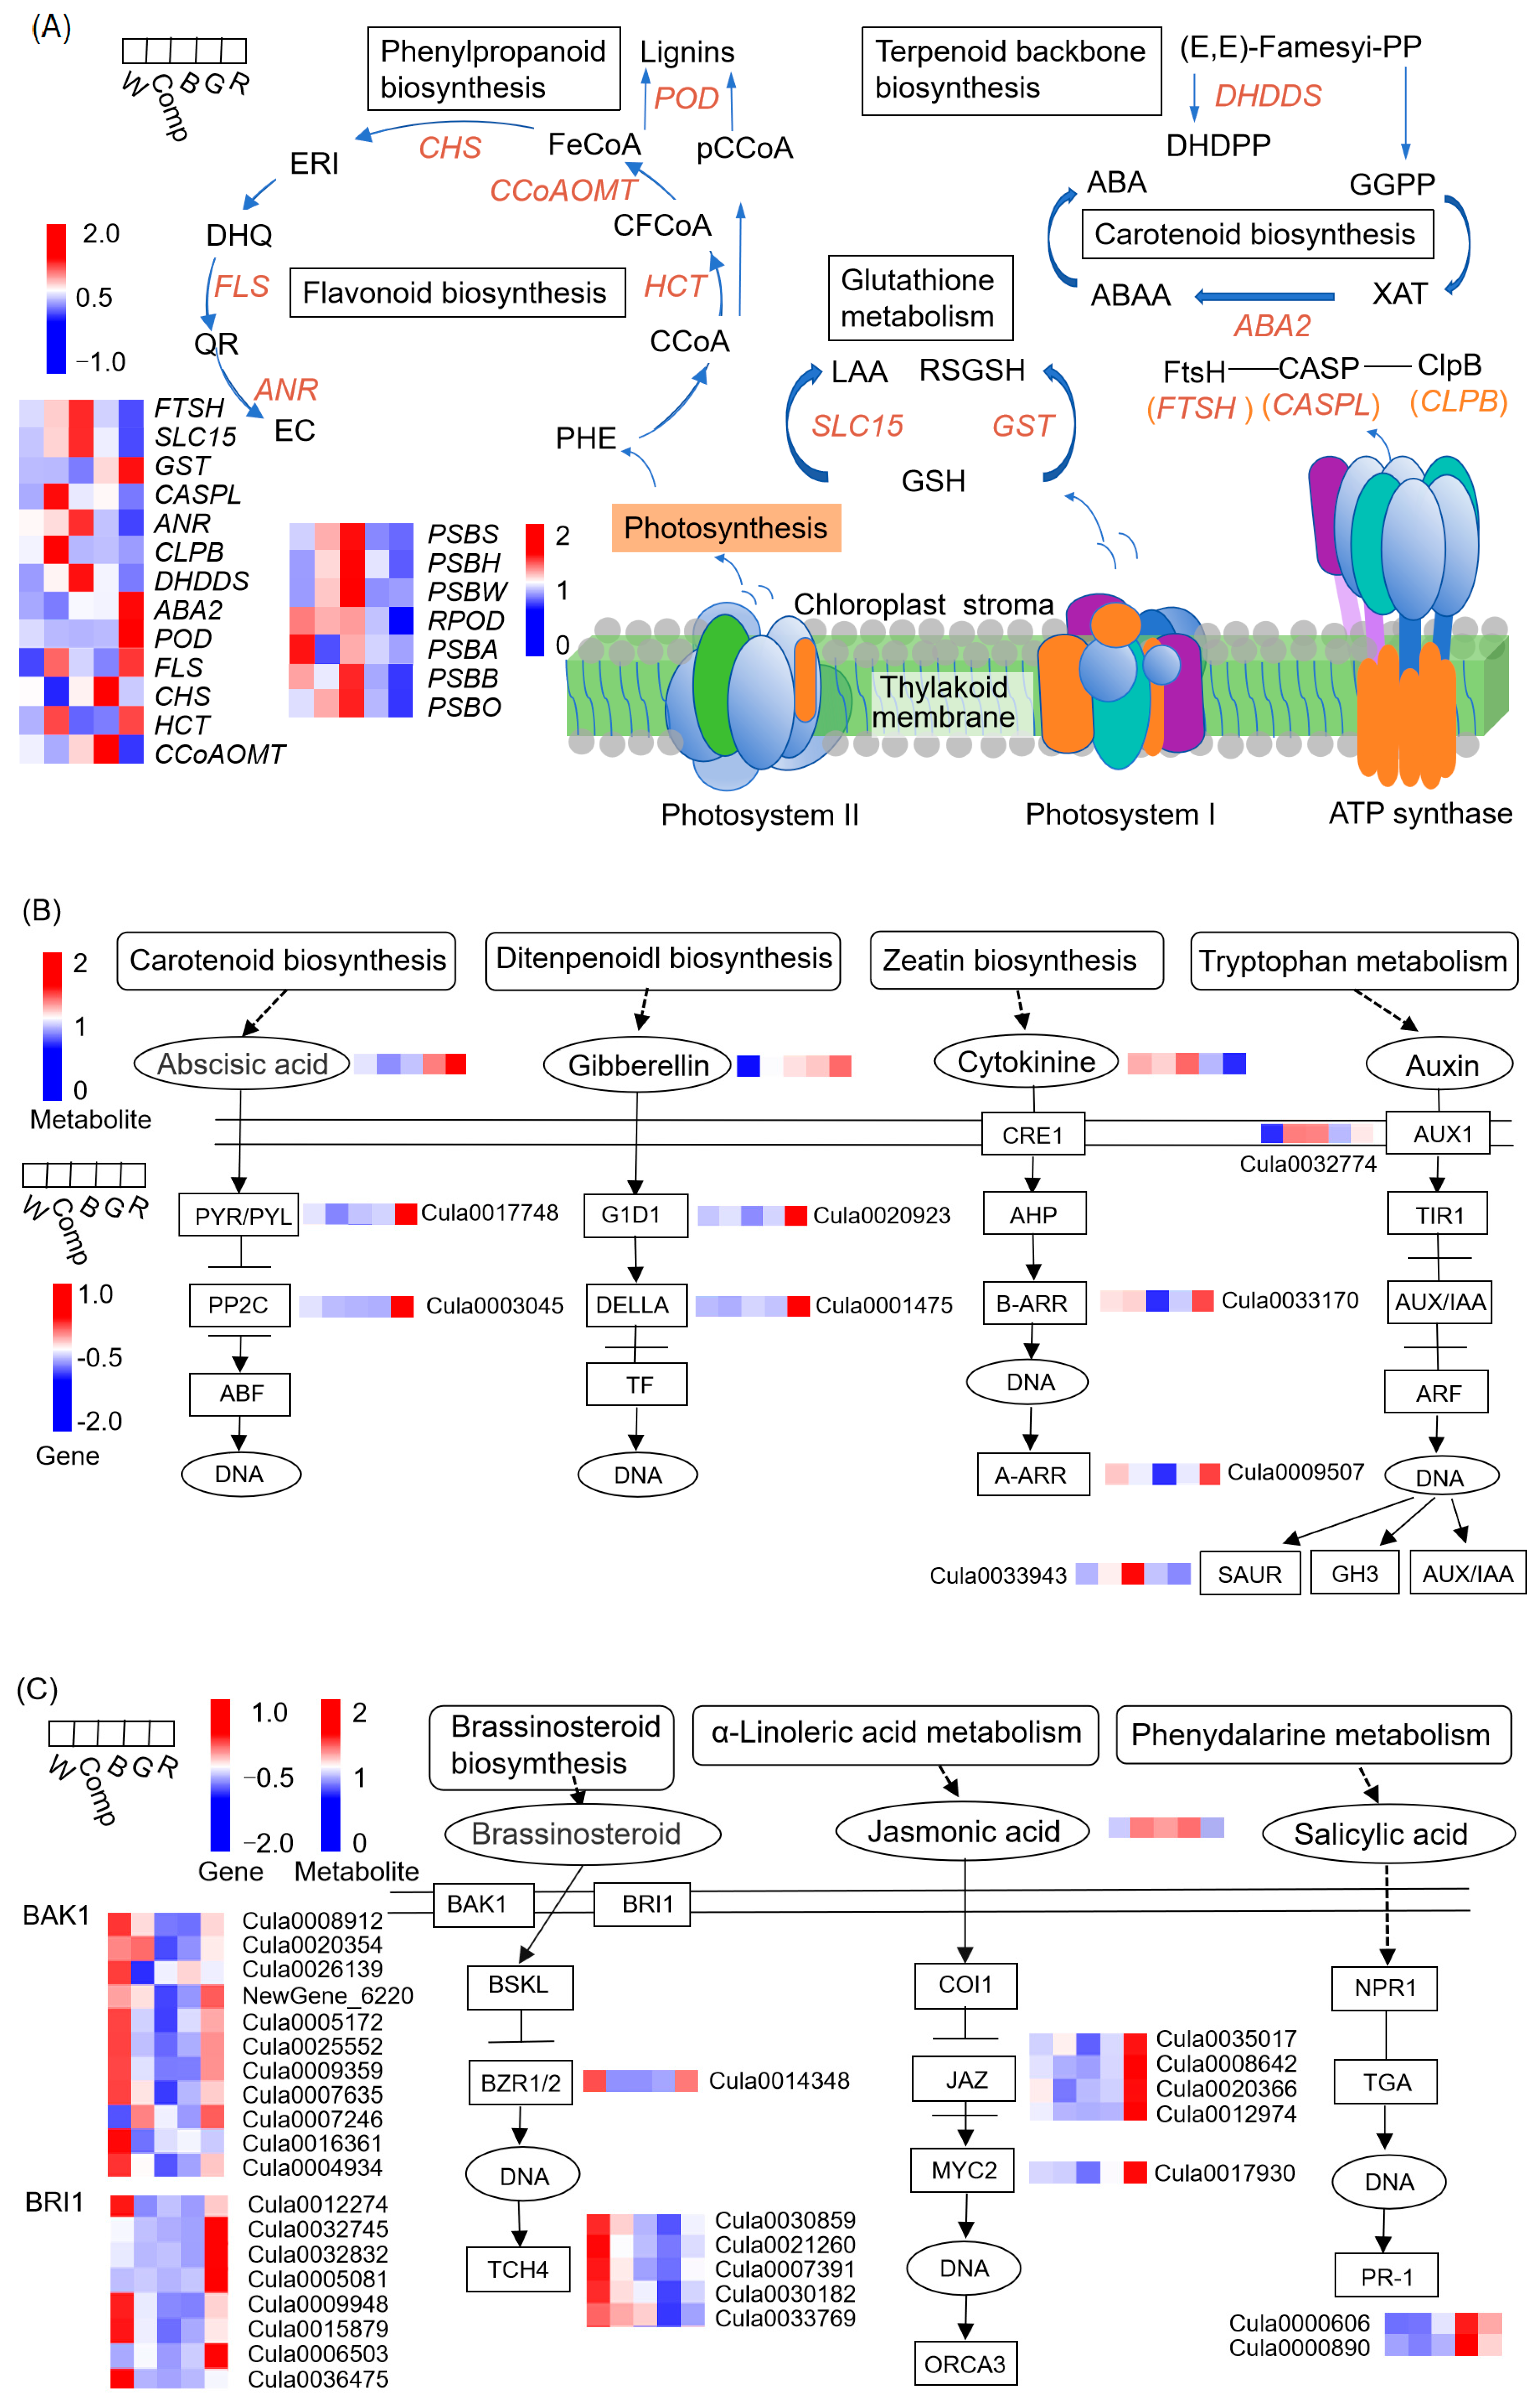
Figure 8.
qRT–PCR validation of transcriptome data for 9 selected genes. The blue bar represents FPKM values in transcriptome data and the red polylines represent the relative expression level of qRT–PCR. The values of R2 were the squares of Pearson correlation coefficients which were obtained by comparing the relative expression level of qRT–PCR and FPKM value in transcriptome data.
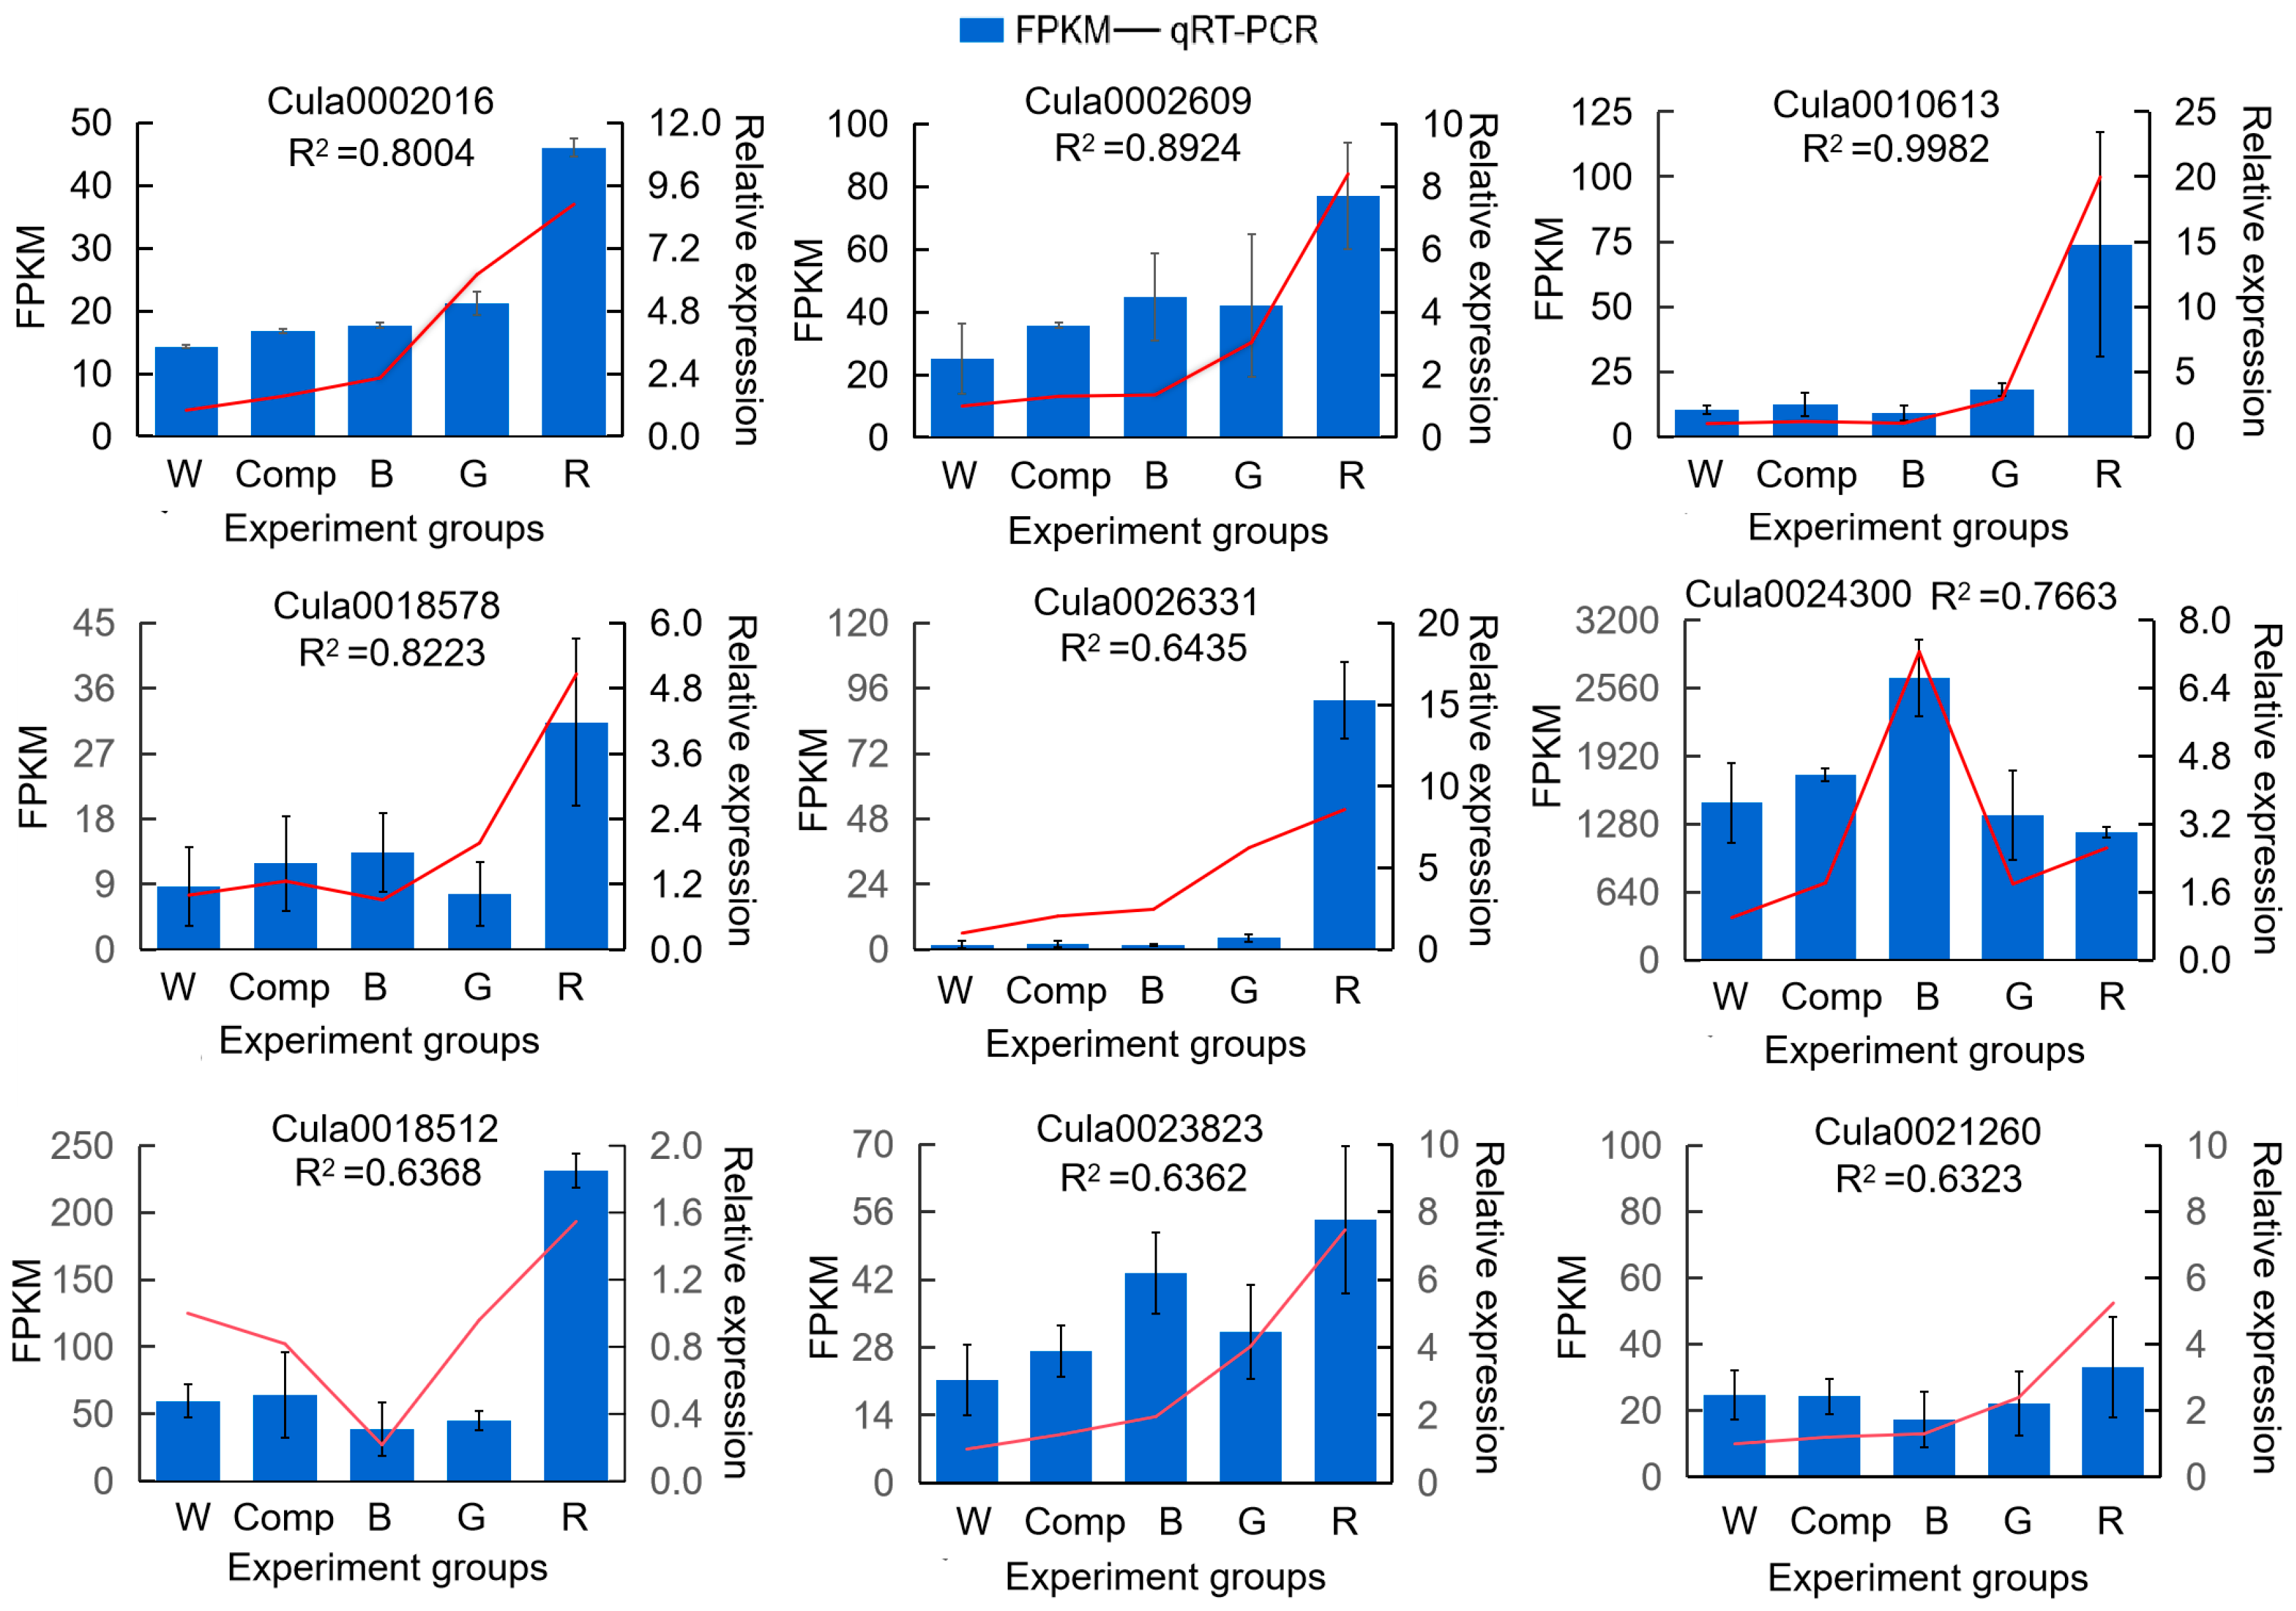

Table 1.
Light quality treatments in the propagation experiment of tissue-cultured Chinese fir seedlings.
Table 1.
Light quality treatments in the propagation experiment of tissue-cultured Chinese fir seedlings.
| Treatment |
Light quality |
Abbreviation |
Peak wavelength (nm) |
Half wave width (nm) | Light intensity (μmol m−2 s−1) |
|---|---|---|---|---|---|
| Tr1 | Composite | Comp | 450(B),532(G),660(R) | 20(B),30(G),20(R) | 20(B)+2(G)+30(R) |
| Tr2 | Blue | B | 450 | 20 | 52 |
| Tr3 | Green | G | 532 | 30 | 52 |
| Tr4 | Red | R | 660 | 20 | 52 |
| Control | White | W | - | - | 52 |
Table 2.
Proliferation coefficient and growth indicators of adventitious shoots of tissue-cultured Chinese fir seedlings under different light qualities.
Table 2.
Proliferation coefficient and growth indicators of adventitious shoots of tissue-cultured Chinese fir seedlings under different light qualities.
| Treatment | Light quality |
Proliferation coefficient |
Shoot height /cm |
Leaf area /mm2 |
Fresh weight /mg |
Dry weight /mg |
Dry matter ratio/% | |
|---|---|---|---|---|---|---|---|---|
| Tr1 | Comp | 3.68±0.12a | 2.91±0.20ab | 7.84±0.40b | 194±14a | 20.1±1.0a | 10.3±0.2b | |
| Tr2 | B | 3.85±0.17a | 2.53±0.20b | 7.27±0.42b | 152±13b | 18.1±1.5a | 11.8±0a | |
| Tr3 | G | 2.12±0.10c | 2.97±0.17ab | 5.14±0.23c | 127±12c | 9.9±1.1b | 7.9±0.2e | |
| Tr4 | R | 1.74±0.10c | 3.03±0.40a | 9.02±0.47a | 123±14c | 10.9±1.5b | 8.9±0.4d | |
| Control | W | 2.85±0.18b | 2.61±0.18ab | 7.12±0.41b | 116±12c | 10.8±1.2b | 9.5±0.1c | |
| F value | 32.366 | 2.473 | 38.142 | 19.420 | 39.571 | 150.312 | ||
| p-value | 0.0001 | 0.1119 | 0.0001 | 0.0001 | 0.0001 | 0.0001 | ||
Note: Different letters represent significant differences between means (p < 0.05).
Disclaimer/Publisher’s Note: The statements, opinions and data contained in all publications are solely those of the individual author(s) and contributor(s) and not of MDPI and/or the editor(s). MDPI and/or the editor(s) disclaim responsibility for any injury to people or property resulting from any ideas, methods, instructions or products referred to in the content. |
© 2025 by the authors. Licensee MDPI, Basel, Switzerland. This article is an open access article distributed under the terms and conditions of the Creative Commons Attribution (CC BY) license (http://creativecommons.org/licenses/by/4.0/).
Copyright: This open access article is published under a Creative Commons CC BY 4.0 license, which permit the free download, distribution, and reuse, provided that the author and preprint are cited in any reuse.


