
Submitted:
23 January 2025
Posted:
23 January 2025
You are already at the latest version
Abstract
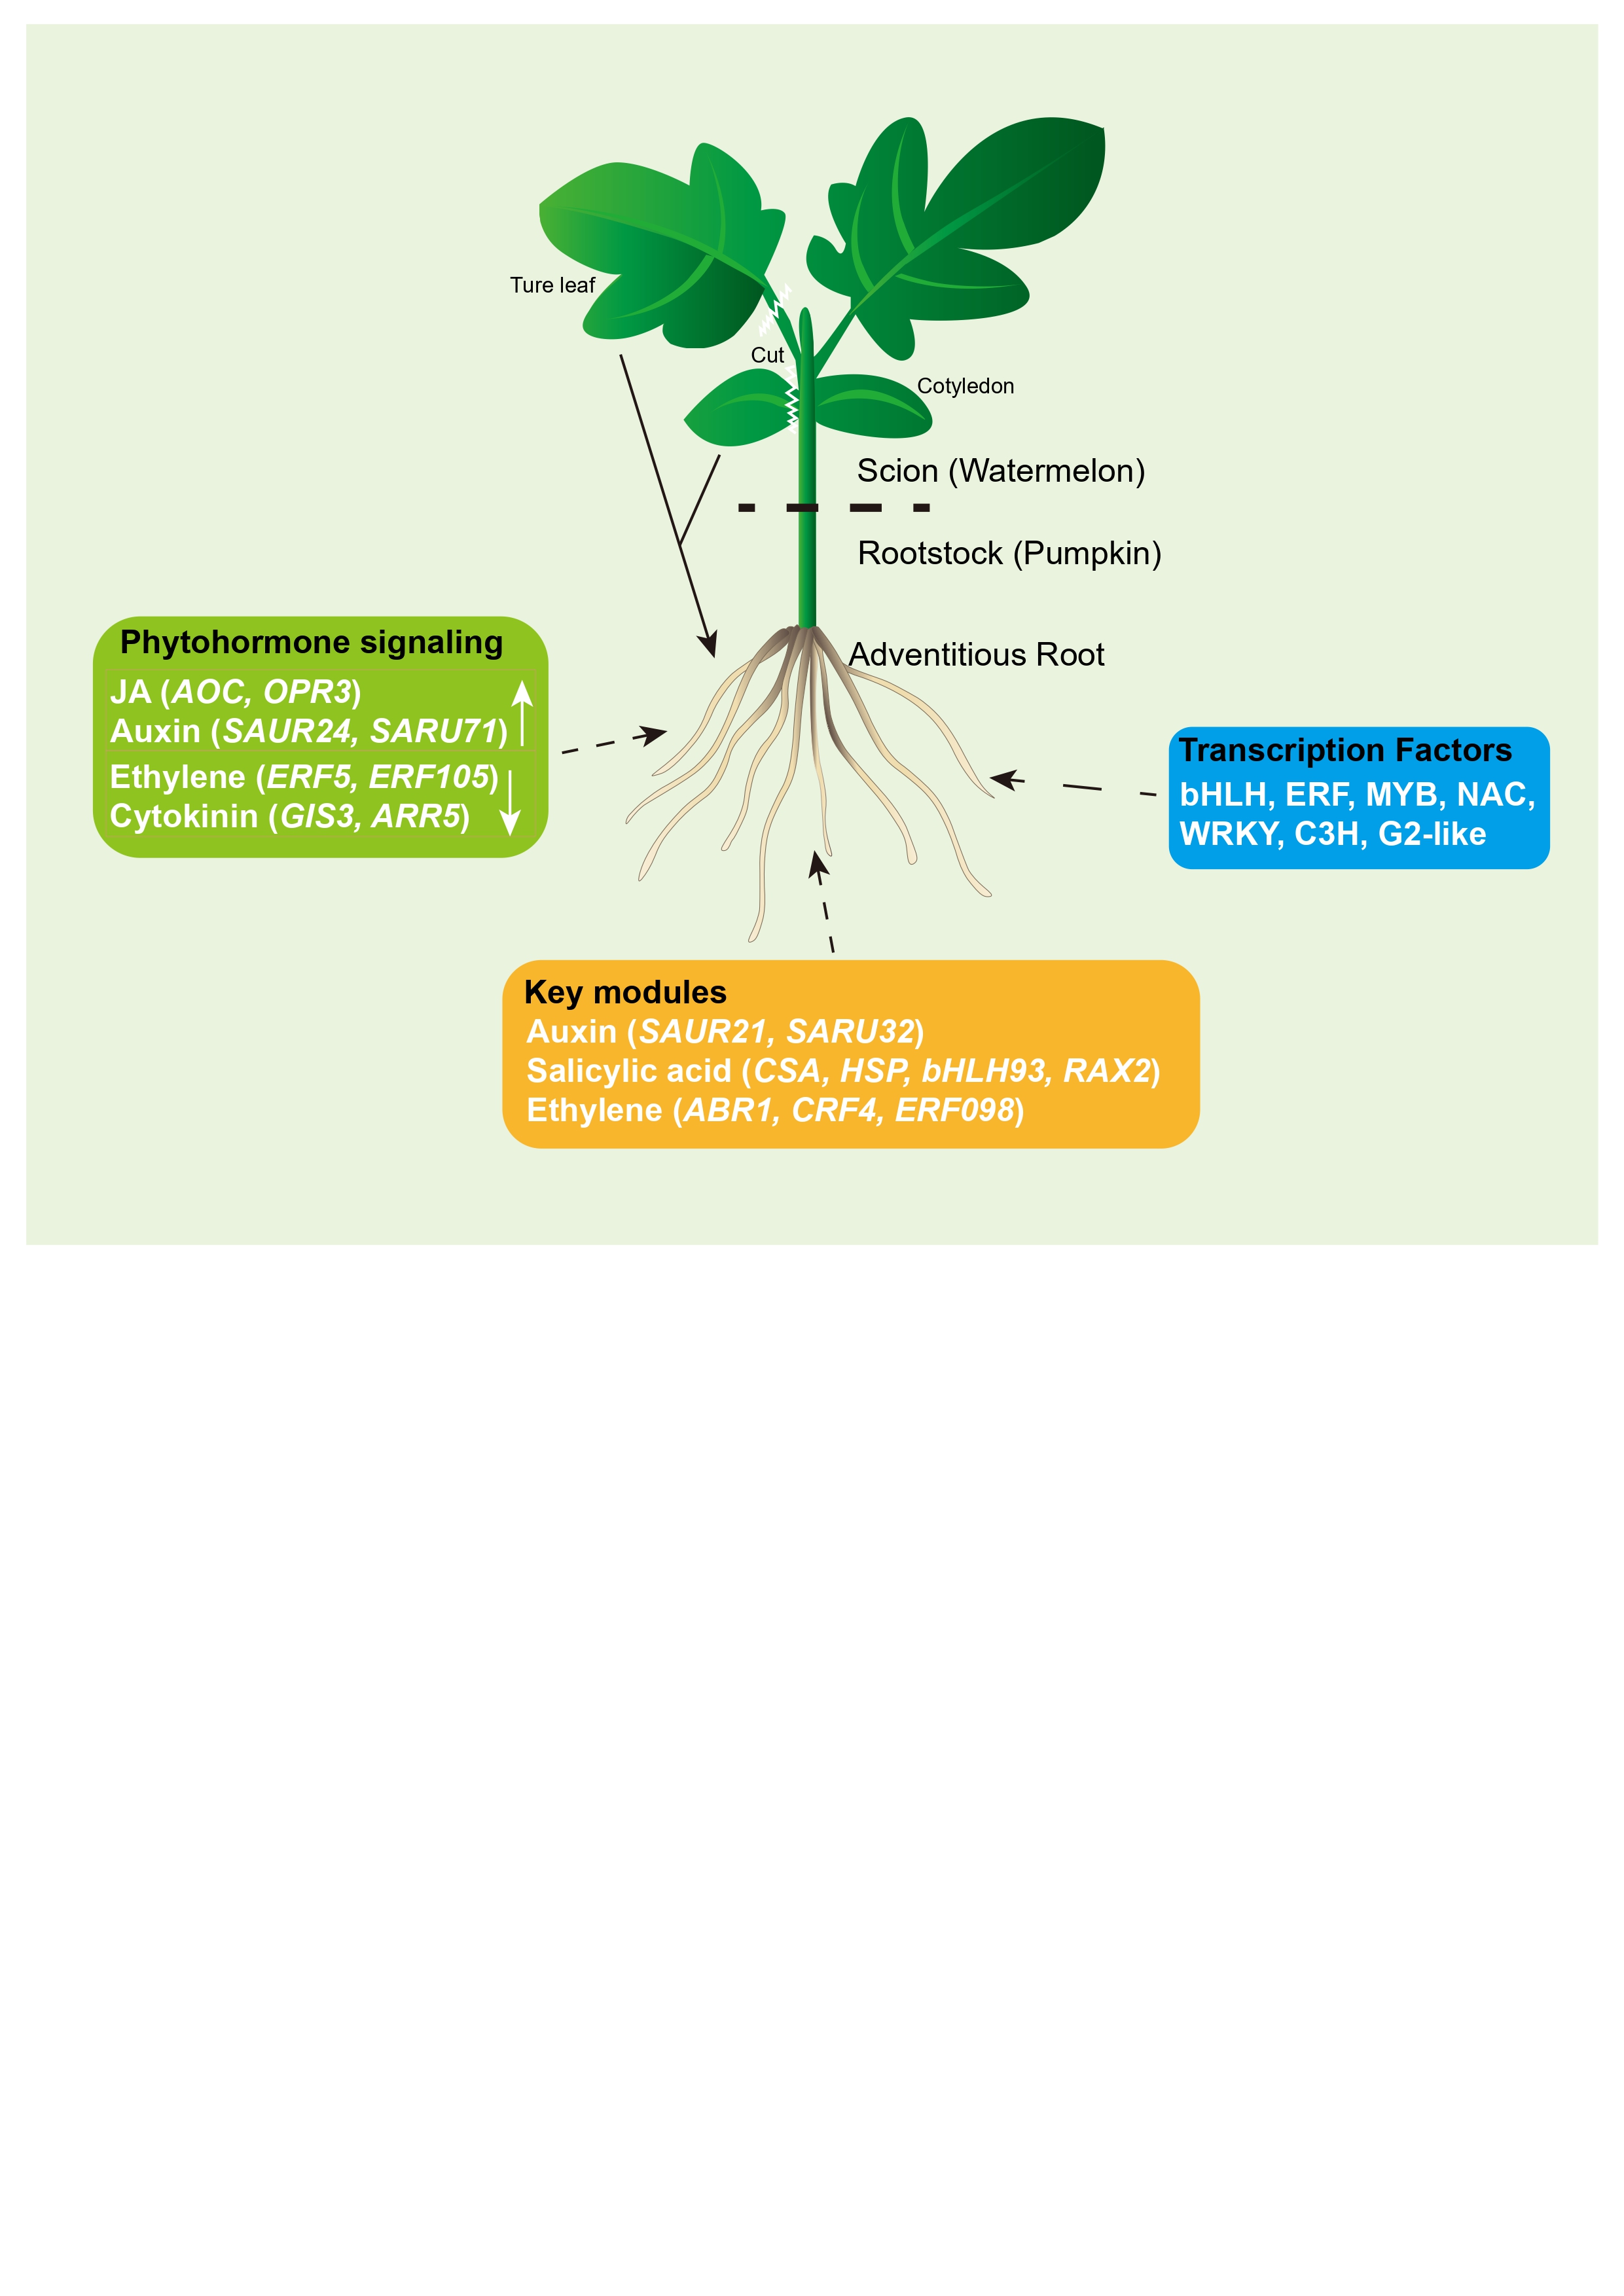
Adventitious roots (ARs) are crucial for grafted seedlings, playing vital roles in nutrient absorption, stress resistance, and grafting efficacy. However, how scions regulate endogenous hormones to influence AR formation remains poorly understood. In this study, we constructed watermelon seedlings (WP) using “HXX” as the scion and “Tie Zhen No. 3” as the rootstock. Removing scion cotyledons (WP-1) significantly promoted AR development, while removing true leaves (WP-2) had minimal effect. Simultaneous removal of both (WP-3) increased endogenous levels of IAA (Indole-3-Acetic Acid), abscisic acid (ABA), and jasmonic acid (JA). Transcriptome sequencing revealed that differentially expressed genes (DEGs) are enriched in various hormone signaling pathways. On the fourth day, when the number of differential genes was the highest, the DEGs significantly expressed in all three treatment groups were enriched in the activation signaling pathways and responses of JA, auxin, ethylene, and cytokinins. Transcription factors such as bHLH, ERF, MYB, and NAC were significantly expressed during the development of ARs, playing a key regulatory role. Kyoto Encyclopedia of Genes and Genomes (KEGG) analysis identified 82 DEGs across five hormone signal transduction pathways. Weighted gene co-expression network analysis (WGCNA) identified modules positively correlated with AR hormones, highlighting hub genes such as ethylene transcription factors (CRF4, ABR1, ERF054, ERF098), auxin response factors (SAUR21, SAUR32), and other regulators (CSA, HSP, bHLH93, ZAT5, ZAT13, NAC, MYB, C3H). These findings provide molecular insights into how scions regulate AR development through hormones, offering a foundation for improving watermelon grafting practices.
Keywords:
adventitious root
; watermelon
; transcriptome
; phytohormone
; WGCNA
1. Introduction
Grafting technology is an important production measure to overcome continuous cropping obstacles and soil-borne diseases, and to increase yield in current watermelon production, while selecting suitable rootstocks and effective grafting methods is the foundation for cultivating strong watermelon seedlings [1]. Pumpkin remains the best rootstock for watermelon grafting. Through grafting, the root systems of cucurbit plants are altered, with the root vitality of the rootstock significantly enhanced, leading to greatly improved water and nutrient absorption capabilities. The plants significantly increase photosynthetic efficiency by enhancing the supply of water and nutrients, while the antioxidant defense system of the plants is further improved, and their long-distance transport capacity is also greatly enhanced [2]. Double-root-cut grafting is a method that involves cutting off the root system of the rootstock after grafting and re-embedding the grafted seedling into the substrate to induce new root formation. The development of adventitious roots (ARs) from the rootstock is similar to the root formation process of cuttings. [3,4]. Therefore, it is extremely important to conduct in-depth research on the formation of ARs in the root systems of double-root-cut grafting rootstocks and the factors affecting the subsequent growth and development of these ARs.
Roots are a crucial organ system in grafted plants, responsible for obtaining water and nutrients from the rhizosphere environment and transporting nutrients necessary for promoting graft union. However, there is very little research on the formation of AR in the rootstocks of double-root-grafted seedlings. ARs are roots formed from parts such as the stem, leaves, or hypocotyl of the plant, or roots that grow from the callus of excised tissues or the lower ends of stem segments. The ARs of plants serve the same functions as the primary and lateral roots, absorbing nutrients and water for the wound healing of double root grafted seedlings [5]. AR development may be influenced by various external environmental factors, especially damage, light, gravity, and internal plant hormones [6,7]. Plant hormones are the main signaling molecules that regulate the formation of ARs, and their content in plant metabolic products is very low. They can be transported from their synthesis sites to other parts to exert regulatory effects. For example, hormones related to plant growth, such as auxin, ABA, JA, cytokinins, gibberellins, strigolactones (SLs), and ethylene, can promote or inhibit the formation of ARs in plants at different concentrations [8,9].
During AR formation, the levels of plant hormones and the genes and transcription factors associated with plant hormone signaling pathways play an indispensable role in the formation and development of AR, undergoing significant changes during this process [7,10]. Auxin is a growth regulator that plays a central role in the rooting process. Most other plant hormones need to interact with auxin to exert regulatory effects on the growth of ARs. Auxin can regulate the formation of ARs by inducing cell division, elongation, and differentiation [11]. Far-red light can significantly induce the expression of auxin response proteins (IAA11, IAA17, and AUX28), small auxin RNA genes (SAUR20 and SAUR50), and auxin efflux transporters (PIN3) in watermelon. It also significantly increases the expression of phytochrome-interacting factors (PIFs), such as PIF1, PIF3, and PIF7. These genes may work together under far-red light treatment to activate auxin-related pathways to regulate the formation of ARs [4]. The exogenous application of GR24 (SL) promotes the development of ARs in melons. The treatment of GR24 combined with IAA (auxin) further increases the number, length, and surface area of ARs. Transcriptome studies indicate that GR24 treatment affects the synthesis of auxin and SL, as well as plant hormone signaling pathways, leading to increased levels of auxin, GA, and zeatin, with an even greater increase under GR24+IAA treatment, while the content of ABA significantly decreases [12]. JA interacts with auxin and other plant hormones through complex crosstalk during the development of ARs. JA may enhance auxin synthesis during the induction phase, promoting AR formation. Low concentrations of methyl jasmonate promote AR development, while high concentrations inhibit it. JA can also interfere with ethylene signaling to promote the occurrence of auxin-induced ARs in the skotomorphogenesis of Arabidopsis seedlings [13,14]. Ethylene is considered a stimulator of the early induction and late formation of ARs. JA can interact with ethylene to regulate the occurrence and quantity of ARs. Ethylene can exhibit a promoting effect on the AR formation process under different conditions, which has been confirmed in crops such as tomato and cucumber. However, some studies indicate that ethylene only plays a negative role during the late AR induction phase and the formation of lateral roots, suggesting that ethylene has two completely opposite effects on AR development [15,16]. In addition to auxin, JA, and ethylene, ABA, salicylic acid, brassinosteroids, and other hormones can also play varying roles in the occurrence of ARs in plants. This indicates that there are complex interactions among various hormones during the formation of ARs, but auxin plays the most important role, as it can interact with almost all hormones. The mechanisms of how these hormones interact still require further research [17,18,19].
Transcriptome, microarray, and genomic sequencing, among other omics technologies, have been widely applied in recent years to study the formation of ARs in various species, including melon [4,12], poplar [20], and apple [21,22,23]. Most of these sequencing technologies aim to identify key genes that regulate the development and formation of ARs, as well as the important metabolic pathways involved, while the structural analysis of the underlying gene regulatory networks is relatively insufficient. Weighted gene co-expression network analysis (WGCNA) focuses on identifying co-expressed gene modules and exploring the relationship between gene networks and phenotypes of interest to researchers. It is based on high-throughput microarray or RNA-Seq technology, utilizing experimental data to explore the connections between gene networks and traits of interest at the transcriptional level [24,25]. This algorithm, as an efficient and accurate bioinformatics method for biological data mining, can effectively combine with transcriptomics, providing a powerful tool for the in-depth exploration of the molecular mechanisms by which endogenous hormones regulate the formation of ARs [26].
An increasing number of researchers have found that the interaction between scions and rootstocks affects the formation of ARs in grafted seedlings. In this study, the treatment of scion cotyledons and true leaves promoted the development of ARs and the increase in three endogenous hormone levels to varying degrees. Using transcriptomics, it was found that the significant expression of DEGs is enriched in various hormone-related biological processes, including auxin, jasmonic acid, ethylene, and cytokinins. KEGG pathways annotated multiple differential genes that are significantly expressed in different hormone signaling pathways. Further WGCNA identified key modules positively correlated with the three hormones, where the hub genes included several candidate genes related to auxin and ethylene, as well as various key transcription factors. These are important components that play regulatory roles in the development of ARs and are focal points for future attention. Taken together, in conjunction with previous research, this study will provide a molecular-level explanation for the issue of AR development in grafted seedlings being limited by hormonal regulation, contributing to improving the survival rate of grafted seedlings and promoting the efficient and sustainable development of the watermelon industry.
2. Results
2.1. Morphological Changes and Endogenous Hormone Response During AR Formation
The scion is a key part of the grafting process used to maintain the excellent traits of a variety, determining the genetic characteristics and economic value of the plant after grafting. The scion significantly affects various aspects such as the length of ARs, root surface area, and biomass, and it also inhibits the accumulation of sugars in the root system of the rootstock [27,28]. To explore the impact of the scion on the ARs of grafted seedlings, we constructed grafted watermelon seedlings (WP sample) using "HXX" as the scion and "Tie Zhen No. 3" as the rootstock, while performing treatments on the scion including the removal of cotyledons (WP-1 sample), the removal of true leaves (WP-2 sample), and the removal of both cotyledons and true leaves (WP-3 sample) (Figure 1A), followed by a statistical analysis of the physiological indicators of the grafted seedlings. The number and length of roots in the WP-1 sample consistently showed a significant advantage during the growth process, except on the sixth day, when it was slightly less than the WP sample (Figure 1B). In terms of both wet and dry weight, there was almost no difference among the four materials on the second and fourth days. However, on the sixth day, the weights of the WP-1 sample were significantly higher than the other three setups, with WP-3 and WP-2 following, and WP being the lightest (Figure 1B). Overall, the removal of cotyledons from the scion can effectively promote the growth and development of ARs, while the simultaneous removal of both cotyledons and true leaves has a lesser promoting effect on ARs, and true leaves have little impact on their growth. This indicates that there is an antagonistic relationship between cotyledons and true leaves, with cotyledons having a greater influence on the development of ARs than true leaves.
Plant hormones are signaling molecules that regulate the formation of ARs, playing a key regulatory role in their formation and development through various pathways, including affecting cell division, differentiation, enzyme activity, and the antioxidant system [29,30,31]. We measured the endogenous levels of three hormones in ARs: IAA, ABA, and JA. The IAA content was consistently higher in the WP-3 sample and remained relatively stable in WP-1, but fluctuated significantly in WP and WP-2 (Figure 2A). The ABA content in the WP and WP-3 samples gradually increased with the development of ARs, while it gradually decreased in WP-1 and remained basically unchanged in WP-2 (Figure 2B). The removal of either cotyledons or true leaves promoted an increase in JA content, and the simultaneous removal of both led to a rapid increase in content only on the sixth day. The JA content in the WP sample showed a trend of first decreasing and then increasing (Figure 2C). Therefore, cotyledons and true leaves play a regulatory role in the internal hormones of ARs, causing changes in hormone levels.
2.2. The Transcriptional Landscape During AR Formation
The scion leaves can affect the endogenous hormone levels. We subsequently explored the pathways and target genes related to hormone changes regulating AR development through transcriptome sequencing. A total of 36 samples were sequenced, yielding 1570.68 Gb of clean data, with the effective data volume for each sample ranging from 55.72 to 83.86 Gb, and the Q30 base distribution between 97.55% and 98.18%. The average GC content was 45.24% (Table S1). By aligning the reads to the reference genome, we obtained the genomic alignment status for each sample, with alignment rates ranging from 84.05% to 88.17% (Table S2). The PCA results showed that PC1 and PC2 explained 32.8% and 12.1% of the variation in gene expression among all of the samples at different days, respectively (Figure 3A). The correlation analysis indicated a strong correlation among the sample repetitions (Figure 3B).
After mapping the clean reads to the Cucurbita moschata genome, a total of 32,462 transcripts were finally obtained (Data S1). The results of the Gene Ontology (GO) analysis showed that these genes are significantly enriched in multiple biological processes such as transcription, protein phosphorylation, the auxin-activated signaling pathway, and signal transduction. Most genes are primarily concentrated in the cellular membranes, cytoplasm, nucleus, and intermembrane regions. Similarly, the molecular function results indicated associations with protein binding, transcription factor activity, protein kinase activity, and RNA enzyme activity (Figure 3C). The combined enrichment results reflect that the gene set performs key molecular activities at specific locations within the cell to drive fundamental biological processes. The enrichment in auxin-activated signaling pathways involves the binding of auxin to receptors on the cell membrane, indicating that our gene set participates in auxin-mediated responses under the conditions studied, triggering a series of downstream events that may involve transcriptional regulation and other enriched biological processes.
We identified several metabolic and signaling pathways significantly associated with the formation of ARs through KEGG pathway enrichment analysis. These pathways include starch and sucrose metabolism, pyruvate metabolism, glycerolipid and fatty acid metabolism, the biosynthesis of amino acids and ribose, mRNA surveillance, endocytosis, and the biosynthesis of secondary metabolites (Figure 3D). These processes collectively provide the necessary energy, molecular basis, and cellular mechanisms for the development of ARs. The metabolism of carbohydrates and fatty acids provides energy for cell division and growth, while the biosynthesis of amino acids and ribose ensures a sufficient supply of proteins and nucleic acids [32]. Additionally, mRNA surveillance and endocytosis play critical roles in cellular signal transduction and gene expression regulation, while secondary metabolites are involved in plant defense and adaptation to environmental changes [33,34]. In summary, these enriched pathways reveal the complex molecular and metabolic networks involved in the formation of ARs, emphasizing the importance of the coordinated activities of multiple biological processes in this developmental process.
2.3. Common Transcriptome Regulation in the AR Development Process
When comparing WP-1, WP-2, and WP-3 with WP on the second day, the three treatment materials had 1712, 1110, and 1097 DEGs, respectively. On the fourth day, the number of DEGs in the three groups was 1429, 1419, and 4288, making it the day with the highest number of DEGs among the three days. On the sixth day, the numbers of DEGs were 800, 899, and 2606, respectively (Figure 4A).
The highest number of DEGs was calculated on the fourth day, and the Venn diagram results showed that there were 587 common genes among the three groups (Figure 4B). Among these, 233 genes were significantly upregulated, and the GO enrichment analysis revealed that they were related to the JA biosynthetic process and response to auxin. The genes involved in the biochemical synthesis of JA include JA biosynthetic enzyme AOC (CmoCh04G029760, CmoCh15G010360, CmoCh15G002030) and 12-OXOPHYTODIENOATE REDUCTASE 3-like (OPRIII) (CmoCh10G007910). The transcription factors responding to auxin include MYB306 (CmoCh01G008230, CmoCh11G001610), SAUR24 (CmoCh20G008010), and SAUR71 (CmoCh20G002990) (Figure S1). Similarly, 139 genes that were significantly downregulated were enriched in pathways such as the ethylene-activated signaling pathway, cytokinin-activated signaling pathway, and hormone-mediated signaling pathway (Figure 4C, D). The commonly downregulated genes included the ethylene response factors ERF5 (CmoCh06G008250, CmoCh16G011680) and ERF105 (CmoCh15G014220, CmoCh02G009910), zinc finger proteins related to the cytokinin-activated signaling pathway (CmoCh18G010170, CmoCh04G016710), and signal regulatory factor ARR5 (CmoCh04G016750, CmoCh15G010550), as well as genes involved in hormone-mediated signaling pathways (CmoCh04G002030, CmoCh17G001200, CmoCh07G007890) (Figure S1) (Data S2).
On the second day, 30 common upregulated genes and 68 common downregulated genes were significantly enriched in the regulation of DNA-templated transcription, proteolysis, cell differentiation, and defense response (Figure S2A, B). The GO analysis results on the sixth day showed that 85 commonly upregulated genes were significantly enriched in the cytokinin-activated signaling pathway (CmoCh15G008650, CmoCh04G022980, CmoCh11G002390), while 26 commonly downregulated genes were enriched in the ethylene-activated signaling pathway (CmoCh08G002930, CmoCh07G002060) (Figure S1 and S2C, D) (Data S2).
Transcription factors regulate the formation and development of ARs through various mechanisms, directly or indirectly, including influencing the direction of cell division, auxin signal transduction, and interactions with other plant hormones [5,7]. We counted the transcription factors that were significantly expressed in the development of ARs over these three days. On the second day, NAC was the most upregulated transcription factor, followed by WRKY and Dof (Figure S3A), while MYB, NAC, and GATA were ranked as the top three most downregulated transcription factors (Figure S3B). The number of transcription factors on the fourth day was the highest among the three days, with bHLH, ERF, MYB, and NAC being the most prominent (Figure S3C, D). Similarly, ERF, bHLH, and NAC accounted for the majority of transcription factors on the sixth day (Figure S3E, F). In summary, the expression changes in these transcription factors at different time points reflect the dynamic regulatory network during the formation of ARs, revealing their key roles at different stages.
2.4. Activated Phytohormone Signaling Pathways During AR Formation
Both the GO enrichment analysis of common differential genes and the expression distribution of transcription factors indicate that plant hormones play an important role in the formation of ARs. We thus identified the expression levels of DEGs annotated to key components of the plant hormone signaling pathway (ko04075), identifying a total of 82 common hormone-related DEGs, involving five pathways including auxin, ABA, JA, cytokinins, and ethylene. The DEGs related to the auxin pathway accounted for the largest proportion, totaling 35. Compared to WP, most genes related to auxin transporter AUX1, auxin receptor TIR1 protein, transcriptional repressor Aux/IAA protein, transcription factor ARF, and genes encoding auxin amide synthetase GH3 were downregulated in WP-1, WP-2, and WP-3. SAUR, as a late response gene, may occur in transcription and post-translational protein expression. Except for a few genes, most genes involved in SAUR were significantly upregulated (Figure 5A). In the ABA signaling pathway, 16 genes were annotated, among which the related genes of PYR/PYL receptors were significantly upregulated in WP-3, and the genes of SnRK2 kinases were significantly expressed, while the genes annotated to PP2C phosphatases and ABF transcription factors were mostly downregulated across the three treatment groups (Figure 5B). Jasmonic acid synthase JAR1 and transcriptional repressor JAZ were significantly upregulated, while MYC2, as a transcriptional activator, showed both upregulation and downregulation (Figure 5C). In cytokinins, the differential genes of histidine kinase CRE1, histidine phosphotransfer protein AHP, and response regulator ARR were mostly significantly downregulated (Figure 5D). In the ethylene signaling pathway, the related genes of ethylene F-BOX EBF1/2 and transcription factors ERF1/2 were significantly upregulated, while the related genes of ethylene transcription factor EIN3 were downregulated (Figure 5E).
2.5. Key Modules and Candidate Genes Associated with AR Formation
To further explore the relationship between hormone levels and the regulatory network of candidate genes during AR development, we performed WGCNA based on the measured endogenous hormone content and the transcription levels of genes included in the four samples on the fourth day [35]. Genes with similar expression patterns were divided into 24 modules, each assigned a different color (Figure 6A). There were significant differences in the number of DEGs across different modules. The turquoise module contained the most DEGs, totaling 3659, followed by the blue (1905) and brown modules (1162). In contrast, the dark turquoise, dark green, and dark red modules had the lowest DEG counts, with 40, 48, and 50, respectively (Figure 6C). The Module-Trait Relationships results showed that seven identified modules were significantly correlated with the content of three hormones. The blue module was significantly positively correlated with IAA and JA content, the greenyellow module was significantly positively correlated with IAA, and the cyan module was significantly positively correlated with ABA (Figure 6B).
Based on the three central modules mentioned above, a co-expression network of DEGs within these modules was constructed by selecting the top 30 genes with the highest correlation coefficients to further explore the central genes that play a core regulatory role. By using Cytoscape to create and visualize the gene network [35], key regulatory genes of the blue, greenyellow, and cyan modules were further identified. In this network, each node represents a gene, and the edges connecting them indicate their co-expression correlation. The central genes with the closest connections in this network may be key regulatory genes, selected based on high weights and high values from the core genes of the modules (Data S3). In the blue module, ethylene-related transcription factors ERF (CRF4, ABR1) and salicylic acid-binding protein 2 were identified, along with transcription factors CSA, HSP, bHLH93, and RAX2 (Figure 7A). The auxin response factor SAUR32 and the ethylene transcription factor TINY were identified in the greenyellow module (Figure 7B). In the cyan module, which is positively correlated with ABA, the ethylene transcription factor ERF098 and zinc finger binding proteins ZAT5 and ZAT12 were identified (Figure 7C).
We also performed WGCNA on the data from the second and sixth days. The tan and darkgrey modules were the two modules with the highest and most significant correlations with ABA and JA on the second day, respectively (Figure S4A, B). In the tan module, the transcription factors C3H and MYB52 were identified (Figure S4C), while the darkgrey module identified WRKY and the ethylene transcription factor ERF054 (Figure S4D). The results from the sixth day showed that the salmon module was significantly positively correlated with ABA, and the brown module was significantly positively correlated with JA (Figure S5A, B). The auxin response factor SAUR21, transcription factor MYB, and G2-like were identified in the candidate gene regulatory network of the salmon module (Figure S5C). In the brown module, the auxin response factor SAUR32, ethylene transcription factor ABR1, and transcription factor NAC were identified (Figure S5D).
2.6. Confirmation of Transcriptome Data Through qRT-PCR
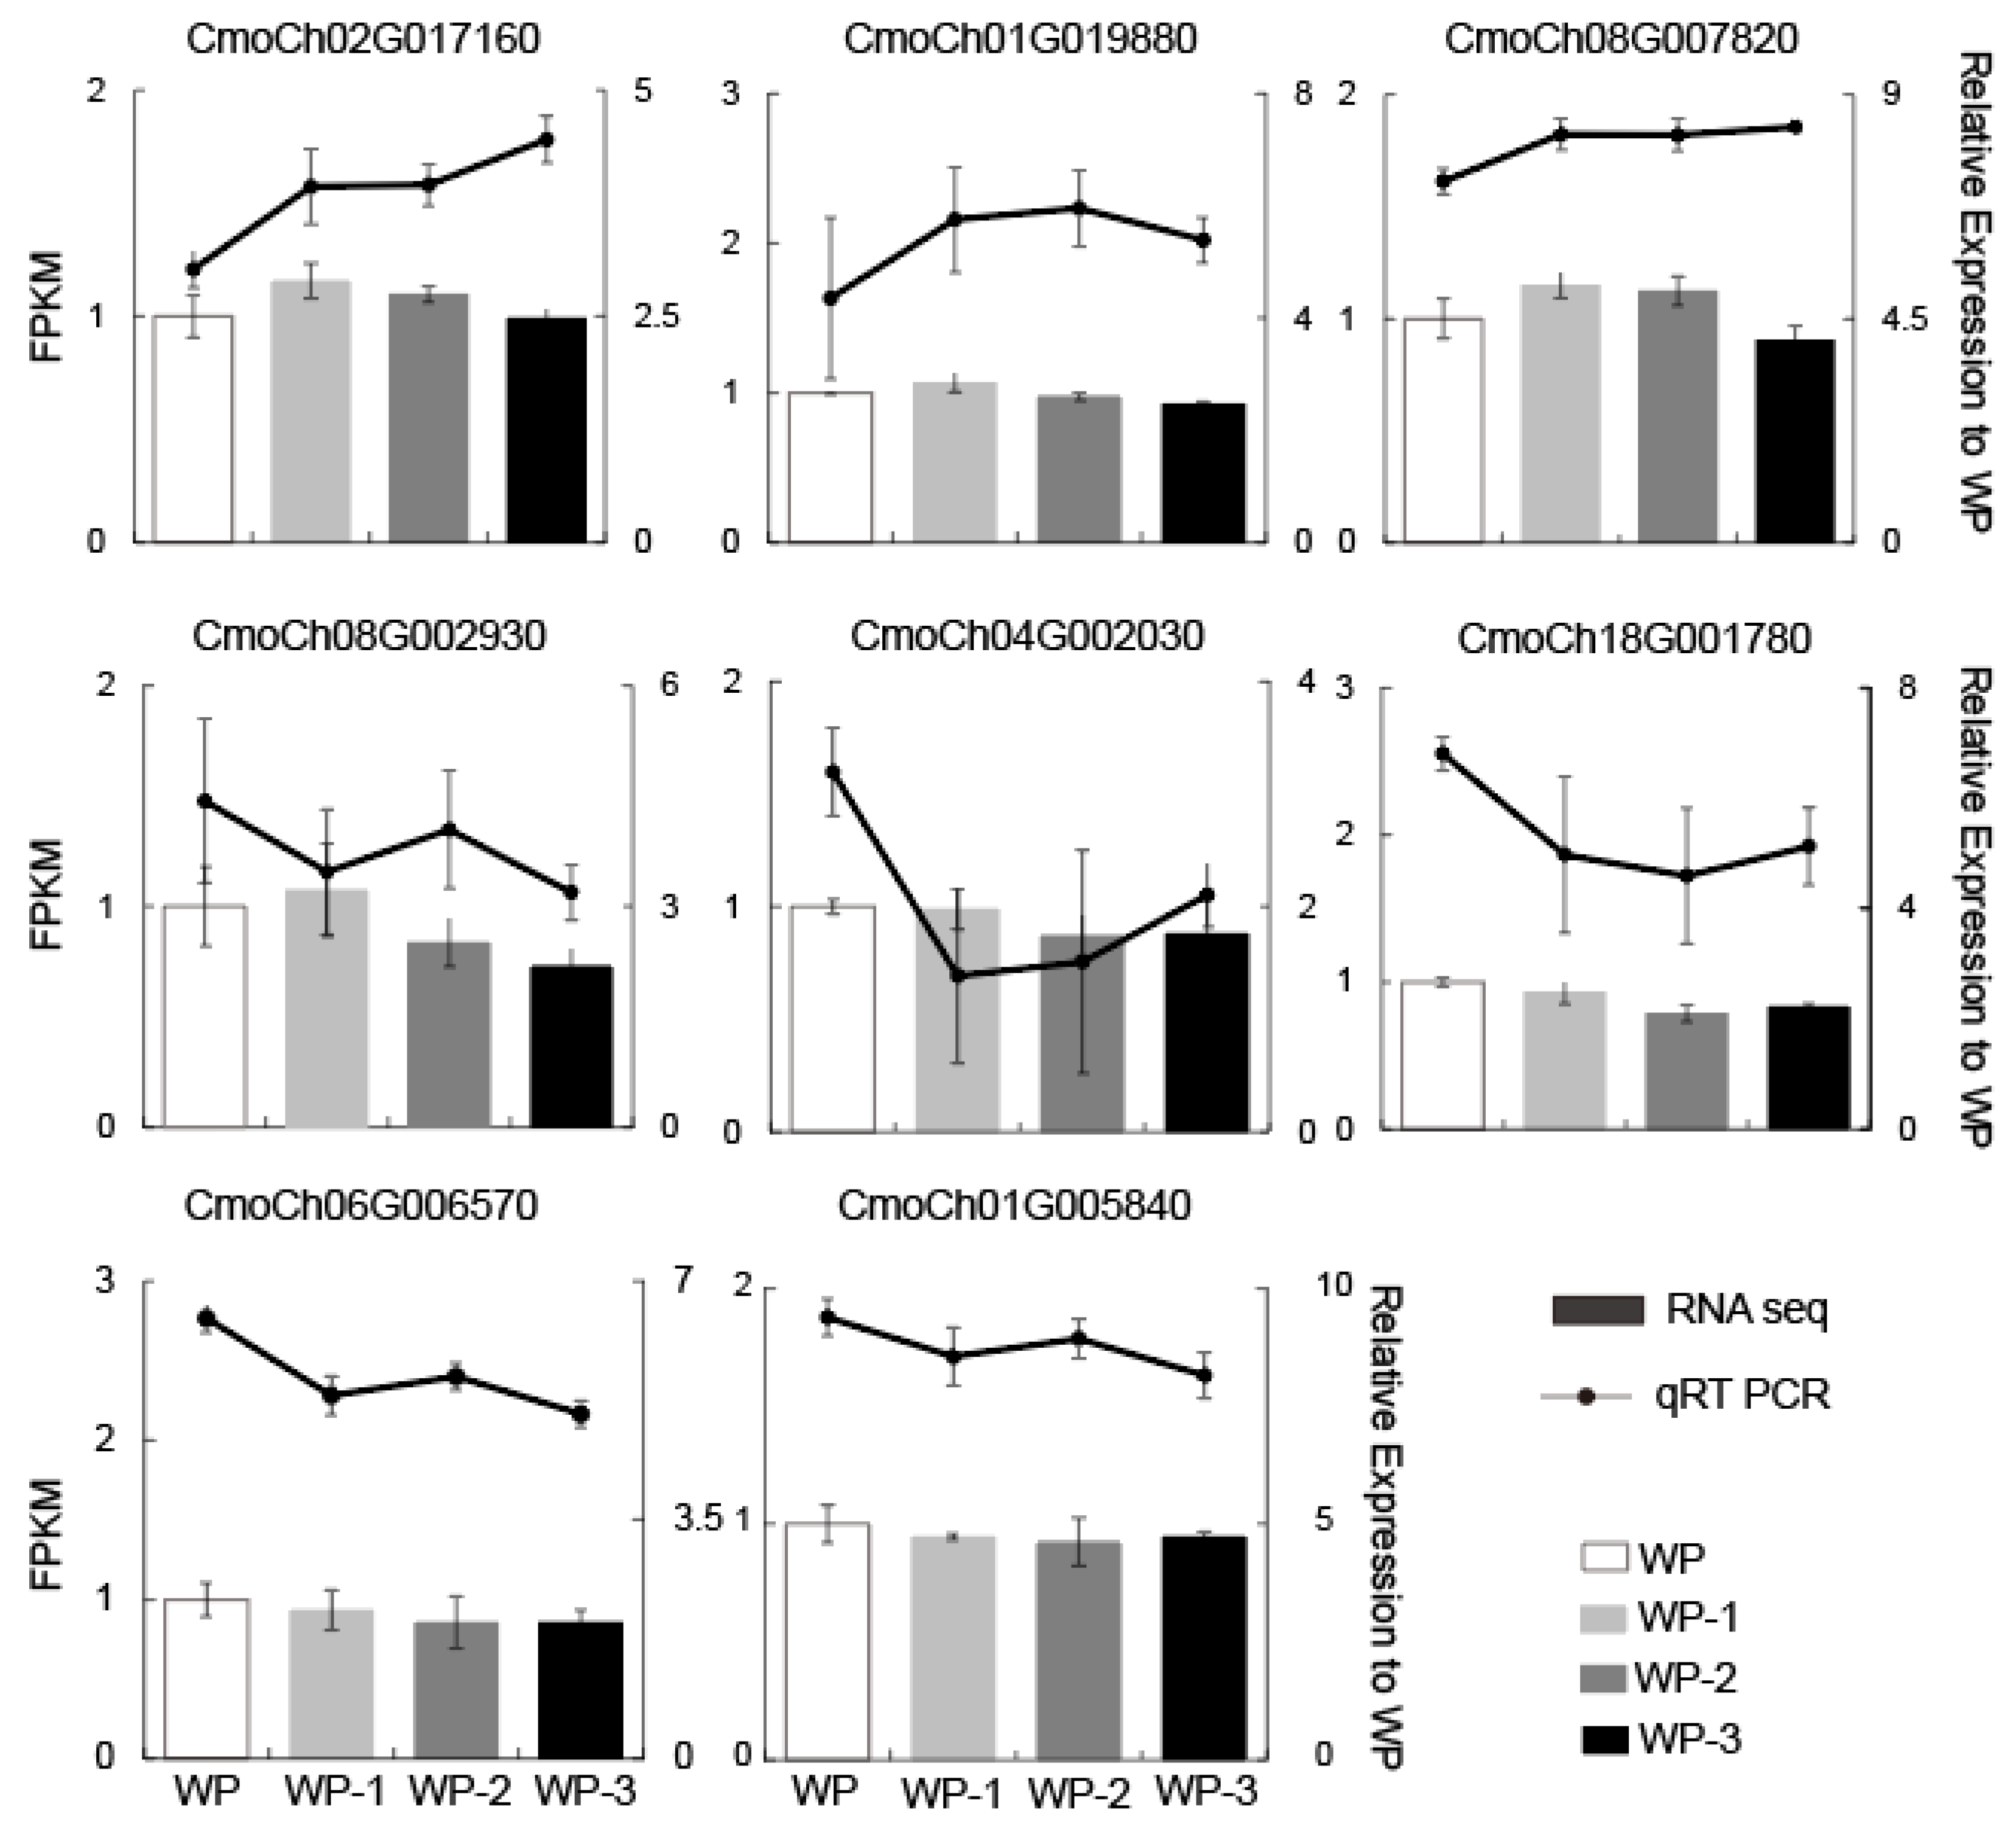
To verify the accuracy of the transcriptome data, we conducted validation through quantitative real-time PCR. From numerous DEGs, we selected eight key genes as objects for validation. These included hormone-related genes, ERFs (CmoCh 02G017160, CmoCh08G002930), jasmonate (CmoCh01G019880, CmoCh08G007820), the hormone-mediated signaling pathway (CmoCh04G002030), and salicylic acid (CmoCh18G001780), as well as the key transcription factor bHLH (CmoCh06G006570) and mitogen-activated protein kinase (CmoCh01G005840) (Figure 8). The results of the qRT-PCR showed that the expression of these selected target genes varied to different extents in different materials, but the expression trends were consistent with the transcriptome data, thus verifying the accuracy of the transcriptome data.
3. Discussion
3.1. Unveiling the Role of Scions in the Coordinated Regulation of AR Development by Phytohormones
Pumpkin is widely regarded as the best rootstock for watermelon grafting, primarily because its developed root system can effectively absorb moisture and nutrients. After grafting, the yield and fruit quality of watermelon typically improve significantly, and the good compatibility between pumpkin and watermelon results in a high success rate for grafting. Combining previous research findings with our observations in production practices, it was found that when using "HXX" watermelon as the scion for grafting, the AR development of the pumpkin rootstock's lower hypocotyl is significantly influenced. However, compared to the research on the effects of rootstock on the scion, there is relatively little scientific exploration on how the scion affects the root system of the rootstock, with records only found for certain specific crops. Studies on grafted seedlings of apple [36] and grape [37] have shown that the scion can significantly influence the morphological characteristics of the rootstock's root system. Our research found that removing cotyledons significantly promoted the development of ARs, including an increase in both the number and length of roots. Similarly, the dry weight and wet weight also increased to varying degrees. However, the removal of true leaves did not cause this phenomenon; instead, it resulted in a weaker effect compared to the complete removal of both cotyledons and true leaves (Figure 1). This may also indirectly indicate that true leaves have a partially opposite role compared to cotyledons in regulating the growth of ARs in grafted seedlings, suggesting that the two may have an antagonistic relationship. Despite these findings, current research results are primarily limited to phenotypic and physiological levels, and our understanding of how the scion comprehensively regulates the molecular mechanisms of root systems remains limited.
Cotyledons play a crucial role in the plant life cycle; they not only store nutrients to provide energy for seed germination, but also produce food through photosynthesis during the seedling stage. Additionally, cotyledons are involved in gas exchange and water regulation, helping plants absorb carbon dioxide, release oxygen, and maintain water balance. In monocotyledonous plants, cotyledons also perform respiratory functions [38]. Cotyledons and true leaves play important roles in regulating plant hormones such as IAA, ABA, and JA. It is possible that plants increase IAA synthesis to compensate for the lack of photosynthesis and auxin signaling, which leads to an increase in auxin levels in WP-3 (Figure 2A). When either cotyledons or true leaves are absent, the changes in auxin may be related to the regulatory effects of cotyledons and true leaves on IAA synthesis and transport, as well as their complex interactions within the plant hormone signaling network. The ABA content gradually increased in the WP and WP-3 samples with the development of ARs, while it decreased in WP-1, suggesting that the presence of cotyledons in the scion is essential for ABA synthesis and that the regulatory effect of true leaves on ABA is less pronounced than that of cotyledons (Figure 2B). The removal of either cotyledons or true leaves promotes an increase in JA levels, which may be related to the plant's response to damage, as the removal of leaves could be perceived as a form of injury, triggering an increase in JA. Notably, in WP, JA levels show a trend of initially decreasing and then increasing, which may be related to the changing demand for JA during the development of ARs; lower levels of JA may be needed initially to promote growth, while the later increased JA levels may be associated with enhancing the plant's defense capabilities (Figure 2C). These results indicate that cotyledons and true leaves influence plant growth and development, as well as stress responses, by affecting the synthesis, transport, and signaling of hormones, further confirming their importance in the plant hormone regulatory network.
Auxins induce cell division and differentiation, and are involved in the regulation of gene expression related to growth and development. They are primarily responsible for inducing the formation of root primordia in the generation of ARs in plants [29]. When plants form ARs, they accumulate auxin and promote cell division through auxin, thereby facilitating the occurrence of ARs. As the most important hormone regulating the formation of ARs, the overall analysis of the transcriptome data shows its relation to auxin activation signaling pathways (Figure 3C). Auxins are central growth regulators in the rooting process, and most other plant hormones need to interact with auxins to exert some regulatory effects on the growth of ARs [39]. The synthesis of JA and the response to auxin were significantly upregulated in all three treatment groups, while cytokinins and ethylene showed the opposite trend (Figure 4C). JA and cytokinins interact to inhibit the formation of ARs in the hypocotyls of Arabidopsis. The content of free cytokinins decreases, which may be due to the downregulation of cytokinin synthesis and the upregulation of its inactivation pathways. The signaling pathway involving JA and the transcription factor MYC2 inhibits the expression of the cytokinin-degrading cytokinin oxidase CKX1, thereby suppressing the formation of ARs [40]. The KEGG annotation results show that most genes in the JA signaling pathway are significantly upregulated (Figure 5C), which also confirms that JA levels significantly increased in all three treatment groups (Figure 2C). At the same time, most genes related to cytokinins were significantly downregulated in the KEGG annotated pathways (Figure 5D). Additionally, JA and cytokinins may synergistically activate the ethylene transcription factor ERF113, which is another negative regulator of ARs. The expression of ERF115 is activated by JA, and JA promotes the biosynthesis of cytokinins to inhibit ARs [41]. Therefore, combining existing research with the results of this study illustrates that auxins interact with JA, cytokinins, and ethylene to participate in the complex regulatory network controlling ARs in the hypocotyls.
3.2. The Effect of Transcription Factors on AR Development During Scion Rootstock Interaction
Grafting is the process of recognition and interaction between the scion and rootstock, and the signaling between them is fundamental to understanding the grafting process. Different combinations of scion and rootstock genotypes can lead to variations in the growth, development, phenotype, yield, and stress resistance of the grafted plants. Currently, significant progress has been made in the research on rootstock selection, grafting techniques, and seedling quality. However, understanding the molecular mechanisms affecting AR development in grafted plants is the theoretical basis for the continuous improvement in grafting techniques. Although vascular connections are not yet established in the early stages of grafting, intercellular strands can form between the adhesive cells of the scion and rootstock, facilitating material transport and communication between the cells [42]. In addition to hormones involved in the transport and communication between rootstock and scion cells, transcription factors related to this process also play important roles. For example, the phloem development gene APL, which encodes a MYB transcription factor, was expressed at different stages of AR development in this study, particularly in the early stage (Figure S3).
Through transcriptome sequencing, we identified multiple transcription factors involved in the formation of ARs (Figure S3). These TFs are believed to participate in the differentiation of ARs in various plant species under different conditions [29]. The involved TFs include those from the ARF, AP2/ERF, MYB, NAC, WRKY, GRAS, and bHLH families. bHLH is the most identified transcription factor in this study. In Arabidopsis, two types of bHLH transcription factors, PFA and PFB, control the ability of the pericycle cells to initiate lateral root primordium formation. The overexpression of the PFA gene imparts characteristic features of the pericycle, including specific marker gene expression and auxin-induced cell division, while the suppression of the PFB target gene leads to the loss of this specific pericycle function, revealing the transcriptional regulatory system that determines the involvement of the pericycle in lateral root initiation [43]. In addition, many studies have shown that AP2/ERF family genes are also involved in the formation of ARs. ERF is the second most identified transcription factor, and WGCNA results have screened multiple ERF transcription factors (Figure 7, Figure S5), including ERF054 (Figure S4). As a transcription factor regulating plant stress adaptation and root formation, WOX affects the expression of several transcription factors and proteins, including ethylene response transcription factors ERF054 and ERF034, with enhanced expression in transgenic WOX1-1, WOX4-3, and WOX5-1 plants [44]. Similarly, the hub gene ERF098 is expressed in the AR of mature chestnuts and may participate in the initial stages of AR and callus formation. On the other hand, the differential expression of ERF098 and ERF107 in mature buds may be related to the formation of callus tissue in crown branches and also participates in integrating JA or cytokinins signals to inhibit the formation of ARs, illustrating the interplay between ethylene and other hormones [45]. Some TFs from the NAC family are also related to the formation of AR induced by excision in Arabidopsis leaf explants [46]. Wamhoff et al. found that NAC family genes are involved in the cell elongation of rose petals and also participate in root elongation [47]. When Arabidopsis is damaged, it not only triggers auxin-mediated cell transformation but also induces the NAC pathway to promote the emergence of root tips. The NAC1 transcription factor is specifically expressed in leaf explants in response to damage, significantly affecting the appearance of AR tips [48]. MYB transcription factors are expressed during multiple stages of AR development and are one of the largest transcription factor families in plant genomes, characterized by structural and functional diversity. Members of this family have been widely recognized for their roles in plant development, cell differentiation, specialized metabolism, and responses to biotic and abiotic stress; however, their roles in plant root systems are still not well described. MYB is involved in the formation of ARs under phosphorus starvation. For example, in Populus ussuriensis, PuMYB40 regulates phosphorus starvation resistance by promoting the formation of ARs [49]. Transcription factors play a key regulatory role in the development of ARs in grafted seedlings. In-depth studies of transcription factors can provide a theoretical basis for improving the survival rate and growth vigor of grafted seedlings. In the future, further research can be conducted on the expression patterns of different transcription factors during the grafting process, as well as their interactions with other regulatory factors, thereby providing new insights for plant breeding.
4. Materials and Methods
4.1. Plant Materials and Growth Conditions
This study used "HXX" watermelon as the scion and "Tie Zhen No. 3" pumpkin as the rootstock to construct grafted seedlings. After stirring two types of seeds in warm water at 55。C for 10 minutes, they were diluted 600 times with a solution of 62.5 g/l total active ingredient in fludioxonil·metalaxyl (metalaxyl content 25 g/l, fludioxonil content 37.5 g/l) and soaked for 2 hours. After rinsing with clean water, the seeds were soaked in 0.1% potassium permanganate solution for 2 hours, then cleaned and dried. The seeds were soaked in clean water for 2 hours, and then dried in a washing machine (4 minutes). The seeds were wrapped in gauze to keep them moist and placed in a germination box at 30。C for about 12 hours. Start sowing after the seeds have turned white. When sowing, a 40 holes plastic tray is used, with 2 pumpkin and watermelon seeds per hole. Cover with 0.5 cm of soil, water thoroughly, and control to dry until no more dripping. Cover the surface with a film to keep it warm and moist. Arch the seeds in the soil, remove the film in a timely manner, and cultivate in a seedling greenhouse. The grafting work is carried out using the "paste grafting" method. A sharp blade is used to cut off the growth point, true leaf, and one leaf of the pumpkin rootstock, with a cutting angle of 30-degree and a section length of 0.5-0.8 cm. The watermelon scion is cut at a 30-degree angle to the hypocotyl 1 cm below the cotyledons with a blade. Then, the two sections of the rootstock and scion are closely aligned, fixed with grafting clips, and the other leaf of the rootstock is cut off, leaving a 5 cm hypocotyl of the rootstock. The interface should be about 3cm above the ground to prevent the scion from rooting. Remove the grafting clip 10-15 days after grafting. All treatments involve inserting one plant into a 40 holes plastic tray, with 120 plants per treatment. Maintain humidity between 85% and 90% to promote root regeneration.
4.2. Determination of Endogenous Hormone Content
Samples were taken from the hypocotyls of the scion and rootstock on days 2, 4, and 6, respectively. All collected samples were frozen in liquid nitrogen for testing. Double antibody one-step sandwich enzyme-linked immunosorbent assay (ELISA) was used for measurement. The measured hormones include IAA, ABA, and JA. Samples, standards, and HRP labeled detection antibodies are sequentially added to the pre coated micropores with hormone antibodies. After incubation on a shaker, they are thoroughly washed with distilled water. Using substrate TMB for color development, TMB is converted to blue under the catalysis of peroxidase, and then acid is added to convert the product to yellow under the action of acid. The depth of color can reflect the number of hormones in the sample. Measure the absorbance (OD value) at a wavelength of 450 nm using an enzyme-linked immunosorbent assay (ELISA) reader. Draw a standard curve based on the concentration of the standard substance and the measured OD value to determine the hormone content in the sample.
4.3. Total RNA Deep Sequencing
Samples were taken from the hypocotyls of the grafted seedlings on days 2, 4, and 6, respectively. All collected samples were frozen in liquid nitrogen for testing. Total RNA was extracted from the tissue using TRIzol® Reagent (Plant RNA Purification Reagent for plant tissue) according the manufacturer’s instructions (Invitrogen) and genomic DNA was removed using DNase I (TaKara). Then RNA quality was determined by 2100 Bioanalyser (Agilent) and quantified using the ND-2000 (NanoDrop Technologies). Only high-quality RNA sample(OD260/280=1.8~2.2, OD260/230≥2.0, RIN≥6.5, 28S:18S≥1.0, >1μg) was used to construct sequencing library.
RNA-seq transcriptome librariy was prepared following TruSeqTM RNA sample preparation Kit from Illumina (San Diego, CA) using 1μg of total RNA. Shortly, messenger RNA was isolated according to polyA selection method by oligo(dT) beads and then fragmented by fragmentation buffer firstly. Secondly double-stranded cDNA was synthesized using a SuperScript double-stranded cDNA synthesis kit (Invitrogen, CA) with random hexamer primers (Illumina). Then the synthesized cDNA was subjected to end-repair, phosphorylation and ‘A’ base addition according to Illumina’s library construction protocol. Libraries were size selected for cDNA target fragments of 300 bp on 2% Low Range Ultra Agarose followed by PCR amplified using Phusion DNA polymerase (NEB) for 15 PCR cycles. After quantified by TBS380, paired-end RNA-seq sequencing library was sequenced with the Illumina HiSeq xten/NovaSeq 6000 sequencer (2 × 150bp read length). The raw paired end reads were trimmed and quality controlled by SeqPrep (https://github.com/jstjohn/SeqPrep) and Sickle (https://github.com/najoshi/sickle) with default parameters. Then clean reads were separately aligned to reference genome with orientation mode using HISAT2 (http://ccb.jhu.edu/software/hisat2/index.shtml) [50] software. The mapped reads of each sample were assembled by StringTie (https://ccb.jhu.edu/software/stringtie/index.shtml? t=example) in a reference-based approach [51]. RNA-seq data are summarized in Data S1 and the raw data can be accessed at the PRJNA1202060.
4.4. Differential Expression Analysis and Functional Enrichment
To identify DEGs between two different samples, the expression level of each transcript was calculated according to the transcripts per million reads (TPM) method. RSEM (http://deweylab.biostat.wisc.edu/rsem/) [52] was used to quantify gene abundances. Essentially, differential expression analysis was performed using the DESeq2 [53] with |log2FC|>1 and Q value <= 0.05 were considered to be significantly different expressed genes. In addition, functional-enrichment analysis including GO and KEGG were performed to identify which DEGs were significantly enriched in GO terms and metabolic pathways at Bonferroni-corrected P-value ≤0.05 compared with the whole-transcriptome background. GO functional enrichment and KEGG pathway analysis were carried out by Goatools (https://github.com/tanghaibao/Goatools) and KOBAS (http://kobas.cbi.pku.edu.cn/home.do) [54].
4.5. Weighted Gene Co-Expression Network Analysis
WGCNA was performed using hormone level traits of IAA, ABA, JA. When analyzing, the correlation coefficient weighting value is used, that is, the gene correlation coefficient is taken to the power of N, so that the connections between genes in the network follow a scale free network distribution. Construct a hierarchical clustering tree based on the correlation coefficients between genes, where different branches represent different gene modules and different colors represent different modules. Based on the weighted correlation coefficient of genes, genes are classified according to their expression patterns, and genes with similar patterns are grouped into a module. Analyze the gene heatmap and key genes of the module, select the top 30 genes with correlation coefficients within the module, and create heatmaps and expression bar charts based on their expression levels to display the characteristics of the module. Associate modules with traits by inputting trait files or default individual samples, study the correlation between modules and traits, and select the module with the most interesting trait for analysis. Display gene related relationships within the module through Cytoscape [35].
4.6. RNA Extraction and Quantitative Real-Time PCR Validation
Total RNA from grafted seedling was first extracted using the CTAB method, and RNA concentration and purity were determined using Nanodrop 2000. Subsequently, a reverse transcription reaction was performed using the SweScript All-in-One RT SuperMix for qPCR kit, with reaction conditions set at 25°C for 5 minutes, 42°C for 30 minutes, and 85°C for 5 seconds. The quantitative PCR reaction system included 2×Universal Blue SYBR Green qPCR Master Mix, gene-specific primers, and cDNA templates, conducted on the Bio-rad CFX Connect platform. The reaction program comprised 30 seconds of pre-denaturation at 95°C, 15 seconds of denaturation at 95°C, and 40 cycles of annealing/extension at 60°C for 30 seconds, followed by a melt curve analysis. The relative expression levels of genes were calculated using the ΔΔCT method, where A=CT (target gene, sample to be tested) - CT (internal control gene, sample to be tested), B=CT (target gene, control sample) - CT (internal control gene, control sample), K=A-B, and expression fold change = 2-K. The qRT-PCR data were normalized to housekeeping genes, particularly Actin, prior to comparisons among various ecotypes. All primers employed for qRT-PCR analyses are detailed in Table S3.
5. Conclusions
This study investigated the impact of scion organs (cotyledons and true leaves) on AR development in grafted watermelon seedlings. The results demonstrate that cotyledons significantly promote root growth, while true leaves have a limited effect. Hormone levels were significantly altered by scion manipulations. The transcriptome analysis revealed enrichment in hormone-related pathways, with IAA, ABA, and JA playing crucial roles. A WGCNA identified key modules correlated with hormone levels, and hub genes within these modules, including ethylene transcription factors (ERF4, ABR1, ERF054, ERF098), auxin response factors (SAUR21, 32), and other transcription factors (CSA, HSP, bHLH93, ZAT5, 13, NAC, MYB, C3H), provide valuable insights into the regulatory networks governing AR development in grafted watermelon. These findings highlight the intricate interplay between scion organs, hormones, and transcriptional regulation in shaping root system architecture, providing a foundation for optimizing grafting strategies in watermelon production.
Supplementary Materials
The following supporting information can be downloaded at: www.mdpi.com/xxx/s1, Figure S1: title; Table S1: title; Video S1: title. Figure S1. Transcript level of phytohormone genes analyzed by GO enrichment. Log-transformed fold changes in transcript levels for genes related to phytohormones by go enrichemt in WP-1, WP-2, and WP-3 at Day 4 and Day 6 (* indicates p < 0.05, and ** indicates p < 0.01). Figure S2. Commonly up-regulated and down-regulated genes in WP-1, WP-2, and WP-3 are enriched by GO analysis at Day 2 and Day 6. (A, B) A total of 30 genes commonly up-regulated and 68 genes down-regulated in WP-1, WP-2, and WP-3 subjected to Enrichment of GO at Day 2. (C, D) A total of 85 genes commonly up-regulated and 26 genes down-regulated in WP-1, WP-2, and WP-3 subjected to Enrichment of GO. Figure S3. Number of Transcription Factors in commonly expression of DEGs at different days. (A, B) The number of transcription factors in DEGs that were commonly and significantly up-regulated or down-regulated in WP-1, WP-2, and WP-3 at Day 2. (C, D) The number of transcription factors in DEGs that were commonly and significantly up-regulated or down-regulated in WP-1, WP-2, and WP-3 at Day 4. (E, F) The number of transcription factors in DEGs that were commonly and significantly up-regulated or down-regulated in WP-1, WP-2, and WP-3 at Day 6. Figure S4. Identifying modules related to phytohormones and screening of co-expression network of central genes at Day 2 with WGCNA. (A) WGCNA identified a hierarchical cluster tree showing co-expression modules, while the major tree branches constitute 25 modules labeled using different colors. (B) Module-trait relationship diagram. The left panel displays the genes matched by 25 modules. The blue-red color gradient represents the module feature correlation. Asterisks indicate the correlation between module samples and the corresponding p-value. * indicates p < 0.05; ** indicates p < 0.01. (C, D) Hub co-expression gene network for the tan and darkgrey module at Day 2. Each dot represents a gene, each line represents the regulatory relationship between them. Genes related to phytohormones and transcription factors are represented in bold font of different colors and shapes. Figure S5. Identifying modules related to phytohormones and screening of co-expression network of central genes at Day 6 with WGCNA. (A) WGCNA identified a Hierarchical cluster tree showing co-expression modules, while the major tree branches constitute 20 modules labeled using different colors. (B) Module-trait relationship diagram. The left panel displays the genes matched by 20 modules. The blue-red color gradient represents the module feature correlation. Asterisks indicate the correlation between module samples and the corresponding p-value. * indicates p < 0.05; ** indicates p < 0.01. (C, D) Hub co-expression gene network for the salmon and brown module at Day 6. Each dot represents a gene, each line represents the regulatory relationship between them. Genes related to phytohormones and transcription factors are represented in bold font of different colors and shapes. Data S1 Transcript level of 32,462 genes by RNA deep sequencing. Data S2 Commonly regulated genes in WP-1, WP-2 and WP-3. Data S3 Hub genes of different module by WGCNA correlated with measured endogenous hormone. Table S1 List of Preprocessing Results for Sequencing Data Quality. Table S2 Statistical results of alignment rate between reads and reference sequence. Table S3 Primers used for qRT-PCR in this study.
Author Contributions
K.M., G.S., and B.T. conceived and designed the research. Y.H. and C.W. conducted seedling culture and biochemical experiments. X.S., G.M., Y.J., and Y.T. performed transcriptome data analysis. T.W., Z.W., and L.N. contributed to plant culture and validation experiments. Y.C., H.C., X.C., and X.T. carried out partial experiments and data analysis. C.S., K.M., and G.S. participated in writing and revising the manuscript. All authors have read and agreed to the published version of the manuscript.
Funding
This work was supported through funding by the Technology System of Bulk Vegetable Industry in Henan Province (HARS-22-07-G2), Major Science and Technology Special Projects in Henan Province (241100110200), Sci-Tech Innovation Team of Henan Academy Agricultural Sciences (2024TD38), Central Guidance for Local Science and Technology Development Funds Project (Z20241471128) to K.M.; Autonomous Innovation Project of Henan Academy of Agricultural Sciences (2025ZC34) to C.S.; Programs for Science and Technology Development of Henan Province (232102110069) to Y.T.
Institutional Review Board Statement
Not applicable.
Informed Consent Statement
Not applicable.
Data Availability Statement
RNA-seq data PRJNA1202060 accessed at https://dataview.ncbi.nlm.nih.gov/object/PRJNA1202060?reviewer=nrhqrklqql1dc7kr6bhq1jip60.
Acknowledgments
Yuxin Cai and Huili Chen from Henan Qingfa Seeds Co., Ltd. are thanked for providing the experimental materials “HXX” and “Tie Zhen No. 3.” Xi Chen and Xiufang Tan from the Xinxiang Academy of Agricultural Sciences are thanked for providing the experimental site. Their support and contributions were invaluable to this study.
Conflicts of Interest
The authors declare no conflicts of interest.
Abbreviations
The following abbreviations are used in this manuscript:
| ARs | Adventitious Roots |
| IAA | Indole-3-Acetic Acid |
| ABA | Abscisic Acid |
| JA | Jasmonic Acid |
| DEGs | Differentially Expressed Genes |
| GO | Gene Ontology |
| KEGG | Kyoto Encyclopedia of Genes and Genomes |
| WGCNA | Weighted Gene Co-expression Network Analysis |
References
- Colla, G.; Rouphael, Y.; Cardarelli, M.; Salerno, A.; Rea, E. The effectiveness of grafting to improve alkalinity tolerance in watermelon. Environ. Exp. Bot. 2010, 68, (3), 283–291. [Google Scholar] [CrossRef]
- Bahadur, A.; Singh, P. M.; Rai, N.; Singh, A. K.; Singh, A. K.; Karkute, S. G.; Behera, T. K. Grafting in vegetables to improve abiotic stress tolerance, yield and quality. The Journal of Horticultural Science and Biotechnology 2024, 1–19. [Google Scholar] [CrossRef]
- Sun, F.; Ma, S.; Gao, L.; Qu, M.; Tian, Y. Enhancing root regeneration and nutrient absorption in double-rootcutting grafted seedlings by regulating light intensity and photoperiod. Scientia Horticulturae 2020, 264, 109192. [Google Scholar] [CrossRef]
- Wu, X.; Zhang, X.; Wang, Y.; Wu, C.; Sun, Y.; Zhang, Y.; Ji, Y.; Bao, E.; Xia, L.; Bian, Z.; Cao, K. Additional far-red light promotes adventitious rooting of double-root-cutting grafted watermelon seedlings. Horticultural Plant Journal 2024. [CrossRef]
- Mhimdi, M.; Pérez-Pérez, J. M. Understanding of Adventitious Root Formation: What Can We Learn From Comparative Genetics? FRONTIERS IN PLANT SCIENCE 2020, 11. [Google Scholar] [CrossRef] [PubMed]
- Gonin, M.; Bergougnoux, V.; Nguyen, T. D.; Gantet, P.; Champion, A. What Makes Adventitious Roots? PLANTS-BASEL 2019, 8, (7). [Google Scholar] [CrossRef] [PubMed]
- Li, S. W. Molecular Bases for the Regulation of Adventitious Root Generation in Plants. FRONTIERS IN PLANT SCIENCE 2021, 12. [Google Scholar] [CrossRef] [PubMed]
- Sun, H. W.; Li, W. Q.; Burritt, D. J.; Tian, H. T.; Zhang, H.; Liang, X. H.; Miao, Y. C.; Mostofa, M. G.; Tran, L. S. P. Strigolactones interact with other phytohormones to modulate plant root growth and development. CROP JOURNAL 2022, 10, (6), 1517–1527. [Google Scholar] [CrossRef]
- Sharma, M.; Singh, D.; Saksena, H. B.; Sharma, M.; Tiwari, A.; Awasthi, P.; Botta, H. K.; Shukla, B. N.; Laxmi, A. Understanding the intricate web of phytohormone signalling in modulating root system architecture. Int. J. Mol. Sci. 2021, 22, (11). [Google Scholar] [CrossRef] [PubMed]
- Betti, C.; Della Rovere, F.; Piacentini, D.; Fattorini, L.; Falasca, G.; Altamura, M. M. Jasmonates, ethylene and brassinosteroids control adventitious and lateral rooting as stress avoidance responses to heavy metals and metalloids. Biomolecules 2021, 11, (1), 1–21. [Google Scholar] [CrossRef]
- Kevei, Z.; Larriba, E.; Romero-Bosquet, M. D.; Nicolás-Albujer, M.; Kurowski, T. J.; Mohareb, F.; Rickett, D.; Pérez-Pérez, J. M.; Thompson, A. J. Genes involved in auxin biosynthesis, transport and signalling underlie the extreme adventitious root phenotype of the tomato aer mutant. Theor. Appl. Genet. 2024, 137, (4). [Google Scholar] [CrossRef] [PubMed]
- Li, J. R.; Fan, M.; Zhang, Q. Q.; Lue, G. Y.; Wu, X. L.; Gong, B. B.; Wang, Y. B.; Zhang, Y.; Gao, H. B. Transcriptome analysis reveals that auxin promotes strigolactone-induced adventitious root growth in the hypocotyl of melon seedlings. FRONTIERS IN PLANT SCIENCE 2023, 14. [Google Scholar] [CrossRef] [PubMed]
- Fattorini, L.; Hause, B.; Gutierrez, L.; Veloccia, A.; Della Rovere, F.; Piacentini, D.; Falasca, G.; Altamura, M. M. Jasmonate promotes auxin-induced adventitious rooting in dark-grown Arabidopsis thaliana seedlings and stem thin cell layers by a cross-talk with ethylene signalling and a modulation of xylogenesis. BMC Plant Biol. 2018, 18, (1). [Google Scholar] [CrossRef]
- Fattorini, L.; Veloccia, A.; Della Rovere, F.; D'Angeli, S.; Falasca, G.; Altamura, M. M. Indole-3-butyric acid promotes adventitious rooting in Arabidopsis thaliana thin cell layers by conversion into indole-3-acetic acid and stimulation of anthranilate synthase activity. BMC Plant Biol. 2017, 17, (1). [Google Scholar] [CrossRef] [PubMed]
- Deng, Y.; Wang, C.; Zhang, M.; Wei, L.; Liao, W. Identification of Key Genes during Ethylene-Induced Adventitious Root Development in Cucumber (Cucumis sativus L.). Int. J. Mol. Sci. 2022, 23, (21). [Google Scholar] [CrossRef] [PubMed]
- Lyu, J.; Wu, Y.; Jin, X.; Tang, Z.; Liao, W.; Dawuda, M. M.; Hu, L.; Xie, J.; Yu, J.; Calderón-Urrea, A. Proteomic analysis reveals key proteins involved in ethylene-induced adventitious root development in cucumber (Cucumis sativus L.). PeerJ 2021, 9.
- Lu, X. Y.; Chen, X. T.; Liu, J. Y.; Zheng, M.; Liang, H. Y. Integrating histology and phytohormone/metabolite profiling to understand rooting in yellow camellia cuttings. Plant Sci. (Amsterdam, Neth.) 2024, 346.
- Bagautdinova, Z. Z.; Omelyanchuk, N.; Tyapkin, A. V.; Kovrizhnykh, V. V.; Lavrekha, V. V.; Zemlyanskaya, E. V. Salicylic Acid in Root Growth and Development. Int. J. Mol. Sci. 2022, 23, (4). [Google Scholar] [CrossRef] [PubMed]
- Fabregas, N.; Fernie, A. R. The interface of central metabolism with hormone signaling in plants. Curr. Biol. 2021, 31, (23), R1535–R1548. [Google Scholar] [CrossRef]
- Zhang, Q.; Shi, M.; Tang, F.; Su, N.; Jin, F.; Pan, Y.; Chu, L.; Lu, M.; Shu, W.; Li, J. Transcriptome Analysis Reveals the Hormone Signalling Coexpression Pathways Involved in Adventitious Root Formation in Populus. Forests 2023, 14, (7). [Google Scholar] [CrossRef]
- Wang, H. M.; Ba, G.; Uwamungu, J. Y.; Ma, W. J.; Yang, L. N. Transcription Factor MdPLT1 Involved Adventitious Root Initiation in Apple Rootstocks. HORTICULTURAE 2024, 10, (1). [Google Scholar] [CrossRef]
- Tahir, M. M.; Tong, L.; Xie, L.; Wu, T.; Ghani, M. I.; Zhang, X.; Li, S.; Gao, X.; Tariq, L.; Zhang, D.; Shao, Y. Identification of the HAK gene family reveals their critical response to potassium regulation during adventitious root formation in apple rootstock. Horticultural Plant Journal 2023, 9, (1), 45–59. [Google Scholar] [CrossRef]
- Mao, J. P.; Niu, C. D.; Li, K.; Fan, L.; Liu, Z. M.; Li, S. H.; Ma, D. D.; Tahir, M. M.; Xing, L. B.; Zhao, C. P.; Ma, J. J.; An, N.; Han, M. Y.; Ren, X. L.; Zhang, D. Cytokinin-responsive MdTCP17 interacts with MdWOX11 to repress adventitious root primordium formation in apple rootstocks. Plant Cell 2023, 35, (4), 1202–1221. [Google Scholar] [CrossRef]
- Zhao, W.; Langfelder, P.; Fuller, T.; Dong, J.; Li, A.; Hovarth, S. Weighted gene coexpression network analysis: state of the art. J. Biopharm. Stat. 2010, 20, (2), 281–300. [Google Scholar] [CrossRef]
- Langfelder, P.; Horvath, S. WGCNA: an R package for weighted correlation network analysis. BMC Bioinformatics 2008, 9, 1–13. [Google Scholar] [CrossRef] [PubMed]
- Wen, S. S.; Miao, D. P.; Cui, H. Y.; Li, S. H.; Gu, Y. N.; Jia, R. R.; Leng, Y. F. Physiology and transcriptomic analysis of endogenous hormones regulating in vitro adventitious root formation in tree peony. SCIENTIA HORTICULTURAE 2023, 318. [Google Scholar] [CrossRef]
- Li, G.; Tan, M.; Liu, X.; Mao, J.; Song, C.; Li, K.; Ma, J.; Xing, L.; Zhang, D.; Shao, J. The nutrient, hormone, and antioxidant status of scion affects the rootstock activity in apple. Scientia Horticulturae 2022, 302, 111157. [Google Scholar] [CrossRef]
- Wang, X.; Cong, L.; Pang, J.; Chen, Y.; Wang, Z.; Zhai, R.; Yang, C.; Xu, L. Dwarfing rootstock ‘Yunnan’Quince promoted fruit sugar accumulation by influencing assimilate flow and PbSWEET6 in pear scion. Horticulturae 2022, 8, (7), 649. [Google Scholar] [CrossRef]
- Adem, M.; Sharma, L.; Shekhawat, G. S.; Šafranek, M.; Jásik, J. Auxin Signaling Transportation and Regulation during Adventitious Root Formation. Current Plant Biology 2024, 100385. [Google Scholar] [CrossRef]
- Zhang, G.; Zhao, F.; Chen, L.; Pan, Y.; Sun, L.; Bao, N.; Zhang, T.; Cui, C.-X.; Qiu, Z.; Zhang, Y. Jasmonate-mediated wound signalling promotes plant regeneration. Nature plants 2019, 5, (5), 491–497. [Google Scholar] [CrossRef]
- Pan, X.; Yang, Z.; Xu, L. Dual roles of jasmonate in adventitious rooting. J. Exp. Bot. 2021, 72, (20), 6808–6810. [Google Scholar] [CrossRef]
- Maeda, H. A.; Fernie, A. R. Evolutionary History of Plant Metabolism. Annu. Rev. Plant Biol. 2021, 72, (Volume 72, 2021), 185–216. [Google Scholar] [CrossRef]
- Seidler, J. F.; Sträßer, K. Understanding nuclear mRNA export: Survival under stress. Mol. Cell 2024, 84, (19), 3681–3691. [Google Scholar] [CrossRef]
- Du, K.; Peng, D.; Wu, J.; Zhu, Y.; Jiang, T.; Wang, P.; Chen, X.; Jiang, S.; Li, X.; Cao, Z. Maize splicing-mediated mRNA surveillance impeded by sugarcane mosaic virus-coded pathogenic protein NIa-Pro. Science advances 2024, 10, (34), eadn3010. [Google Scholar] [CrossRef]
- Han, C.; Shi, C.; Liu, L.; Han, J.; Yang, Q.; Wang, Y.; Li, X.; Fu, W.; Gao, H.; Huang, H.; Zhang, X.; Yu, K. Majorbio Cloud 2024: Update single-cell and multiomics workflows. iMeta 2024, 3, (4), e217. [Google Scholar] [CrossRef]
- Harrison, N.; Barber-Perez, N.; Pennington, B.; Cascant-Lopez, E.; Gregory, P. In Root system architecture in reciprocal grafts of apple rootstock-scion combinations, XXIX International Horticultural Congress on Horticulture: Sustaining Lives, Livelihoods and Landscapes (IHC2014): 1130, 2014; 2014; pp 409-414.
- Tandonnet, J. P.; Cookson, S.; Vivin, P.; Ollat, N. Scion genotype controls biomass allocation and root development in grafted grapevine. Aust. J. Grape Wine Res. 2010, 16, (2), 290–300. [Google Scholar] [CrossRef]
- Chandler, J. W. Cotyledon organogenesis. J. Exp. Bot. 2008, 59, (11), 2917–2931. [Google Scholar] [CrossRef]
- Zeng, Y.; Verstraeten, I.; Trinh, H. K.; Lardon, R.; Schotte, S.; Olatunji, D.; Heugebaert, T.; Stevens, C.; Quareshy, M.; Napier, R. Chemical induction of hypocotyl rooting reveals extensive conservation of auxin signalling controlling lateral and adventitious root formation. New Phytol. 2023, 240, (5), 1883–1899. [Google Scholar] [CrossRef]
- Dob, A.; Lakehal, A.; Novak, O.; Bellini, C. Jasmonate inhibits adventitious root initiation through repression of CKX1 and activation of RAP2. 6L transcription factor in Arabidopsis. J. Exp. Bot. 2021, 72, (20), 7107–7118. [Google Scholar]
- Lakehal, A.; Dob, A.; Rahneshan, Z.; Novák, O.; Escamez, S.; Alallaq, S.; Strnad, M.; Tuominen, H.; Bellini, C. ETHYLENE RESPONSE FACTOR 115 integrates jasmonate and cytokinin signaling machineries to repress adventitious rooting in Arabidopsis. New Phytol. 2020, 228, (5), 1611–1626. [Google Scholar] [CrossRef]
- Yin, H.; Yan, B.; Sun, J.; Jia, P.; Zhang, Z.; Yan, X.; Chai, J.; Ren, Z.; Zheng, G.; Liu, H. Graft-union development: a delicate process that involves cell–cell communication between scion and stock for local auxin accumulation. J. Exp. Bot. 2012, 63, (11), 4219–4232. [Google Scholar] [CrossRef]
- Zhang, Y.; Mitsuda, N.; Yoshizumi, T.; Horii, Y.; Oshima, Y.; Ohme-Takagi, M.; Matsui, M.; Kakimoto, T. Two types of bHLH transcription factor determine the competence of the pericycle for lateral root initiation. Nature Plants 2021, 7, (5), 633–643. [Google Scholar] [CrossRef]
- Quan, L.; Shiting, L.; Chen, Z.; Yuyan, H.; Minrong, Z.; Shuyan, L.; Libao, C. NnWOX1-1, NnWOX4-3, and NnWOX5-1 of lotus (Nelumbo nucifera Gaertn) promote root formation and enhance stress tolerance in transgenic Arabidopsis thaliana. BMC Genomics 2023, 24, (1), 719. [Google Scholar] [CrossRef] [PubMed]
- Vielba, J. M.; Rico, S.; Sevgin, N.; Castro-Camba, R.; Covelo, P.; Vidal, N.; Sánchez, C. Transcriptomics analysis reveals a putative role for hormone signaling and MADS-Box genes in mature chestnut shoots rooting recalcitrance. Plants 2022, 11, (24), 3486. [Google Scholar] [CrossRef]
- Chen, L.; Tong, J.; Xiao, L.; Ruan, Y.; Liu, J.; Zeng, M.; Huang, H.; Wang, J.-W.; Xu, L. YUCCA-mediated auxin biogenesis is required for cell fate transition occurring during de novo root organogenesis in Arabidopsis. J. Exp. Bot. 2016, 67, (14), 4273–4284. [Google Scholar] [CrossRef]
- Wamhoff, D.; Marxen, A.; Acharya, B.; Grzelak, M.; Debener, T.; Winkelmann, T. Genome-wide association study (GWAS) analyses of early anatomical changes in rose adventitious root formation. Scientific Reports 2024, 14, (1), 25072. [Google Scholar] [CrossRef] [PubMed]
- Chen, X.; Cheng, J.; Chen, L.; Zhang, G.; Huang, H.; Zhang, Y.; Xu, L. Auxin-independent NAC pathway acts in response to explant-specific wounding and promotes root tip emergence during de novo root organogenesis in Arabidopsis. Plant Physiol. 2016, 170, (4), 2136–2145. [Google Scholar] [CrossRef]
- Wang, H.; Pak, S.; Yang, J.; Wu, Y.; Li, W.; Feng, H.; Yang, J.; Wei, H.; Li, C. Two high hierarchical regulators, PuMYB40 and PuWRKY75, control the low phosphorus driven adventitious root formation in Populus ussuriensis. Plant Biotechnol. J. 2022, 20, (8), 1561–1577. [Google Scholar] [CrossRef]
- Kim, D.; Langmead, B.; Salzberg, S. L. HISAT: a fast spliced aligner with low memory requirements. Nature methods 2015, 12, (4), 357–360. [Google Scholar] [CrossRef]
- Pertea, M.; Pertea, G. M.; Antonescu, C. M.; Chang, T.-C.; Mendell, J. T.; Salzberg, S. L. StringTie enables improved reconstruction of a transcriptome from RNA-seq reads. Nat. Biotechnol. 2015, 33, (3), 290–295. [Google Scholar] [CrossRef]
- Li, B.; Dewey, C. N. RSEM: accurate transcript quantification from RNA-Seq data with or without a reference genome. BMC Bioinformatics 2011, 12, 1–16. [Google Scholar] [CrossRef]
- Love, M. I.; Huber, W.; Anders, S. Moderated estimation of fold change and dispersion for RNA-seq data with DESeq2. Genome Biol. 2014, 15, 1–21. [Google Scholar] [CrossRef] [PubMed]
- Xie, C.; Mao, X.; Huang, J.; Ding, Y.; Wu, J.; Dong, S.; Kong, L.; Gao, G.; Li, C.-Y.; Wei, L. KOBAS 2.0: a web server for annotation and identification of enriched pathways and diseases. Nucleic Acids Res. 2011, 39, (suppl_2), W316–W322. [Google Scholar]
Figure 1.
Phenotype growth parameters of grafted seedlings at different stages. (A) Phenotype of grafted seedlings (taking "HXX" watermelon as scion and "Tie Zhen No. 3" pumpkin as rootstock) at Day 2, Day 4 and Day 6. WP sample: Normal grafting seedlings without any treatment; WP-1 sample: With cotyledon of scion removed; WP-2 sample: True leaves of scion removed; WP-3 sample: Cotyledon and true leaves of scion removed. (B) Graphs showing root number, root length, wet weight, and dry weight. Error bars indicate standard deviation across three biological replicates. Different letters within different days indicate statistically significant differences based on one-way ANOVA. The dots represent biological replicates.
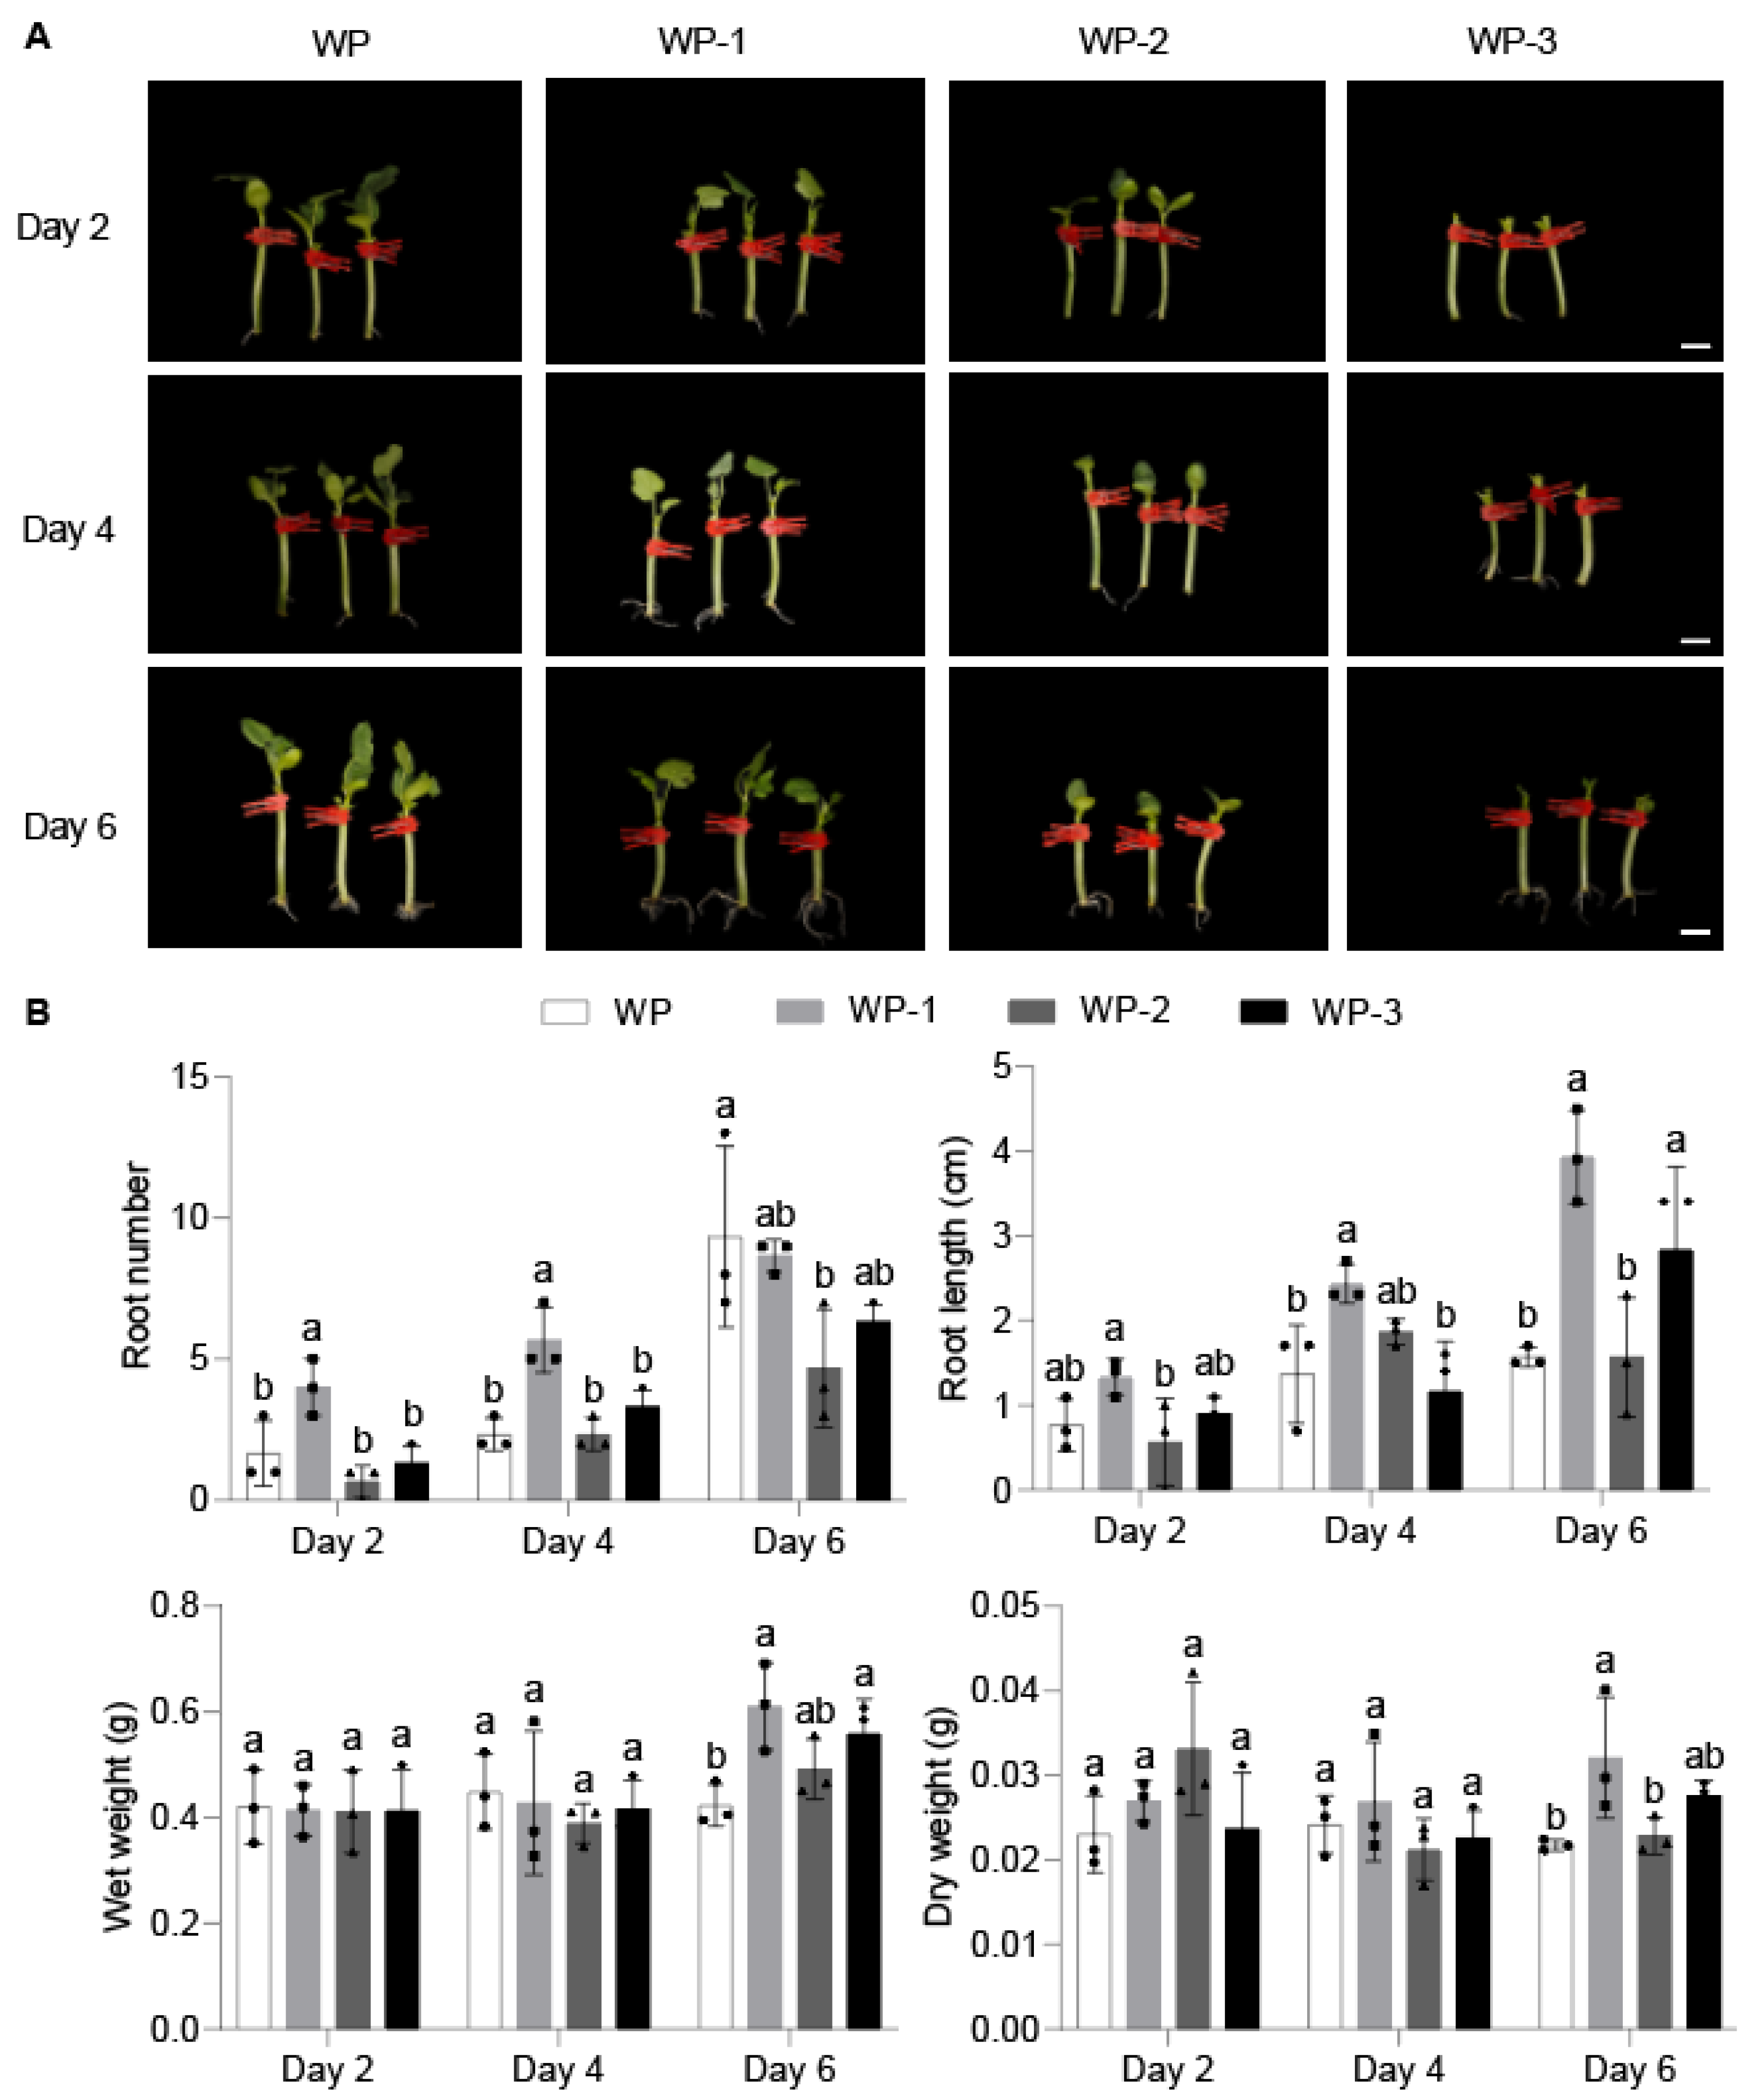
Figure 2.
Changes in endogenous hormone content in grafted seedlings at different stages. (A-C) Changes in endogenous content of IAA, ABA, and JA in the four phenotypes on Days 2, 4, and 6. Error bars indicate standard deviation across three biological replicates. Different letters within different days indicate statistically significant differences based on one-way ANOVA. The dots represent biological replicates.
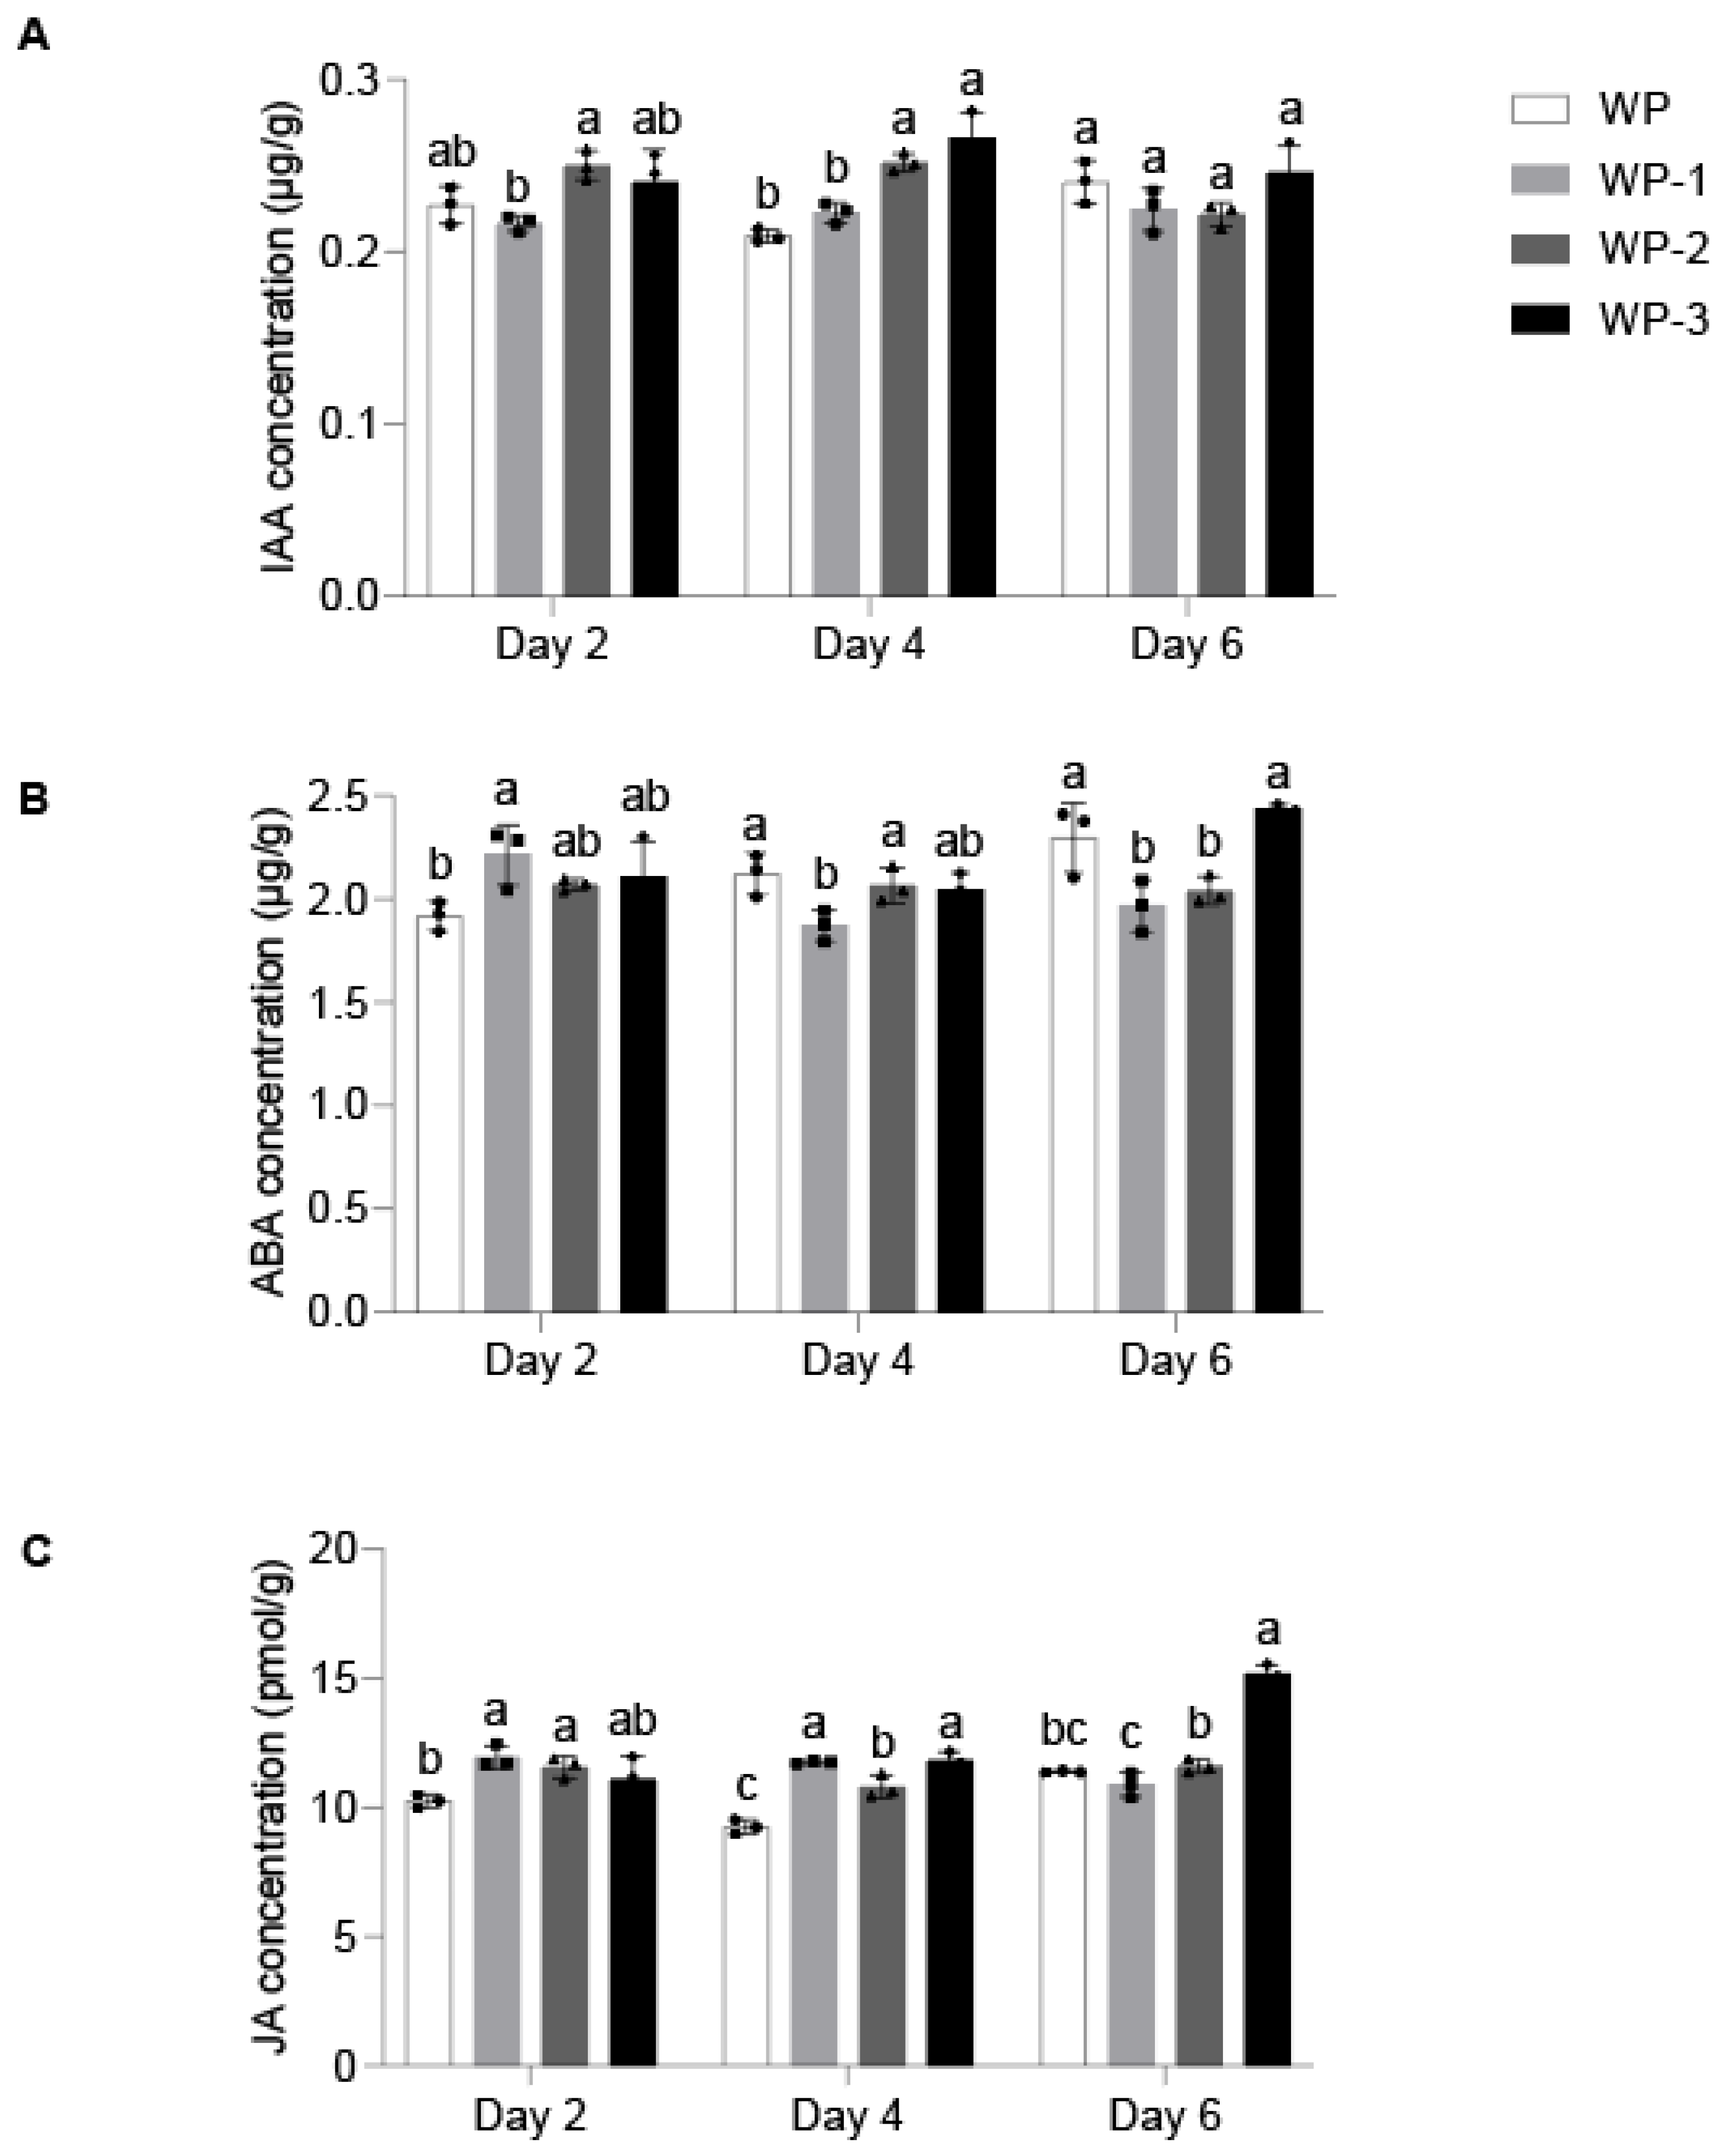
Figure 3.
Comprehensive display and functional and pathway analysis of transcriptome data. (A) Principal component analysis (PCA) performed using RNA deep sequencing data from WP, WP-1, WP-2 and WP-3. (B) Correlation analysis between samples. (C) Total genes from annotated databases subjected to Enrichment of Gene Ontology (GO). The horizontal bars represent the counts for Biological Processes (BP), Cell Compartments (CC) and Molecular Functions (MF), while the blue-red color bar indicates the range of log-transformed P values. (D) Kyoto Encyclopedia of Genes and Genomes (KEGG) pathway enrichment analysis of total genes. The size of the bubbles corresponds to the number of genes involved, while the green-red color bar indicates the range of log-transformed P values.
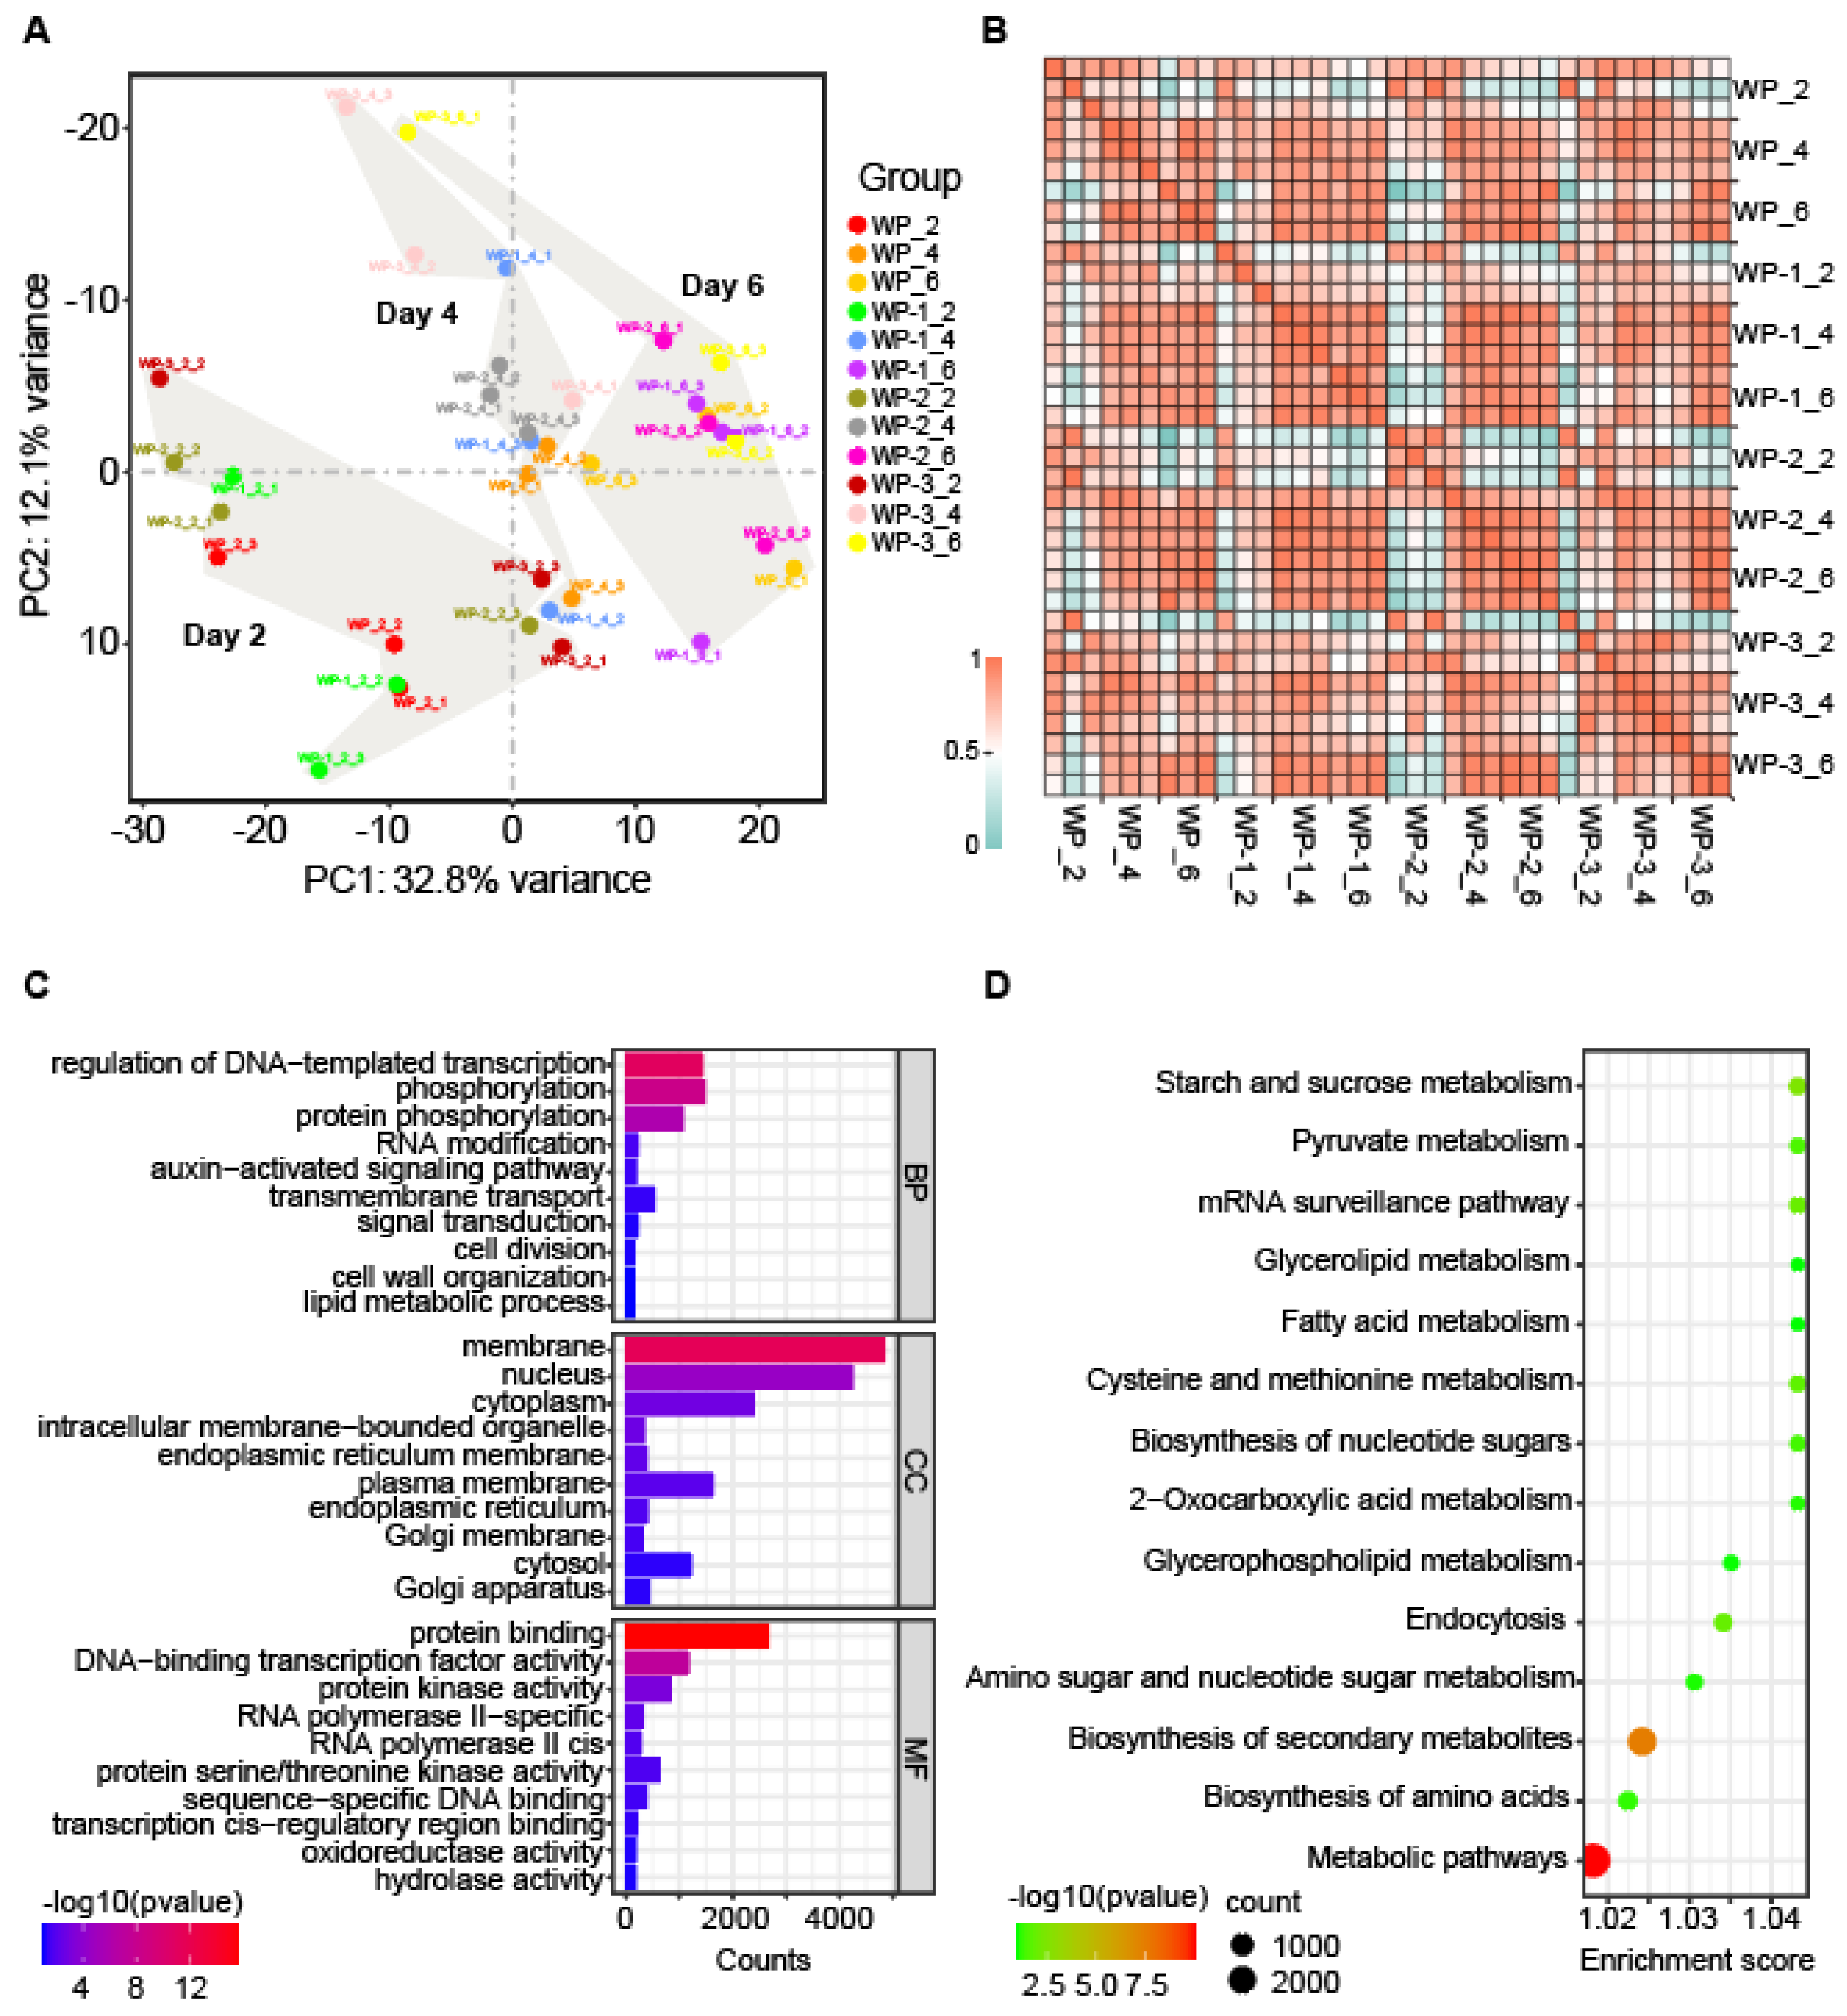
Figure 4.
Differentially expressed genes at Day 4 were enriched with phytohormones. (A) Differential gene expression analysis showed up-regulated and down-regulated genes in all nine comparison groups on different days. (B) The Venn diagram displays the genes expressed in three different comparison groups at Day 4. (C) A total of 233 genes commonly up-regulated in WP-1, WP-2 and WP-3 subjected to Enrichment of GO. (D) A total of 139 genes commonly down-regulated in WP-1, WP-2 and WP-3 subjected to Enrichment of GO.
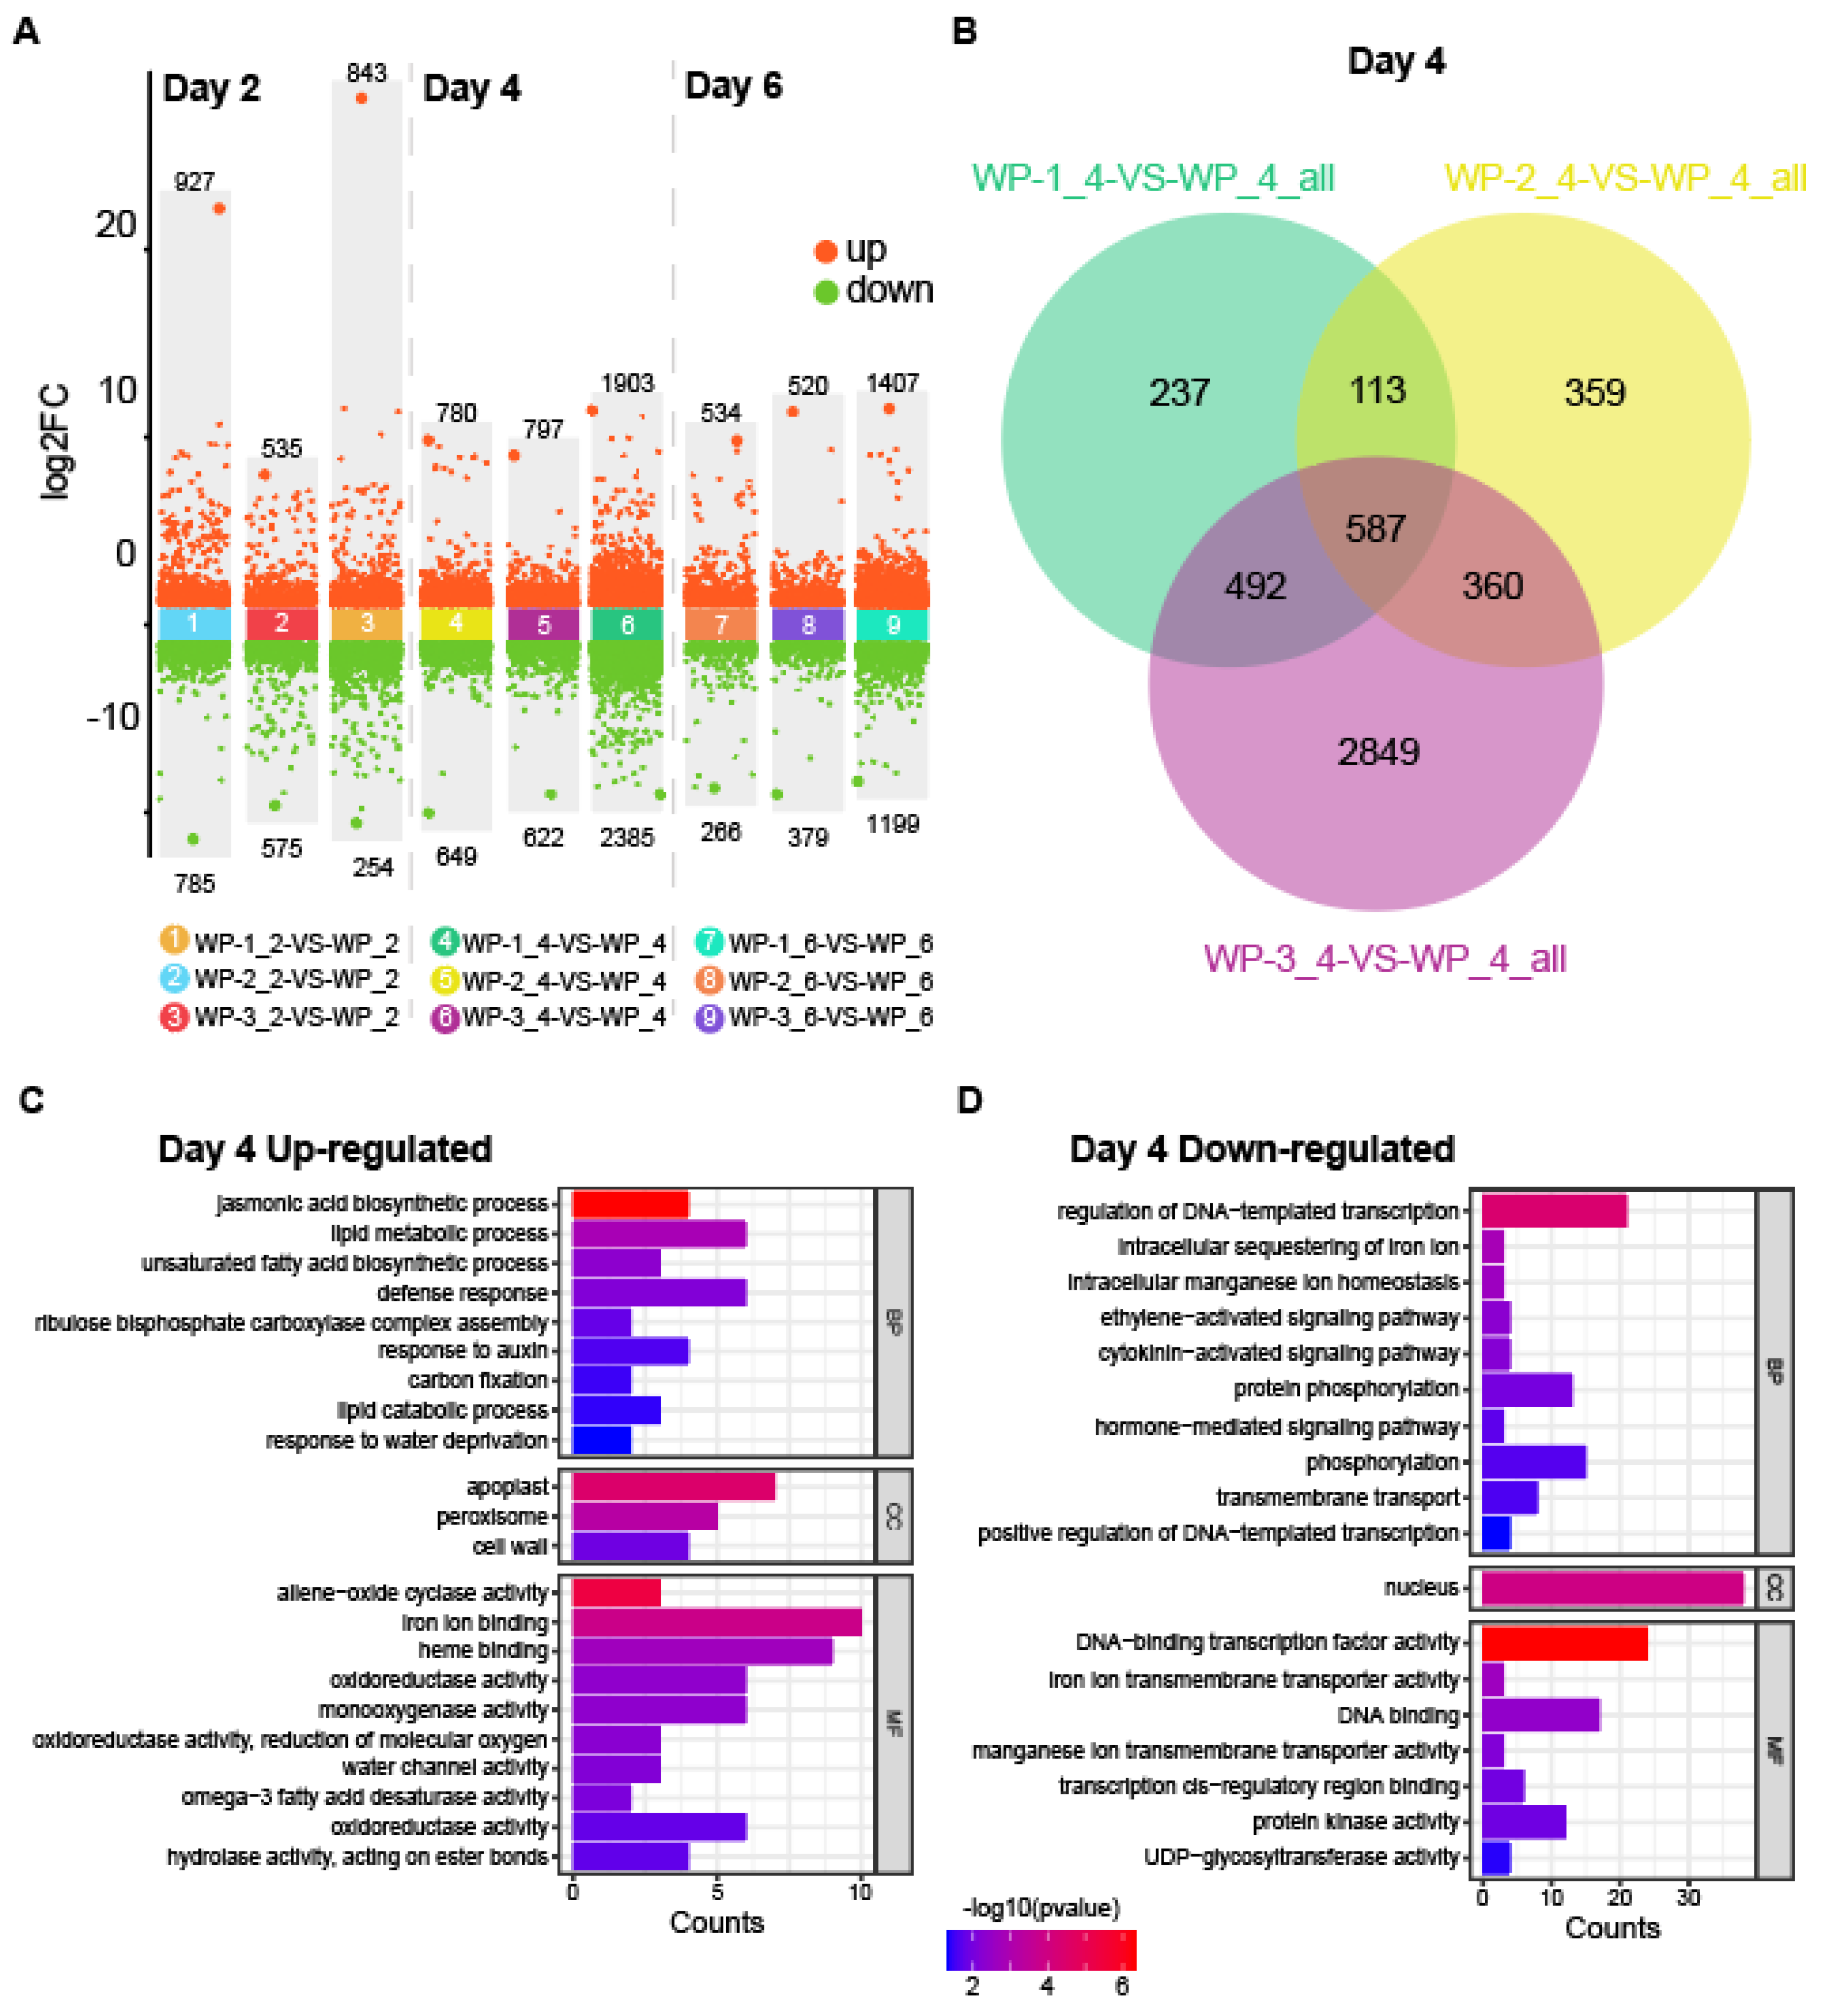
Figure 5.
Expression of key genes in phytohormone signaling pathways. Heatmaps show log-transformed fold changes in the expression of DEGs in the auxin (A), abscisic acid (B), jasmonic acid (C), cytokine (D), and ethylene (E) signaling pathways in three different comparison groups at Day 4. The blue-yellow color gradient represents the log2FC values between WP-1, WP-2, WP-3, and WP. * indicates p < 0.05, ** indicates p < 0.01. Gray blocks mean no data were available.
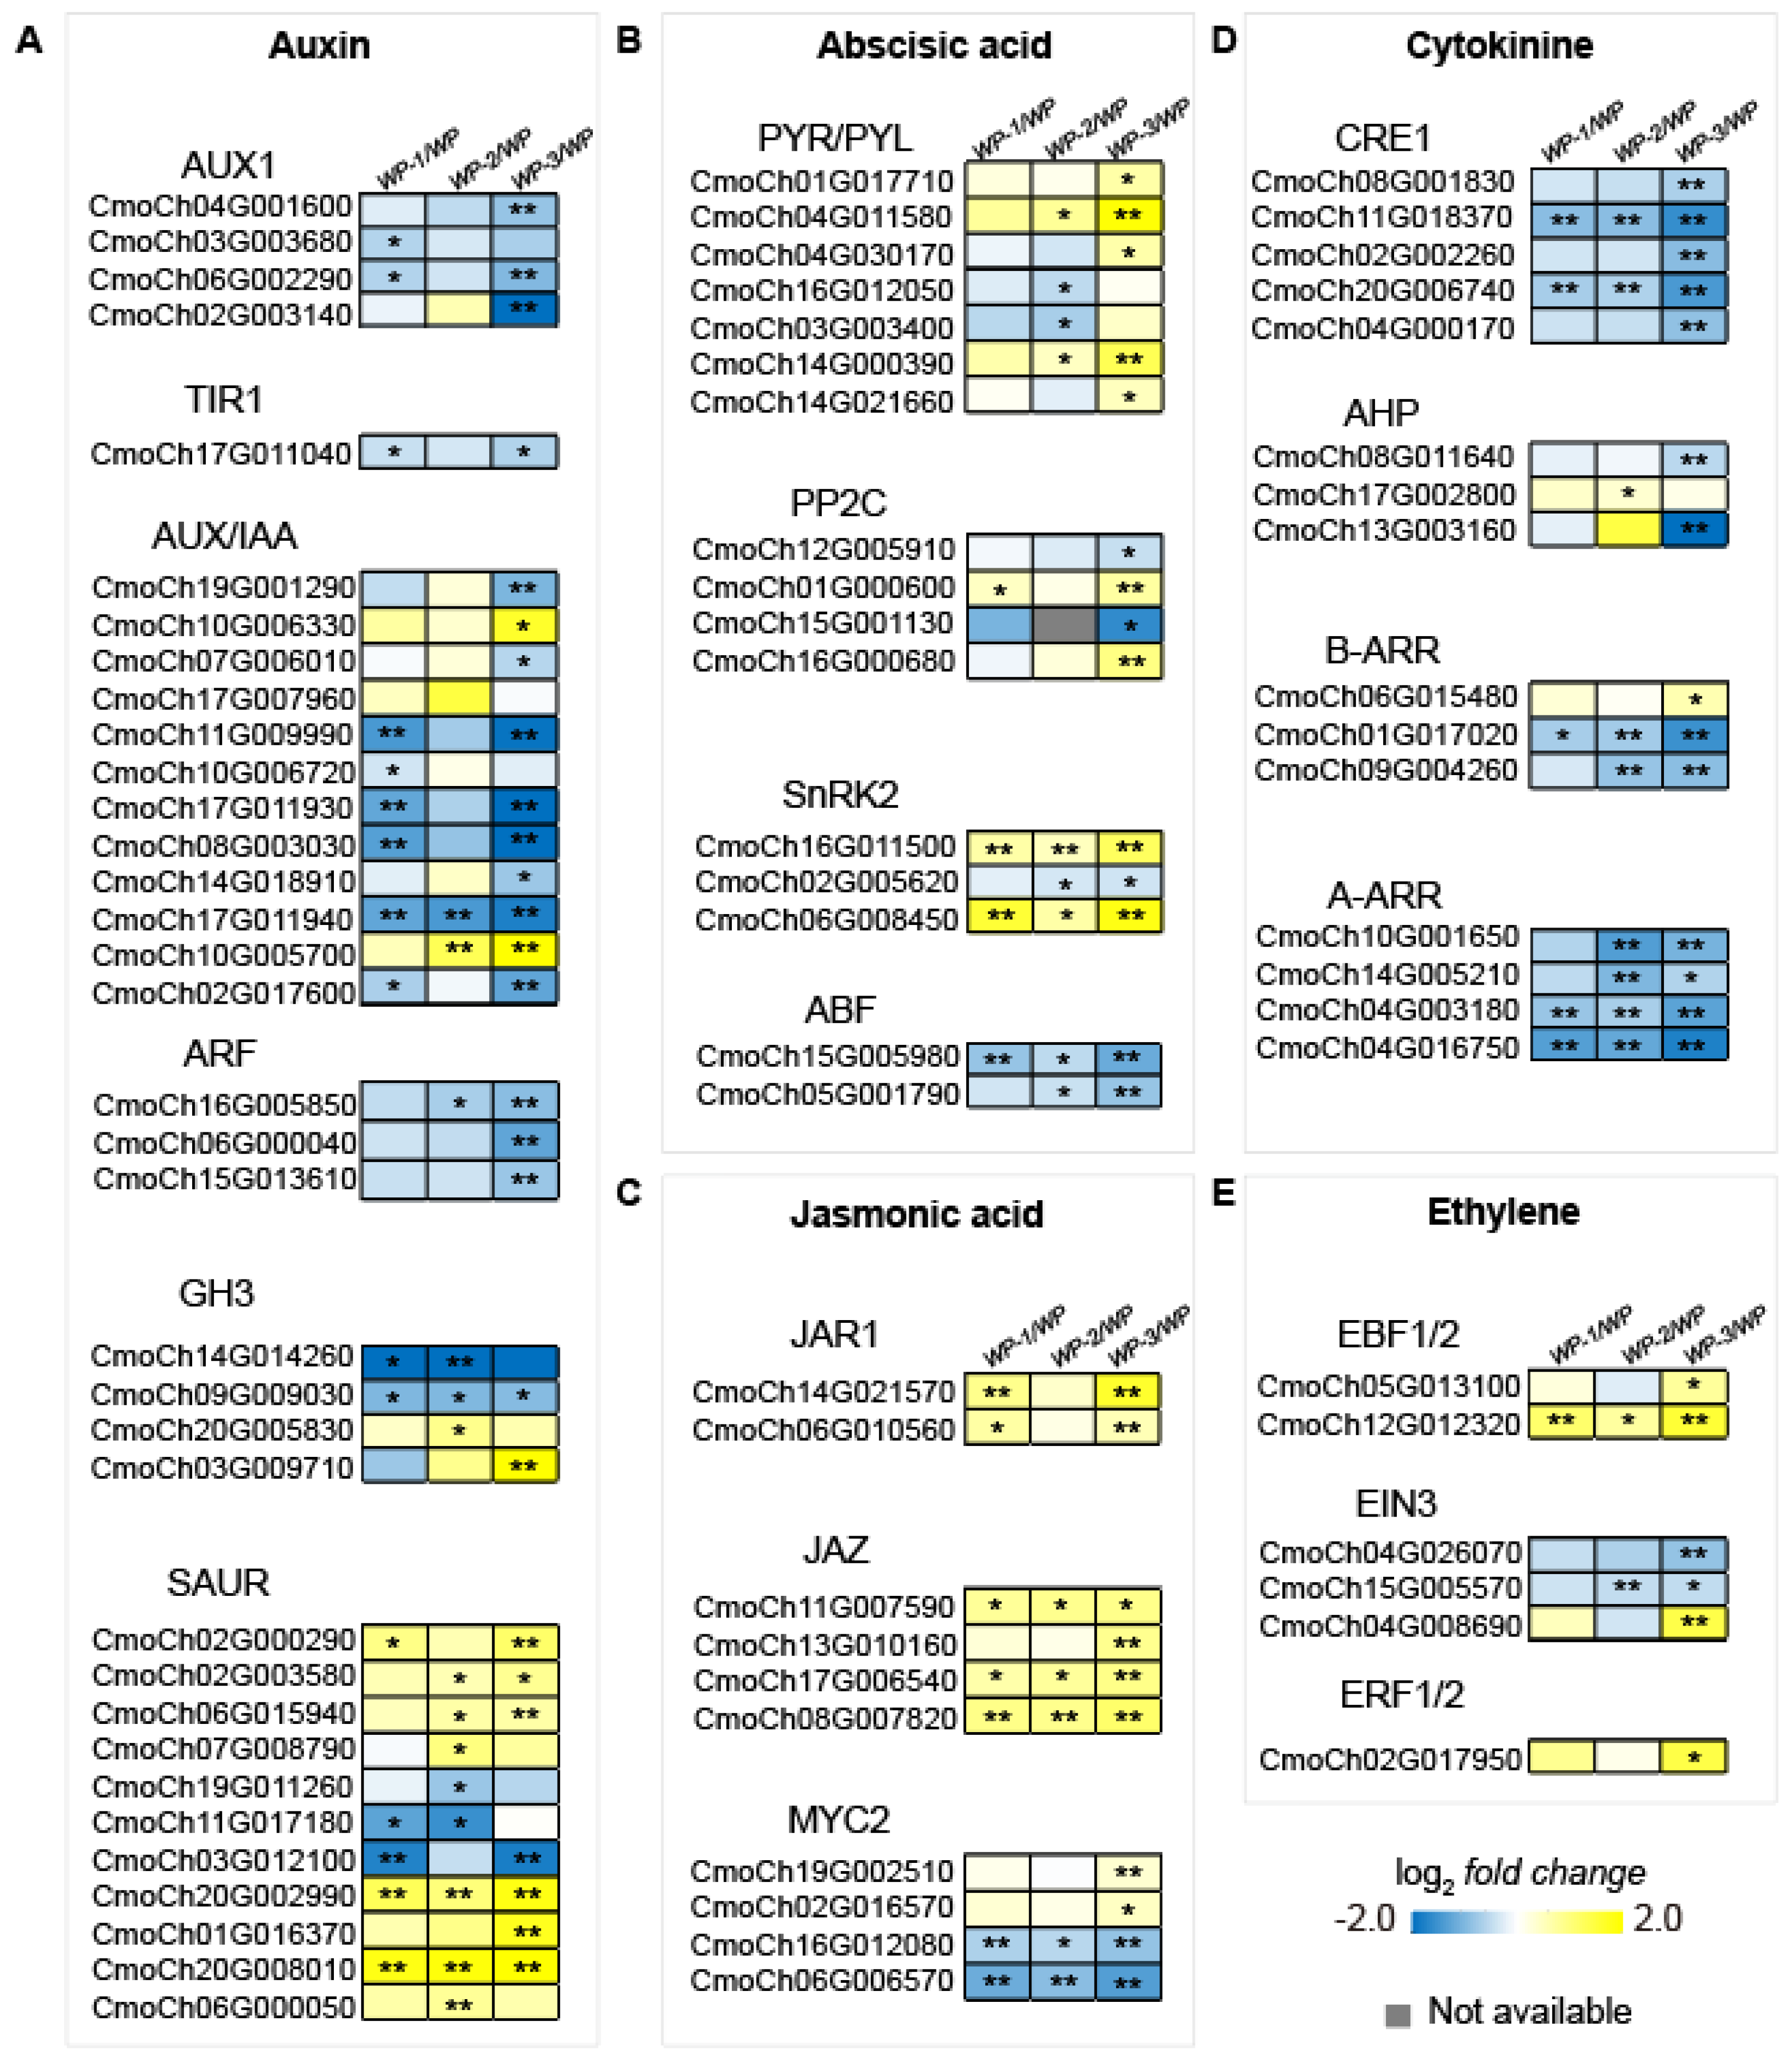
Figure 6.
Identifying modules related to phytohormones with WGCNA. (A) Weighted gene co-expression network analysis identified a hierarchical cluster tree showing co-expression modules, while the major tree branches constitute 24 modules labeled using different colors. (B) Module-trait relationship diagram. The left panel displays the genes matched by 24 modules. The blue-red color gradient represents the module feature correlation. Asterisks indicate the correlation between module samples and the corresponding p-value. * indicates p < 0.05; ** indicates p < 0.01. (C) The number of genes in each module.
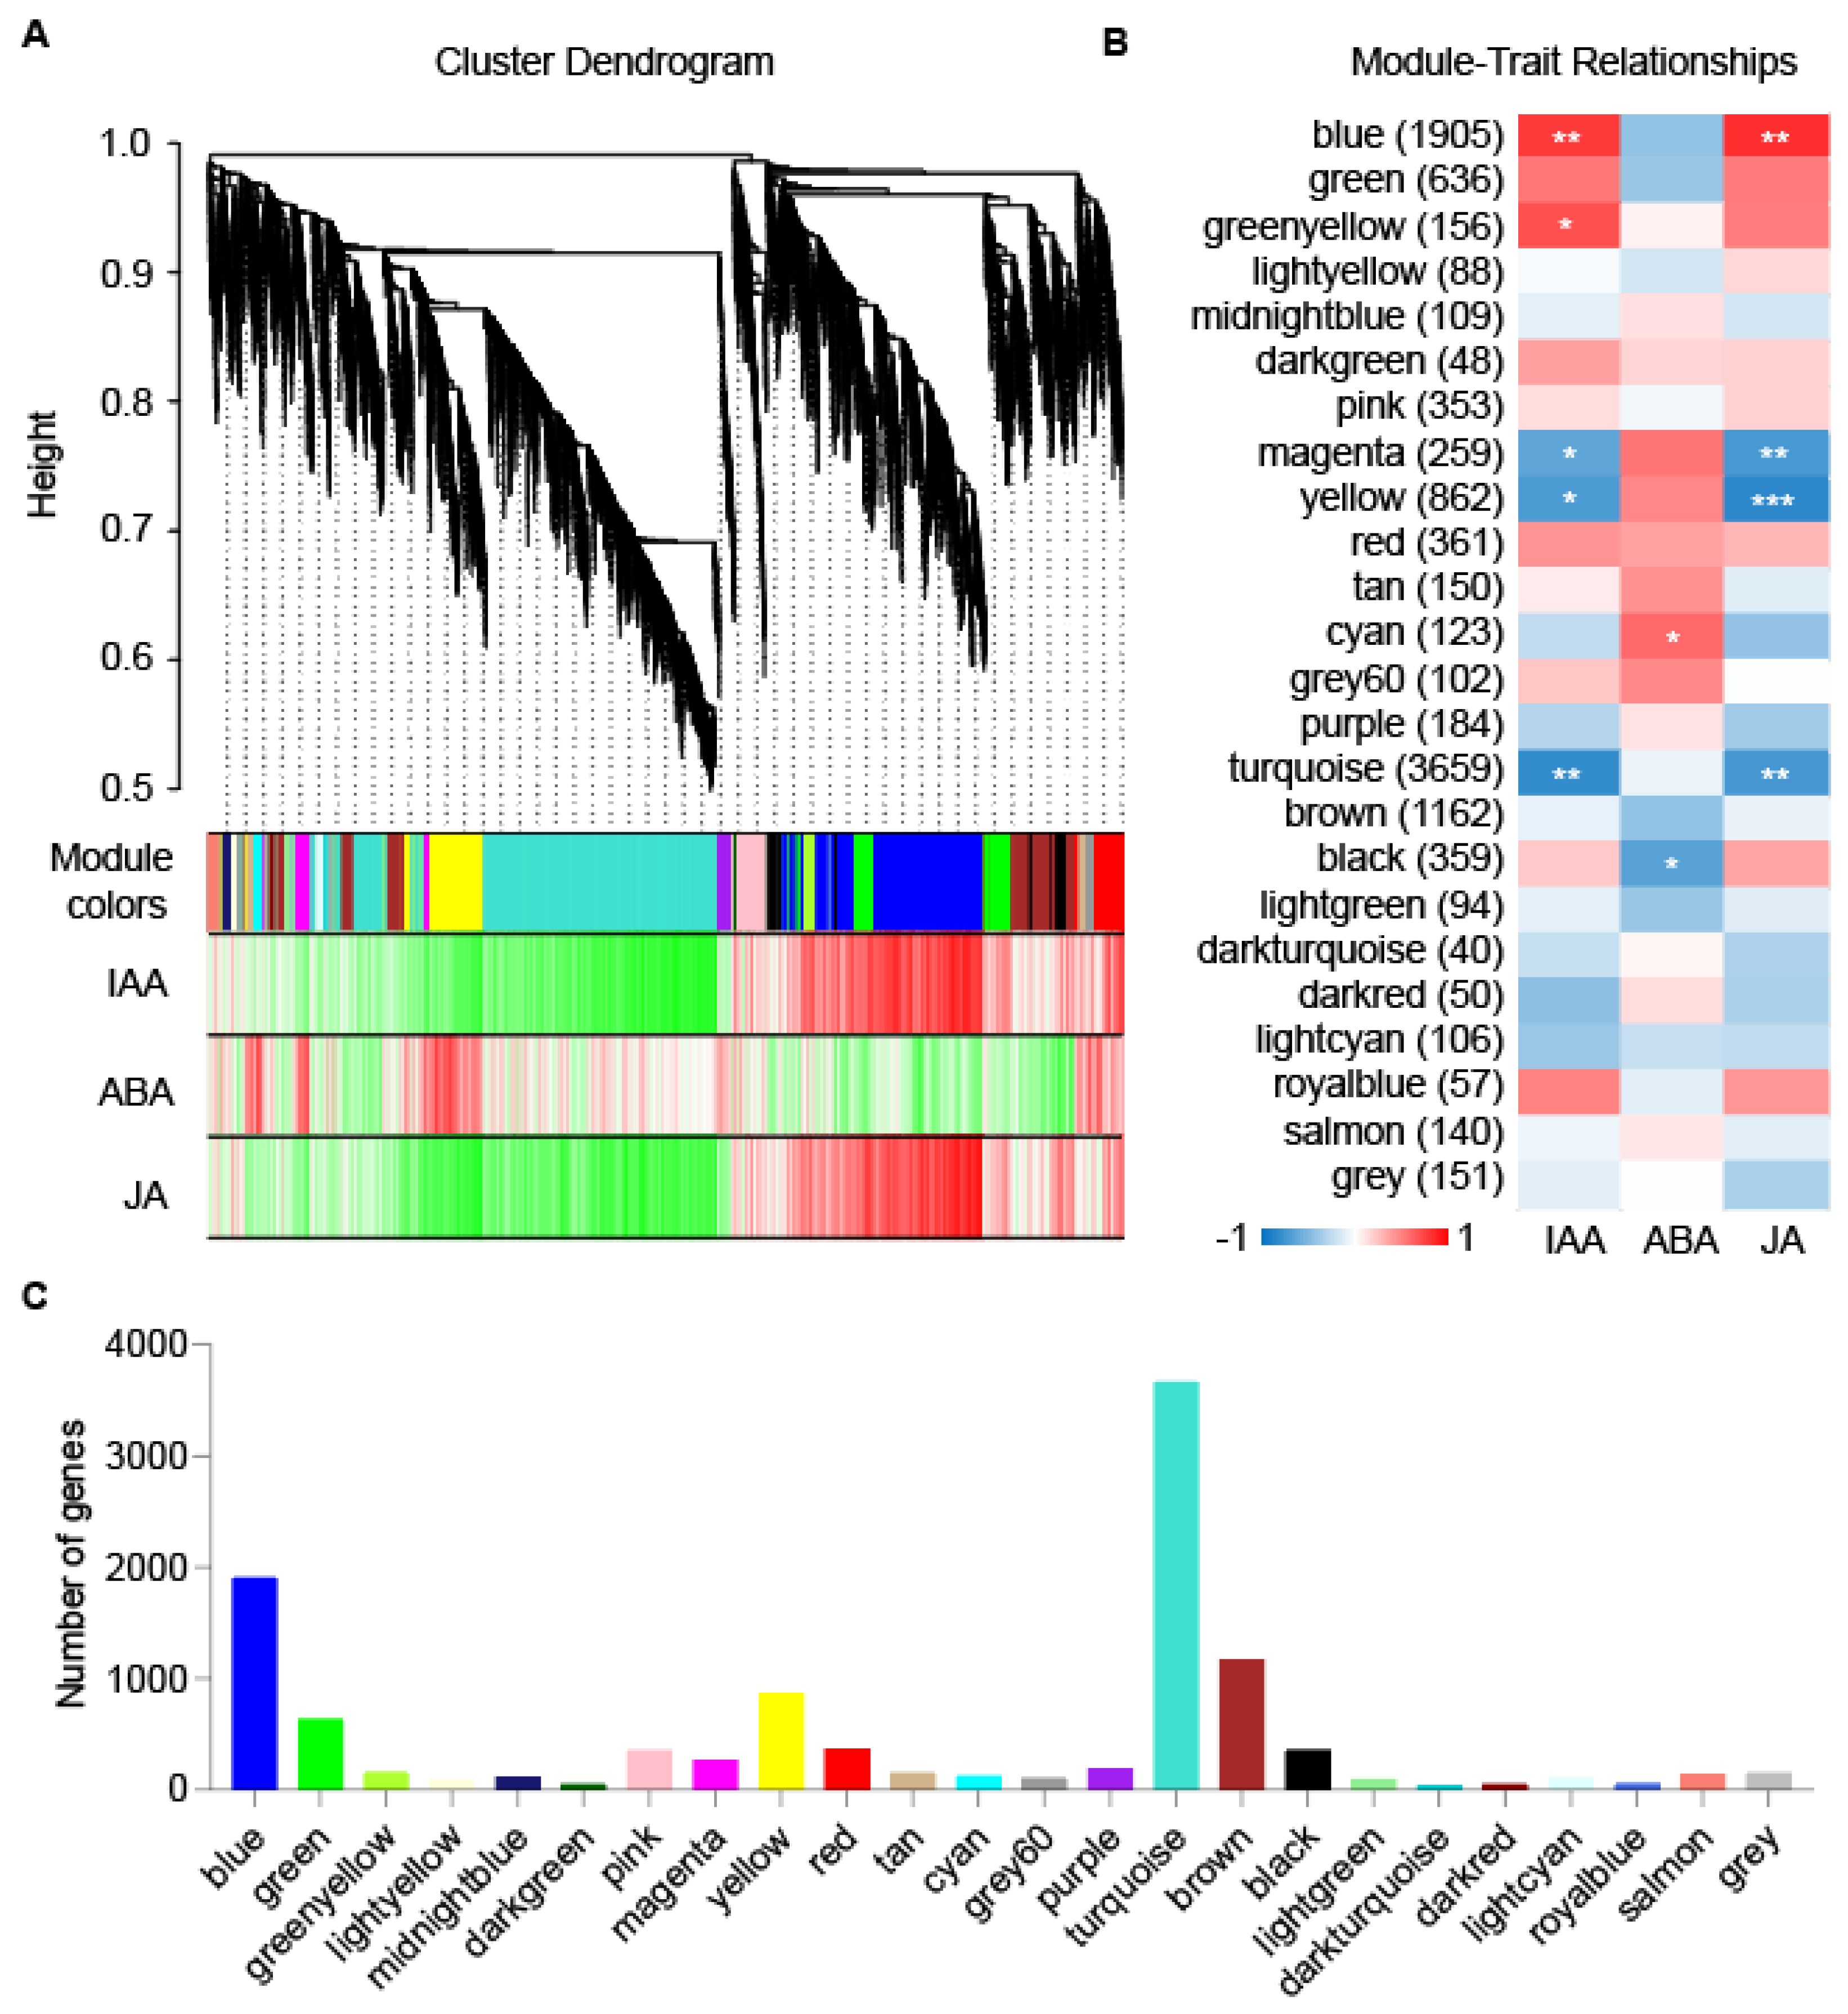
Figure 7.
Screening of co-expression network of central genes. Hub co-expression gene network for the blue (A), greenyellow (B), and cyan module (C). Each dot represents a gene, each line represents the regulatory relationship between them. Genes related to phytohormones and transcription factors are represented in bold font of different colors and shapes.
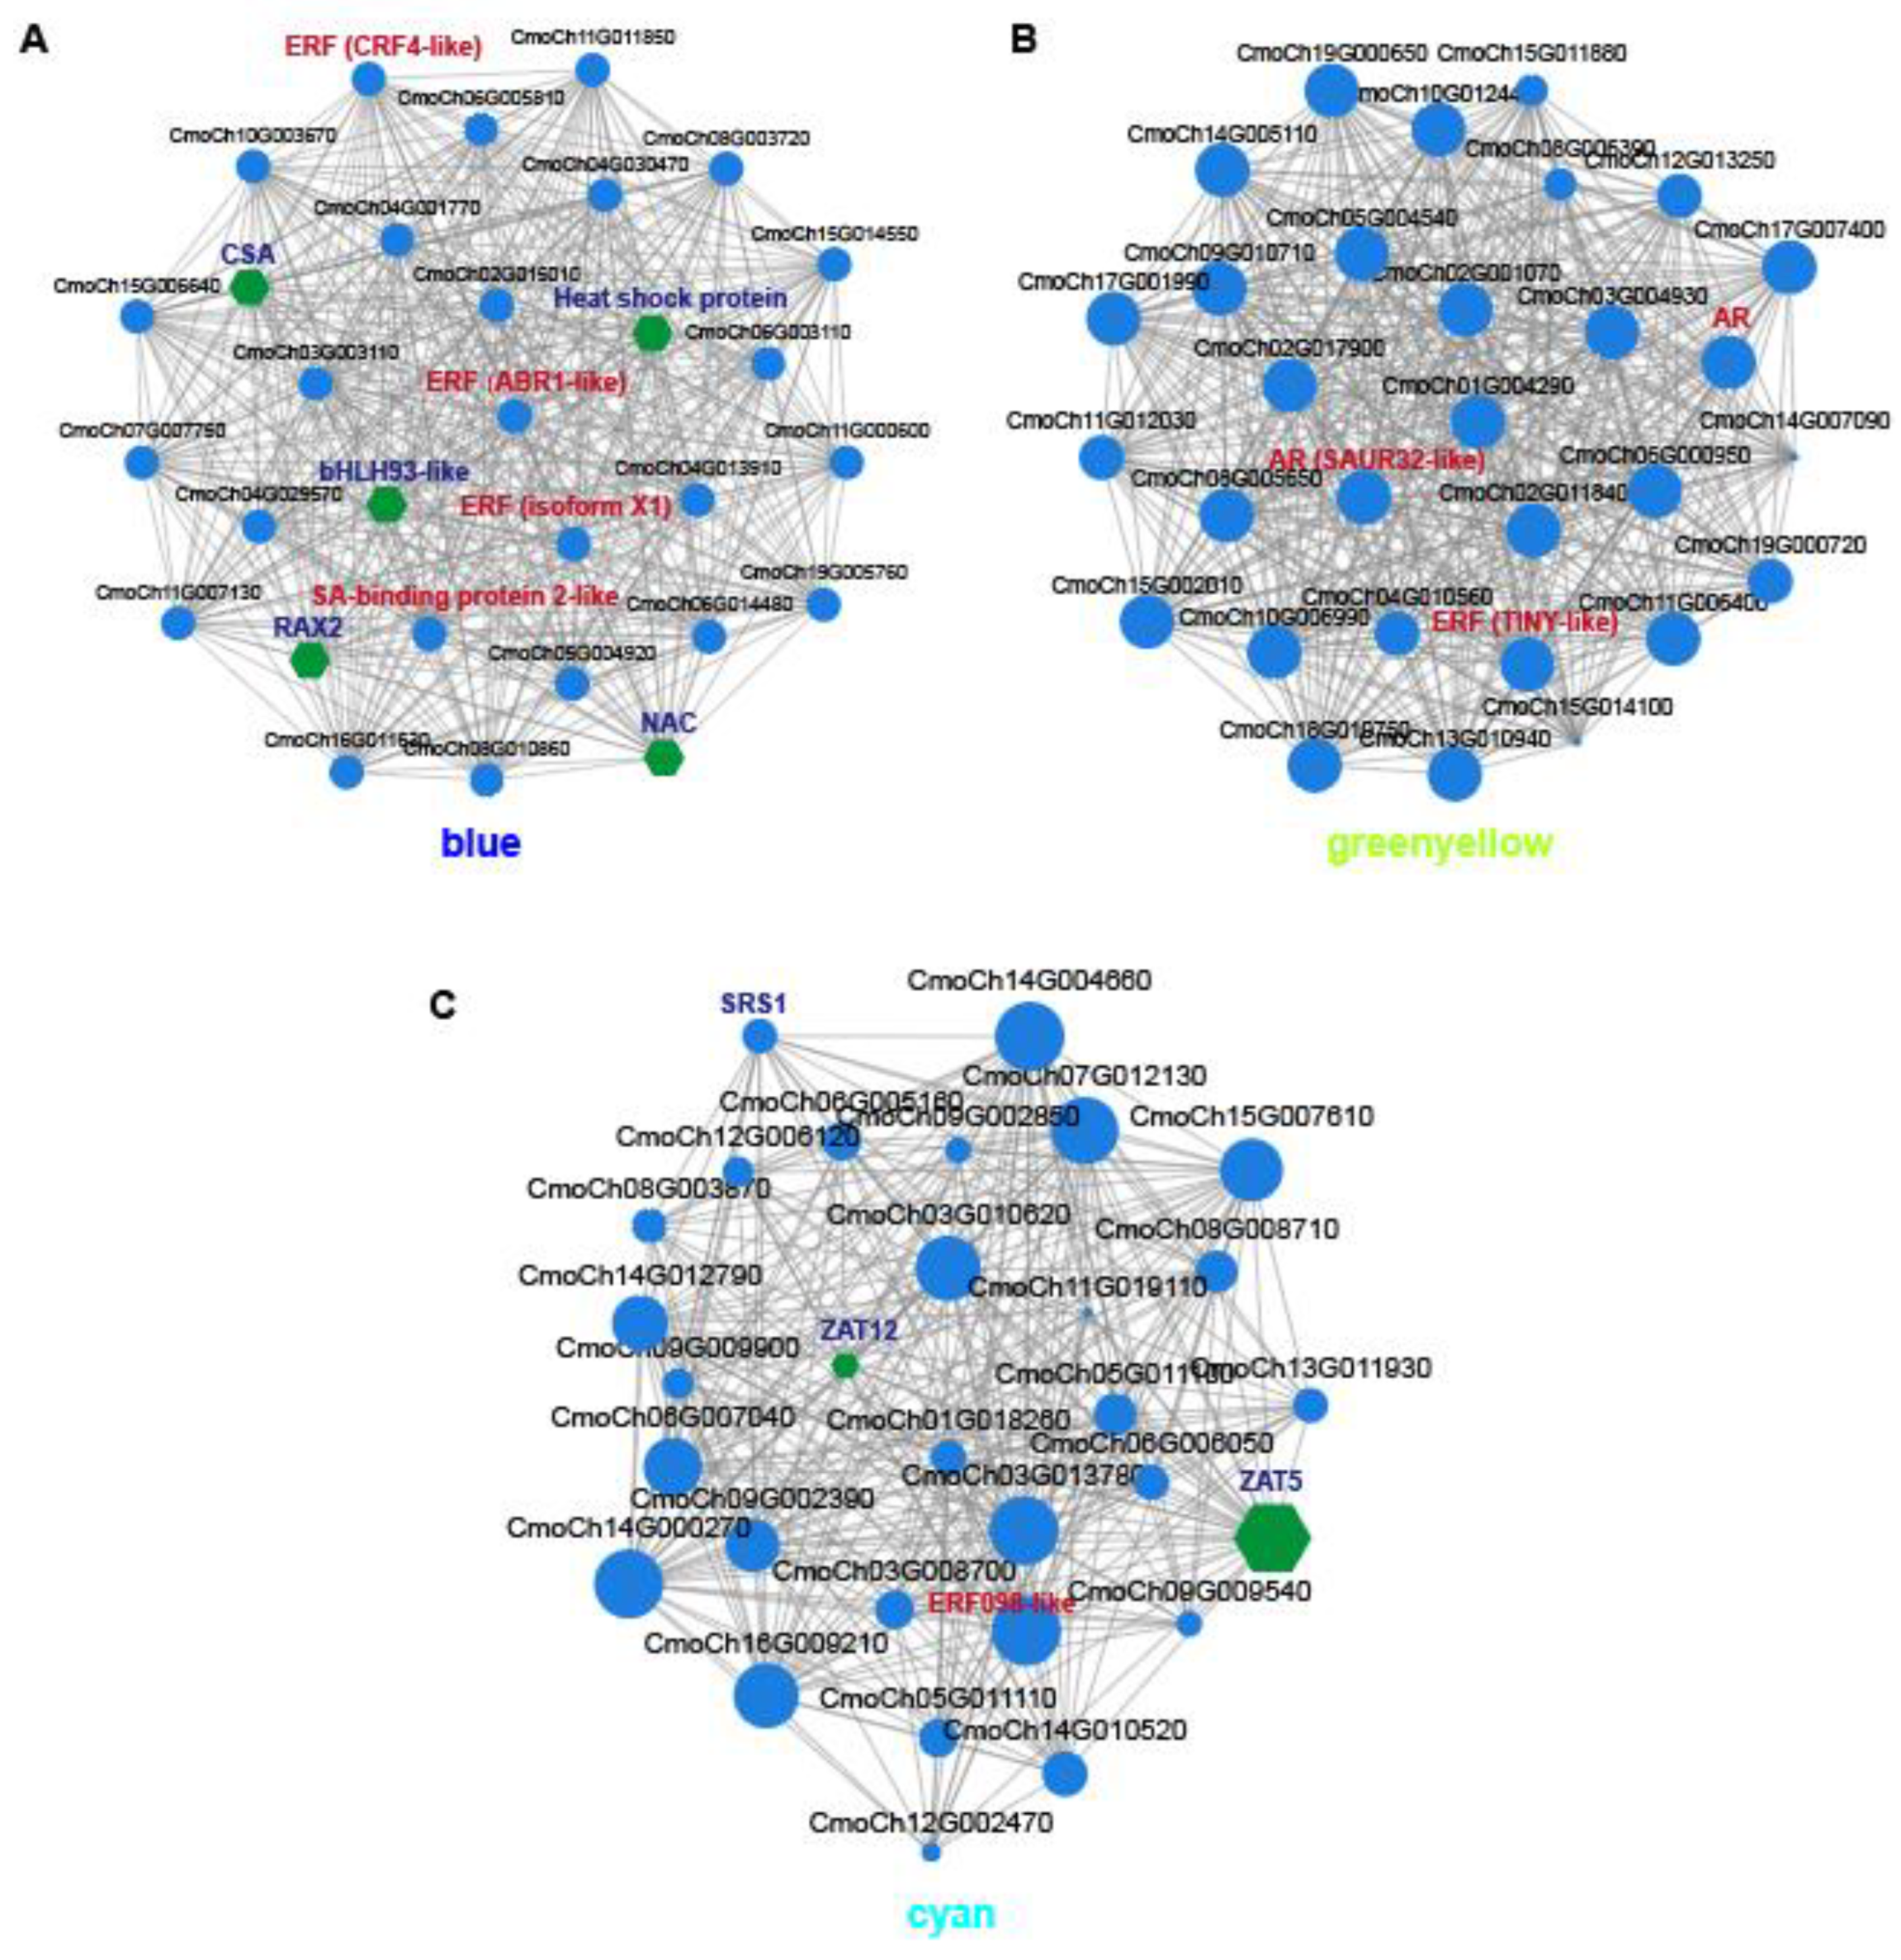
Figure 8.
qRT-PCR validation of RNA-seq data. Quantitative real-time PCR (qRT-PCR) was conducted to assess the transcript levels of selected phytohornomen genes (CmoCh02G017160, CmoCh01G019880, CmoCh08G007820, CmoCh08G002930, CmoCh04G002030, CmoCh18G001780), transcription factors (CmoCh06G006570) and mitogen-activated protein kinase (CmoCh01G005840) in WP, WP-1, WP-2, and WP-3 at Day 4. Error bars represent standard deviations of three biological replicates.
Disclaimer/Publisher’s Note: The statements, opinions and data contained in all publications are solely those of the individual author(s) and contributor(s) and not of MDPI and/or the editor(s). MDPI and/or the editor(s) disclaim responsibility for any injury to people or property resulting from any ideas, methods, instructions or products referred to in the content. |
© 2025 by the authors. Licensee MDPI, Basel, Switzerland. This article is an open access article distributed under the terms and conditions of the Creative Commons Attribution (CC BY) license (http://creativecommons.org/licenses/by/4.0/).
Copyright: This open access article is published under a Creative Commons CC BY 4.0 license, which permit the free download, distribution, and reuse, provided that the author and preprint are cited in any reuse.


