
Submitted:
17 January 2025
Posted:
18 January 2025
You are already at the latest version
Abstract
In the mining industry the most energy/demanding activity is particle size reduction, i.e. comminution. Blasting is the first stage of comminution. It has been experimentally and by field observation demonstrated that blasting produces two effects on rock: i) it produces macroscopic fracturing, fragmentation; ii) it generates microscopic fracturing, a series of microfractures that weaken the rock, reducing the specific Work Index, therefore making it less resistant to crushing and milling. The present work is aimed to verify the following hypothesis: do smaller particles, having been macroscopically more affected by blasting, also possess a higher degree of microfractures, therefore being less resistant to grinding? To verify this hypothesis we analyzed blasted rock under three test dominions: macroscopic testing via point loading, laboratory grinding testing via Bond’s mill to determine the blasted Work Index and microscopic optical observation of microfractures. The results show that macroscopic testing cannot appreciate microscopic weakening (no correlation between point load results and particle size). On the other hand, laboratory ball mill and microscopic optical observation results show a direct correlation between particle size and internal weakening of particles. The results are evidence, albeit very preliminary, that the Work Index might not be a constant within a given volume of blasted rock, and it could be a function of particle size distribution.
Keywords:
Blasting
; Comminution
; Particle Size
; Work Index
; Microfractures
Introduction
Goal n.12 of the 2030 Agenda for Sustainable Development aims to ensure sustainable consumption and production patterns [1]. In the the 2030 Agenda for Sustainable Development, there is a dedicated and stand-alone goal on energy, SDG 7, calling to "ensure access to affordable, reliable, sustainable and modern energy for all". [2].
Mining can do its part to reduce energy consumption and carbon footprint of energy generation. This paper studies this aspect from the point of view of comminution.
In the mining industry, particle size reduction (i.e. comminution) is the most energy demanding activity. It begins with blasting, and it is commonly followed by one or more stages of crushing and ore or more stages of milling (grinding). The energy consumption demand increases by order of magnitude along the comminution circuit. Figure 1 shows general figures of this increase in energy demand, while Figure 2 shows a real example of a Pb-Zn production plant: real data confirm this increase by order of magnitude both in terms of specific energy required to process the ore and in terms of energy demand of the equipment.
[5] (2021) show similar figures, adding that “In the American mining industry, […] grinding is responsible for 40% of the electricity used in the mines”. The work previously cited in Figure 1 by [3] points out the following advantages from better fragmentation of ore:
- Increase in ore recovery ratio;
- Decrease in energy waste (mainly due to increasing the temperature of the material instead of fragmenting it);
- Decrease in greenhouse emissions (comminution accounts for over 60% of the whole mining process).
Being blasting the least energy-consuming phase, great advantage can be taken from this activity to benefit the downstream processes and reduce the energy demand of the mining operation. Table 1 summarizes the meaning of such benefits.
As per the macroscopic rock fragmentation and its effects on downstream opearations, literature is abundant and with many insights (see just as some examples: [6,7,8,9,10,11,12,13,14,15]). Over the years several prediction models of the particle size distribution of the blasted muck pile that obtain good fitting with sieving. To mention some, the KUZ-RAM [16,17], the SWEBREC [18] among other studies [19]. In more recent year, the concept of the Fragmentation-Energy fan saw light [20]. it considers the percentiles of the particle size distribution (fragmentation) vis-a-vis the specific charges (energy in a log-log graph: they fit well in a fan fashion where straight lines tend to converge to a focal point (fan).
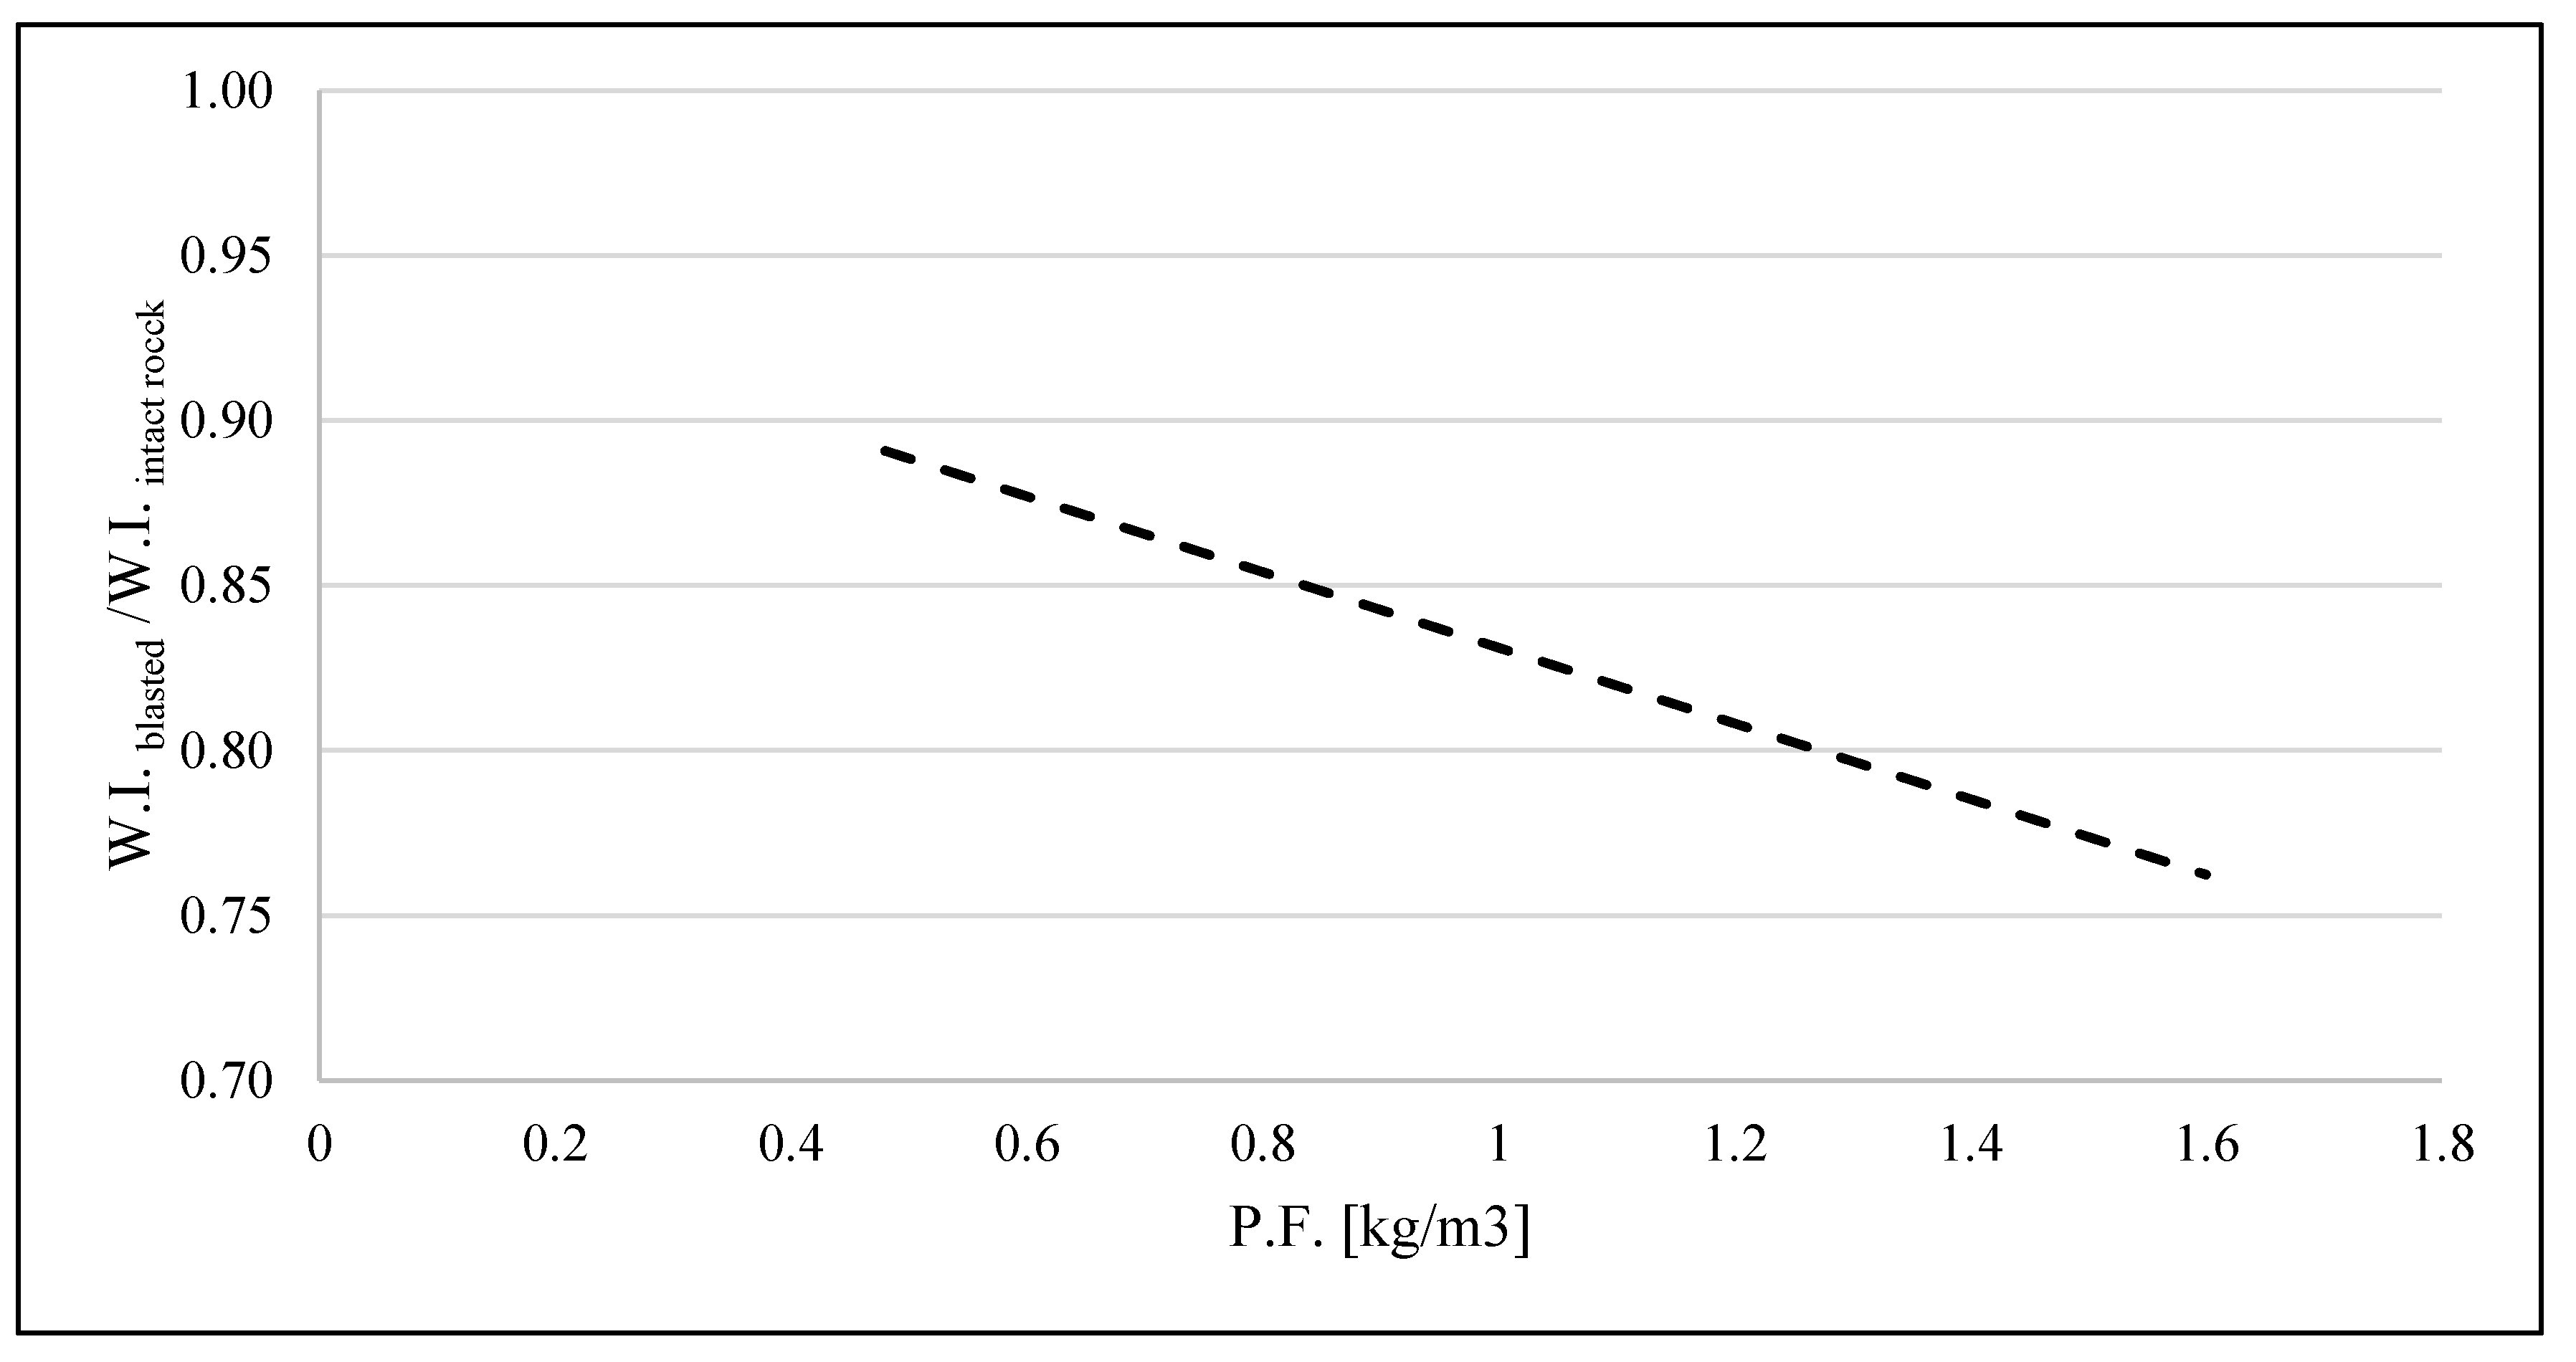
The microscopic weaking of the grinding resistance by means of micro-fractures (microscopic) has a different impoact in scientific literature. Studies are not so common. [21] pioneered the research: by means of microscopic analysis and laboratory tests they showed that increasing the Powder Factor (P.F). achieves significant reductions in Bond Work Index [22] due to the presence of micro-fractures in the material. [23,24] report and discuss a wide selection of them.
Figure 1 shows a general trend line obtained from results of experimental blasts at small-scale. Table 2 shows the results at industrial scale how increasing blasting at the mine benefits comminution circuits at the plant.
Figure 3.
Reduction ow the W.I. of blasted rock at the increase of the specific explosive charge. At laboratory scale. (Analysis of data by [21,25,26]).
The present work is aimed to study the relationship between the size of blasted fragments and their resistance. In particular, to verify the following hypothesis:
do smaller particles, having been macroscopically more affected by blasting, also possess a higher degree of microfractures, therefore being less resistant to grinding?
Materials and Methods
The rock for the present study is a copper-bearing andesitic lava, 1- 4% Cu. It has a porphyritic texture, with plagioclase phenocrystals of 1-10 mm and epidote and amphiboles alterations of 1-3 mm. The samples come from production blasts at the Experimental and School Mine of the the Universidad Catolica del Norte: a small-scale mining operation in the proximity of Antofagasta, in the II Region of Northern Chile. The specific blasts origin of the fragments studied here were a series of unconventional ones to widen the tunnel, therefore it is not possible to determine a specific explosive charge (P.F., kg/m3). Details of the characterization of this rock are given in the following sections of this document.
For the evaluation of the influence of particle size on the weakening of rock they were used the tests of Table 3, where the reason and the standards employed are detailed.
Point Load Tests
Point Load Strength Test
The point load strength test is used to estimate the σc of rocks without having to prepare perfectly machined cylindrical samples. Irregular fragments have been used to perform this test and the indications of [27] have been followed. The geometric conditions that this test must meet for each fragment are that the cross-sectional area is greater than 500 mm2, the relationship between the distance D and the width of the cross section W is between 0.3 and 1 (0.3<D/W<1) and that the distance from the point of application of the load to the free face in a direction perpendicular to the cross section is greater than half of D (L>0.5 D), as shown in Figure 3.
Figure 3.
Condiciones geométricas de los fragmentos de roca para el ensayo de fragmentos irregulares (ISMR, 2007).
Figure 3.
Condiciones geométricas de los fragmentos de roca para el ensayo de fragmentos irregulares (ISMR, 2007).
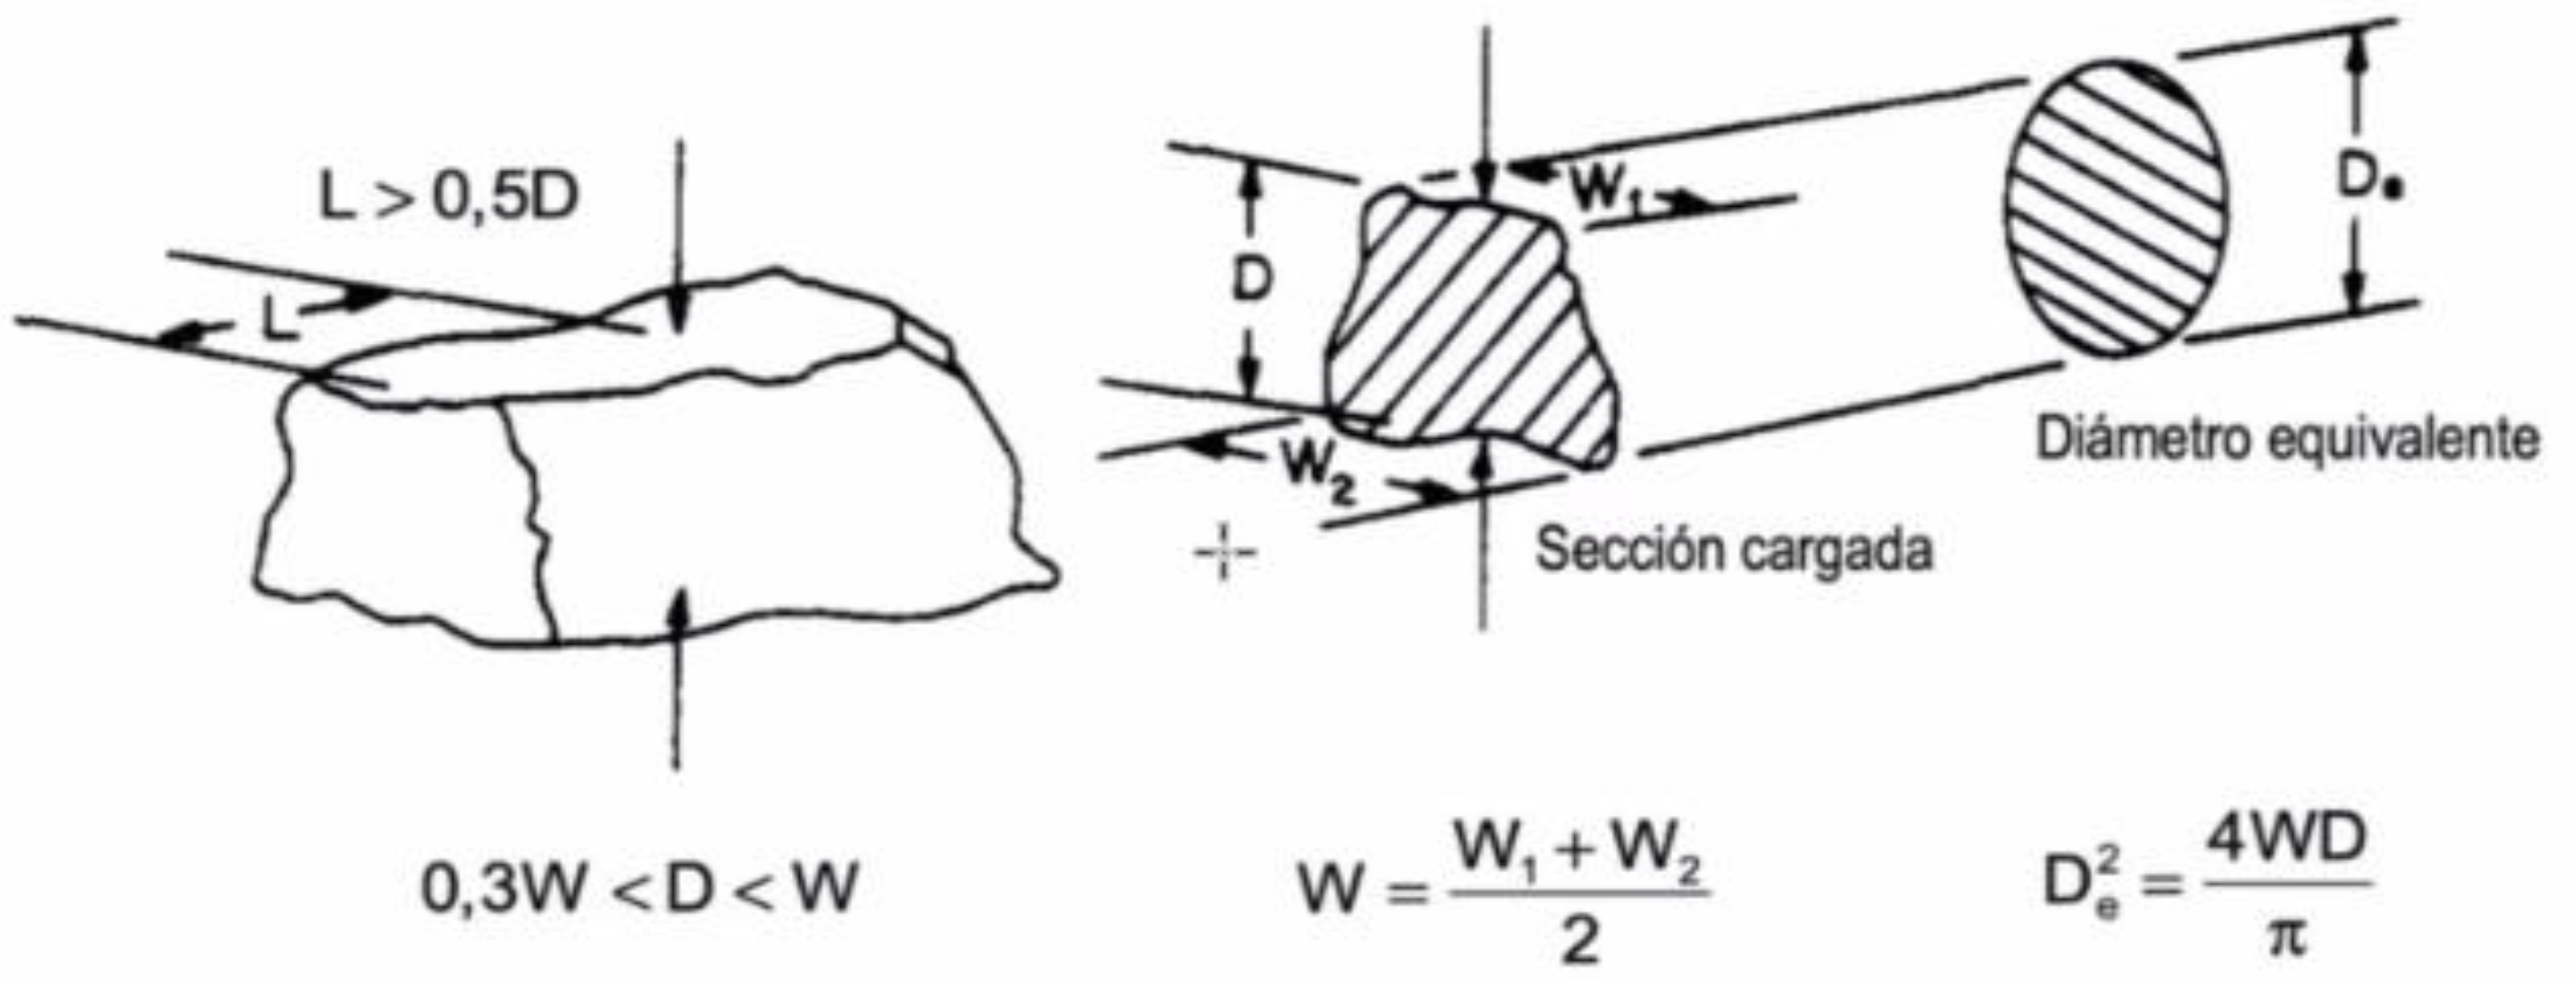
The procedure for estimating σc consists of calculating the corrected point load index, Is (50) (Equation 1) and multiplying it by a factor F that varies between 0 and 1 (Equation 2). To determine the value of the factor F, the Brook size correction (1985) was used using equations 3 and 4.
where Is (50) is the corrected point load index (MPa), P is the breaking load (kN), De the equivalent diameter of the fragment (mm), T500 is the point load index (MPa), A the area of the loaded section (mm2) and L the distance between the contact points and the free face in a direction perpendicular to the cross section (mm).
Samples for Point Load Tests
To begin with, rock fragments were collected from the debris produced by two different blasts carried out inside the site. These fragments were prepared so that they had flat faces. For this, the Controls Group cutting saw was used, thus providing a better contact surface at the loading points. In addition, the size of the fragment was regulated so that it could be tested. The samples were classified according to the blast with the following nomenclature:
- First blast (T1)
- Second blast (T2)
A total of thirty-one samples were obtained for the first blast (T1) and thirty samples for the second blast (T2).
To obtain the load that the fragments can withstand, it was used a Franklin press (Digital Rock Strength Index Apparatus from the Controls Group brand). The sample must be placed with high precision between the two conical tips to ensure that the load is applied in the center. The conical tips exert pressure by pumping from the hydraulic jack. This equipment has sensors that record oil pressure. The results obtained can be viewed on a real-time digital screen, which are stored for later analysis. The pressure is applied until the sample fractures and the digital screen stops the test, triggering an alarm indicating that the breaking force has been found. To validate the test, the breaking conditions of the samples were observed. Those samples that break in one or two breaking planes were considered valid, as shown in Figure 4.
Both regular-shaped samples and irregular ones of different sizes were used.
Results of Point Load Tests
Work Index Tests
Work Index of Material, Work Index (Wi)
This is the value calculated in kWh/t required to reduce a material of infinite particle size by 80% passing 100 microns, which is approximately equivalent to 65% passing 200 mesh. This index establishes the relative resistance to reduction of a material within the range of sizes tested, as well as the relative mechanical efficiencies of different machines and processes. It can be determined from any commercial or laboratory operation where the applied work and the size distribution of the feed material and the product are known (Bond F. C, 1952). The following equation is used for its calculation:
Pi: Sieve mesh through which 100% of the product's weight passes
P80: Sieve mesh through which 80% of the product's weight passes
F80: Sieve mesh through which 80% of the product's weight passes
Gbp: Grindability index in g/revolutions for the considered cut-off mesh
Specific Energy Consumption, W
This is the work or energy applied, expressed in kW-h per short ton, to a machine that reduces material from a defined feed size to a defined product size [22]. Its calculation is as follows:
Wi: SPecific Work Index of the material being grinded.
P80: Sieve mesh through which 80% of the product's weight passes
F80: Sieve mesh through which 80% of the product's weight passes
Material and mMethods for W.I.
The rock fragments collected for this part of the study come from a single blast. Fragments were classified into four groups according to size:
- Group 1 and 2: quartered from a particle size fraction 5cm<D<20cm
- Group 3 and 4: quartered from a particle size fraction 20cm<D<25cm
Each of the group of fragments corresponded to an amount of about 10 kg of material, considered representative. Then, all the groups were crushed separately, to obtain a particle size of the fragments finer than 6#. The 10 kg of each sample were homogenized and quartered into 20 sub-samples through a rotary sampler, as can be seen in Figure 7.
Then, one of the sub-samples is subjected to a granulometric analysis with a series of Tyler mesh sieves. This analysis is performed with the following mesh sizes: 8#, 14#, 20#, 30#, 40#, 50#, 70#, 100#, 140#, 200#, 325#, -325#.
To obtain the work index values, tests must be carried out in the bond mill (Figure 8).
An average of fragments size is considered for each group to generate the correlation shown in the graph of Figure 9. For groups one and two, a value of 12.5 cm was averaged, since the sizes of their fragments range from 5 to 20 cm, for groups three and four, a value of 22.5 cm was averaged, since the sizes range from 20 to 25 cm.
It appears to be a correlation between the average size of the fragments and the specific energy consumption, since the larger the fragments, the greater the amount of energy needed to reduce their size.
Microscope Analysis
- a)
- Fracture Density
Fracture density is the number of fractures in a given area. For practical cases:
- b)
- Diameter of the visual field of the Microscope
The actual diameter of the observed surface is calculated by dividing the diameter of the field of view by the magnification of the objective and eventually by the tube factor, where the formula is:
: Diameter of the visual field in the plane of the specimen.
: Field number in millimeters.
: Objective lens zoom.
: Tube lens magnification factor.
- c)
- Samples
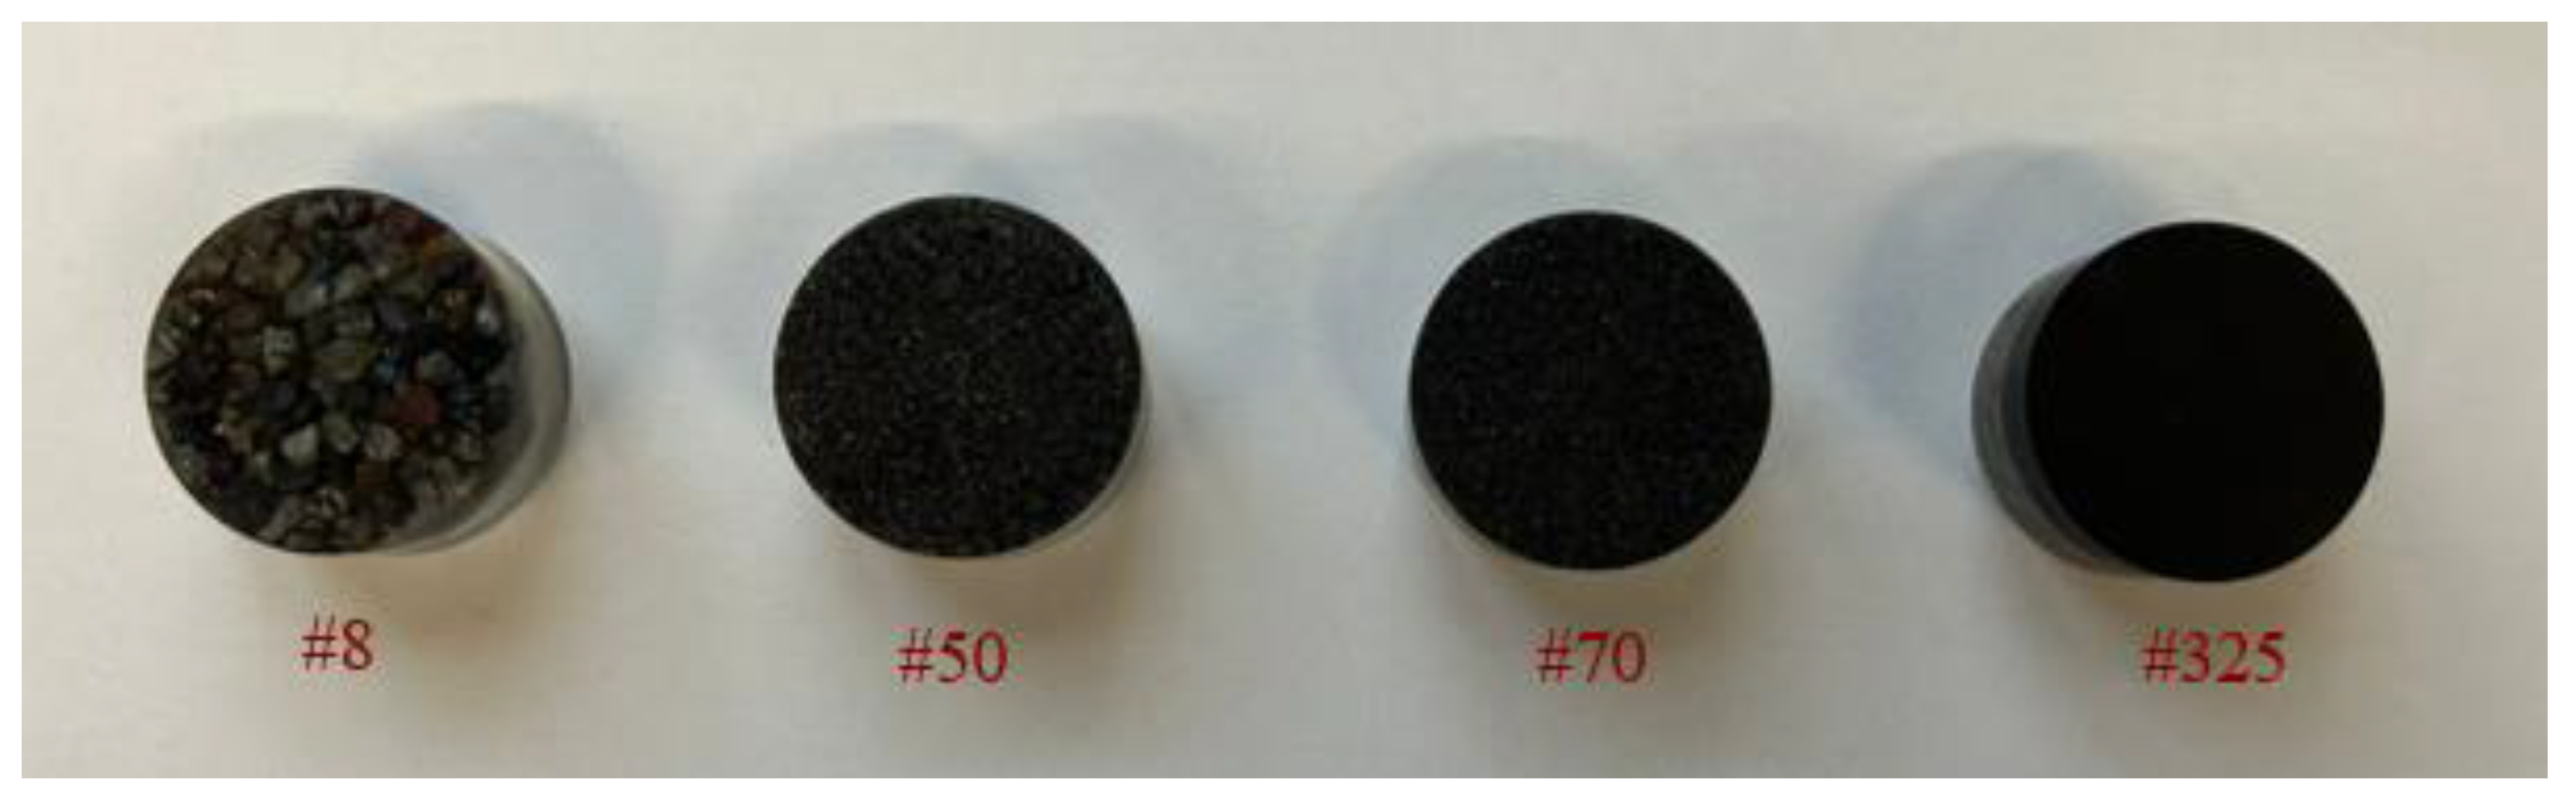
The samples come from the same blast of the previous experiments. Approximately five kilograms of samples were collected, then sieved, starting # 4 to # 325.
Once the samples have been separated by size, four mesh sizes are selected (Figure 10).
In order to carry out a correct observation under the microscope, the selected samples must be placed in polished briquettes. In this case, the MAINI® scientific team helped to create four polished briquettes reassociated with each selection mesh..
Figure 11.
Polished briquettes for each sample.
The polished briquettes are placed in a MCS-IM100 Microscope, obtaining images like the one of Figure 12. Between 4 and 5 images are necessary for each zoom and for each mesh sample to be representative, for a total of 26 pictures taken.
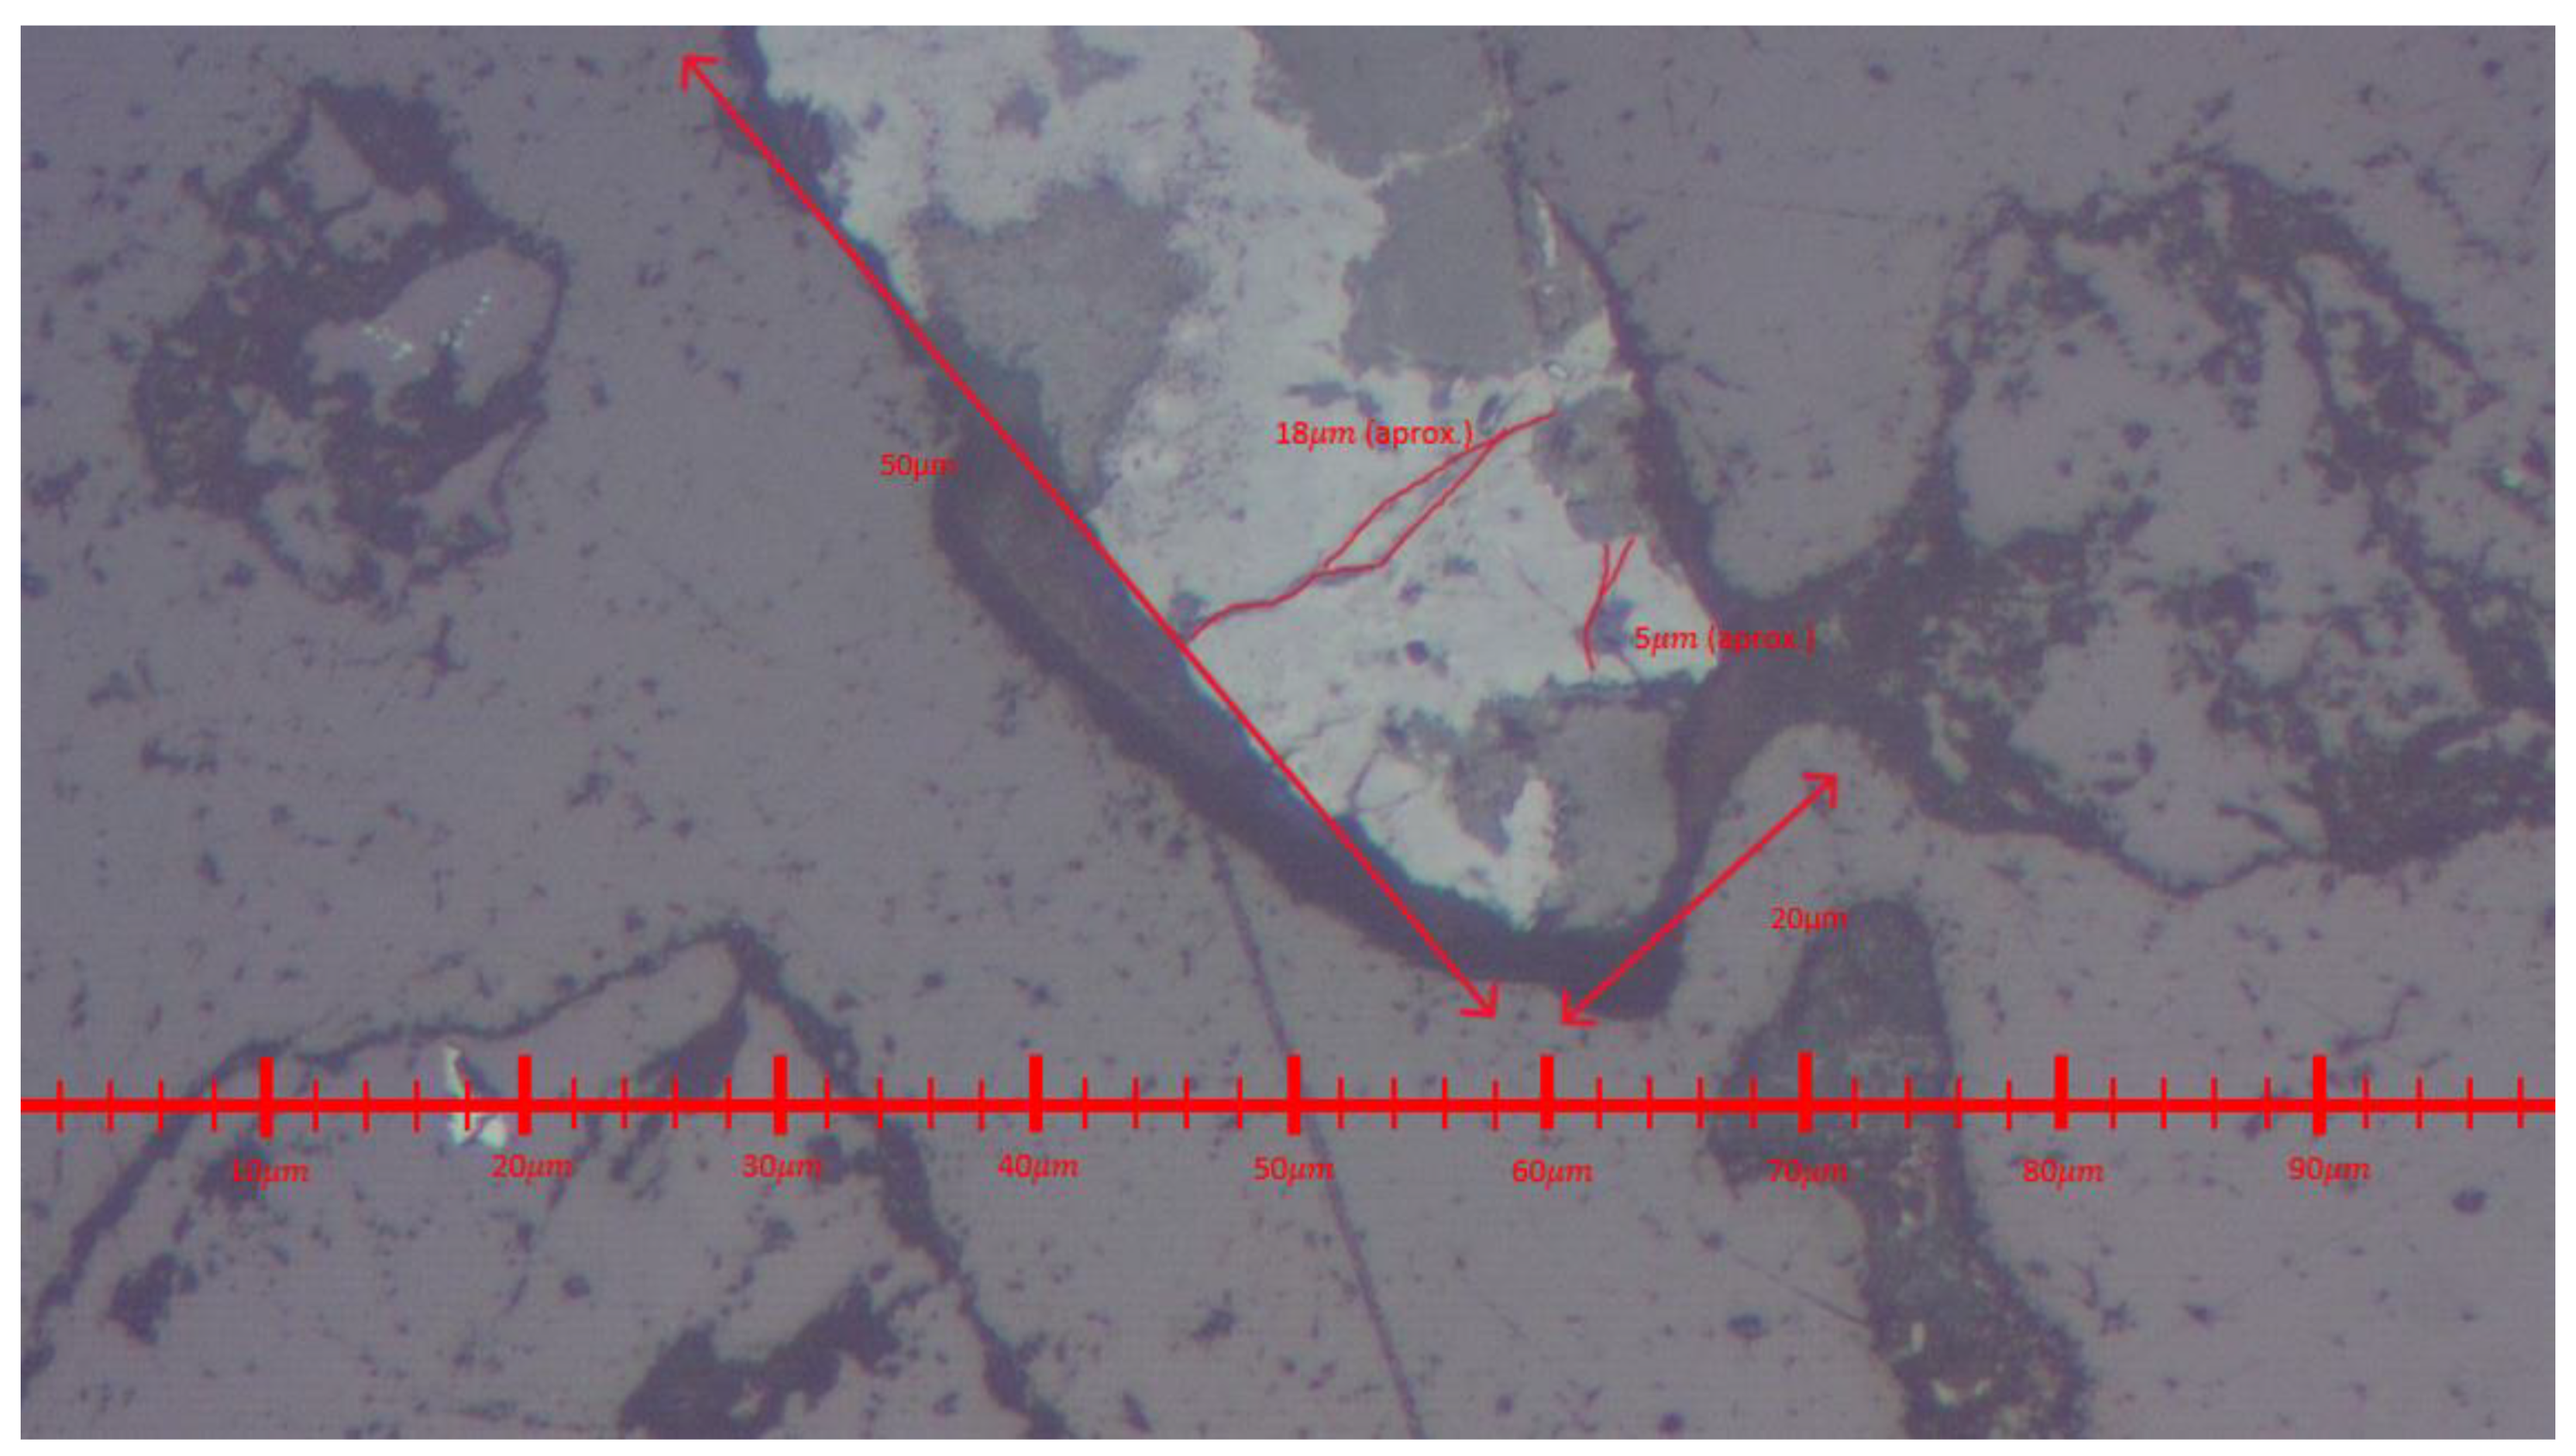
Once the images required for the study have been obtained, the diameter of the visual field is calculatedaccordin to Equation 2, giving the results as diameters expressed in Table 4. Figure 13 shows an example of a visual diameter with scale.
Subsequently, it is determined the area of the mineral particles observed in the images. The area corresponds to the maximum width by the length of particle in the sample: this is a way of standardizing the calculation of the area for all the samples.
Figure 14.
Representation of the calculation of the area of each sample.
Results from Microscope Analysis
Figure 15 show a typical result observed: the presence of a net of induced discontinuities (microfractures), which are not typical of the mineral. This was the case for all sample sizes.
Figure 16, Figure 17, Figure 18 and Figure 19 show the correlation sample size vs. number of fractures for each microscope lens zoom.
It appears to exist a correlation between particle size and the density of microfractures. The tendency is visible until the 20x zoom. The most evident is at the 10x zoom. In the largest zoom increment, one loses the perception of special distribution of fractures. Further studies will analyze more samples to address the influence of the zoom-size of visual field effect on the measurements.
Discussions
The results obtained give some insights regarding how to investigate macroscopic and microscopic effect of size-dependant pre-conditioning of rock via blasting. Our macroscopical approach was using the Point Load Test (PLT) as a mean to investigate the influence of particle size in the weakening of the blasted rock. The results gave no correlation between PLT strength and particle size. This indicate that, at least via PLT, one cannot appreciate this size-depending weakening at the macroscopic scale. This helps to rule out a type of test when investigating this topic For microscopic effect we used the Bond’s test for calculating the Work Index and microscopic observation to measure the length of blast-induced fractures in the blasted rock. The results from both tests gave the same results: microscoping weakening of the blasted material is size-dependant. First of all, this confirms that these two tests are effective to measure the microscopic size-dependency of the pre-conditioning of rock by the explosive.
As for the meaning of the results obtaines, the size-dependency of the grade of blast-induced weakening of rock, one must note that these results are very preliminary as they are based on a limited amount of tests. The interpretation suggests that the W.I.blasted is not a constant in a given volume of blasted rock.
This of course must be discussed considering other variables, such as lithology. For example, [25] from small-scale blast tests in granite and consequent measurement of W.I.blasted in ball mill, observed that the explosive decreases at smaller particle sizes, and that it is improbable to induce micro-fracturing at a scale smaller than the one of the mineral grains of the rock. Their that the effects of micro-cracking depend on the lithotype. The fractures observed in the present study break transversally the graons of the rock, mainly the plagioclase phenocrystals.
The authors of this study will continue this research with more material coming from more blasts at the same mine. The next stages of the research will include a proper measurement of the Poowder Factor of the blasts.
Conclusions
In the introduction it was explicated the Research Question of this study:
do smaller particles, having been macroscopically more affected by blasting, also possess a higher degree of microfractures, therefore being less resistant to grinding?
This research analyzed blasted rock under three test dominions:
- macroscopic testing via point loading,
- microscopic mechanical testing via Bond’s mill
- microscopic optical observation of microfractures.
Macroscopic testing seems to be unable to appreciate microscopic size-dependency weakening of blasted rock.
Microscopic mechanical and optical results, on the other hand, show a direct correlation between particle size and internal weakening of particles. The results are evidence, albeit very preliminary, that the Work Index might not be a constant within a given volume of blasted rock, and it could be a function of particle size distribution.
References
- UN (2024-1). Topic: Energy. Department of Economic and Social Affairs Sustainable Development. Available online: https://sdgs.un.org/topics/energy (accessed on 6 January 2024).
- UN (2024-2). Topics - Sustainable consumption and production. Department of Economic and Social Affairs Sustainable Development. Available online: https://sdgs.un.org/topics/energy (accessed on 6 January 2024).
- Zhang, Z. X., Sanchidrián, J. A., Ouchterlony, F.,; Luukkanen, S. Reduction of fragment size from mining to mineral processing: a review. Rock Mechanics and Rock Engineering 2023, 56, 747–778. [Google Scholar] [CrossRef]
- Magdalena, R., Valero, A., Palacios, J. L.,; Valero, A. Mining energy consumption as a function of ore grade decline: The case of lead and zinc. Journal of Sustainable Mining 2021, 20, 109–121. [Google Scholar] [CrossRef]
- Purhamadani, E., Bagherpour, R.,; Tudeshki, H. Energy consumption in open-pit mining operations relying on reduced energy consumption for haulage using in-pit crusher systems. Journal of Cleaner Production 2021, 291, 125228. [Google Scholar] [CrossRef]
- Mackenzie, A. S. Optimum blasting. Annual Minnesota Mining Symposium, Proceeding Duluth, MN, 1967; pp. 181–188. [Google Scholar]
- Clerici, C.; et al. Blasting operations in quarry. Mutual influen ce between blasting and fragmentation. In Congress on ornamental stones and industrial minerals mining; 1. Proceedings; Politecnico di Torino: Torino, 1974. [Google Scholar]
- Scott, A. (Ed.) Open pit blast design: analysis and optimization; The University of Queensland, Julius Kruttschnitt Mineral Research Centre (JKMRC): Brisbane, 1996; 338p. [Google Scholar]
- Božic, B. Control of fragmentation by blasting. Rudarsko-geoloiko-nafini zbornik, Zagreb 1998, 10, 49–57. [Google Scholar]
- Sastry, V.; Chandar, K. Influence of the initiation system on blast results: case studies. Fragblast 2004, (8), 207–220. [Google Scholar] [CrossRef]
- Morin, M.A.; Ficarrazzo, F. Monte Carlo simulation as a tool to predict blasting fragmentation based on the Kuz–Ram model. Computers & Geosciences 2006, (32), 352–359. [Google Scholar]
- Mansfield, S.; Schoeman, J. L. Blasting solutions for rapid mine expansion. Annual Conference International Society Of Explosives Engineers; 2010; 36. [Google Scholar]
- Seccatore, J.; De Tomi, G.; Munaretti, E.; Dompieri, M. Blasting fragmentation management: an innovative approach using complexity analysis. REM: R. Esc. Minas, Ouro Preto 2011, 64, 525–530. [Google Scholar]
- Cardu, M., Dompieri, M., Seccatore, J. omplexity Analysis of blast-induced vibrations in underground mining: a case study. International Journal of Mining Science and Technology 2012, 22, 125–132. [Google Scholar] [CrossRef]
- Dompieri, M., Seccatore, J., De Tomi, G., Nader, B. An innovative approach to mine blast fragmentation management using complexity analysis: three case studies. 7th International Conference on Intelligent Processing and Manufacturing of Materials – IPMM, Foz do Iguaçu, Brazil, September, 2-3, 2012. [Google Scholar]
- Cunnnigham, C.V.B. The Kuz-Ram model for prediction of fragmentation from blasting. 1st International Symposium on Rock Fragmentation by Blasting, Lulea University Technology, Lulea, Sweden, Aug. 22– 26 1983; pp. 439–453. [Google Scholar]
- Cunnnigham, C.V.B. R., Holmberg, et al., Eds.; The Kuz-Ram fragmentation model – 20 years on. Brighton Conference Proceedings 2005, European Federation of Explosives Engineers. 2005; 201–210ISBN 0-9550290-0-7. [Google Scholar]
- Ouchterlony, F., Olsson, M., Nyberg, U., Andersson, P., Gustavsson L. Constructing the fragment size distribution of a bench blasting round, using the new Swebrec function. Rock Fragmentation by Blasting 2006, 332–344. [Google Scholar]
- Ryu, D. W., Shim, H. J., Han, C.Y., Ahn, S. M. Prediction of rock fragmentation and design of blasting pattern based on 3-D spatial distribution of rock factor. International journal of rock mechanics and mining sciences 2009, 46, 326–332. [Google Scholar] [CrossRef]
- Ouchterlony, F., Sanchidrián, J.A.; Moser, P. Percentile Fragment Size Predictions for Blasted Rock and the Fragmentation–Energy Fan. . Rock Mech Rock Eng 2017, 50, 751–779. [Google Scholar] [CrossRef]
- Nielsen, K.; Kristianen, J. Blasting-crushing-grinding: Optimization of an integrated comminution system. In Rock Fragmentation by Blasting; CRC Press: London, 1996; p. 472. ISBN 9789054108245. [Google Scholar]
- Bond, F.C. Bemrose, C.R., Bridgwater, J., Eds.; Crushing and Grinding Calculations. In A Review of Attrition and Attrition Test Methods; Powder Technology, 1961; pp. 97–126. [Google Scholar]
- Katsabanis , P.D., Kelebek, S., Pelley, C., Pollanen, M. "Blasting effects on the grindability of Rocks. Proc. of the 30th Annual Conference on Explosives and Blasting Technique, New Orleans, USA, Feb 2004. [Google Scholar]
- Seccatore, J. A review of the benefits for comminution circuits offered by rock blasting. REM: Rev. Esc. Minas. REM, Int. Eng. J., Ouro Preto 2019, 72, 133–138. [Google Scholar] [CrossRef]
- . Katsabanis, P.D., Kim, S., Tawadrous, A., Sigler, J. Effect of powder factor and timing on the impact breakage of rocks. Proc. of the 34th Annual Conference on Explosives and Blasting Technique, Nashville, USA, Feb 2008. [Google Scholar]
- Seccatore, J., Cardu, M., Marin, T. How the distribution of blasting charges influences the energy of comminution of rocks. Journal of the Southern African Institute of Mining and Metallurgy 2024, 124. [Google Scholar]
- ISRM (2007) The Complete ISRM Suggested Methods for Rock Characterization, Testing and Monitoring: 1974-2006. En: R Ulusay and JA Hudson (eds) Commission on Testing Methods, International Society for Rock Mechanics. ISRM Turkish National Group, Ankara.
Figure 1.
Progressive increase in energy demand with the finer stages of comminution. After [3].
Figure 1.
Progressive increase in energy demand with the finer stages of comminution. After [3].
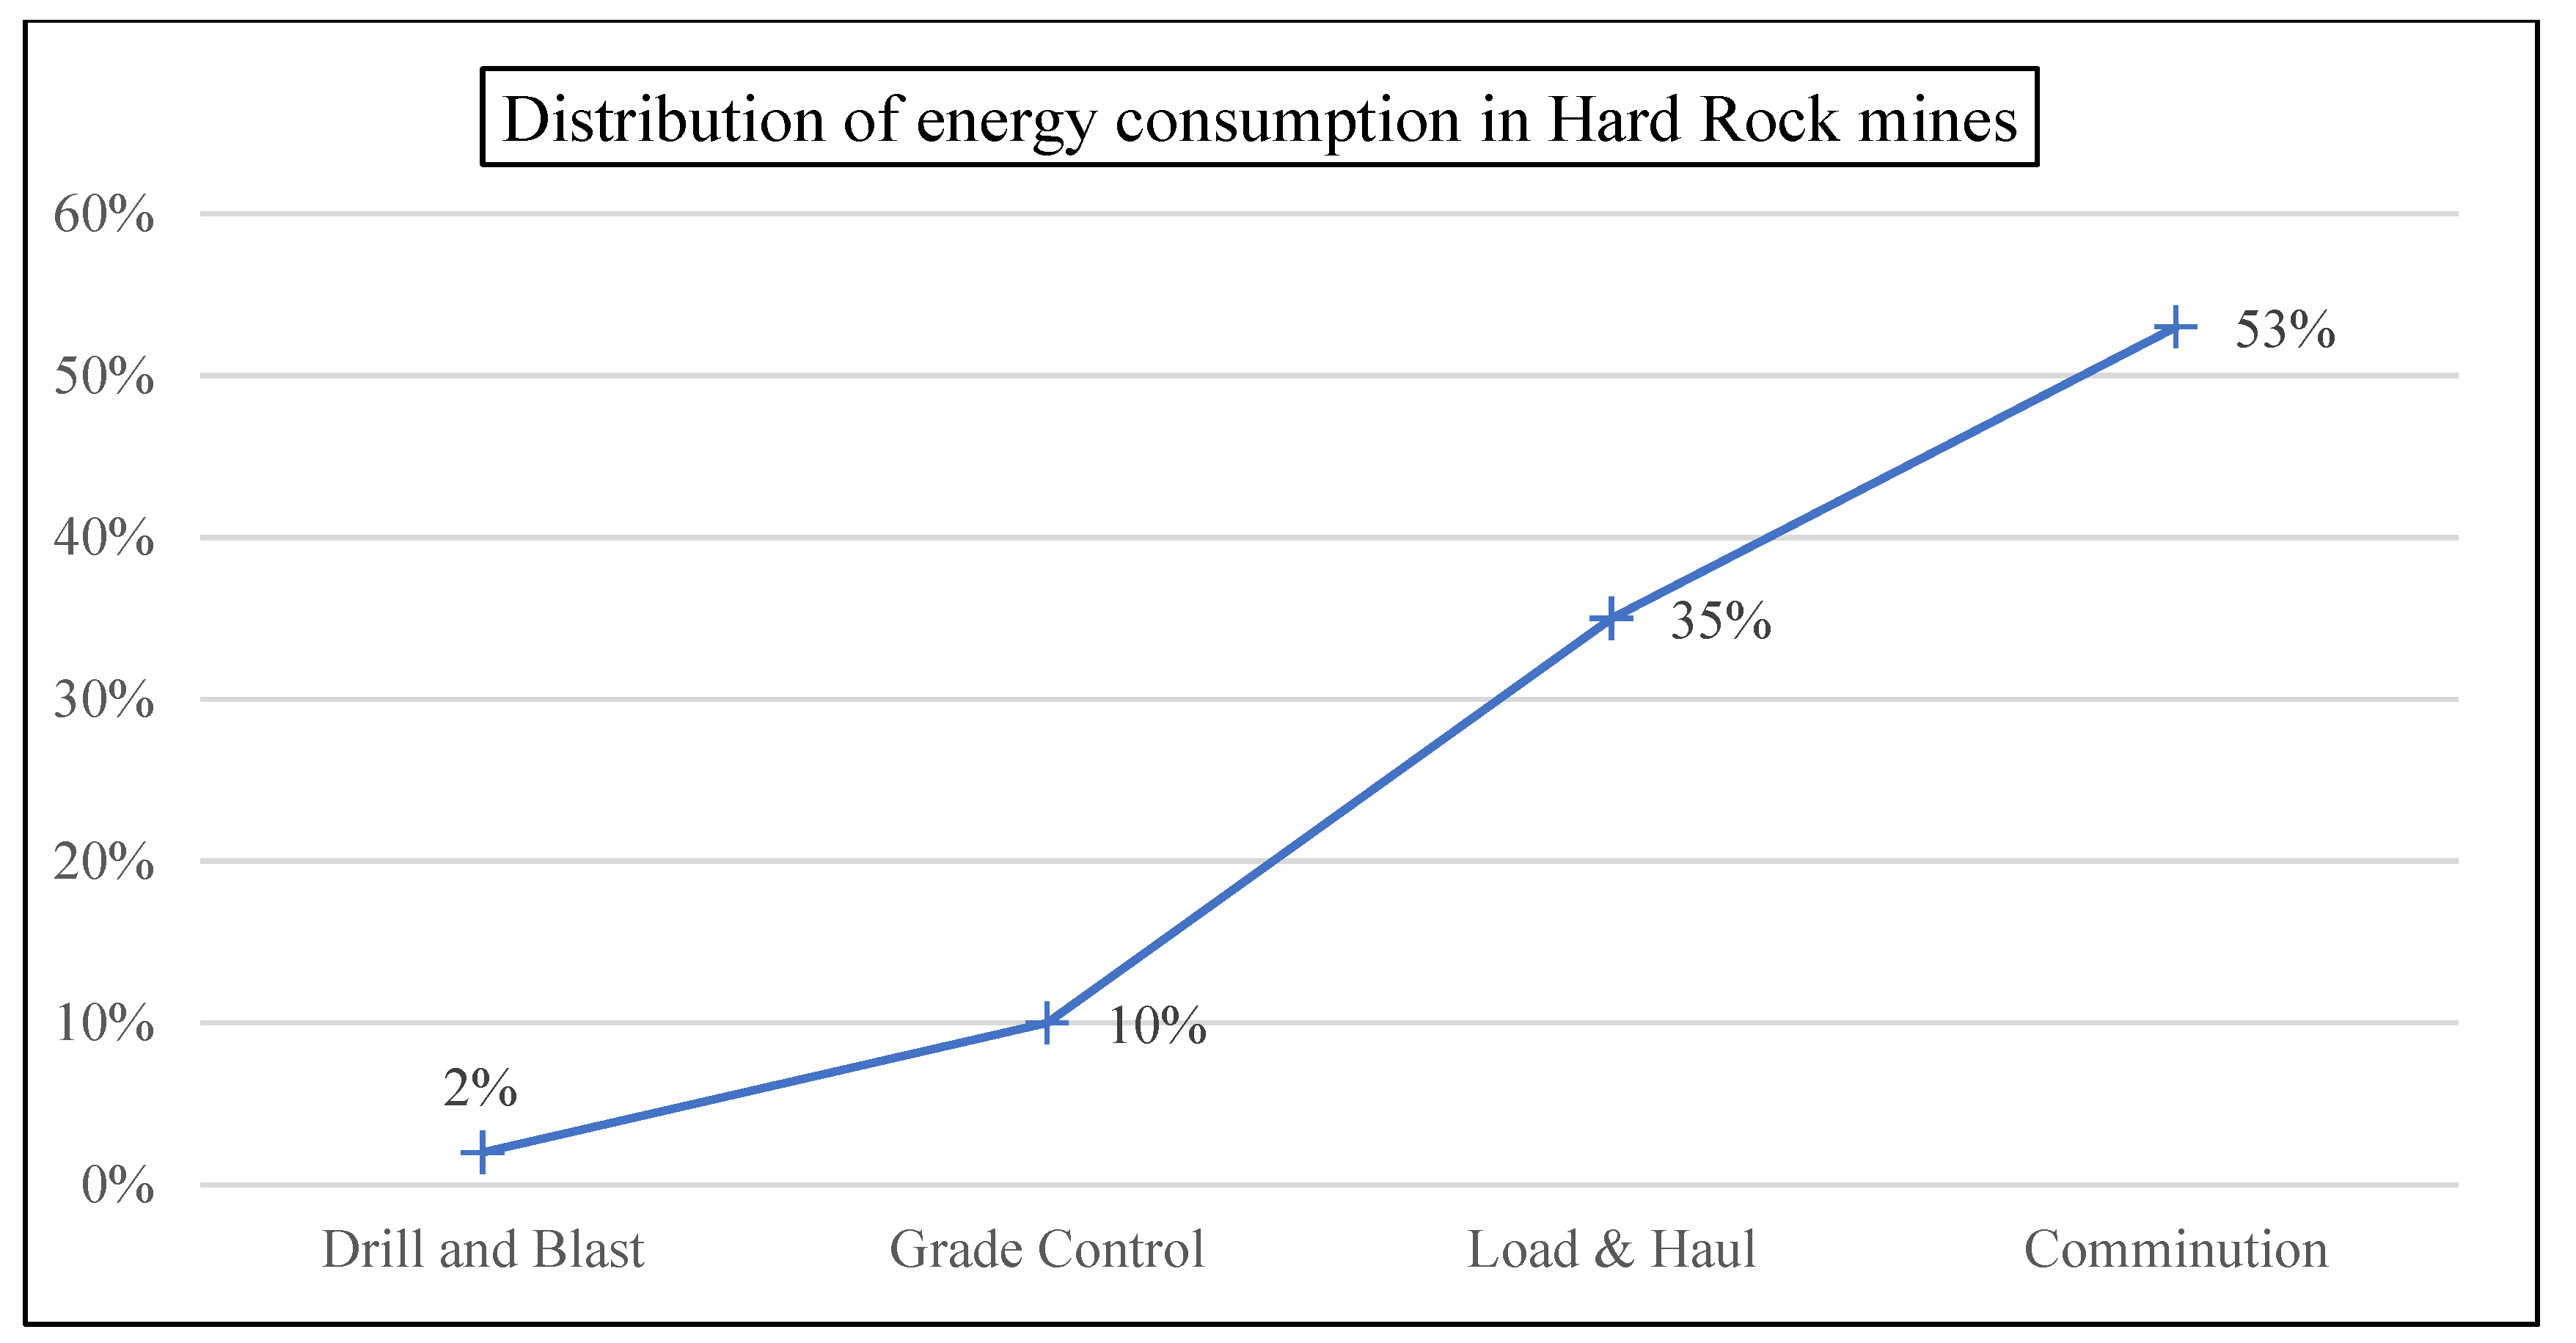
Figure 2.
Data from a real case: increase in power demand and specific energy. Data from: [4].
Figure 2.
Data from a real case: increase in power demand and specific energy. Data from: [4].
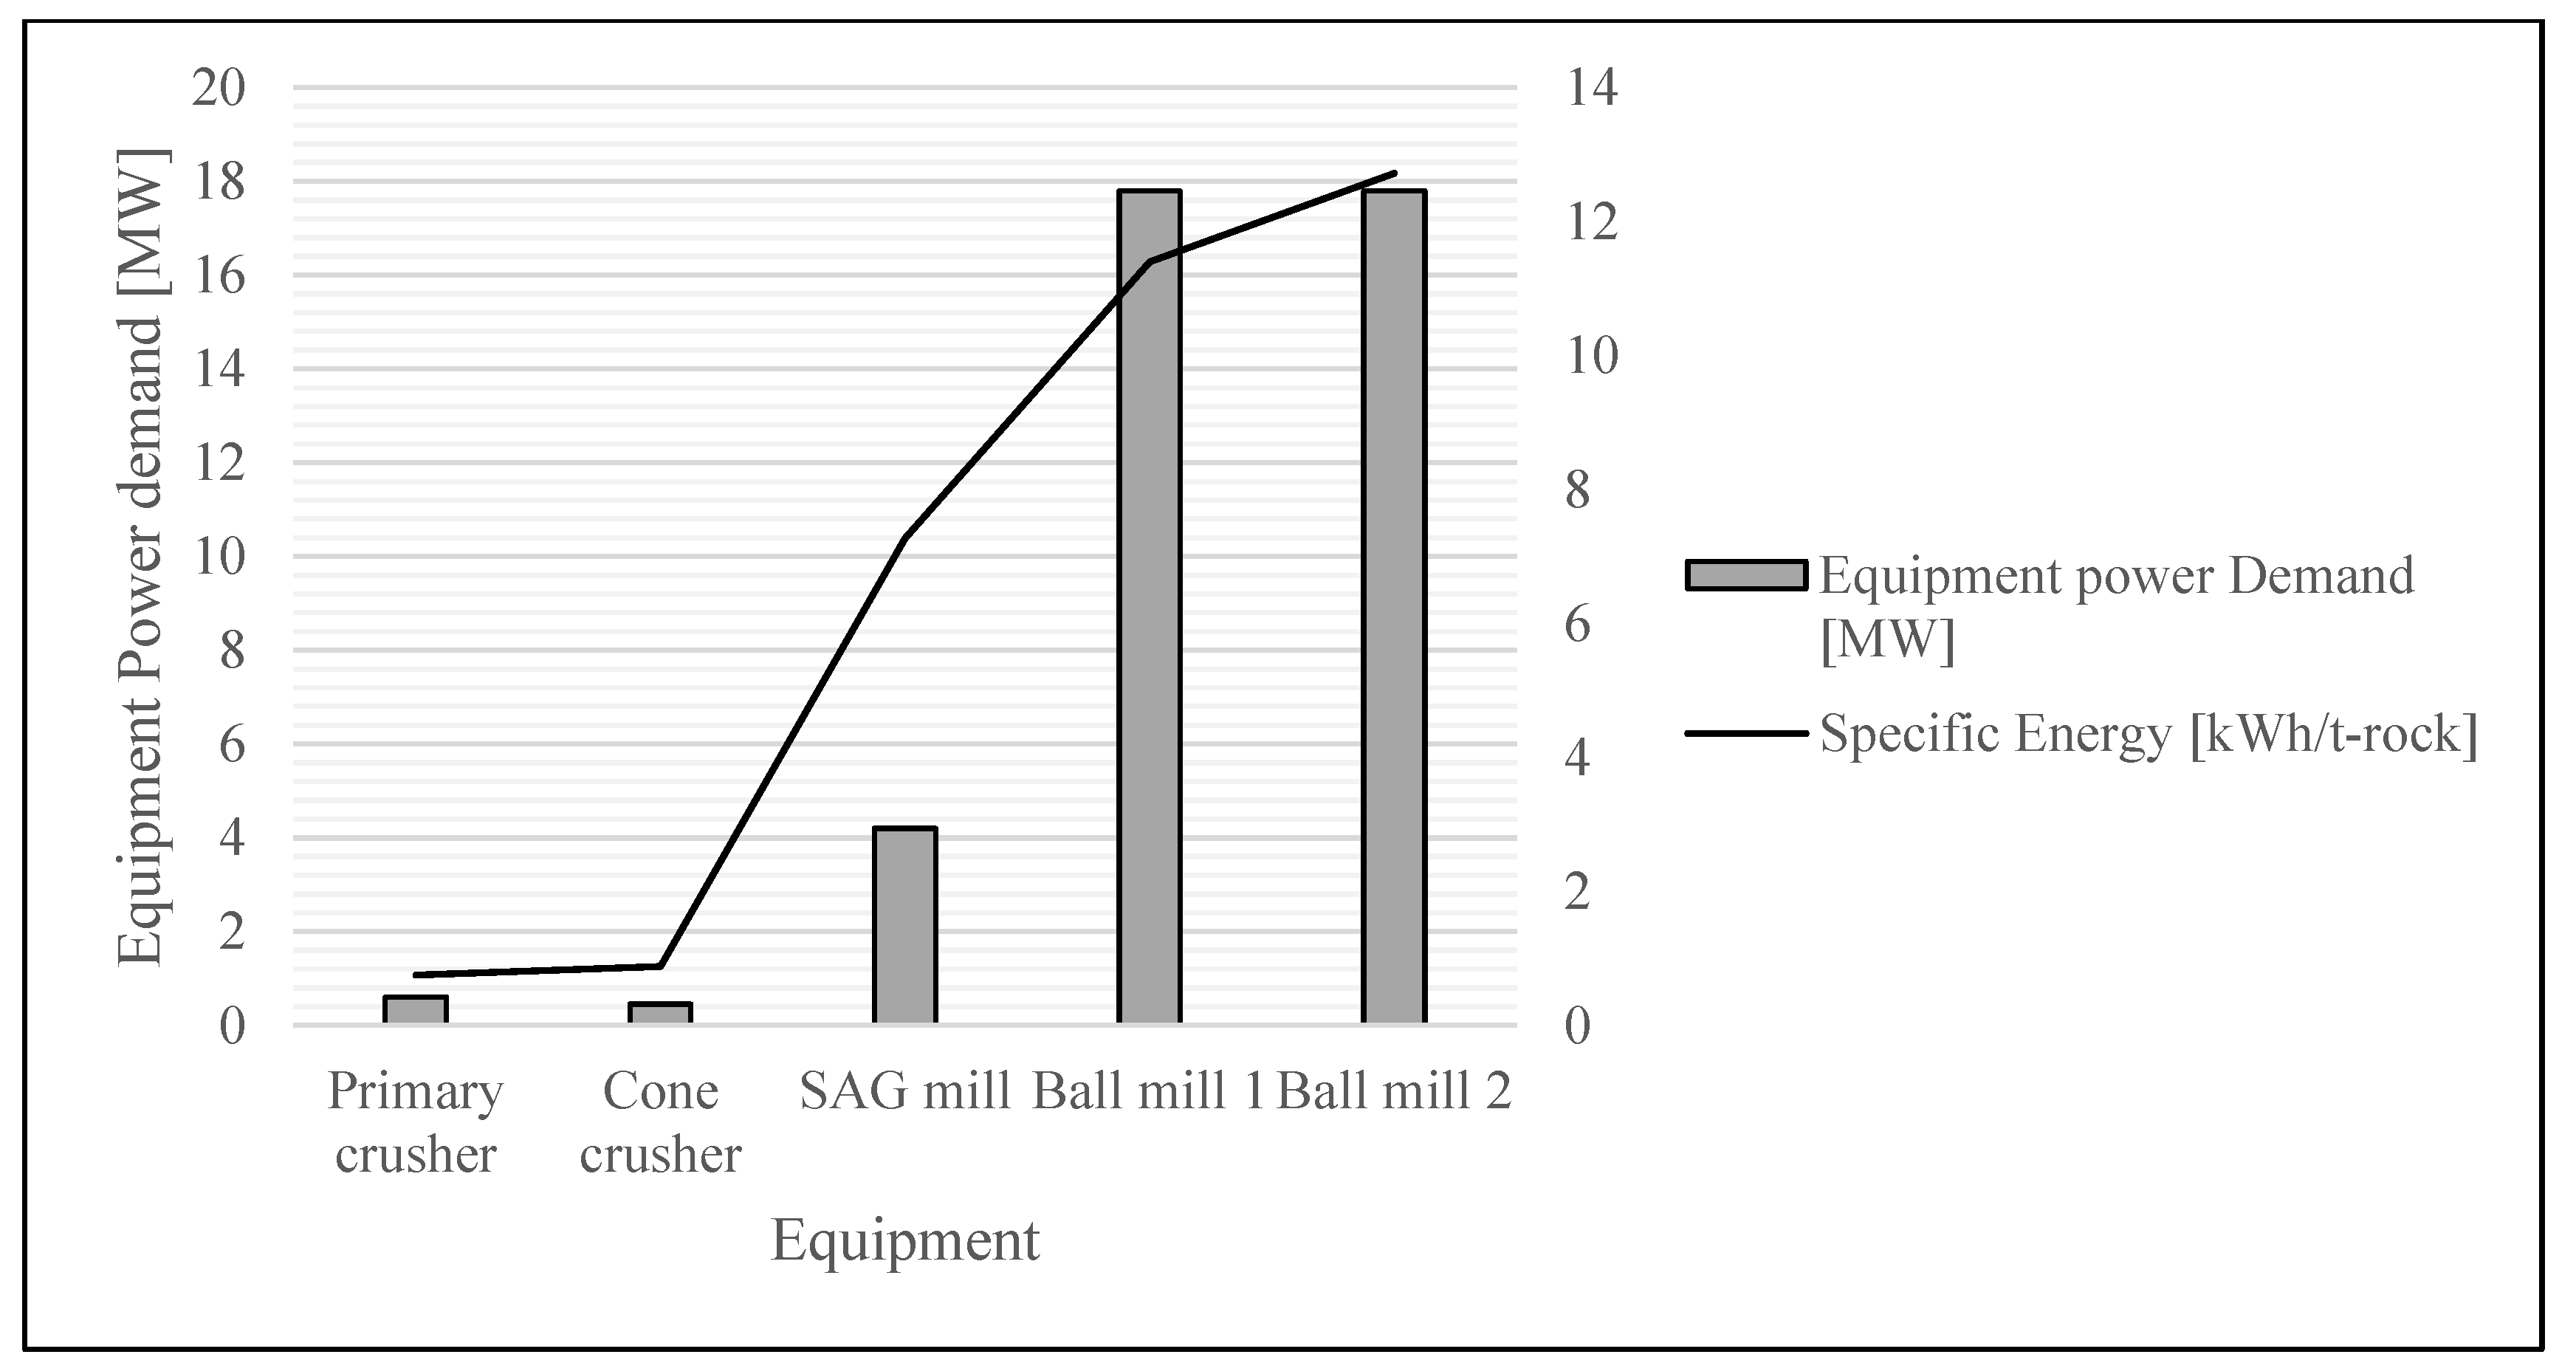
Figure 4.
Block failure models that are considered valid after Point-Loading (ISMR, 2007).
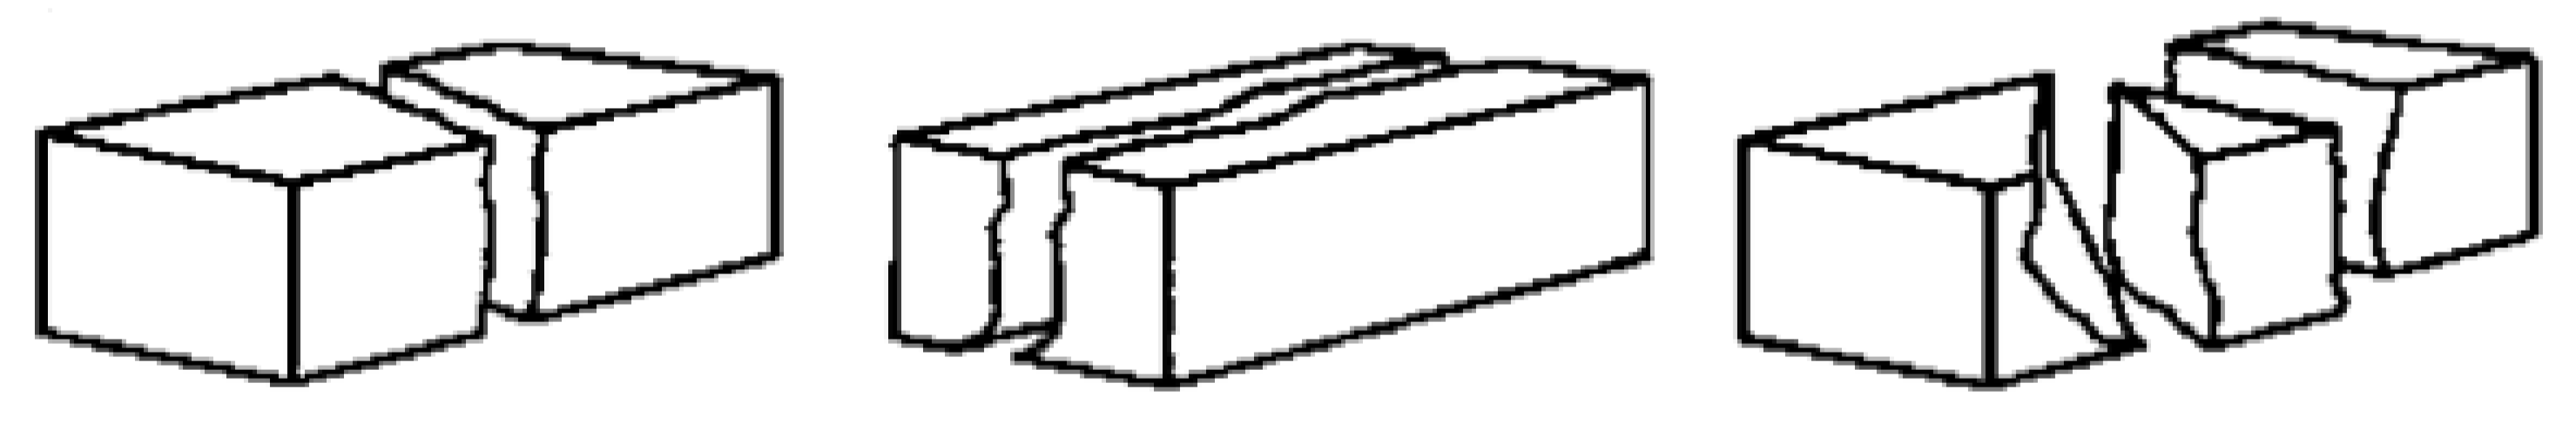
Figure 5.
UCS (derived from Point-load) vs size (mass) of the fragment for Blast 1: there is no correlation.
Figure 5.
UCS (derived from Point-load) vs size (mass) of the fragment for Blast 1: there is no correlation.

Figure 6.
UCS (derived from Point-load) vs size (mass) of the fragment for Blast 2: there is no correlation.
Figure 6.
UCS (derived from Point-load) vs size (mass) of the fragment for Blast 2: there is no correlation.
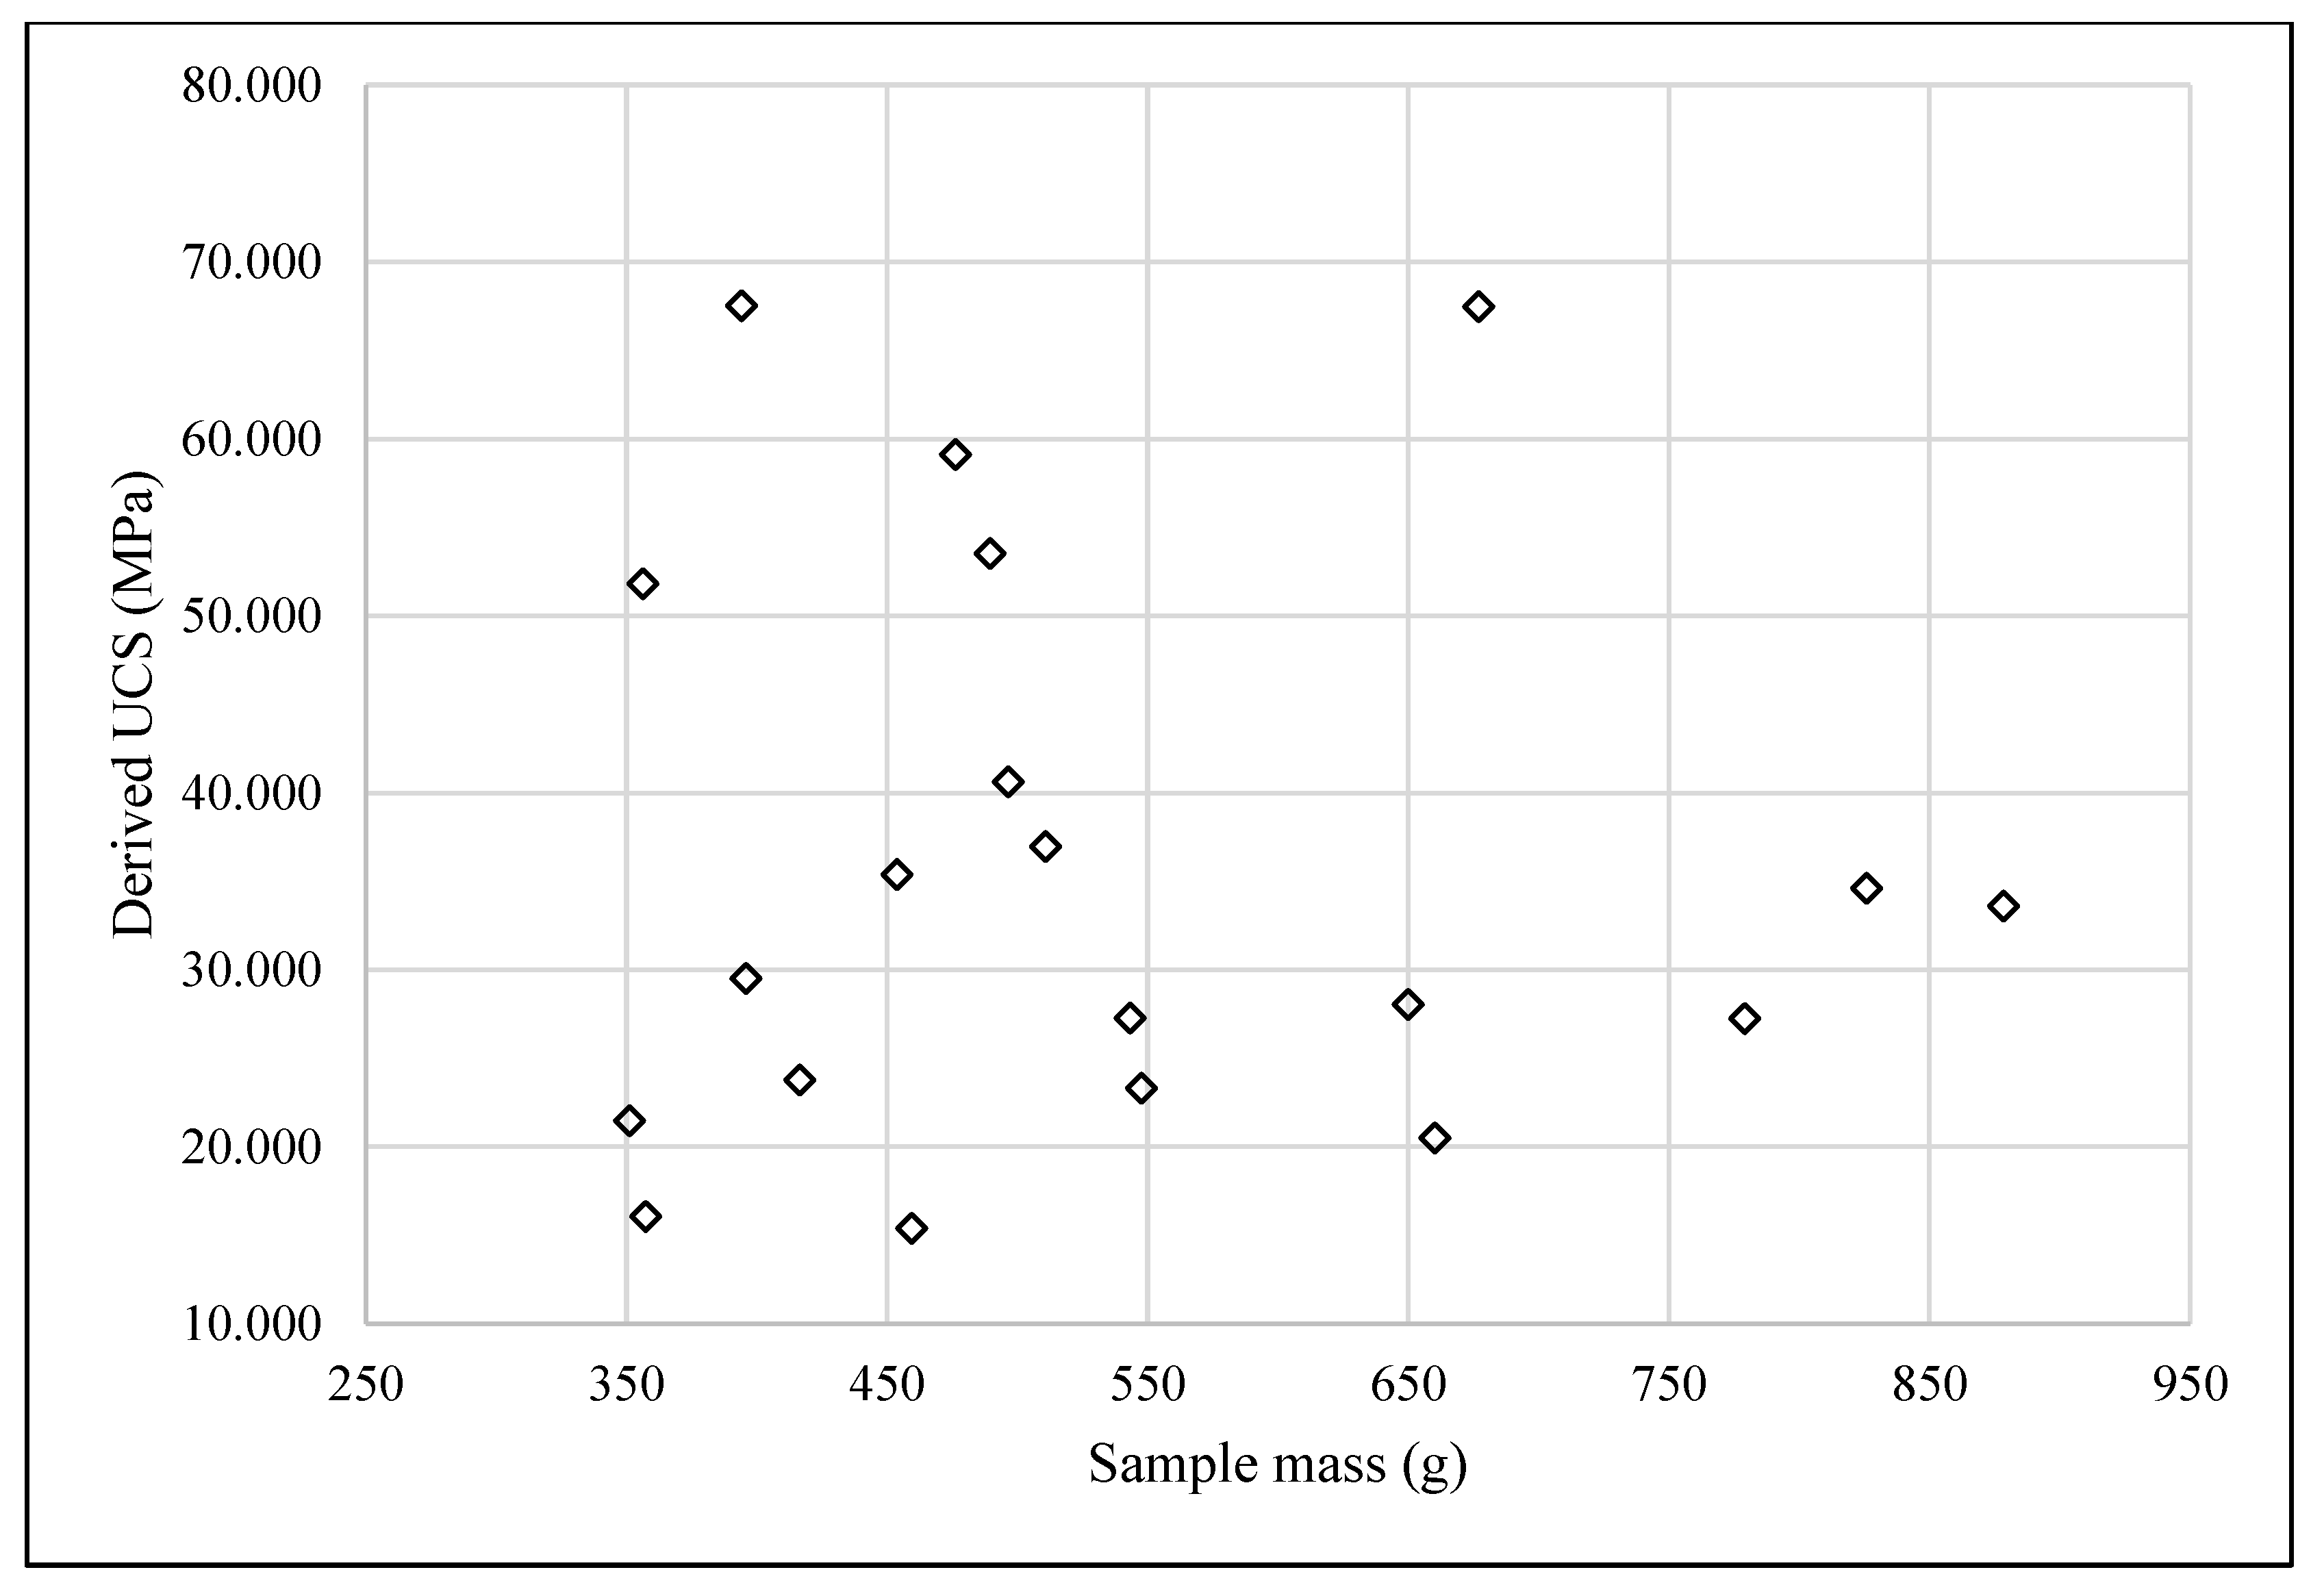
Figure 7.
Rotary Sampler.
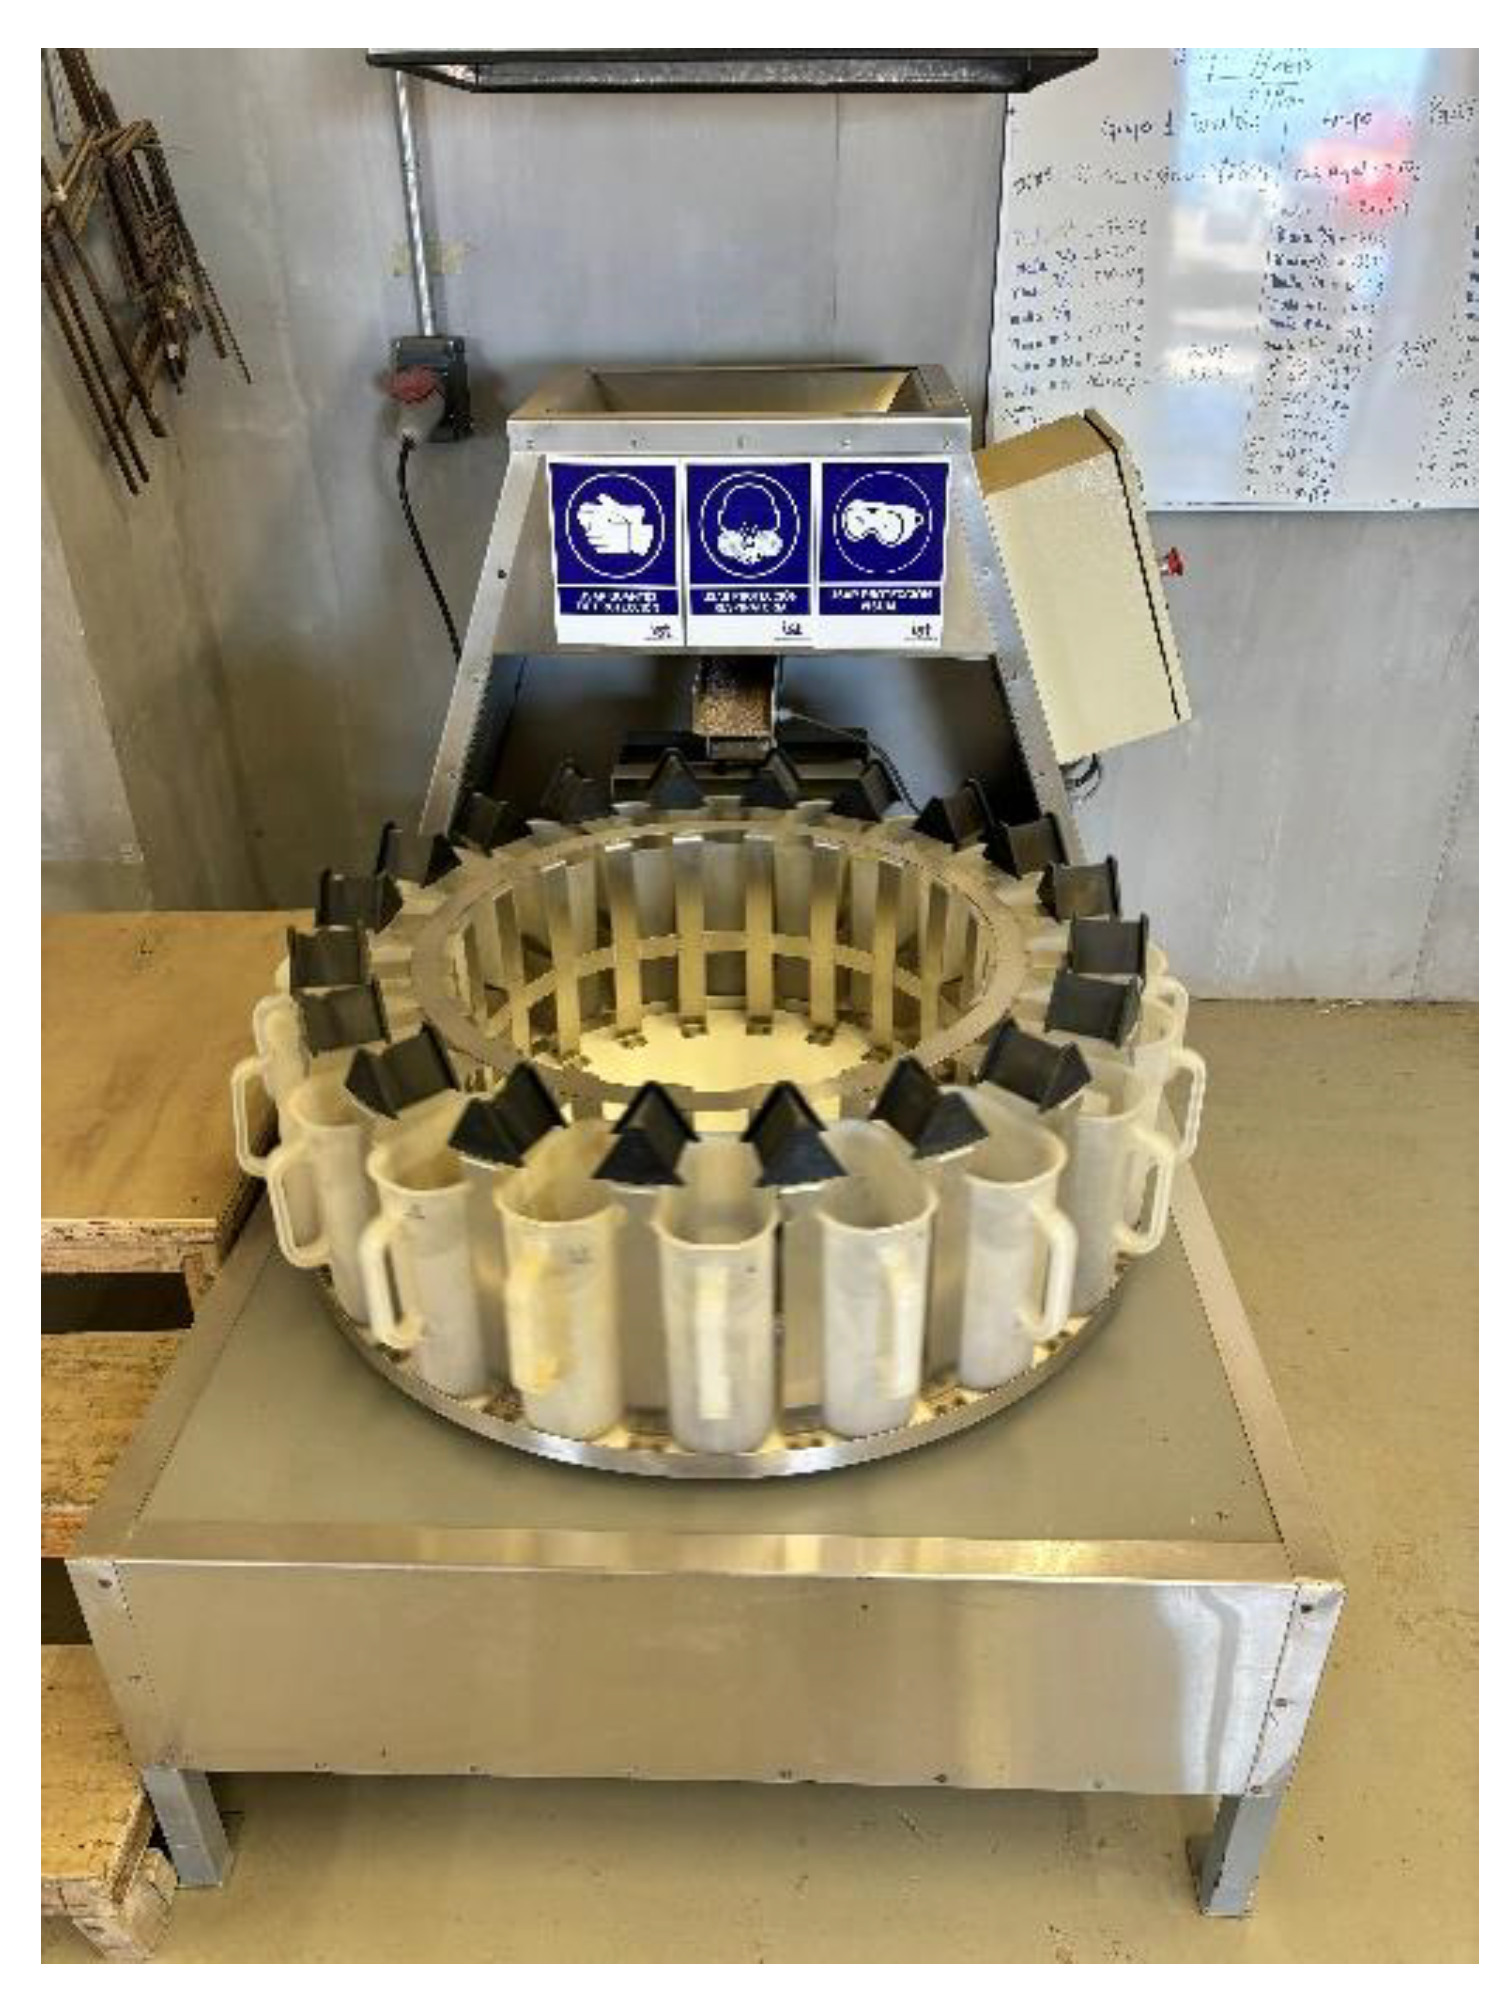
Figure 8.
Laboratory Bond’sball mil.
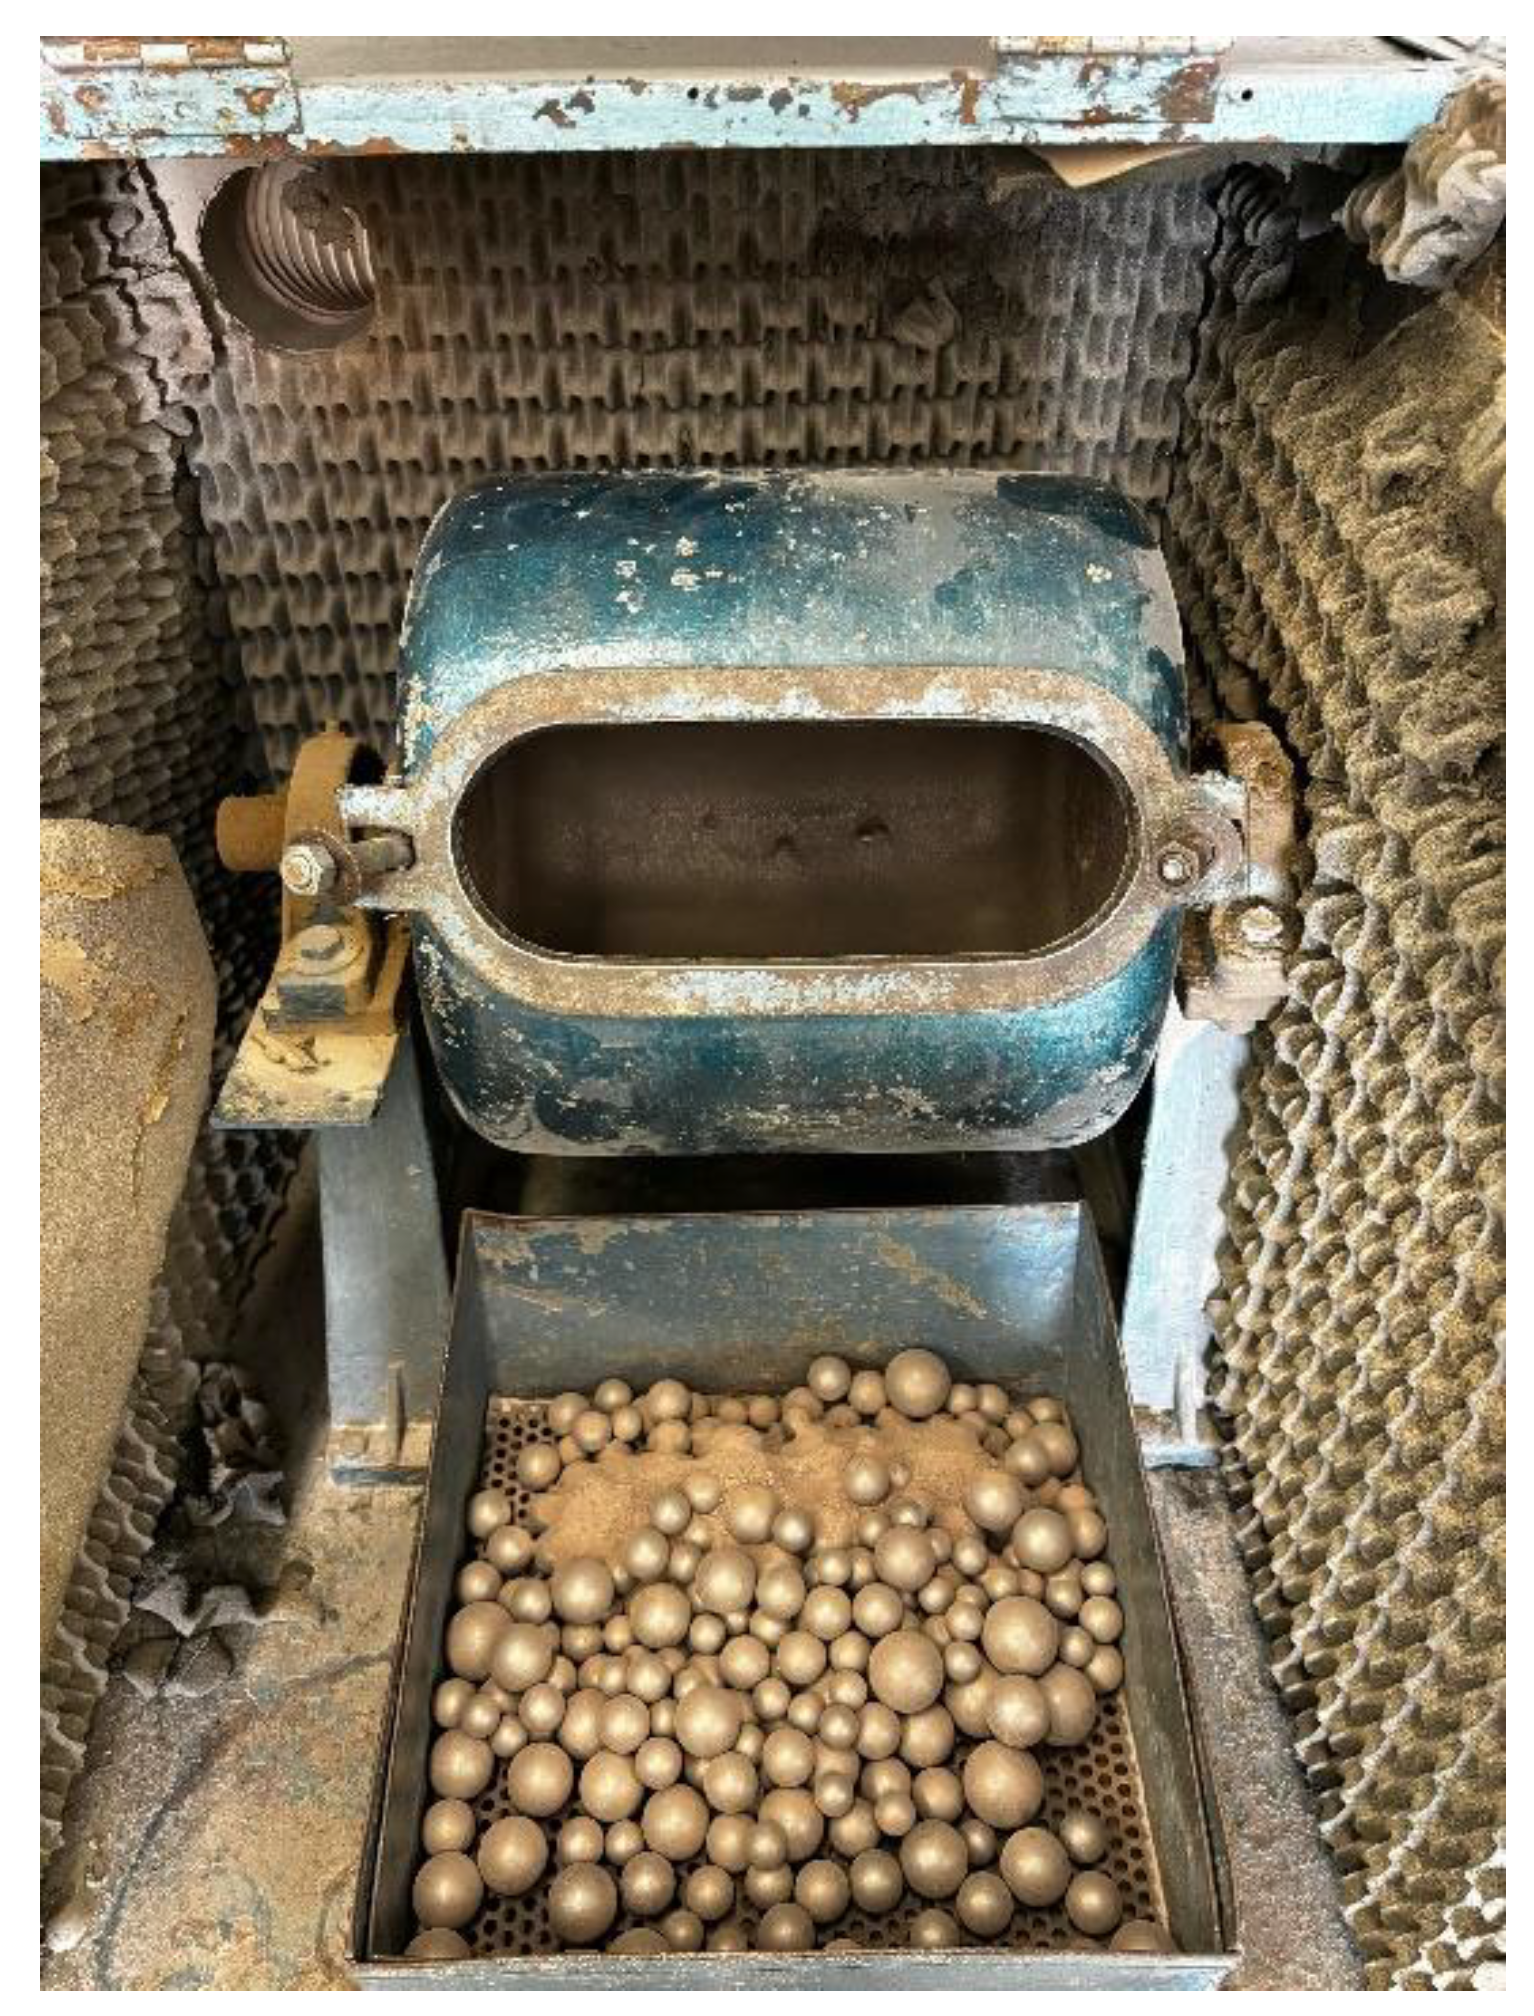
Figure 9.
Correlation between fragment size (from blast) Vs. the W.I.: the work index increases with the increase of particle size.
Figure 9.
Correlation between fragment size (from blast) Vs. the W.I.: the work index increases with the increase of particle size.
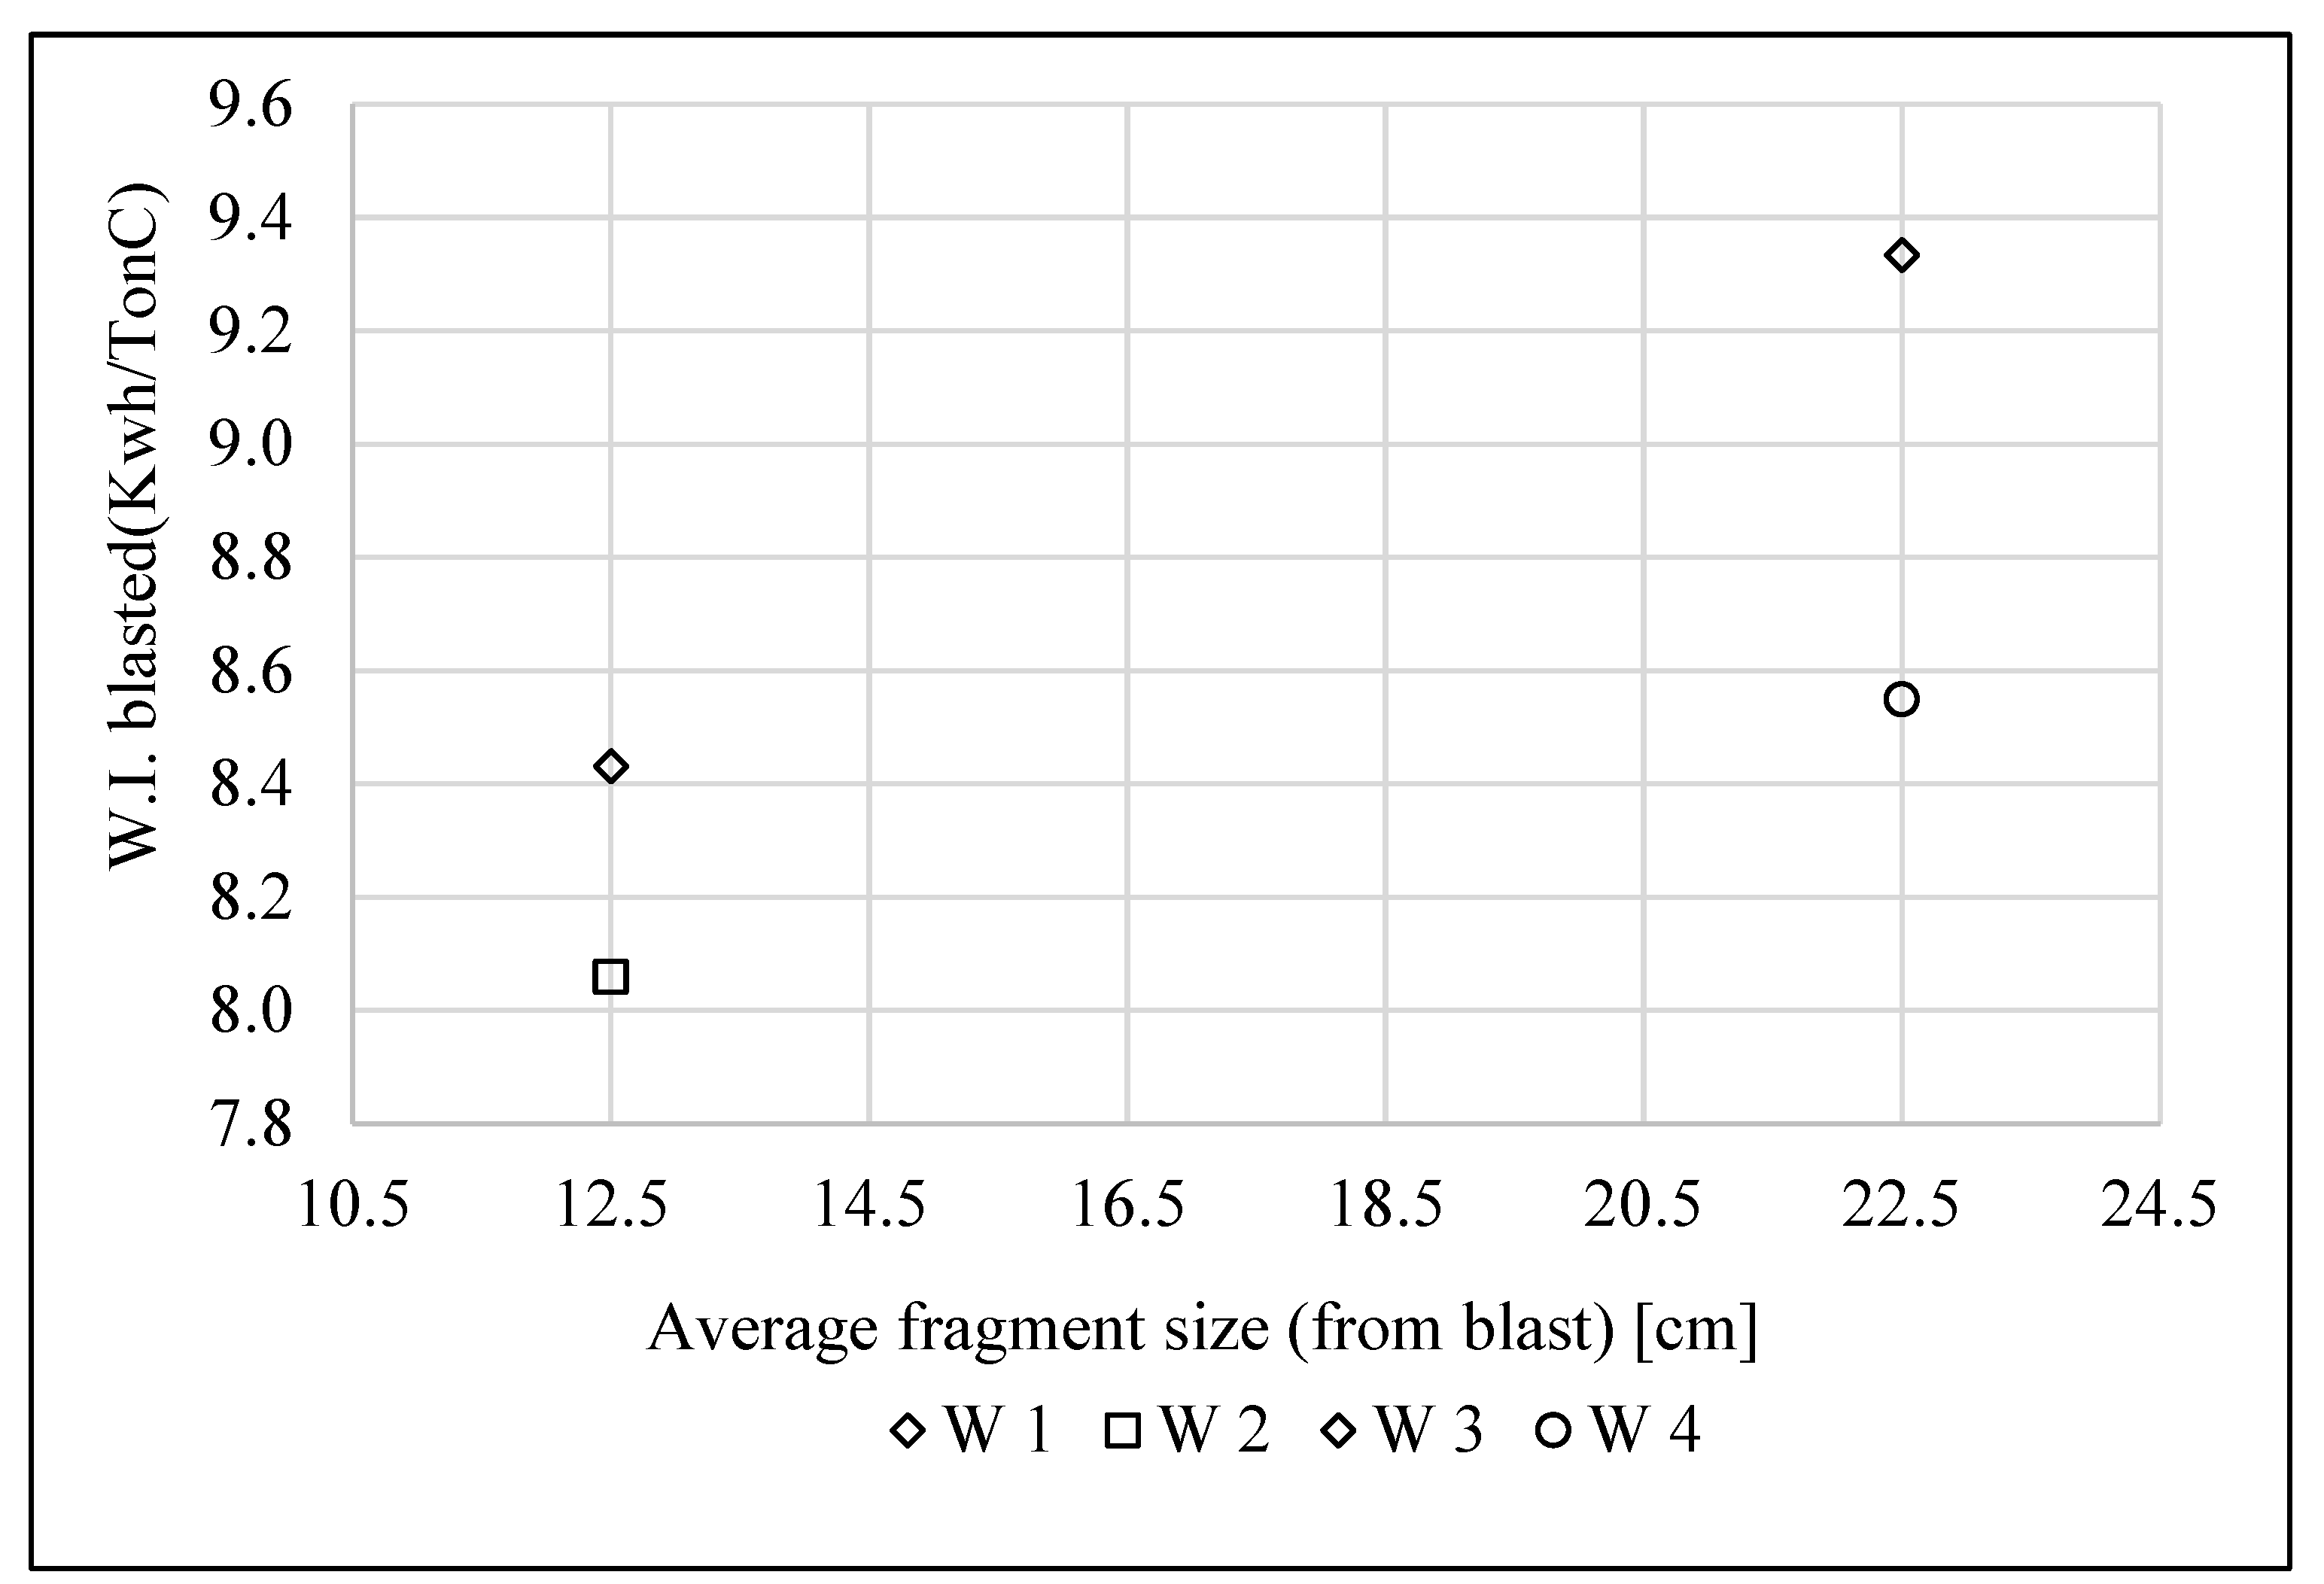
Figure 10.
Selected simples: particles ), which are retained at #8, #50, #70 and #325..
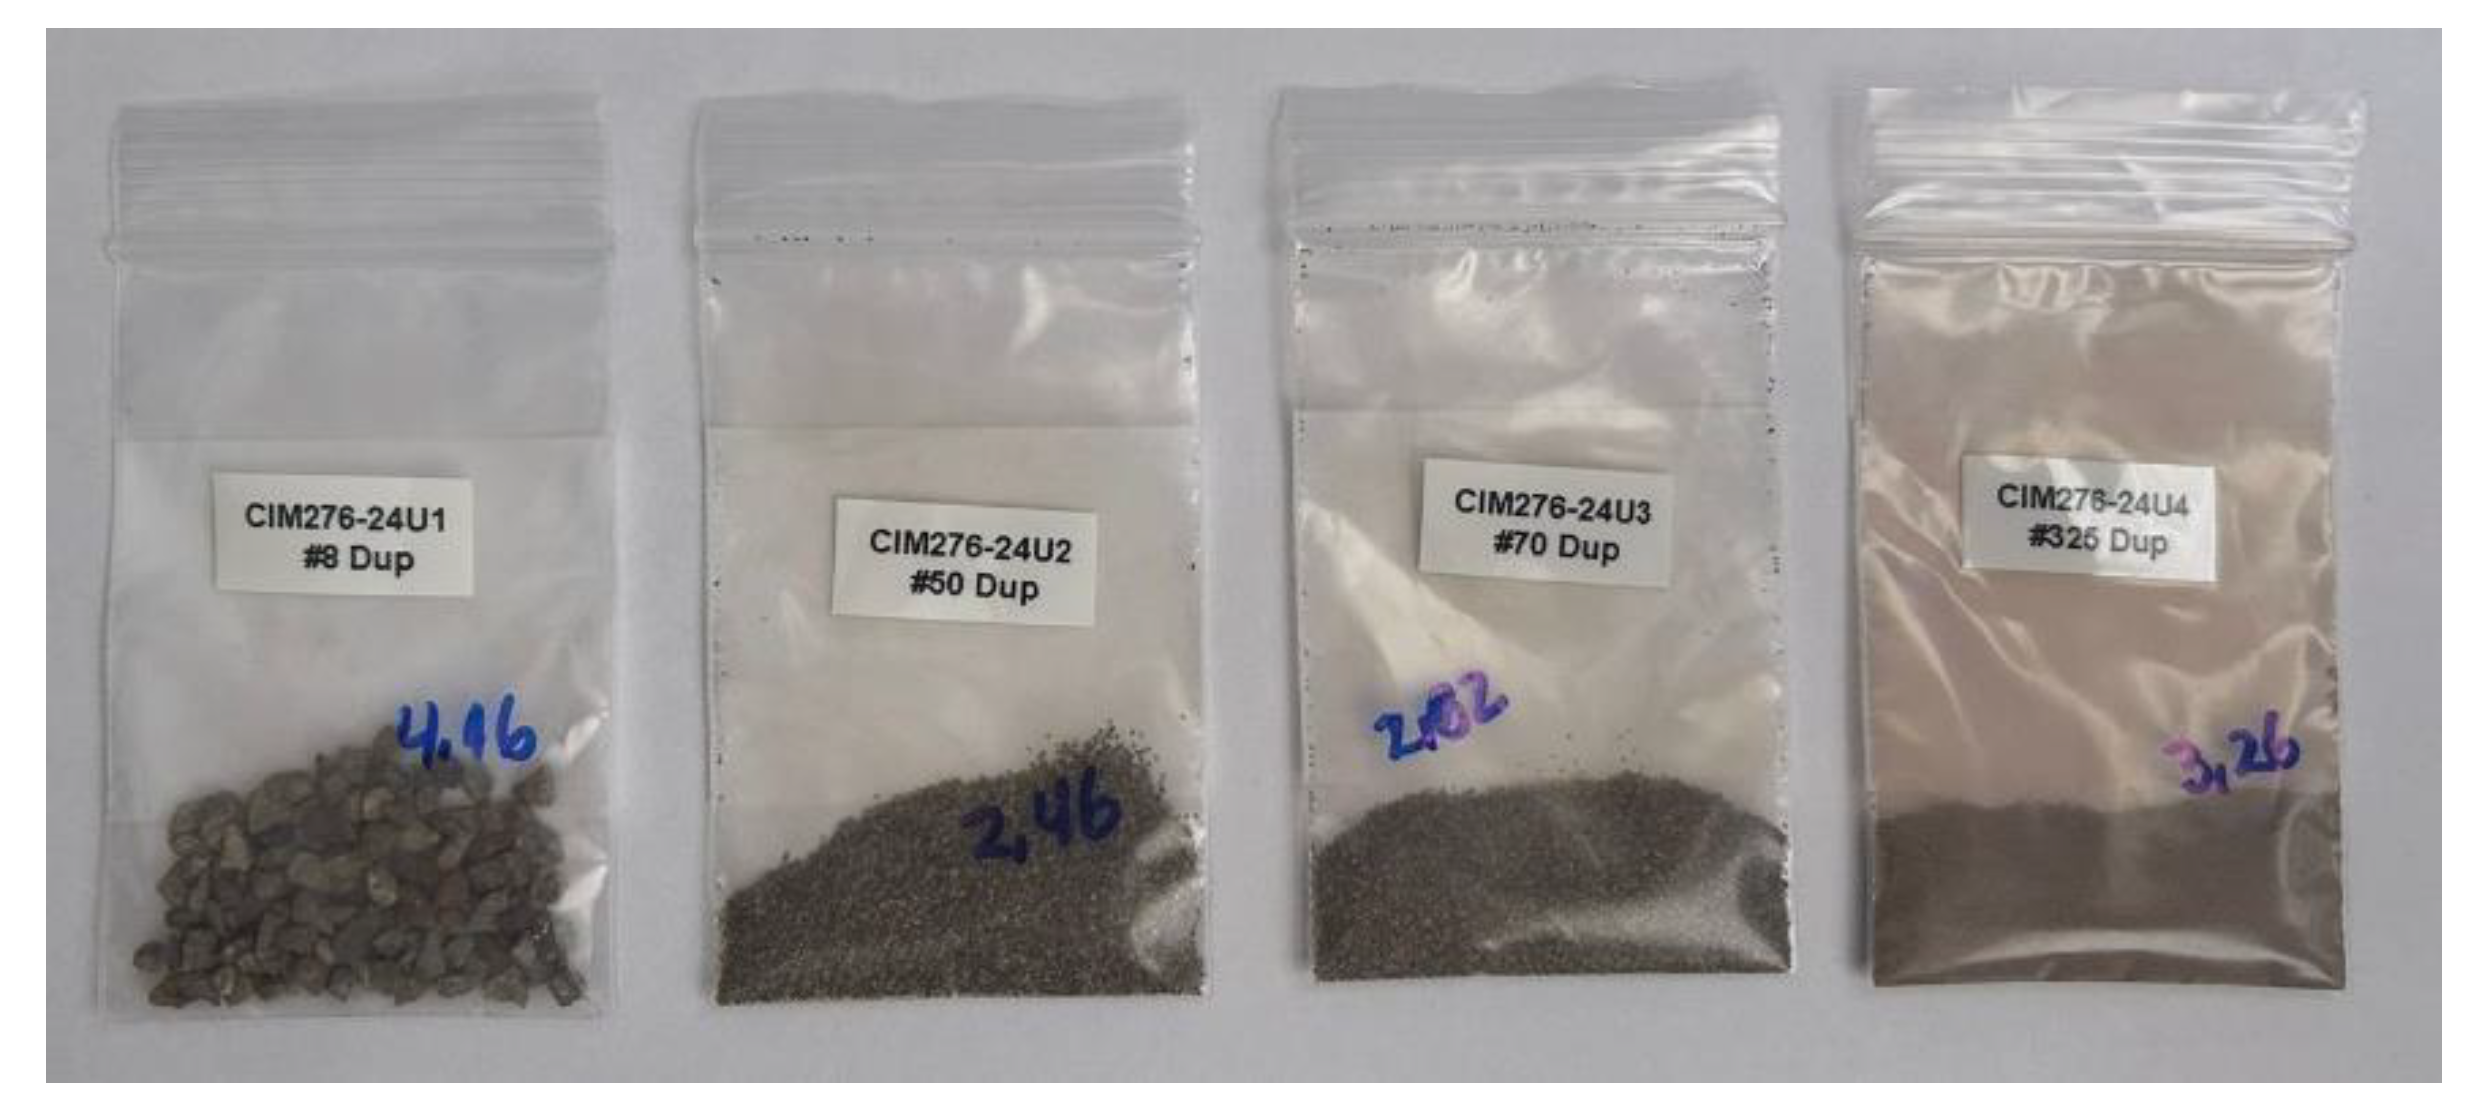
Figure 12.
Microscopic visión of a blasted sample.
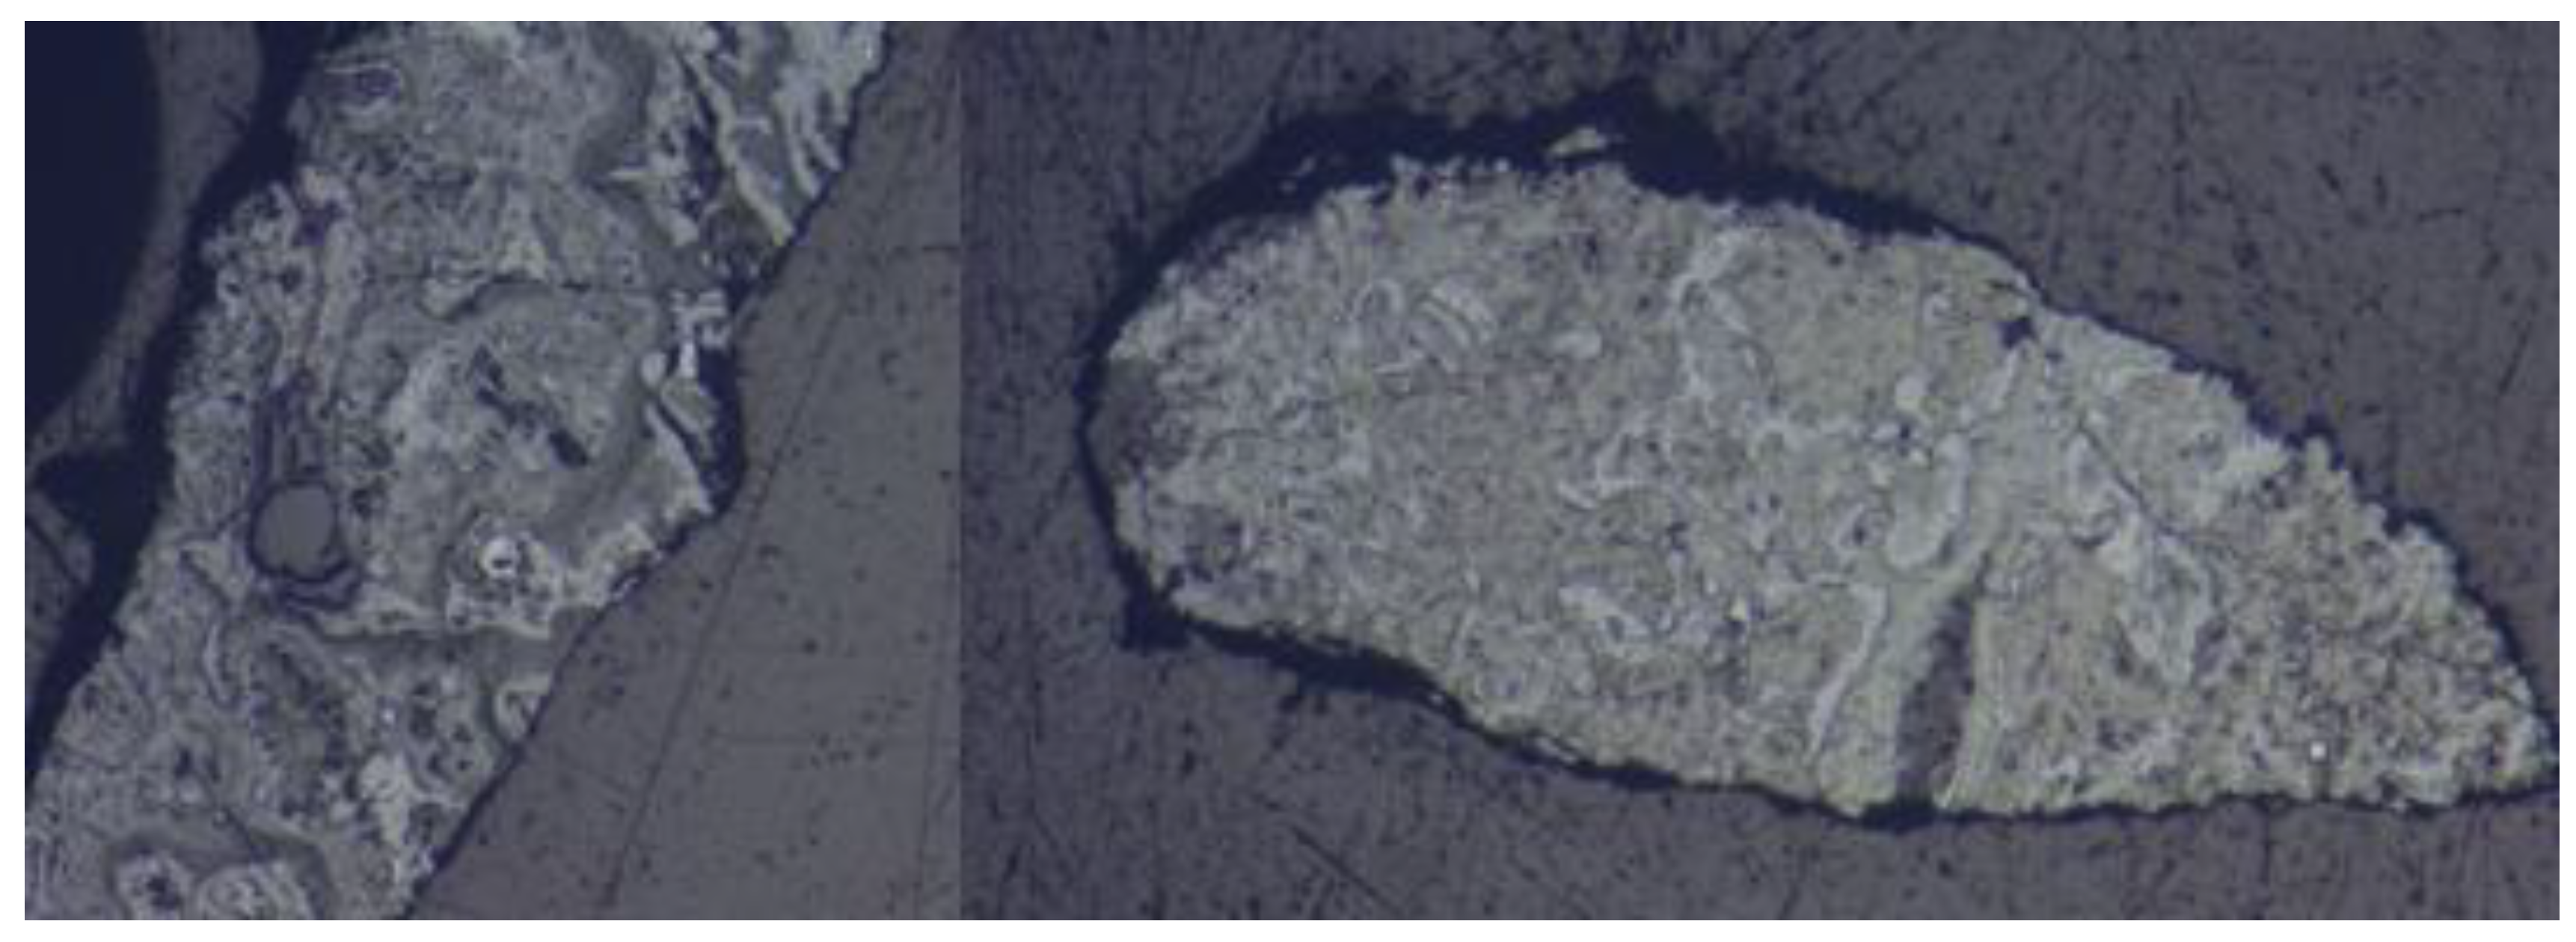
Figure 13.
Visual representation of the diameters obtained.
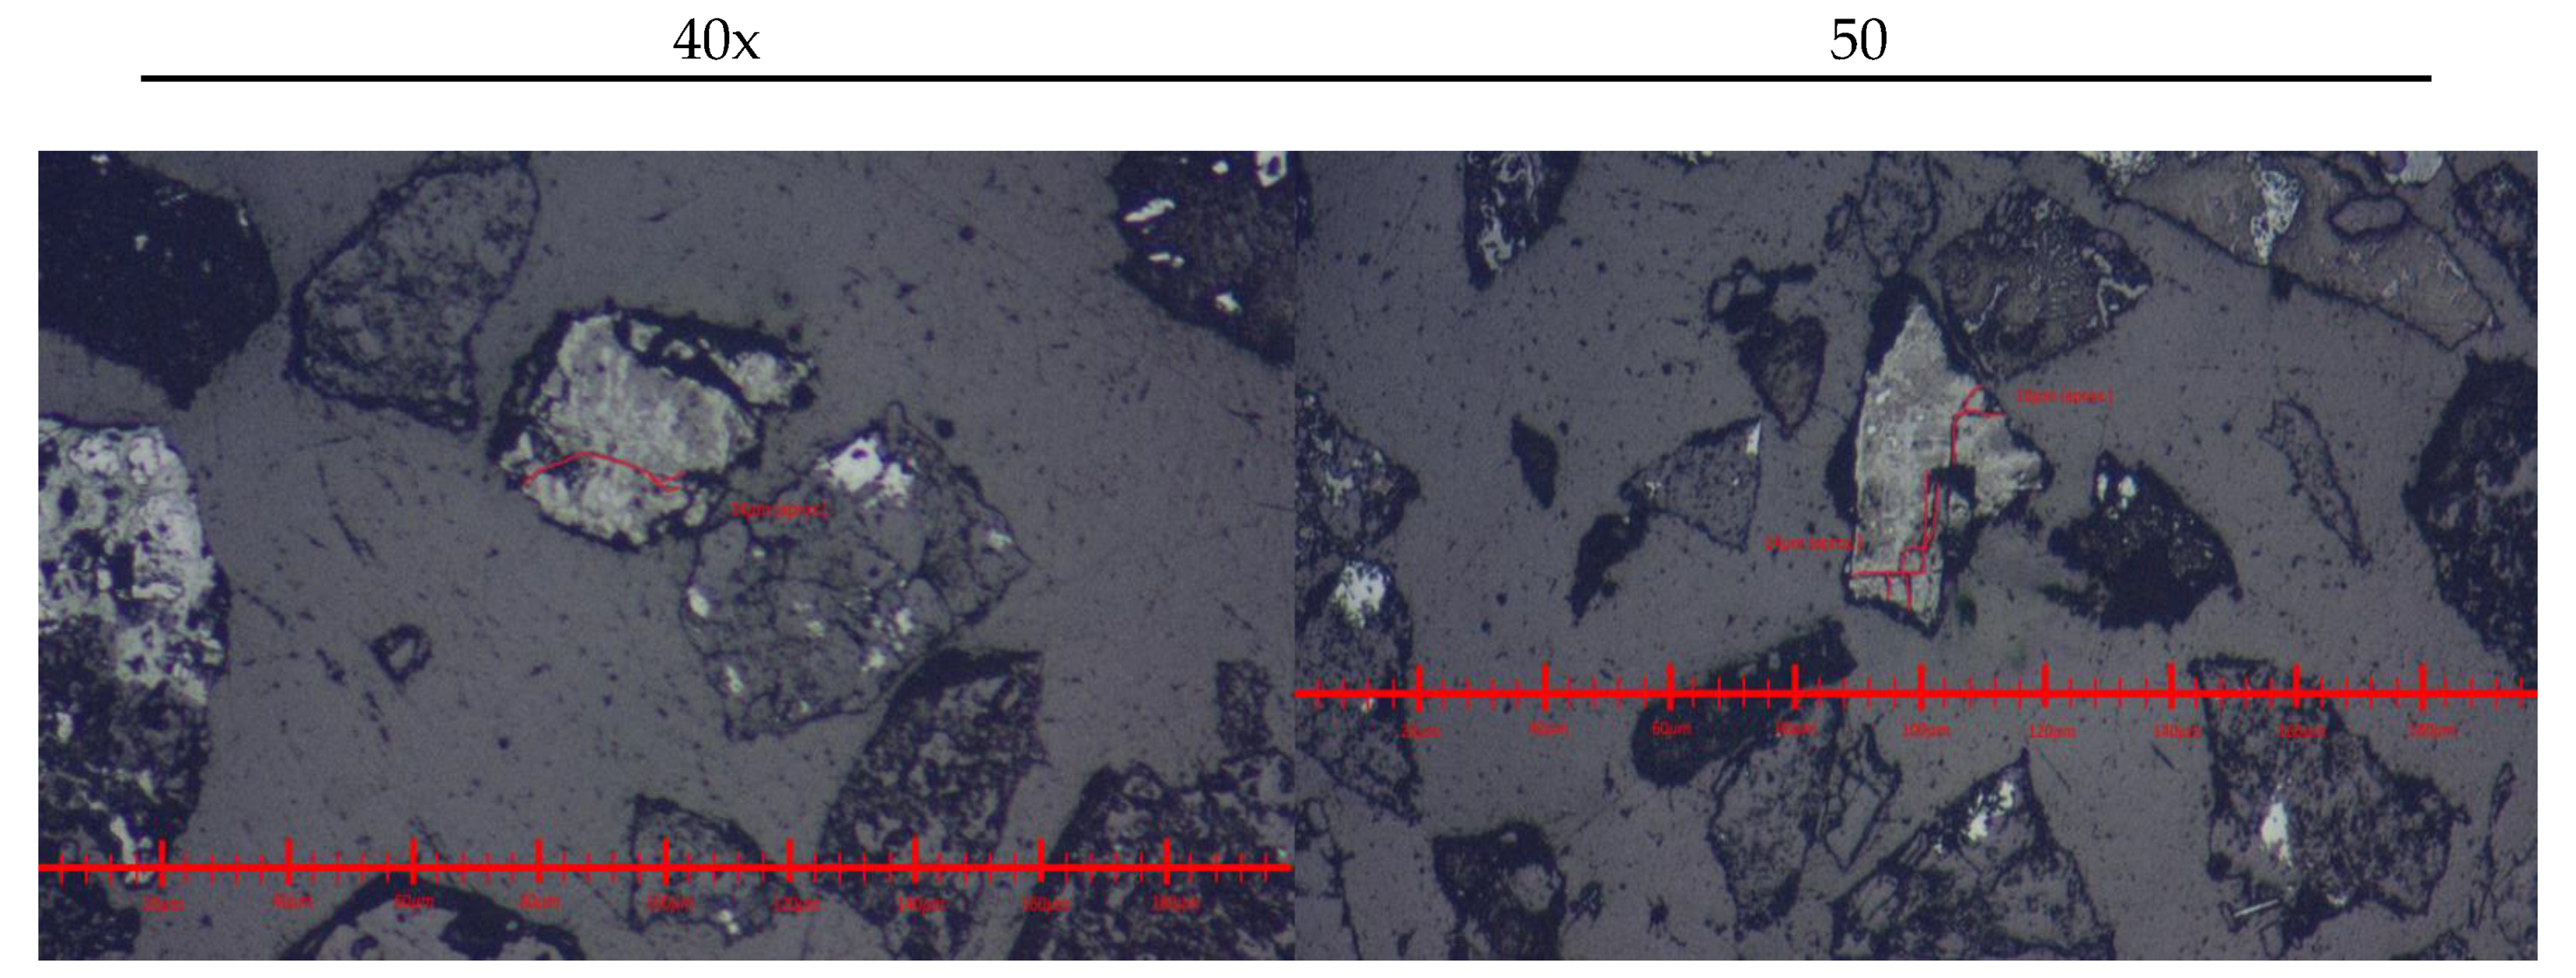
Figure 15.
The visible net of microfracture induced by the explosive.
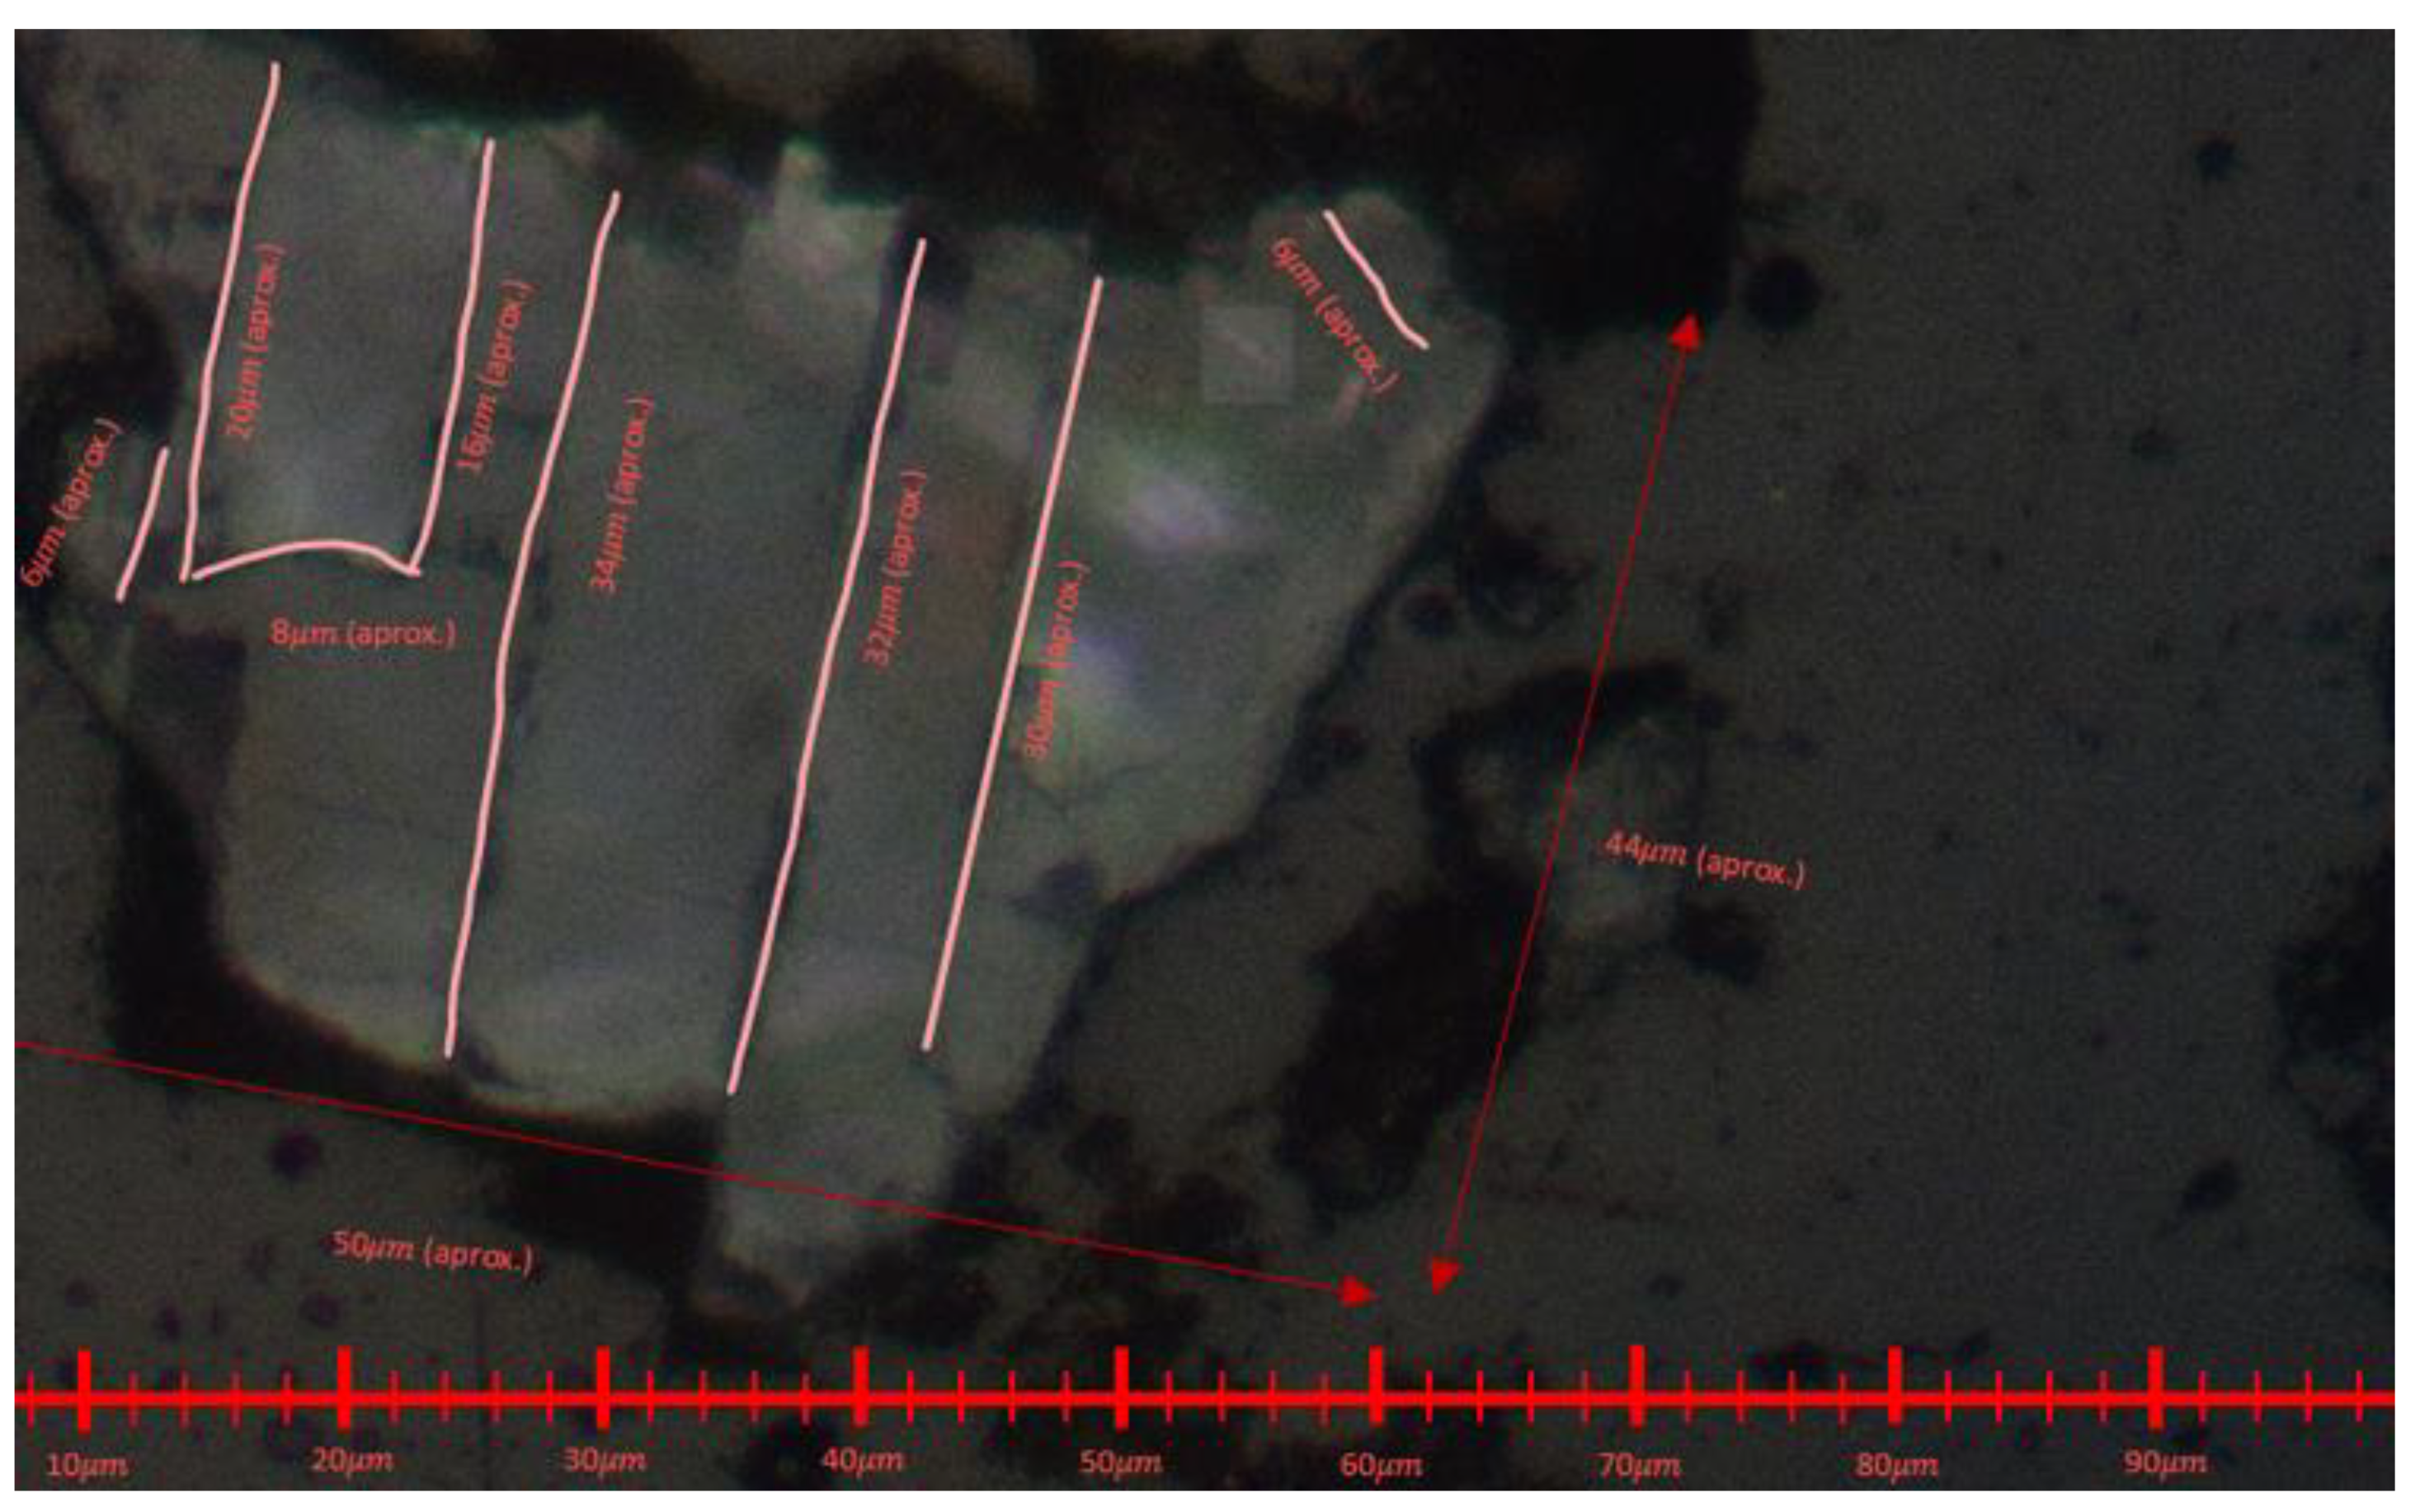
Figure 16.
Number of fractures vs sample size for a 4x lens zoom.
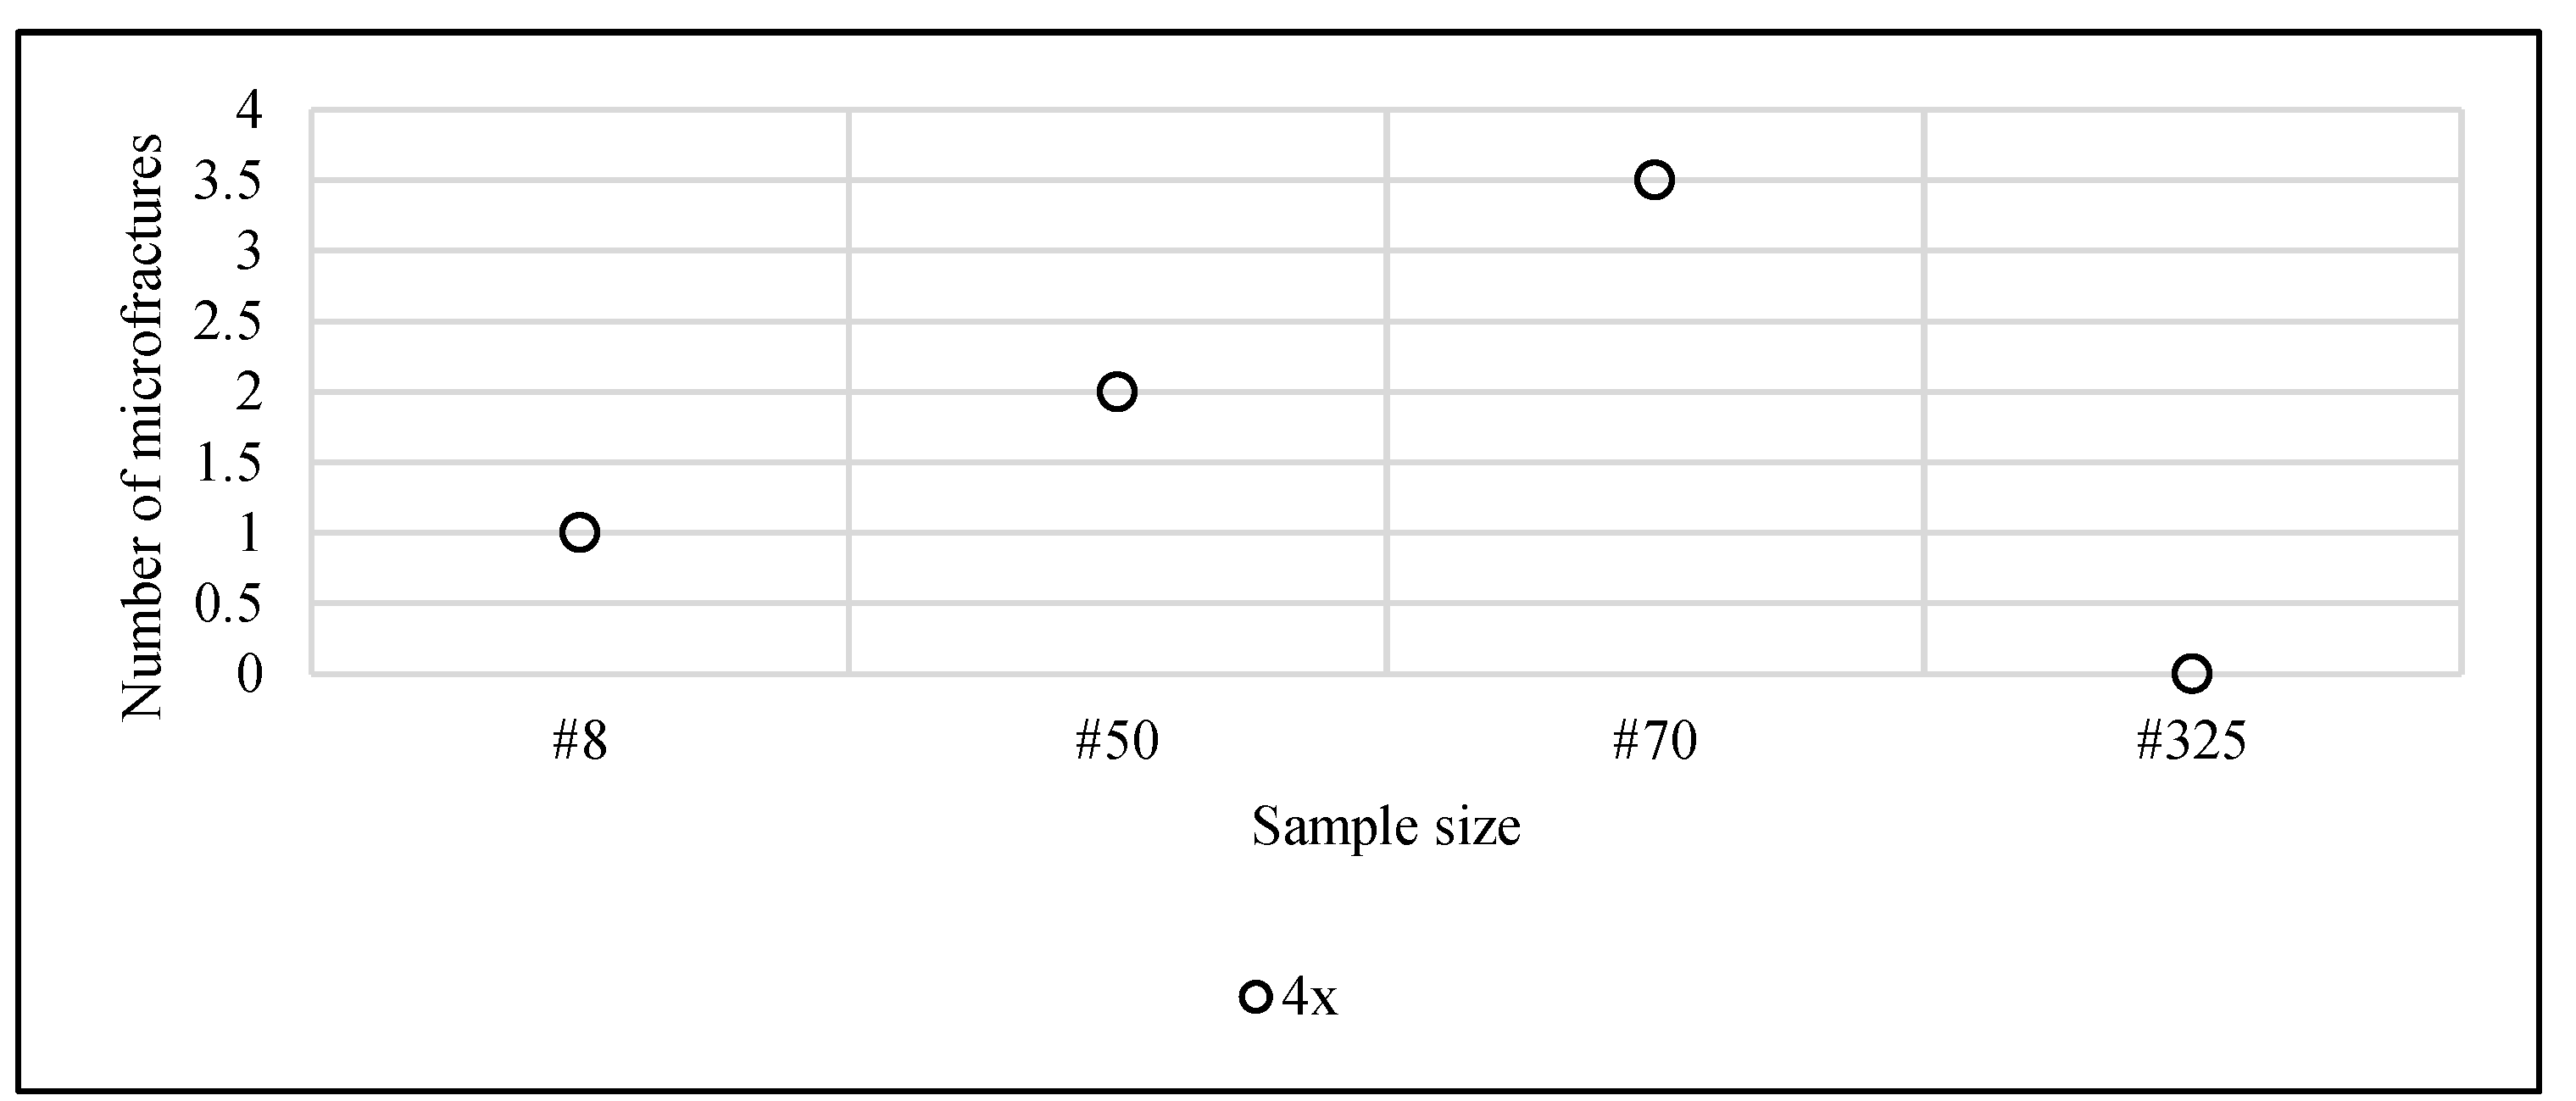
Figure 17.
Number of fractures vs sample size for a 10x lens zoom.
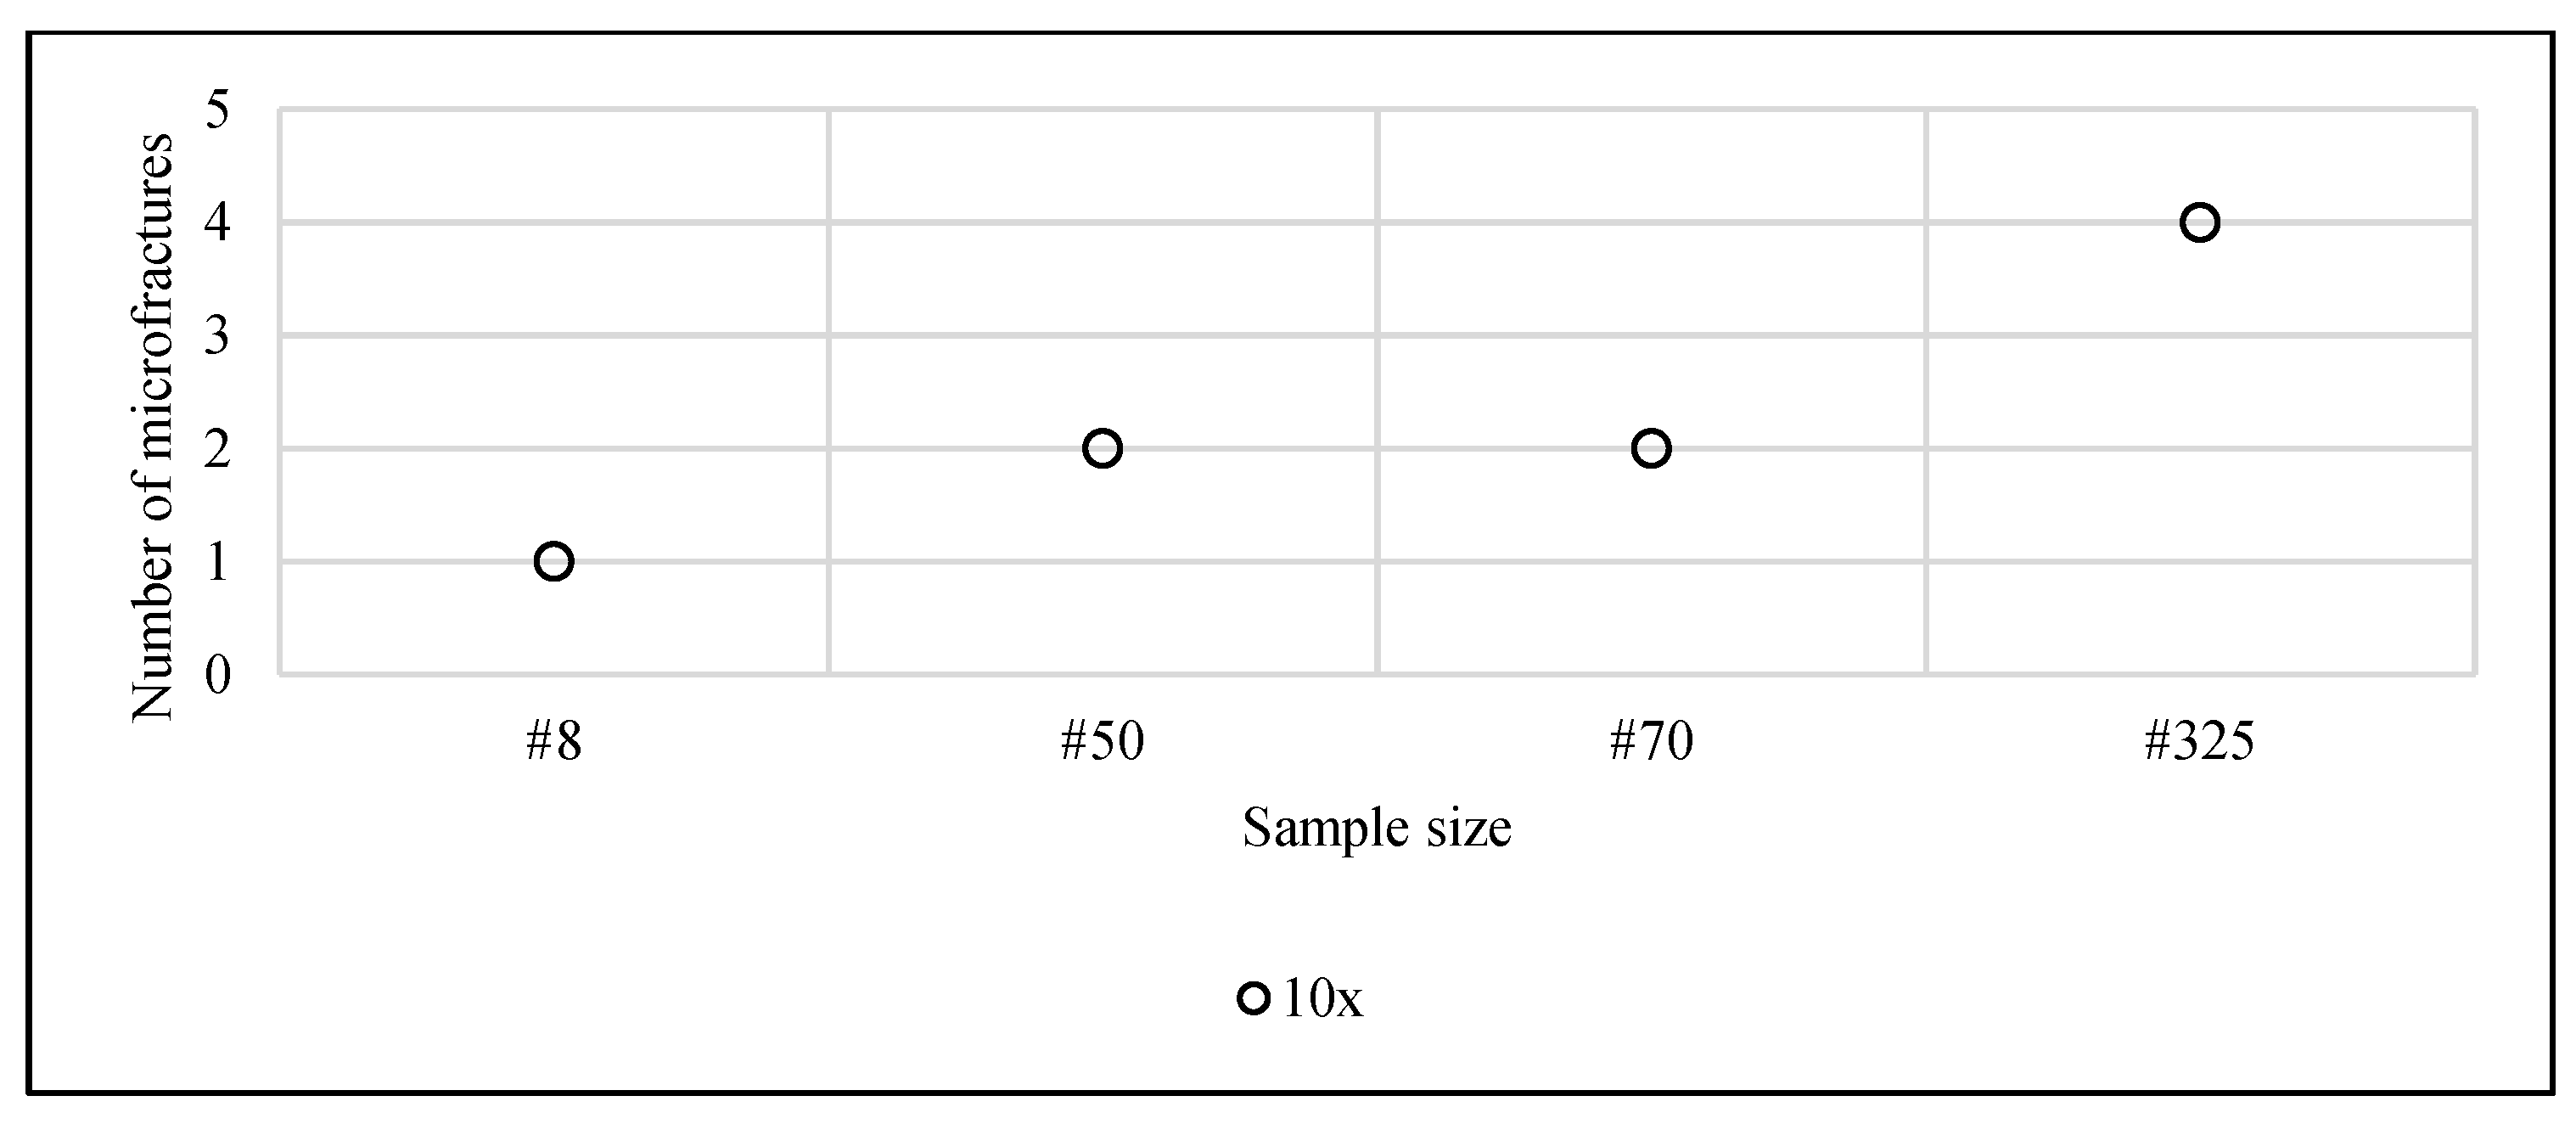
Figure 18.
Number of fractures vs sample size for a 20x lens zoom.
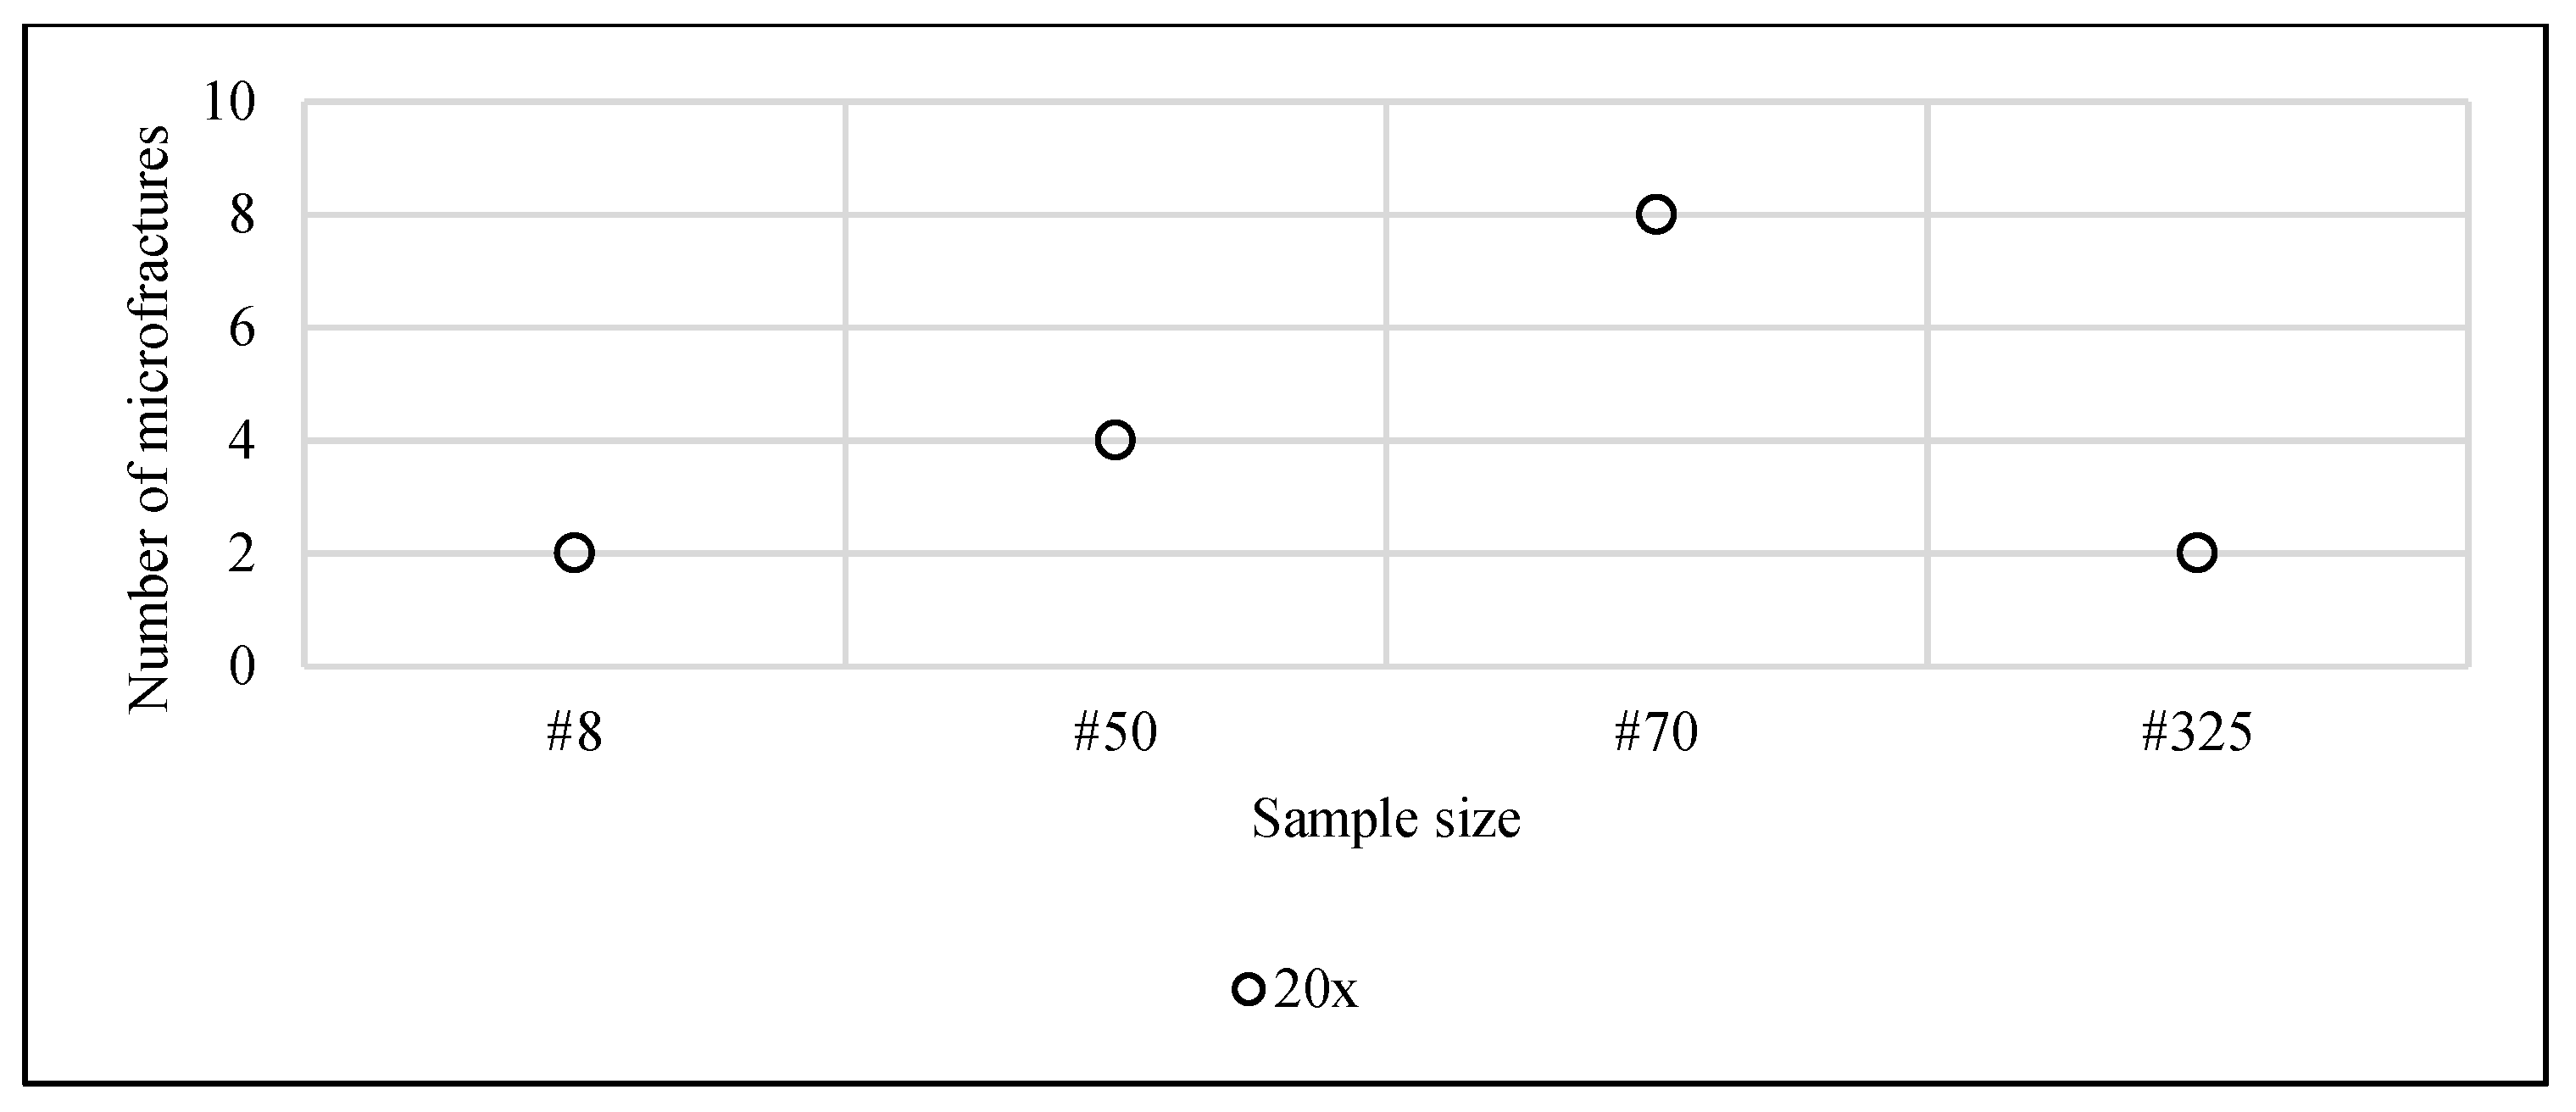
Figure 19.
Number of fractures vs sample size for a 40x lens zoom.
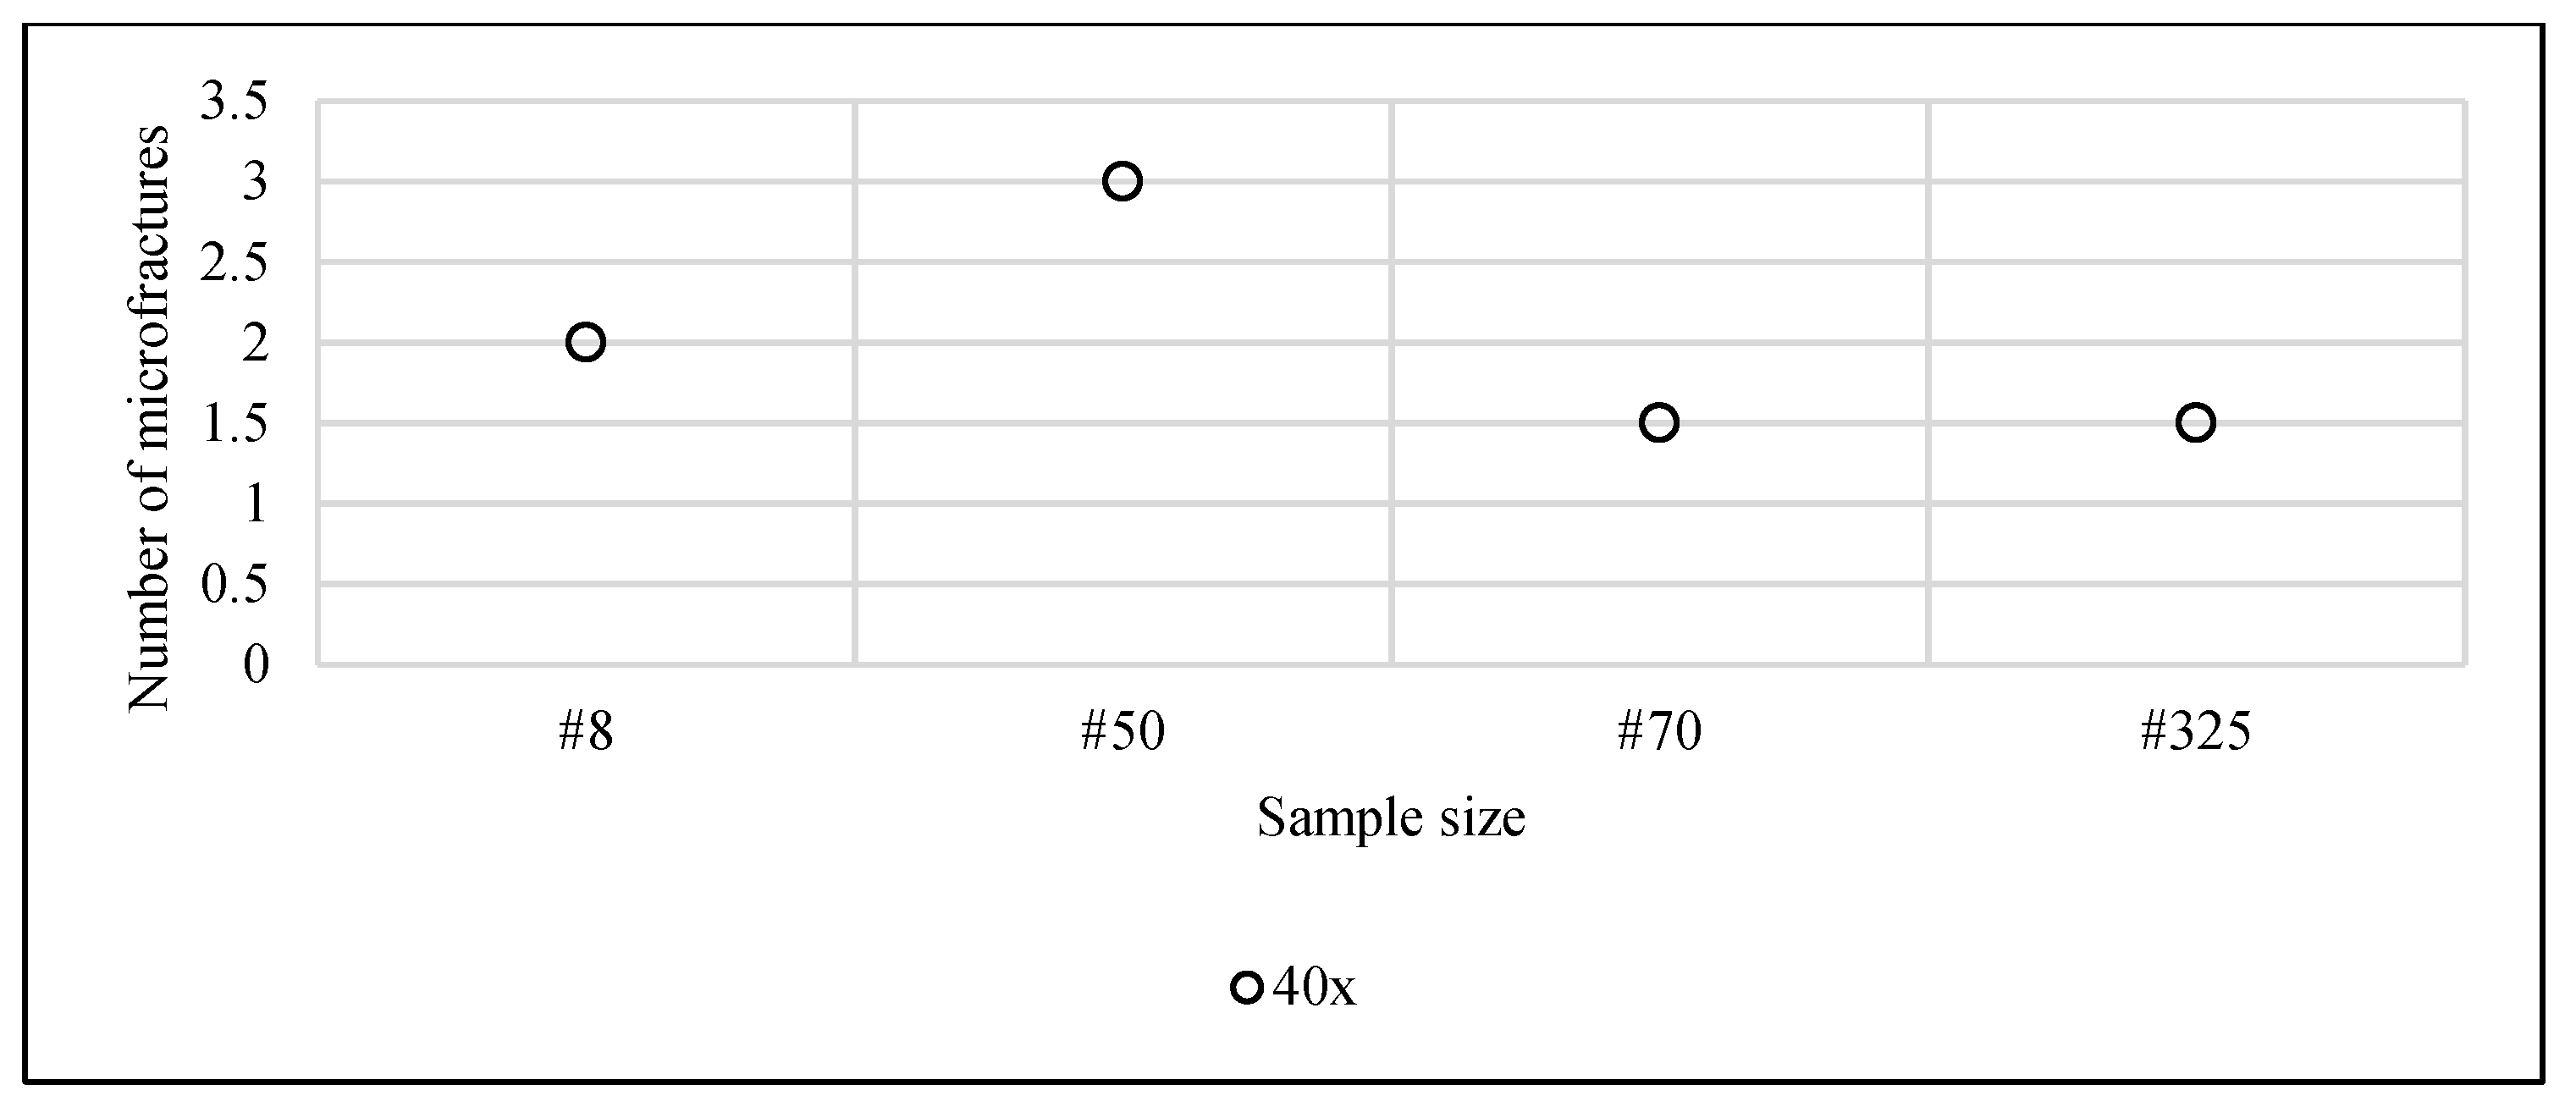

Table 1.
Benefits for comminnution offered by blasting.
| WHAT COMMINUTION NEEDS | WHAT BLASTING OFFERS |
|---|---|
| Small particle size | A particle size distribution adjustable to a desired range varying drill&blast parameters |
| Low internal resistance of the grains | A system of micro-fractures, invisible at the naked eye, that somehow "softens" the material reducing the internal resistance |
Table 2.
Selected studies showing the effects on comminution at the increase of blasting energy. After [23,24].
| Blasting changes | Effects in comminution | Material |
|---|---|---|
| P.F. + 240%, Speficic Priming (Delays/t) + 400% | Stops at the primary crusher -79%, Electricity Consumption at primary crusher - 27% , Total Production Costs -34% |
Marble |
| P.F. + 40% (D&B costs +40%) | Mill throughput + 16%, Grinding costs - 19% |
Gold ore |
| P.F. + 42% | Excavator productivity + 14% Crusher throughput + 30% Grinding throughput + 10% |
n.a. |
| P.F. +25% | Mill Energy -10% | Metal ore |
| P.F. + 33% | Comminution Energy at SAG mill -29%, total Greenhouse emissions -20% | Gold ore |
| P.F. + 65% | SAG mill throughput + 14% | Gold ore |
Table 3.
Tests used during this study.
| Test | Reason | Method |
|---|---|---|
| Point Load test | Evaluating the effect of microfractures at the macroscopic scale | Standard Point-Load tester (ISRM 2007) |
| Bond’s Work Index test via ball mill | Evaluating the reduction of resistance to grinding of the rock due to effect of the microfractures | Standard Ball Mill test (after Bond 1952) |
| Microscopic measurement of fractures | Optical observation | Microscopic observation of blasted mineral sealed in briquettes for fitting under the microscope lens (National Research Council, 1996) |
Table 4.
Diameter of the visual fields used for the study.
| Lens Zoom | Diameter of the visual field (µm) |
| 4x | 500 |
| 10x | 200 |
| 20x | 100 |
| 40x | 50 |
Disclaimer/Publisher’s Note: The statements, opinions and data contained in all publications are solely those of the individual author(s) and contributor(s) and not of MDPI and/or the editor(s). MDPI and/or the editor(s) disclaim responsibility for any injury to people or property resulting from any ideas, methods, instructions or products referred to in the content. |
© 2025 by the authors. Licensee MDPI, Basel, Switzerland. This article is an open access article distributed under the terms and conditions of the Creative Commons Attribution (CC BY) license (http://creativecommons.org/licenses/by/4.0/).
Copyright: This open access article is published under a Creative Commons CC BY 4.0 license, which permit the free download, distribution, and reuse, provided that the author and preprint are cited in any reuse.


