
Submitted:
05 February 2024
Posted:
06 February 2024
You are already at the latest version
Abstract
In rock blasting for mining production, stress waves play a major role in rock fracturing along with explosion gases. Better energy distribution improves fragmentation and safety, lowers production costs, increases productivity, and controls ore losses and dilution. Blast outcomes vary significantly with the choice of the explosive and the properties of the rock mass encountered. This study analyzes the effects of rock mass and explosives properties on the blast outcomes through numerical simulation using data from the case study and later validates the simulation results from the field blast fragmentation. The outcomes suggest that, for a given set of rock properties, the choice of explosive has a major influence on the resulting fragmentation. Strong explosives favor large fracture extents in hard rocks, while less strong explosives offer a better distribution of explosive energy and fractures. The presence of rock structures such as rock con-tacts and joints influences the propagation of stress waves and fractures depending on the structures' material properties, intensity and orientations, and the direction and strength of the stress wave. To achieve effective fragmentation, the blast design should mitigate the effect of variability in the rock mass by ensuring adequate energy distribution within the limits of geo-metrical design.
Keywords:
Blast fragmentation
; numerical simulation
; rock mass properties
; explosive properties
; rock damage
1. Introduction
Drilling and blasting are common operations used to fragment and facilitate rock excavation in mining and civil works. The theory of rock fracture and fragmentation due to blasting suggests an overall combined damage mechanism, where intensity, propagation, and interaction of stress waves are responsible for initially fracturing the rock (conditioning). At the same time, the ensuing gas pressure predominantly effects fragmentation breakage and displacement beyond the immediate blast hole region. While the crushed zone surrounding the blast hole is formed due to higher compressive stresses after the stress wave travels through a distance and the rock yields, the tangential stress changes from compressive to tensile forming radial cracks in the fracture zone [1]. The crushed and fracture zones (crack zones) are the areas of focus in rock fragmentation by blasting.
It is commonly observed that under 10% of broken volume breaks in shear due to compression, while the remaining over 90% is broken by tensile stresses [2]. The further the stress wave travels radially outwards, its amplitude decreases, and it becomes an elastic wave that can deform but not fracture the rock, instigating ground vibrations. The size of the crushed zone can be 2 to 5 times the blast hole radius, while the fracture zone can extend 20 to 60 times the radius. The size of these zones varies vastly depending on the explosive strength and encountered rock mass strength and structural properties.
Damage zones around a single-hole blast have been studied by several researchers experimentally and using numerical models [3–8]. These studies observed that several factors influence the extent of damage zones, the main ones being the explosive strength and rock mass strength. The rock mass is heterogeneous and anisotropic, with various structures cross-cutting the mass, altering the distribution of explosive energy and, hence, the extent of damage zones. Studies on the influence of structural properties [9–13] indicate that the presence of interfaces as rock contacts, fractures, joints, etc. may result into partial propagation, reflection or total arrest of the stress waves and cracks in variable proportions depending on the properties of structures and strength of the stress wave. This complicates the blasting process and blast outcomes.
Regarding the blasting process in variable rock masses where the stress wave passes through rock media with different physical and mechanical properties, Zhang (7) developed the transmission and reflection coefficients of the stress wave from theoretical studies. Chen, Yang (14) found that the incident angle greatly influences how the stress wave interacts with the interface and the stress fields at the crack tip. Xu, Yang (15) determined from the experiments that the stress wave reflects on the joint surface and is concentrated on the crack tip of the joint for the perpendicular joints. Zhu (16) observed from the experiment and numerical modelling that the cracks always propagate perpendicular to the joint surface. Although these studies provide meaningful insight into the stress wave behavior at the interface, the influence of rock heterogeneity and the presence of structures in the blasting process is unclear. Such analysis is valuable in preparing models to predict fragmentation from blasting and in improving blast designs.
Rock fragmentation by blasting is a complex non-linear process involving several input parameters [17]. Due to data analysis limitations and the complexity of the process and the rock mass, numerical modelling has been used to investigate stress wave behavior and the response of rock material to blasting loads and predict outcomes [1,18,19]. Simulations provide a better insight into fragmentation under variable conditions in a more simplified and controlled environment. Finite element modelling (FEM) is vastly used in blasting simulation due to its ability to track the growth and nucleation of cracks of brittle material, such as a rock, from the established damage evolution laws [20]. The RHT constitutive material model introduced by Riedel, Thoma (21) and implemented by Borrvall and Riedel (22) in LS-DYNA has features capable of modelling the dynamic behavior of concrete and in simulating rock fragmentation by blasting.
In this study, the numerical models are constructed and simulated in LS-DYNA to analyze the effect of rock mass and explosive properties on the blast process and outcomes using the data from an existing mine. The model is verified and validated by the field measurement and is later used to propose design considerations for various rock and structural properties.
2. Numerical modelling and verification
Most blast-induced fragmentation studies are based on two dimensions (2D) analysis. Although 2D models simplify the computation process and provide a significant understanding of fragmentation, they do not capture the spatial stress distribution and blast damage in the three-dimensional (3D) setup. In this study, both 2D and 3D numerical simulation models are used in various applications.
LS-DYNA, a nonlinear transient finite element code with an explicit integration scheme capable of implementing dynamic problems, is used to model the blasting process [23]. LS-DYNA can successfully model the interaction between the solid material (rock) and fluid and gas flow (explosion gases) using the Lagrangian algorithm and Arbitrary Lagrangian-Eulerian (ALE), incorporate coupling between Lagrangian and ALE interfaces and apply boundary conditions to restrict elements' movements as needed.
Two main damage models commonly used to simulate the damage evolution of rock mass under blasting loads in LS-DYNA are the Holomquist–Johnson–Cook (HJC) model [24] and the Riedel–Hiermaier–Thoma (RHT) model [21]. From the study conducted by Wang, Wang (25), the RHT model is observed to define the damage distribution in the rock better and describe the formation of the crushed zone and propagation of radial tensile cracks than the HJC model. Therefore the RHT model is used as the constitutive model in this study.
2.1. The RHT Material Model
The RHT material model is an advanced brittle plasticity model for impulsive and dynamic loadings of brittle materials such as concrete, rock, or metals. In the RHT material model, the shear and pressure components are coupled. A Mie-Gruneisen describes the pressure with a polynomial Hugoniot curve that accounts for porous compaction in Eq. (1); where B0 and B1 are material constants, αo is the initial porosity, ρo is the rock density, μ is the volumetric strain and A1, A2, and A3 are Hugoniot polynomial coefficients [22]
Three limit surfaces define the stress state of the material in the RHT strength model: the initial elastic yield surface, residual friction surface, and failure surface, which depend on the hydrostatic pressure. The surfaces represent the reduction in material strength in different meridians and the strain rate effect. Surface material failure is achieved when its ultimate compressive, shear, or tensile strength is reached. Figure 1 illustrates an example of static compressive meridian surfaces; Pt is the pressure at time and Pu is the current pore crush pressure. In the figure, the model is elastic until it reaches the initial yield surface, beyond which plastic strain prevails. When stress reaches the failure surface, damage strain accumulation governs damage evolution. The damage variable of the RHT model (D) is calculated using the Eq. (2) Where  is the accumulated plastic strain and
  the plastic strain failure. D varies from 0 to 1; 0 represents undisturbed material and 1 is a fully damaged material. More information about the RHT model can be found in Borrvall and Riedel (22)
is the accumulated plastic strain and the plastic strain failure. D varies from 0 to 1; 0 represents undisturbed material and 1 is a fully damaged material. More information about the RHT model can be found in Borrvall and Riedel (22)
The RHT model has 37 parameters that need to be obtained or estimated from the rock’s physical and mechanical properties. Properties such as the density, uniaxial compressive strength, bulk modulus, and elastic shear modulus are obtained from the laboratory physical and mechanical experiments. Other parameters such as Hugoniot polynomial coefficients A1, A2, and A3, crush pressure (Pcrush), compressive and tensile strain rate dependence exponents, etc. are estimated rock physical and mechanical properties using the relationships presented by Borrvall and Riedel (22) and Xie, Lu (19). Other parameters, such as the yield surface parameters (G*c and G*t), reduction factor in shear modulus XI, and minimum damaged residual strain  are insensitive to simulation results and were taken from the reference values suggested by Borrvall and Riedel (22)
are insensitive to simulation results and were taken from the reference values suggested by Borrvall and Riedel (22)The RHT model was calibrated from the Banded Iron Formation rock (BIF) studied by Dotto, Pourrahimian (8) from Nyankanga Pit; Geita Gold Mine in Tanzania. The parameters calibrated for the RHT model are listed in Table 1.
2.2. Explosive Properties and Parameters
Upon explosive detonation in the blast hole, the chemical reaction transforms the explosive material into explosion gases at very high pressure and temperature. There are different ways blast loads can be introduced into a simulation model. One way is using the high explosive burn material and Jones-Wilkins-Lee equation of state (JWL EOS) to model explosive charge detonation. The JWL EOS is a high-energy combustion model that can reliably predict higher explosion pressures. The model defines the pressure of detonation products Pcj using Eq. Error! [26]; where A, B, R1, and R2 and ꞷ are material constants, E is detonation energy per unit volume, and V1 is the relative specific volume of detonation products.
The explosive used is a specially manufactured emulsion by ORICA; Fortis Extra [27], with properties summarized in Table 2. The input parameters for the JWL Model for emulsion are adapted from a similar emulsion explosive E682 calibrated by Hansson (28) as presented in Table 3

Table 2.
Explosive (Fortis Extra) properties.
| Explosive property (units) | Density (g/cm3) | Minimum diameter (mm) | VOD (km/s) | Relative Effective Energy (REE), (%) |
| Value | 1.10–1.25 | 64 | 4.1–6.7 | 151–189 |
Table 3.
Explosive parameters for simulation.
| Explosive Type | Density (kg/m3) | VOD (m/s) | Pcj (GPa) |
A (GPa) |
B (GPa) |
R1 | R2 | ꞷ | Eo (kJ/cm3) | vo |
| E682/FortisE | 1,207 | 4,789 | 6.926 | 276.2 | 8.44 | 5.2 | 2.1 | 0.5 | 3.87 | 0 |
2.3. Simulation Model Preparation, Verification, and Validation
The numerical models were created and executed using LS-DYNA Version: smp s R11.1 on a Dell Precision7810 with two Intel(R) Xeon(R) eight-core CPUs running at 2.40 GHz and equipped with 32GB RAM. Figure 2a illustrates the full-size single blast hole model for the intact rock. The model adopts the dimensions of the blast pattern used in Nyankanga pit, where the burden and spacing are 5.5 m and 6.5 m, respectively. The bench height is 10 m with a 1.5 m sub-drill. The charge column is 7 m and the stemming height is 4.5 m. The radius of the blast hole is 101.5 mm, and a coupled charge is adopted, where the diameter of the charge is the same as the blast hole. Non- reflecting boundaries are set on the four sides to simulate infinite rock medium on respective sides and two sides are left as free boundaries along the burden and the top side to allow stress wave reflection. The simulation is run for 2.5 ms.
The simulation results show the damage zones from the vertical plane section B (Figure 2b) along the burden plane and horizontal plane section A (Figure 2c) 3 m from the bottom of the blast hole. The crushed zone is represented by the circular red contour around the charge, and the fractured zone is defined by the cracks propagating from the crushed zone. Spalling occurs at the free face propagating inwards towards the blast hole. The initial crushed zone is 0.184 m at 0.7 ms, almost twice the blast hole radius; it extends to 0.3 at 0.3 ms. The fractured zone is 5 m. The maximum borehole pressure recorded is 2828 MPa, and the peak pressure and peak particle velocity (PPV) at the end of the crushed zone are 1280 MPa, and 95.2 m/s, respectively. Pressure at the end of the fractured zone is 15.97 MPa along the burden (free boundary) and 18.82 MPa along the spacing. PPV is 4.37 m/s on the burden and 1.9 m/s along spacing.
To investigate the validity and applicability of the simulation results, they are compared with the field and analytical model results obtained by Dotto, Pourrahimian (8) in Error! Reference source not found.; rc and rf are the radius of the crushed zone and fractured zone. Pe, Pf, ue, and uf are the peak pressures and the peak particle velocities at the end of the crushed and fractured zone, respectively. From the visual comparison and the standard error calculation, it is evident that the simulation results are similar to the field and analytical approach results except for the far-field monitoring, which underestimates the pressure and PPV near the blast hole. Likewise, when compared to field data, the pressure and PPV curves obtained from the simulation history in Figure 2d agree well with the field data, indicating that the simulation results are feasible.
Table 4.
Simulation results validation.
| Approach | rc (m) | Pe (MPa) | ue(m/s) | rf (m) | Pf (Mpa) | uf (m/s) |
|---|---|---|---|---|---|---|
| Study approach | 0.169 | 1,543.27 | 74.23 | 5.25 | 14.69 | 1.25 |
| SWT | 0.194 | 1,260.88 | 98.24 | 4.75 | 15.85 | 1.23 |
| HEL | 0.173 | 1,473.89 | 114.84 | - | - | - |
| Numerical modelling | 0.182 | 1,280.00 | 95.2 | 5.00 | 15.97 | 1.9 |
| Far-field monitoring | 0.169 | 592.82 | 50.63 | 5.25 | 13.82 | 1.25 |
| Standard error | 0.01 | 70.30 | 8.34 | 0.11 | 0.46 | 0.15 |
3. Factors Influencing Damage/Fragmentation in Single Blast Holes
Several factors influence the blast outcomes. This study covers the variable explosive properties/strengths, rock properties, the rock contacts, and rock joint parameters (the joint’s width and infill material, distance from the blast hole, orientation reference to the free face, and the fracture frequency). The cases are studied by a single blast hole simulation in 2D. The diameter of the explosive is 203 mm, and the rock is 5.5 square meters; the size of the elements ranges from 0.03 mm close to the blast hole and increases gradually to 0.08 mm.
3.1. Variable Explosive and Rock Properties
ANFO and emulsion are the commonly used commercial explosives in civil and mining applications, depending on the energy requirements and the water/moisture content in the blast holes. JWL parameters for emulsion are presented in Table 2, and similar parameters for ANFO were adopted from Sanchidrián, Castedo (29) in
Table 5.
ANFO JWL parameters.
| Explosive Type | Density (kg/m3) | VOD (m/s) | Pcj(GPa) | A (GPa) | B (GPa) | R1 | R2 | ꞷ | Eo (GPa) | vo |
| ANFO | 902 | 4426 | 4.503 | 207.79 | 2.91 | 5.91 | 1.08 | 0.4 | 2.29 | 0 |
Four cases are studied for the two types of explosives and the two rock types. The first rock is BIF with properties listed in Error! Reference source not found.; this study considers it a hard rock. The second rock is sandstone with RHT material parameters calibrated from the experiment results by Jeong and Jeon (30) in Table 6.
The four scenarios evaluated the influence of explosive properties on the formation of damage zones on the two rock types. Figure 3 shows the peak pressure and PPV profiles for the four scenarios evaluated. The pressure generated is higher with the high-strength (emulsion) explosive and hard rock. The peak pressure attenuates faster in a soft rock. The highest PPV is observed with high emulsion and the soft rock; it attenuates faster and all curves converge to 10 m/s at 3 m except for the hard rock/ANFO which is consistently low.
As illustrated in Figure 4, due to high confinement and strength, the crushed zone formed in hard rock/emulsion is small, 0.3 m, and the fractured zone extends to a longer distance (5 m). When ANFO is used; the fractured zone is reduced to 4.5 m along with the overall damage intensity. Conversely, on soft rock, the crushed zone formed is bigger, 0.54 m, but with less confinement (high PPV), the fractured zone is reduced to 4 m for both explosives. The damage zones on the soft rock do not change with a change in explosive, although within the same boundaries, the damage contours and curves in Figure 4 indicate higher damage intensity when the emulsion is used. In all cases, further fracturing is observed on the free face side (more with emulsion). The distribution of energy and, hence, fractures is better when ANFO is used.
3.2. Influence of Rock Contacts on Fracture Distribution
The natural rock mass is heterogeneous and usually consists of layers with different rock compositions, properties, thicknesses, etc. making their mechanical properties different from a homogeneous rock mass. The contact between soft rock and hard rock in blasting causes wave dissipation at the interface and hence variable stress wave attenuations from the intact rock. Studies on the behavior of the transmitted wave through interfaces with different impedances show that the wave can either be attenuated or enhanced depending on the direction of the wave.
In this study, two rock contact scenarios are evaluated in a 2D model; the first is the contact between “hard-to-soft” and “soft-hard” at 1.5 m from the blast hole. The second scenario is “hard-soft-hard” and “soft-hard-soft” with interfaces at 1.5 and 2.5 m from the blast hole. Monitoring points are set at 1 m, 2 m, and 3 m distances (M1, M2, and M3) as illustrated in Figure 5.
Figure 5.
General models for contact simulation .
Results indicate that the pressure/stress is enhanced through a “soft-to-hard” interface and on the contrary attenuates through a “hard-to-soft” interface. On the latter, the pressure is reflected at the interface resulting in double peaks on the incident side as seen in Figure 6(a). On multiple contacts, energy transmission and reflection across the joints follow the same trend although depending on the interface; for example, comparing “hard-to-soft-to-hard” (HSH) in Figure 6(a) and (b), the pressure on the soft rock at 2 m increases in (b) due to increase in joint stiffness causing an increase in the pressure transmitted to the hard rock at 3 m distance.
Although the pressure is enhanced on the “soft-to-hard” interface, it is hardly above the hard rock strength, and the cracks are terminated at the contact except for the reflection at the free face; the opposite is true for the “hard-to-soft” interface where the pressure attenuates but still higher than the soft rock strength and the cracks propagate as seen in Figure 7(a) and (b). Overall, the likelihood of a stress wave causing fracturing depends on the impedance difference of the material on the opposite sides of the interface, the direction, and the strength of the stress wave at the interface.
3.3. Joint Parameters and Their Influence on Blast Damage
The most common feature encountered in the rock mass is the joints formed from brittle fractures of rock, usually by tensile stress acting on a solid rock. The joints can be void or filled with various materials such as clay, sand, etc. When the rock fractures and somehow gets displaced, it forms a fault. The presence of joints and their properties influence the overall rock strength, the interaction of explosive energy, and the overall fragmentation. Understanding such influences is important in optimizing blast designs to achieve operations efficiency and productivity in mining. This study covers the influence of the joint’s infill material, width and persistence, distance from the charge, and orientation relative to the free face. It also covers the influence of multiple joints considering fracture frequency and orientations.
The effect of joints infill material is analyzed through simulations of void joints (air-filled joints) and joints-filled clay material. Air is modeled as NULL material and ALE part with properties described in Table 7, while the clay infill is modeled using the plastic kinematic material model as a Lagrangian part with properties detailed in Table 8. The joint is 3 mm wide and 1 m from the blast hole; the surrounding rock is BIF.
The results indicate that partial reflection and transmission occur depending on the joint properties when the stress wave encounters the joint. As for the infill material, as illustrated in Figure 8, more energy is reflected on the void joints, causing excessive failure on the incident side and less fracturing on the opposite side.
Using clay as the infill material and BIF as the main rock, several other joint parameters are evaluated for their influence on the blasting fragmentation. Figure 9(a) and (b) illustrate damage distribution for variable joint widths; 3 and 10 mm and Figure 9(c) and (d) persistence where the joint length is changed from full-size length cutting across the bench to 5 m for both cases. With increasing joint width the fractures on the opposite side of the joint decrease significantly, more energy is reflected causing the increased size of the crushed zone, and significant energy is absorbed in joint deformation, also seen on the rock/joint interface (Figure 9(b)) reducing significantly the strength of the wave transmitted through the joint.
Figure 9.
Joint width and persistence influence on fracture distribution.
When the compressive stress wave reaches the joint interface, the stiffness of the joint increases at a rate that depends on the joint thickness and the normal stress. For the same infill material and normal stress, smaller joints have higher specific stiffness growth than wider joints. An increase in joint stiffness increases the joint’s transmission coefficient. For the same joint properties and orientation, fracturing is favored by discontinuous joints by the formation of new fractures from stress concentration on the cracks/joint tips and uninterrupted energy transmission on the rock bridges, as illustrated by the pressure contours taken at 0.6 ms on full-size joint and 5 m joint in Figure 9 (e) and (f).
Fragmentation distribution in the rock mass depends on the strength and direction of the stress wave and hence is affected by the distance from the charge to the joint and its orientation relative to the direction of the wave and relative to the free face. Several scenarios are assessed for each case with and without a free face; the distance from the charge is varied from 0.5 m, 1 m, 2 m, and 3.5 m, and joint orientation from 0, 15, 45, 60, and 90 degrees relative to the free face.
Figure 10 (a to d) shows damage distribution for variable distance simulations. Fragmentation increases with the wave reflection at the free face in all cases where the free face is used. Fracture patterns generated for various distances indicate that the closer the joint is to the blast hole more energy is reflected and used up on joint deformation, causing less fracturing on the opposite side, as with 0.5 and 1 m distance joints.
Figure 9.
Damage distribution at various distances from the charge.
Unlike the 1 m distance, when the joint is at 0.5 m, the high energy associated with closeness to the blast influences sufficient energy transmission across the joint, causing fracturing on the opposite side with additional enhancement from the free face. Wave energy reflection and joint deformation decrease with distance increase, hence increasing fracturing for 2 m joint. At 3.25 m the stress wave has attenuated, and fracturing does not occur on the opposite side of the joint except for the enhancement caused by the reflected wave at the free face in Figure 9(d).
The orientation of the joints and the free face influences the direction and propagation of cracks as illustrated in Figure 10(a to d). Cracks propagation beyond the joint depends on the angle at which the stress wave hits the joints. Regardless of the joint orientation, in the areas where the joints are hit perpendicularly or near perpendicular, the wave gets transmitted, and cracks propagate through the joint as observed in the 30° orientation. Further burden fracturing depends on the energy reflected at the free face. Energy reflection is limited to the portion that is close to the free face when the joint is perpendicular to the free face as seen with a 90° joint. Since the joint orientation does not favor further cracking from wave reflection at the free face, fragmentation on the opposite side of a vertical joint is significantly reduced (Figure 10(d).
Joints usually occur in multiples, evenly spaced, with the same orientation and physical properties forming a joint set. When two or more joint sets intersect, they form a joint system which is a common feature in the rock mass. The spacing between the joints (fracture frequency), orientations, and intersections affect the fracture distribution from blasting. The analysis is presented in Figure 11
Investigation of the effect of joint frequency was conducted from three scenarios with 2, 3, and 4 joints per meter. The simulation results show that increased joint frequency reduces the burden cracking significantly as illustrated in Figure 12(a). With the increase in joint frequency, the wave goes through multiple partial reflections and transmissions, weakening the wave strength. Similarly, joint deformation consumes wave energy, and with the increase in joint frequency, this occurs multiple times, contributing to weakening the stress wave and lessening the fracturing of the burden
Figure 10.
Damage distribution at various orientations.
Figure 11.
Effect of multiple joints and their orientations on fracture distribution.
The analysis of the joint system (randomness) with three parallel joints and three intersecting joints all within 3 m width in Figure 11(b), shows better energy transfer in parallel than random joints indicated by the least fracturing on the opposite side of the joints. The figure also shows the peak stress monitored in four locations for the two cases where the wave is observed to attenuate more rapidly with random joints.
4. Summary and Verification
4.1. Analysis Summary
Section 3 covers the analysis of several factors influencing blast outcomes, mainly explosive strength, intact rock strength, and structural properties. From the analysis of explosive energy and rock strength, it has been observed that high-energy explosives like emulsion offer a larger extent of fracturing. In contrast, the ANFO explosive offers a better energy distribution. The extent of fracturing in soft rock does not improve with increasing explosive energy due to less confinement associated with low strength and higher deformations. It requires more energy to fracture a hard rock; therefore, the damage extent decreases when ANFO is used on the hard rock.
The contacts between soft and hard can enhance or attenuate the stress wave depending on the impedance difference and the direction of the wave. The same trend is observed with multiple contacts, but depending on the properties of the contact materials and the distance between the contacts, the attenuations or enhancement can vary significantly.
Variable joint parameters influence the fragmentation differently, as summarized in Figure 13. The figure compares the number of damaged elements in various structural properties to those in the intact rock (Damage =1).
The type of joint infill material and the width influence the transmission of the energy and crack propagation across the joint due to materials impedance difference and joint stiffness. Empty joints reflect most of the energy. On wider joints, in addition to energy reflection, more energy is absorbed in joint deformation. Joint persistence determines the surface area in which the joint affects the stress wave. Discontinuous joints favor more fragmentation over continuous joints from blast energy by offering rock bridges for stress wave and cracks propagation, and also from the stress concentration on the joints tips fractures are initiated.
The joint orientation affects the distribution of explosive energy and cracks. Stress waves and cracks can easily propagate in the areas where the wave hits the joint perpendicularly. In this case, angled joints become favorable in energy and crack propagation. Further cracking on the opposite side of the joint occurs from the wave reflection at the free face making the perpendicular joints to the free face at a disadvantage.
When the joint is very close to the blast hole, the high-intensity stress wave overcomes losses from reflection and joint deformation, allowing some wave transmission and crack formation across the joint. As the distance increases, the energy attenuates, less gets transmitted, and fewer fractures are formed beyond the joint. When the joint is the furthest and the stress wave has weakened, very little to no fractures form beyond the joint
Joints usually appear in a family with similar properties and orientations, forming joint sets and systems. The comparison of the fracture frequency analysis indicates a consistent decrease in energy transmission and crack formation with increased fracture frequency. Parallel joints offer better energy transmission than randomly oriented joints for an equal number of joints.
Figure 12.
Analysis summary.
4.2. The Field Analysis and Model Validation
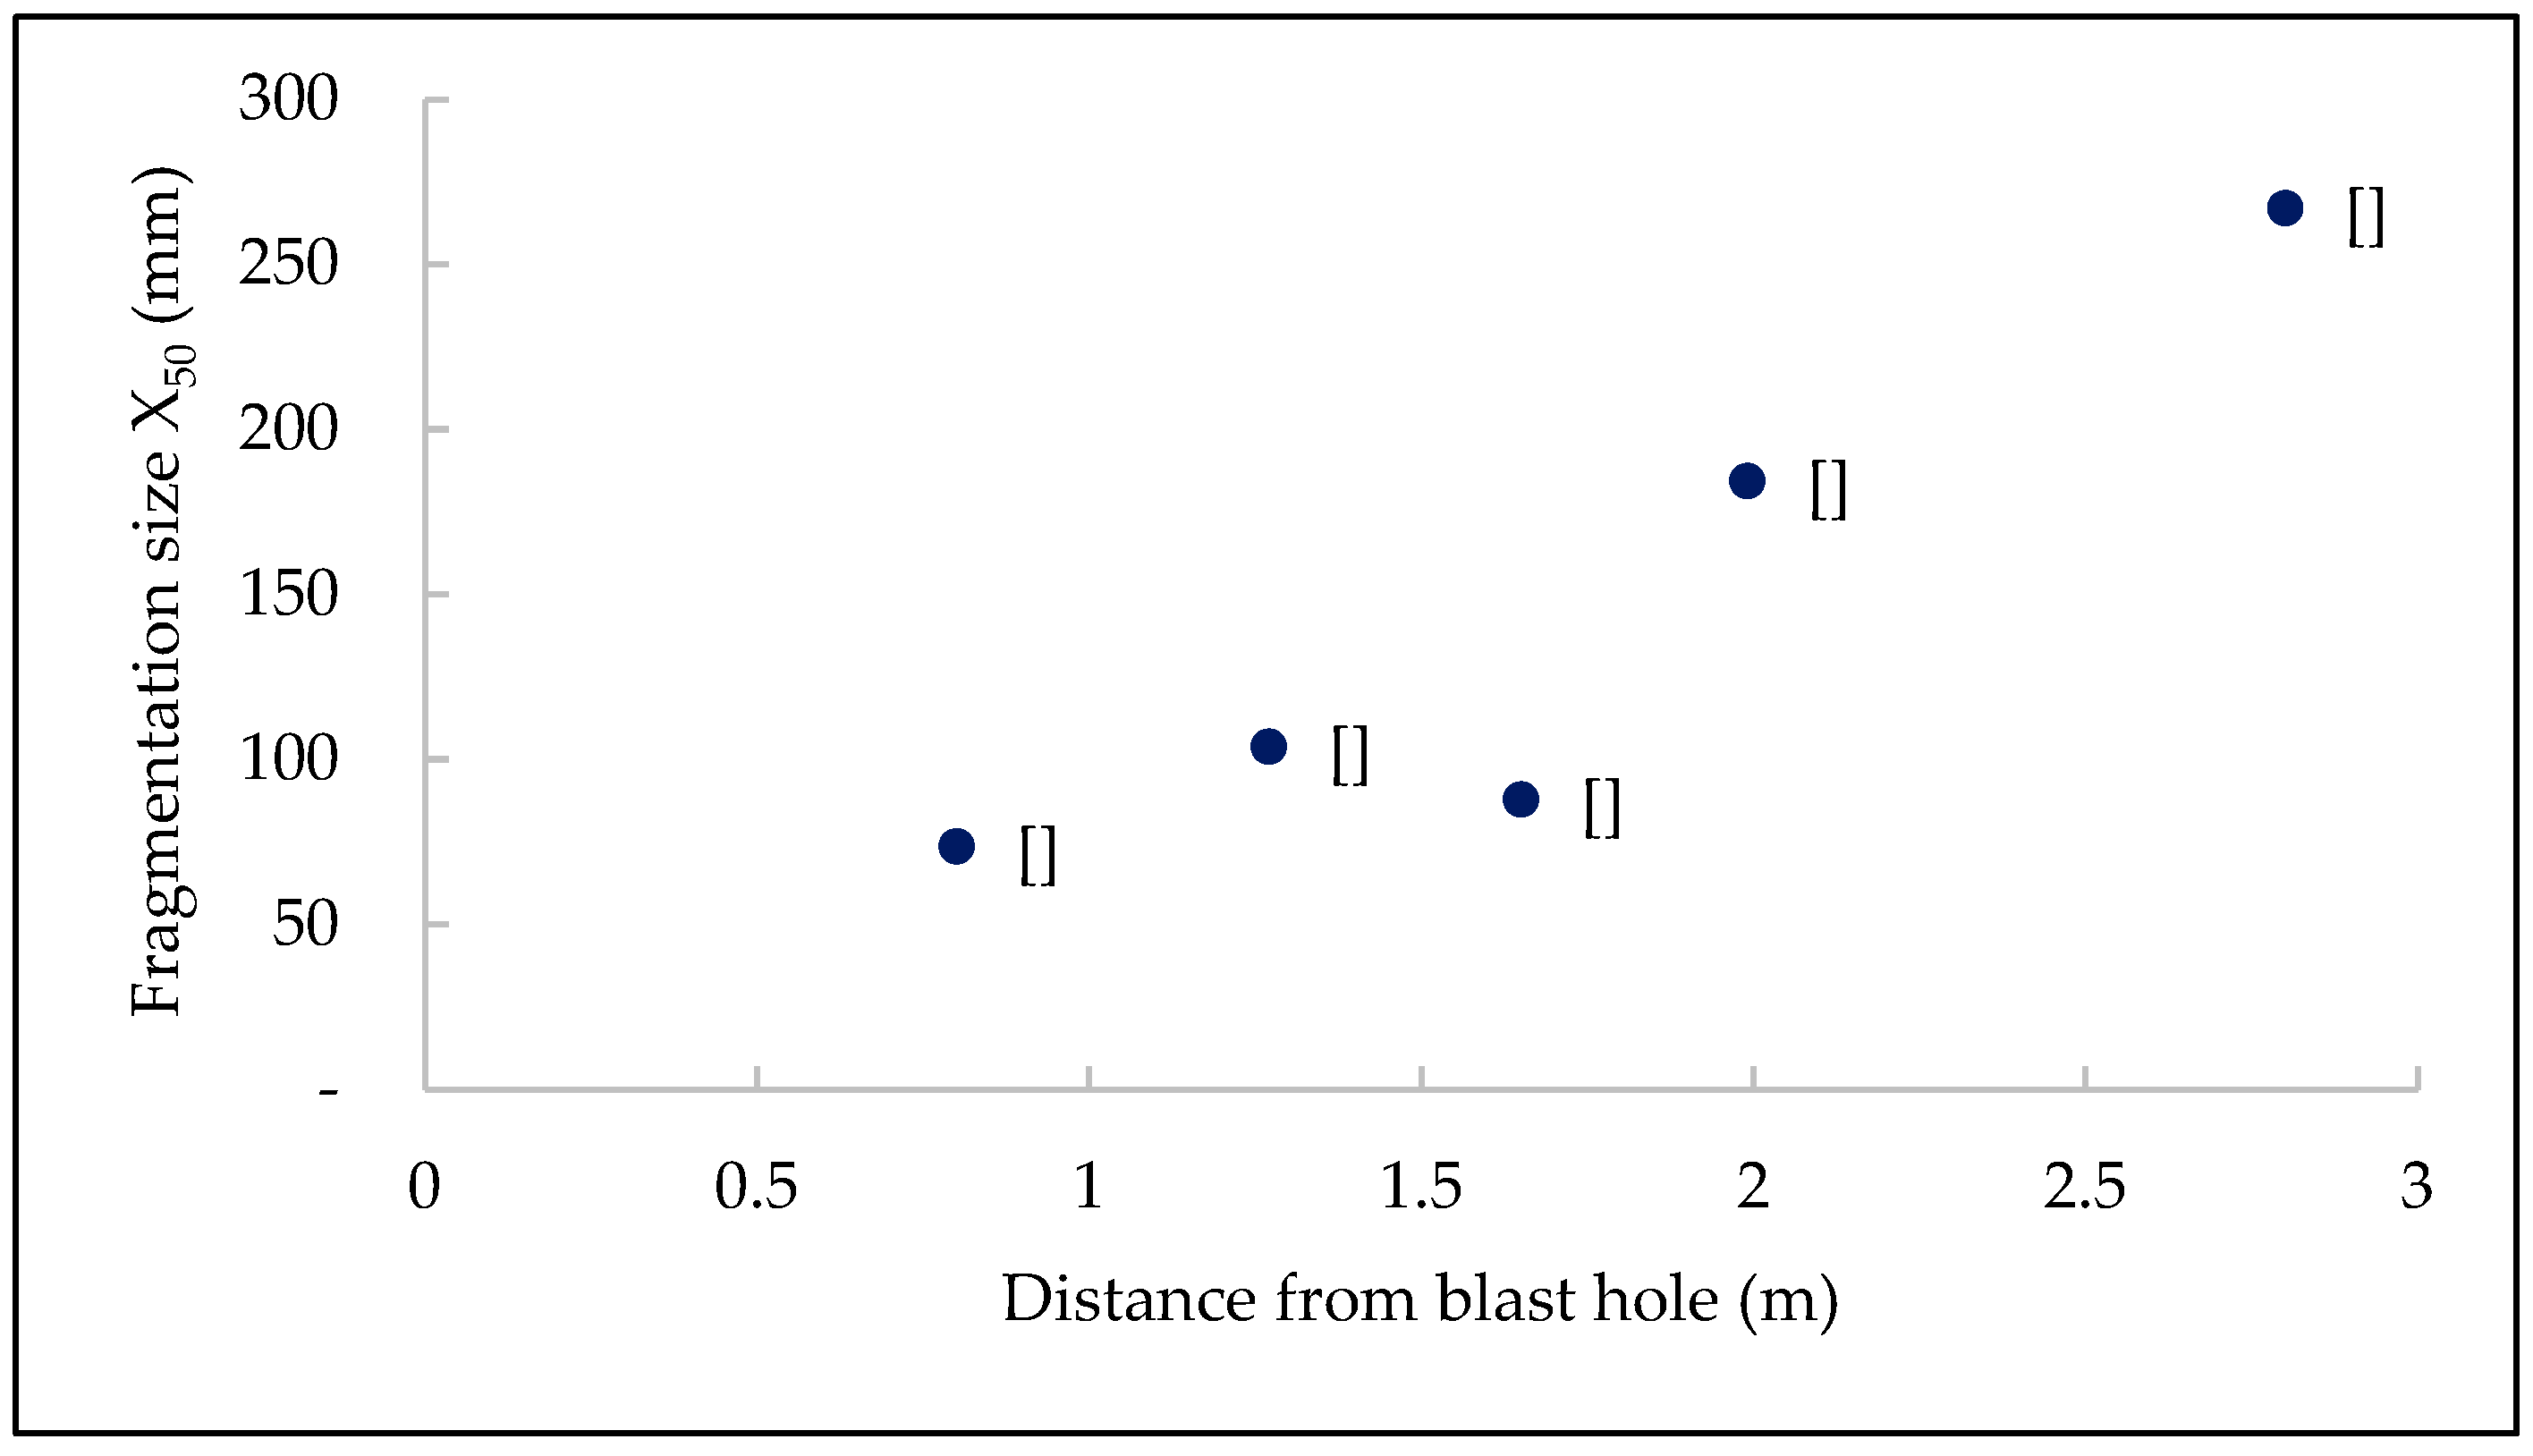
Pit wall mapping and fragmentation analysis conducted by Dotto, Pourrahimian (8) in Figure 13 (in locations P1 to P14) established the location and orientation of the joints relative to the blast holes. They estimated the average in-situ block size (B50), the average fragmentation (X50), and the block reduction factor (BRF), as seen in Error! Reference source not found. and Figure 14. Based on the fragmentation analysis, the general trend indicates an increase in the average fragmentation size with the burden distance. P8 has the smallest fragmentation size and is the closest to the blast hole (0.8 m). Although multiple random joints cross (see Figure 13), they are very close to the blast hole within the high-intensity stress wave zone. P6 is the furthest from the blast hole. It has several joints at random orientations crossing the burden, resulting in coarser fragmentation, similar to the scenario presented in Figure 11(b).
Figure 13.
Major structures mapping and locations for fragmentation analysis.
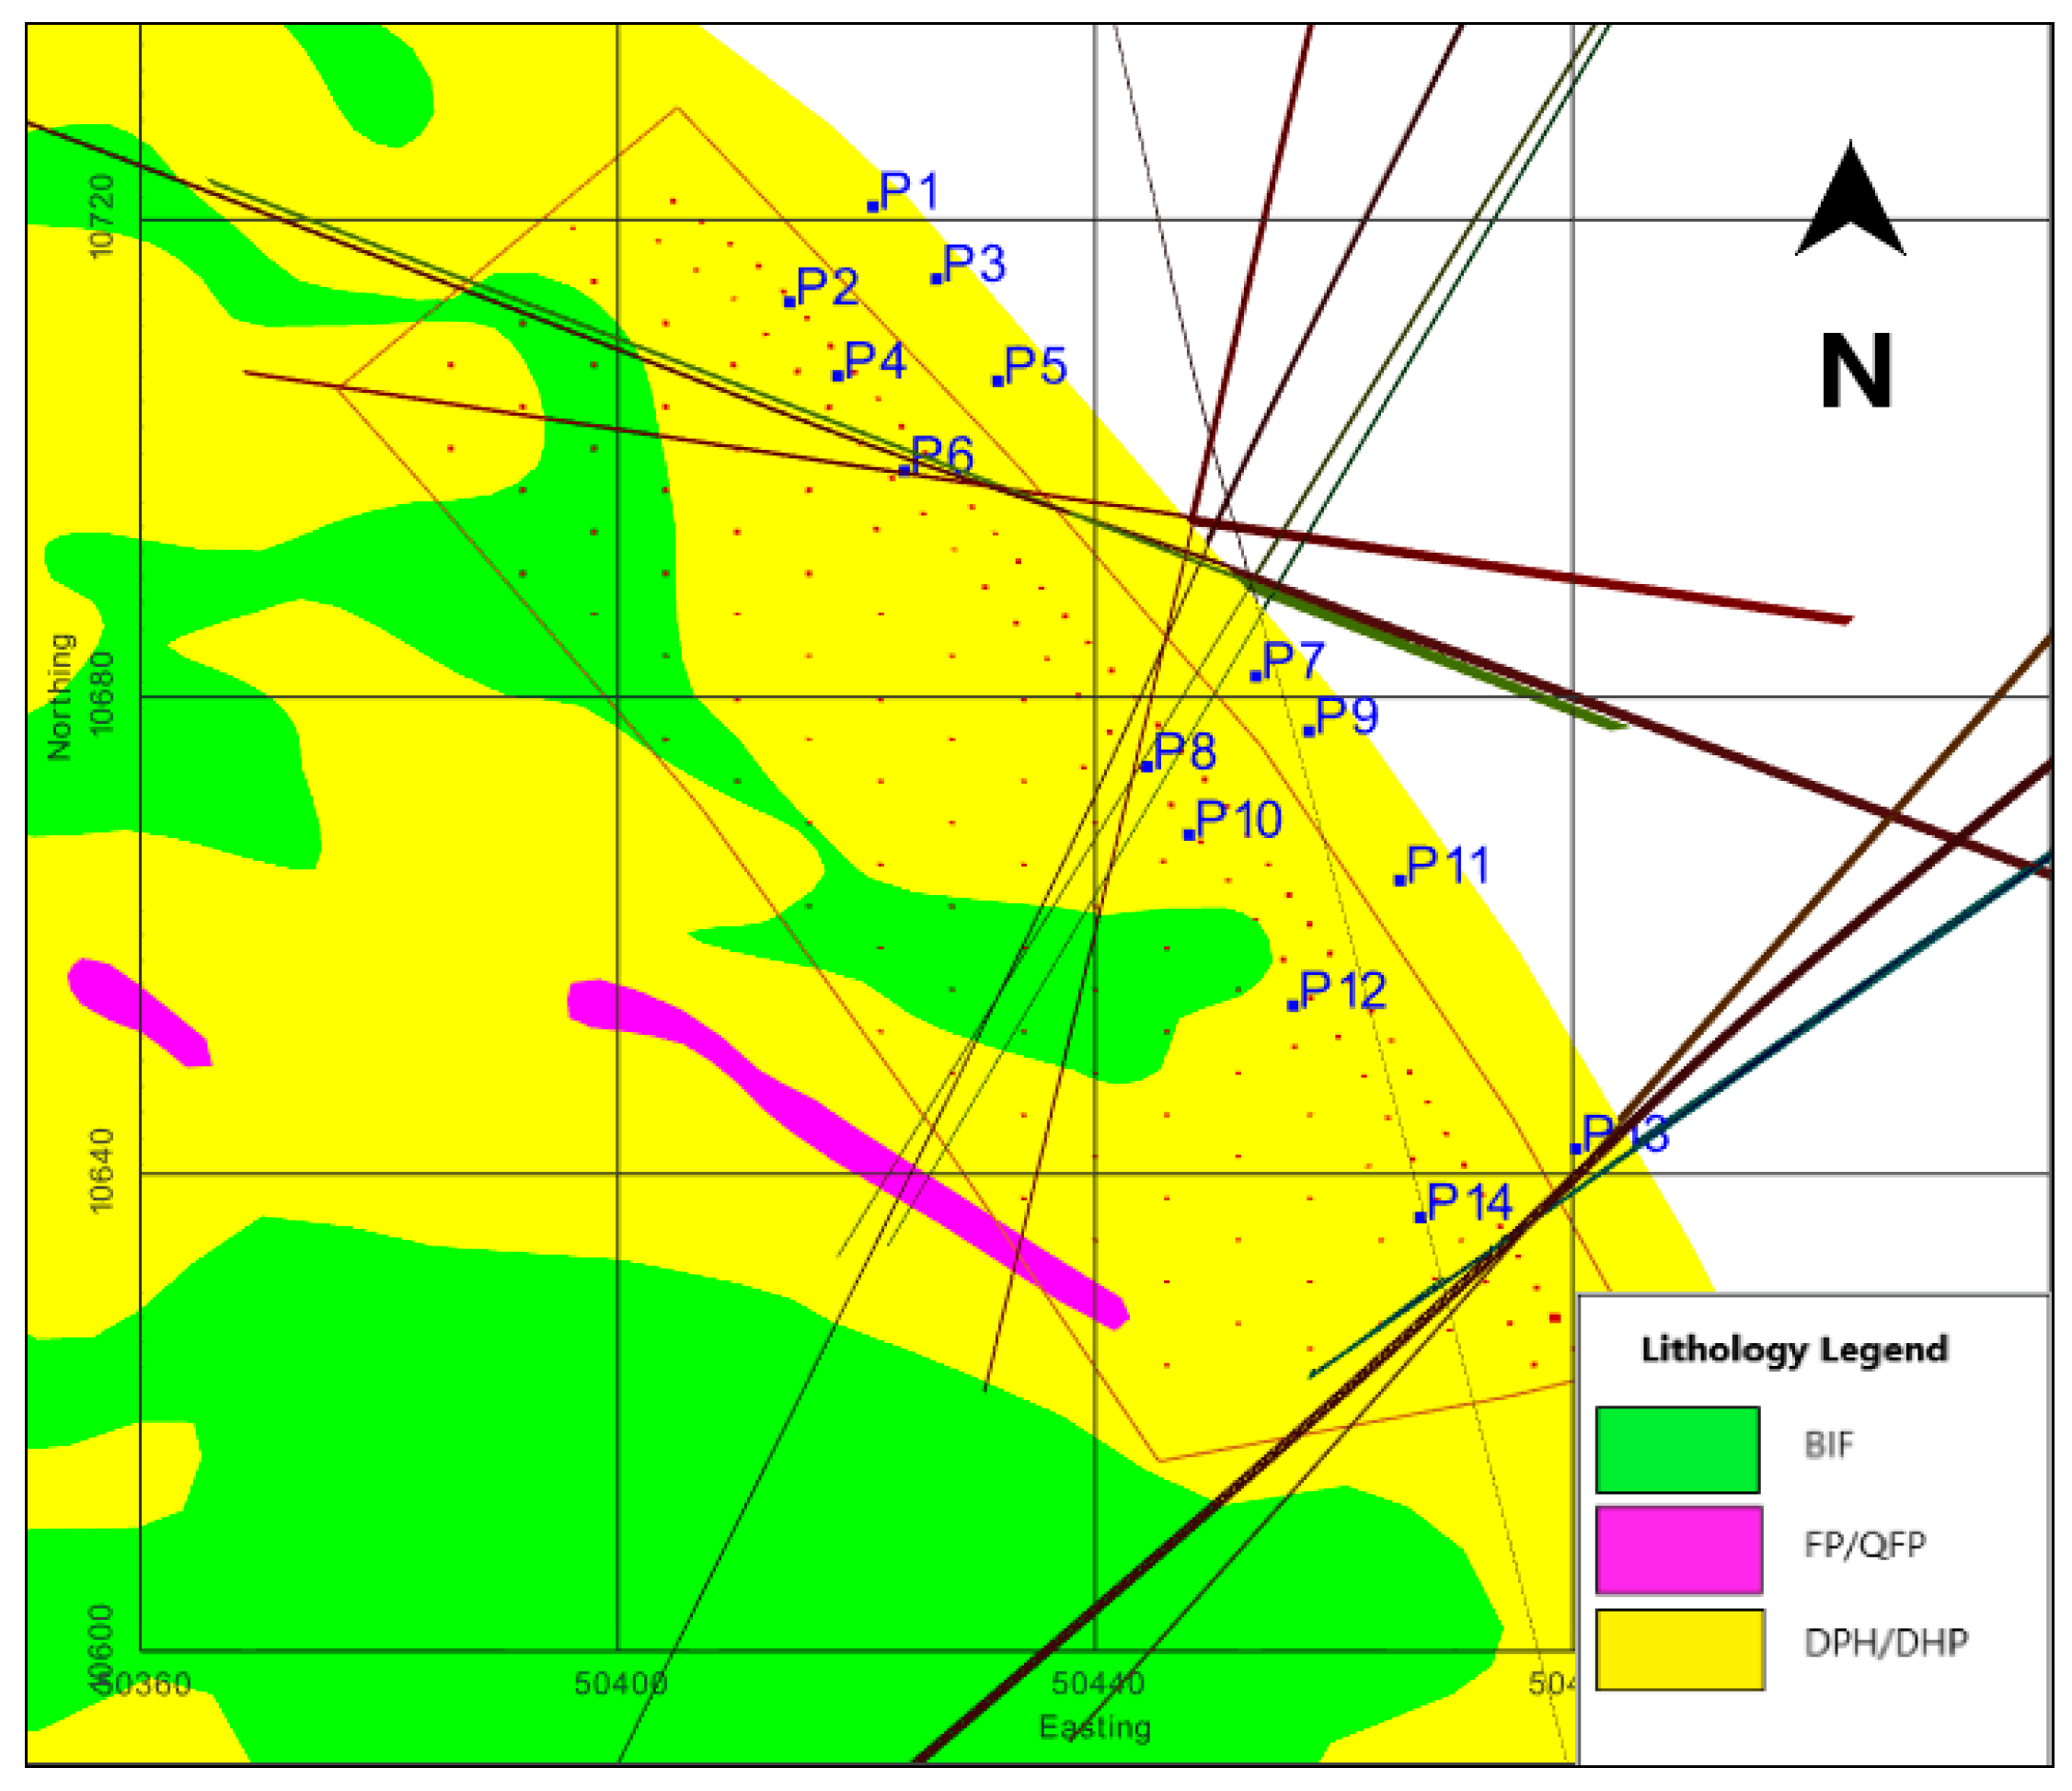
Table 9.
Block reduction factor calculations.
| Muckpile Point | Distance from BH, (m) | Intact rock size (B50), (m) | Charge (kg) | SD (m/kg0.5) |
PPV (m/s) |
Average frag. (X50) | BRF (B50/X50) |
| P2 | 2.48 | 1.04 | 73.24 | 0.29 | 1.37 | 129.14 | 8.09 |
| P4 | 2.17 | 1.68 | 73.24 | 0.25 | 1.58 | 237.42 | 7.07 |
| P8 | 0.8 | 0.67 | 210 | 0.06 | 8.25 | 73.67 | 9.12 |
| P6 | 2.8 | 2.38 | 210 | 0.19 | 2.12 | 267.09 | 8.89 |
| P10 | 1.27 | 2.26 | 210 | 0.09 | 5.00 | 103.97 | 21.72 |
| P12 | 1.65 | 1.42 | 210 | 0.11 | 3.76 | 87.98 | 16.16 |
| P14 | 1.99 | 1.30 | 210 | 0.14 | 3.07 | 184.40 | 7.07 |
P10 and P12 are almost a quarter burden distance from the blast hole, with fewer to no significant joints between the blast hole and the monitoring point. A medium-size fragmentation is observed in both cases. Although P10, which is closer to the blast hole, has a slightly bigger average fragmentation (103.97mm) as opposed to P12 (87.98 mm), it has a higher size reduction factor (22) as compared to P12 (16). The similarity between simulation and the blasting fragmentation on the increase of the fragmentation (reduced damage) with the distance and the role of the random multiple joints on the redistribution of stress wave and cracks indicate that the simulation results are valid.
Figure 14.
Fragmentation along burden in various monitoring locations.
5. Conclusions
This study conducted a numerical simulation of the effects of explosive strength, rock strength, and structural properties on rock damage in a single blast hole. The field input parameters and fragmentation results were used to prepare and validate the models. The conclusions drawn from the analysis are as follows;
- The RHT model can be used to describe the blast process and evaluate the impact of variable input parameters.
- The choice of explosive for the rock type greatly influences the blast outcomes. From the analysis, the strong explosives offer longer extended fractures while the less strong explosive (ANFO) has a better fracture distribution. With soft rock, the extent of fractures does not increase with stronger explosives; instead, it increases the damage intensity within the same boundaries. Using a weaker explosive on harder rock reduces the extent of fractures.
- The analysis of the structural properties shows the similarity in the behavior of the stress wave and crack propagation at the interface due to the impedance difference of materials, the intensity, and the direction of the wave. When the stress wave travels from the hard to soft rock, it is enhanced and attenuated when it travels in the opposite direction, similar to the cracks. The same is expected with multiple interfaces, although the outcomes may vary depending on the thickness of rock layers.
- The joints influence the stress wave and fracture propagation differently depending on the properties of the infill material, the width and continuity of the joints, the distance from the charge, the number of joints in a burden distance, and their orientations. Regardless of the case, the stress wave on the opposite side of the joint needs to be higher than the rock strength to guarantee fracturing; this includes the wave reflected at the free face.
Understanding the properties and how they affect energy and fracture propagation is important in ensuring effective blast designs. Since the geology, rock, and structural properties cannot be changed, their influence can be mitigated by the choice of explosive, geometric design of the pattern, initiation delays, and firing sequence, among others.
Author Contributions
Conceptualization, M.S.D. and Y.P; methodology, M.S.D.; software, M.S.D and Y.P.; validation, M.S.D..; formal analysis, M.S.D.; investigation, M.S.D.; resources, Y.P.; data curation, M.S.D.; writing—original draft preparation, M.S.D.; writing, review and editing, Y.P; visualization, M.S.D.; supervision, Y.P. All authors have read and agreed to the published version of the manuscript
Funding
This research received no external funding
Institutional Review Board Statement
No Applicable
Informed Consent Statement
Not Applicable
Data Availability Statement
Not Applicable
Acknowledgments
The authors would like to thank Geita Gold Mine for allowing field access for data collection.
Conflicts of Interest
The authors declare no conflict of interest
References
- Zhu Z, Mohanty B, Xie H. (2007). Numerical investigation of blasting-induced crack initiation and propagation in rocks. International Journal of Rock Mechanics and Mining Sciences, 44(3), 412-24. [CrossRef]
- Hustrulid WA. Blasting Principles for Open Pit Mining: CRC Press; 1999.
- Dehghan Banadaki MM, Mohanty B. (2012). Numerical simulation of stress wave induced fractures in rock. International Journal of Impact Engineering, 40-41, 16-25. [CrossRef]
- Esen S, Onederra I, Bilgin HA. (2003). Modelling the size of the crushed zone around a blasthole. International Journal of Rock Mechanics and Mining Sciences, 40(4), 485-95. 4. [CrossRef]
- Ding X, Yang Y, Zhou W, An W, Li J, Ebelia M. (2022). The law of blast stress wave propagation and fracture development in soft and hard composite rock. Scientific Reports, 12(1), 17120. [CrossRef]
- Shadabfar M, Gokdemir C, Zhou M, Kordestani H, Muho EV. (2021). Estimation of Damage Induced by Single-Hole Rock Blasting: A Review on Analytical, Numerical, and Experimental Solutions. Energies, 14(1), 29. [CrossRef]
- Zhang ZX. Rock Fracture and Blasting: Theory and Applications Amsterdam: Elsevier; 2016.
- Dotto MS, Pourrahimian Y, Joseph T, Apel D. (2022). Assessment of blast energy usage and induced rock damage in hard rock surface mines. CIM Journal, 13(4), 166-80. [CrossRef]
- Chen SG, Zhao J. (1998). A study of UDEC modelling for blast wave propagation in jointed rock masses. International Journal of Rock Mechanics and Mining Sciences, 35(1), 93-9. [CrossRef]
- Ismail MA, Gozon JS. (1987). Effects of discontinuities on fragmentation by blasting. International Journal of Surface Mining, Reclamation and Environment, 1(1), 21-5. [CrossRef]
- Wang Z, Huang Y, Xiong F. (2019). Three-Dimensional Numerical Analysis of Blast-Induced Damage Characteristics of the Intact and Jointed Rockmass. Computers, Materials \& Continua, 60(3), 1189 -206.
- Yang R, Ding C, Yang L, Chen C. (2018). Model experiment on dynamic behavior of jointed rock mass under blasting at high-stress conditions. Tunnelling and Underground Space Technology, 74, 145-52. [CrossRef]
- Jiang X, Xue Y, Kong F, Gong H, Fu Y, Zhang W. (2023). Dynamic responses and damage mechanism of rock with discontinuity subjected to confining stresses and blasting loads. International Journal of Impact Engineering, 172, 104404. [CrossRef]
- Chen C, Yang R, Xu P, Ding C. (2022). Experimental study on the interaction between oblique incident blast stress wave and static crack by dynamic photoelasticity. Optics and Lasers in Engineering, 148, 106764. [CrossRef]
- Xu P, Yang R-s, Guo Y, Chen C, Kang Y. (2021). Investigation of the effect of the blast waves on the opposite propagating crack. International Journal of Rock Mechanics and Mining Sciences, 144, 104818. [CrossRef]
- Zhu ZM. (2011). The Responses of Jointed Rock Mass under Dynamic Loads. Advanced Materials Research, 230-232, 251-5. [CrossRef]
- Amoako R, Jha A, Zhong S. (2022). Rock Fragmentation Prediction Using an Artificial Neural Network and Support Vector Regression Hybrid Approach. Mining, 2(2), 233-47. 2. [CrossRef]
- Torres VFN, Castro C, Valencia ME, Figueiredo JR, Silveira LGC. (2022). Numerical Modelling of Blasting Fragmentation Optimization in a Copper Mine. Mining, 2(4), 654-69. [CrossRef]
- Xie LX, Lu WB, Zhang QB, Jiang QH, Chen M, Zhao J. (2017). Analysis of damage mechanisms and optimization of cut blasting design under high in-situ stresses. Tunnelling and Underground Space Technology, 66, 19-33. [CrossRef]
- Wang J, Yin Y, Esmaieli K. (2018). Numerical simulations of rock blasting damage based on laboratory-scale experiments. Journal of Geophysics and Engineering, 15(6), 2399-417. [CrossRef]
- Riedel W, Thoma K, Hiermaier S, Schmolinske E, editors. Penetration of Reinforced Concrete by BETA-B-500 Numerical Analysis using a New Macroscopic Concrete Model for Hydrocodes. 9th international symposiumon interaction of the effects of munitions with structures; 1999; Berlin, Germany.
- Borrvall T, Riedel W, editors. The RHT concrete model in LS-DYNA. 8th European LS-DYNA users conference; 2011; Strasbourg, Austria.
- Livermore Software Technology Corporation L. LS-DYNA® Keyword User’s Manual R11 Volume II Material Models2018.
- Holmquist TJ, Johnson GR, Cook WH, editors. A Computational Constitutive Model for Concrete Subjected to Large Strains, High Strain Rates and High Pressures. 14th International symposium, Vol 2; Warhead mechanisms, terminal ballistics; 1993; Arlington, Quebec; Canada: ADPA;
- Wang Z, Wang H, Wang J, Tian N. (2021). Finite element analyses of constitutive models performance in the simulation of blast-induced rock cracks. Computers and Geotechnics, 135, 104172. [CrossRef]
- Lee EL, Hornig HC, Kury JW. Adiabatic Expansion Of High Explosive Detonation Products. United States; 1968. Contract No.: UCRL-50422.
- ORICA. (2018). Technical data sheet - Fortis Extra System - Africa.
- Hansson H. Determination of Properties for Emulsion Explosives Using Cylinder Expansion Tests and Numerical Simulation. Stockholm and Luleå, Sweden; 2009.
- Sanchidrián JA, Castedo R, López LM, Segarra P, Santos AP. (2015). Determination of the JWL Constants for ANFO and Emulsion Explosives from Cylinder Test Data. Central European Journal of Energetic Materials, 12, 177-94.
- Jeong H, Jeon S. (2018). Characteristic of size distribution rock chip produced by rock cutting with a pick cutter. Geomechanics and Engineering, 15. [CrossRef]
Figure 1.
Stress limit surfaces and loading scenario [22].
Figure 1.
Stress limit surfaces and loading scenario [22].
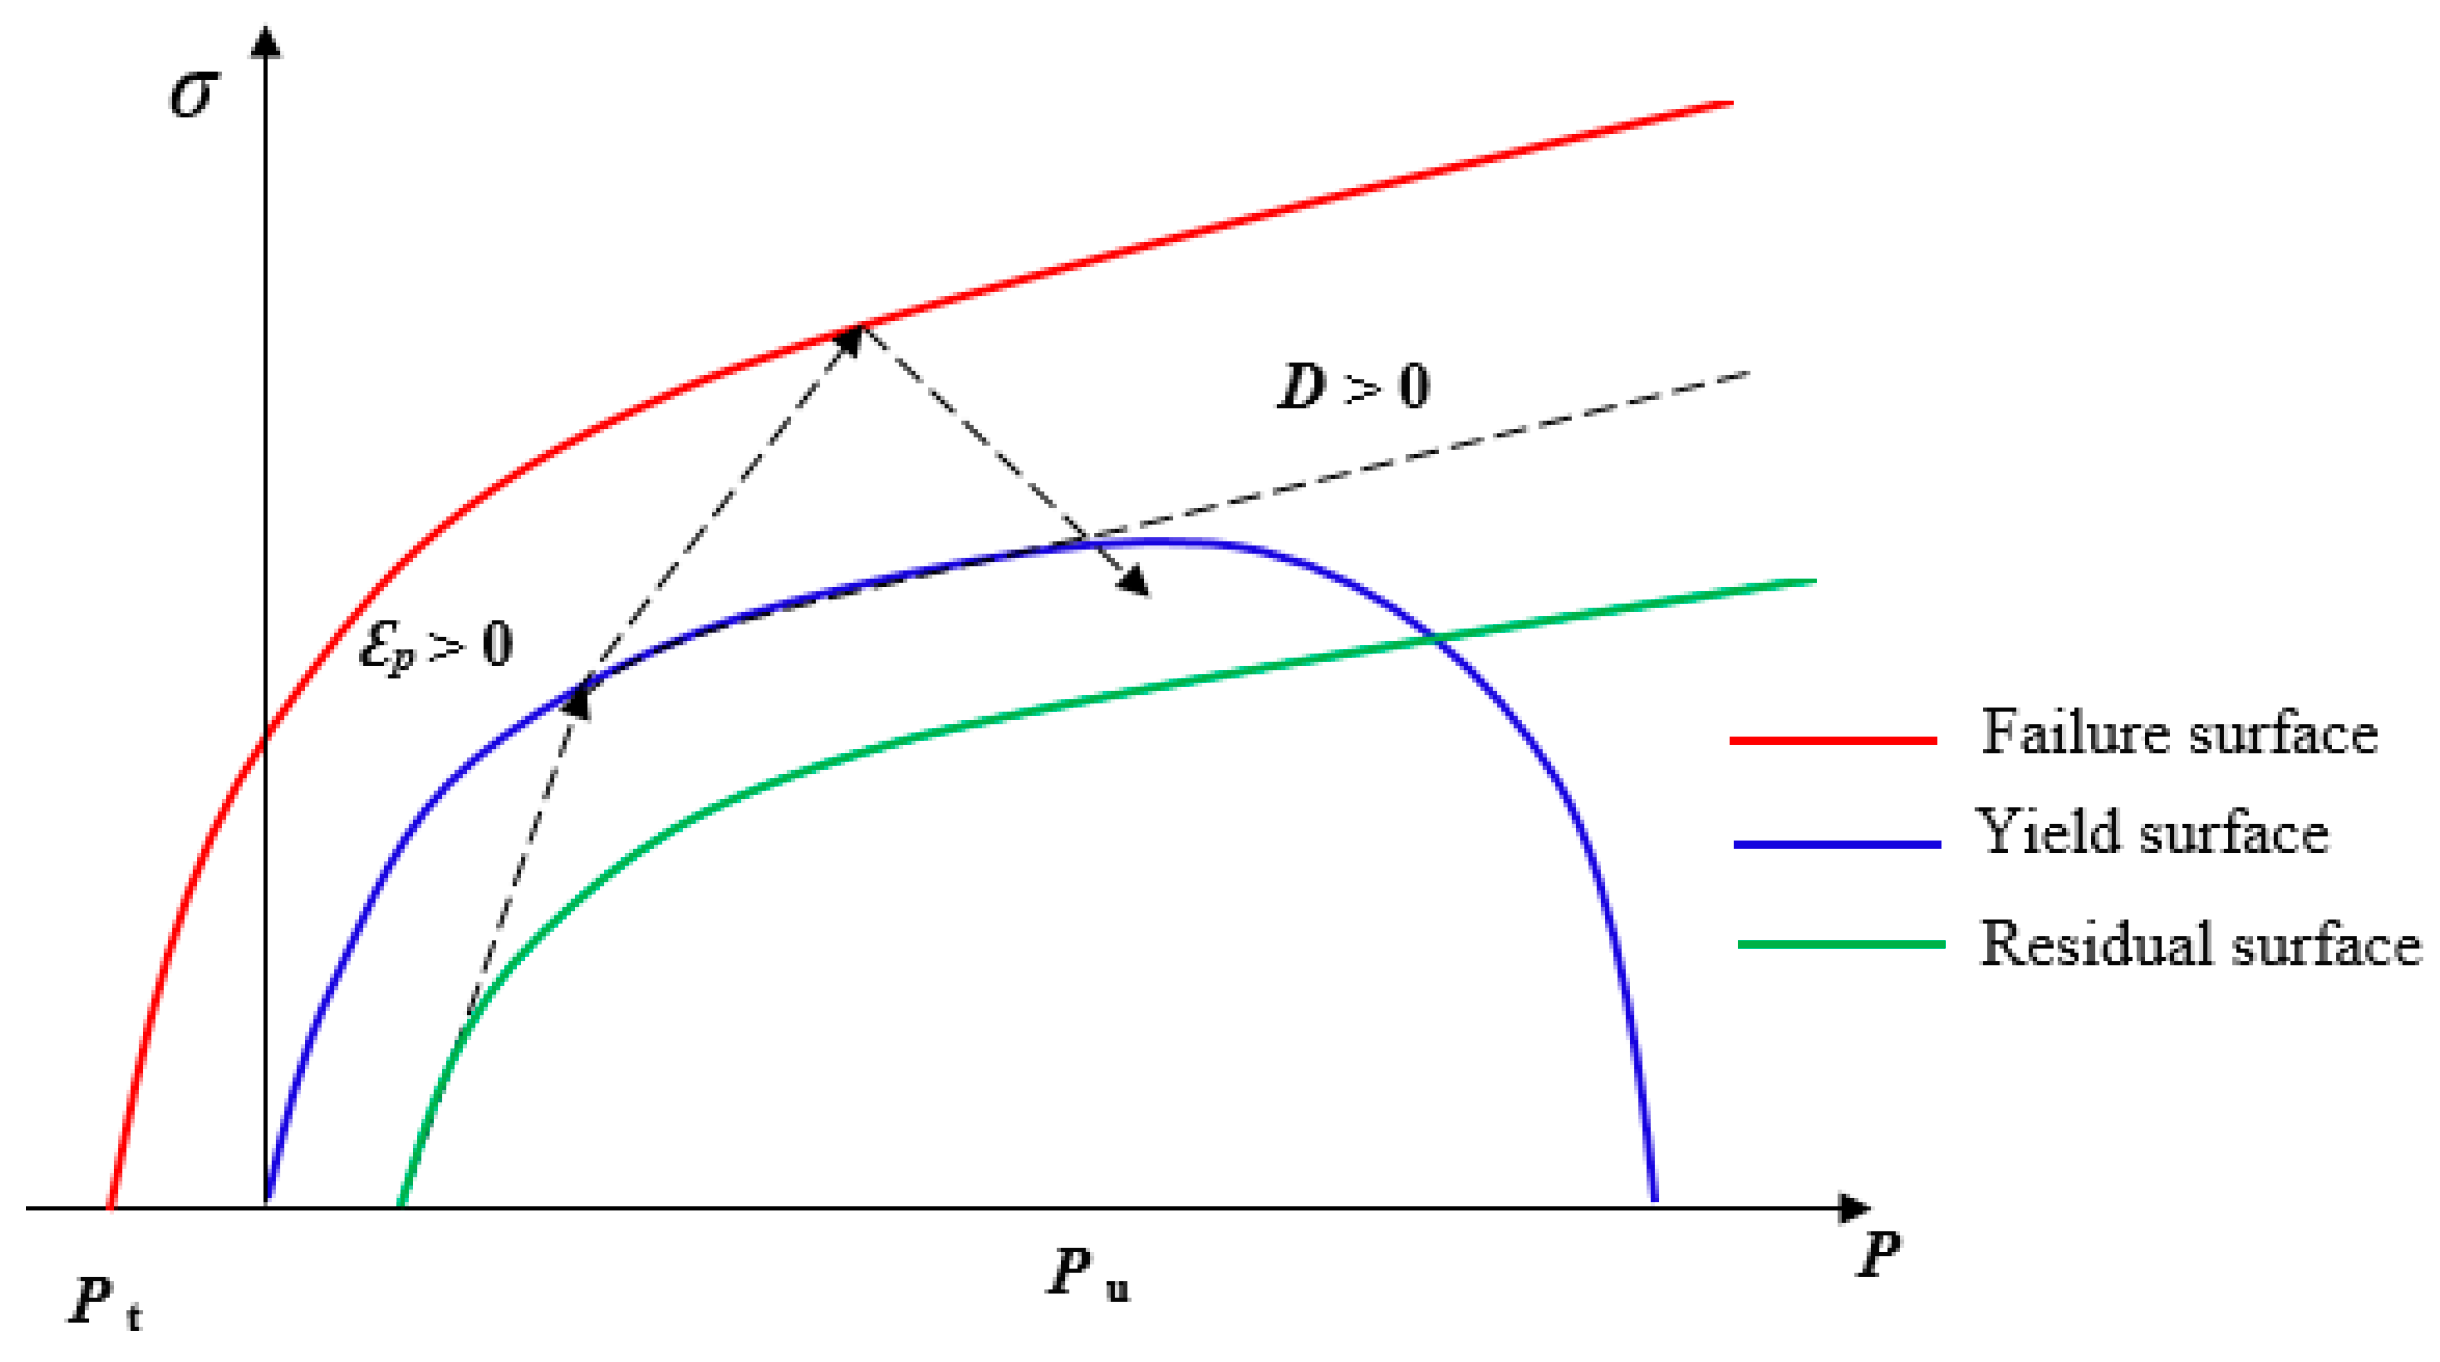
Figure 2.
Single blast hole pattern.
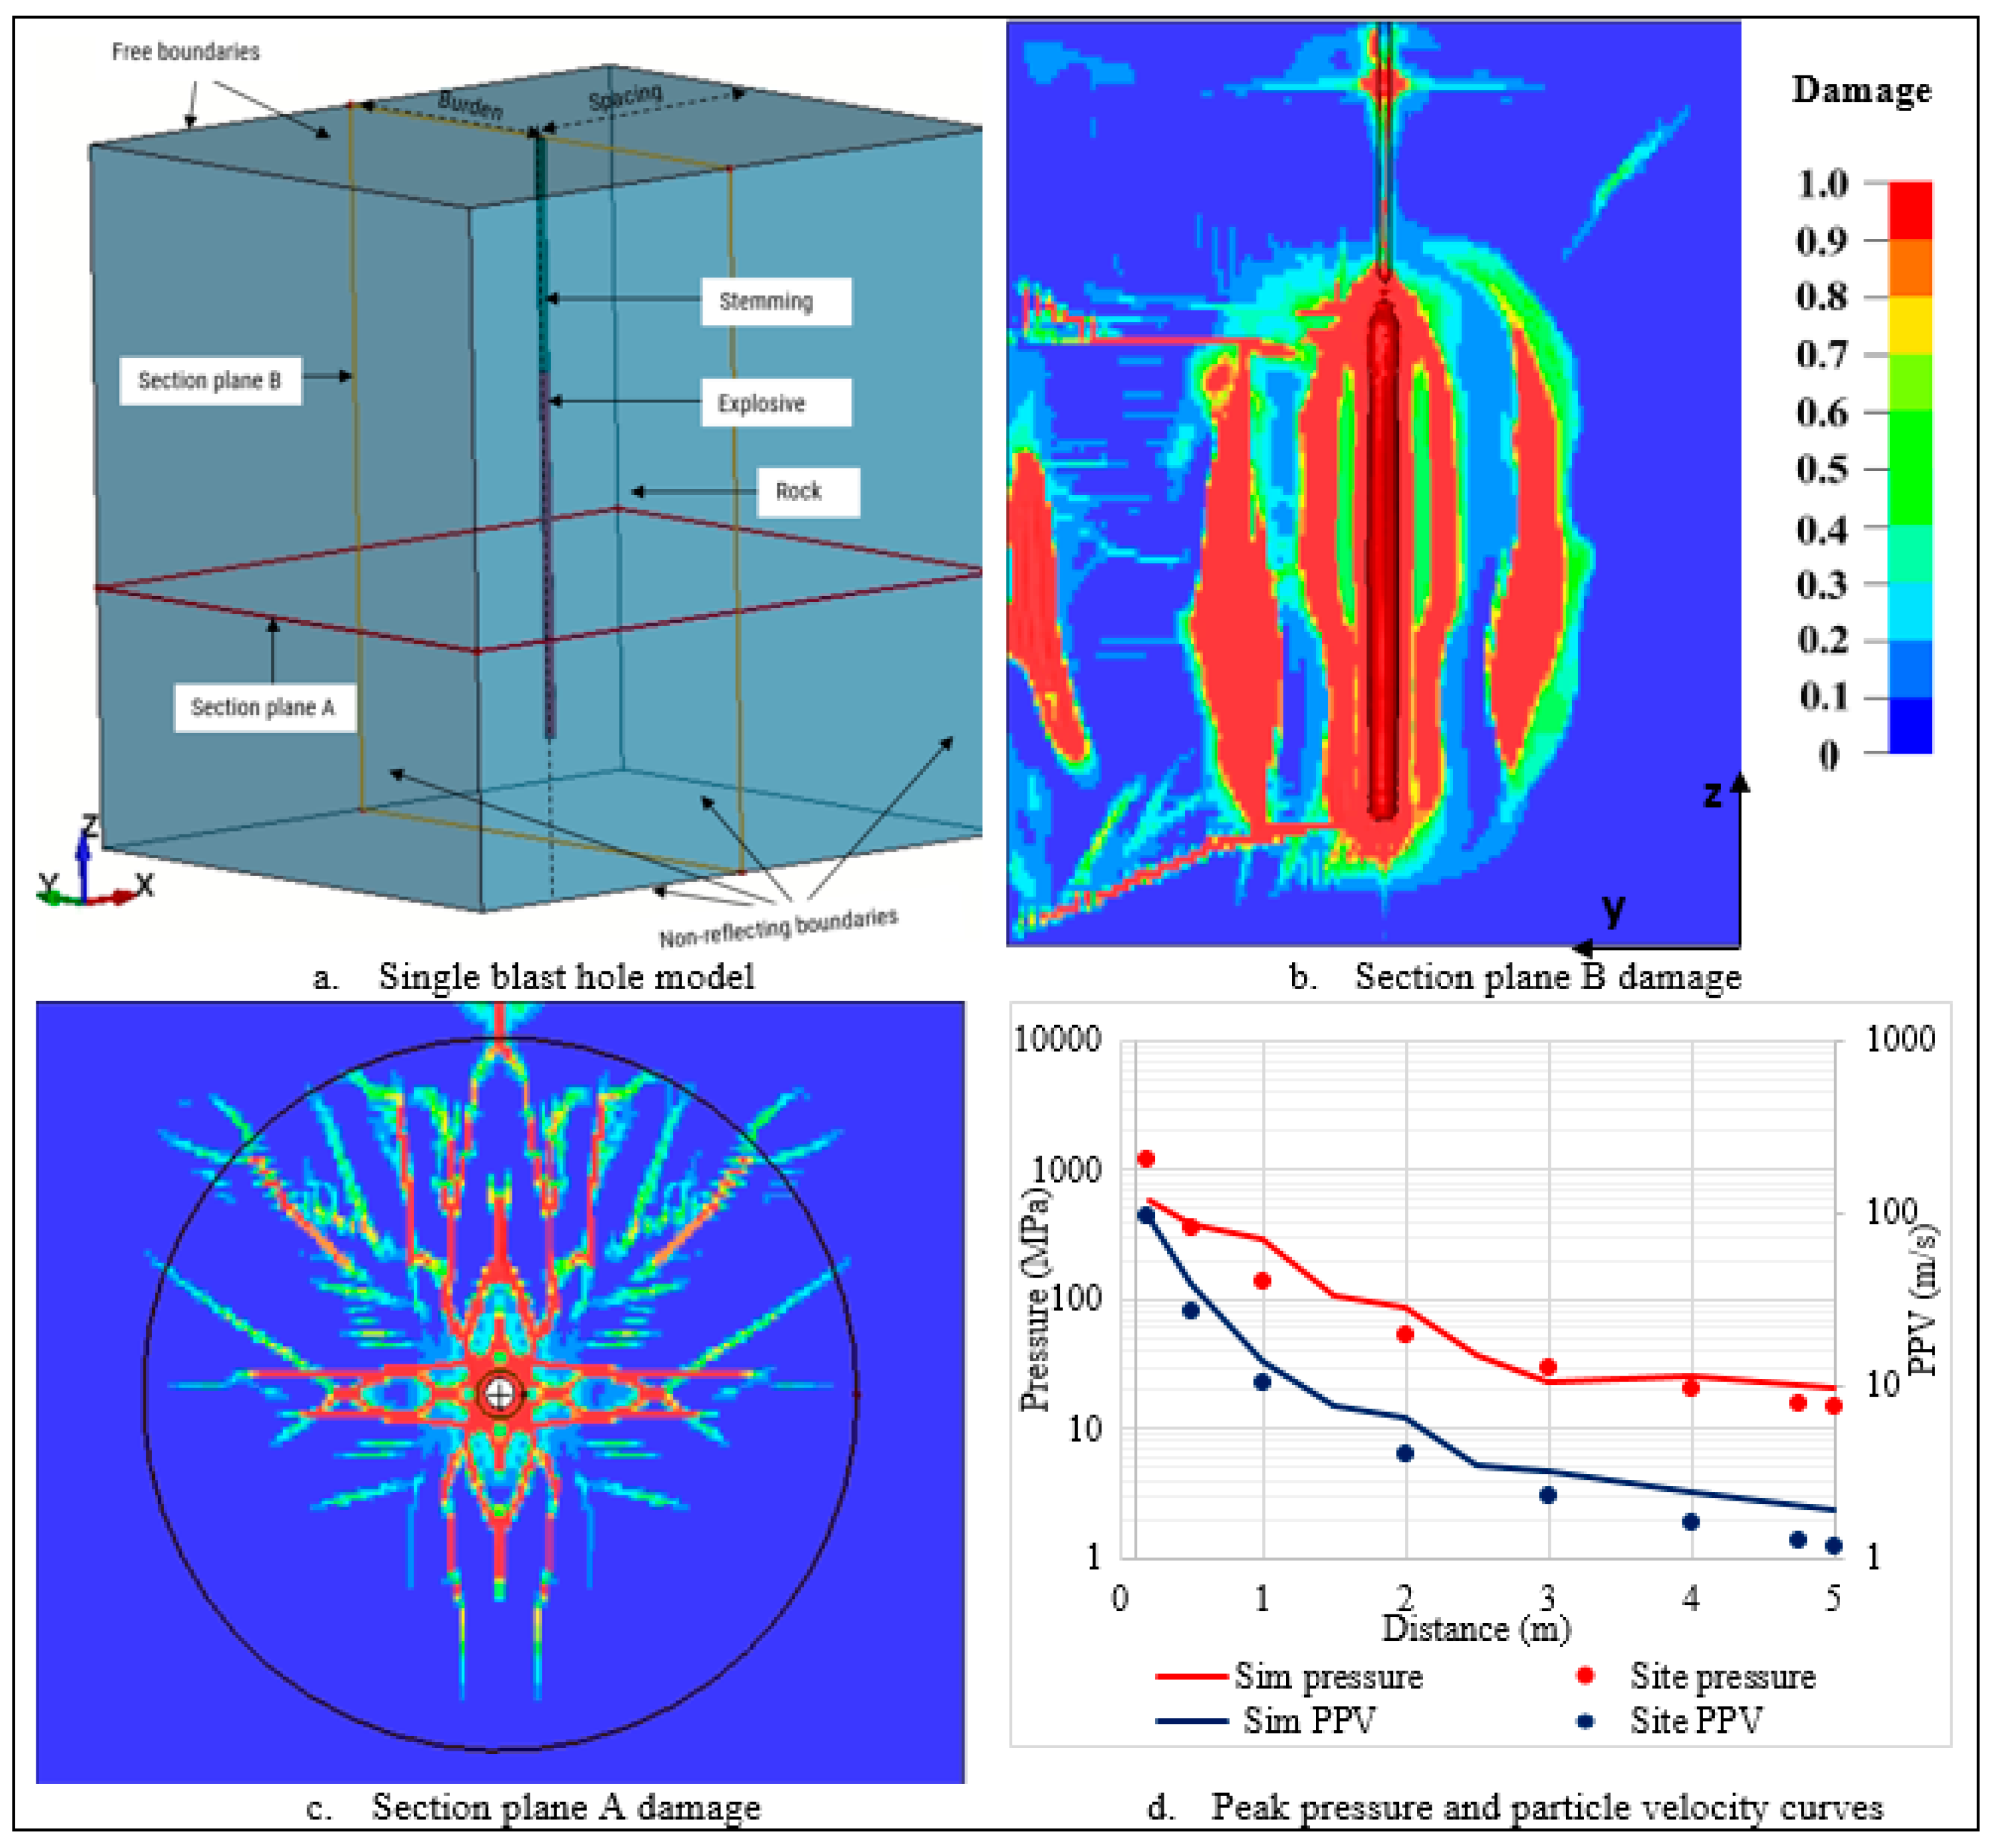
Figure 3.
Peak pressure and PPV profiles.
Figure 4.
Damage distribution in variable explosive and rock properties.
Figure 6.
Pressure across the contacts.
Figure 7.
Damage across the contacts.
Figure 8.
Damage distribution on various joint infill material.
Table 1.
RHT Model parameters for BIF.
Table 6.
Sandstone physical and mechanical properties.
| Density (kg/m3) | UCS (MPa) | Tensile strength (MPa) | Young modulus (GPa) | Poisson ratio | P-wave velocity |
| 2400 | 88 | 0.1xUCS | 25 | 0.3 | 2589 |
Table 7.
Air properties.
| Density (kg/m3) | C4 | C5 | C6 | Eo (MPa) | Vo |
| 1.29 | 0.4 | 0.4 | 0 | 0.5 | 1 |
Table 8.
Clay infill properties.
| Density (kg/m3) | Young Modulus (GPa) | Poisson’s ratio | Yield stress, (MPa) | Tangent Modulus, (GPa) | Hardening parameter | Failure strain, FS |
| 1,160 | 5 | 0.35 | 0.4 | 4 | 0 | 0.5 |
Disclaimer/Publisher’s Note: The statements, opinions and data contained in all publications are solely those of the individual author(s) and contributor(s) and not of MDPI and/or the editor(s). MDPI and/or the editor(s) disclaim responsibility for any injury to people or property resulting from any ideas, methods, instructions or products referred to in the content. |
© 2024 by the authors. Licensee MDPI, Basel, Switzerland. This article is an open access article distributed under the terms and conditions of the Creative Commons Attribution (CC BY) license (http://creativecommons.org/licenses/by/4.0/).
Copyright: This open access article is published under a Creative Commons CC BY 4.0 license, which permit the free download, distribution, and reuse, provided that the author and preprint are cited in any reuse.


